Article

The Gulf Stream Front Amplifies Large-Scale SST Feedback to the Atmosphere in North Atlantic Winter

College of Oceanic and Atmospheric Sciences, Ocean University of China, Qingdao 266000, China
*
Author to whom correspondence should be addressed.
Atmosphere 2023, 14(12), 1758; https://doi.org/10.3390/atmos14121758
Submission received: 18 October 2023 / Revised: 15 November 2023 / Accepted: 20 November 2023 / Published: 29 November 2023
(This article belongs to the Section Climatology)

Abstract

:
The Gulf Stream (GS) ocean front releases intense moisture and heat to the atmosphere and regulates storm tracks and zonal jets in winter. The large-scale sea surface temperature (SST) anomaly in the central North Atlantic provides important feedback to the atmosphere in winter, but the role played in this feedback by the GS front inside the SST anomaly has not been extensively studied. In this study, two sets of ensemble experiments were conducted using a global community atmosphere model forced by SST in boreal winters from 2000 to 2013. The regional averaged SST and its variation in the experiments were identical, with the only difference being the strength of the SST front in the GS region. The large-scale SST anomaly in the central North Atlantic in our model provides feedback to the atmosphere and excites a wave train that extends across Eurasia. With the inclusion of the strong GS front, the first center of the wave train in the North Atlantic is strengthened by approximately 40%, and the wave activity flux toward downstream is highly intensified. When the large-scale SST anomaly is combined with a strong GS front, greatly increased water vapor is released from the GS region, resulting in a 50% increase in moisture transport toward Western Europe. In this scenario, precipitation and diabatic heating both increase greatly on the western Scandinavian Peninsula. With the release of deep diabatic heating, a strong upward wave activity flux is triggered, and the wave train excited by the large-scale SST variation is significantly intensified. These findings suggest that the strong SST front in the large-scale SST anomaly in the central North Atlantic significantly amplifies its feedback to the atmosphere in winter.

1. Introduction

In the Gulf Stream (GS) and its extension region, during the winter season, when cold and dry northwesterly winds from the continent encounter a sharp sea surface temperature (SST) gradient, intense atmosphere–ocean interactions are induced, and large amounts of precipitation and strong diabatic heating are anchored above the ocean front [1,2,3,4,5]. The SST front modifies the environment, including moisture and low-level baroclinicity, to influence cyclones and regulate zonal jets and storm tracks [6,7,8]. The increase in SST on the warm side of the ocean front significantly moistens the boundary layer [7], introduces increased moist baroclinic development, and forms a stronger uplifting and warm conveyor belt, causing cyclone intensification [9]. The anomalous heating above the GS front can also induce a Rossby wave train in the troposphere [10,11], which may regulate large-scale atmosphere–ocean interactions.
The typical large-scale atmosphere–ocean interaction in the North Atlantic is the interaction of the North Atlantic Oscillation (NAO) with horseshoe-like SST anomalies [12]. Although large-scale SST anomalies in the North Atlantic in winter are generally forced by the atmosphere, they also exert feedback on the atmosphere and can excite atmospheric wave trains. Nie et al. [12] reported that the SST anomaly can induce a quasi-barotropic NAO-like atmospheric response through eddy-mediated processes on subseasonal timescales. The increasing trend of SST in the GS region has also been reported to connect with a negative NAO tendency [13]. When modeling resolution was increased to an eddy-permitting scale, the mesoscale oceanic variability in the GS region was found to strongly affect NAO on interannual timescales [14]. These works suggest that the large-scale SST in the North Atlantic and the mesoscale SST in the GS region are both important with respect to atmospheric variabilities.
For the teleconnection spreading from the North Atlantic to Eastern Asia, which is known as the Eurasian teleconnection pattern (EU), positive feedback from the SST anomalies in the central North Atlantic has also been reported [15]. The work of Wang et al. [16] further reveals that the linkage between the EU and the SST involves variations on a timescale of decades. During the strong linkage period (“high-epoch”) from 1993 to 2013, the SST in the central North Atlantic influenced the EU pattern through eddy-mediated processes such as storm tracks. In previous studies, we noticed the region where the SST exhibits a significant correlation with the EU index [15,16]; this covers the central North Atlantic, and includes the GS front region. Furthermore, because the GS front has an important impact on the storm track, and this is exactly the process that links the large-scale SST variation and the EU pattern, we may surmise that the GS front plays an important role in the large-scale SST feedback to the atmosphere in winter.
In this study, we investigated the role of the GS front in the excitation of atmospheric teleconnections by the central North Atlantic SST variation using a global model. This is the fifth version of the community atmosphere model (CAM5) forced by observed winter season (DJF) SST between 2000 and 2013 (i.e., the “strong linkage period” revealed by Wang et al. [16]). To study the importance of the GS front, we conducted two sets of parallel ensemble experiments forced by SST fields, which differ only in the GS and central North Atlantic region. The regional averaged SST and its variation in the two sets of experiments were identical, with the only difference being the strength of the SST front in the GS region. The structure of this paper is as follows: Section 2 introduces numerical experiments, data, and methods; Section 3 reports the atmospheric response to the SST variation, compares the results with and without a strong ocean front, investigates the mechanism behind the effect of the GS front on the SST feedback, and discusses the importance of the GS front. Finally, Section 4 presents the conclusions.

2. Experiments and Methods

2.1. Global Model Experiments

The global model used in this study was CAM5. The horizontal resolution was approximately 0.25°, which is eddy-permitting and allows reliable resolution of the ocean–atmosphere interaction along the GS stream [17,18,19,20]. The model was forced by SST and sea-ice concentration data from daily 0.25° NOAA Optimum Interpolation SST and ICE (OISST) datasets. The model simulation covered 13 boreal winters (DJF) from 2000 to 2013 (i.e., within the “high-epoch” period, when the SST exhibited a close relationship with the EU index [16]). In control experiments (hereafter termed CTRL), the SST front in the GS region was retained. In the twin simulation (hereafter termed FLTR), a 4° × 4° boxcar low-pass filter was applied to the SST field to reduce the strength of the SST front in the GS region. The filter region (81.25° W–20° W, 25° N–57° N) is marked by the red box in Figure 1. Each twin simulation consisted of 5 ensemble members. The contours in Figure 1d,f show the winter season mean SST in CTRL and in FLTR, respectively. For a detailed description of the model settings, please refer to our recently submitted paper [21]. By smoothing, the SST gradient was weakened by approximately 40% in the middle of the GS extension region (72° W–47° W), resulting in greatly reduced ocean–atmospheric interaction in the GS region [2,22]. The location of the smoothing region was chosen according to the region of high correlation between the SST and the EU index (as shown in Figure 1e,f) in agreement with Liu et al. [15] and Wang et al. [16]; this will be explained in detail in the next section. In the following sections, the regional averaged SST (excluding interannual and seasonal variation) is defined as the SST index. Thus, the SST indexes in the two sets of experiments were identical. As a result, in CTRL, the SST variation was combined with a stronger SST front variation, while in FLTR, the same SST variation was accompanied by an SST gradient, which was 40% lower.

2.2. Data and Method

In this study, we used daily geopotential height and SST data from the ERA5 reanalysis covering the winter period (DJF) from 2000 to 2013, with a horizontal resolution of 0.25° × 0.25°.
To obtain the spatiotemporal mode of the wave train from the North Atlantic to Eastern Asia, rotated empirical orthogonal function (REOF) analysis was applied on daily 500 hPa geopotential height anomalies (excluding interannual and seasonal variation) over the Northern Hemisphere (20° N–90° N, 0° to 360° longitude), following [15], for the 13 winters between 2000 and 2013.
The storm track is the most intense area of synoptic-scale transient wave activity, and its intensity can be expressed by the square of the meridional wind disturbances from the model output. In this study, the storm track was calculated from 2–10-day bandpass filtering of meridional wind at 300 hPa, following Lau and Holoppainen [23]. The integrated water vapor transport (IVT) was calculated from the velocity and specific humidity from the model output, following Zhu and Newell [24].
To estimate diabatic heating in this study, we calculated the apparent heat source according to Yanai et al. [25], as follows:
Q 1 = ( p p 0 ) R C p ( θ t + u .   θ + ω θ p )
In Equation (1), θ is the potential temperature, u = ( u , v ) is the horizontal wind velocity, ω is the vertical p -velocity, and p is the pressure. In the equation, R and Cp are the gas constant and the specific heat at constant pressure of dry air, respectively, p 0   = 1000 hPa, and ∇ is the isobaric gradient operator. Finally, Q1 represents diabatic heating for the purposes of the study.
Wave activity flux is a useful diagnostic tool for studying the propagation of stationary wave packets. It may be calculated using the following equation, according to Takaya and Nakamura [26], as follows:
W = 1 | u ¯ | ( u ¯ ( ψ x 2 ψ ψ x x ) + v ¯ ( ψ x ψ y ψ ψ x y ) u ¯ ( ψ x ψ y ψ ψ x y ) + v ¯ ( ψ y 2 ψ ψ y y ) f 2 R σ / p { u ¯ ( ψ x ψ p ψ ψ x p ) + v ¯ ( ψ y ψ p ψ ψ x p ) } )
where ψ is the stream function, f is the Coriolis parameter, R is the gas constant, and σ = ( R T ¯ C p p ) d T ¯ / d p , with temperature T and specific heat at constant pressure C p . Overbars are the temporal average, and the primes are the anomalies from the mean. In our results, the primes represent regression onto the SST index.

3. Results and Discussion

3.1. The Effect of the GS Front on the Large-Scale SST Feedback

The ability of the model to simulate EU was evaluated by comparison with ERA5 reanalysis data. Following Liu et al. [15], using the rotated empirical orthogonal functions (REOF) method [27,28,29], geopotential height anomalies at 500 hPa in the winter season (DJF) during 2000–2013 were analyzed. The first and second REOF modes resembled the NAO and Pacific/North American (PNA) patterns, respectively. The fourth REOF mode (REOF4), from ERA5 data, explained 5.9% of the variance. This mode had two positive centers, in the North Atlantic and near Siberia, and two negative centers, near Siberia and in eastern China (Figure 1), roughly in line with the findings of an earlier study [15]. The difference from former studies mainly lies in the downstream, which may have been due to the difference in the temporal period. Among the nine REOF modes in CTRL, we chose the third mode to study (REOF3, explains 8.8% of variance) because its correlation with the REOF4 from ERA5 was the highest and most significant; indeed, the others all failed the significance test. In CTRL, the EU pattern was similar to that of ERA5, except that the two downstream centers were shifted eastward. With the principal component time series of REOF as the EU index, the winter mean SST regressed against the EU index, resulting in a significant positive anomaly in the central North Atlantic (Figure 1d–f), in agreement with Liu et al. [15] and Wang et al. [16]. However, and in contrast with these two previous studies, we used data with a much higher resolution of approximately 0.25° for both atmosphere and SST compared with the 2.5° for atmosphere and 1° for SST used in the earlier works. The importance of the GS front was thereby revealed, as the regression coefficient of SST along the front was approximately 2–3 times higher, suggesting that a greater impact on the atmosphere lies along the GS front. To prove the importance of the GS front to the large-scale SST effect on atmospheric teleconnections, we chose the box region shown in Figure 1 ([81.25° W–20° W, 25° N–57° N]) to obtain a regional averaged SST index. This region included both the positive SST regression signal and the SST front. This SST index represented the variation in the large-scale SST signal in the central North Atlantic and was significantly correlated with the EU index from when the SST lagged by −8 days to when it lagged by +10 days (Figure 1h). It can be seen that when the lag is negative, i.e., when the SST index leads the EU index, the positive correlation is relatively greater in CTRL than in ERA5, suggesting stronger SST feedback to the atmosphere in CTRL. The correlation was largest when the EU index led the SST index for 1–3 days in CTRL and in ERA5, thus showing the driving effect of the EU index on the large-scale SST, in agreement with previous studies [15,16].
To investigate the effect of the GS front, we performed a 2D boxcar low-pass filter on SST in this region, resulting in a decrease of up to 40% in the SST gradient without influencing the regional averaged SST (the smoothed SST is shown in Figure 1f). Thus, the SST indexes from the filtered and unfiltered SST fields are identical, with the only difference being the SST gradient. Using these two SST fields, we performed two sets of ensemble experiments based on the global CAM5 model. By doing so, we sought to reveal the role of the GS front by comparison between the two sets of experiments.
The REOF3 (explaining 5.6% of the variance) in FLTR is shown in Figure 1c. It can be seen that although its pattern is similar to that in CTRL, the downstream signal is much weaker, and the correlation with the EU index from ERA5 is not significant. The relationship between SST and the EU index from FLTR is positive in the central North Atlantic, but the regression coefficient is reduced to 50% of that from CTRL, suggesting the importance of the GS front to the large-scale SST-related atmospheric response. The lag correlation between the SST index and the EU index is about 30% weaker in FLTR compared with the corresponding value in CTRL, although it does reach a maximum when SST leads the EU index by 3 days, suggesting a forcing effect of SST on the atmosphere. We will discuss this later in Section 3.3. To examine the role of the GS front in the large-scale SST forcing on the atmosphere, the geopotential height regressed on the SST index was compared with that regressed onto the EU index (Figure 2). In CTRL, the geopotential height anomaly at 300 hPa (Z300) excited by SST variation captured most features of those anomalies associated with the EU index, especially the location of the first two centers. This is in line with the findings of previous studies that the SST contributes to the excitation of the first anomaly of the EU pattern. Compared with results from the FLTR, the inclusion of the strong GS front induced an approximately 40% enhancement of the first geopotential height anomaly excited by the SST variation. We compared the standard deviation of the regressed geopotential height with the total deviation and found that the geopotential height related to the SST index accounted for about 20% of the total, thereby indicating the importance of SST feedback to the atmosphere.
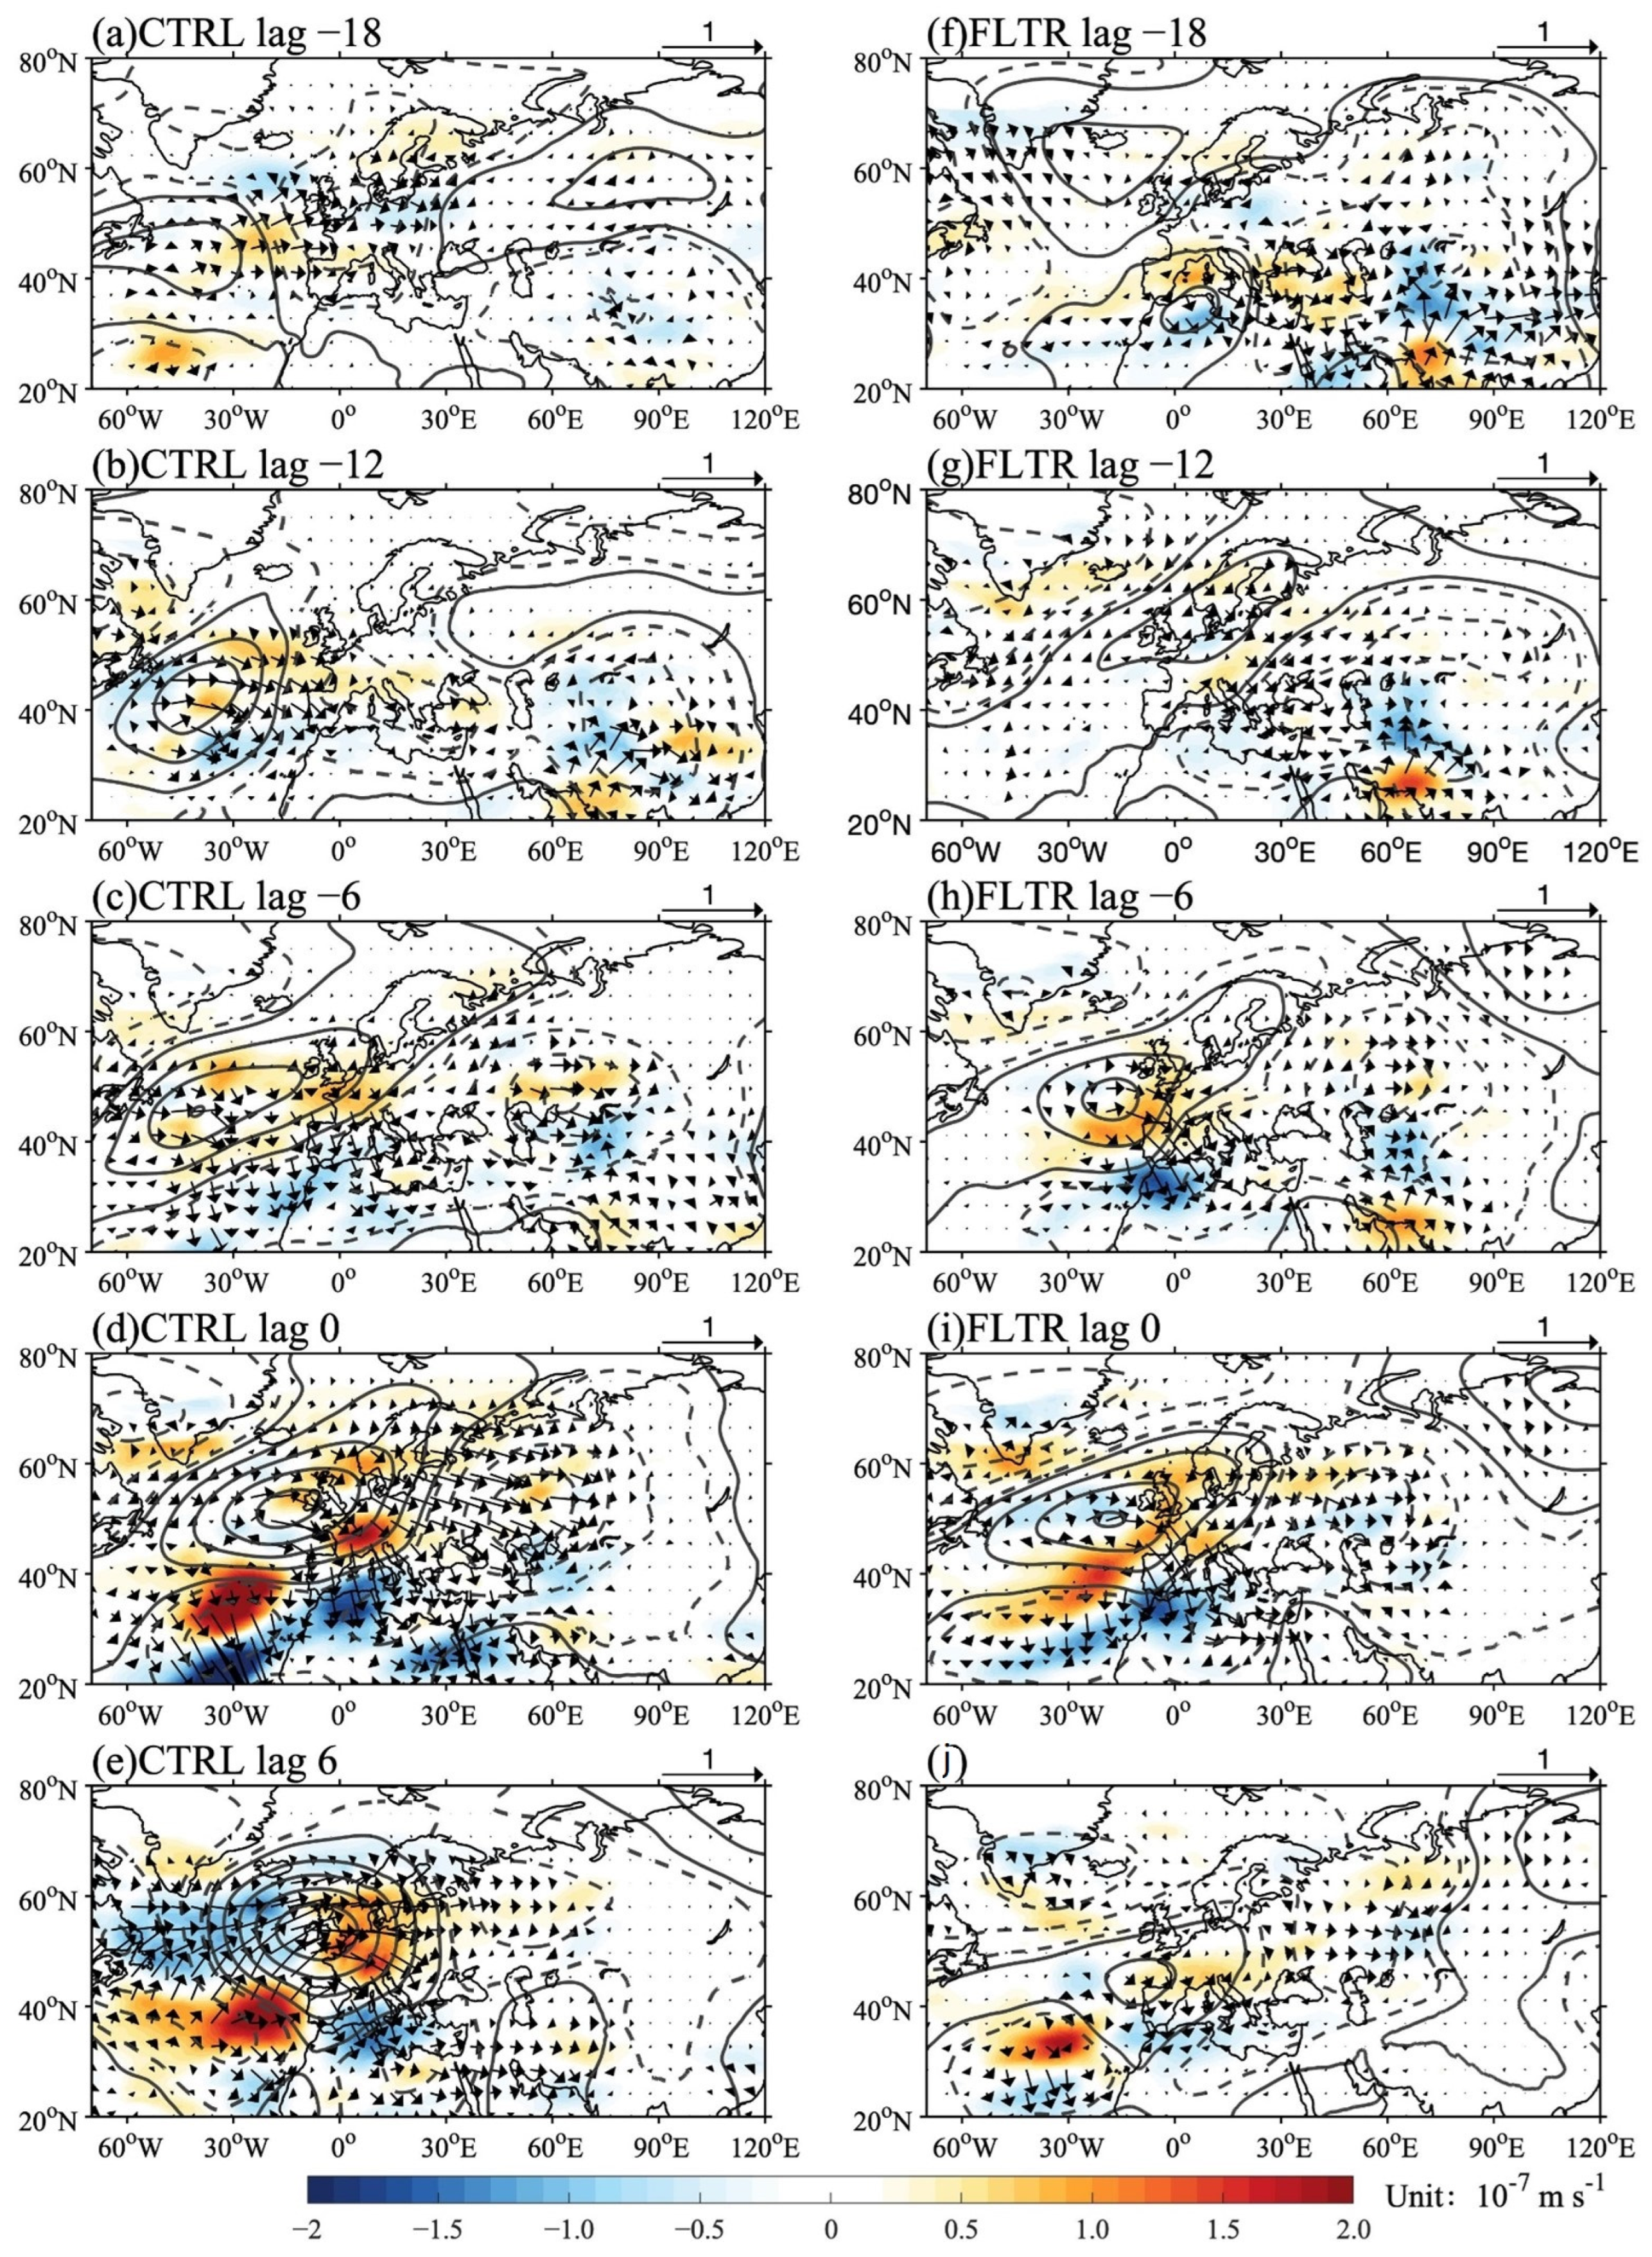
The evolution of the Z300 anomalies associated with the SST variation was then examined to explore the role of the GS front. In Figure 3a–e, a lag regression analysis of Z300 onto the SST index shows that a positive center of Z300 already appeared over the GS region at lag −18 days (when the SST index led the Z300 anomalies). This positive Z300 anomaly is related to diabatic heating above the GS front in winter [2,10]. This positive Z300 anomaly intensified from lag −18 days to −6 days over the GS front, then migrated northeastward to the Western Europe coast, reaching its maximum at lag 6 days. Moreover, a negative center at downstream began to appear at lag −6 days under the influence of the wave activity flux (WAF). The influence of this wave train can extend eastward beyond 60° E and may have an impact on the Eurasian continent. Along with the strengthening of the positive Z300 signal, significant divergence in the WAF was observed near the western coast of Europe from lag −6 days to lag 6 days, suggesting the emission of wave energy in that region [26]. We will discuss the source of this Rossby wave energy in the following paragraphs.
In the results from FLTR illustrated in Figure 3f–j, it can be seen that the positive signal above the GS region is absent and that the first positive signal excited by the SST index appears directly near the Western European coast. The wave train and WAF do exist from lag −6 days to lag 0 days in FLTR, but these are much weaker, and the negative signal in Western Europe diminishes after lag 0 days. The divergence of the WAF is weakened from lag 0 days to lag 6 days, indicating that the wave source is also much weaker with the smoothed SST front. These results confirmed that the effect of the GS front is to enhance the wave train and the Rossby wave source near the western coast of Europe.

3.2. Mechanism of the GS Front in Amplifying the Large-Scale SST Feedback

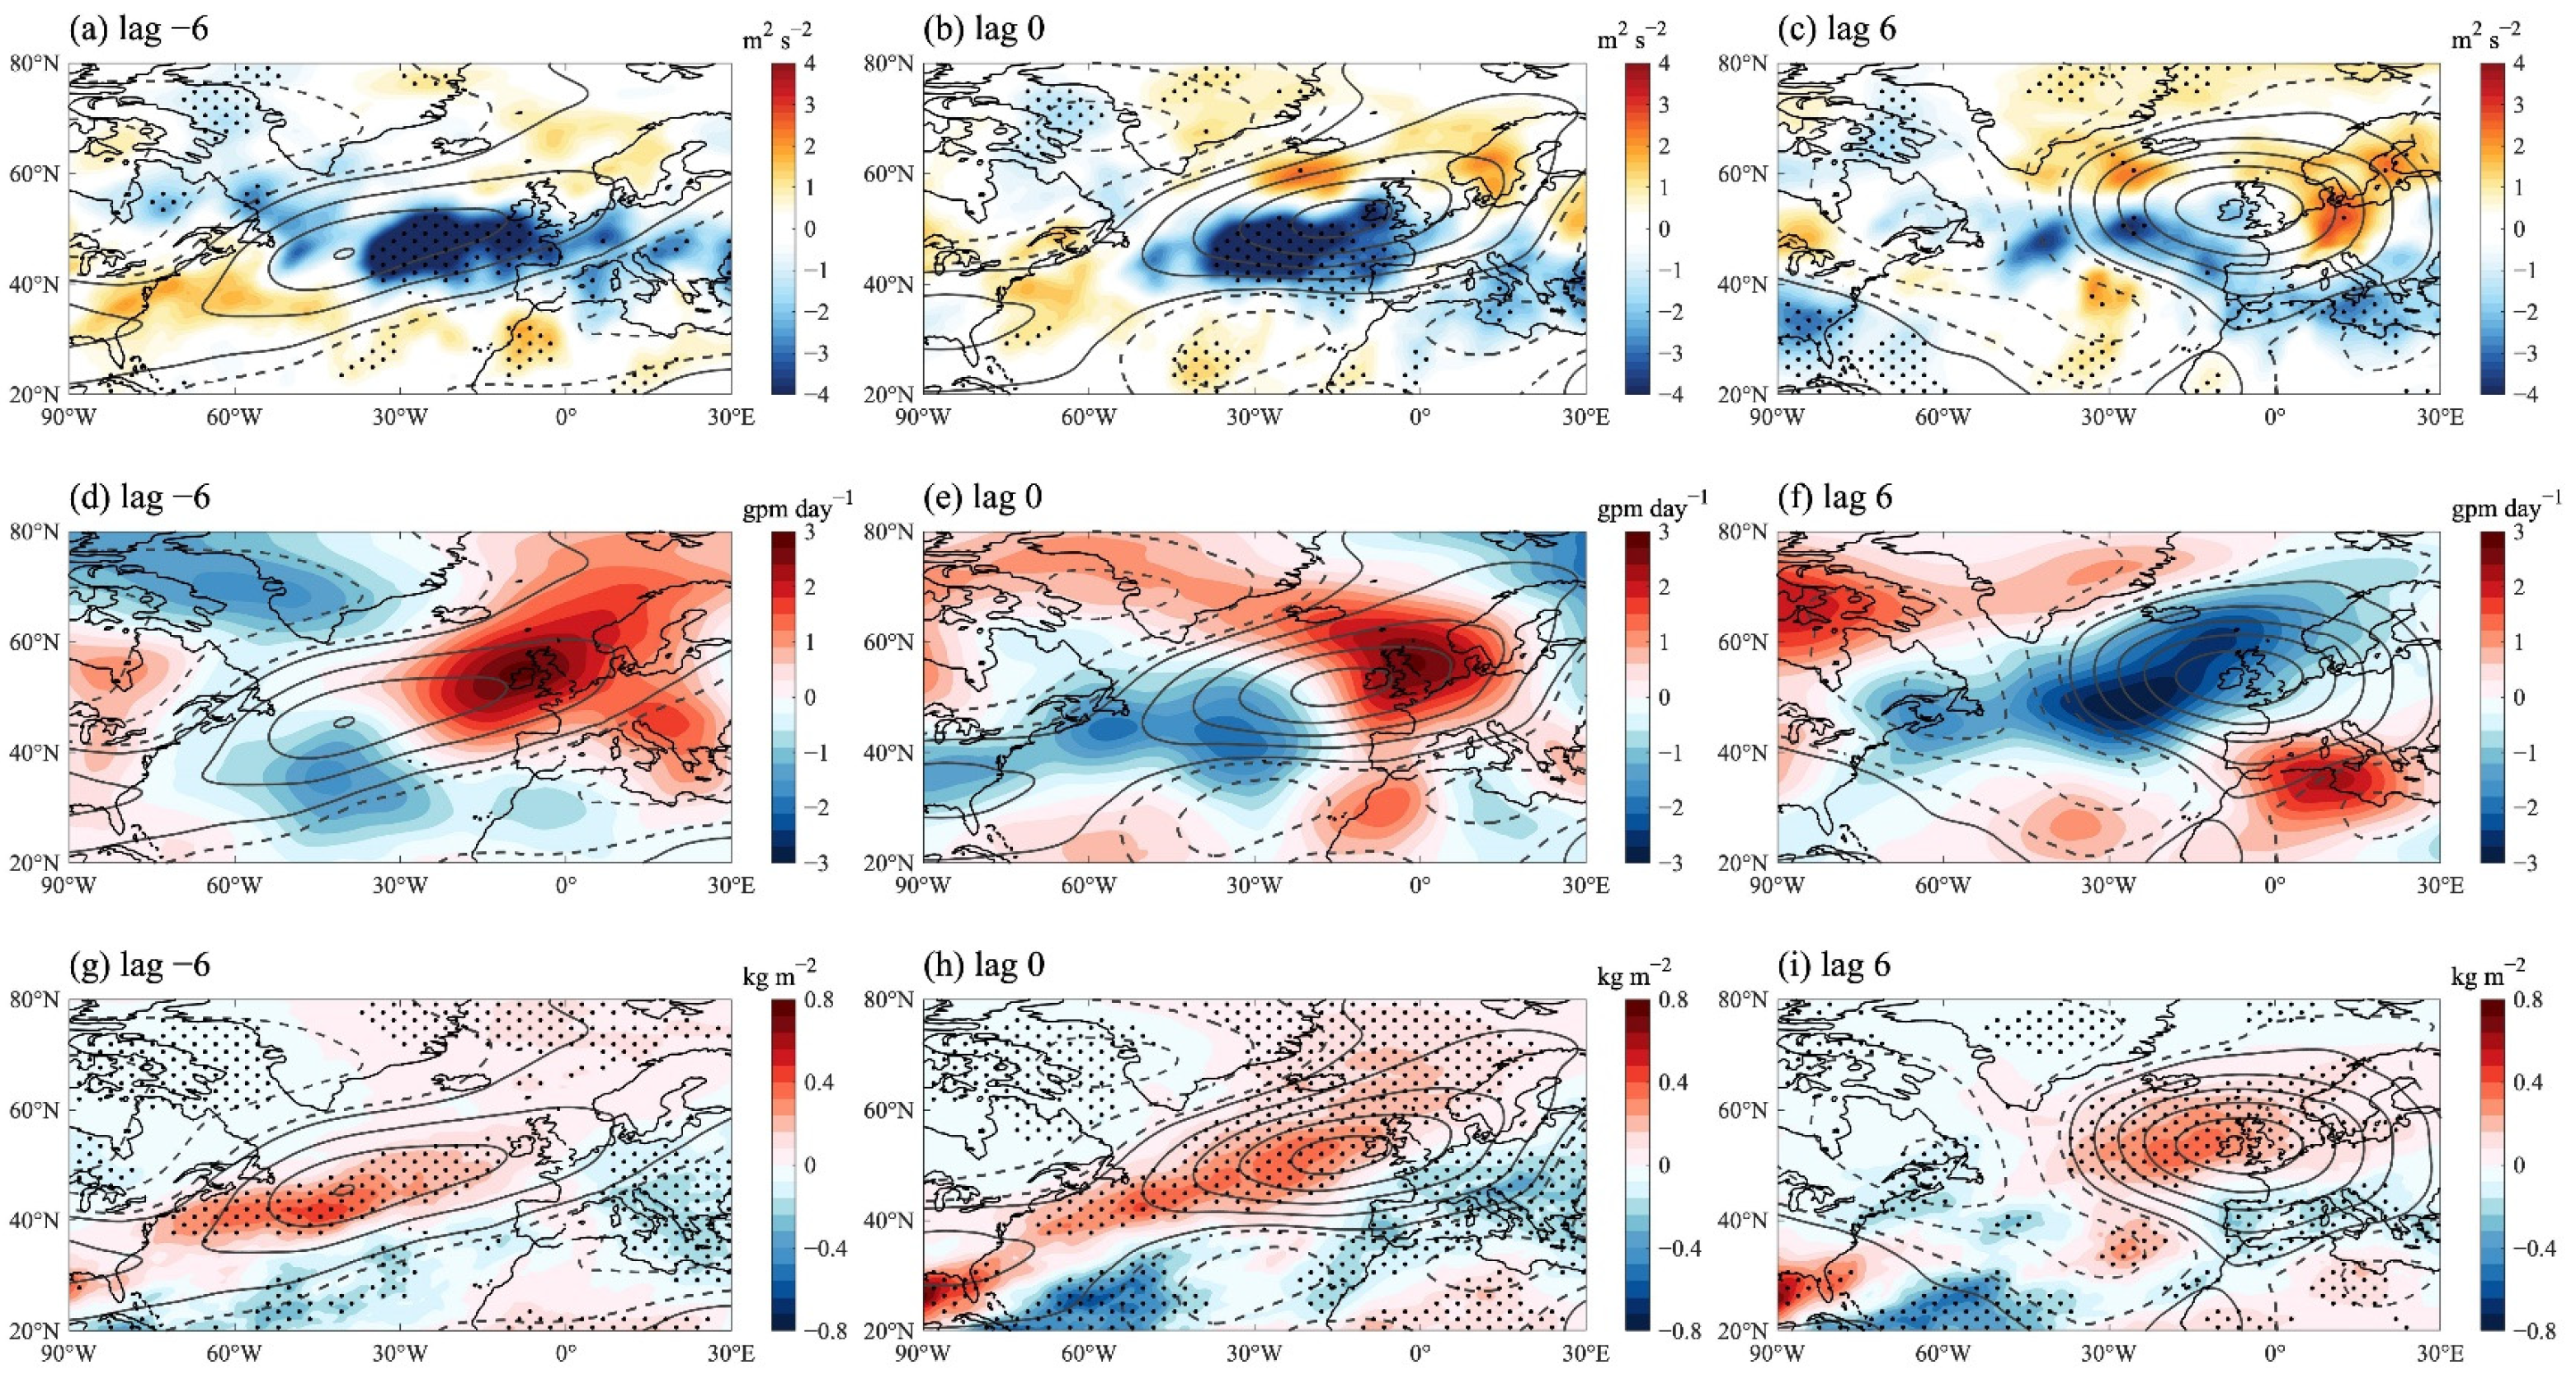
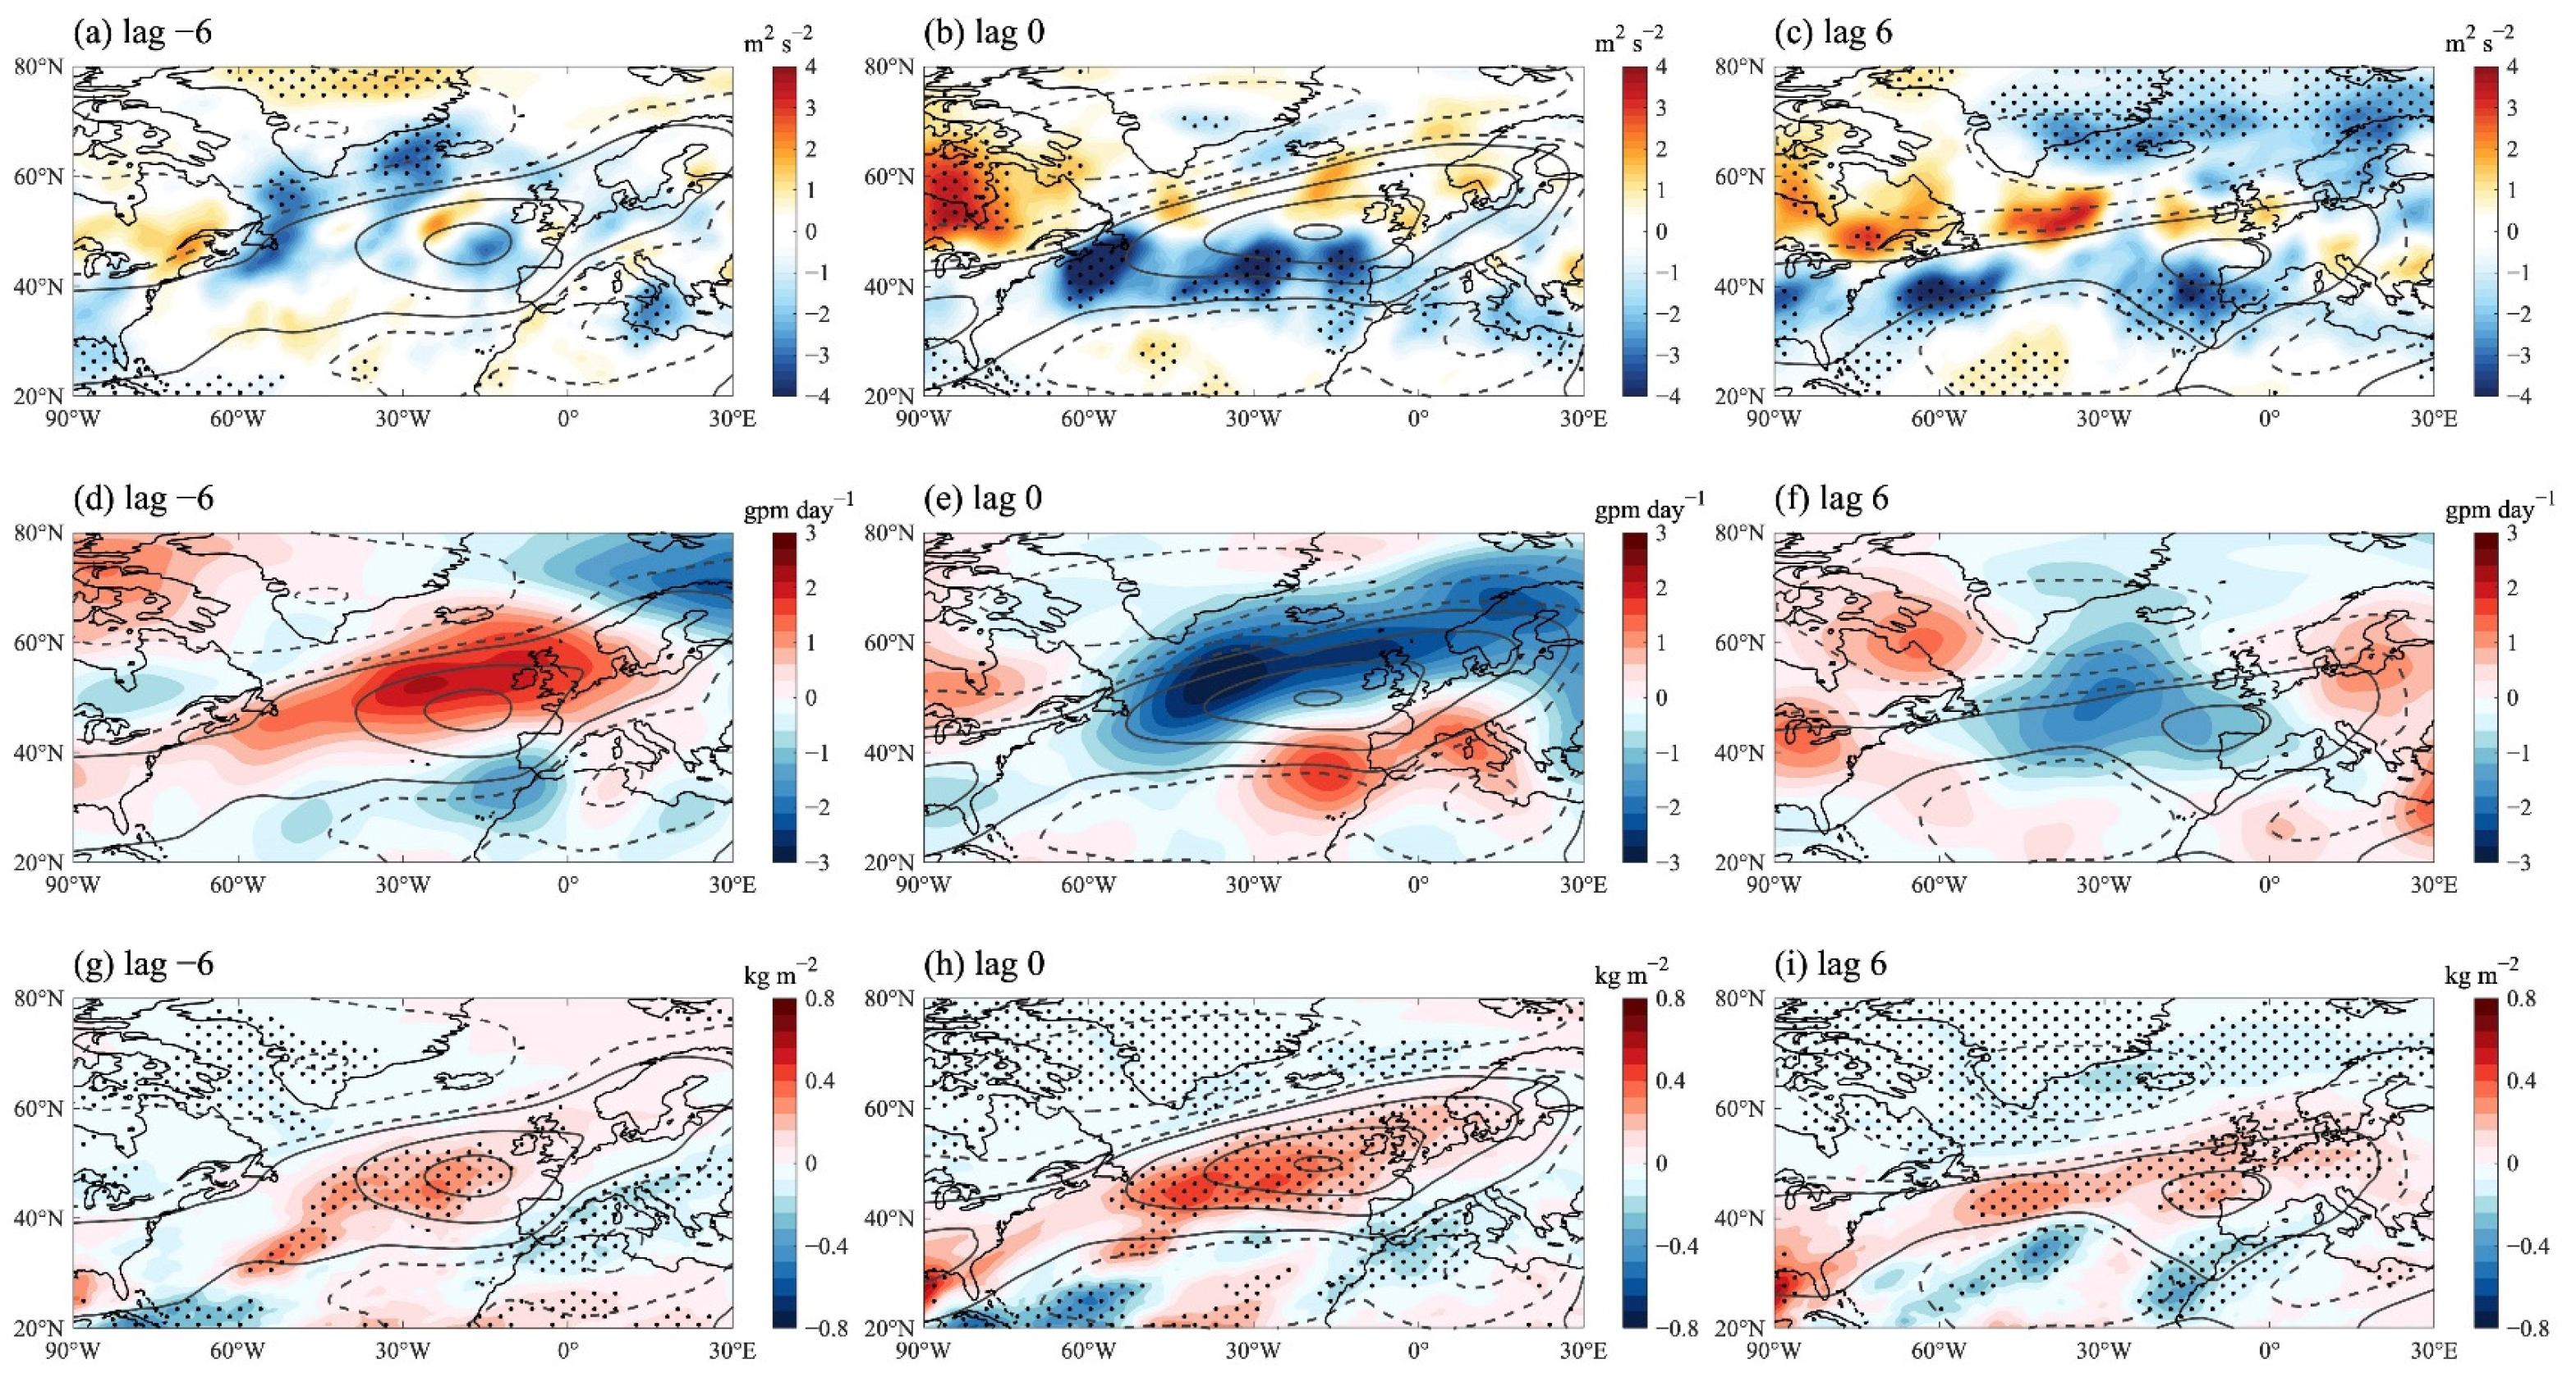
Previous reports in the literature have demonstrated that diabatic heating processes in the troposphere, along with heavy rain, are important for generating wave sources [2,30,31,32]. The Western European coastal region is frequently affected by heavy rain in winter when atmospheric rivers make landfall (atmospheric rivers are known as high moisture flux convergence zones, which exhibit a close relationship with extratropical storms) [24,33,34,35]. The intense diabatic heating associated with extreme rain along the Western European coast can perturb the upper-level atmosphere, leading to wave-like pattern responses [36,37,38]. These findings inspired us to explore the storm track and moisture responses to the SST index in the two experiments of the present study. It can be seen in Figure 4a–c that the response of the storm track at 300 hPa to the SST index in CTRL exhibits a northward shift, with a negative response in the center of the Z300 anomaly and a positive response to its north, in line with the pattern reported by Wang et al. [16] and Nie et al. [12]. This shift in storm track response is consistent with the geopotential height tendency shown in Figure 4d,e, in which a northeastward migration trend may be seen. This finding is in line with the conclusion of Wang et al. [16] that the eddy-mediated process contributes to the increase in the first signal excited by the SST variation. We also noticed a positive storm track response above the GS region, which was most obvious from lag −6 days to lag 0 days when the positive Z300 signal was above the GS region. This positive storm track response indicates an increased interaction between extratropical cyclones and the ocean front in that region, which can enhance the transport of moisture, as revealed by Liu et al. [39]. The response of column-integrated water vapor (TMQ) to SST variation from lag −6 days to lag 6 days is shown in Figure 4g–i. At lag −6 days, there is a band of positive TMQ response extending from the GS front to the center of the Z300 signal; this suggests the effect of the eddy-mediated process on moisture release from the ocean front. Then, this moisture is then transported northeastward along with the migration of the Z300 signal. The positive response of TMQ at lag 0 days lies to the southwest of the positive storm track response. This result can be explained with reference to the finding in earlier studies [39,40] that high water-vapor filaments are left behind as storms travel. A comparison with the FLTR results further demonstrates the importance of the ocean front, as illustrated in Figure 5. It can be seen that in FLTR, the storm track response is much weaker, especially above the GS front. The geopotential height tendency becomes negative after lag 0 days, indicating the fast decay of the signal in Z300. The TMQ response is absent above the GS region and lies more southward compared with those in CTRL (Figure 5).
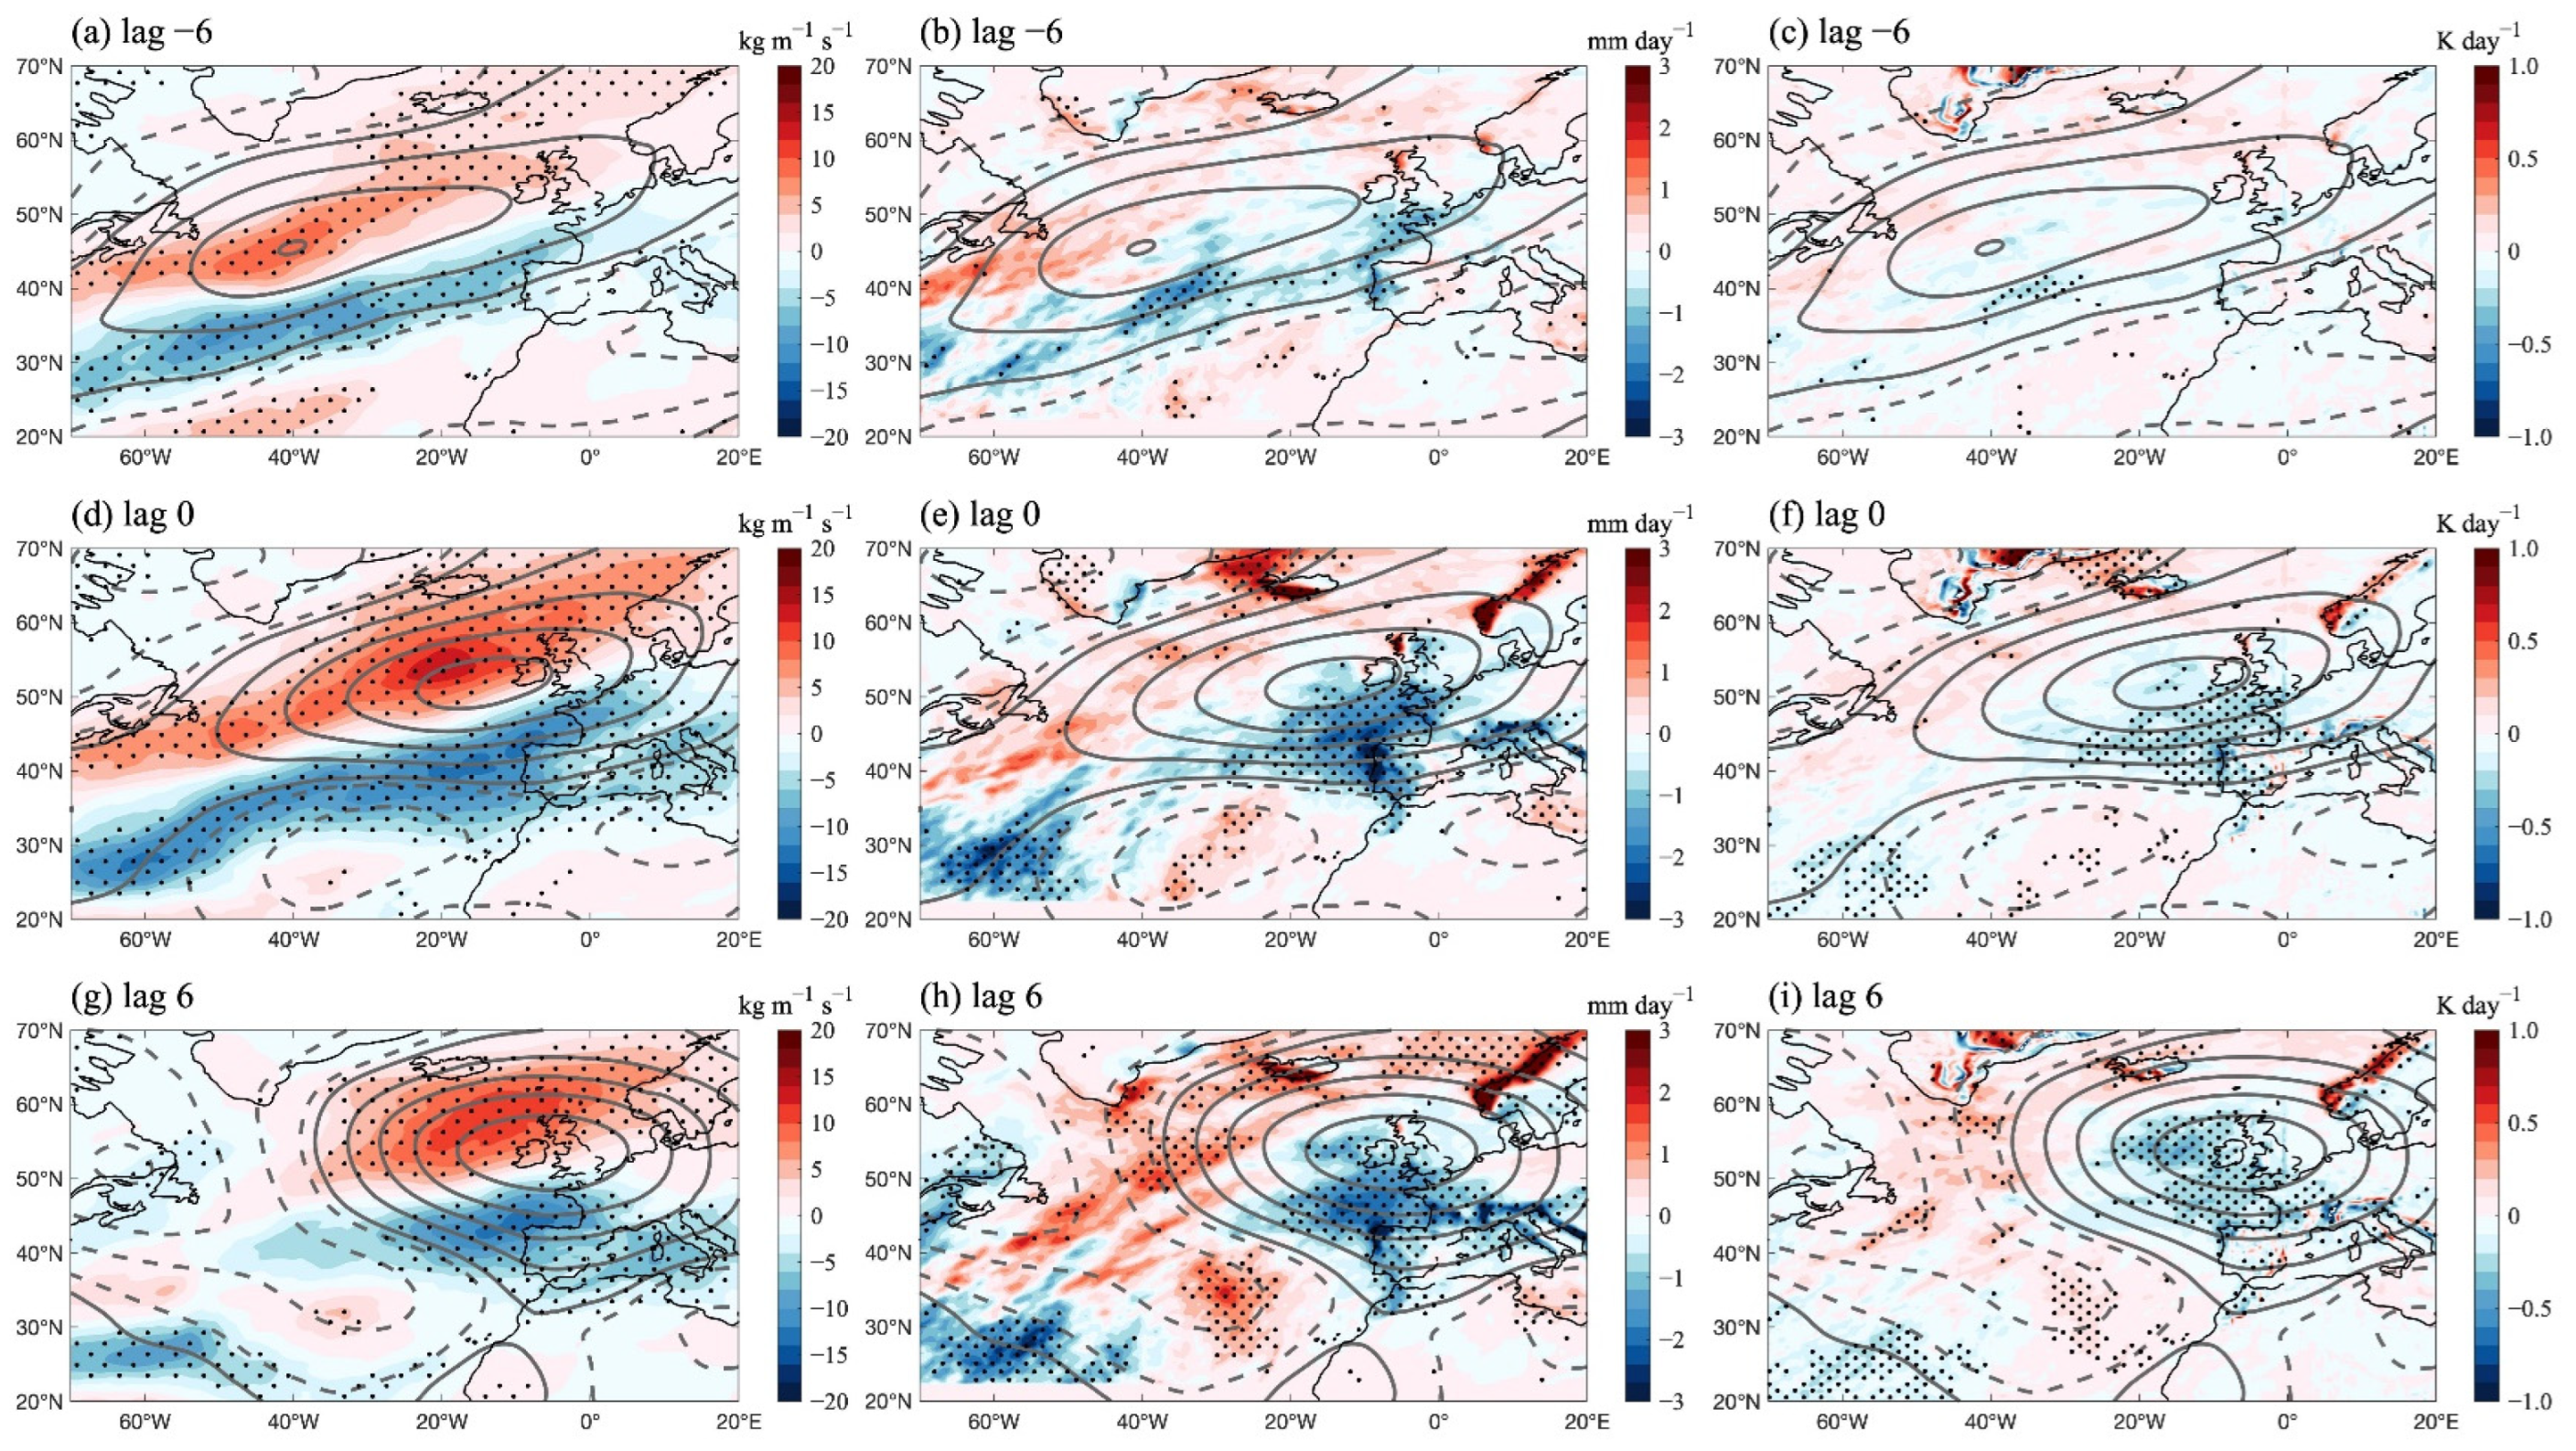
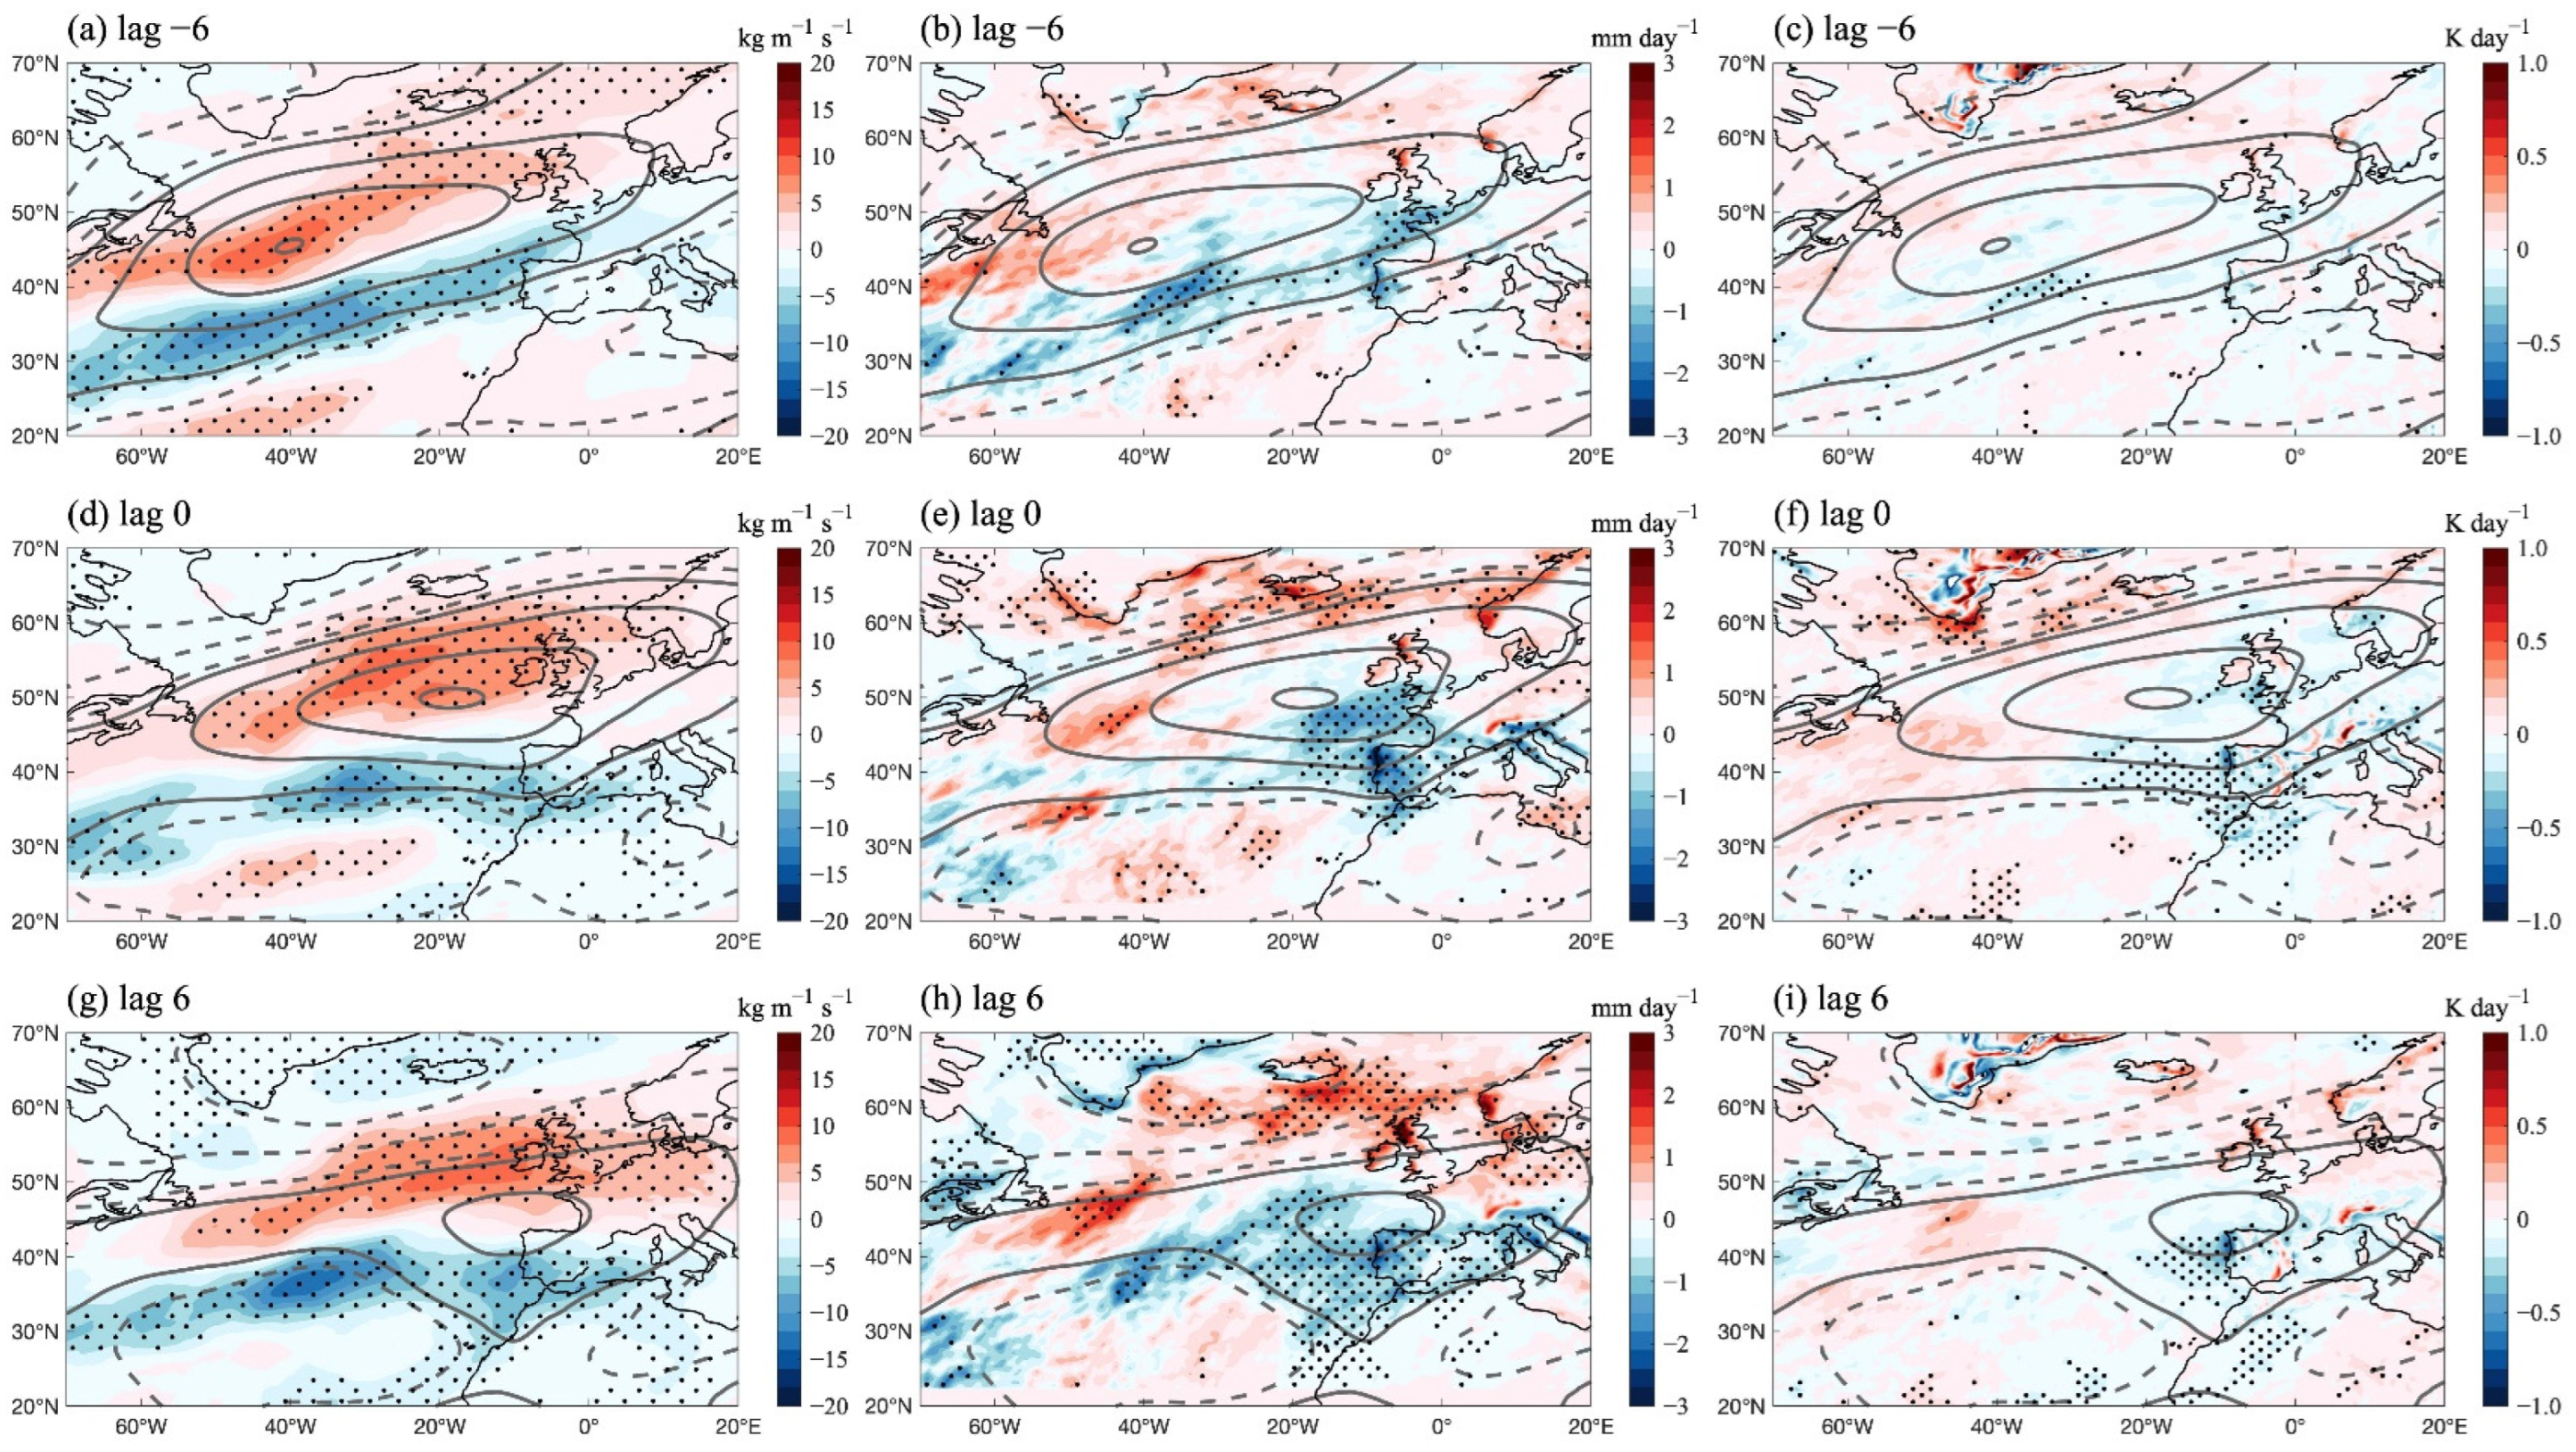
To explain the migration of the first Z300 signal toward the Western European coast in CTRL, the thermodynamic processes, including moisture transport, precipitation, and diabatic heating, were analyzed. First, we examined the response of moisture transport to the SST variation, as illustrated in Figure 6a–c. It can be seen that the IVT response exhibits a northward shift pattern, according to the northward shift in the storm track response. A band of positive IVT response (spread along the northern part of the Z300 signal) starts from the GS front region at lag −6 days and then intensifies toward Northwestern Europe until lag 0 days. As the positive IVT response reaches the Northwestern European coast, heavy rain occurs along the Scandinavian Peninsula (as high as 50 mm day−1), and a large amount of diabatic heating (Q1 at 700 hPa, as high as 1 K day−1) is released until lag 6 days (Figure 6d–i). The diabatic heating response is coherent with the strengthening of the positive Z300 signal near that region, indicating that the heating plays an important role. In FLTR, due to the weakened SST front in the GS region, the moisture supply is significantly reduced, and the positive IVT response above the GS region is absent on lag −6 days. As a result, the positive IVT response band from lag 0 days to lag 6 days is reduced by ~50% (Figure 7a,d,g). With the lack of moisture supply, precipitation and diabatic heating along the Scandinavian Peninsula are both greatly decreased (Figure 7). To this extent, the thermodynamic role of the ocean front in the SST feedback is to promote stronger moisture transport toward the Northwestern European coast, resulting in strong precipitation and diabatic heating in that region.
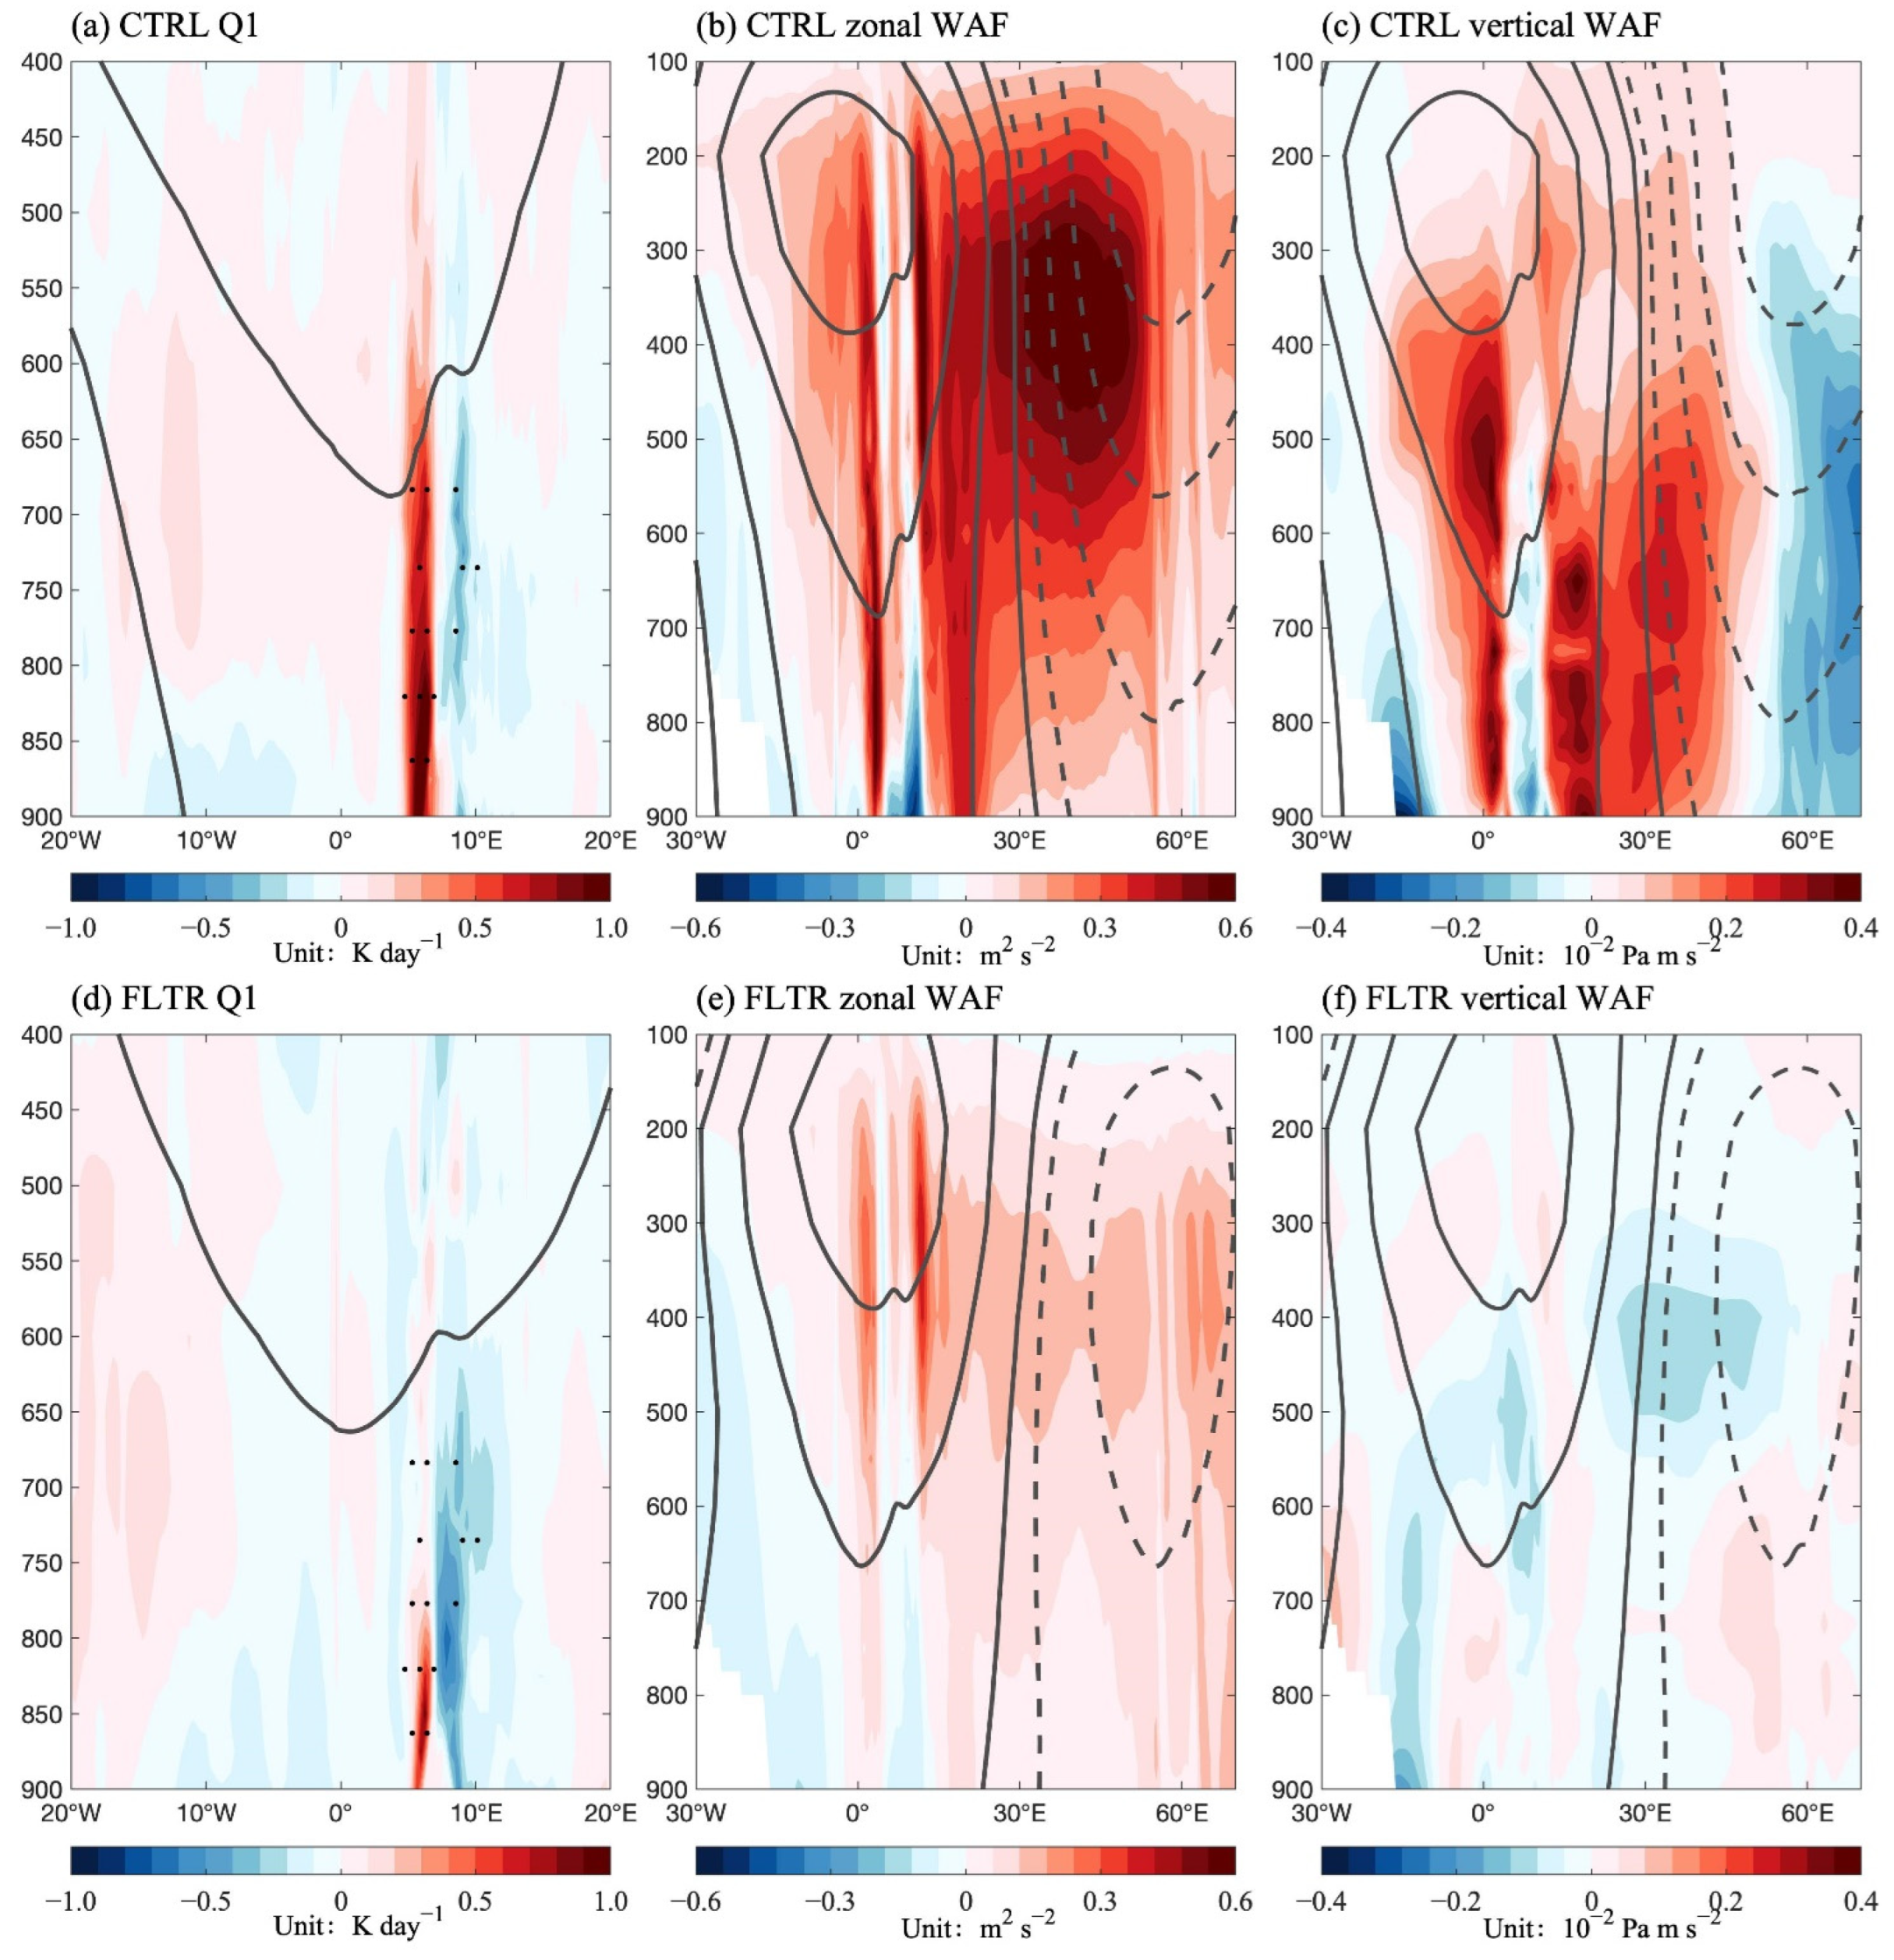
The vertical profiles of the Q1 response to the SST index along 60° N further demonstrated the importance of the moisture supply from the GS front. In Figure 8, it can be seen that in CTRL, the heating above the Northwestern European coast (near 0° E) extends up to 500 hPa, with a positive Q1 response as high as 1.4 K day−1. In contrast, without the strong ocean front, the heating is significantly weaker and remains under 800 hPa in FLTR. Previous studies have found that deep heating induced by heavy rain can trigger wave trains in the troposphere [2,31,32], and so we also plotted the vertical profile of WAF responses. In Figure 8b, it can be seen that under the influence of the deep heating, a distinct wave pattern spread from 30° W to 60° E in CTRL at lag 0 days. The zonal WAF response exhibits a propagation of wave energy from the first positive signal to the negative center downstream. Moreover, a strong response in the vertical WAF extends from the boundary layer up to 300 hPa, consistent with the wave source in Figure 3 and the deep heating in Figure 8a. Compared with the results in FLTR, the inclusion of the strong GS front in CTRL resulted in an approximately four-fold intensification of upward WAF and a two-to-three-fold increase in zonal WAF throughout the atmospheric column (Figure 8). These results once again highlight the crucial role of the GS front in the excitation of the wave energy by the SST index.

3.3. Discussion

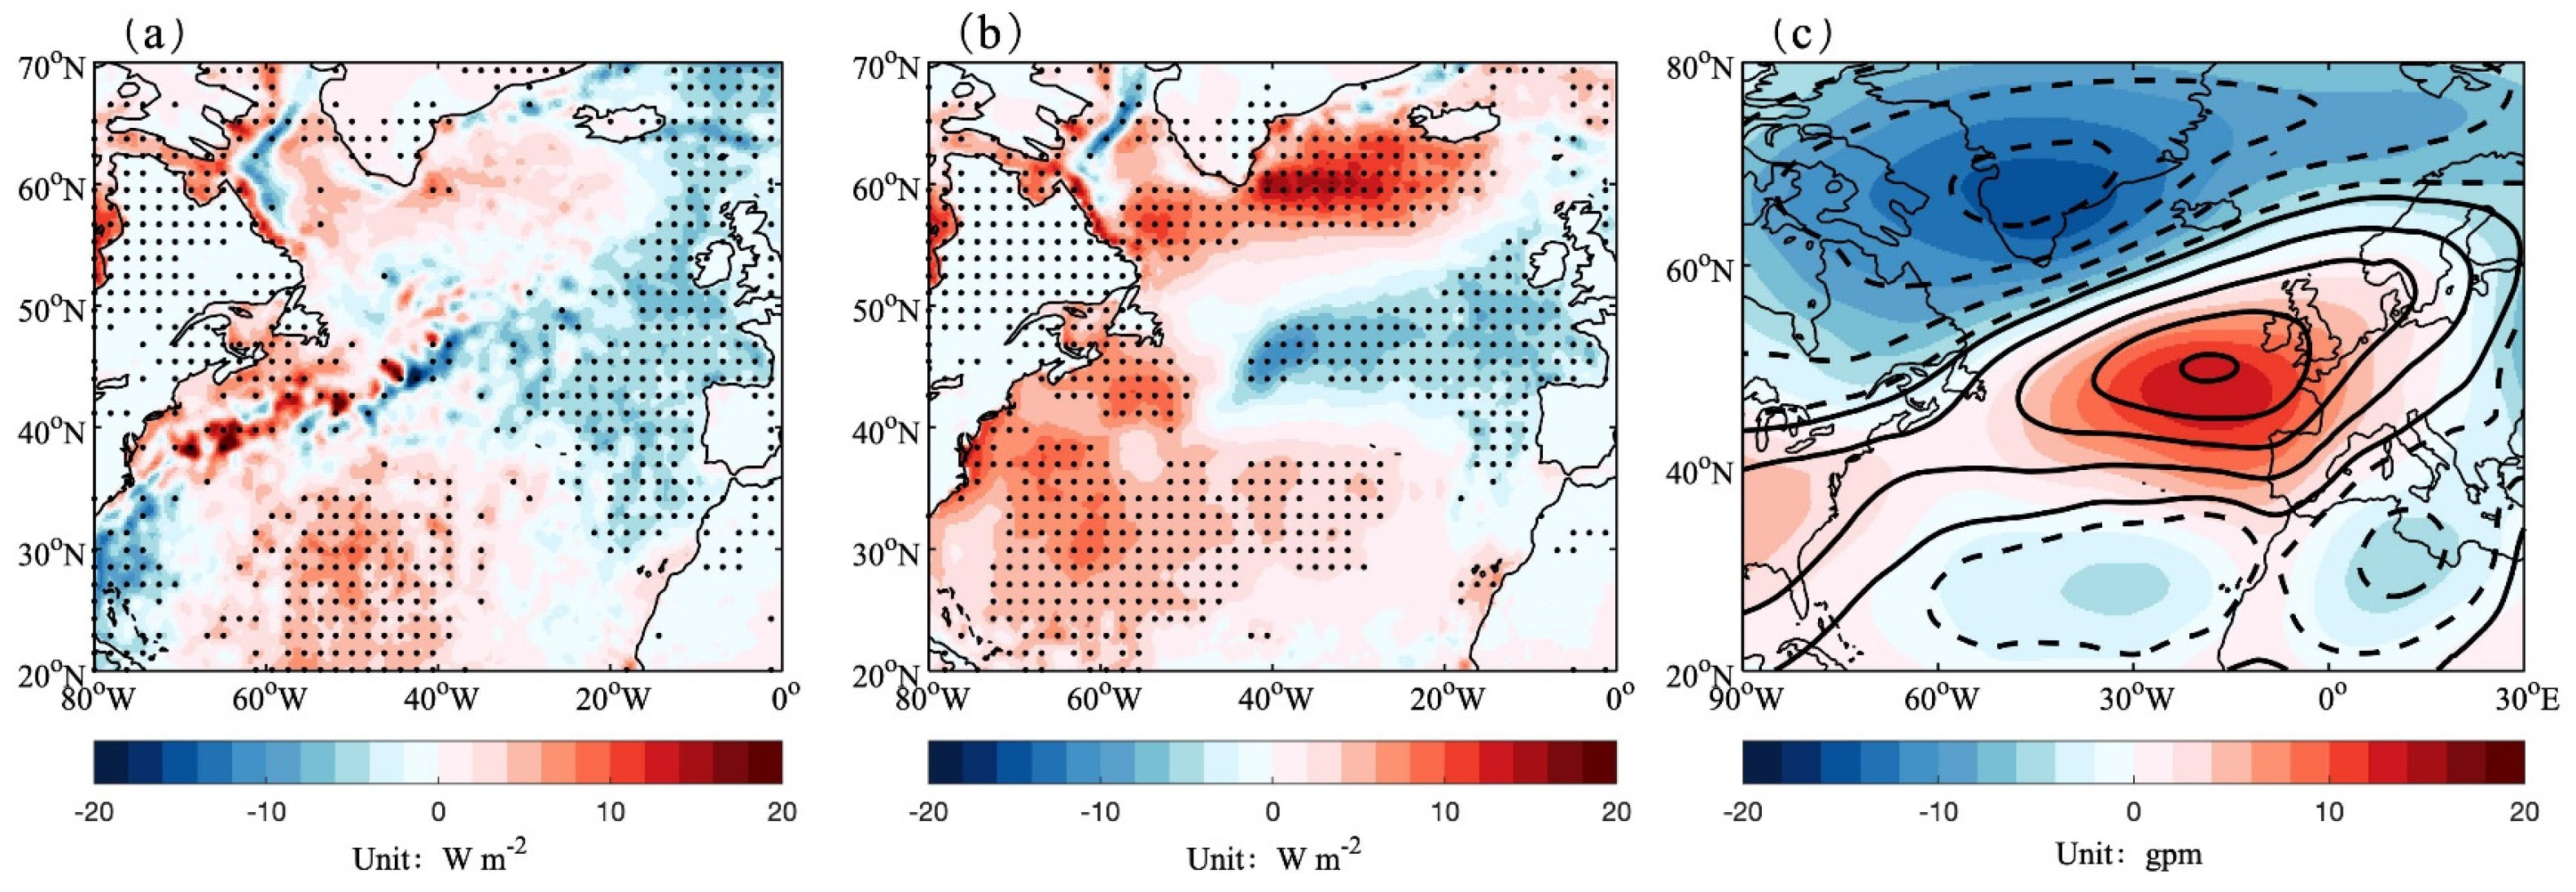
As described above, the lag correlation between the SST index and the EU index changed from atmospheric forcing to SST forcing when the GS front was smoothed in FLTR (Figure 1g–i). To investigate the reason behind the SST driving in FLTR, the turbulent heat fluxes regressed to the SST index are shown in Figure 9. It can be seen from the figure that in FLTR, the pattern of turbulent heat flux response resembles the North Atlantic SST horseshoe (NAH) pattern [41], which is reported to lead the NAO index by 10 days [12]. The geopotential height response to the SST index at lag 0 days in FLTR (Figure 9c) already shows a more meridional distribution than that in CTRL (with a negative signal in the north of a positive signal in the North Atlantic). When the SST index leads the EU index by 3 days, the negative signal grows, and the geopotential height response turns to an NAO-like pattern. This did not happen in CTRL because the strong GS front blurred the horseshoe distribution of the turbulent heat response (Figure 9a). Thus, in the scenario with a strong GS front, the SST feedback excites an EU-like pattern; in the scenario with a weak GS front, the SST drives an NAO-like response.
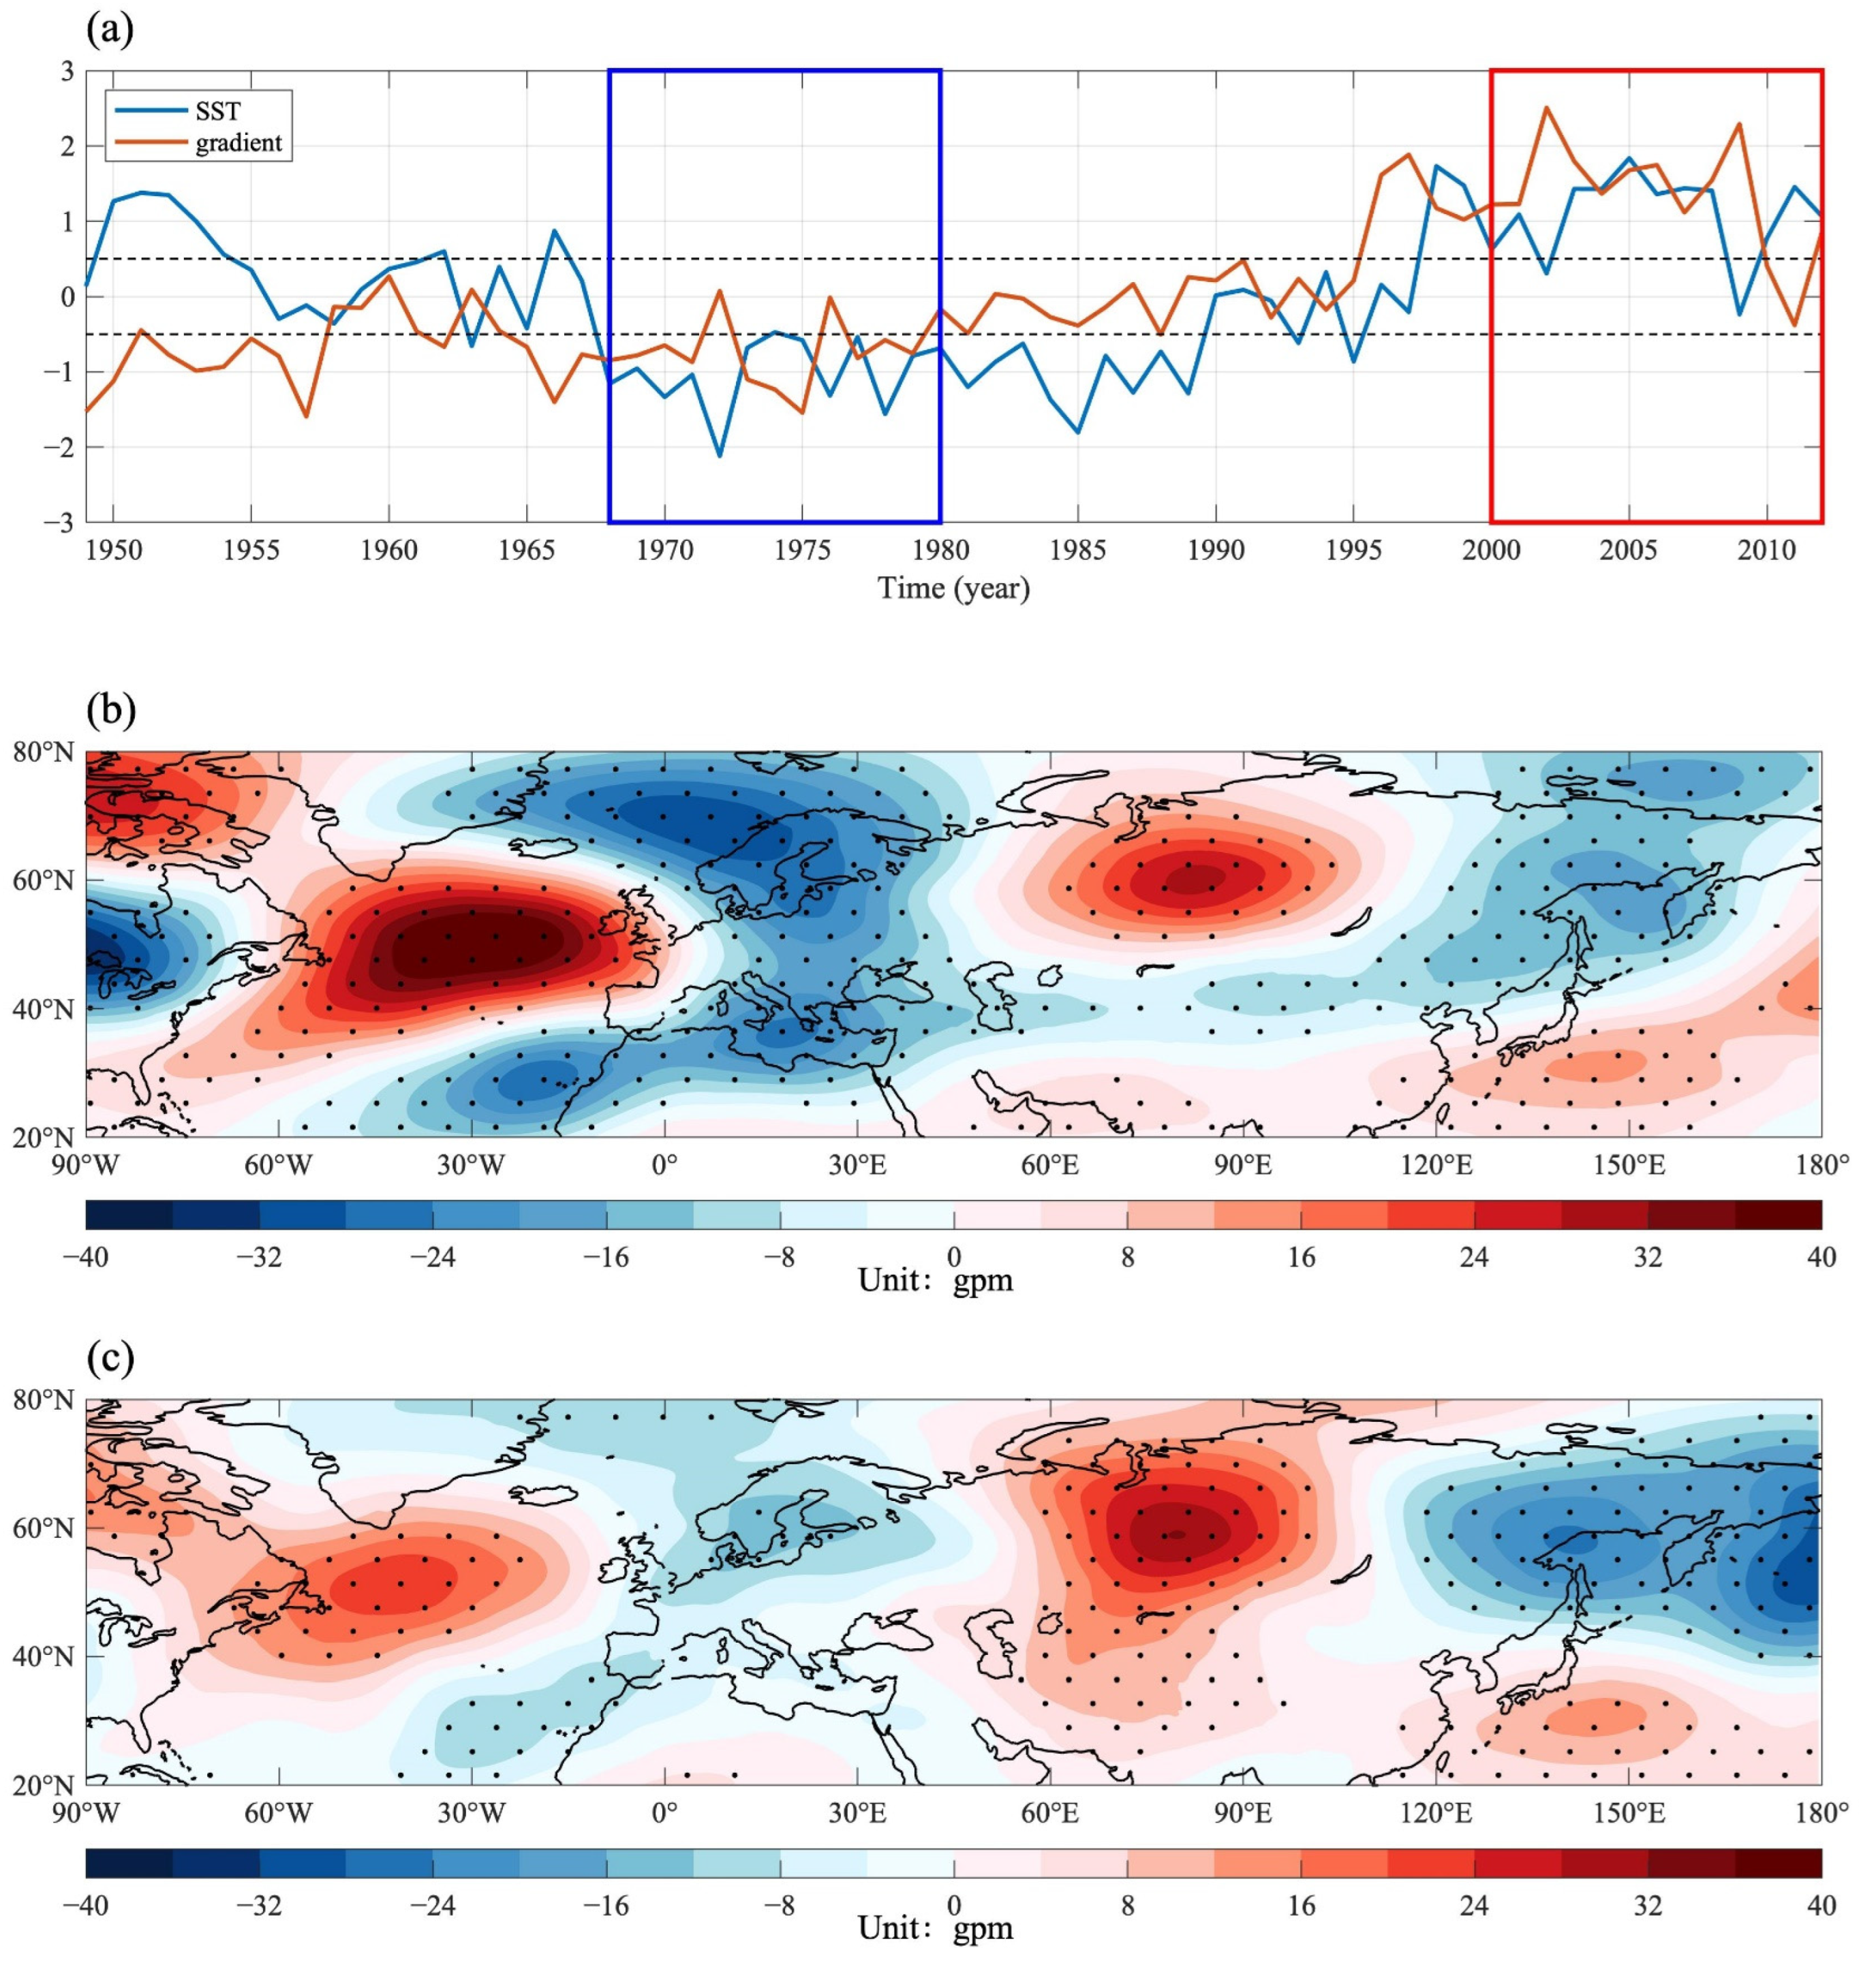
From the previous analysis, the large-scale SST anomaly combined with the strong GS front excited a strong wave train in the high-epoch period. Then how about the SST-excited wave train in the low-epoch period when the SST and gradient were both lower? As the dominant mode of multidecadal variation in the North Atlantic SST is the Atlantic Multidecadal Oscillation (AMO) [42,43], we show in Figure 10a the multidecadal variation of the normalized SST and normalized SST gradient, averaged in the same region shown in Figure 1, from ERA5 reanalysis data. In contrast with the period we chose (2000–2012, during which the SST and its gradient were higher by half of a standard deviation, hereafter termed the “high-period”), there was a period (1968–1980, in the negative phase of AMO) when the SST and its gradient were generally lower by half of a standard deviation (hereafter termed the “low-period”). The Z300 values excited by the SST index during the low-period were compared with those during the high-period, as illustrated in Figure 10b,c. It can be seen that during the high-period, the first Z300 signal excited by the SST index is almost twice as large as that during the low-period. The signal also lies closer to the European coast when the SST gradients are strong. These results agree with the findings of previous studies that during an AMO-positive phase, the Scandinavian teleconnection pattern is stronger [44,45]. Our results also indicated the importance of the SST gradient in large-scale SST feedback to the atmosphere on synoptic-to-subseasonal timescales. The effect of the GS front on large-scale SST variation over longer timescales, such as decadal and multidecadal timescales, may be seen as an interesting topic for future research.

4. Conclusions

In this study, we investigated the role played by the GS front in SST feedback to the atmosphere using a global high-resolution CAM5 model forced by SST in boreal winters (DJF) from 2000 to 2013. We conducted two sets of multiensemble simulations, each consisting of five ensemble members. To study the importance of the GS front, the SST fields were smoothed in the region (81.25° W–20° W, 25° N–57° N), and the SST gradients were weakened by approximately 40% in the middle of the GS extension region. The regional averaged SST in the central North Atlantic region and its variation were identical in the two sets of experiments; the only difference was the strength of the GS SST front. The large-scale SST anomaly in the central North Atlantic in our model gives feedback to the atmosphere and excites a wave train extending across Eurasia, thereby resembling the EU pattern. With the inclusion of the strong GS front, the first center of the wave train in the North Atlantic is strengthened by approximately 40%, and the wave activity flux toward downstream is intensified. The factors through which the GS front might exert influence on the wave train were further explored. The presence of a strong GS front corresponds to a stronger eddy-mediated process and a greater increasing tendency of the geopotential height anomaly in the North Atlantic. When the large-scale SST is combined with a strong GS front, highly increased water vapor is released from the GS region, resulting in a 50% increase in moisture transport toward Western Europe. In this scenario, precipitation and diabatic heating are greatly increased on the western Scandinavian Peninsula. The deep diabatic heating over the Scandinavian Peninsula then triggers strong upward wave activity flux, and the wave train excited by the large-scale SST variation is strengthened. These findings suggest that the strong SST front in the large-scale SST anomaly in the central North Atlantic significantly amplifies its feedback to the atmosphere in winter.

Author Contributions

Conceptualization, X.X. and Y.J.; methodology, X.X. and Y.J.; software, X.X.; validation, X.X. and Y.J. and Z.H.; formal analysis, X.X. and Y.J.; investigation, X.X.; resources, X.X. and Y.J.; data curation, X.X. and Y.J.; writing—original draft preparation, X.X. and Y.J.; writing—review and editing, X.X. and Y.J.; visualization, X.X.; supervision, Y.J.; project administration, Y.J.; funding acquisition, Y.J. All authors have read and agreed to the published version of the manuscript.

Funding

This research was supported by the National Natural Science Foundation of China (41975065), the Shandong Provincial Natural Science Foundation (ZR2019ZD12), and the Taishan Panddeng Scholar Project.

Institutional Review Board Statement

Not applicable.

Informed Consent Statement

Not applicable.

Data Availability Statement

The CAM5 model output data from this study are available from the corresponding author on reasonable request. The ERA5 data are available at https://cds.climate.copernicus.eu/cdsapp#!/dataset/reanalysis-era5-pressure-levels?tab=overview URL (accessed on 10 August 2023). The OISST data are available at https://climatedataguide.ucar.edu/climate-data/sst-data-noaa-high-resolution-025x025-blended-analysis-daily-sst-and-ice-oisstv2. URL (accessed on 5 June 2023).

Acknowledgments

We thank the National Supercomputing Center in TianJin for providing the computing resources that contributed to the research in this paper.

Conflicts of Interest

The authors declare no conflict of interest.

References

  1. Hoskins, B.J.; Valdes, P.J. On the Existence of Storm-Tracks. J. Atmos. Sci. 1990, 47, 1854–1864. [Google Scholar] [CrossRef]
  2. Minobe, S.; Kuwano-Yoshida, A.; Komori, N.; Xie, S.P.; Small, R.J. Influence of the Gulf Stream on the troposphere. Nature 2008, 452, 206–209. [Google Scholar] [CrossRef] [PubMed]
  3. Nakamura, H.; Sampe, T.; Tanimoto, Y.; Shimpo, A. Observed associations among storm tracks, jet streams and midlatitude oceanic fronts. Earth’s Clim. Ocean. Atmos. Interact. Geophys. Monogr. 2004, 147, 329–345. [Google Scholar]
  4. Ogawa, F.; Nakamura, H.; Nishii, K.; Miyasaka, T.; Kuwano-Yoshida, A. Dependence of the climatological axial latitudes of the tropospheric westerlies and storm tracks on the latitude of an extratropical oceanic front. Geophys. Res. Lett. 2012, 39, L05804. [Google Scholar] [CrossRef]
  5. Zhou, G.; Cheng, X. Impacts of oceanic fronts and eddies in the Kuroshio-Oyashio Extension region on the atmospheric general circulation and storm track. Adv. Atmos. Sci. 2022, 39, 22–54. [Google Scholar] [CrossRef]
  6. Kuwano-Yoshida, A.; Minobe, S. Storm-Track Response to SST Fronts in the Northwestern Pacific Region in an AGCM. J. Clim. 2017, 30, 1081–1102. [Google Scholar] [CrossRef]
  7. Small, R.J.; Msadek, R.; Kwon, Y.O.; Booth, J.F.; Zarzycki, C. Atmosphere surface storm track response to resolved ocean mesoscale in two sets of global climate model experiments. Clim. Dyn. 2018, 52, 2067–2089. [Google Scholar] [CrossRef]
  8. Tsopouridis, L.; Spengler, T.; Spensberger, C. Smoother versus sharper Gulf Stream and Kuroshio sea surface temperature fronts: Effects on cyclones and climatology. Weather. Clim. Dyn. 2021, 2, 953–970. [Google Scholar] [CrossRef]
  9. Bui, H.; Spengler, T. On the Influence of Sea Surface Temperature Distributions on the Development of Extratropical Cyclones. J. Atmos. Sci. 2021, 78, 1173–1188. [Google Scholar] [CrossRef]
  10. Lee, R.W.; Woollings, T.J.; Hoskins, B.J.; Williams, K.D.; O’Reilly, C.H.; Masato, G. Impact of Gulf Stream SST biases on the global atmospheric circulation. Clim. Dyn. 2018, 51, 3369–3387. [Google Scholar] [CrossRef]
  11. Wills, S.M.; Thompson, D.W.J.; Ciasto, L.M. On the Observed Relationships between Variability in Gulf Stream Sea Surface Temperatures and the Atmospheric Circulation over the North Atlantic. J. Clim. 2016, 29, 3719–3730. [Google Scholar] [CrossRef]
  12. Nie, Y.; Zhang, Y.; Yang, X.Q.; Ren, H.L. Winter and summer Rossby wave sources in the CMIP5 models. Earth Space Sci. 2019, 6, 1831–1846. [Google Scholar] [CrossRef]
  13. Karnauskas, K.B.; Zhang, L.; Amaya, D.J. The Atmospheric Response to North Atlantic SST Trends, 1870–2019. Geophys. Res. Lett. 2020, 48, e2020GL090677. [Google Scholar] [CrossRef]
  14. Haarsma, R.J.; García-Serrano, J.; Prodhomme, C.; Bellprat, O.; Drijfhout, S. Sensitivity of winter North Atlantic-European climate to resolved atmosphere and ocean dynamics. Sci. Rep. 2019, 9, 13358. [Google Scholar] [CrossRef] [PubMed]
  15. Liu, Y.; Wang, L.; Zhou, W.; Chen, W. Three Eurasian teleconnection patterns: Spatial structures, temporal variability, and associated winter climate anomalies. Clim. Dyn. 2014, 42, 2817–2839. [Google Scholar] [CrossRef]
  16. Wang, L.; Liu, Y.; Zhang, Y.; Chen, W.; Chen, S. Time-varying structure of the wintertime Eurasian pattern: Role of the North Atlantic sea surface temperature and atmospheric mean flow. Clim. Dyn. 2019, 52, 2467–2479. [Google Scholar] [CrossRef]
  17. Ma, X.; Chang, P.; Saravanan, R.; Montuoro, R.; Hsieh, J.S.; Wu, D.; Lin, X.; Wu, L.; Zhao, J. Distant Influence of Kuroshio Eddies on North Pacific Weather Patterns? Sci. Rep. 2015, 5, 17785. [Google Scholar] [CrossRef]
  18. Ma, X.; Chang, P.; Saravanan, R.; Montuoro, R.; Nakamura, H.; Wu, D.; Lin, X.; Wu, L. Importance of resolving Kuroshio front and eddy influence in simulating the north Pacific storm track. J. Clim. 2017, 30, 1861–1880. [Google Scholar] [CrossRef]
  19. Willison, J.; Robinson, W.A.; Lackmann, G.M. The importance of resolving mesoscale latent heating in the North Atlantic storm track. J. Atmos. Sci. 2013, 70, 2234–2250. [Google Scholar] [CrossRef]
  20. Tsartsali, E.E.; Haarsma, R.J.; Athanasiadis, P.J.; Bellucci, A.; de Vries, H.; Drijfhout, S.; de Vries, I.E.; Putrahasan, D.; Roberts, M.J.; Sanchez–Gomez, E.; et al. Impact of resolution on the atmosphere–ocean coupling along the Gulf Stream in global high resolution models. Clim. Dyn. 2022, 58, 3317–3333. [Google Scholar] [CrossRef]
  21. Ma, X.; Jia, Y.; Han, Z. Impact of the Gulf Stream front on atmospheric rivers and Rossby wave train in the North Atlantic. Clim. Dyn. 2023; submitted. [Google Scholar] [CrossRef]
  22. Kwon, Y.O.; Alexander, M.A.; Bond, N.A.; Frankignoul, C.; Nakamura, H.; Qiu, B.; Thompson, L.A. Role of the Gulf Stream and Kuroshio-Oyashio systems in large-scale atmosphere-ocean interaction: A review. J. Clim. 2010, 23, 3249–3281. [Google Scholar] [CrossRef]
  23. Lau, N.; Holopainen, E.O. Transient Eddy Forcing of the Time-Mean Flow as Identified by Geopotential Tendencies. J. Atmos. Sci. 1984, 41, 313–328. [Google Scholar] [CrossRef]
  24. Zhu, Y.; Newell, R.E. A proposed algorithm for moisture fluxes from atmospheric rivers. Mon. Weather. Rev. 1998, 126, 725–735. [Google Scholar] [CrossRef]
  25. Yanai, M.; Esbensen, S.; Chu, J. Determination of Bulk Properties of Tropical Cloud Clusters from Large-Scale Heat and Moisture Budgets. J. Atmos. Sci. 1973, 30, 611–627. [Google Scholar] [CrossRef]
  26. Takaya, K.; Nakamura, H. A Formulation of a Phase-Independent Wave-Activity Flux for Stationary and Migratory Quasigeostrophic Eddies on a Zonally Varying Basic Flow. J. Atmos. Sci. 2001, 58, 608–627. [Google Scholar] [CrossRef]
  27. Barnston, A.G.; Livezey, R.E. Classification, seasonality and persistence of low-frequency atmospheric circulation patterns. Mon. Weather. Rev. 1987, 115, 1083–1126. [Google Scholar] [CrossRef]
  28. Hannachi, A.; Jolliffe, I.T.; Stephenson, D.B. Empirical orthogonal functions and related techniques in atmospheric science: A review. Int. J. Climatol. A J. R. Meteorol. Soc. 2007, 27, 1119–1152. [Google Scholar] [CrossRef]
  29. Thompson, D.W.; Wallace, J.M. The Arctic Oscillation signature in the wintertime geopotential height and temperature fields. Geophys. Res. Lett. 1998, 25, 1297–1300. [Google Scholar] [CrossRef]
  30. Watanabe, M.; Kimoto, M. Atmosphere-ocean thermal coupling in the North Atlantic: A positive feedback. Q. J. Roy. Meteor. Soc. 2000, 126, 3343–3369. [Google Scholar]
  31. An, X.; Sheng, L.; Li, C.; Chen, W.; Tang, Y.; Huangfu, J. Effect of rainfall-induced diabatic heating over southern China on the formation of wintertime haze on the North China Plain. Atmos. Chem. Phys. 2022, 22, 725–738. [Google Scholar] [CrossRef]
  32. Luo, Y.; Shi, J.; An, X.; Li, C. The combined impact of subtropical wave train and Polar-Eurasian teleconnection on the extreme cold event over North China in January 2021. Clim. Dyn. 2022, 60, 3339–3352. [Google Scholar] [CrossRef]
  33. Guan, B.; Waliser, D.E. Detection of atmospheric rivers: Evaluation and application of an algorithm for global studies. J. Geophys. Res. Atmos. 2015, 120, 12514–12535. [Google Scholar] [CrossRef]
  34. Lavers, D.A.; Villarini, G. The nexus between atmospheric rivers and extreme precipitation across Europe. Geophys. Res. Lett. 2013, 40, 3259–3264. [Google Scholar] [CrossRef]
  35. Zhang, Z.; Ralph, F.M.; Zheng, M. The relationship between extratropical cyclone strength and atmospheric river intensity and position. Geophys. Res. Lett. 2019, 46, 1814–1823. [Google Scholar] [CrossRef]
  36. De Vries, A.J. A global climatological perspective on the importance of Rossby wave breaking and intense moisture transport for extreme precipitation events. Weather. Clim. Dyn. 2021, 2, 129–161. [Google Scholar] [CrossRef]
  37. Piazza, M.; Terray, L.; Boé, J.; Maisonnave, E.; Sanchez-Gomez, E. Influence of small-scale North Atlantic sea surface temperature patterns on the marine boundary layer and free troposphere: A study using the atmospheric ARPEGE model. Clim. Dyn. 2016, 46, 1699–1717. [Google Scholar] [CrossRef]
  38. Zavadoff, B.L.; Kirtman, B.P. Dynamic and thermodynamic modulators of European atmospheric rivers. J. Clim. 2020, 33, 4167–4185. [Google Scholar] [CrossRef]
  39. Liu, X.; Ma, X.; Chang, P.; Jia, Y.; Fu, D.; Xu, G.; Wu, L.; Saravanan, R.; Patricola, C.M. Ocean fronts and eddies force atmospheric rivers and heavy precipitation in western North America. Nat. Commun. 2021, 12, 1268. [Google Scholar] [CrossRef]
  40. Dacre, H.F.; Martinez-Alvarado, O.; Mbengue, C.O. Linking atmospheric rivers and warm conveyor belt airflows. J. Hydrometeor. 2019, 20, 1183–1196. [Google Scholar] [CrossRef]
  41. Czaja, A.; Frankignoul, C. Observed Impact of Atlantic SST anomalies on the North Atlantic Oscillation. J. Clim. 2002, 15, 606–623. [Google Scholar] [CrossRef]
  42. Knight, J.R.; Allan, R.J.; Folland, C.K.; Vellinga, M.; Mann, M.E. A signature of persistent natural thermohaline circulation cycles in observed climate. Geophys. Res. Lett. 2005, 32, L20708. [Google Scholar] [CrossRef]
  43. Trenberth, K.E.; Shea, D.J. Atlantic hurricanes and natural variability in 2005. Geophys. Res. Lett. 2006, 33, L12704. [Google Scholar] [CrossRef]
  44. Zheng, F.; Liu, X.; Chen, J.; Huang, W.; Sun, C.; Wang, H. Physical Mechanism of Winter Temperature Multidecadal Variations in Arid Central Asia: The Role of the Atlantic Multidecadal Oscillation (AMO). J. Clim. 2023, 36, 7363–7377. [Google Scholar] [CrossRef]
  45. Jin, C.; Wang, B.; Yang, Y.-M.; Liu, J. “Warm Arctic-cold Siberia” as an internal mode instigated by North Atlantic warming. Geophys. Res. Lett. 2020, 47, e2019GL086248. [Google Scholar] [CrossRef]
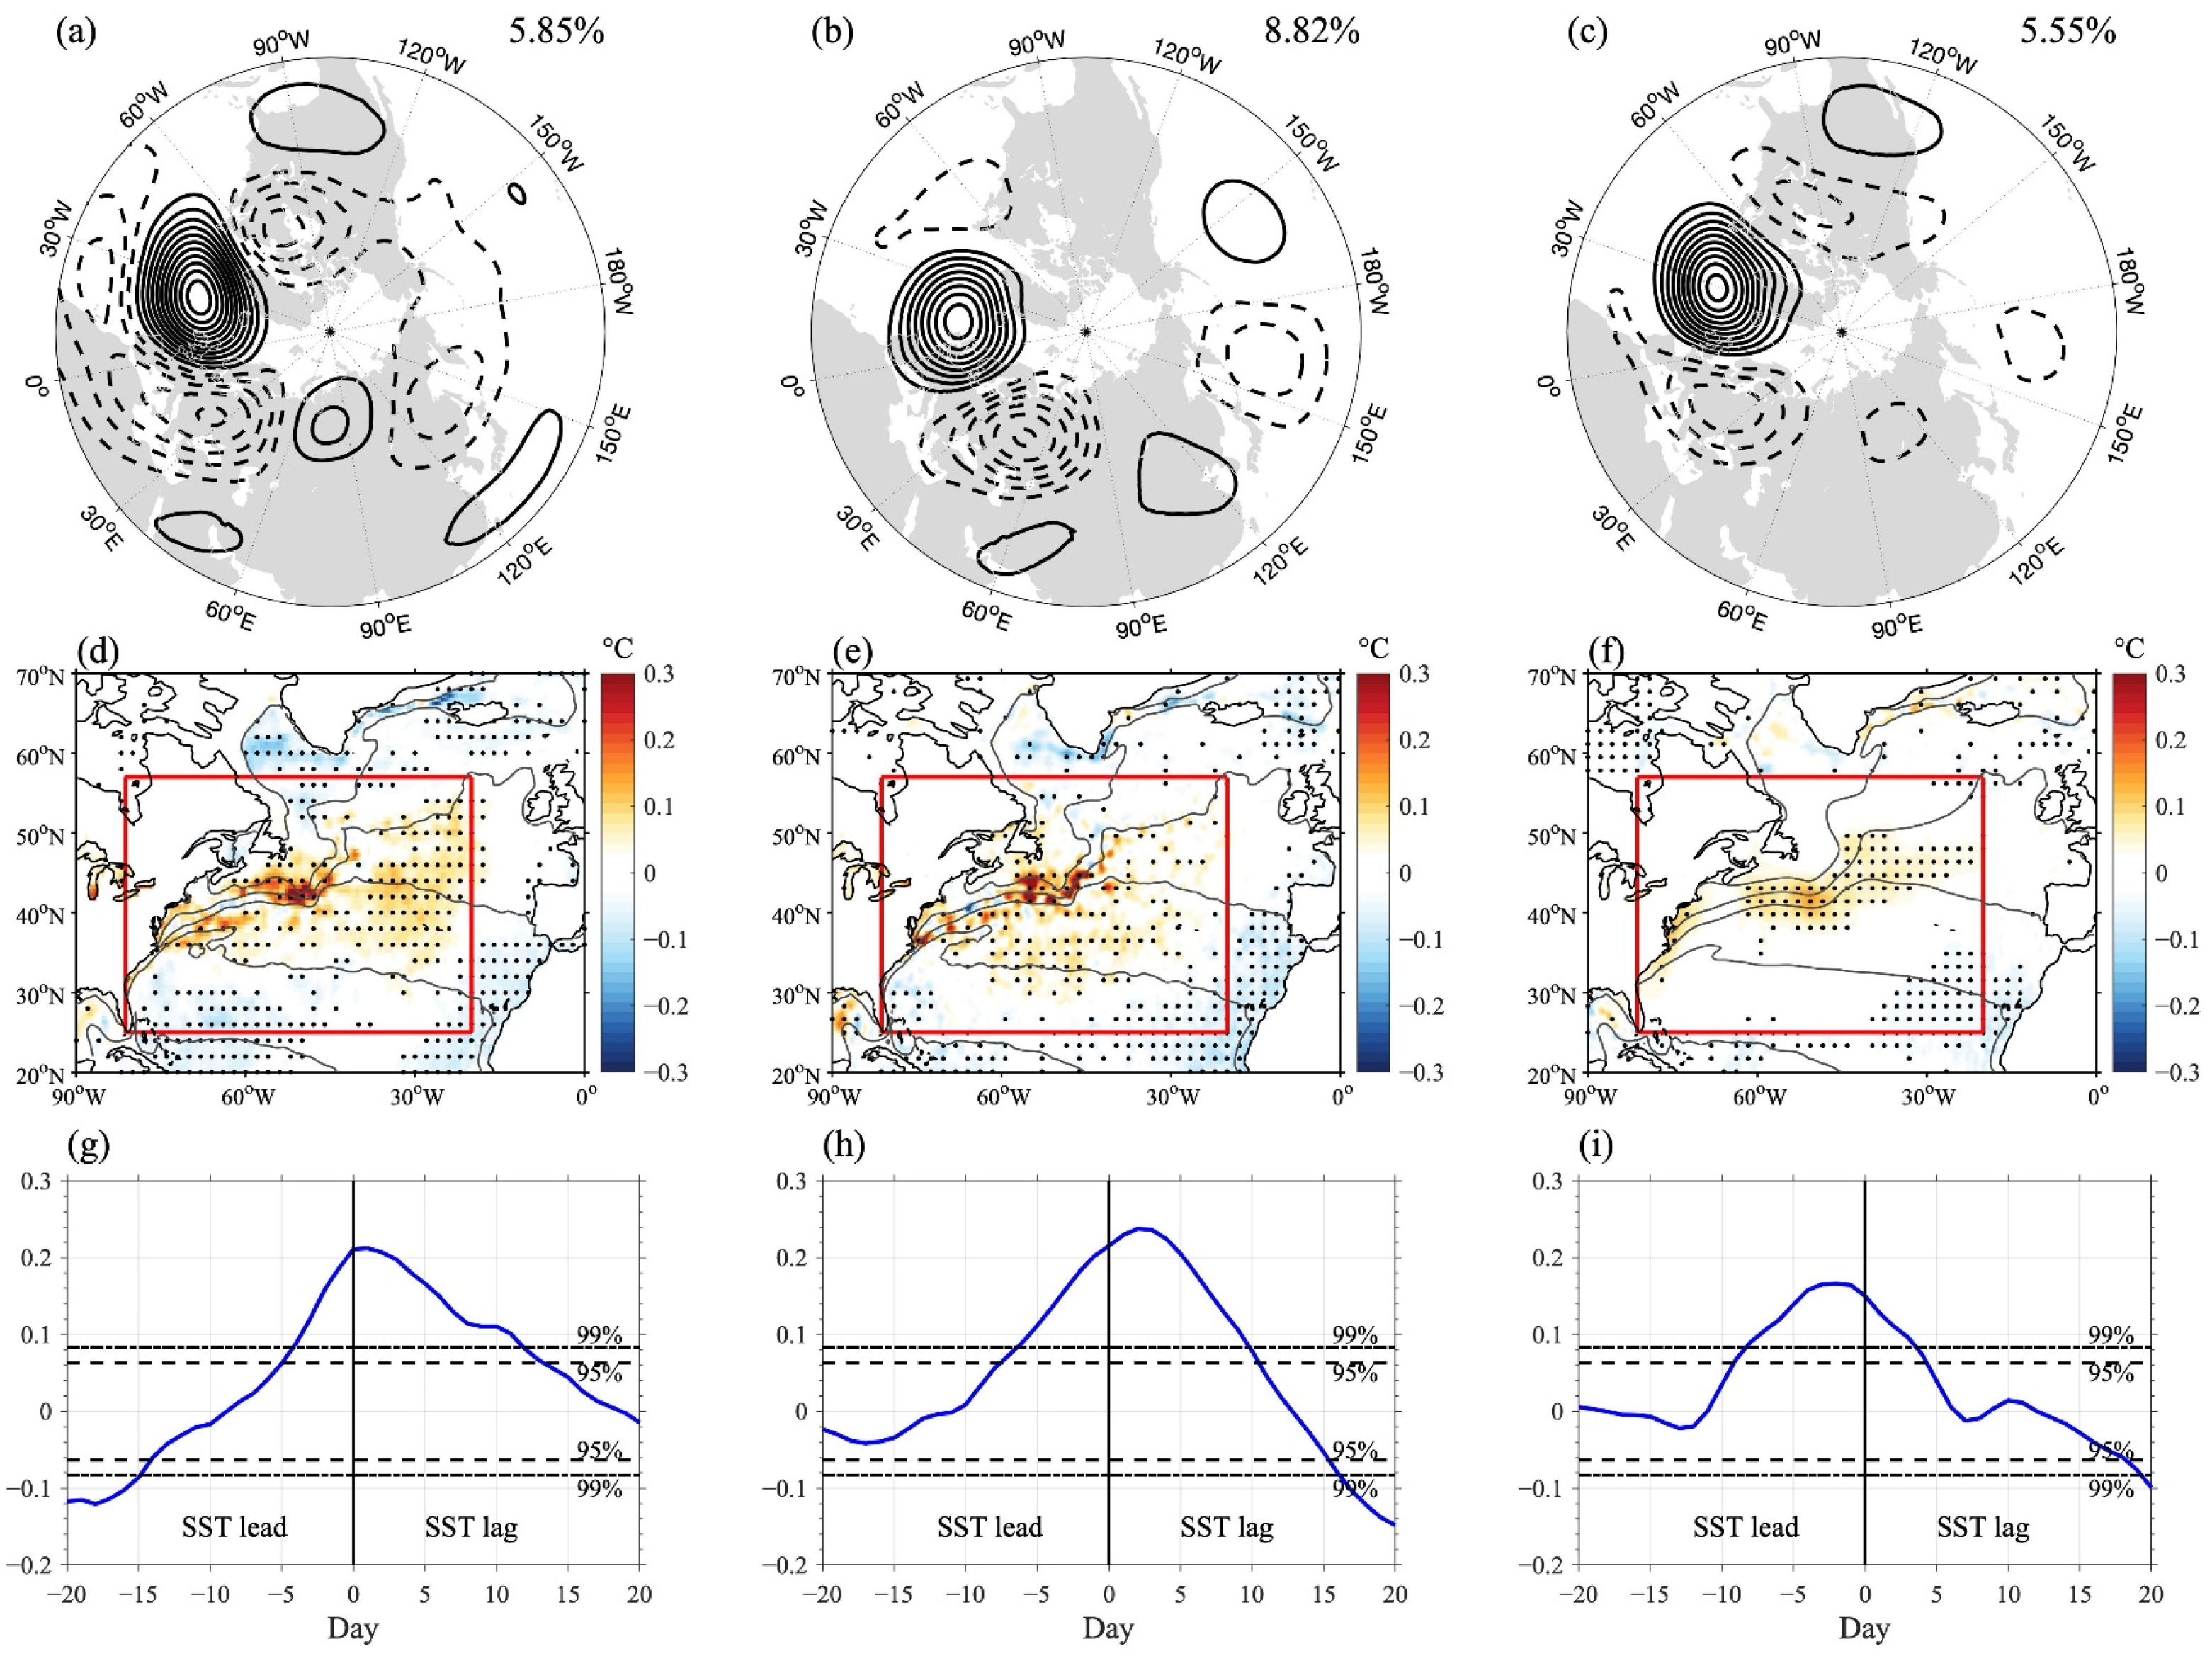
Figure 1. REOF modes of the geopotential height at 500 hPa, regression of SST on the PC time series, and lag correlation between the SST index and the PC time series in winter seasons from 2000 to 2013. (a) The fourth REOF mode (REOF4) from ERA5; (b) the REOF3 from CTRL; and (c) REOF3 from FLTR. Regression (shading) of the SST on the normalized PC time series from ERA5 (d), CTRL (e), and FLTR (f). Lag correlations between the SST index and the EU index from ERA5 (g), CTRL (h), and FLTR (i). Negative lags indicate that the SST index leads the atmosphere. Contour intervals are 5 gpm, zero-contour lines are omitted, and negative values are dashed. The unit of SST is °C. The thin gray lines (contours; unit: °C) represent the mean winter SST used by the model. The red rectangle marks the region of SST smoothing and enables calculation of the SST index. The black dots in (df) represent the 95% confidence level. Contour intervals are 0.001 in (ac), zero-contour lines are omitted, and negative values are dashed. Contour intervals in (df) are 2 °C. In (gi), long dashed lines and short dashed lines indicate the 95 and 99% confidence levels, respectively.
Atmosphere 14 01758 g001
Figure 2. Regression maps for the geopotential height at 300 hPa (shading; unit: gpm) on the normalized PC time series in (a) CTRL and (b) FLTR. (c,d) As in (a,b), but for regression on the normalized SST index. The black dots mark the 95% confidence level.
Atmosphere 14 01758 g002
Figure 3. Lagged regressions of geopotential height at 300 hPa (contour; unit: gpm), WAF (arrows; unit: m2 s−2), and WAF divergence (shading; unit: 1 × 10⁻⁷ m s−2) on the normalized SST index from lag –18 days to lag 6 days in CTRL (ae) and in FLTR (fj). Negative lags denote that the SST index leads the atmosphere. Contour intervals are 5 gpm, zero-contour lines are omitted, and negative values are dashed.
Atmosphere 14 01758 g003
Figure 4. Lagged regressions on the normalized SST index in CTRL from lag –6 days to lag 6 days. (ac) are for storm tracks at 300 hPa (shading; unit: m2 s−2), (df) are for regressions of geopotential height tendency (shaded; unit: gpm day−1), and (gi) are for TMQ (shading; unit: kg m−2). The contours are regressions of geopotential height at 300 hPa (unit: gpm). Negative lags denote that the SST index leads the atmosphere. The black dots represent the 95% confidence level. Contour intervals are 5 gpm, zero-contour lines are omitted, and negative values are dashed.
Atmosphere 14 01758 g004
Figure 5. As in Figure 4, but for the results from FLTR.
Atmosphere 14 01758 g005
Figure 6. Lagged regressions on the normalized SST index in CTRL from lag −6 to lag 6 days. The first column is for IVT (shading; unit: kg m−1 s−1), the second column is for precipitation (shading; unit: mm day−1), and the third column is for Q1 at 700 hPa (shading; unit: K day−1). The contours are regressions of geopotential height at 300 hPa (unit: gpm). Negative lags denote that the SST index leads the atmosphere. The black dots represent the 95% confidence level. Contour intervals are 5 gpm, zero-contour lines are omitted, and negative values are dashed.
Atmosphere 14 01758 g006
Figure 7. As in Figure 6, but for the results from FLTR.
Atmosphere 14 01758 g007
Figure 8. Vertical cross-section of regressions on the normalized SST index along 60° N at lag day 0. (a) Q1 (shading; unit: K day−1), (b) zonal WAF component (shading; unit: m−2 s−2), (c) vertical WAF component (shading; unit: 10−2 Pa m s−2) in CTRL. (df) As in (ac), but for FLTR. The contours are regressions of geopotential height (unit: gpm). Contour intervals are 4 gpm, zero-contour lines are omitted, and negative values are dashed. The black dots in the Q1 profiles represent the 95% confidence level.
Atmosphere 14 01758 g008
Figure 9. Regressions of turbulent heat flux and geopotential height at 300 hPa on the normalized SST index. (a) Turbulent heat flux (shading; unit: W m−2) in CTRL. (b) Turbulent heat flux in FLTR. (c) Geopotential height at 300 hPa (shading; unit: gpm) in FLTR on lag 3 days. Contours (unit: gpm) show geopotential height on lag 0 days in FLTR. Contour intervals are 2 gpm, zero-contour lines are omitted, and negative values are dashed. The black dots in (a,b) profiles represent the 95% confidence level.
Atmosphere 14 01758 g009
Figure 10. (a) Normalized winter mean (DJF) SST and SST gradient variation from 1949 to 2012 (averaged in the region [81.25° W–20° W, 25° N–57° N]). The thin black dash lines mark the −0.5 and 0.5 standard deviations. The blue rectangle marks the “low-period” (1968–1980), while the red rectangle marks the “high-period” (2000–2012). The black dots mark the 95% confidence level. (b) Regression map of the geopotential height at 300 hPa (shading; unit: gpm) on the normalized SST index during 2000–2013. (c) Regression map of the geopotential height at 300 hPa (shading; unit: gpm) on the normalized SST index during 1968–1980.
Atmosphere 14 01758 g010
Disclaimer/Publisher’s Note: The statements, opinions and data contained in all publications are solely those of the individual author(s) and contributor(s) and not of MDPI and/or the editor(s). MDPI and/or the editor(s) disclaim responsibility for any injury to people or property resulting from any ideas, methods, instructions or products referred to in the content.