
Relationship between Summer Synoptic Circulation Patterns and Extreme Precipitation in Northern China


Abstract
:1. Introduction
2. Materials and Methods
2.1. Data
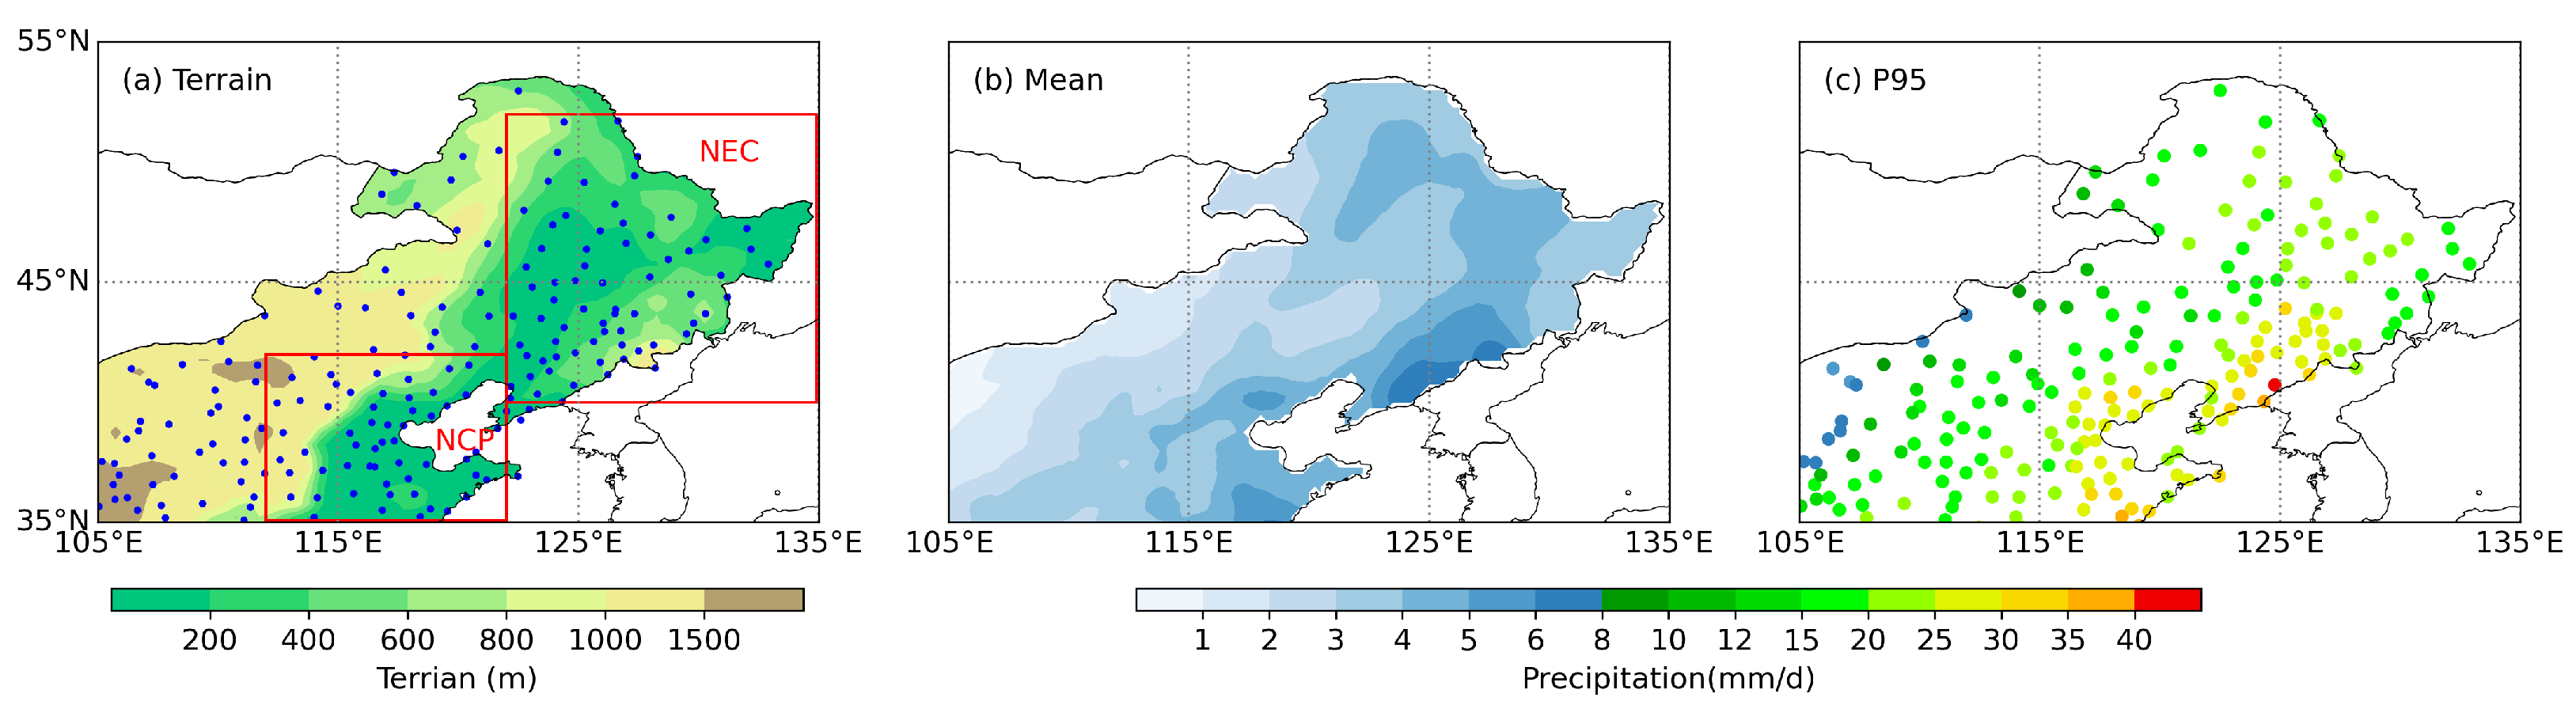
2.2. Study Area
2.3. Self-Organizing Map (SOM)
2.4. Regional Extreme Precipitation Events (REPEs)
3. Results
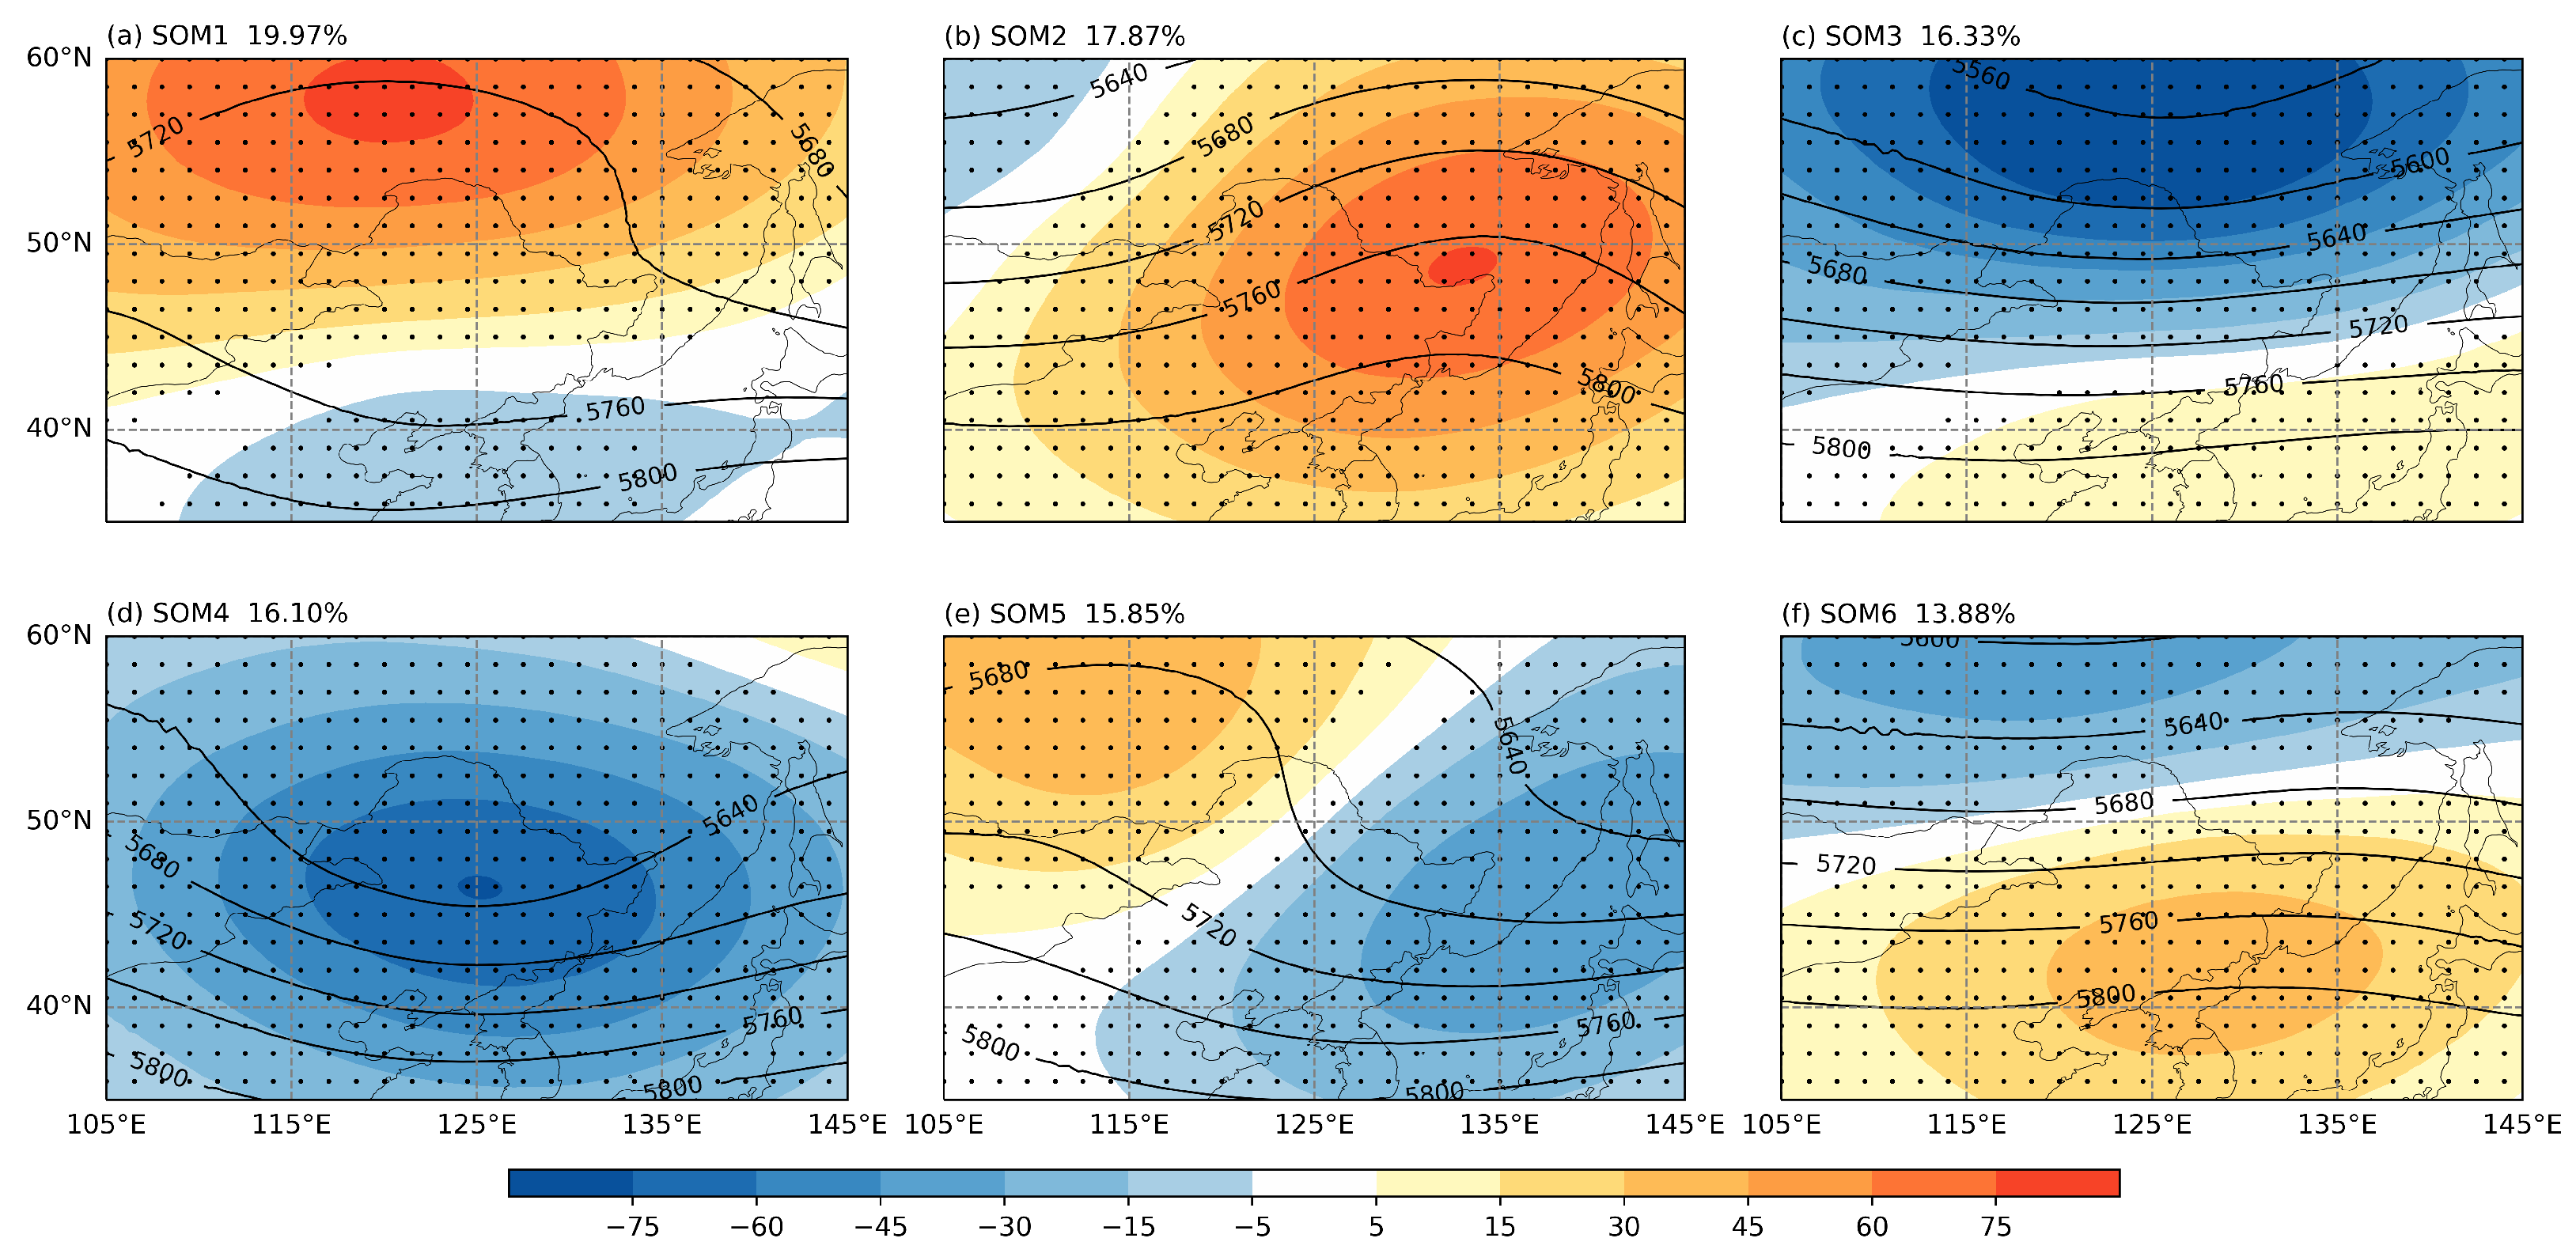
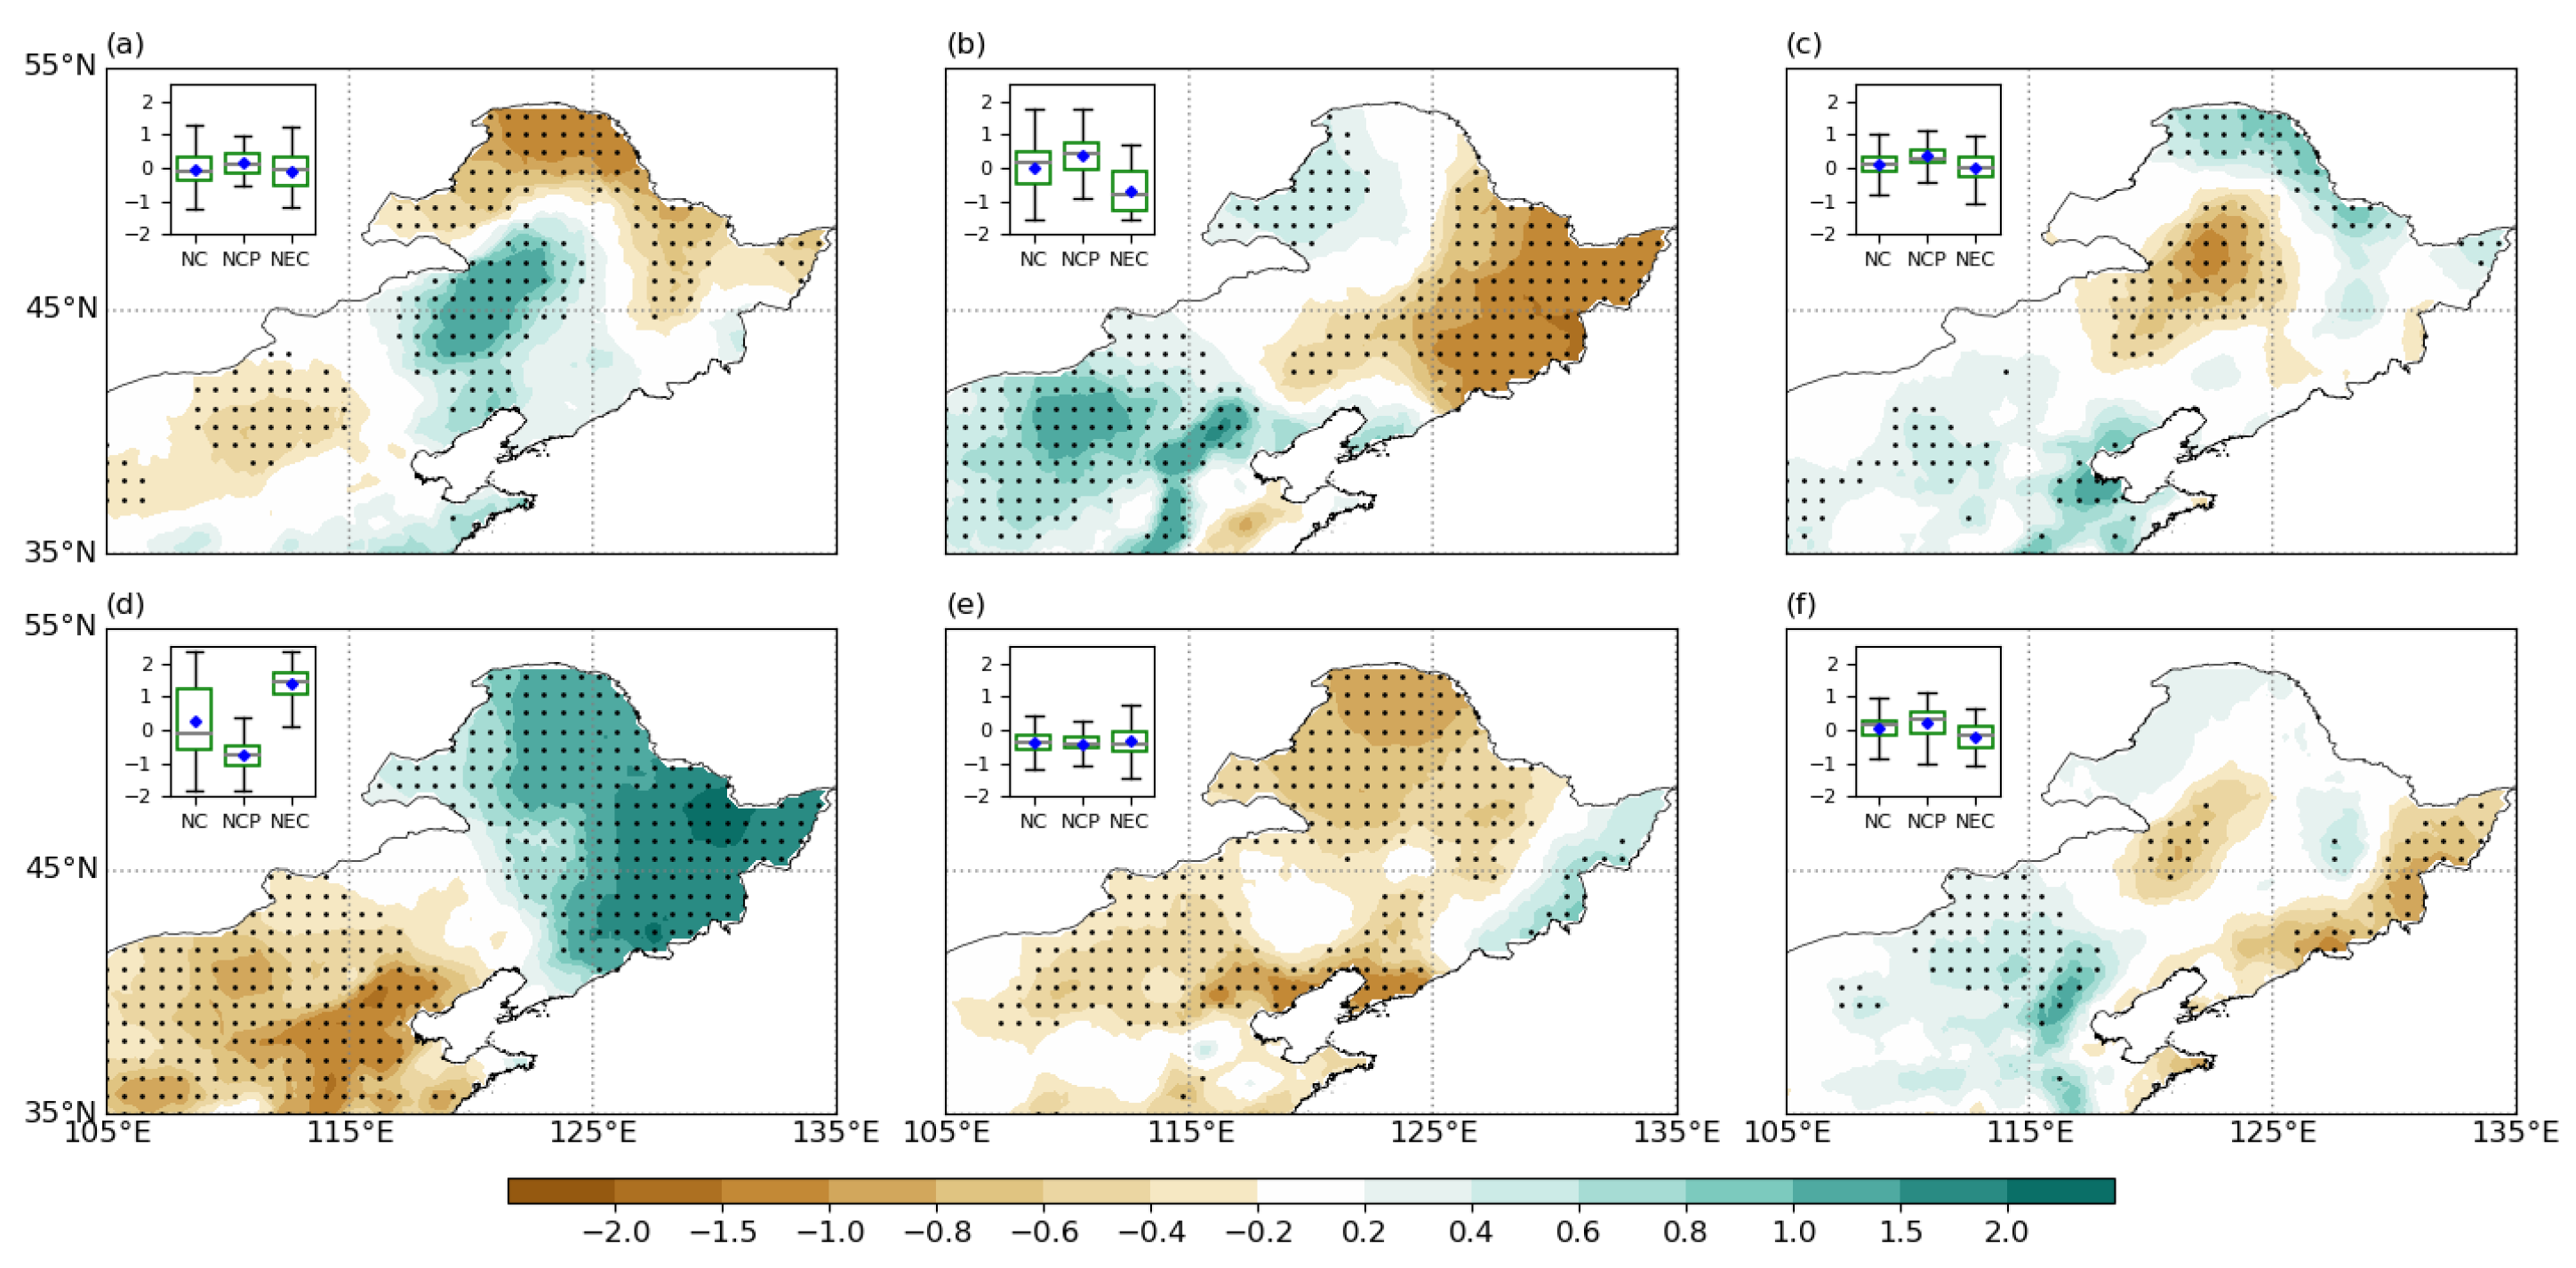
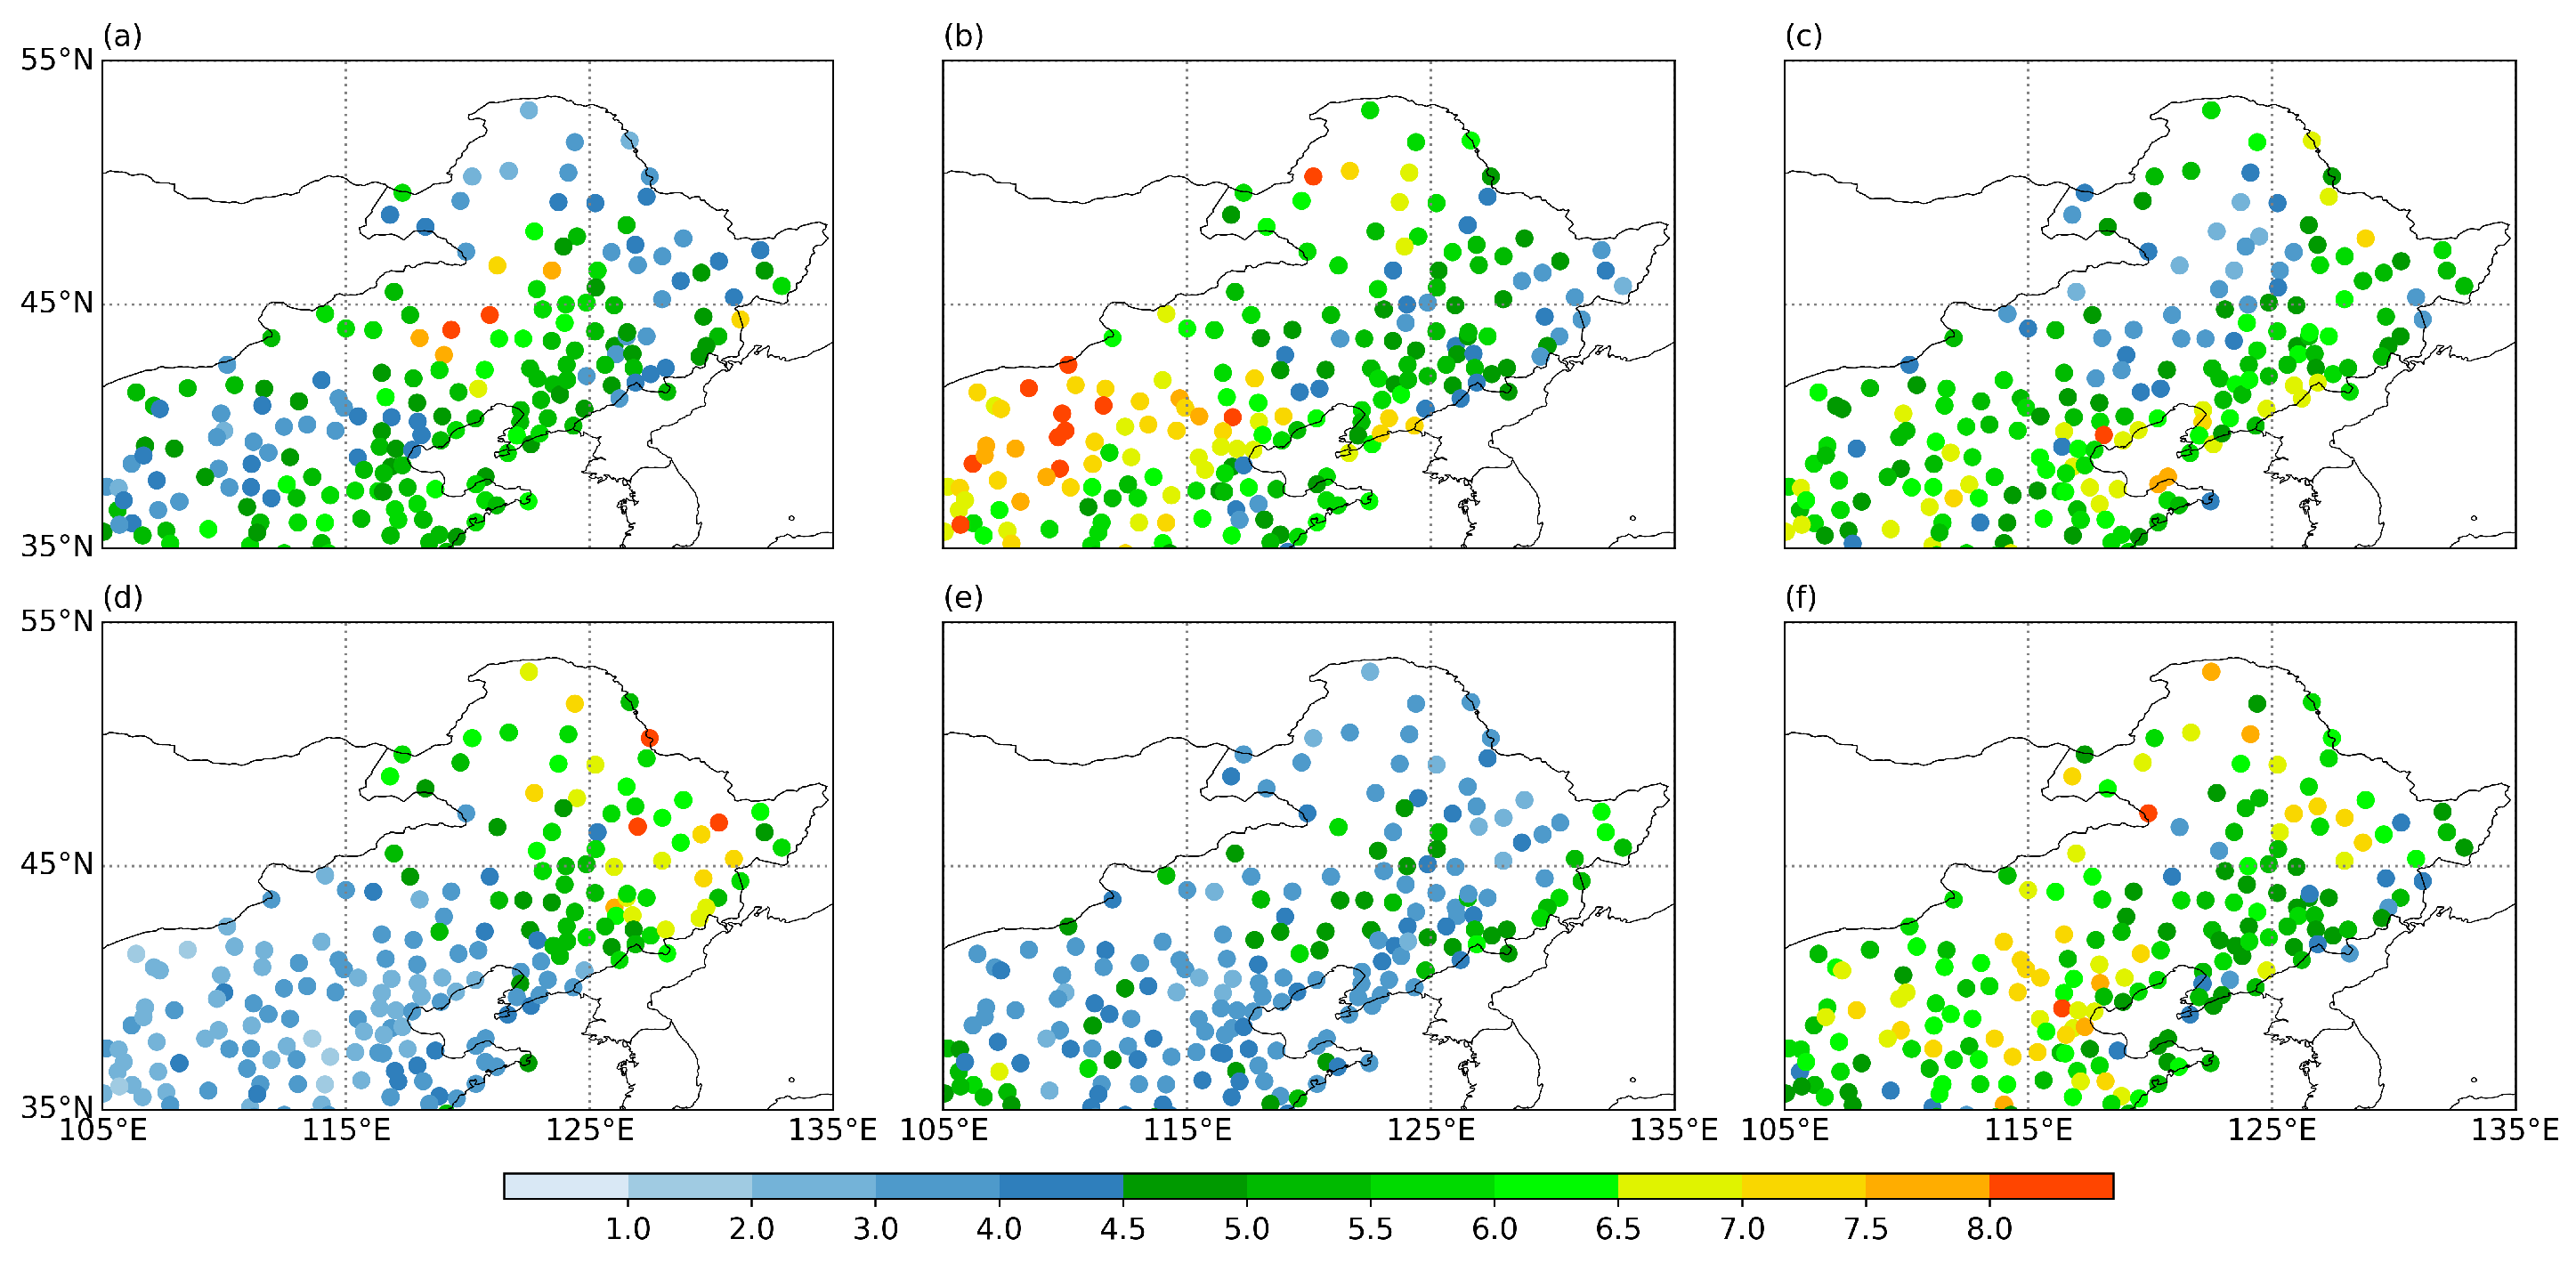
3.1. Synoptic Circulation Patterns and Their Impacts on Summer Precipitation
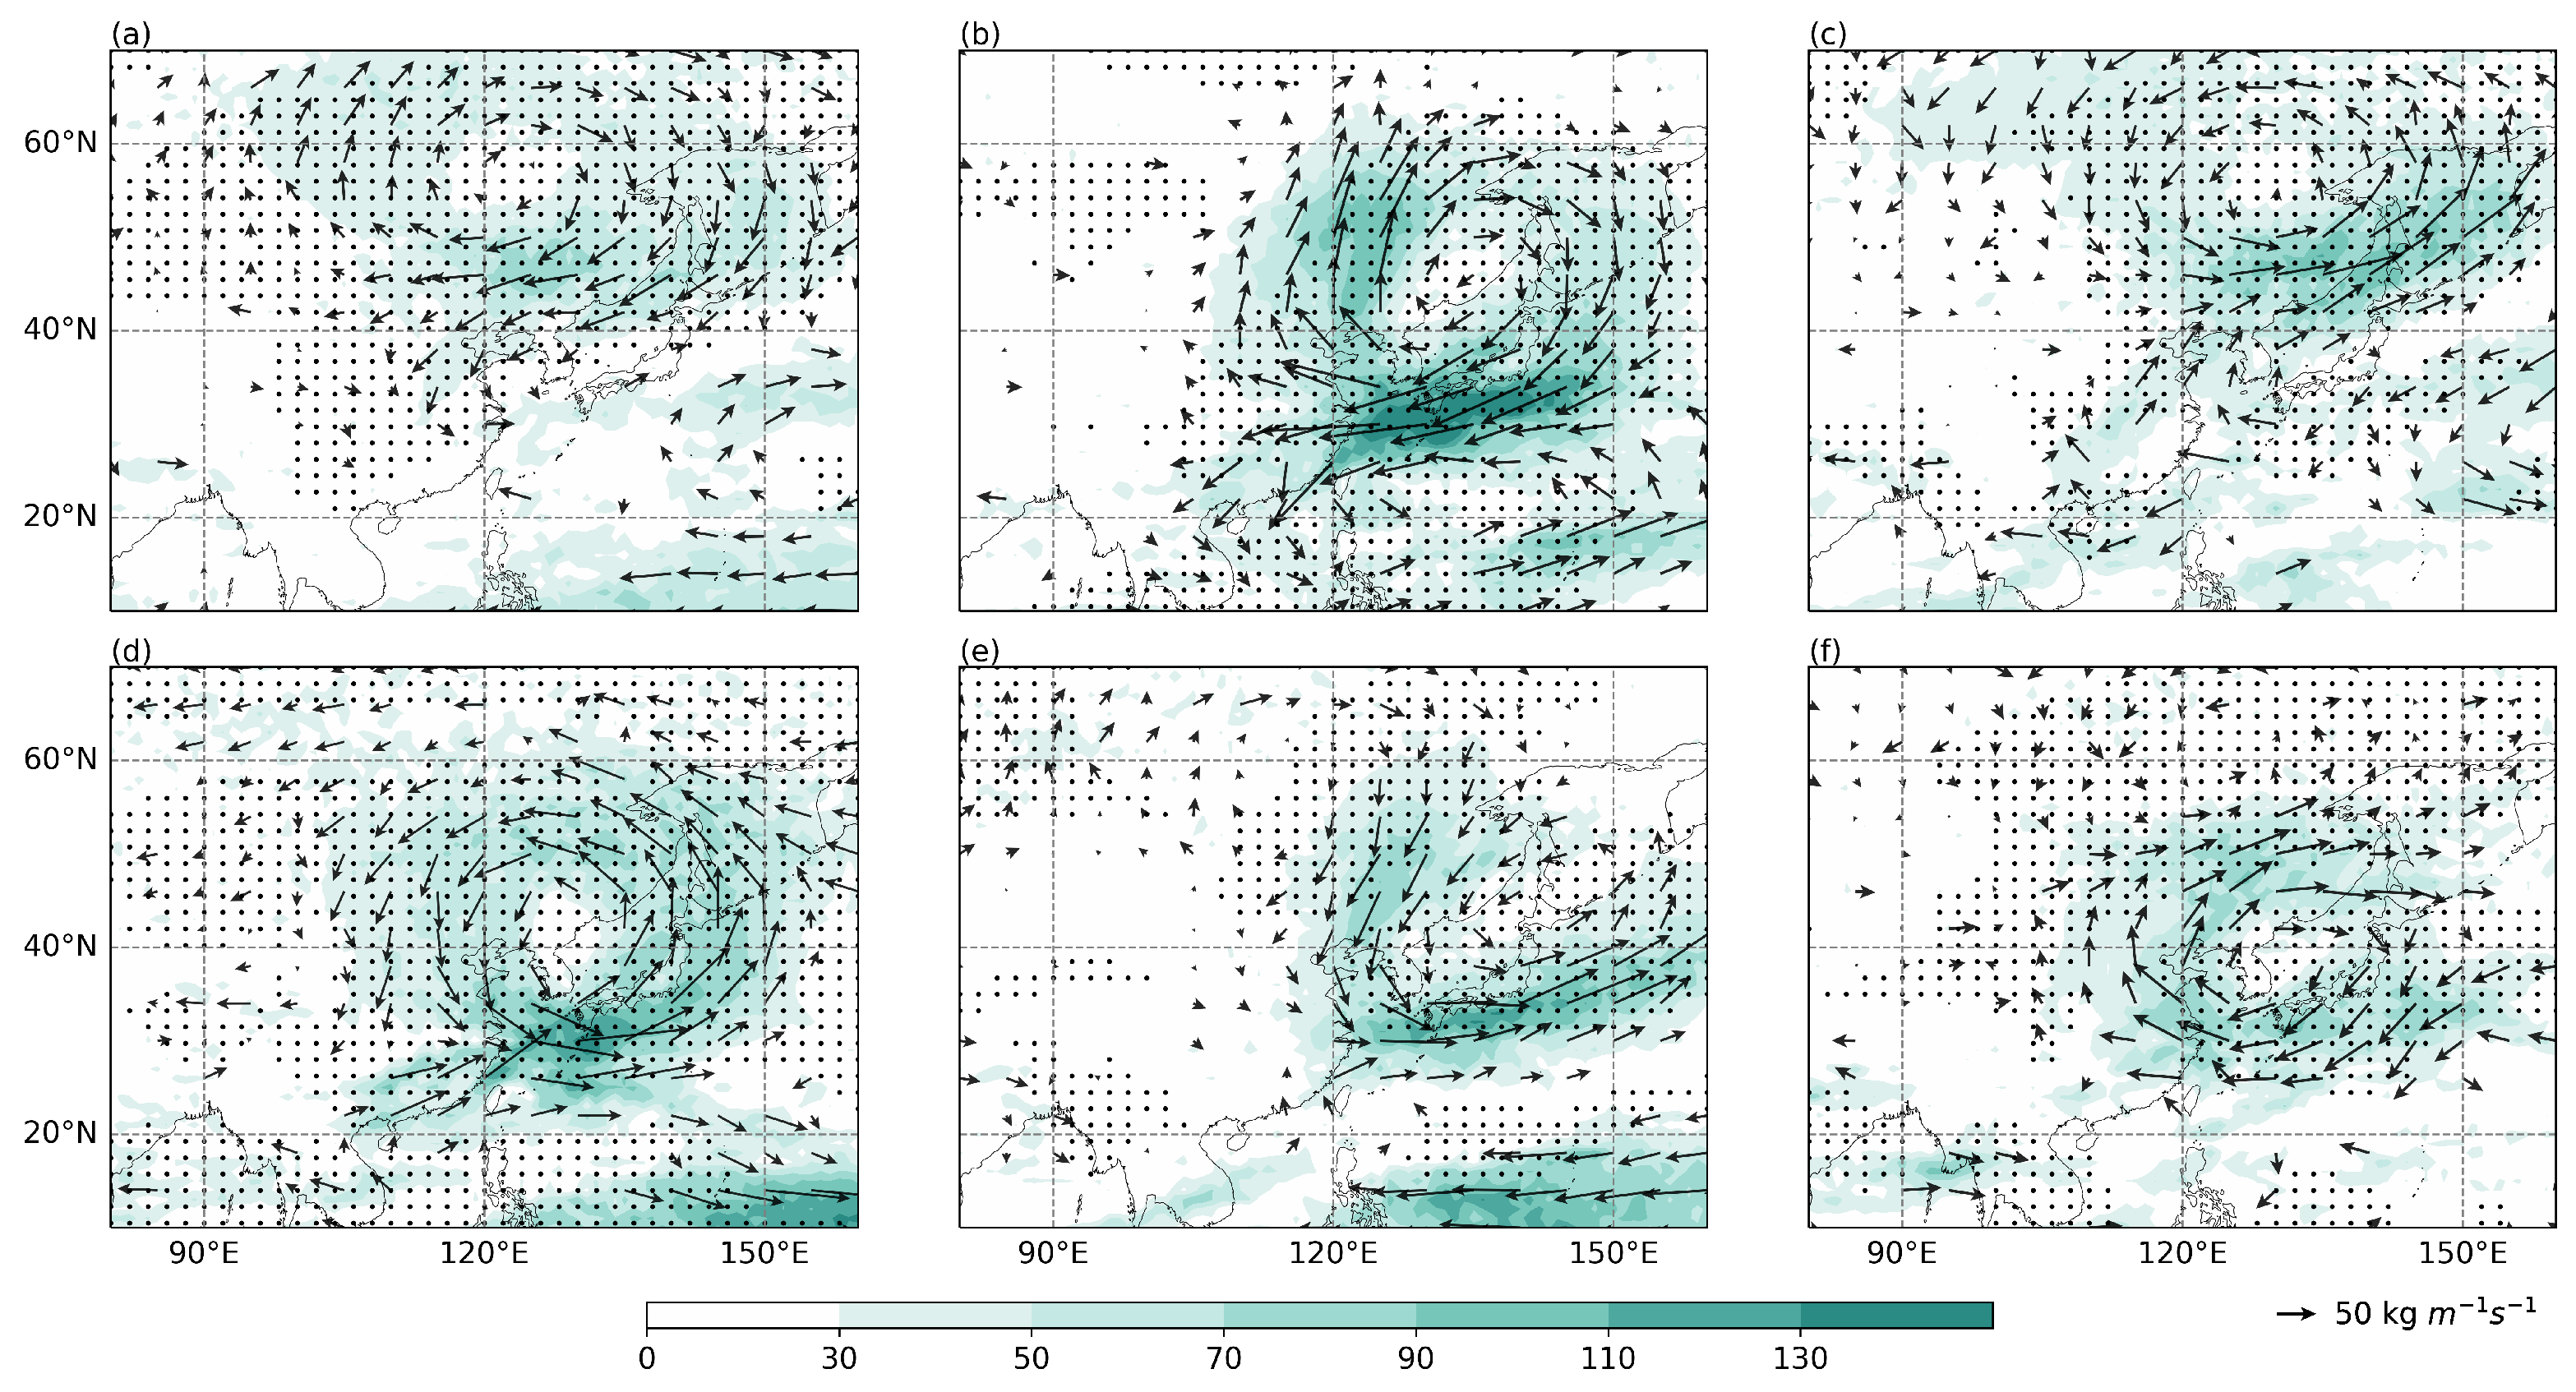
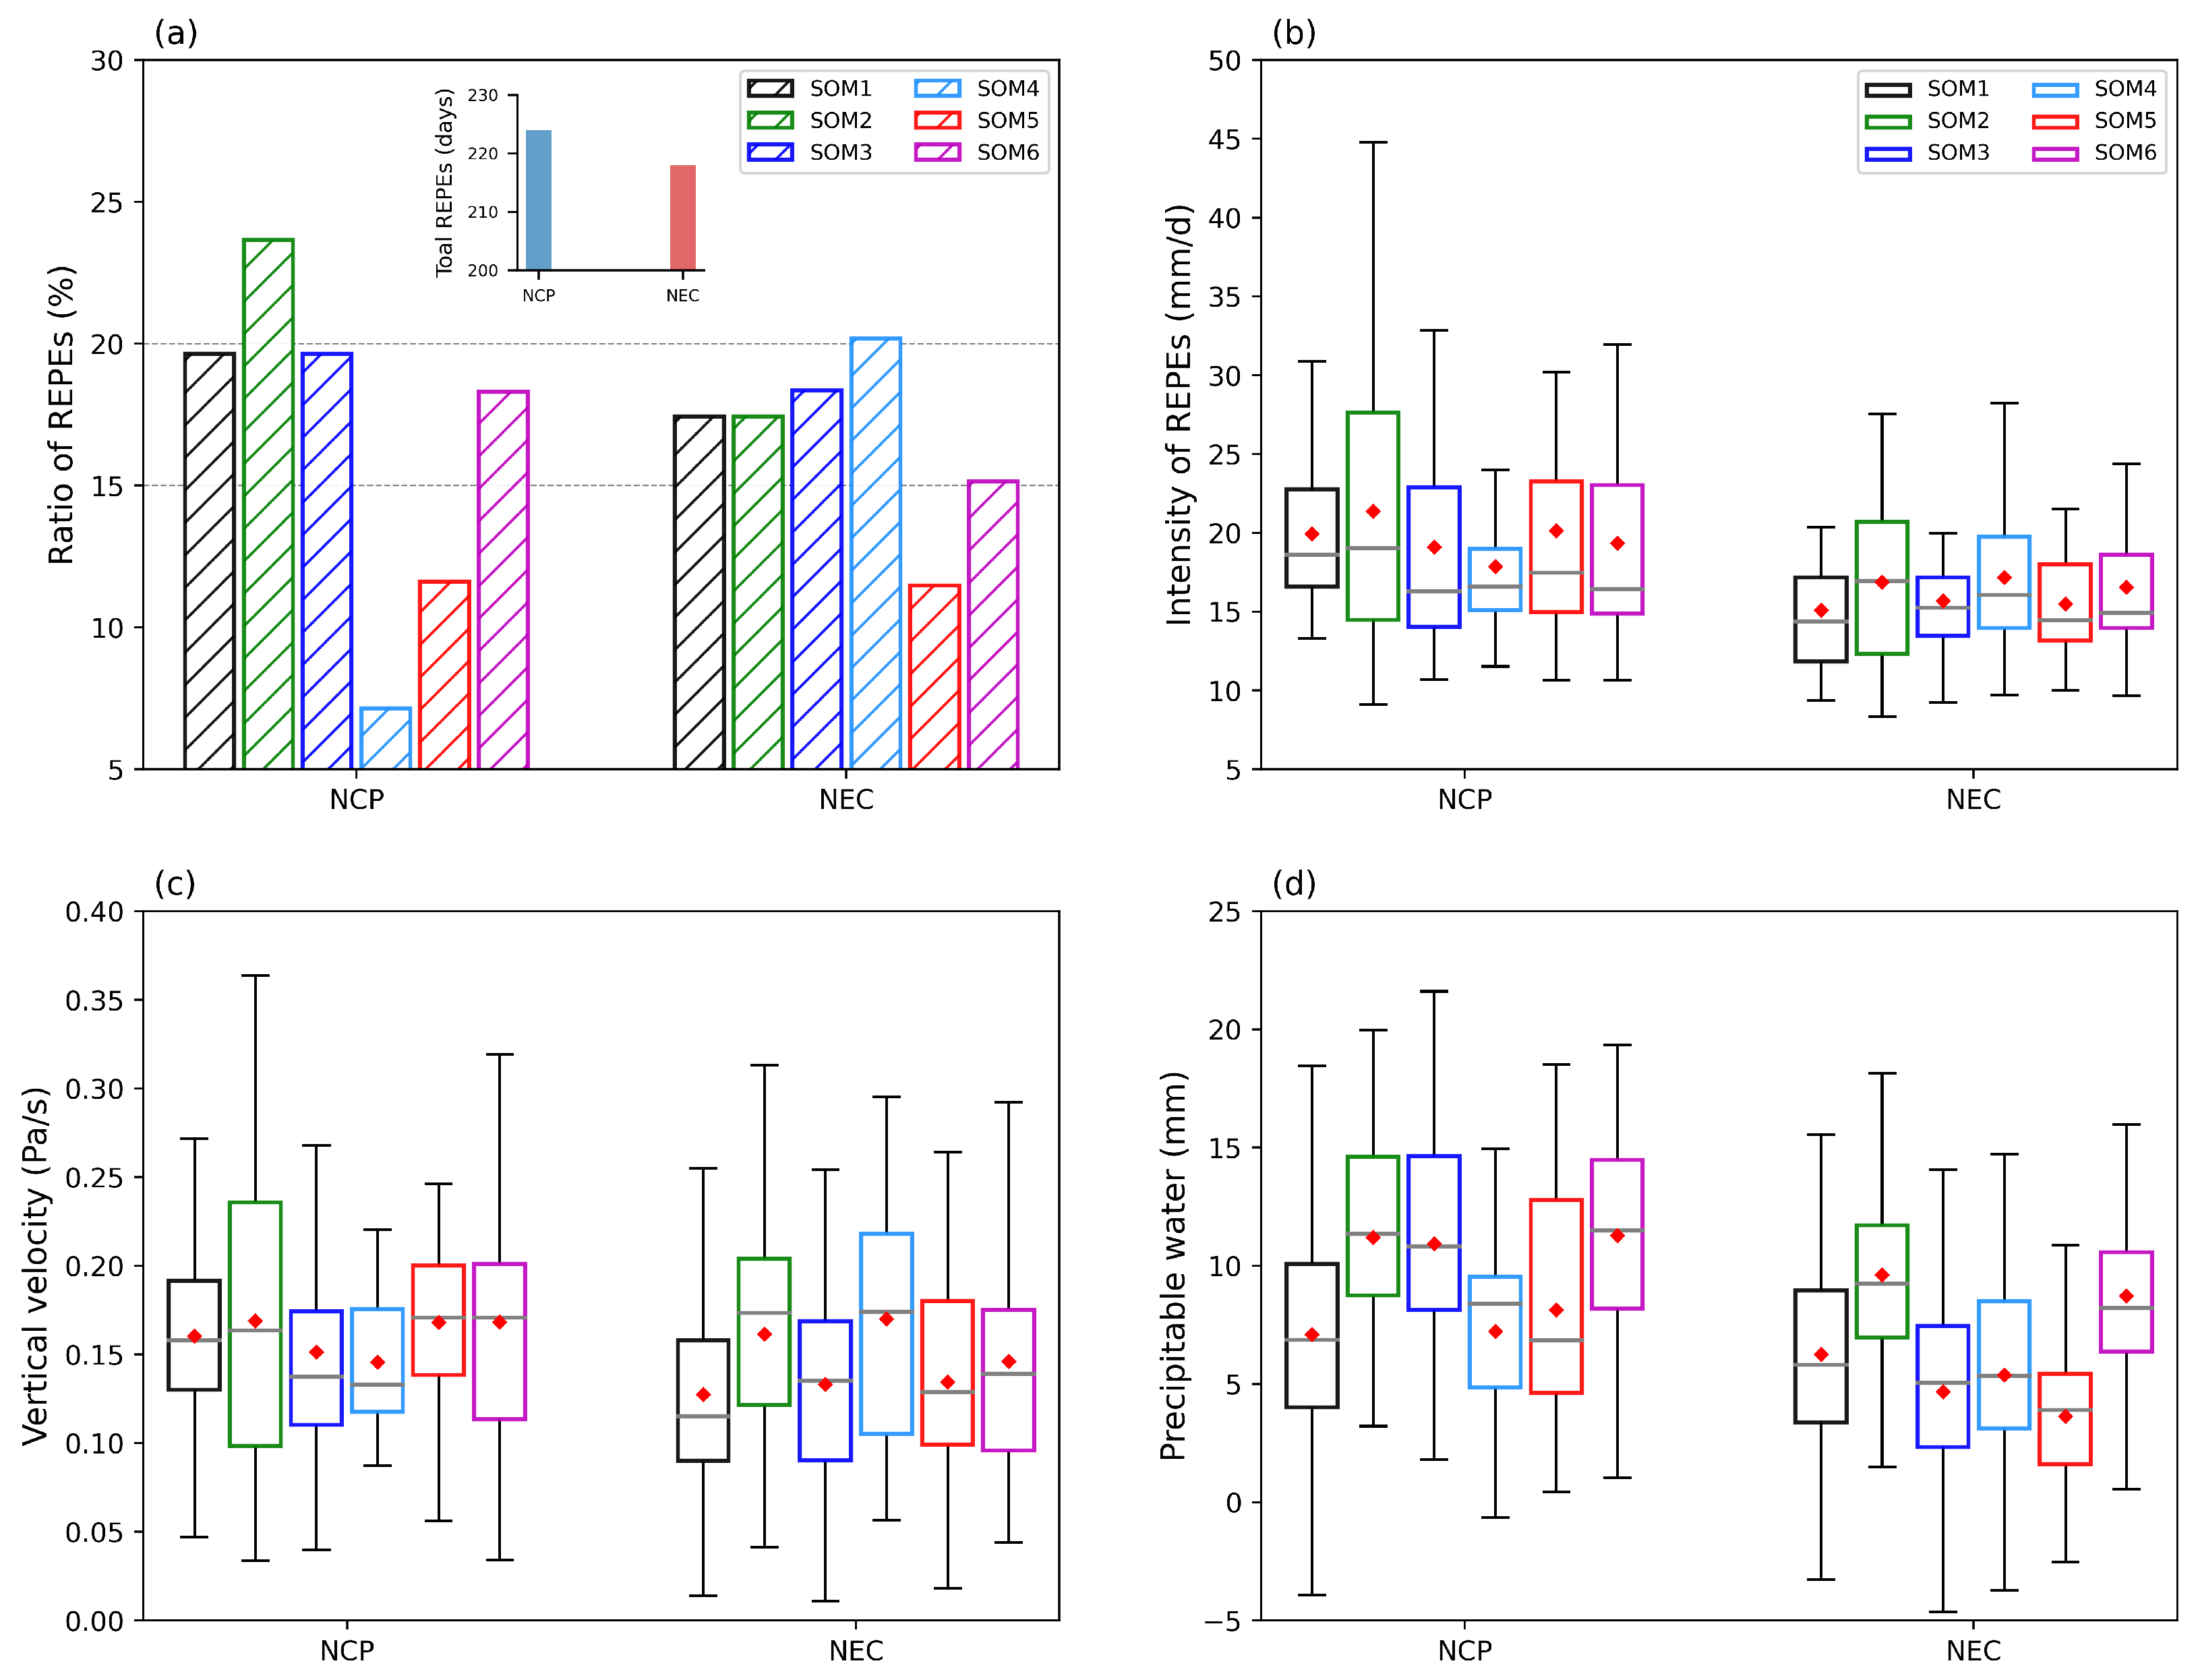
3.2. Synoptic Circulation Patterns and Extreme Precipitation
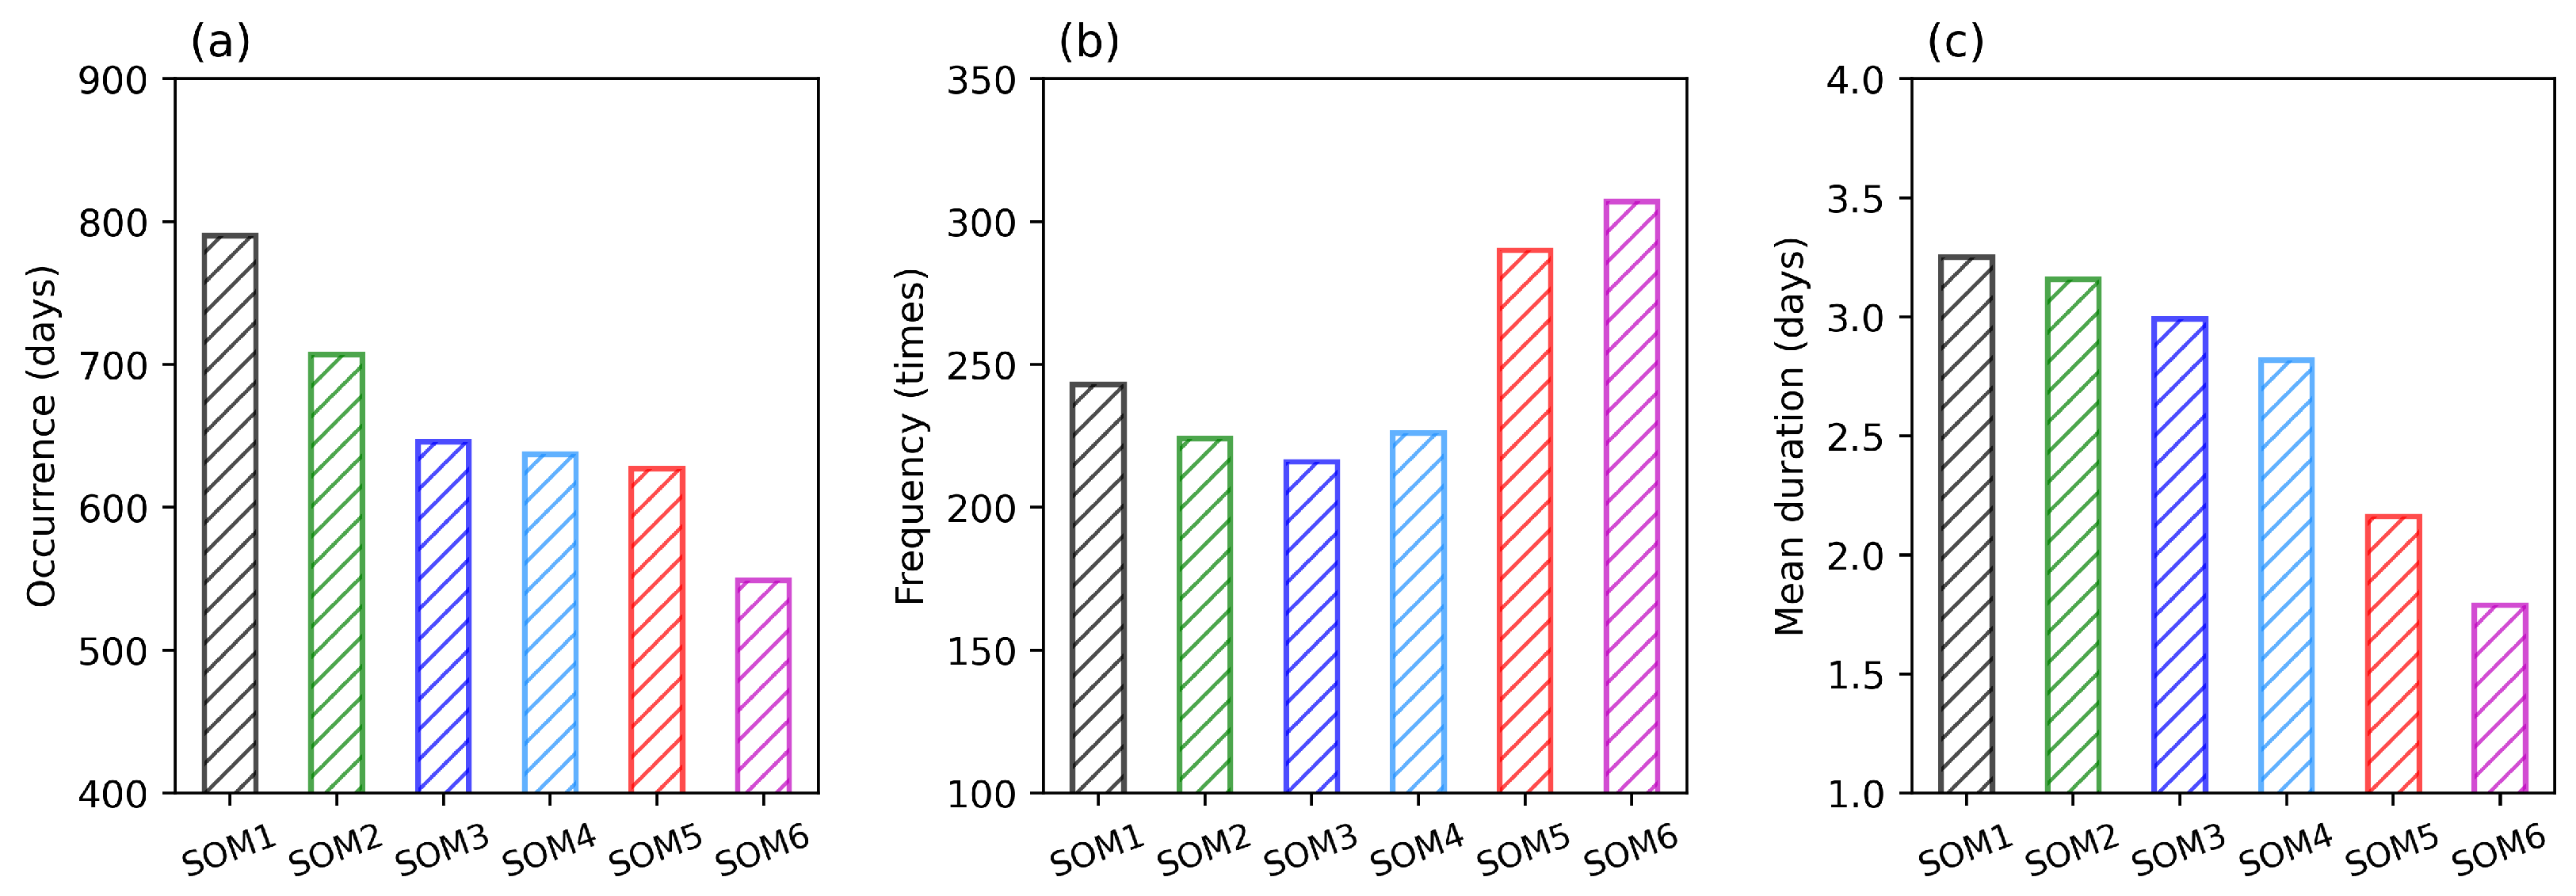
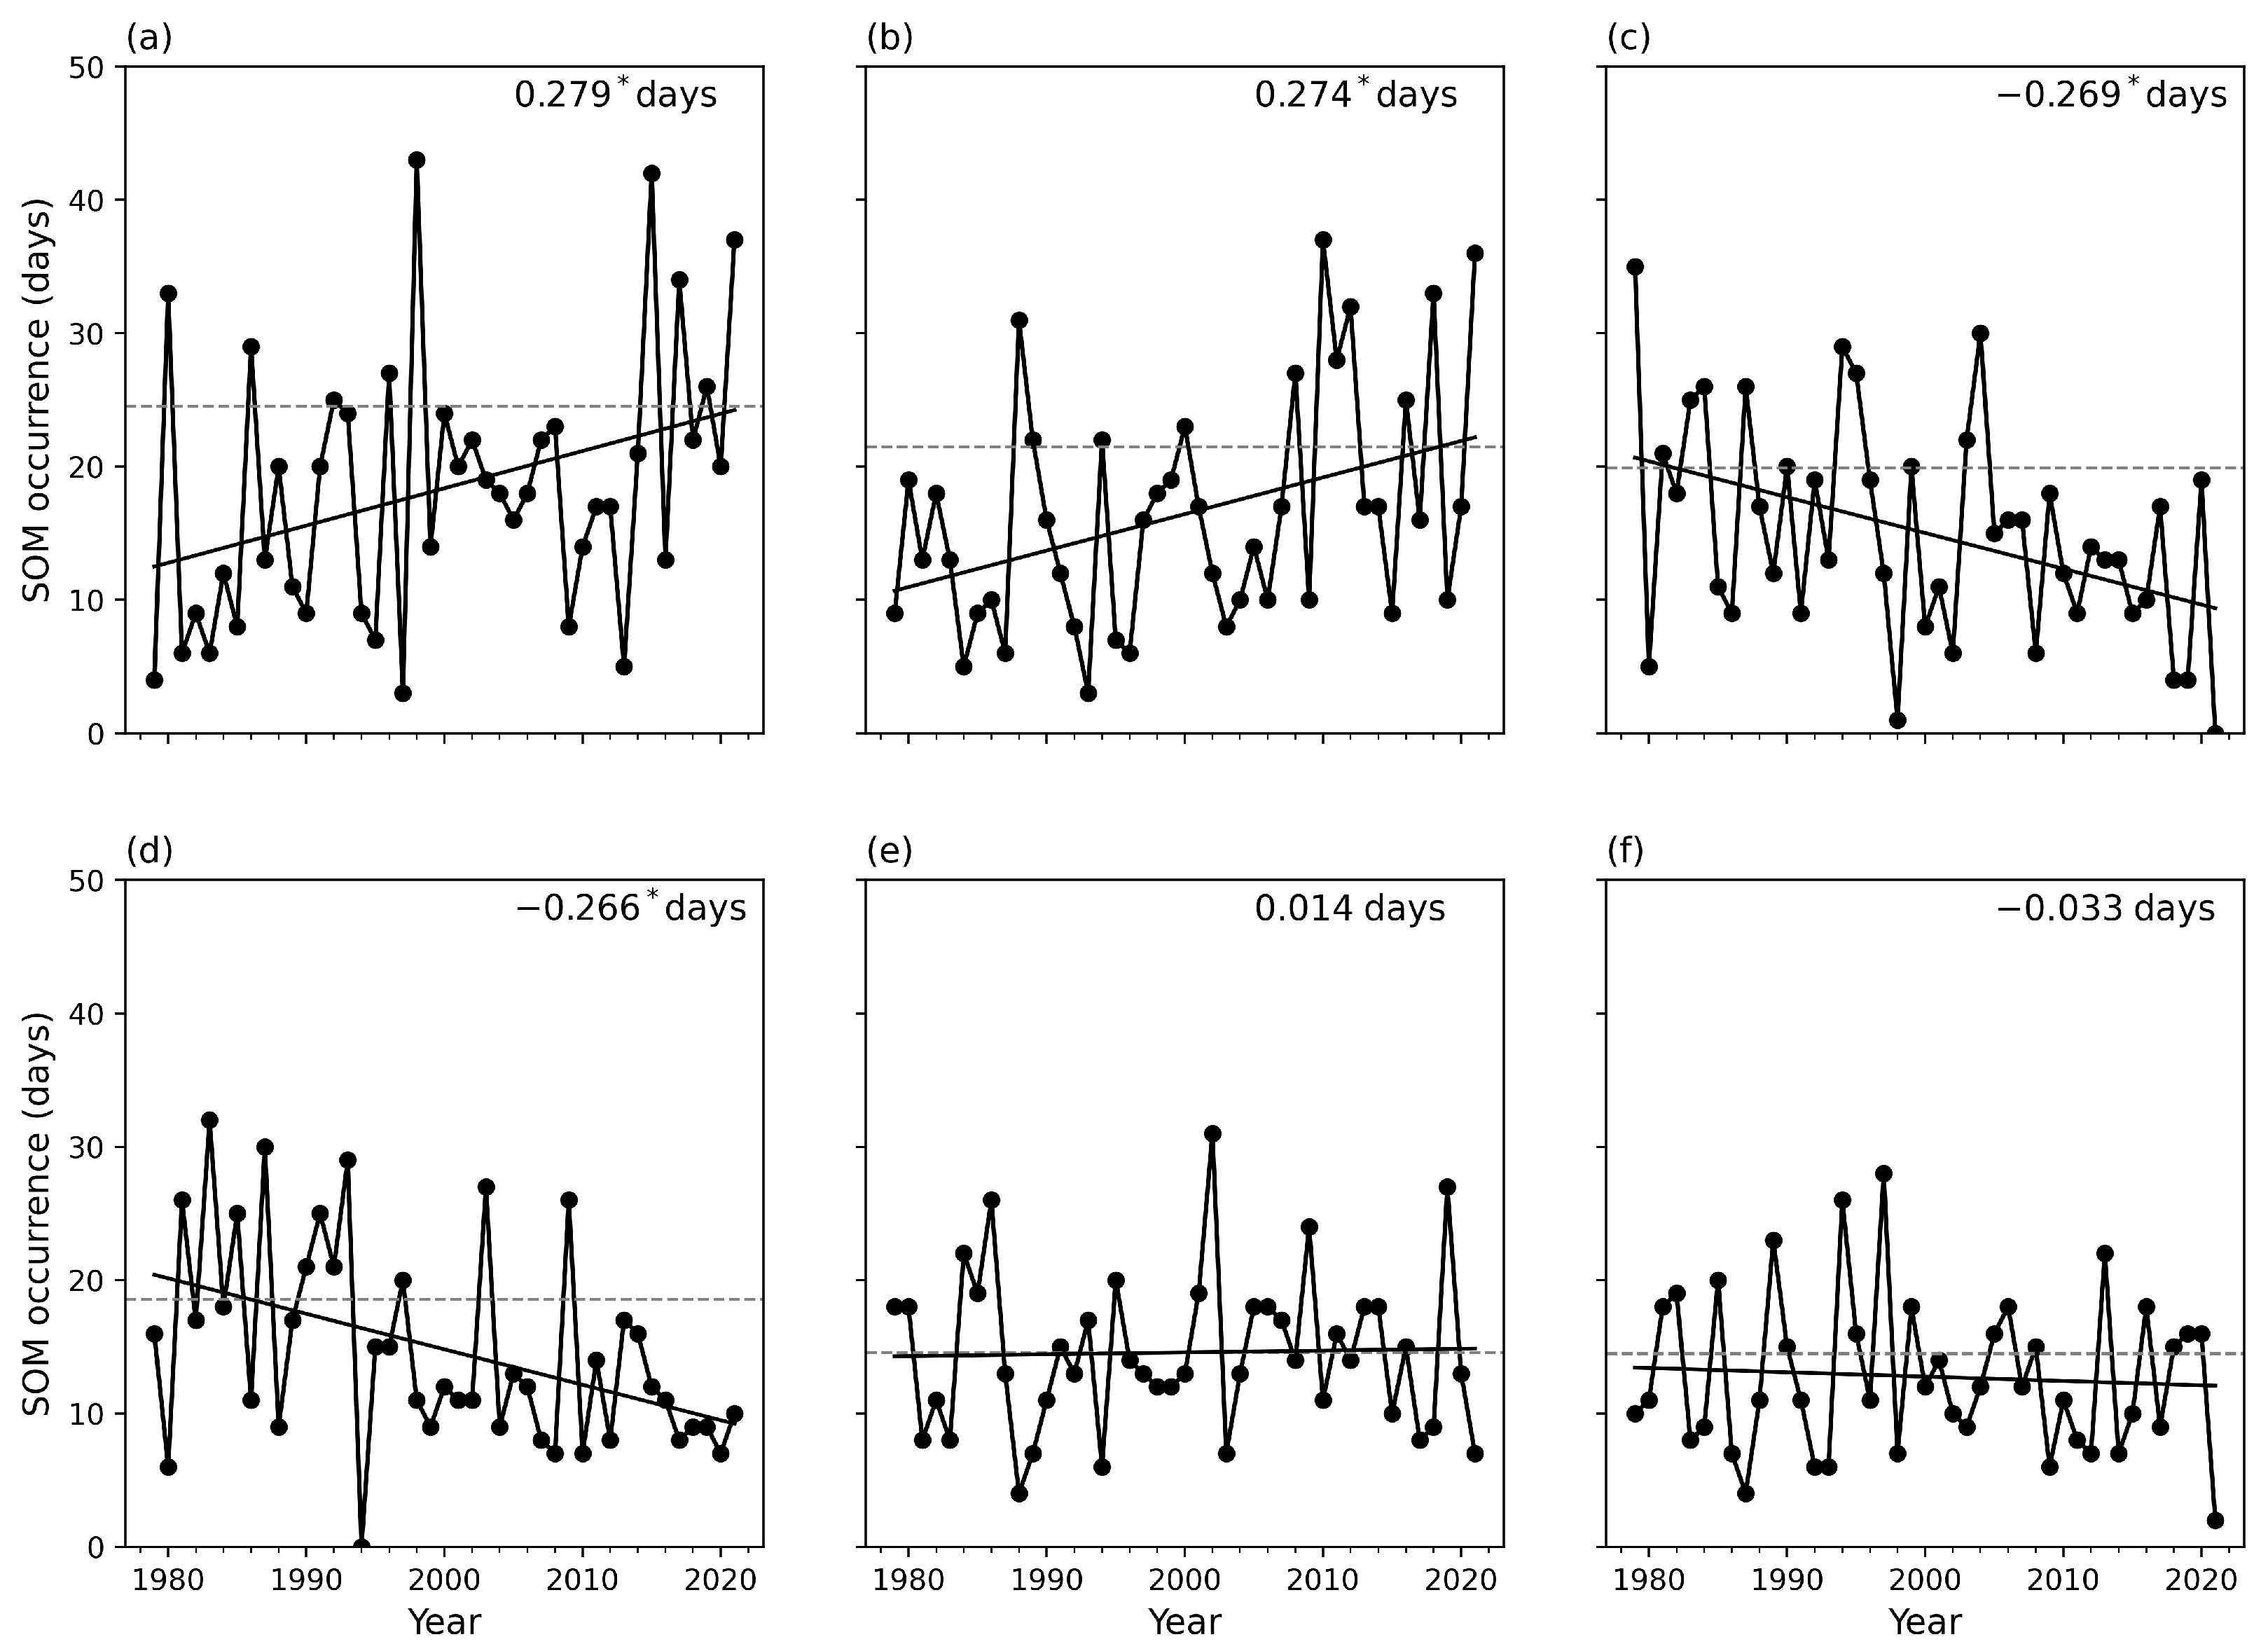
3.3. Interannual Variability of Synoptic Circulation Patterns
4. Conclusions and Discussion
Supplementary Materials
Author Contributions
Funding
Institutional Review Board Statement
Informed Consent Statement
Data Availability Statement
Acknowledgments
Conflicts of Interest
References
- Ding, Y.; Wang, Z.; Sun, Y. Inter-decadal variation of the summer precipitation in East China and its association with decreasing Asian summer monsoon. Part I: Observed evidences. Int. J. Climatol. 2008, 28, 1139–1161. [Google Scholar] [CrossRef]
- Peng, Y.; Shen, C.; Wang, W.C.; Xu, Y. Response of summer precipitation over Eastern China to large volcanic eruptions. J. Clim. 2010, 23, 818–824. [Google Scholar] [CrossRef]
- Li, S.; Su, T.; Yan, P.; Yang, Z.; Feng, G. The role of SST forcing in the interdecadal variations of the Pacific-Japan pattern in the late 1990s. Int. J. Climatol. 2023, 43, 1514–1528. [Google Scholar] [CrossRef]
- Li, M.; Jiang, Z.; Zhou, P.; Le Treut, H.; Li, L. Projection and possible causes of summer precipitation in eastern China using self-organizing map. Clim. Dyn. 2020, 54, 2815–2830. [Google Scholar] [CrossRef]
- Ning, G.; Luo, M.; Zhang, Q.; Wang, S.; Liu, Z.; Yang, Y.; Wu, S.; Zeng, Z. Understanding the mechanisms of summer extreme precipitation events in Xinjiang of arid Northwest China. J. Geophys. Res. Atmos. 2021, 126, e2020JD034111. [Google Scholar] [CrossRef]
- Chen, Z.; Zhang, J. The characteristics of late summer extreme precipitation in northern China and associated large-scale circulations. Int. J. Climatol. 2020, 40, 5170–5187. [Google Scholar] [CrossRef]
- Zhou, X.; Cao, J.; Chen, H.; Sun, J.; Zhao, W.; Qiu, X.; Zhang, L.; Jing, H. Comparative analysis of synoptic characteristics and causes of regional persistent extreme precipitation events over North China Plain between the year of 2021 and historical years. Atmos. Res. 2023, 286, 106697. [Google Scholar] [CrossRef]
- Zhao, Y.; Xu, X.; Li, J.; Zhang, R.; Kang, Y.; Huang, W.; Xia, Y.; Liu, D.; Sun, X. The large-scale circulation patterns responsible for extreme precipitation over the North China plain in midsummer. J. Geophys. Res. Atmos. 2019, 124, 12794–12809. [Google Scholar] [CrossRef]
- Zhao, Y.; Chen, D.; Li, J.; Chen, D.; Chang, Y.; Li, J.; Qin, R. Enhancement of the summer extreme precipitation over North China by interactions between moisture convergence and topographic settings. Clim. Dyn. 2020, 54, 2713–2730. [Google Scholar] [CrossRef]
- Yan, Y.; Miao, Y.; Guo, J.; Liu, S.; Liu, H.; Lou, M.; Liu, L.; Chen, D.; Xue, W.; Zhai, P. Synoptic patterns and sounding-derived parameters associated with summertime heavy rainfall in Beijing. Int. J. Climatol. 2019, 39, 1476–1489. [Google Scholar] [CrossRef]
- Fang, Y.; Chen, H.; Lin, Y.; Zhao, C.; Lin, Y.; Zhou, F. Classification of Northeast China cold vortex activity paths in early summer based on k-means clustering and their climate impact. Adv. Atmos. Sci. 2021, 38, 400–412. [Google Scholar] [CrossRef]
- Cao, F.; Gao, T.; Dan, L.; Ma, Z.; Yang, X.; Yang, F. Contribution of large-scale circulation anomalies to variability of summer precipitation extremes in northeast China. Atmos. Sci. Lett. 2018, 19, e867. [Google Scholar] [CrossRef]
- Ng, C.P.; Zhang, Q.; Li, W. Changes in hourly extreme precipitation over eastern China from 1970 to 2019 dominated by synoptic-scale precipitation. Geophys. Res. Lett. 2021, 48, e2020GL090620. [Google Scholar] [CrossRef]
- Luo, Y.; Wu, M.; Ren, F.; Li, J.; Wong, W.K. Synoptic situations of extreme hourly precipitation over China. J. Clim. 2016, 29, 8703–8719. [Google Scholar] [CrossRef]
- An, N.; Zuo, Z. Investigating the influence of synoptic circulation patterns on regional dry and moist heat waves in North China. Clim. Dyn. 2021, 57, 1227–1240. [Google Scholar] [CrossRef]
- Ding, Y.; Li, J.; Sun, S.; Cai, Z.; Zhao, S.; Tao, S. The analysis on mesoscale systems producing heavy rainfall in North China. Inst. Atmos. Phys. Chin. Acad. Sci. 1980, 9, 1–13. [Google Scholar]
- Zhao, Y.; Zhang, Q.; Du, Y.; Jiang, M.; Zhang, J. Objective analysis of circulation extremes during the 21 July 2012 torrential rain in Beijing. Acta Meteorol. Sin. 2013, 27, 626–635. [Google Scholar] [CrossRef]
- Zhang, S.; Chen, Y.; Luo, Y.; Liu, B.; Ren, G.; Zhou, T.; Martinez-Villalobos, C.; Chang, M. Revealing the circulation pattern most conducive to precipitation extremes in Henan Province of North China. Geophys. Res. Lett. 2022, 49, e2022GL098034. [Google Scholar] [CrossRef]
- Tang, Y.; Huang, A.; Wu, P.; Huang, D.; Xue, D.; Wu, Y. Drivers of summer extreme precipitation events over East China. Geophys. Res. Lett. 2021, 48, e2021GL093670. [Google Scholar] [CrossRef]
- Sun, L.; Zheng, X.; Wang, Q. The climatological characteristics of northeast cold vortex in China. Quart. J. Appl. Meteor 1994, 5, 297–303. [Google Scholar]
- Xie, Z.; Bueh, C. Different types of cold vortex circulations over Northeast China and their weather impacts. Mon. Weather. Rev. 2015, 143, 845–863. [Google Scholar] [CrossRef]
- Ai, Y.; Qian, W. Anomaly-based synoptic analysis on the Heavy Rain Event of July 2018 in Japan. Nat. Hazards 2020, 101, 651–668. [Google Scholar] [CrossRef]
- Cipolla, G.; Francipane, A.; Noto, L.V. Classification of extreme rainfall for a Mediterranean region by means of atmospheric circulation patterns and reanalysis data. Water Resour. Manag. 2020, 34, 3219–3235. [Google Scholar] [CrossRef]
- Chen, H.; Sun, J.; Chen, X.; Zhou, W. CGCM projections of heavy rainfall events in China. Int. J. Climatol. 2012, 32, 441–450. [Google Scholar] [CrossRef]
- Zhang, X.; He, J.; Zhang, J.; Polyakov, I.; Gerdes, R.; Inoue, J.; Wu, P. Enhanced poleward moisture transport and amplified northern high-latitude wetting trend. Nat. Clim. Chang. 2013, 3, 47–51. [Google Scholar] [CrossRef]
- Yin, J.; Gu, H.; Liang, X.; Miao, Y.; Sun, J.; Xie, Y.; Li, F.; Wu, C. A possible dynamic mechanism for rapid production of the extreme hourly rainfall in Zhengzhou City on 20 July 2021. J. Meteorol. Res. 2022, 36, 6–25. [Google Scholar] [CrossRef]
- Agel, L.; Barlow, M.; Feldstein, S.B.; Gutowski, W.J. Identification of large-scale meteorological patterns associated with extreme precipitation in the US northeast. Clim. Dyn. 2018, 50, 1819–1839. [Google Scholar] [CrossRef]
- Guo, J.; Yan, Y.; Chen, D.; Lv, Y.; Han, Y.; Guo, X.; Liu, L.; Miao, Y.; Chen, T.; Nie, J.; et al. The response of warm-season precipitation extremes in China to global warming: An observational perspective from radiosonde measurements. Clim. Dyn. 2020, 54, 3977–3989. [Google Scholar] [CrossRef]
- Nie, J.; Sobel, A.H.; Shaevitz, D.A.; Wang, S. Dynamic amplification of extreme precipitation sensitivity. Proc. Natl. Acad. Sci. USA 2018, 115, 9467–9472. [Google Scholar] [CrossRef]
- Kunkel, K.E.; Stevens, S.E.; Stevens, L.E.; Karl, T.R. Observed climatological relationships of extreme daily precipitation events with precipitable water and vertical velocity in the contiguous United States. Geophys. Res. Lett. 2020, 47, e2019GL086721. [Google Scholar] [CrossRef]
- Barnston, A.G.; Livezey, R.E. Classification, seasonality and persistence of low-frequency atmospheric circulation patterns. Mon. Weather. Rev. 1987, 115, 1083–1126. [Google Scholar] [CrossRef]
- Li, C.; Li, T.; Liang, J.; Gu, D.; Lin, A.; Zheng, B. Interdecadal variations of meridional winds in the South China Sea and their relationship with summer climate in China. J. Clim. 2010, 23, 825–841. [Google Scholar] [CrossRef]
- Wang, J.; Wen, Z.; Wu, R.; Guo, Y.; Chen, Z. The mechanism of growth of the low-frequency East Asia–Pacific teleconnection and the triggering role of tropical intraseasonal oscillation. Clim. Dyn. 2016, 46, 3965–3977. [Google Scholar] [CrossRef]
- Ku, H.Y.; Noh, N.; Jeong, J.H.; Koo, J.H.; Choi, W.; Kim, B.M.; Lee, D.; Ban, S.J. Classification of large-scale circulation patterns and their spatio-temporal variability during High-PM10 events over the Korean Peninsula. Atmos. Environ. 2021, 262, 118632. [Google Scholar] [CrossRef]
- Horton, D.E.; Johnson, N.C.; Singh, D.; Swain, D.L.; Rajaratnam, B.; Diffenbaugh, N.S. Contribution of changes in atmospheric circulation patterns to extreme temperature trends. Nature 2015, 522, 465–469. [Google Scholar] [CrossRef] [PubMed]
- Gibson, P.B.; Uotila, P.; Perkins-Kirkpatrick, S.E.; Alexander, L.V.; Pitman, A.J. Evaluating synoptic systems in the CMIP5 climate models over the Australian region. Clim. Dyn. 2016, 47, 2235–2251. [Google Scholar] [CrossRef]
- Kohonen, T. Self-organized formation of topologically correct feature maps. Biol. Cybern. 1982, 43, 59–69. [Google Scholar] [CrossRef]
- Liu, Y.; Weisberg, R.H.; Mooers, C.N. Performance evaluation of the self-organizing map for feature extraction. J. Geophys. Res. Ocean 2006, 111. [Google Scholar] [CrossRef]
- Gao, M.; Yang, Y.; Shi, H.; Gao, Z. SOM-based synoptic analysis of atmospheric circulation patterns and temperature anomalies in China. Atmos. Res. 2019, 220, 46–56. [Google Scholar] [CrossRef]
- Polo, I.; Ullmann, A.; Roucou, P.; Fontaine, B. Weather regimes in the Euro-Atlantic and Mediterranean sector, and relationship with West African rainfall over the 1989–2008 period from a self-organizing maps approach. J. Clim. 2011, 24, 3423–3432. [Google Scholar] [CrossRef]
- Swales, D.; Alexander, M.; Hughes, M. Examining moisture pathways and extreme precipitation in the US Intermountain West using self-organizing maps. Geophys. Res. Lett. 2016, 43, 1727–1735. [Google Scholar] [CrossRef]
- Hersbach, H.; Bell, B.; Berrisford, P.; Hirahara, S.; Horányi, A.; Muñoz-Sabater, J.; Nicolas, J.; Peubey, C.; Radu, R.; Schepers, D.; et al. The ERA5 global reanalysis. Q. J. R. Meteorol. Soc. 2020, 146, 1999–2049. [Google Scholar] [CrossRef]
- Wu, J.; Gao, X.J. A gridded daily observation dataset over China region and comparison with the other datasets. Chin. J. Geophys. 2013, 56, 1102–1111. [Google Scholar]
- Xie, P.; Arkin, P.A. Global precipitation: A 17-year monthly analysis based on gauge observations, satellite estimates, and numerical model outputs. Bull. Am. Meteorol. Soc. 1997, 78, 2539–2558. [Google Scholar] [CrossRef]
- Li, S.; Hou, W.; Feng, G. Atmospheric circulation patterns over East Asia and their connection with summer precipitation and surface air temperature in Eastern China during 1961–2013. J. Meteorol. Res. 2018, 32, 203–218. [Google Scholar] [CrossRef]
- Screen, J.A.; Simmonds, I. Amplified mid-latitude planetary waves favour particular regional weather extremes. Nat. Clim. Chang. 2014, 4, 704–709. [Google Scholar] [CrossRef]
- Swain, D.L.; Horton, D.E.; Singh, D.; Diffenbaugh, N.S. Trends in atmospheric patterns conducive to seasonal precipitation and temperature extremes in California. Sci. Adv. 2016, 2, e1501344. [Google Scholar] [CrossRef]
- Li, S.; Feng, G.; Hou, W.; Cheng, J. Characteristics of atmospheric circulation patterns over East Asia and their impacts on precipitation in summer. Clim. Res. 2019, 78, 117–133. [Google Scholar] [CrossRef]
- Chattopadhyay, A.; Hassanzadeh, P.; Pasha, S. Predicting clustered weather patterns: A test case for applications of convolutional neural networks to spatio-temporal climate data. Sci. Rep. 2020, 10, 1317. [Google Scholar] [CrossRef]
- Cassano, J.J.; Uotila, P.; Lynch, A.H.; Cassano, E.N. Predicted changes in synoptic forcing of net precipitation in large Arctic river basins during the 21st century. J. Geophys. Res. Biogeosci. 2007, 112. [Google Scholar] [CrossRef]
- Johnson, N.C.; Feldstein, S.B.; Tremblay, B. The continuum of Northern Hemisphere teleconnection patterns and a description of the NAO shift with the use of self-organizing maps. J. Clim. 2008, 21, 6354–6371. [Google Scholar] [CrossRef]
- Schär, C.; Ban, N.; Fischer, E.M.; Rajczak, J.; Schmidli, J.; Frei, C.; Giorgi, F.; Karl, T.R.; Kendon, E.J.; Tank, A.M.K.; et al. Percentile indices for assessing changes in heavy precipitation events. Clim. Chang. 2016, 137, 201–216. [Google Scholar] [CrossRef]
- Xie, Z.; Du, Y.; Zeng, Y.; Miao, Q. Classification of yearly extreme precipitation events and associated flood risk in the Yangtze-Huaihe River Valley. Sci. China Earth Sci. 2018, 61, 1341–1356. [Google Scholar] [CrossRef]
- Dong, W.; Lin, Y.; Wright, J.S.; Xie, Y.; Yin, X.; Guo, J. Precipitable water and CAPE dependence of rainfall intensities in China. Clim. Dyn. 2019, 52, 3357–3368. [Google Scholar] [CrossRef]
- Han, T.; Chen, H.; Wang, H. Recent changes in summer precipitation in Northeast China and the background circulation. Int. J. Climatol. 2015, 35, 4210–4219. [Google Scholar] [CrossRef]
- Hu, P.; Wang, M.; Yang, L.; Wang, X.; Feng, G. Water vapor transport related to the interdecadal shift of summer precipitation over northern East Asia in the late 1990s. J. Meteorol. Res. 2018, 32, 781–793. [Google Scholar] [CrossRef]
- Gibson, P.B.; Perkins-Kirkpatrick, S.E.; Uotila, P.; Pepler, A.S.; Alexander, L.V. On the use of self-organizing maps for studying climate extremes. J. Geophys. Res. Atmos. 2017, 122, 3891–3903. [Google Scholar] [CrossRef]
- Shen, X.; Liu, B.; Li, G.; Wu, Z.; Jin, Y.; Yu, P.; Zhou, D. Spatiotemporal change of diurnal temperature range and its relationship with sunshine duration and precipitation in China. J. Geophys. Res. Atmos. 2014, 119, 13–163. [Google Scholar] [CrossRef]
- Shen, X.; Liu, B.; Lu, X. Weak cooling of cold extremes versus continued warming of hot extremes in China during the recent global surface warming hiatus. J. Geophys. Res. Atmos. 2018, 123, 4073–4087. [Google Scholar] [CrossRef]
- Ohba, M.; Kadokura, S.; Yoshida, Y.; Nohara, D.; Toyoda, Y. Anomalous weather patterns in relation to heavy precipitation events in Japan during the Baiu season. J. Hydrometeorol. 2015, 16, 688–701. [Google Scholar] [CrossRef]
- Gong, H.; Wang, L.; Chen, W.; Chen, X.; Nath, D. Biases of the wintertime Arctic Oscillation in CMIP5 models. Environ. Res. Lett. 2016, 12, 014001. [Google Scholar] [CrossRef]
Disclaimer/Publisher’s Note: The statements, opinions and data contained in all publications are solely those of the individual author(s) and contributor(s) and not of MDPI and/or the editor(s). MDPI and/or the editor(s) disclaim responsibility for any injury to people or property resulting from any ideas, methods, instructions or products referred to in the content. |
© 2023 by the authors. Licensee MDPI, Basel, Switzerland. This article is an open access article distributed under the terms and conditions of the Creative Commons Attribution (CC BY) license (https://creativecommons.org/licenses/by/4.0/).
Share and Cite
Li, S.; Feng, G.; Yan, P.; Su, T. Relationship between Summer Synoptic Circulation Patterns and Extreme Precipitation in Northern China. Atmosphere 2023, 14, 1705. https://doi.org/10.3390/atmos14121705
Li S, Feng G, Yan P, Su T. Relationship between Summer Synoptic Circulation Patterns and Extreme Precipitation in Northern China. Atmosphere. 2023; 14(12):1705. https://doi.org/10.3390/atmos14121705
Chicago/Turabian StyleLi, Shuping, Guolin Feng, Pengcheng Yan, and Tao Su. 2023. "Relationship between Summer Synoptic Circulation Patterns and Extreme Precipitation in Northern China" Atmosphere 14, no. 12: 1705. https://doi.org/10.3390/atmos14121705
APA StyleLi, S., Feng, G., Yan, P., & Su, T. (2023). Relationship between Summer Synoptic Circulation Patterns and Extreme Precipitation in Northern China. Atmosphere, 14(12), 1705. https://doi.org/10.3390/atmos14121705