Article

Assessment of the Temporal and Seasonal Variabilities in Air Pollution and Implications for Physical Activity in Lagos and Yaoundé

1
Yusuf Hamied Department of Chemistry, University of Cambridge, Cambridge CB2 1EW, UK
2
Air Quality Monitoring Research Group, Department of Chemistry, University of Lagos, Lagos 101017, Nigeria
3
Health of Populations in Transition Research Group, The University of Yaoundé I, Yaoundé P.O. Box 337, Cameroon
4
Centre for Housing and Sustainable Development, University of Lagos, Lagos 101017, Nigeria
5
National Center for Education, Ministry of Scientific Research and Innovation, Yaoundé P.O. Box 6331, Cameroon
6
Faculty of Medicine and Pharmacological Sciences, University of Dschang, Dschang P.O. Box 96, Cameroon
7
Medical Research Council Epidemiology Unit, University of Cambridge, Cambridge CB2 0SL, UK
*
Author to whom correspondence should be addressed.
Atmosphere 2023, 14(11), 1693; https://doi.org/10.3390/atmos14111693
Submission received: 12 September 2023 / Revised: 13 November 2023 / Accepted: 14 November 2023 / Published: 17 November 2023

Abstract

:
Physical activity (PA) can reduce the risk of non-communicable diseases like heart diseases and diabetes. However, exposure to poor air quality (AQ) when engaging in PA could negate the health benefits. The risk associated with air pollution is relatively severe during physical activities because a higher inhaled pollution dose is experienced during PA compared to when sedentary. We conducted a yearlong AQ monitoring using a commercial low-cost AQ device. The devices were deployed near a public space used for PA as part of a study to understand the health risks encountered by people informally appropriating public spaces for PA in Lagos, Nigeria and Yaoundé, Cameroon. The parameters monitored included CO, NO, NO2, O3, PM2.5, PM10, CO2, pressure, temperature and relative humidity. We detected unique pollutant temporal profiles at the two locations, with a distinct weekday-to-weekend effect observed for the gaseous pollutants but not for the PM. Transboundary emissions related to the Harmattan haze dominated the background PM concentration in both cities in the dry season. Our findings underscore the importance of long-term AQ monitoring to inform action and offer insights into simple behavioural changes that can maximise the health benefits of PA while minimising the risk of air pollution exposure.

1. Introduction

Air pollution is a major global environmental challenge, and the vast majority of this air pollution health burden occurs in the Global South which includes Africa, Latin America, and most of Asia, including the Middle East [1]. In Africa, where routine air pollution monitoring is sparse and air quality awareness is poor, many are at the risk of exposure to poor air quality by virtue of occupying public spaces. For example, physical activity is actively encouraged as a healthy behaviour to reduce the risk of non-communicable diseases (NCD) like heart disease and diabetes, the burden of which is rising steeply in many low and middle-income contexts [2]. But for many, embracing this behaviour in the most equitable manner (in a public space) can paradoxically increase disease risk from exposure to other harmful factors such as air pollution, environmental waste, injury, and safety risks in the course of engaging in physical activity in spaces that are not conducive to these behaviours [3]. This is due to the fact that physical activity increases the air pollution intake by increasing the inhaled dose of air pollutants because of the exercise-induced higher minute ventilation, and a higher deposition of the inhaled particles in the lungs.
The World Health Organization (WHO) has proposed a “six-dimensional view of health” that includes physical health (healthy diet and balanced nutrition), psychological health, intellectual health, mental health, social health and environmental health [4]. This holistic concept highlights the importance of physical inactivity and exposure to air pollution as important risk factors for death and disease globally. But poor access to public spaces with safe air quality means that air pollution affects health both directly, by increasing the risk of several diseases, and indirectly, by acting as a barrier to physical activity, a healthy behaviour that improves physical and mental health.
Studies on air pollution-exposure monitoring have shown how locations and activities can explain the variations in exposure [5]. Sources of air pollutants include domestic wood and charcoal burning, industrial combustion, road transport and the use of solvents and industrial processes. The criteria for air quality pollutants include carbon monoxide (CO), nitrogen dioxide (NO2), ozone (O3), sulphur dioxide (SO2), and particulate matter PM1, PM2.5 and PM10. These pollutants greatly impact health as PM can be transported around the body, with greater impacts in vulnerable groups like older persons, pregnant women, children and individuals with underlying conditions (asthma, chronic obstructive pulmonary disease (COPD) [6] and COVID-19 [7]). Air pollution has been reported to lead to stunted growth, reduce lung function, increase the risk of developing asthma, acute lower respiratory infections, behavioural disorders and impaired mental development in children [8]. Other documented health effects include low birth weight, premature birth and infant mortality for pregnant women and their children, childhood cancer, an increased risk of coronary heart disease, non-insulin-dependent diabetes, hypertension and stroke in adulthood [9,10].
Ambient air quality, while dependent on emissions, is also strongly influenced by meteorological conditions, including the atmospheric circulation, weather systems, structures of the atmospheric boundary layer, and the corresponding meteorological parameters [11]. The total amount of pollutants emitted in a particular period of time is usually stable [12,13,14], with observed variabilities in pollutant concentrations due to the impact of meteorology and loss processes which help modulate the concentrations of ambient air pollutants [15]. Seasonal effects such as wet/dry seasons, as well as long-range transport are evident, particularly for PM during the Harmattan haze affecting Sub-Saharan Africa. In addition, the time of the day and days of the week have been reported to play crucial roles in exposure [16].
According to a report by UNICEF [17], despite deaths from indoor air pollution declining in Africa due to cleaner and more efficient cooking methods, mortality from outdoor air pollution is increasing. The report also noted that only 6% of children in Africa live near reliable, ground-level monitoring stations that provide real-time data on the quality of the air they are breathing, compared to about 72% of children across Europe and North America. Increasing reliable, local, ground-level measurements would greatly aid effective responses to this poorly-understood direct and indirect threat to health across the continent. In this study, we sought to investigate air quality in the public spaces used for physical activity, and to understand how air pollution varied daily, weekly and across seasons over a 12-month period. The novelty of this study includes: (1) using evidence-driven data to highlight the risk associated with air pollution when engaging in physical activities in both cities under study, (2) long-term monitoring of air pollution in Yaoundé or any other city in Cameroon for multiple criteria species such as gases and PM including CO2, as previous studies have only covered very short duration (weeks to couple of months) and have mostly focused on PM [18,19].

2. Materials and Methods

This study was conducted as part of a larger study to understand the health risks encountered by people informally appropriating public spaces for physical activity (ALPhA study) in Lagos, Nigeria and Yaoundé, Cameroon [20].

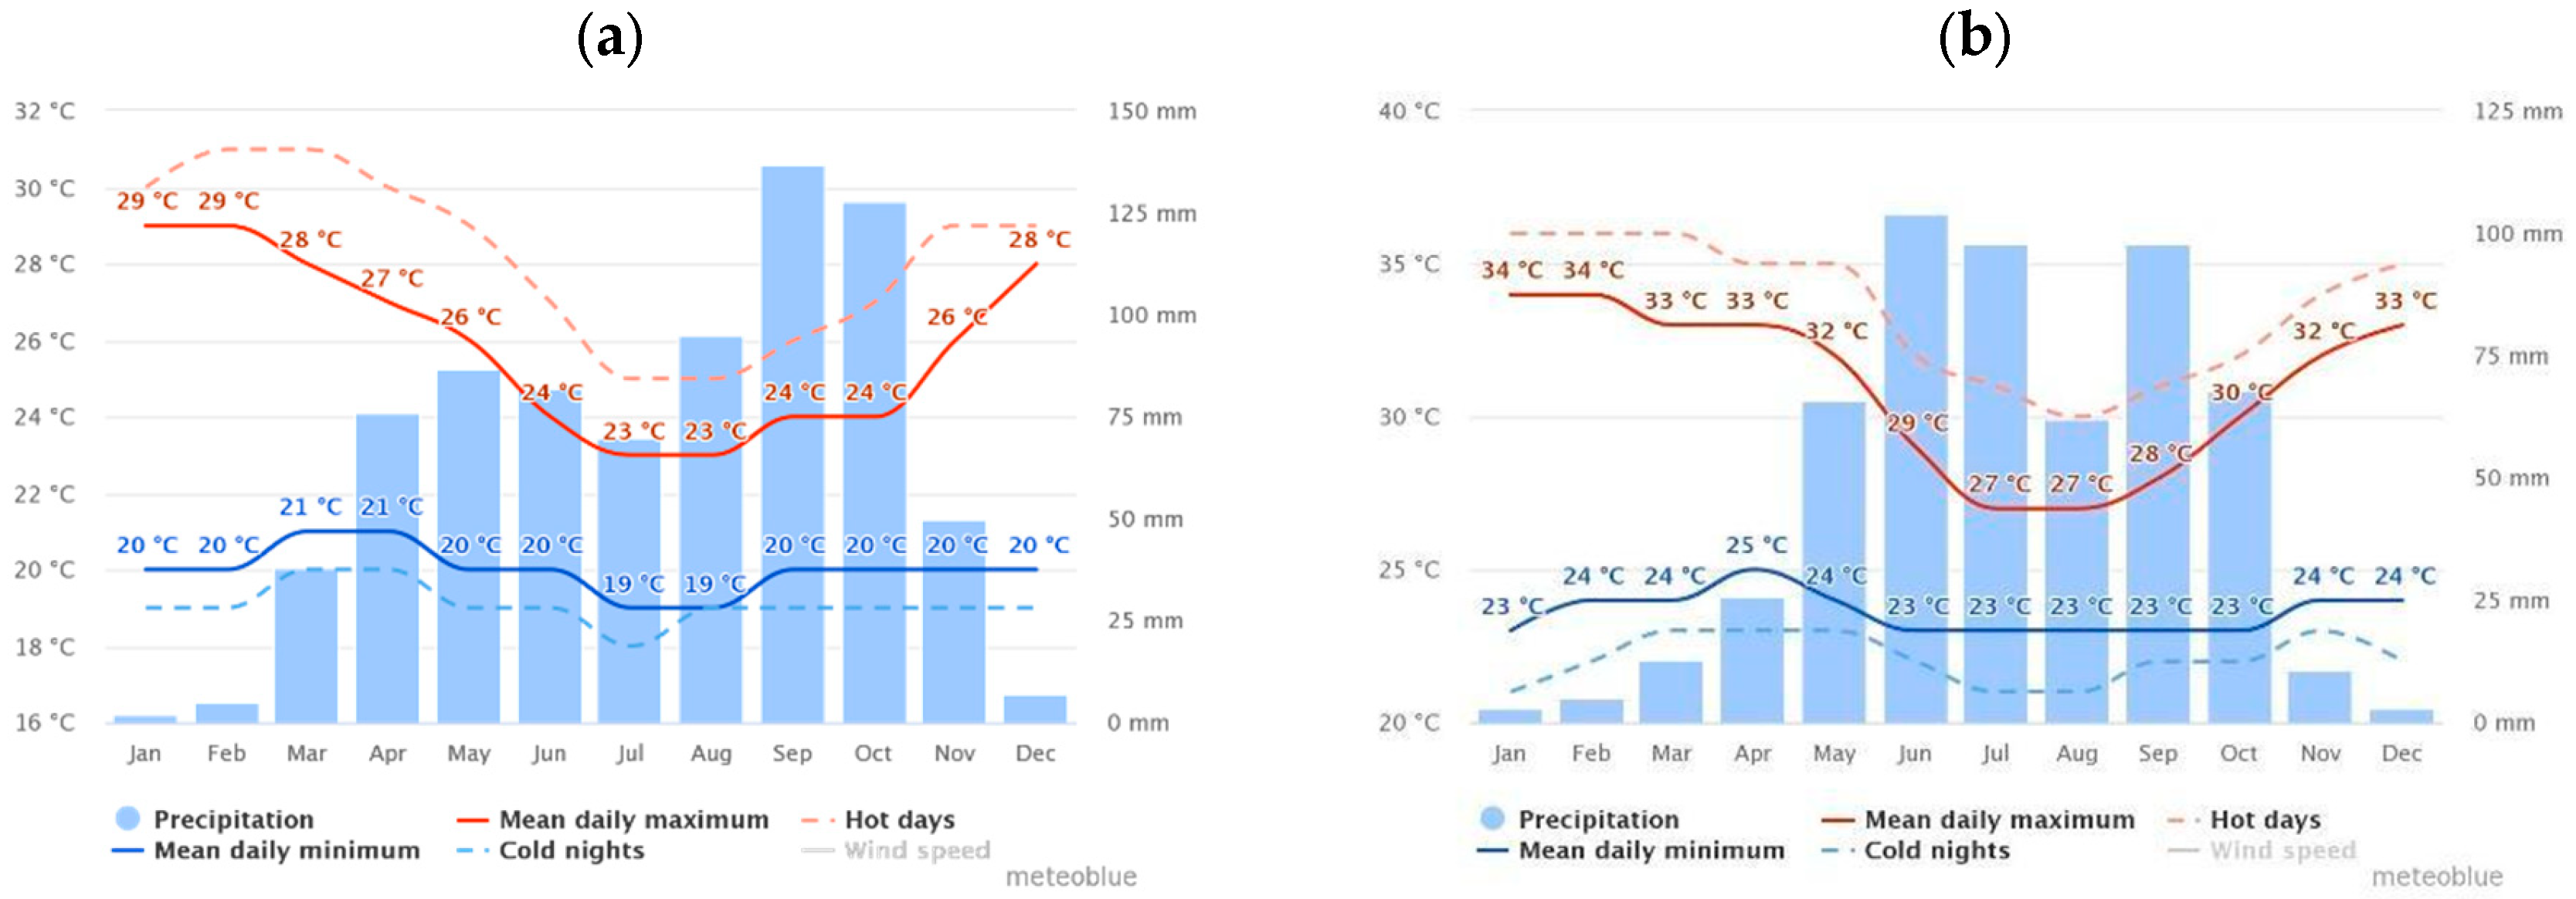
2.1. Climatology of Lagos and Yaoundé

Climate data for the two cities were obtained from an online resource [21]. Climatic data are based on 30 years of hourly weather-simulated data. Figure 1 shows the climatology of both cities, presented as monthly averages. Yaoundé experiences relatively more precipitation (>100 mm in the main wet season) than Lagos, with the most intense rainfall in the months of September to October compared to Lagos where the main rainy season is earlier (June–July). Lagos is relatively warmer than Yaoundé, with mean daily maximum temperatures ranging from 27 to 34 °C compared to 23 to 29 °C. Conversely, Yaoundé is characterised by cooler nights compared to Lagos, consistent with the topography of the two cities. Yaoundé is 726 m above sea level (ASL) surrounded by seven hills, compared to Lagos, a coastal city approximately 40 m ASL.

2.2. Urbanisation Contexts

Lagos State has a very high concentration of commercial, industrial, and educational activities, consequently resulting in urbanisation, overpopulation, and traffic congestion. The state accounts for about 30% of all traffic in Nigeria [22,23], a significant challenge given the limited road infrastructure and development. In addition, 70% of Nigeria’s industrial and commercial activities are in the Lagos region, making it the commercial nerve centre and the most populous state in the country [24]. It has been estimated that the population of Lagos city (24.6 million in 2015, [25]) is increasing ten times faster than New York and Los Angeles [26].
Yaoundé, the political capital of Cameroon, is an industrial and commercial city. Given its relatively huge population (as a proportion of the national population) of 4.5 million [27], while smaller, shares many air pollution emitting activities with Lagos. Some of the anthropogenic factors that contribute to air pollution in mega cities like Lagos and Yaoundé include economic development, urbanisation, energy consumption, transportation, dumpsites, open incinerators, power generators, domestic heating, industrial and agricultural activities, and rapid population growth.

2.3. Public Spaces Appropriated for Physical Activity

As part of the ALPhA study, members of the public were recruited as citizen scientists and invited to share information about the types of public spaces used for physical activity. These data provided insight into the typologies of public spaces appropriated for physical activity and included: vacant plots of land, areas under and next to bridges, parks, side of the road and roundabouts. These public spaces pose very high risks to those using these spaces for physical activity due to the proximity to vehicular emissions. These findings informed the siting of the air quality sensors in each city, with one of these sites selected in each city to capture public spaces that are regularly used for physical activity.

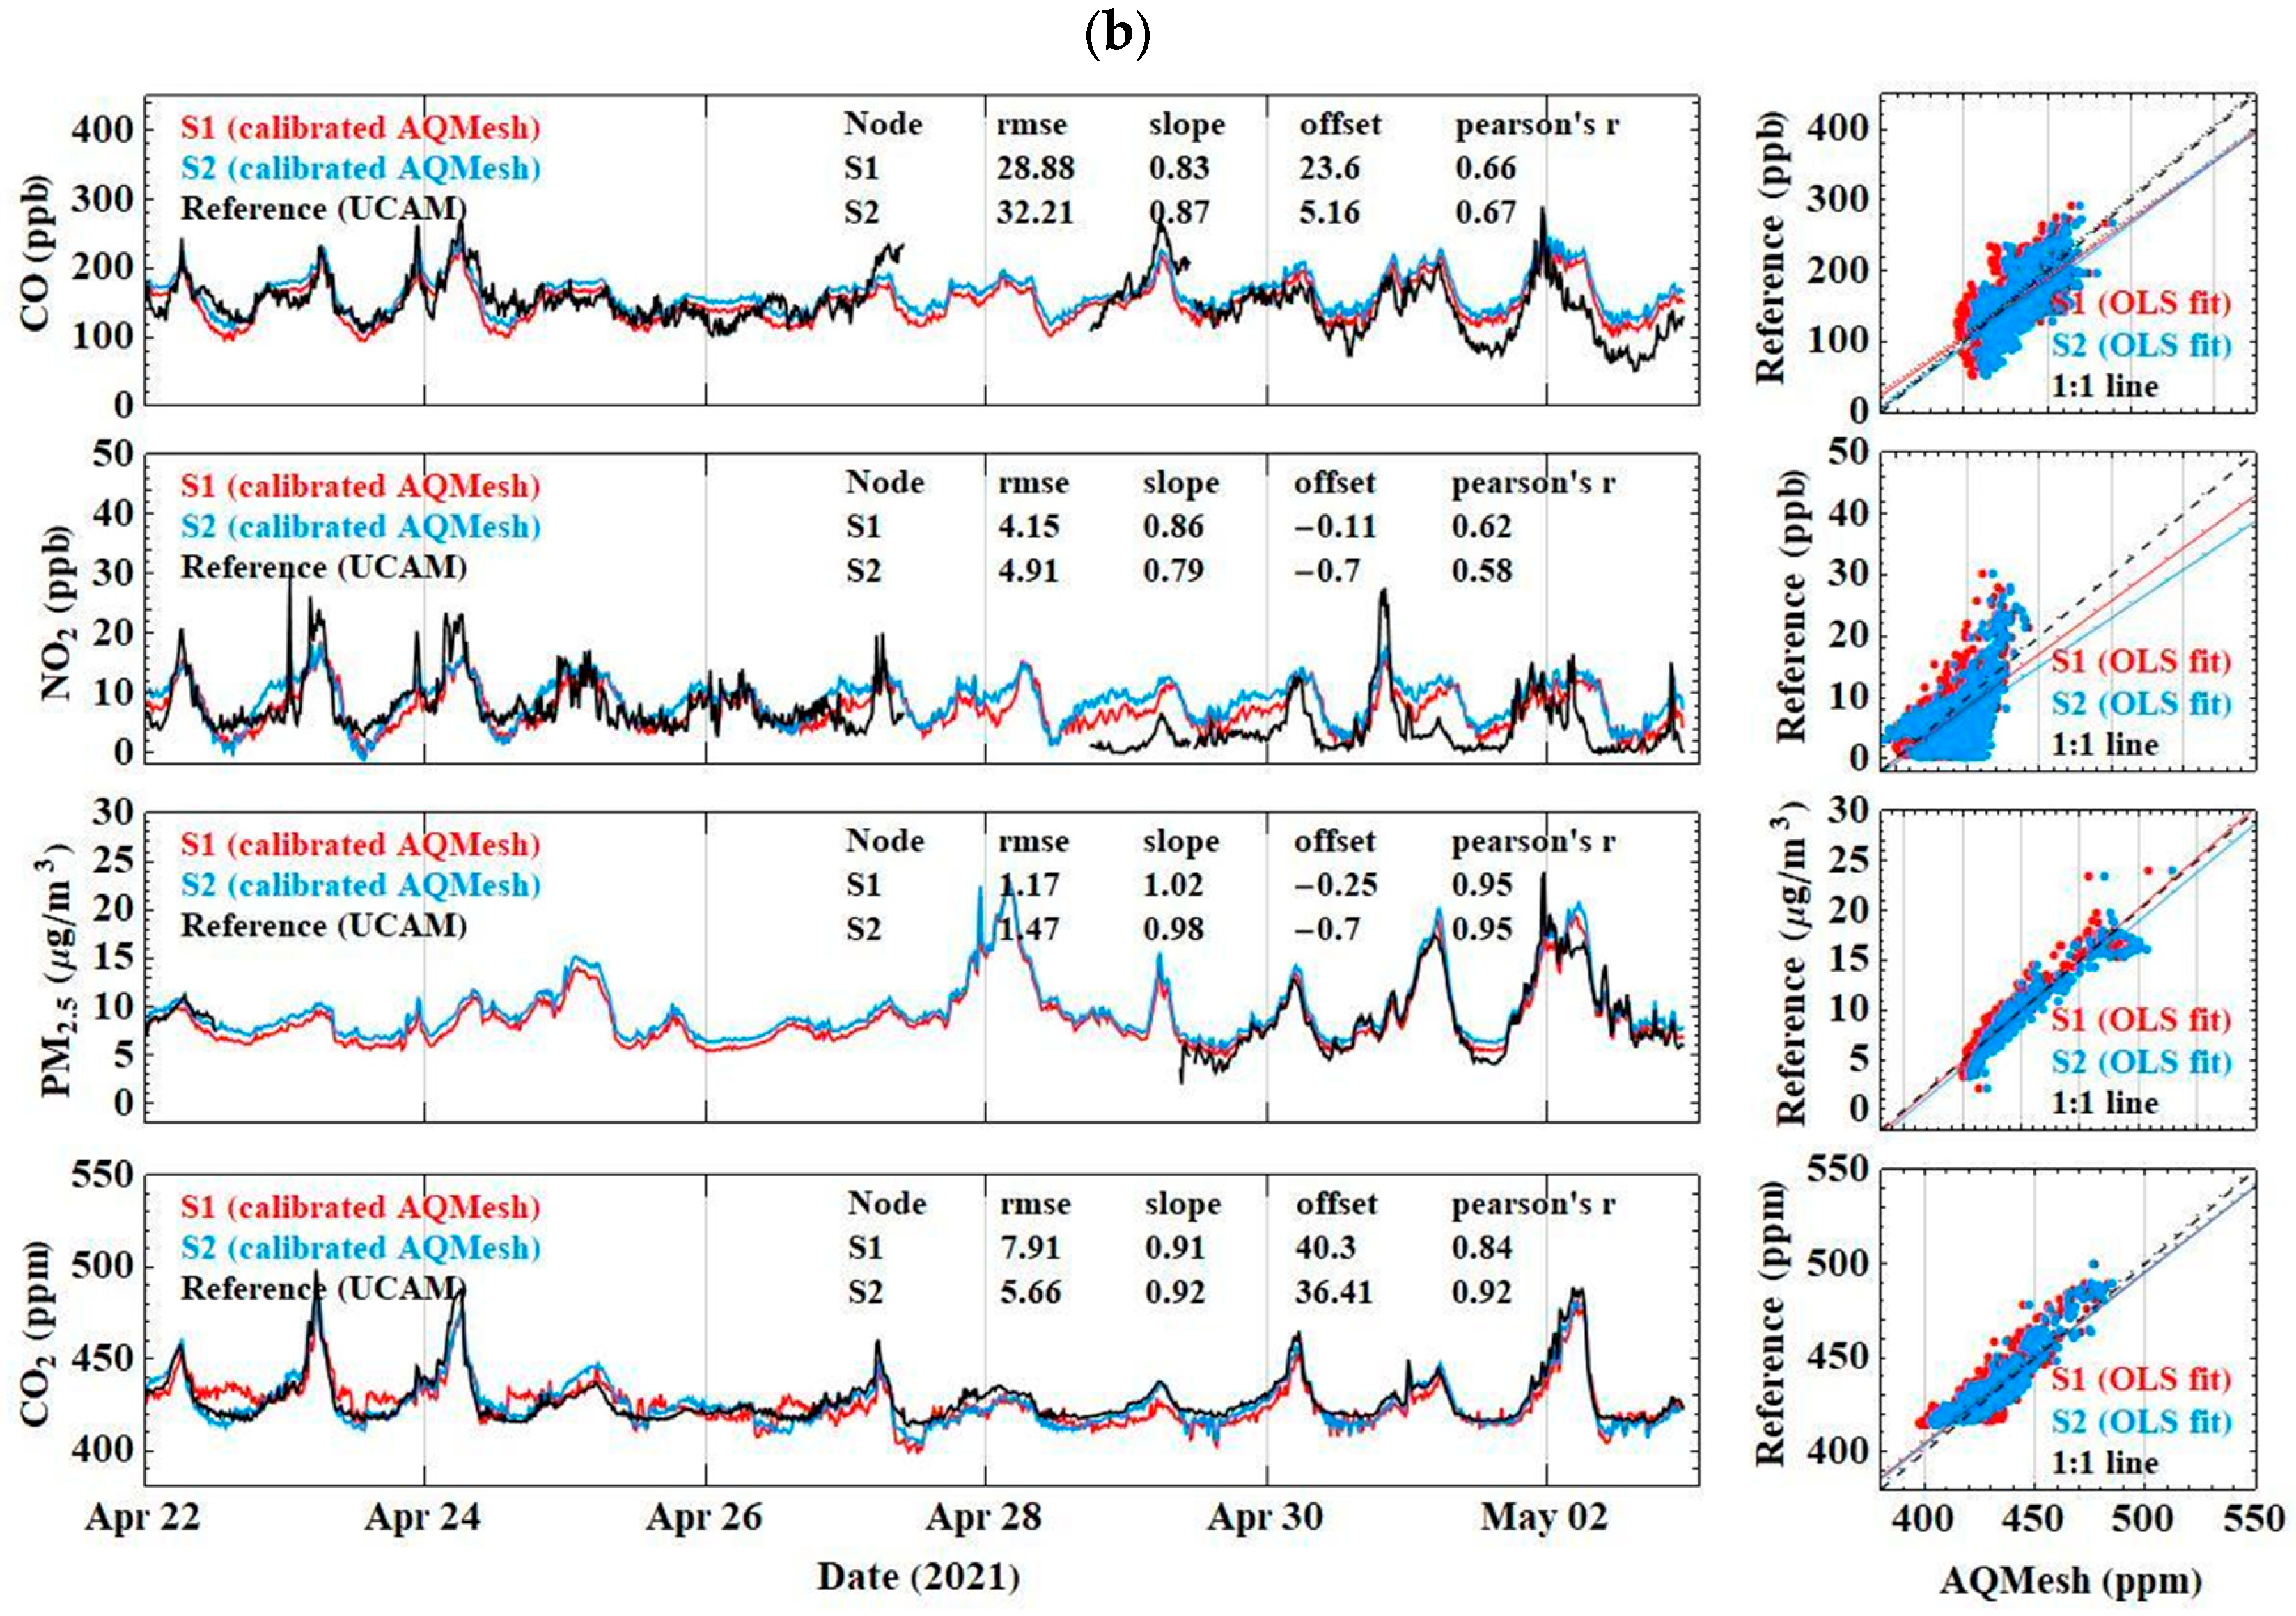
2.4. Instrumentation for Air Quality Observation

One commercial low-cost air quality device (AQMesh, Stratford-upon-Avon, UK) was deployed in each city. Parameters monitored by the nodes included CO, NO, NO2, O3, CO2 and particulate matter (PM2.5 and PM10). Each node also recorded meteorological parameters including relative humidity (RH), temperature, ambient pressure, all at 15 min average resolution.
AQMesh uses electrochemical sensors to detect the toxic gas species. These work on the principle of amperometry where the current generated by the target gas species is proportional to the concentration of the gas species. A non-dispersive infra-red (NDIR) sensor is used in the detection of CO2; concentration is proportional to the ratio of the intensity of the transmitted light (which is affected by an absorbing gas) relative to a reference light when absorption is absent. AQMesh uses an optical particle counter (OPC), to measure PM. This works on the principle of Mie scattering which allows the number concentrations for different size ranges to be determined. By making assumptions on the particle density, refractive indices, the mass concentrations are calculated from the different PM mass sizes (i.e., PM2.5 and PM10).

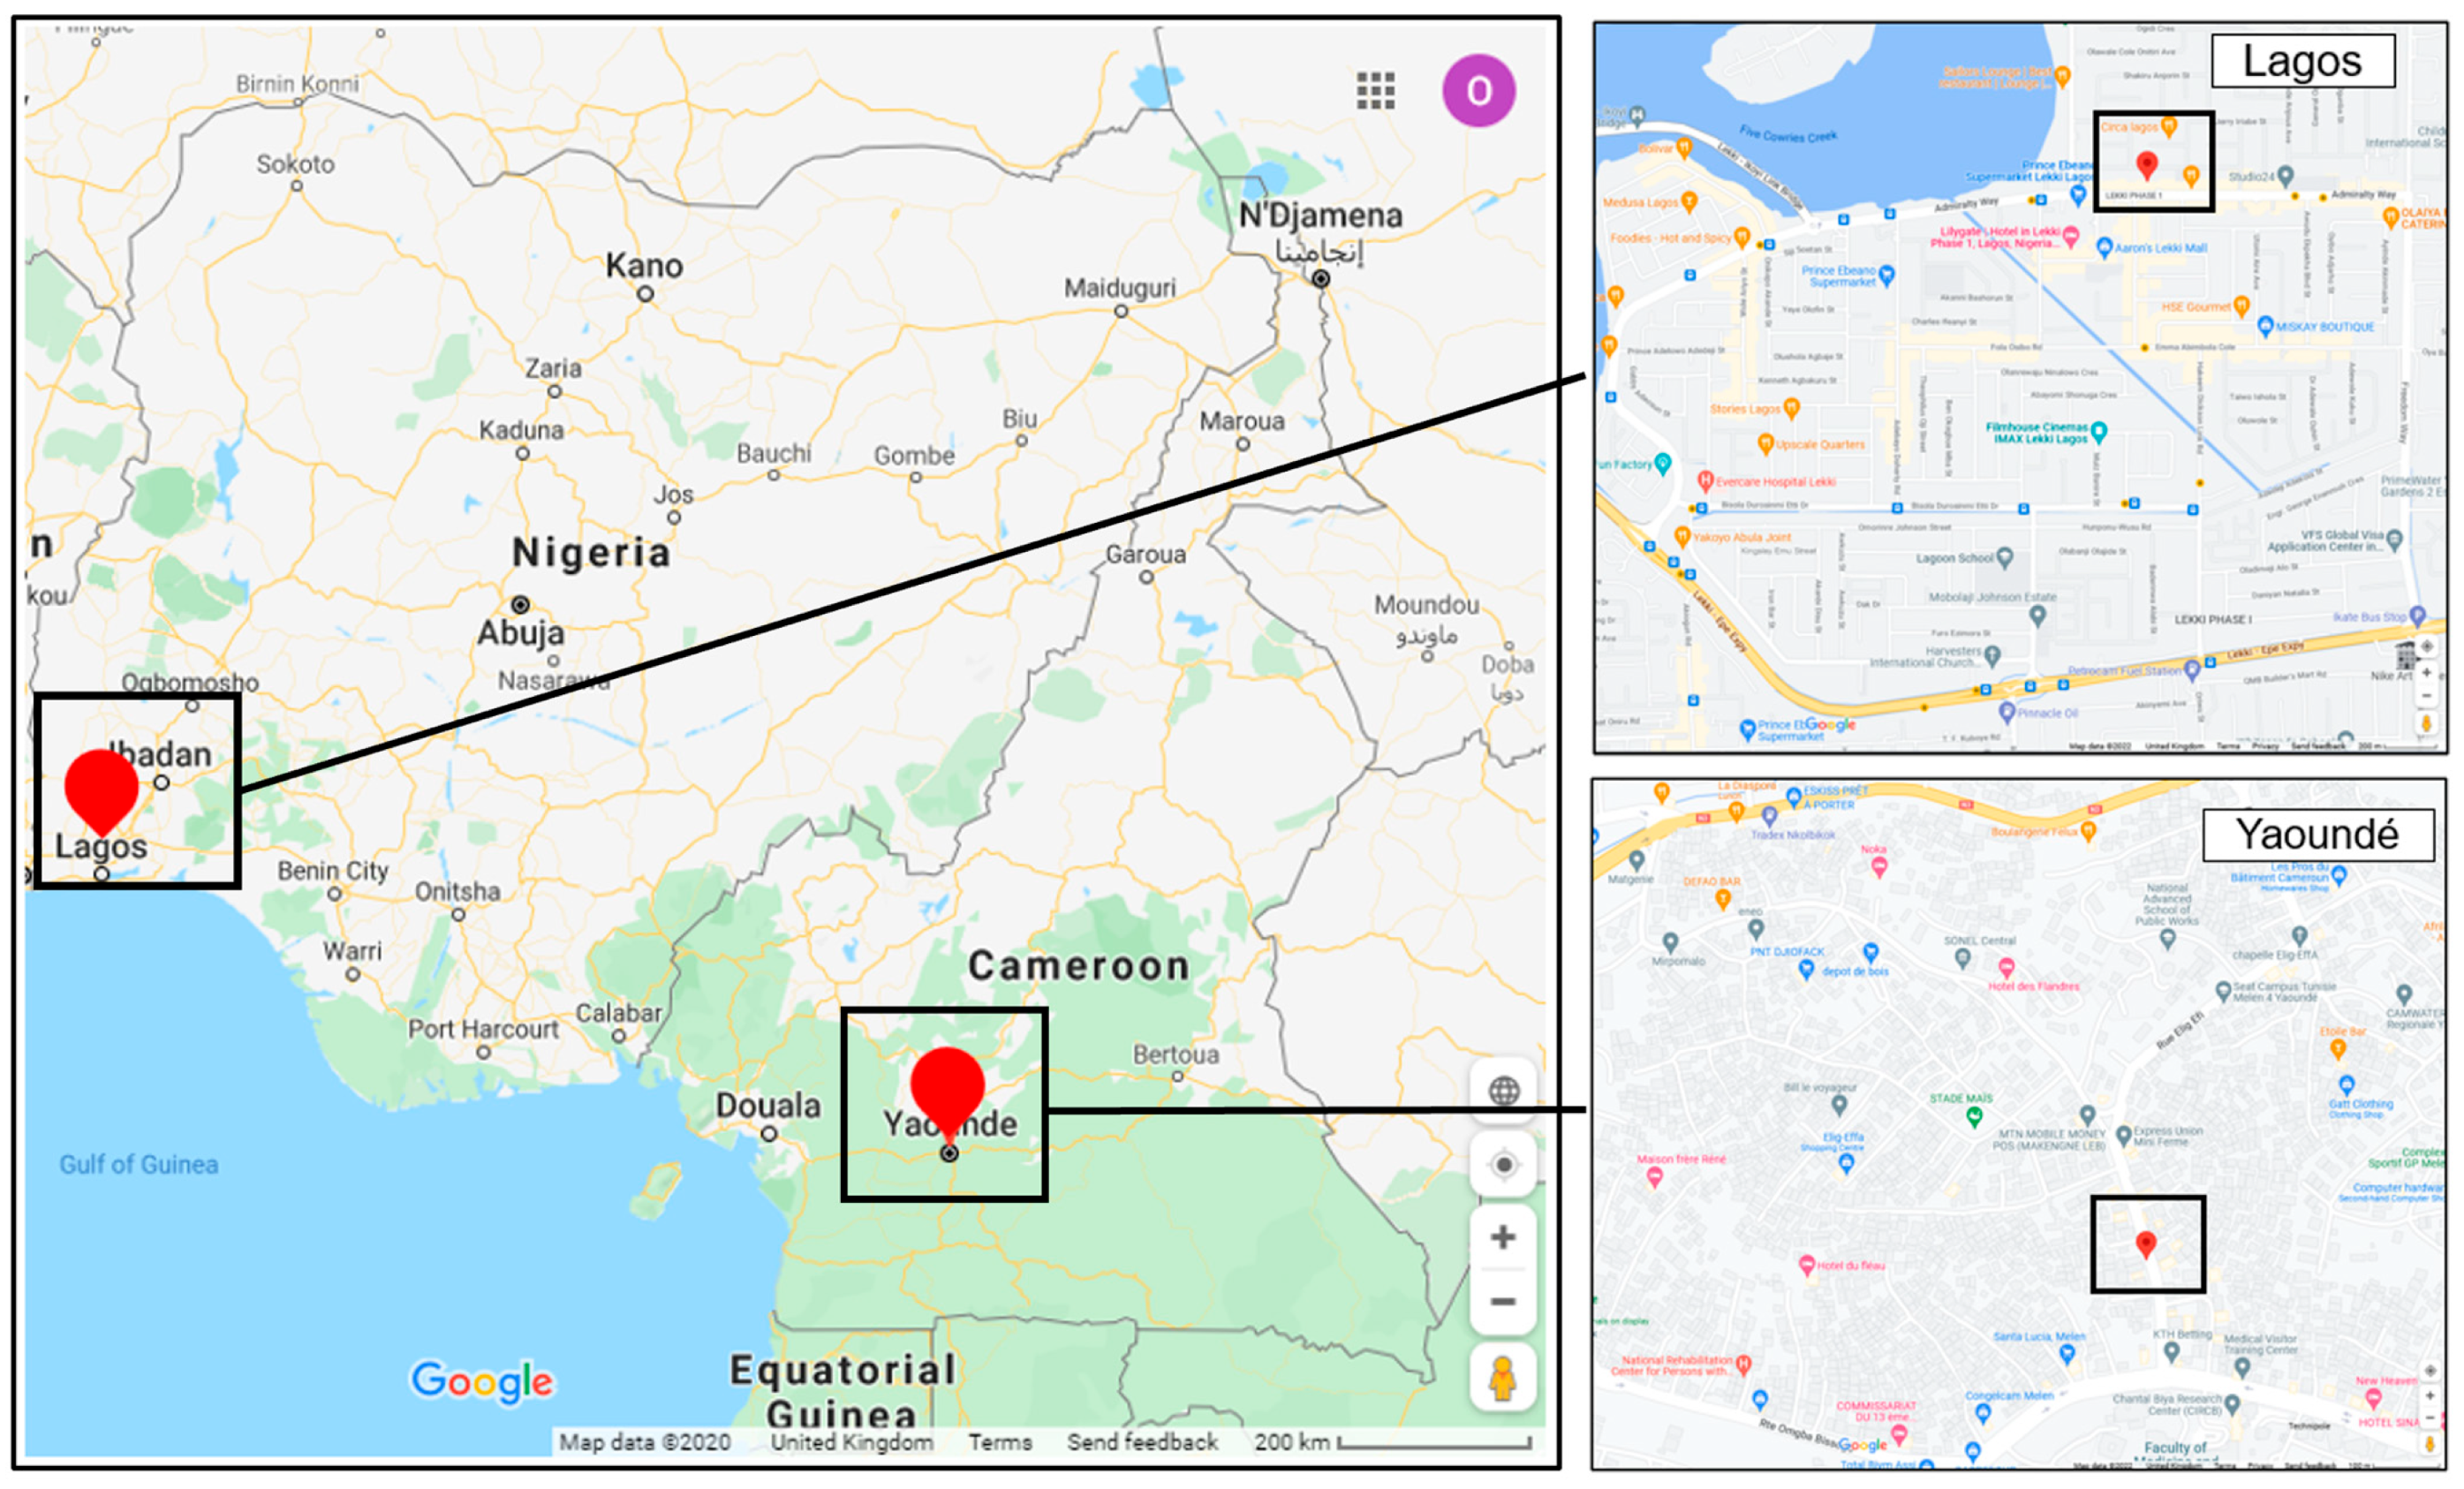
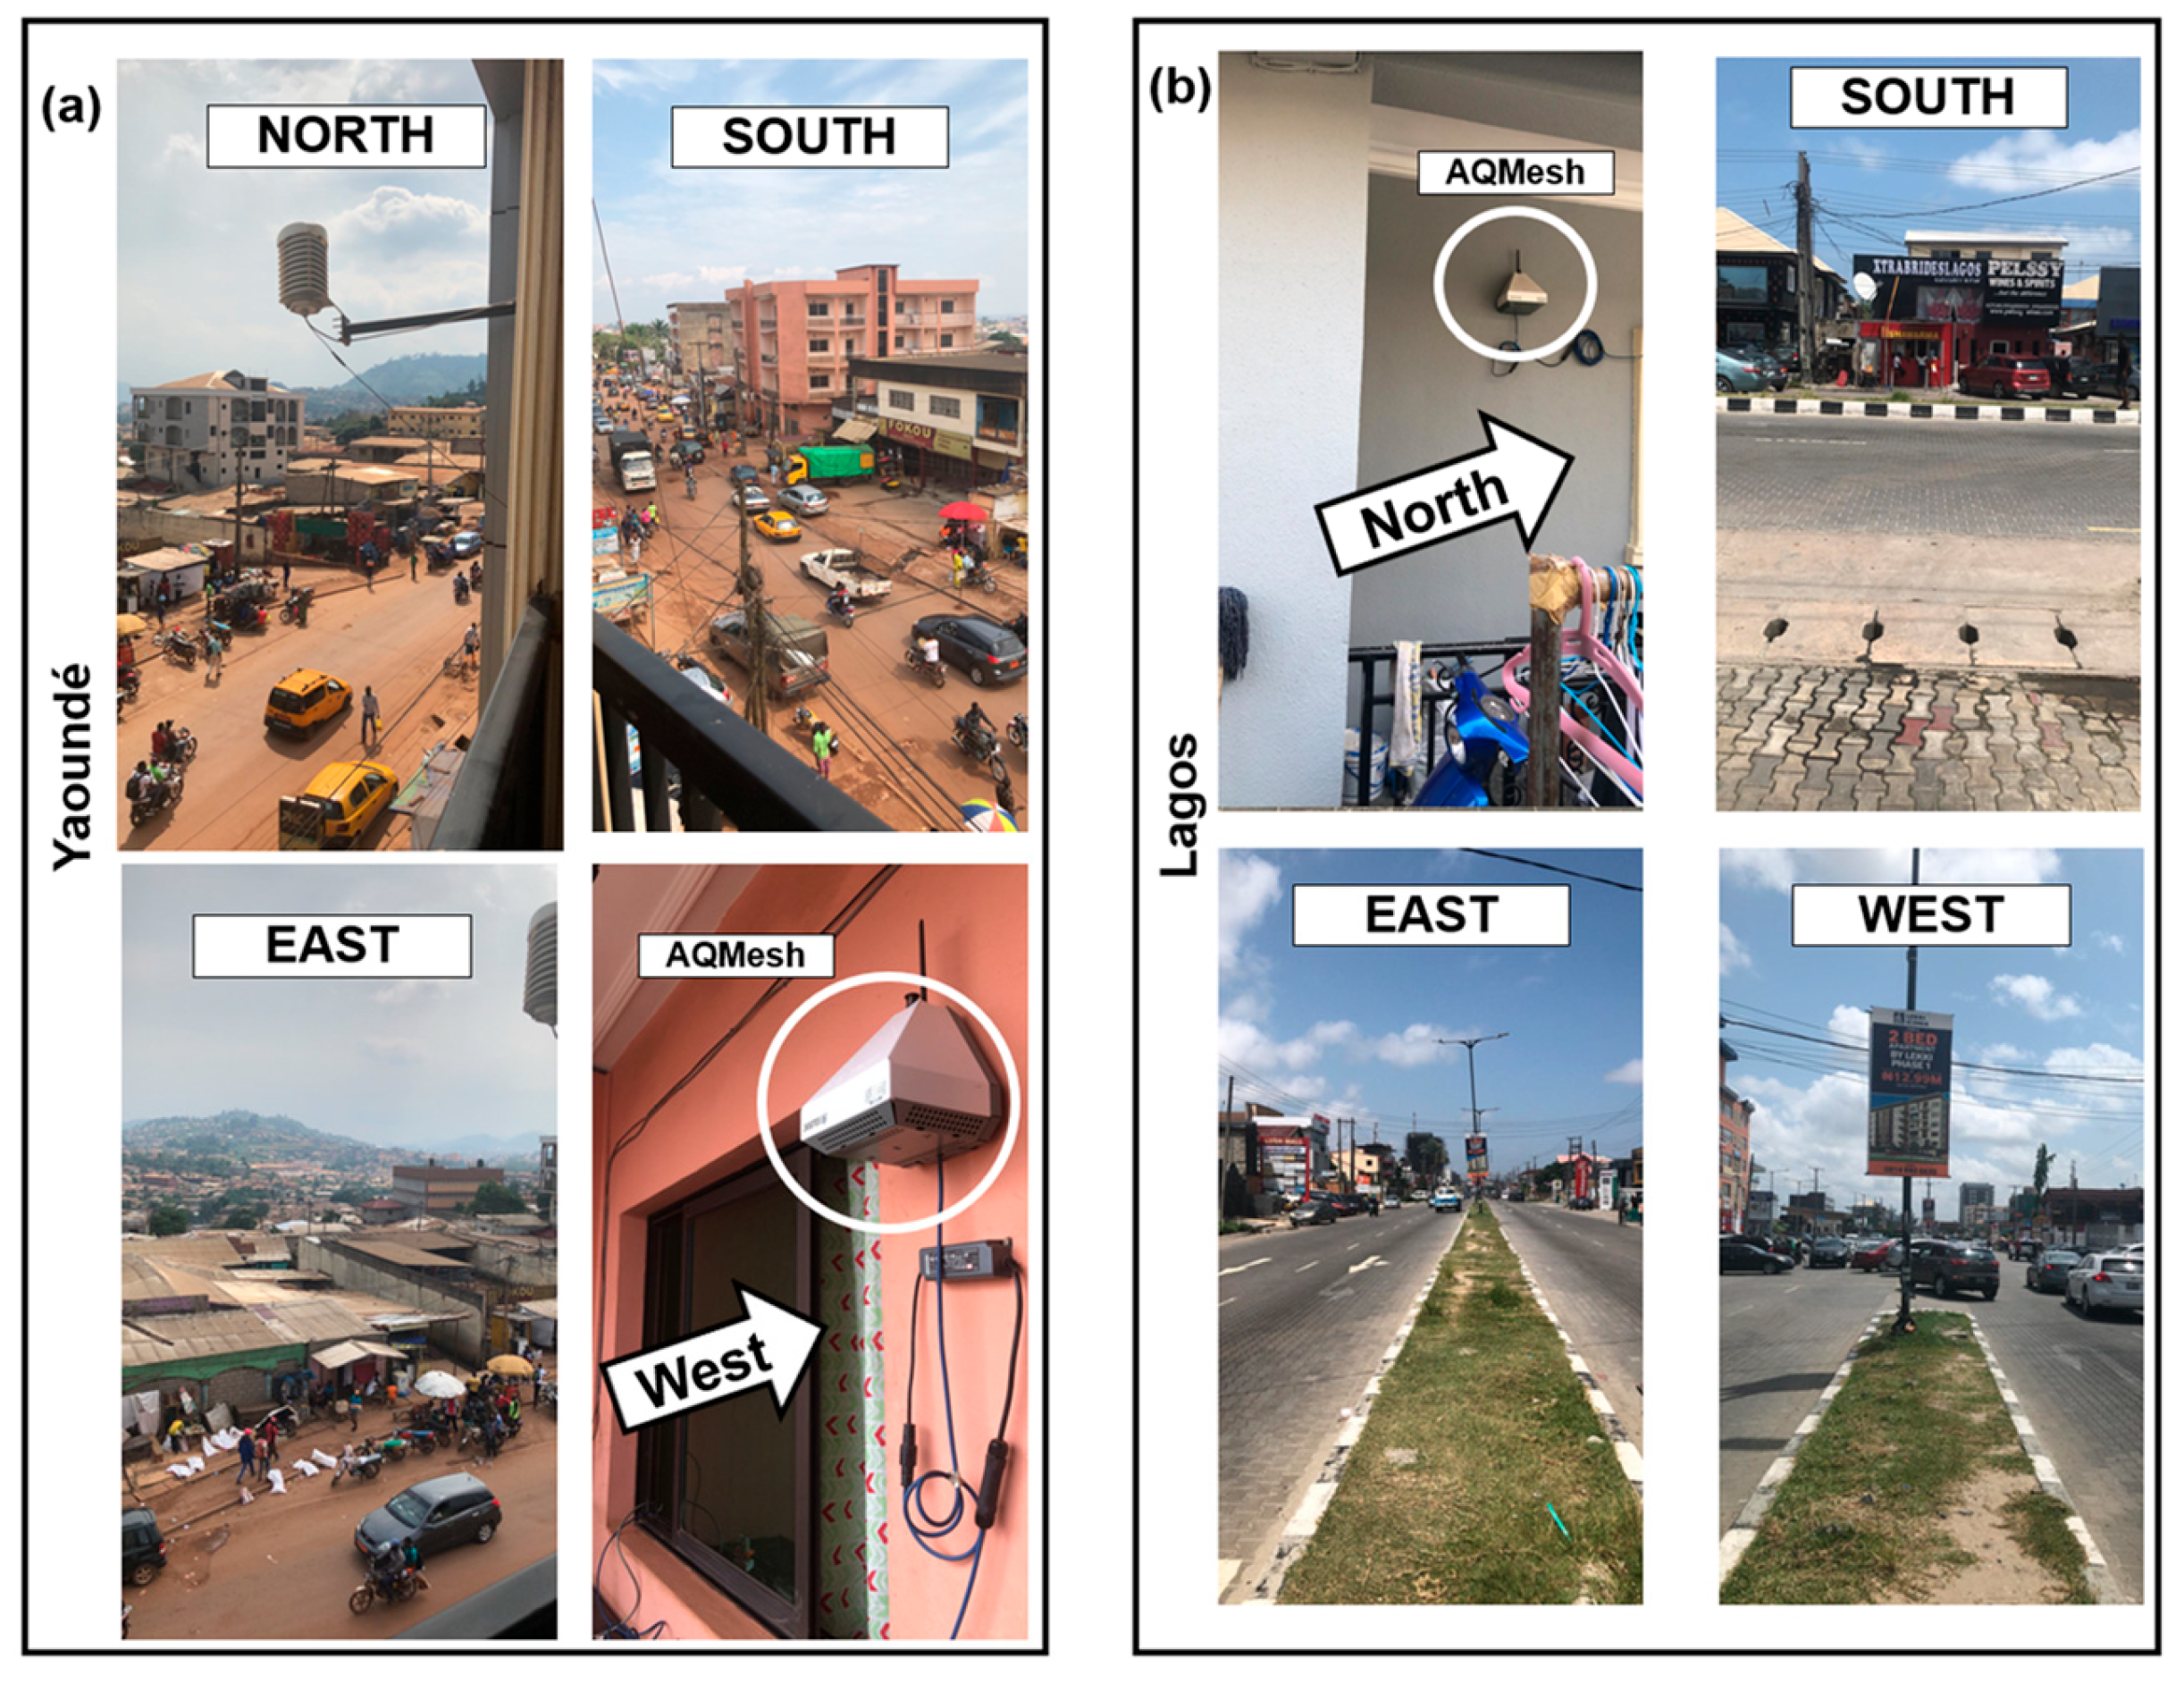
2.5. Air Quality Node Location

The fixed station was sited along Admiralty Way, Victoria Island (AW-VI) (6°26′53.40″ N, 3°28′21.50″ E) in Lagos, and in the Melen Mini-Ferme (MM-F) area of Yaoundé (3°51′56.40″ N, 11°29′46.61″ E), as depicted in Figure 2. Based on a physical survey of the site and soliciting expert knowledge from local partners, we can describe the site in Lagos as a mixed environment, with emissions from road traffic, residential and small local business operations expected to dominate emissions (Figure 3). The low-cost sensor (LCS) was installed at heights of ~2.8 m and ~8 m in secured premises in AW-VI, Lagos and MM-F, Yaoundé respectively. Installation height was mainly determined by security and access to power. Observations were made for a year, from 1 June 2021 to 31 May 2022, to capture the long-term trends and seasonal variabilities at the two locations.
Like AW-VI in Lagos, the MM-F in Yaoundé can also be categorised as mixed use, although the characteristics of the vehicle fleet, traffic volume and condition of the roads are quite different. A visit to the sites prior to deployment showed that there were more 3-stroke engine vehicles at the MM-F, Yaoundé, and a higher volume of commercial vehicles compared to the AW-VI site in Lagos. Other local sources of air pollution at MM-F, Yaoundé, include roadside cooking (charcoal grilling), resuspended particles from roads, and nearby construction work.
Descriptive daily logs of perceived weather conditions such as visibility in the later months of 2021 and 2022, which often coincided with Saharan dust episodes, were also recorded qualitatively by the project team in each city. This information was used to further interpret the air trajectory analysis presented in the results section. The Openair package in R [28] was used to create a trend analysis and the back trajectory including the concentration-weighted trajectory (CWT), a hybrid single-particle Lagrangian integrated trajectory (HYSPLIT)-based model. We also used the UK Met Office’s numerical atmospheric-dispersion modelling environment, NAME [29] run in backward format to investigate the Saharan dust episodes.

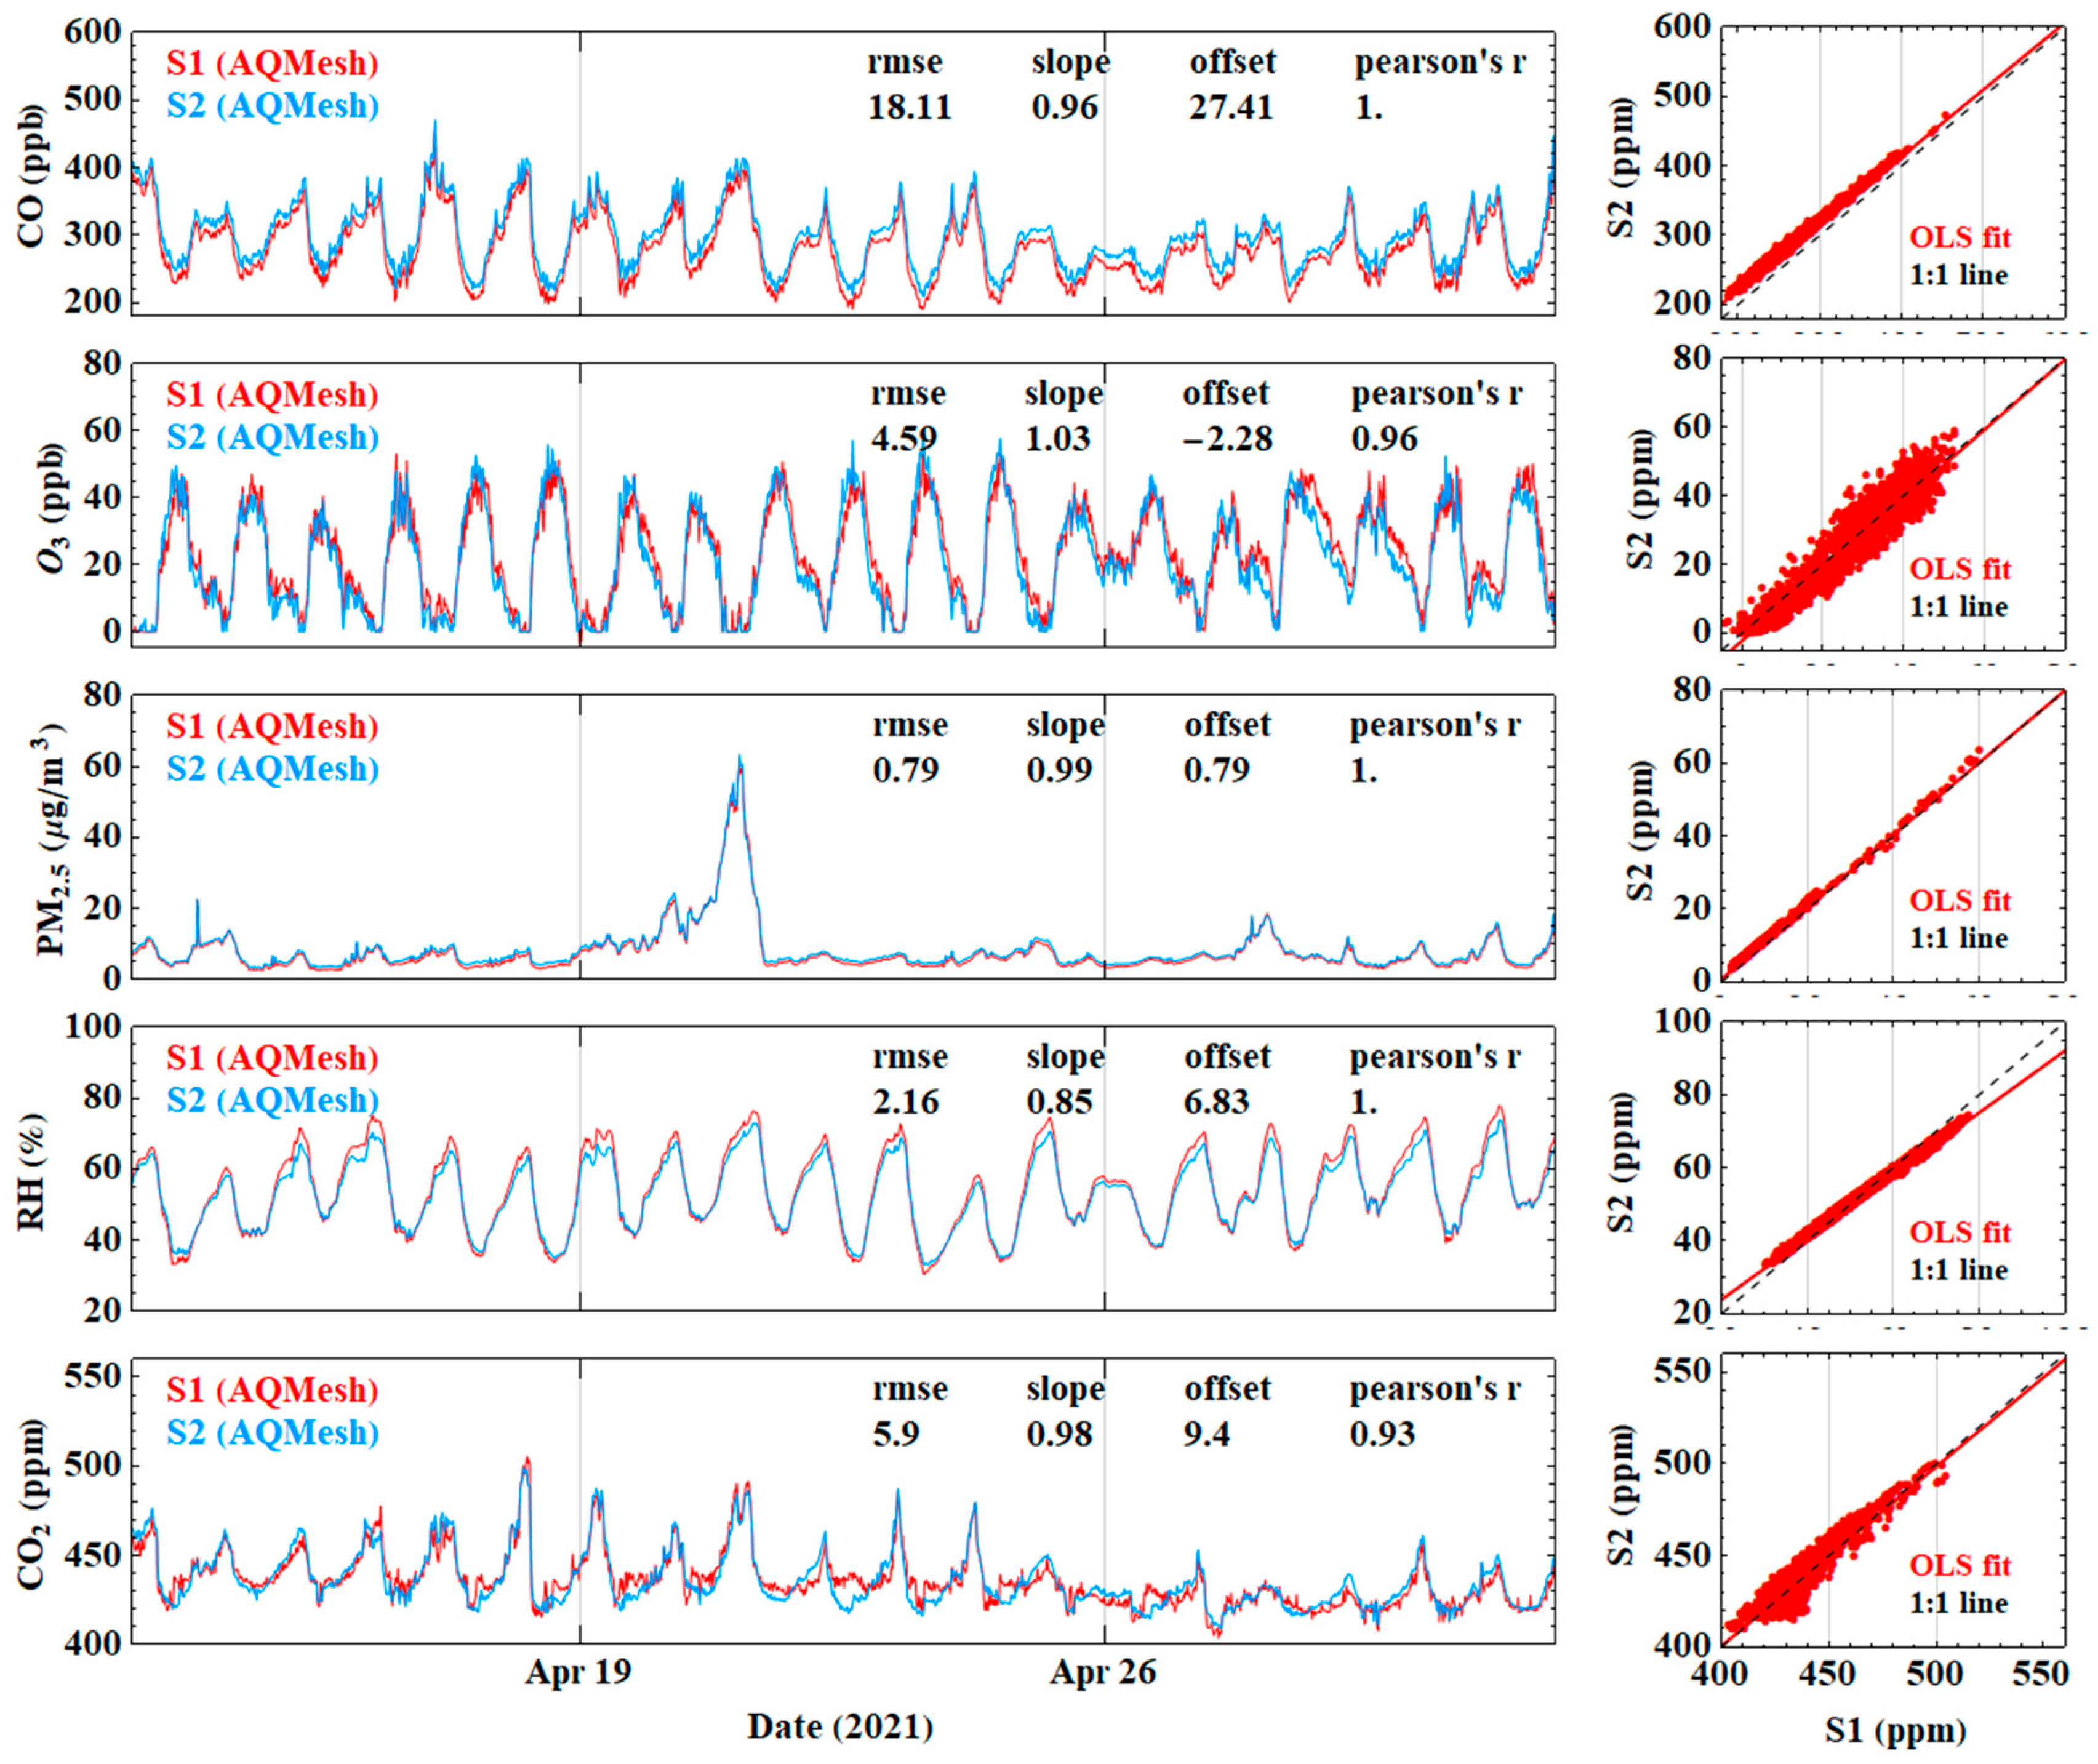
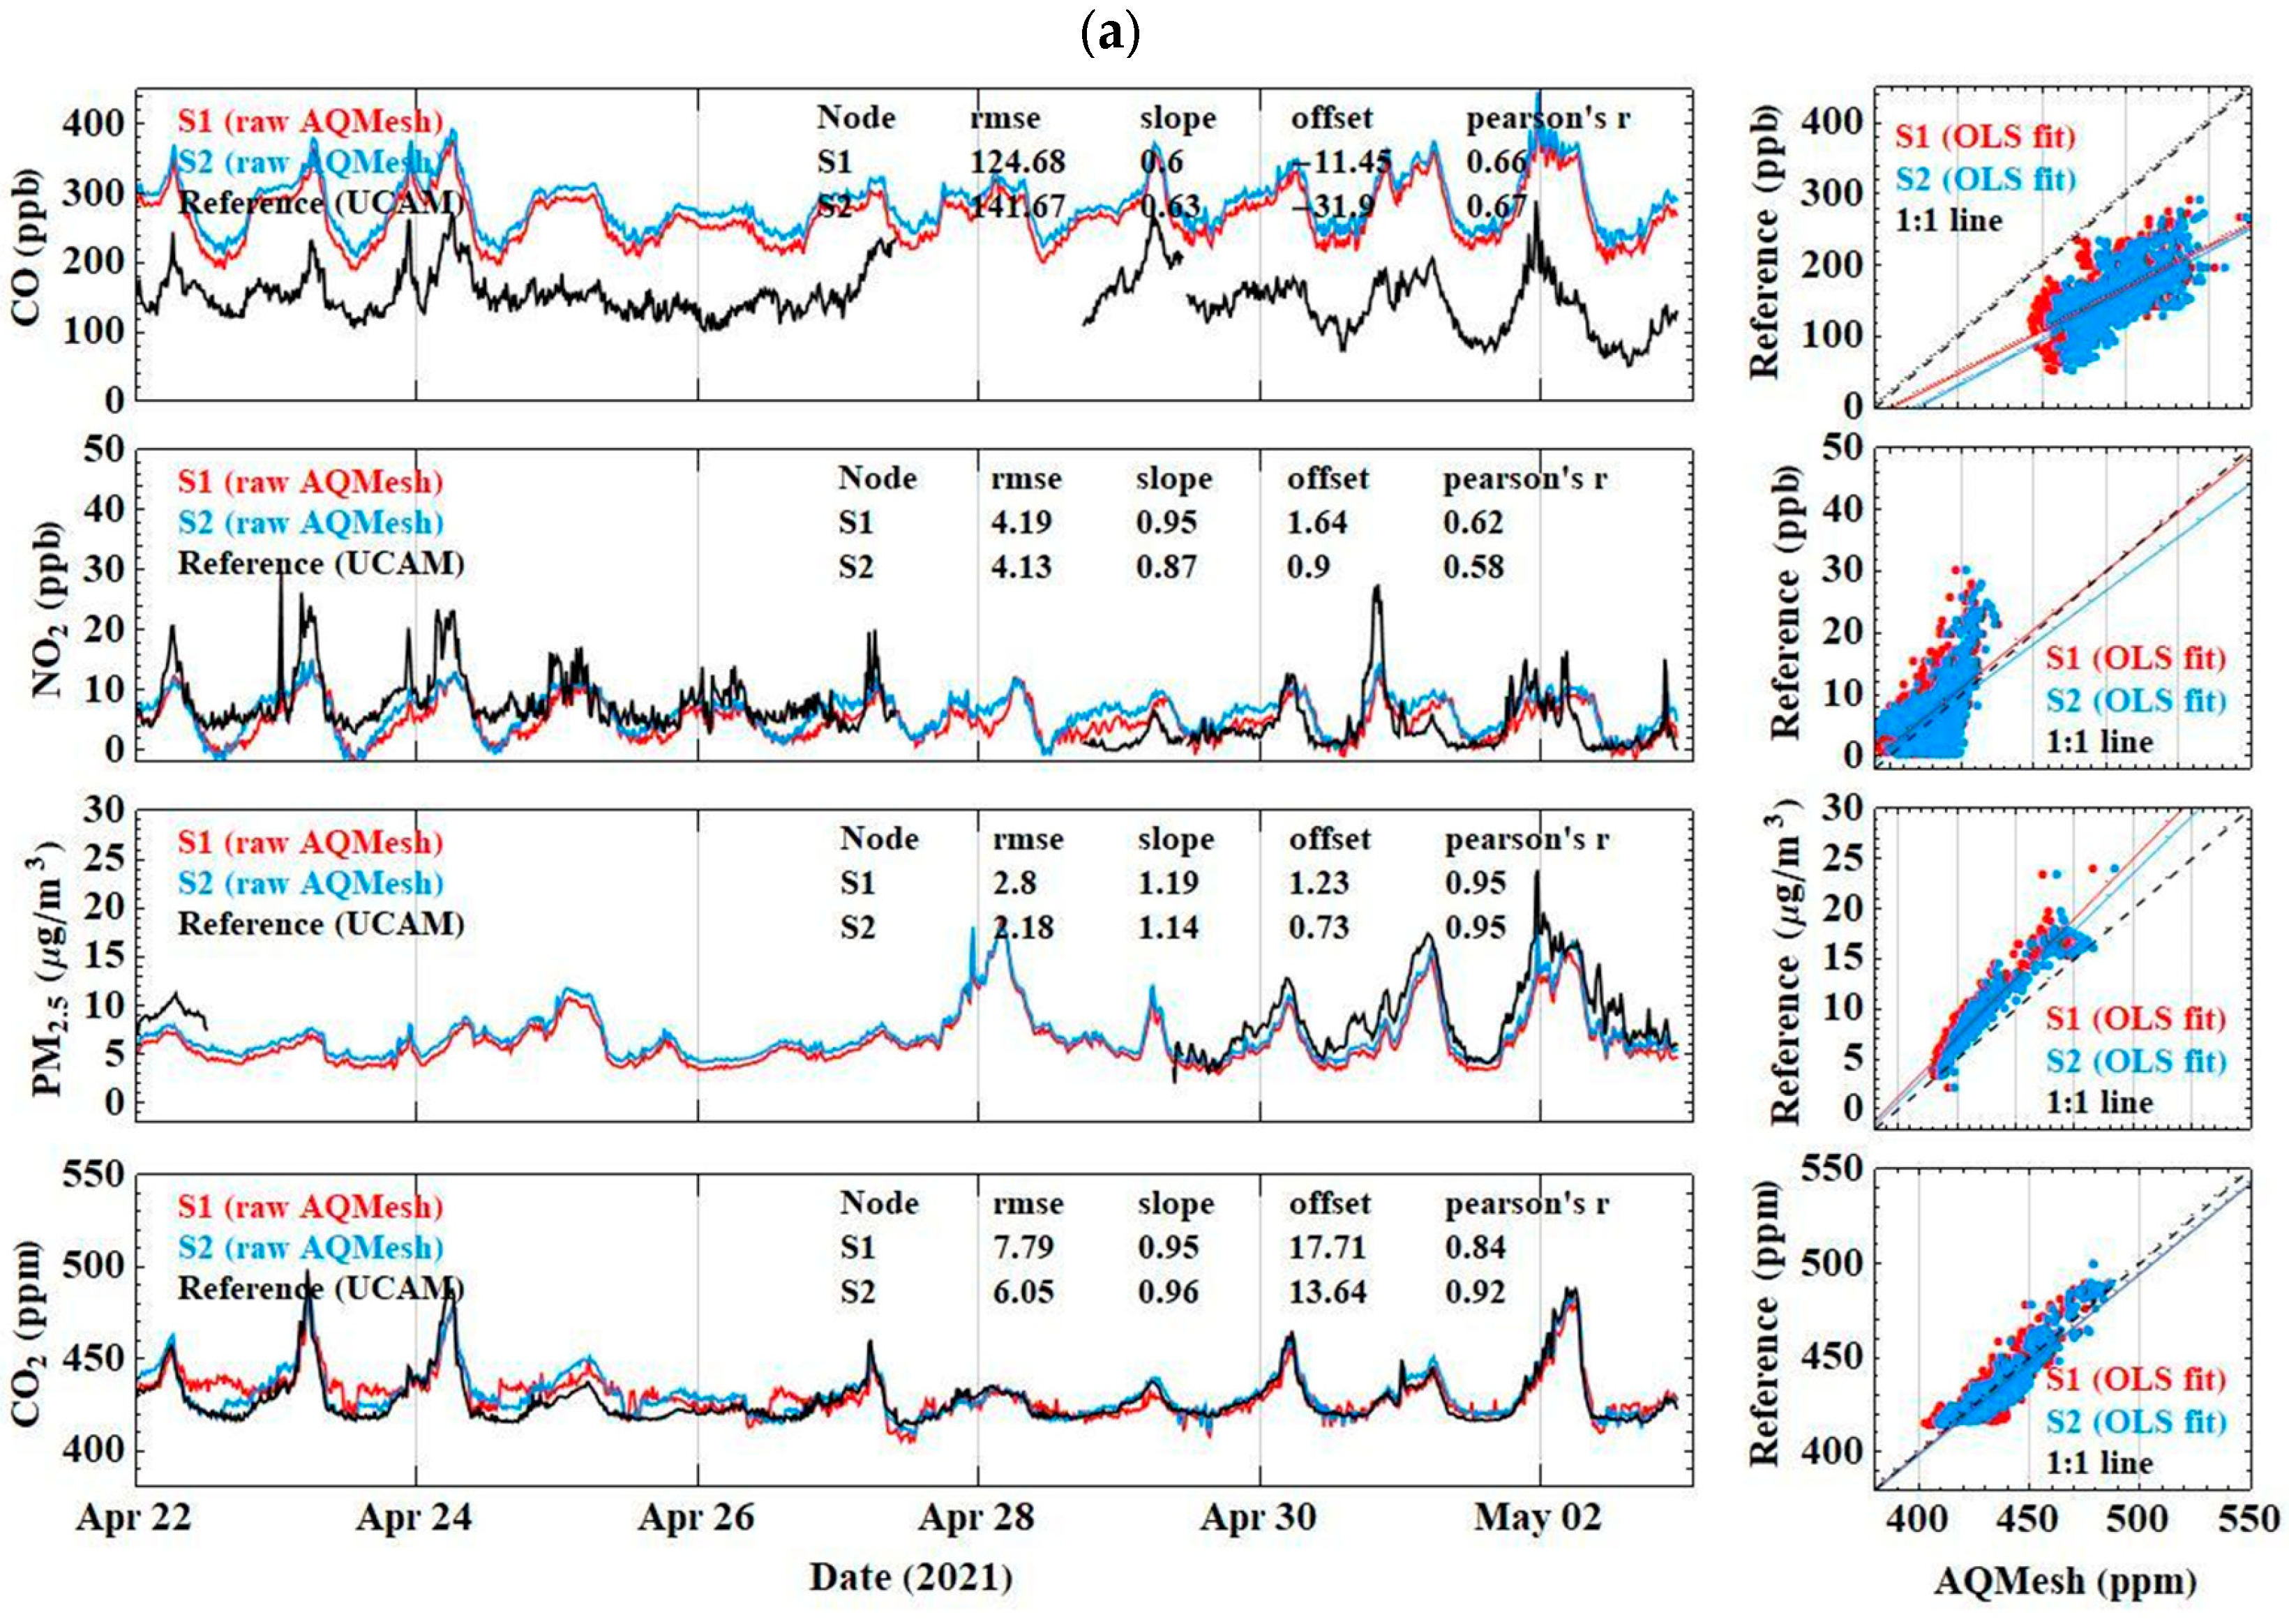
2.6. Characterisation of Air Quality Nodes

Due to lack of reference grade instrumentation in the study locations, prior to shipping, the two AQMesh nodes were characterised by conducting a co-location study (between 13 April and 2 May 2021) at the ambient urban air quality site located in the Department of Chemistry, University of Cambridge, UK. Figure 4 presents the comparisons between the two devices for some parameters. Both devices showed excellent precision and reproducibility (slope ~ 1 and r > 0.8) for all parameters at the urban background station (see Figure S1 for the other parameters).
We derived the absolute calibration parameters for the LCS nodes by comparing the measured parameters with the reference observations using a subset of the data from 13 April to 21 April 2021 during the co-location period. These calibration factors were used for all the subsequent analysis presented in this study. We validated calibrated data using the second half of the co-location study (22 April to 2 May 2021) The results showed that a generally good correspondence was observed between the calibrated data and the reference observations when compared to the raw LCS observations (Figure 5). The gaps in the reference data represent periods when the corresponding reference analysers were not operational.

3. Results and Discussion

The results from the monitoring in the two cities are presented separately in the context of the sampling environment. Due to the large amount of missing data in Lagos (as a result of frequent power outages) in the later stages of the study, intercomparison between the two locations were based on periods when there were measurements available at both locations.

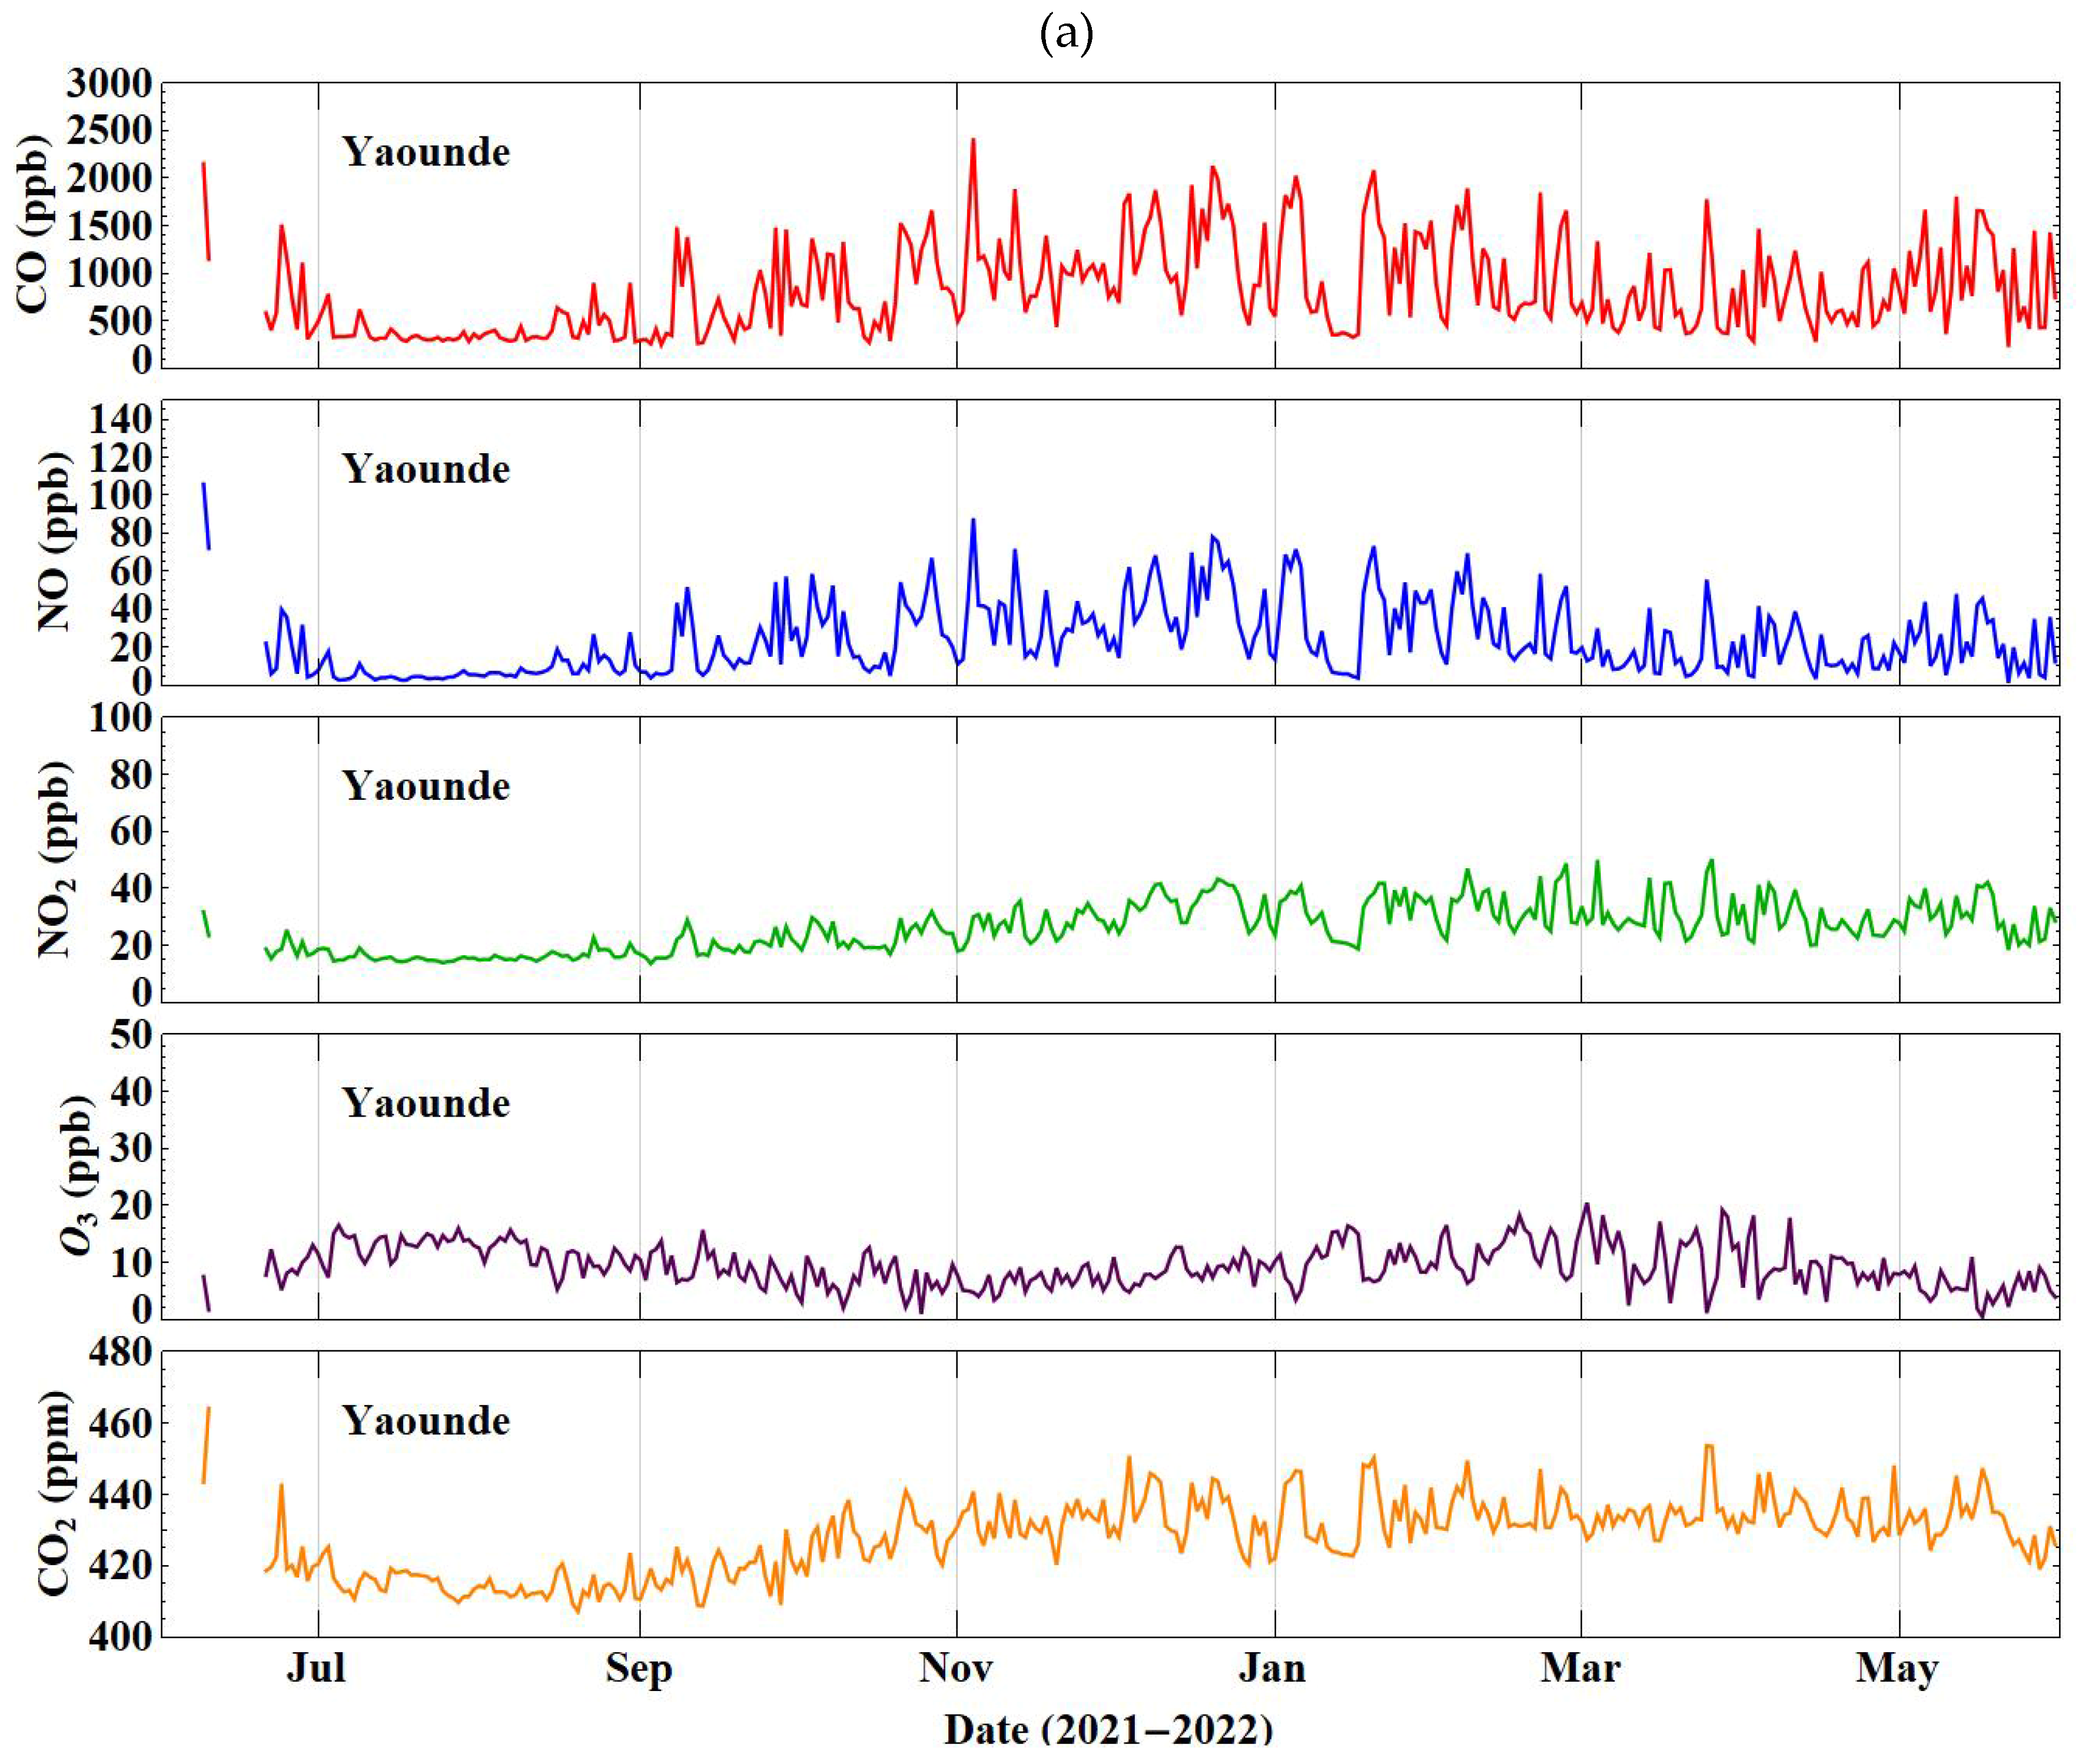
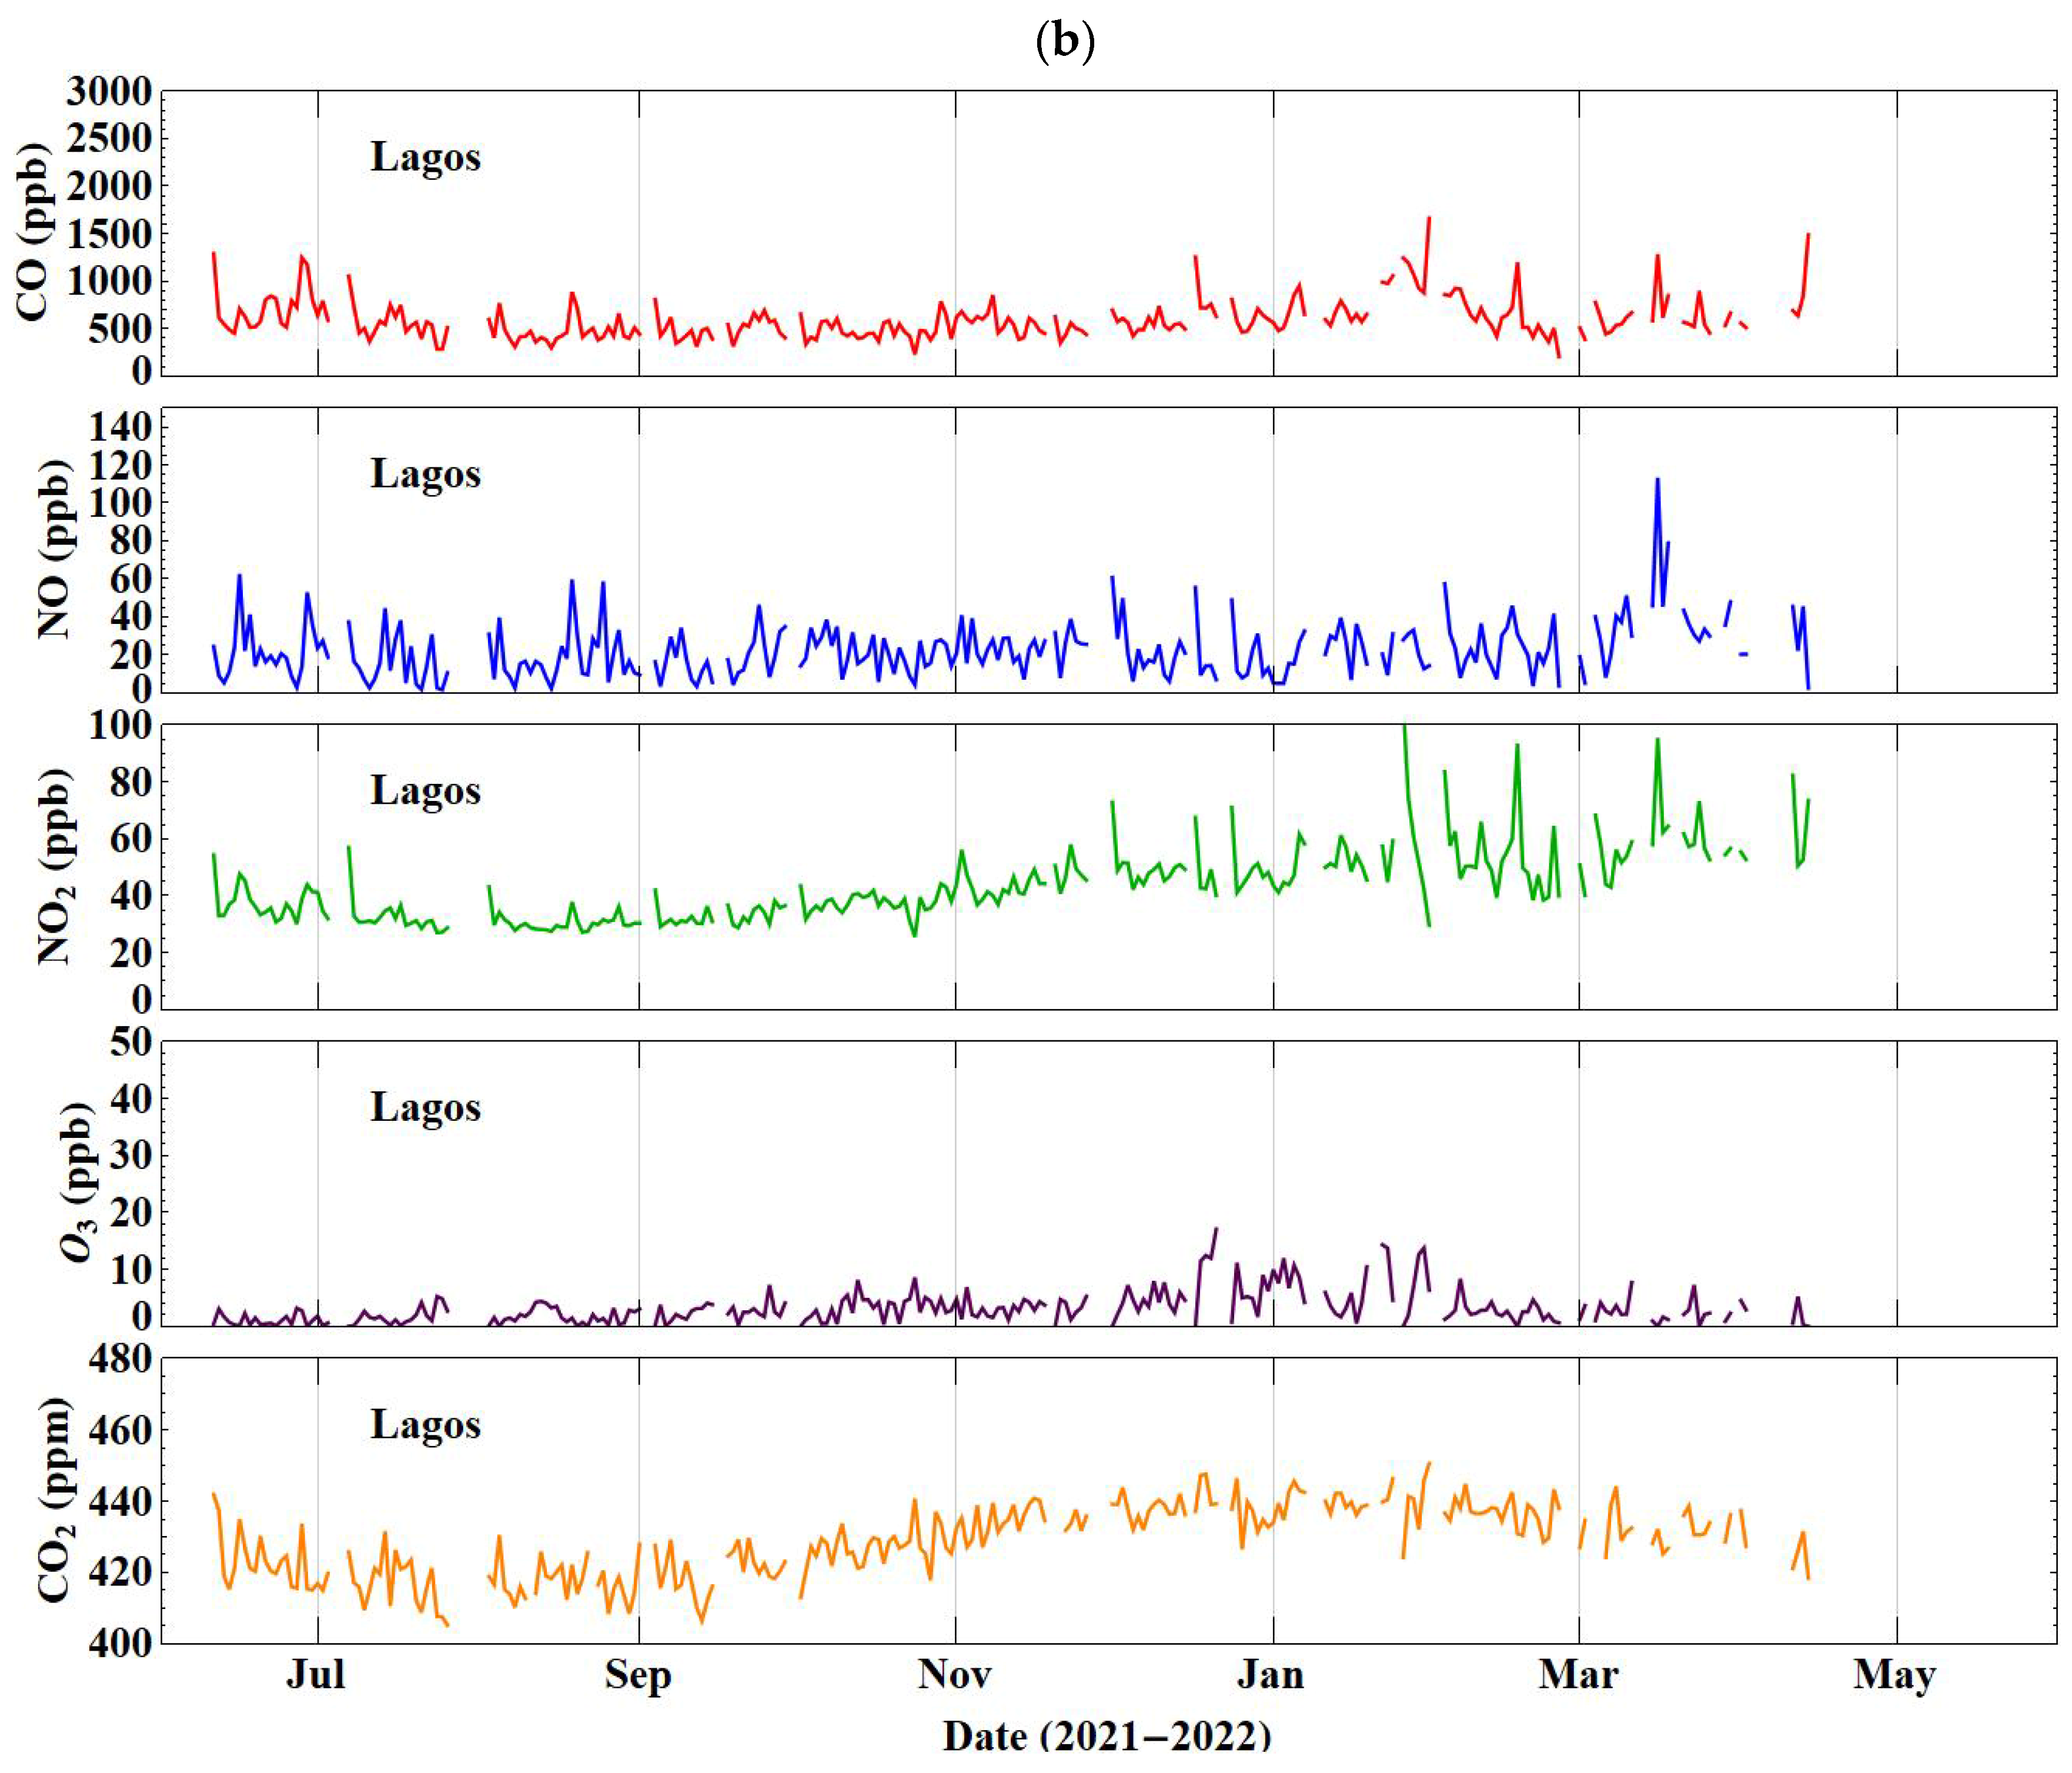
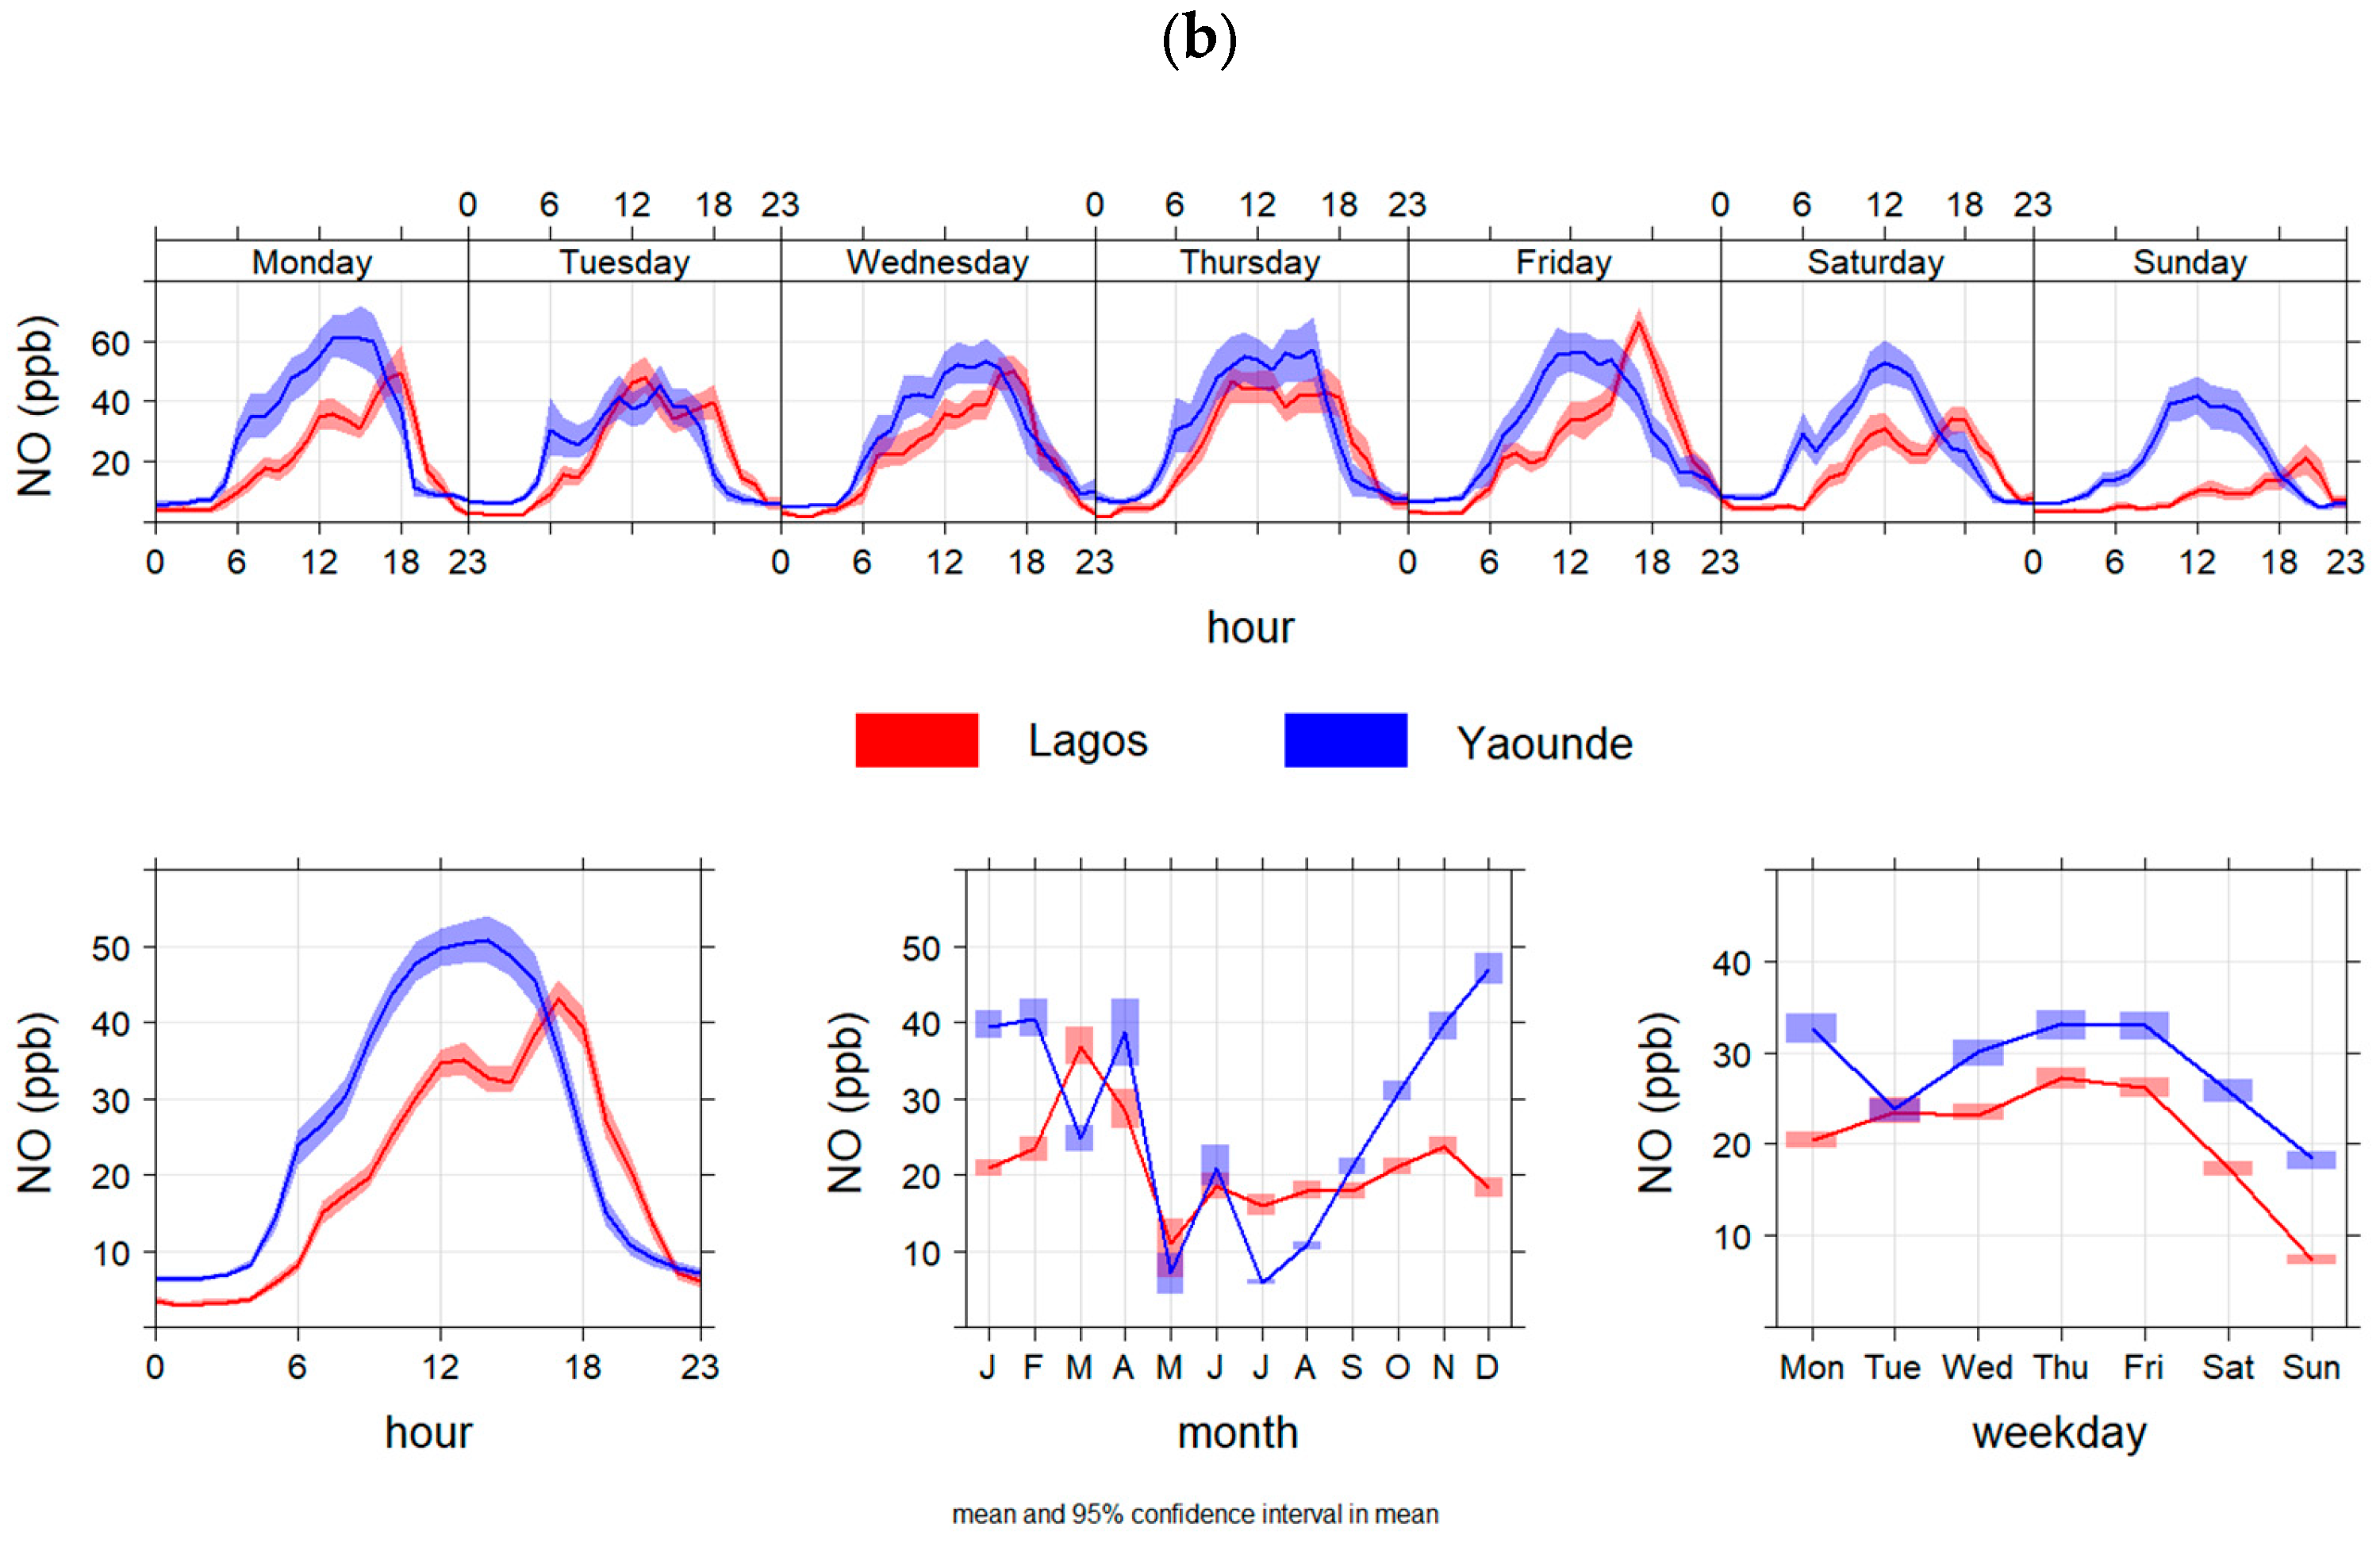
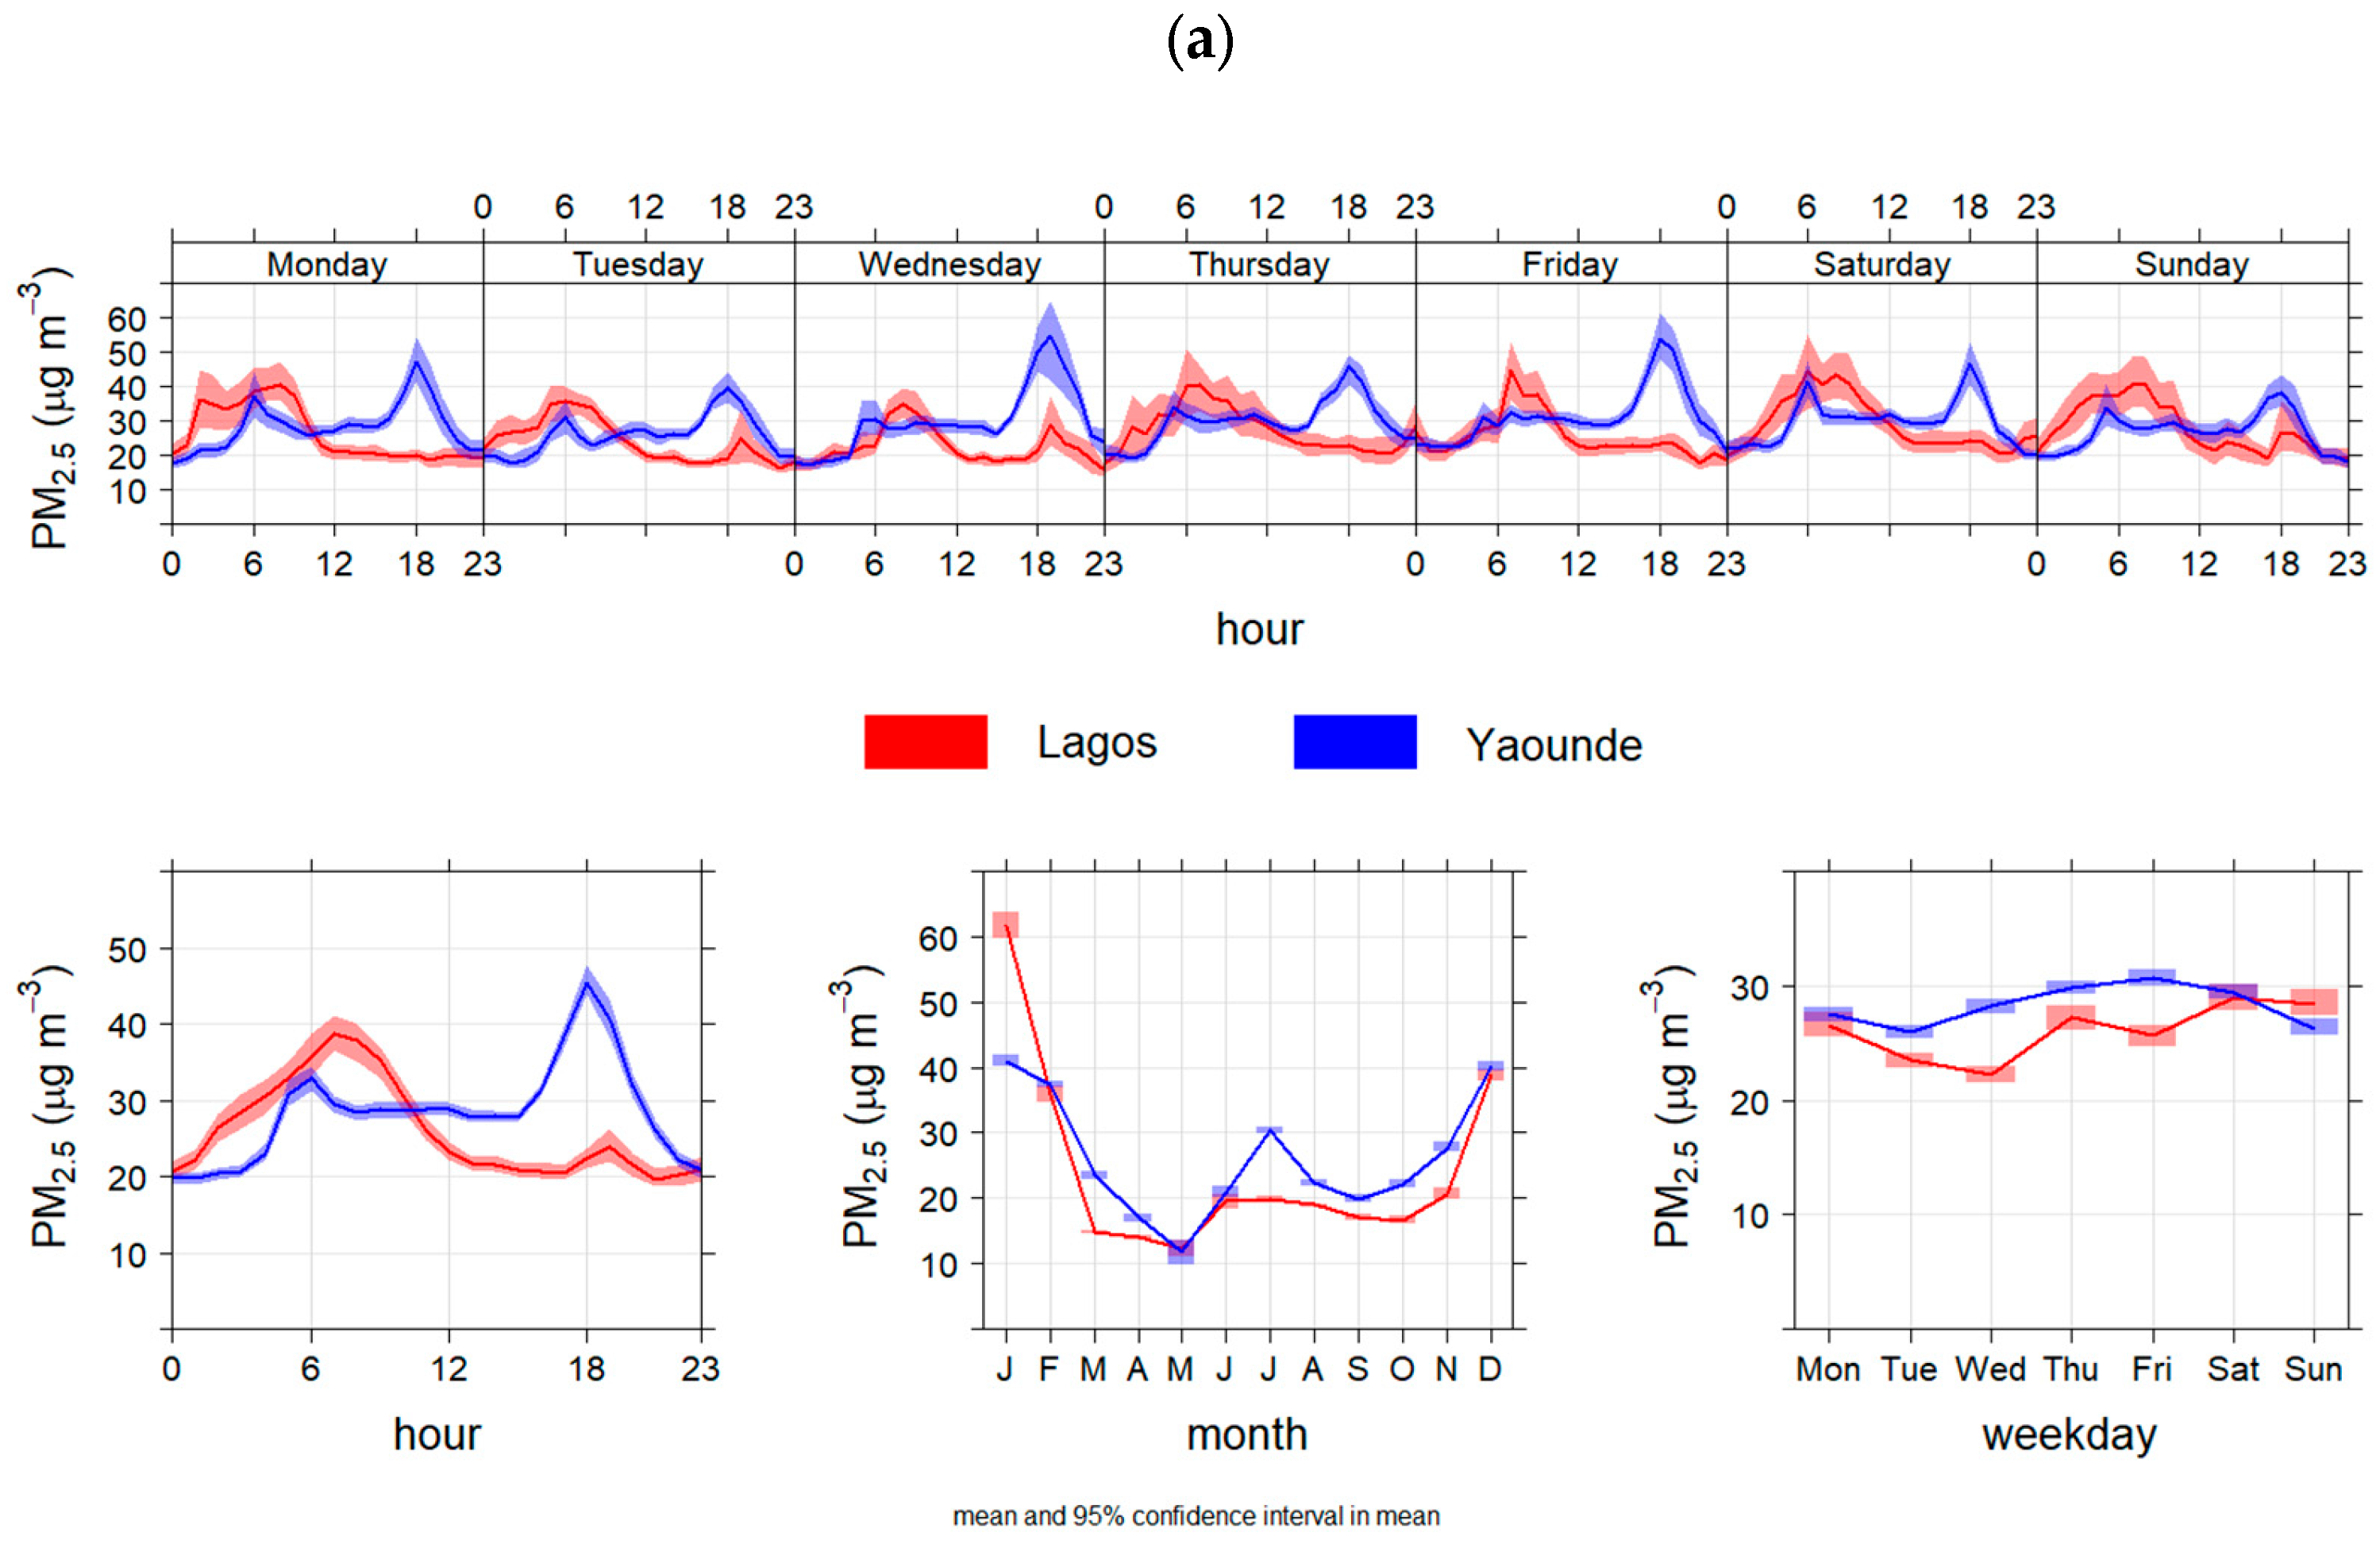
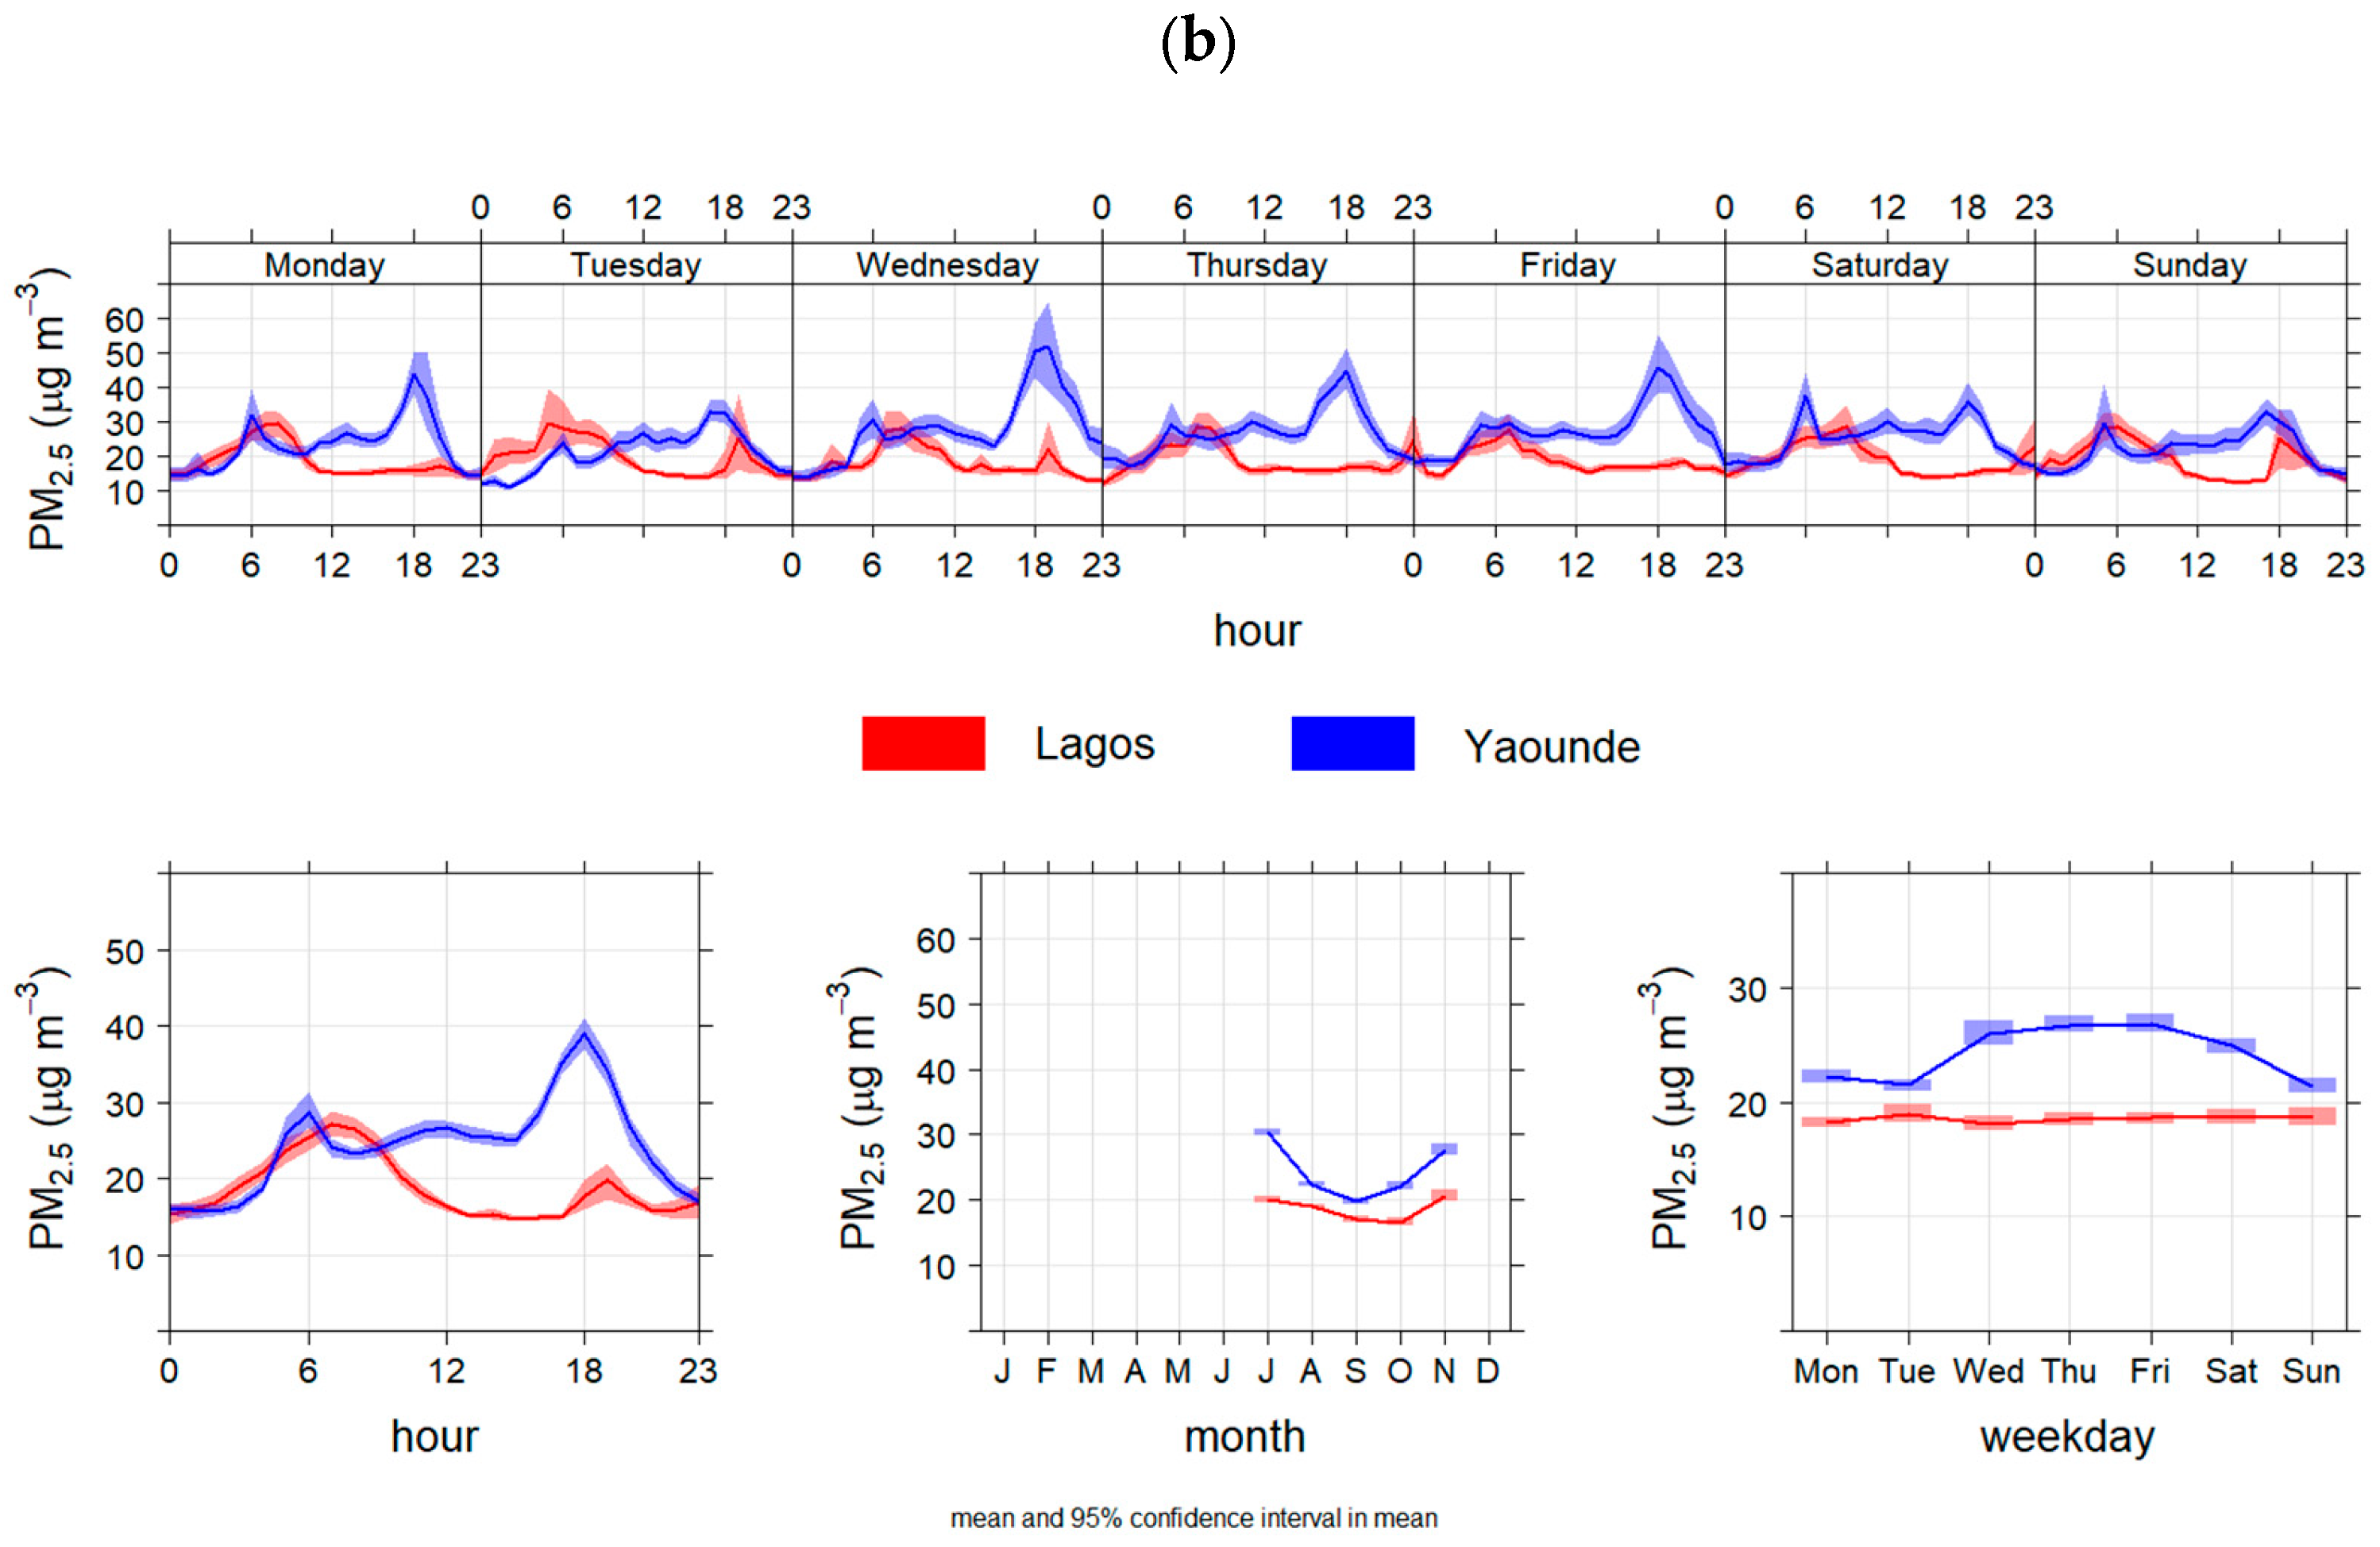
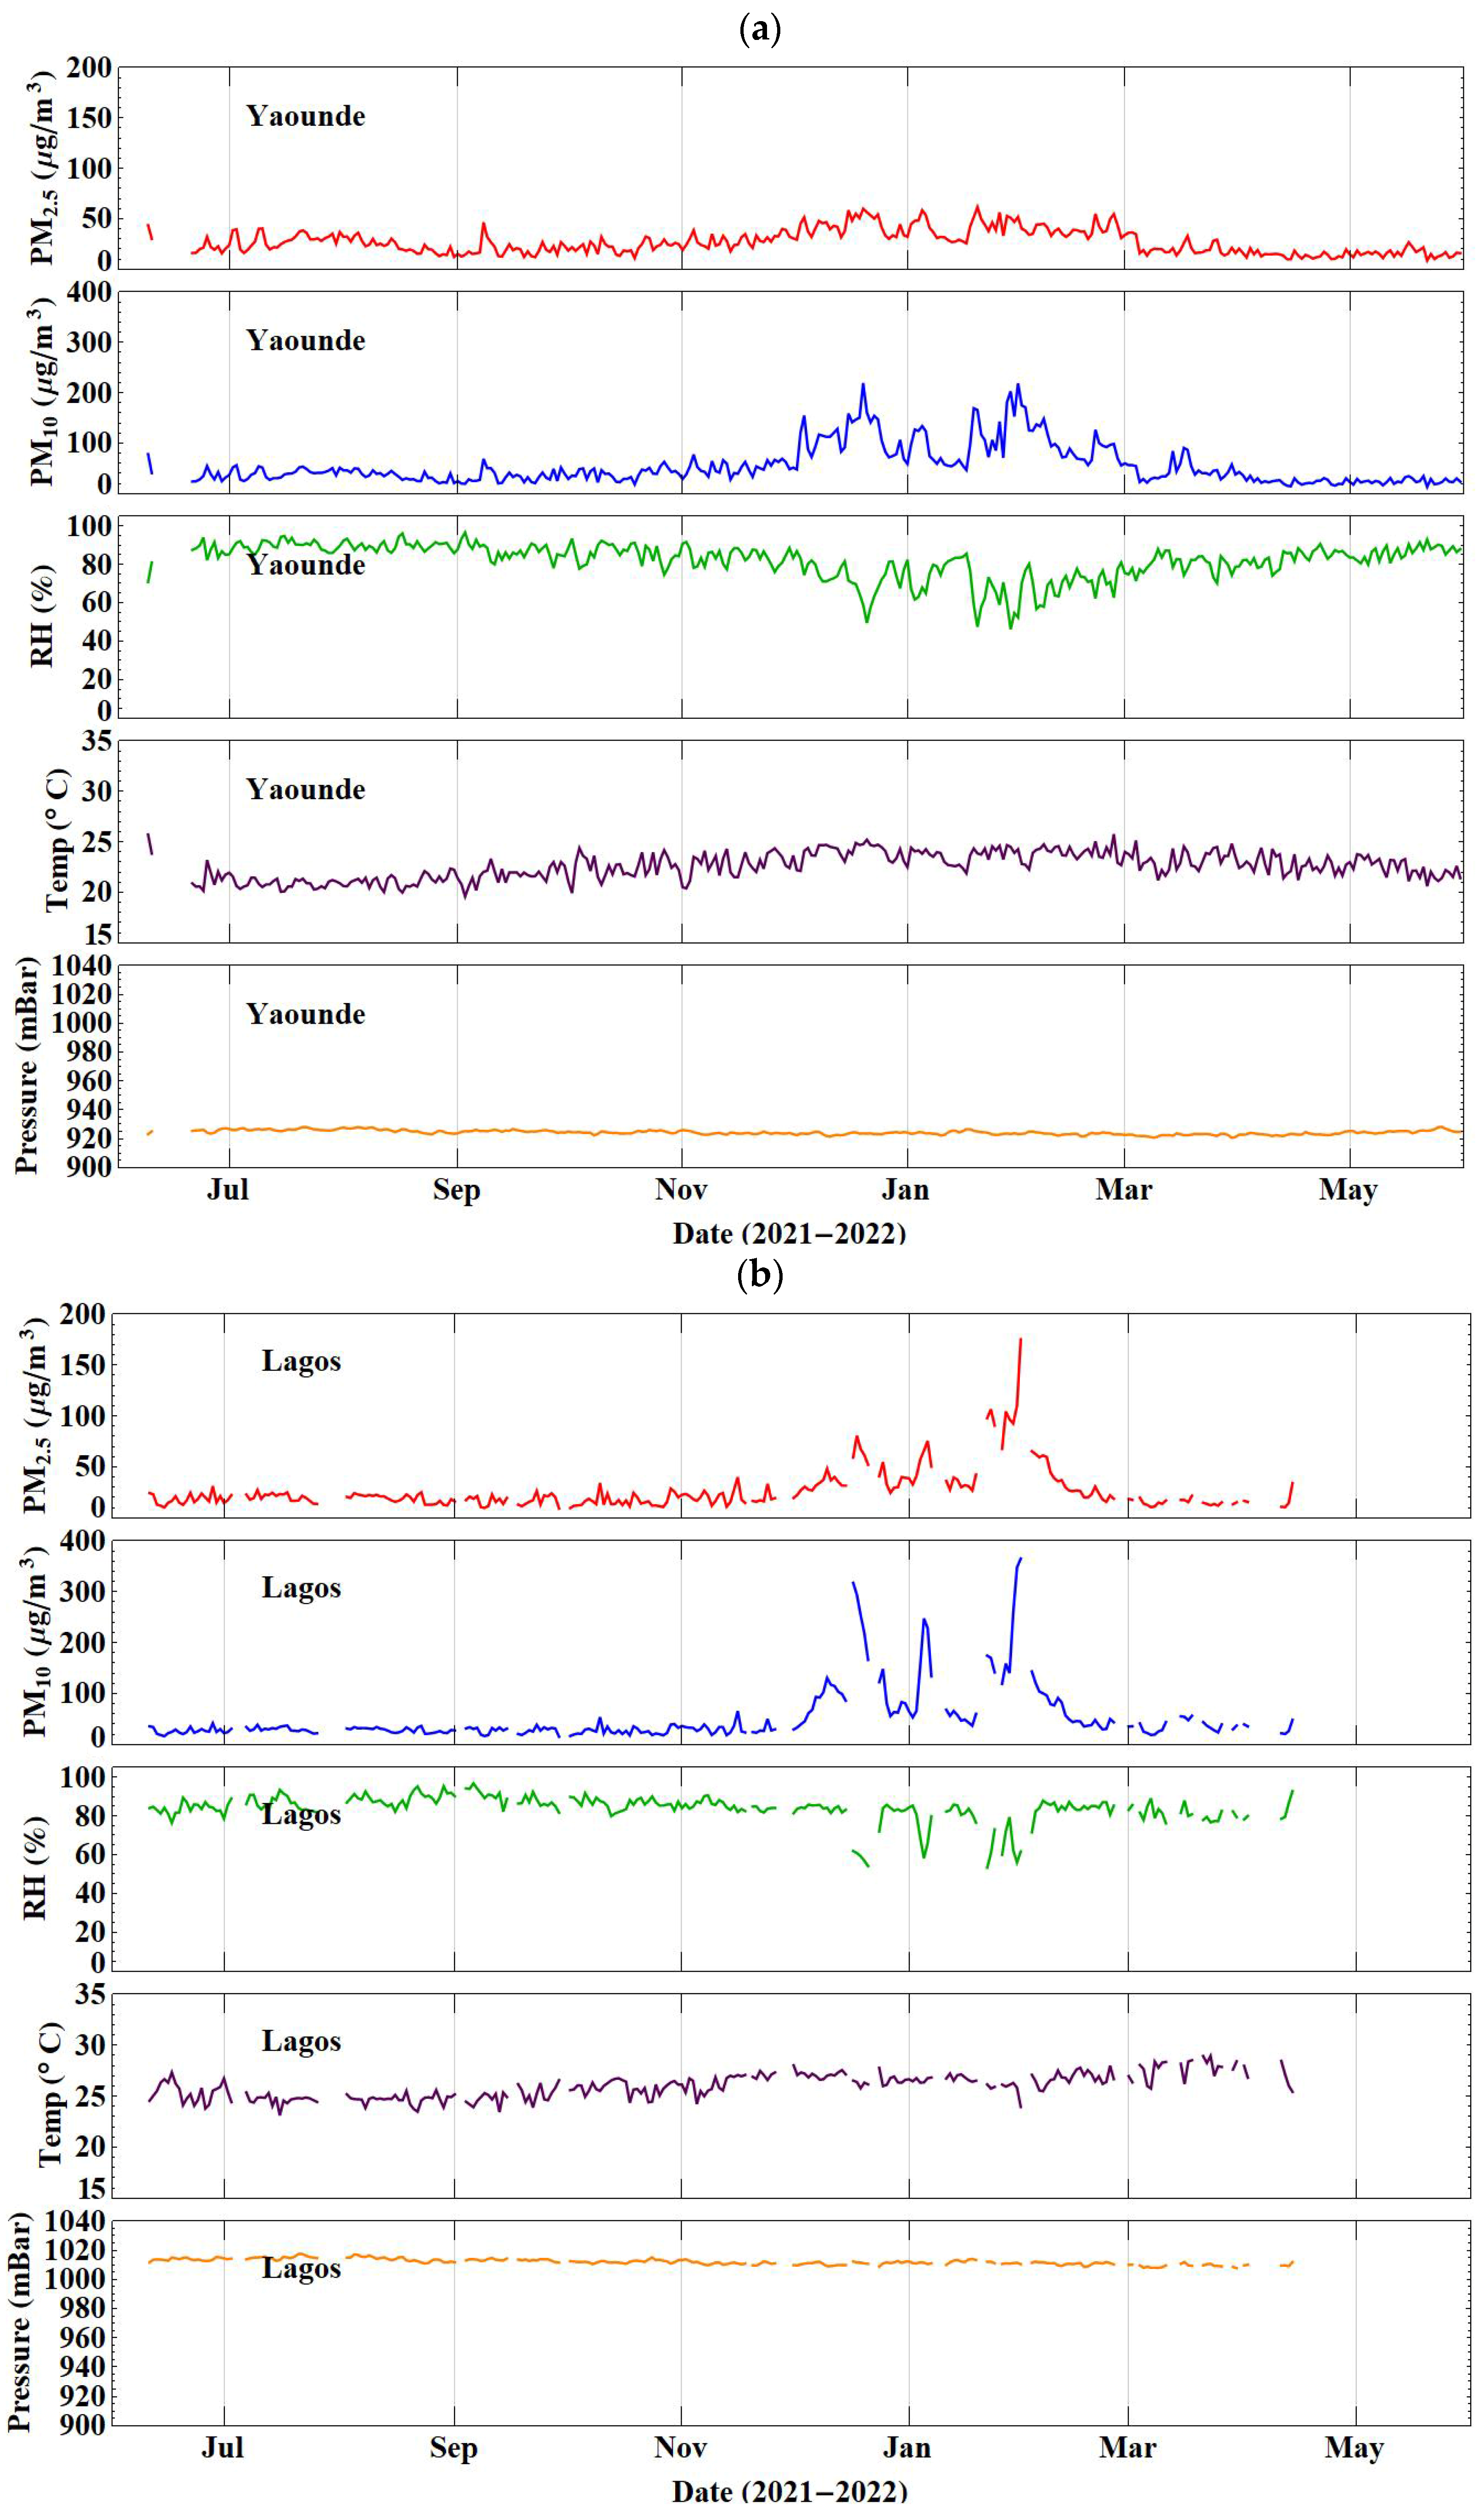
3.1. Gaseous and Particulate Observations in Lagos and Yaoundé

The average data capture between MM-F, Yaoundé and AW-VI, Lagos over the study period (June 2021 to 31 May 2022) were approximately 90 and 50%, respectively. Levels of gaseous parameters in both locations were influenced by local emissions and the meteorology. With the exception of NO and CO2, the magnitude of the observations in Yaoundé were generally higher than those observed in Lagos throughout the measurement period (Figure 6 and Figure S4). A significant drop was observed in combustion-related pollutants (CO, NO, NO2) in Yaoundé between late July and early September, coinciding with the onset of the second wet season (Figure 1). Prolonged precipitation events can affect pollution levels due to (a) wet deposition of pollutants (washout), and (b) reduction in local emissions due to decrease in outdoor activities. A similar effect was also observed, albeit over a short period (days), during the dry season in Yaoundé. The sudden drop in pollution levels in January (11–17 January 2022) was due to intense rainfall during the period. Trends in particulate matter (PM2.5 and PM10) observations were similar between the two locations, with lower levels recorded during the wet seasons compared to the significantly higher readings in the dry seasons, noticeably between December 2022 and February 2023 when there was substantial enhancement in the PM background level. This also coincided with a drop in the relative humidity (RH) levels at both locations (Figure 7 and Figure S5), likely linked to the influence of the Harmattan haze, the dry and dusty north-easterly trade wind which blows from the Sahara over West Africa.
A summary of the statistics of the measured parameters at the two locations for the duration of the deployment is presented in Table S1. The average concentrations of PM2.5 and PM10 recorded at the two locations were similar; the main difference in PM statistics was captured in the standard deviation, a measure of the variabilities in local emissions (MM-F, Yaoundé ~3.5 times the value of AW-VI, Lagos). This was expected given the varied local emission sources noted at the two sites (see Section 2.5). Much of the PM average statistics was driven by the high pollution events associated with the Harmattan haze (more details in Section 3.4). The annual mean PM2.5 from our study (26 µg/m3) was close to the lower end of the annual concentration range (30–97 µg/m3) reported in a similar study carried out in Lagos [30]. The lowest annual concentration in the World Bank study was observed at a coastal site, which is very similar to the coastal site (AW-VI, Lagos) in our study. The average NO mixing ratio was similar between the sites (~22 ppb) with both locations also showing comparable standard deviations. The mean NO2 recorded in Yaoundé was about 1.5 times lower than the observed value (41 ppb) in Lagos. In contrast, the mean CO mixing ratio in Yaoundé was approximately twice that observed in Lagos. All these can be related to the characteristics of the study site as previously discussed. We observed a similar average CO2 mixing ratio at the two locations (428 ppm) which was above the 2022 global surface average of 417.06 ppm [31].

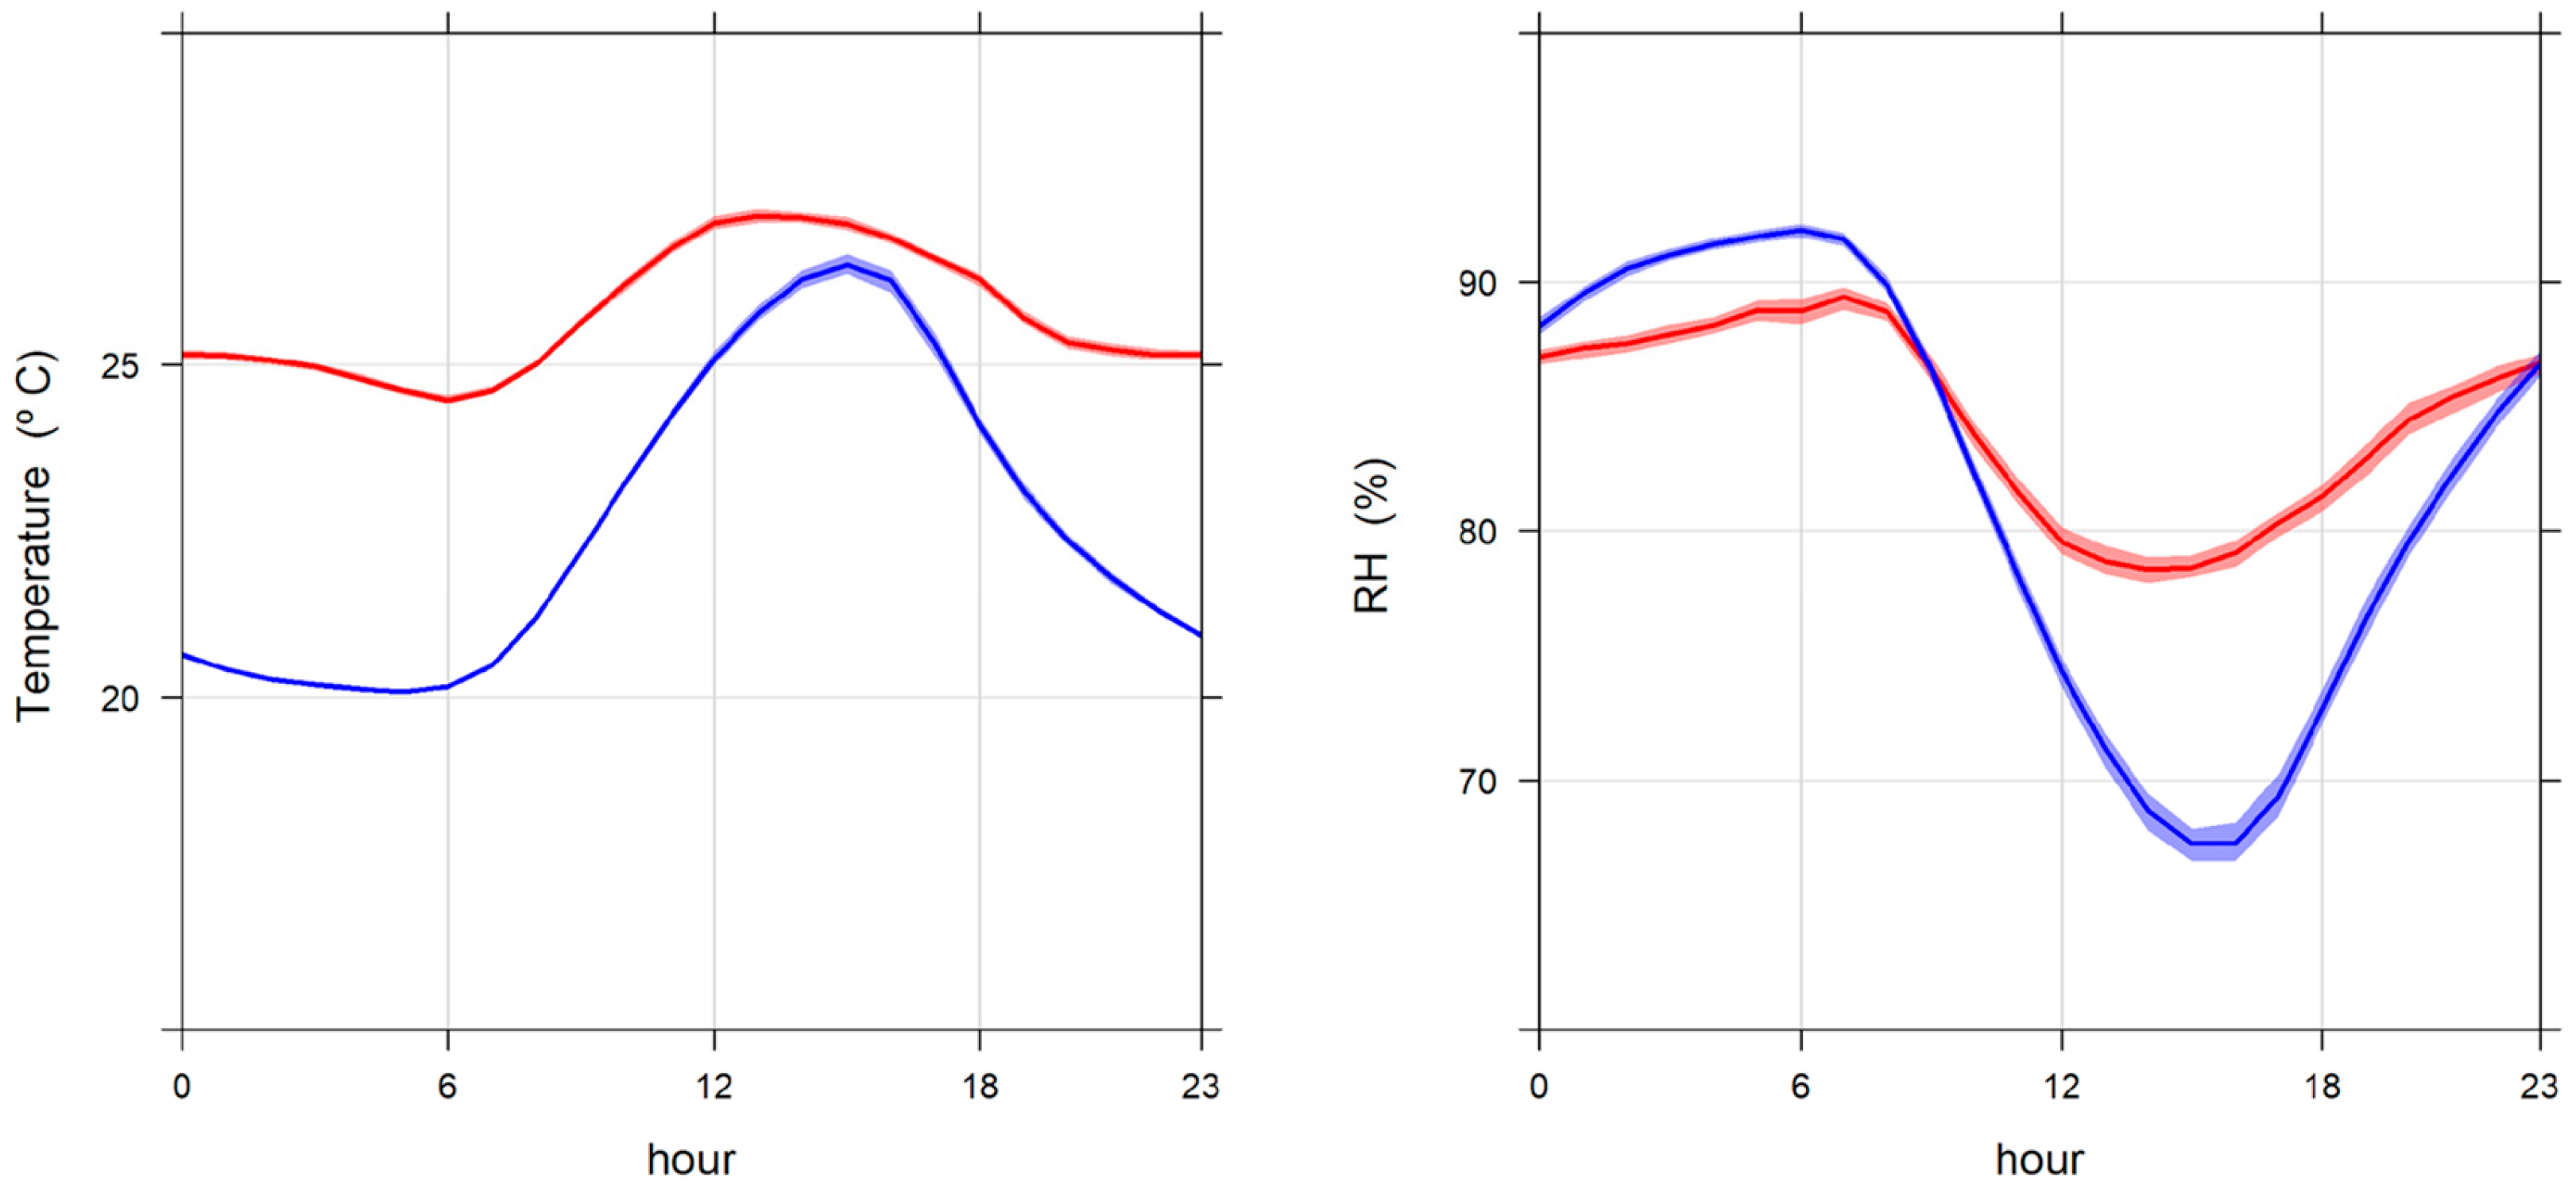
3.2. Meteorological Observations in Lagos and Yaoundé

The pressure readings in Lagos were relatively higher than Yaoundé. This was expected because the latter is situated at significantly higher altitude. These relative pressure observations can be described by using the hydrostatic relationship, represented by equation 1 for two altitudes, which predicts a mean pressure for Yaoundé of 936 mBar, within 1% of the pressure recorded (924 mBar).
P Y a o u n d e = P L a g o s e x p [ Z Y a o u n d e Z L a g o s H ]
where P represents the pressure (mean pressure for Lagos, PLagos = 1012 mBar), H is the scale height (assumed to be 8800 m for 300 K), Z are the altitudes in metres of the locations.
Although the average RH readings at both locations were similar (see Table S1~84%) during the measurement period, the diel profile was remarkably different. The night–day RH range was larger in Yaoundé (68–92%) compared to Lagos (78–90%), an indication of the larger temperature range observed in the former (20–27 °C), as shown in Figure 8. These observations are expected for the city of Yaoundé, situated at relatively higher altitude and therefore expected to experience much colder nights compared to coastal Lagos (Figure 1). The summary statistics (Table S1) show that Lagos was on average 4 °C warmer than Yaoundé even though the two sites have similar average RH values. This could be partly because the relatively higher night-time RH values observed in Yaoundé are being compensated for by the relatively lower daytime values when compared to the profiles observed in Lagos (Figure 8). An additional reason could be the impact of the Harmattan haze period when the RH readings were very similar at the two locations (Figure S2). As expected, the average pressure reading in Yaoundé on average was ~90 mBar lower than Lagos.

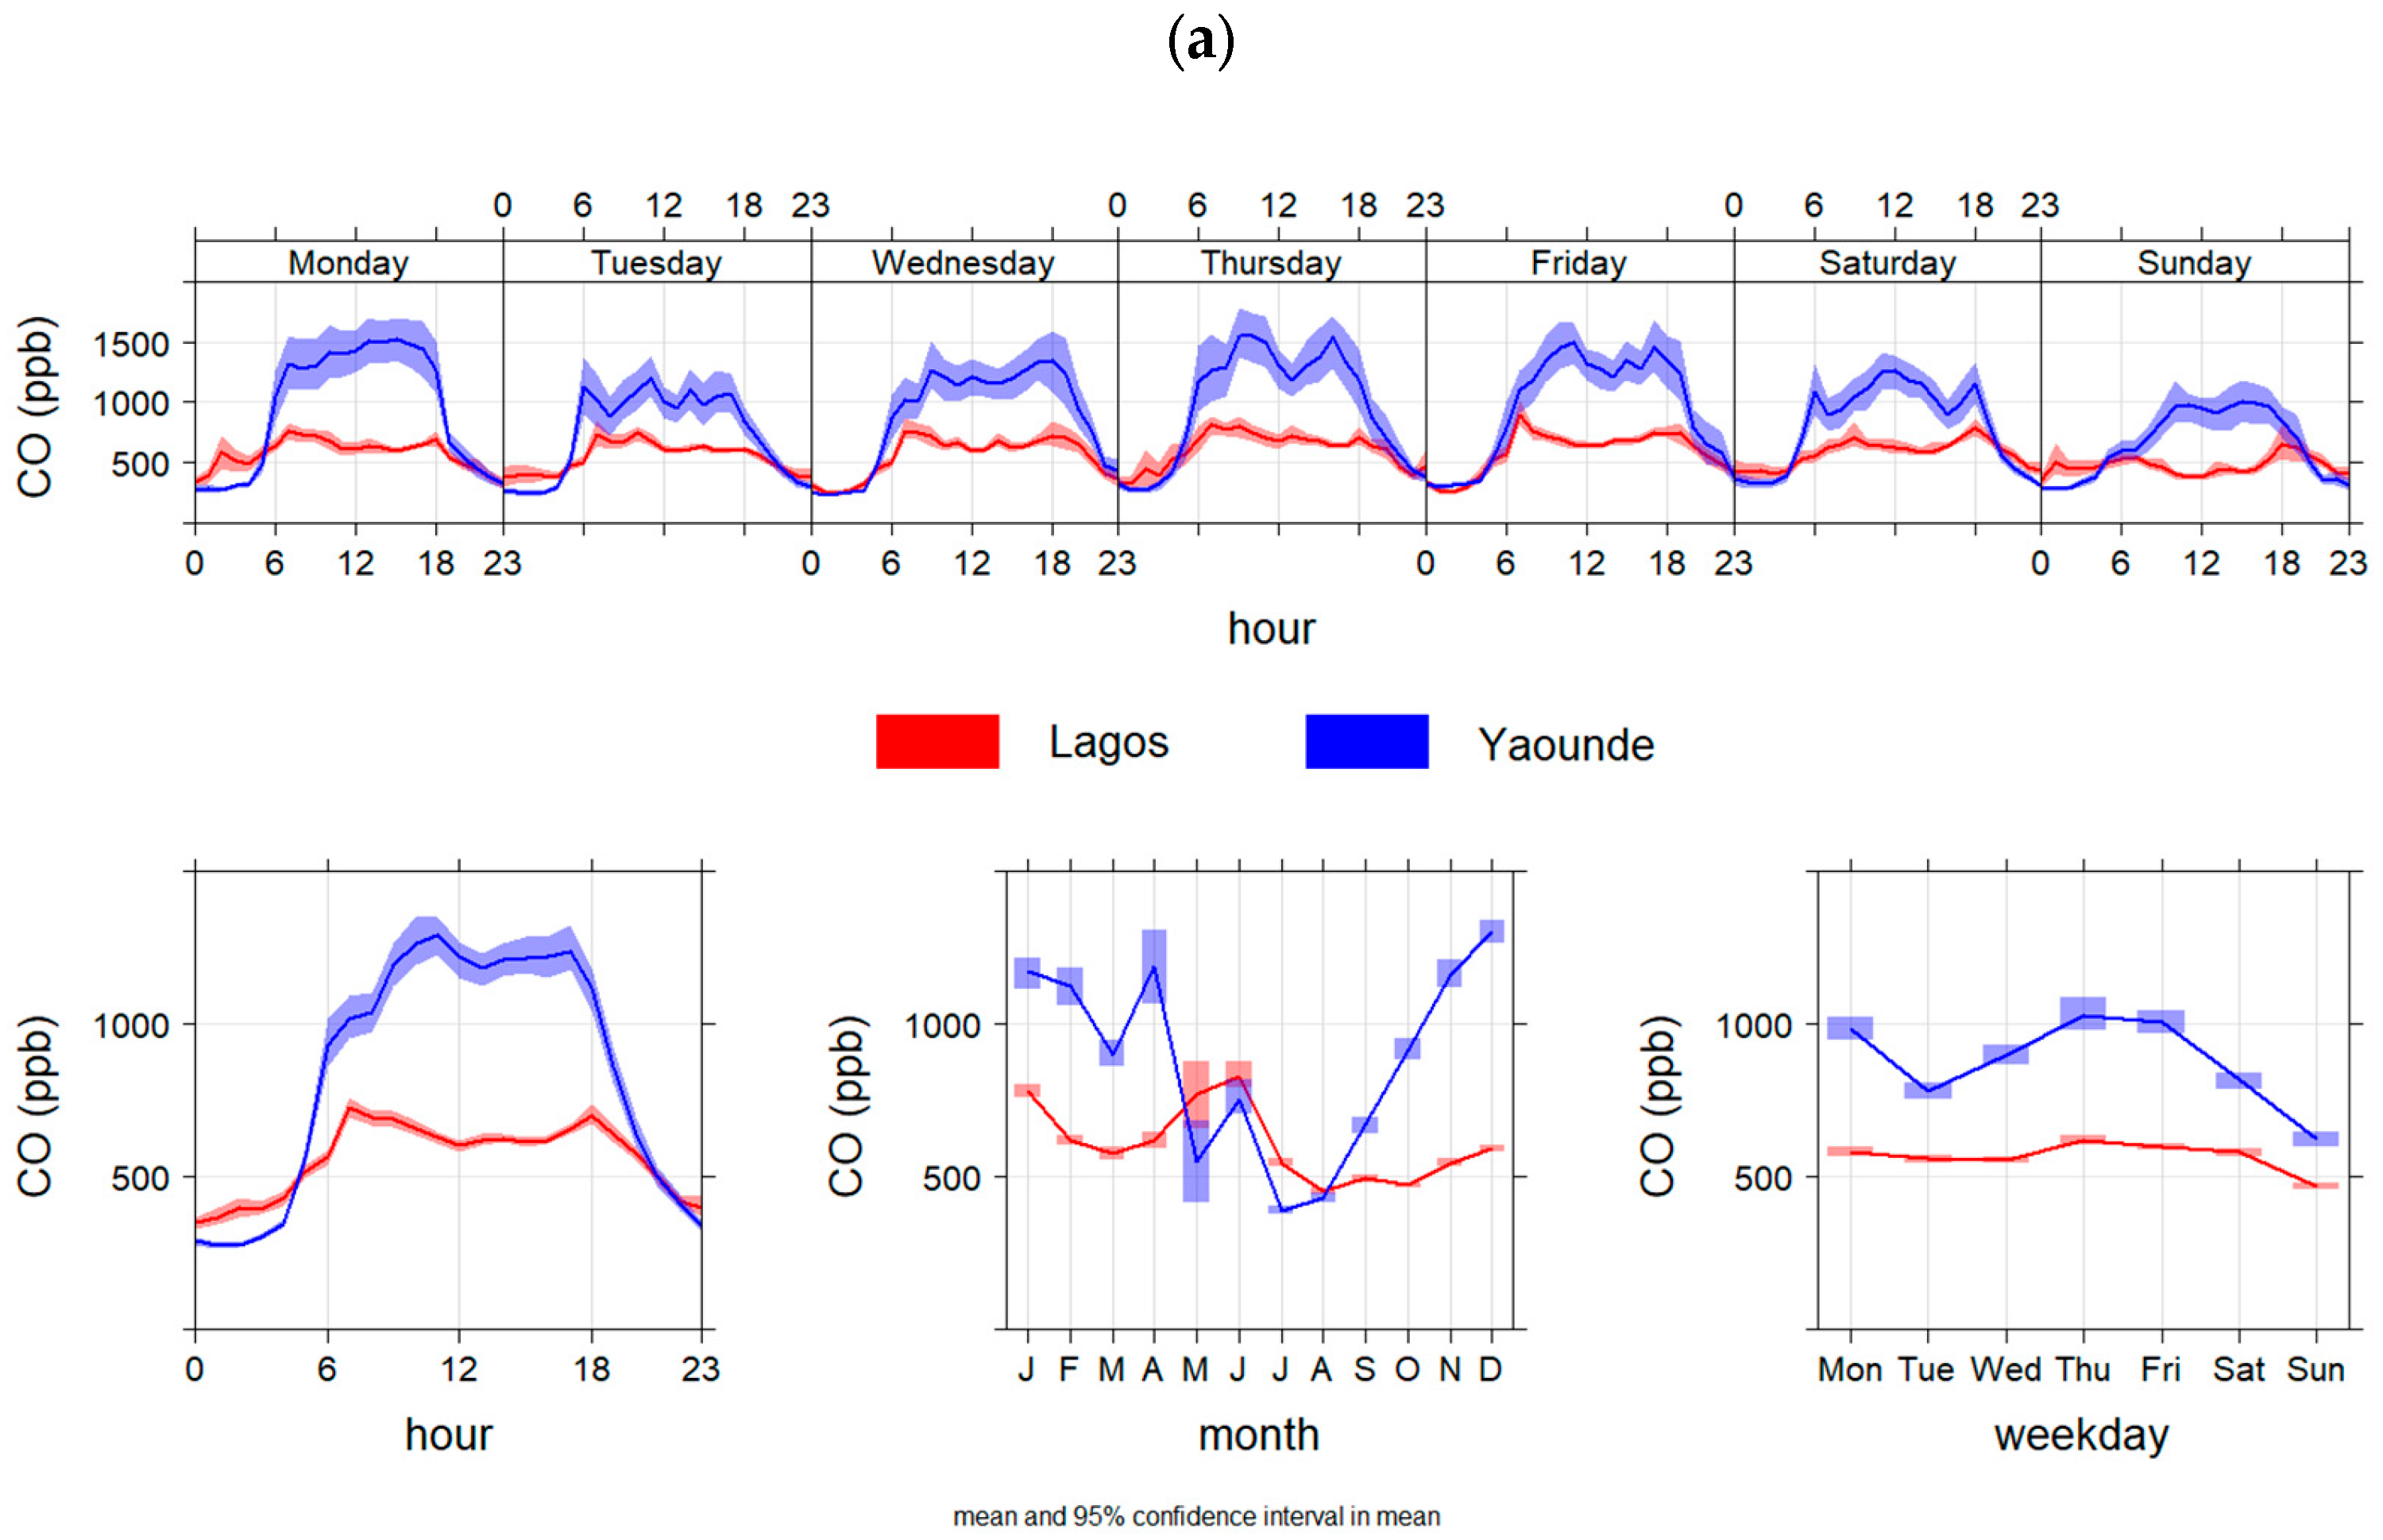
3.3. Temporal Comparison of Gaseous and Particulate Observations in Yaoundé

We compared the temporal trends in both cities to gain insights into the potential drivers for the pollutants’ profiles observed during our study. We only considered periods where there was data at both sites for this comparison to avoid bias.

Temporal Trend Analysis

A comparison of the temporal trend at the two sites shows that the CO at the Yaoundé site was relatively higher than the Lagos site (mean value 873 ppb compared to 564 ppb). The pattern was similar for NO although the difference was not as marked (28 ppb relative to 21 ppb), as shown in Figure 9. The emission profiles were unique to the two sites even though both study locations can be characterised as mixed-use urban environments. A distinct morning and evening road-traffic rush-hour signal was detected in CO around 0600 and 1800 UTC (for about an hour) in Lagos but not for Yaoundé, where elevated levels were maintained from 0500 UTC until 2000 UTC. Experiential knowledge from the project team revealed that commercial activities at this site extend well into the night, unlike Lagos which is mainly dominated by traffic emissions which tail off towards the end of the day. The difference in magnitude can be explained by the composition of the vehicle fleets and volume of traffic in both locations. While surveying the installation site, it was observed that a larger volume of old vehicles were present on the road in the vicinity of the study location in Yaoundé compared to Lagos, and the study site was very close to a busy junction even though sampling was at a height of ~8 m compared to 2.8 m in Lagos.
Although the weekday NO measurements were similar at both locations (daytime peaks of 60 ppb), the main difference occurred at weekends. NO levels in Lagos were significantly lower than Yaoundé, particularly on Sundays, while the mean concentration in Lagos was less than 10 ppb and dominated by night-time emissions likely linked to residential emissions. Monthly averages showed reduced levels during the wet seasons at both locations. Unlike the gas species, the mean PM2.5 concentrations during the measurement period (June 2021 to May 2022) were very similar, 26 µg/m3 (Lagos) and 28 µg/m3 (Yaoundé) as presented in Figure 10. The main reason for this is the contribution associated with the long-range transport of PM during the dry season due to the Harmattan haze episode (accompanied by a drop in RH and an increase in the day–night range, see Figure S2). Excluding the haze-related observations (Figure 10b), we noted that PM2.5 levels in Yaoundé (24 µg/m3) were slightly higher than Lagos (19 µg/m3). The PM2.5 diel profiles differed at the two locations. Levels tended to peak in the early hours in Lagos, possibly due to a mixture of local emissions and the evolution of the nocturnal boundary layer, unlike Yaoundé where the early morning profile was similar to Lagos but with a unique night-time maximum around 1800 UTC. Unlike gaseous pollutants, obvious weekday–weekend distinctions in PM levels were not observed, indicating that the PM might be dominated by sources that were non-local, for instance transboundary pollution events.

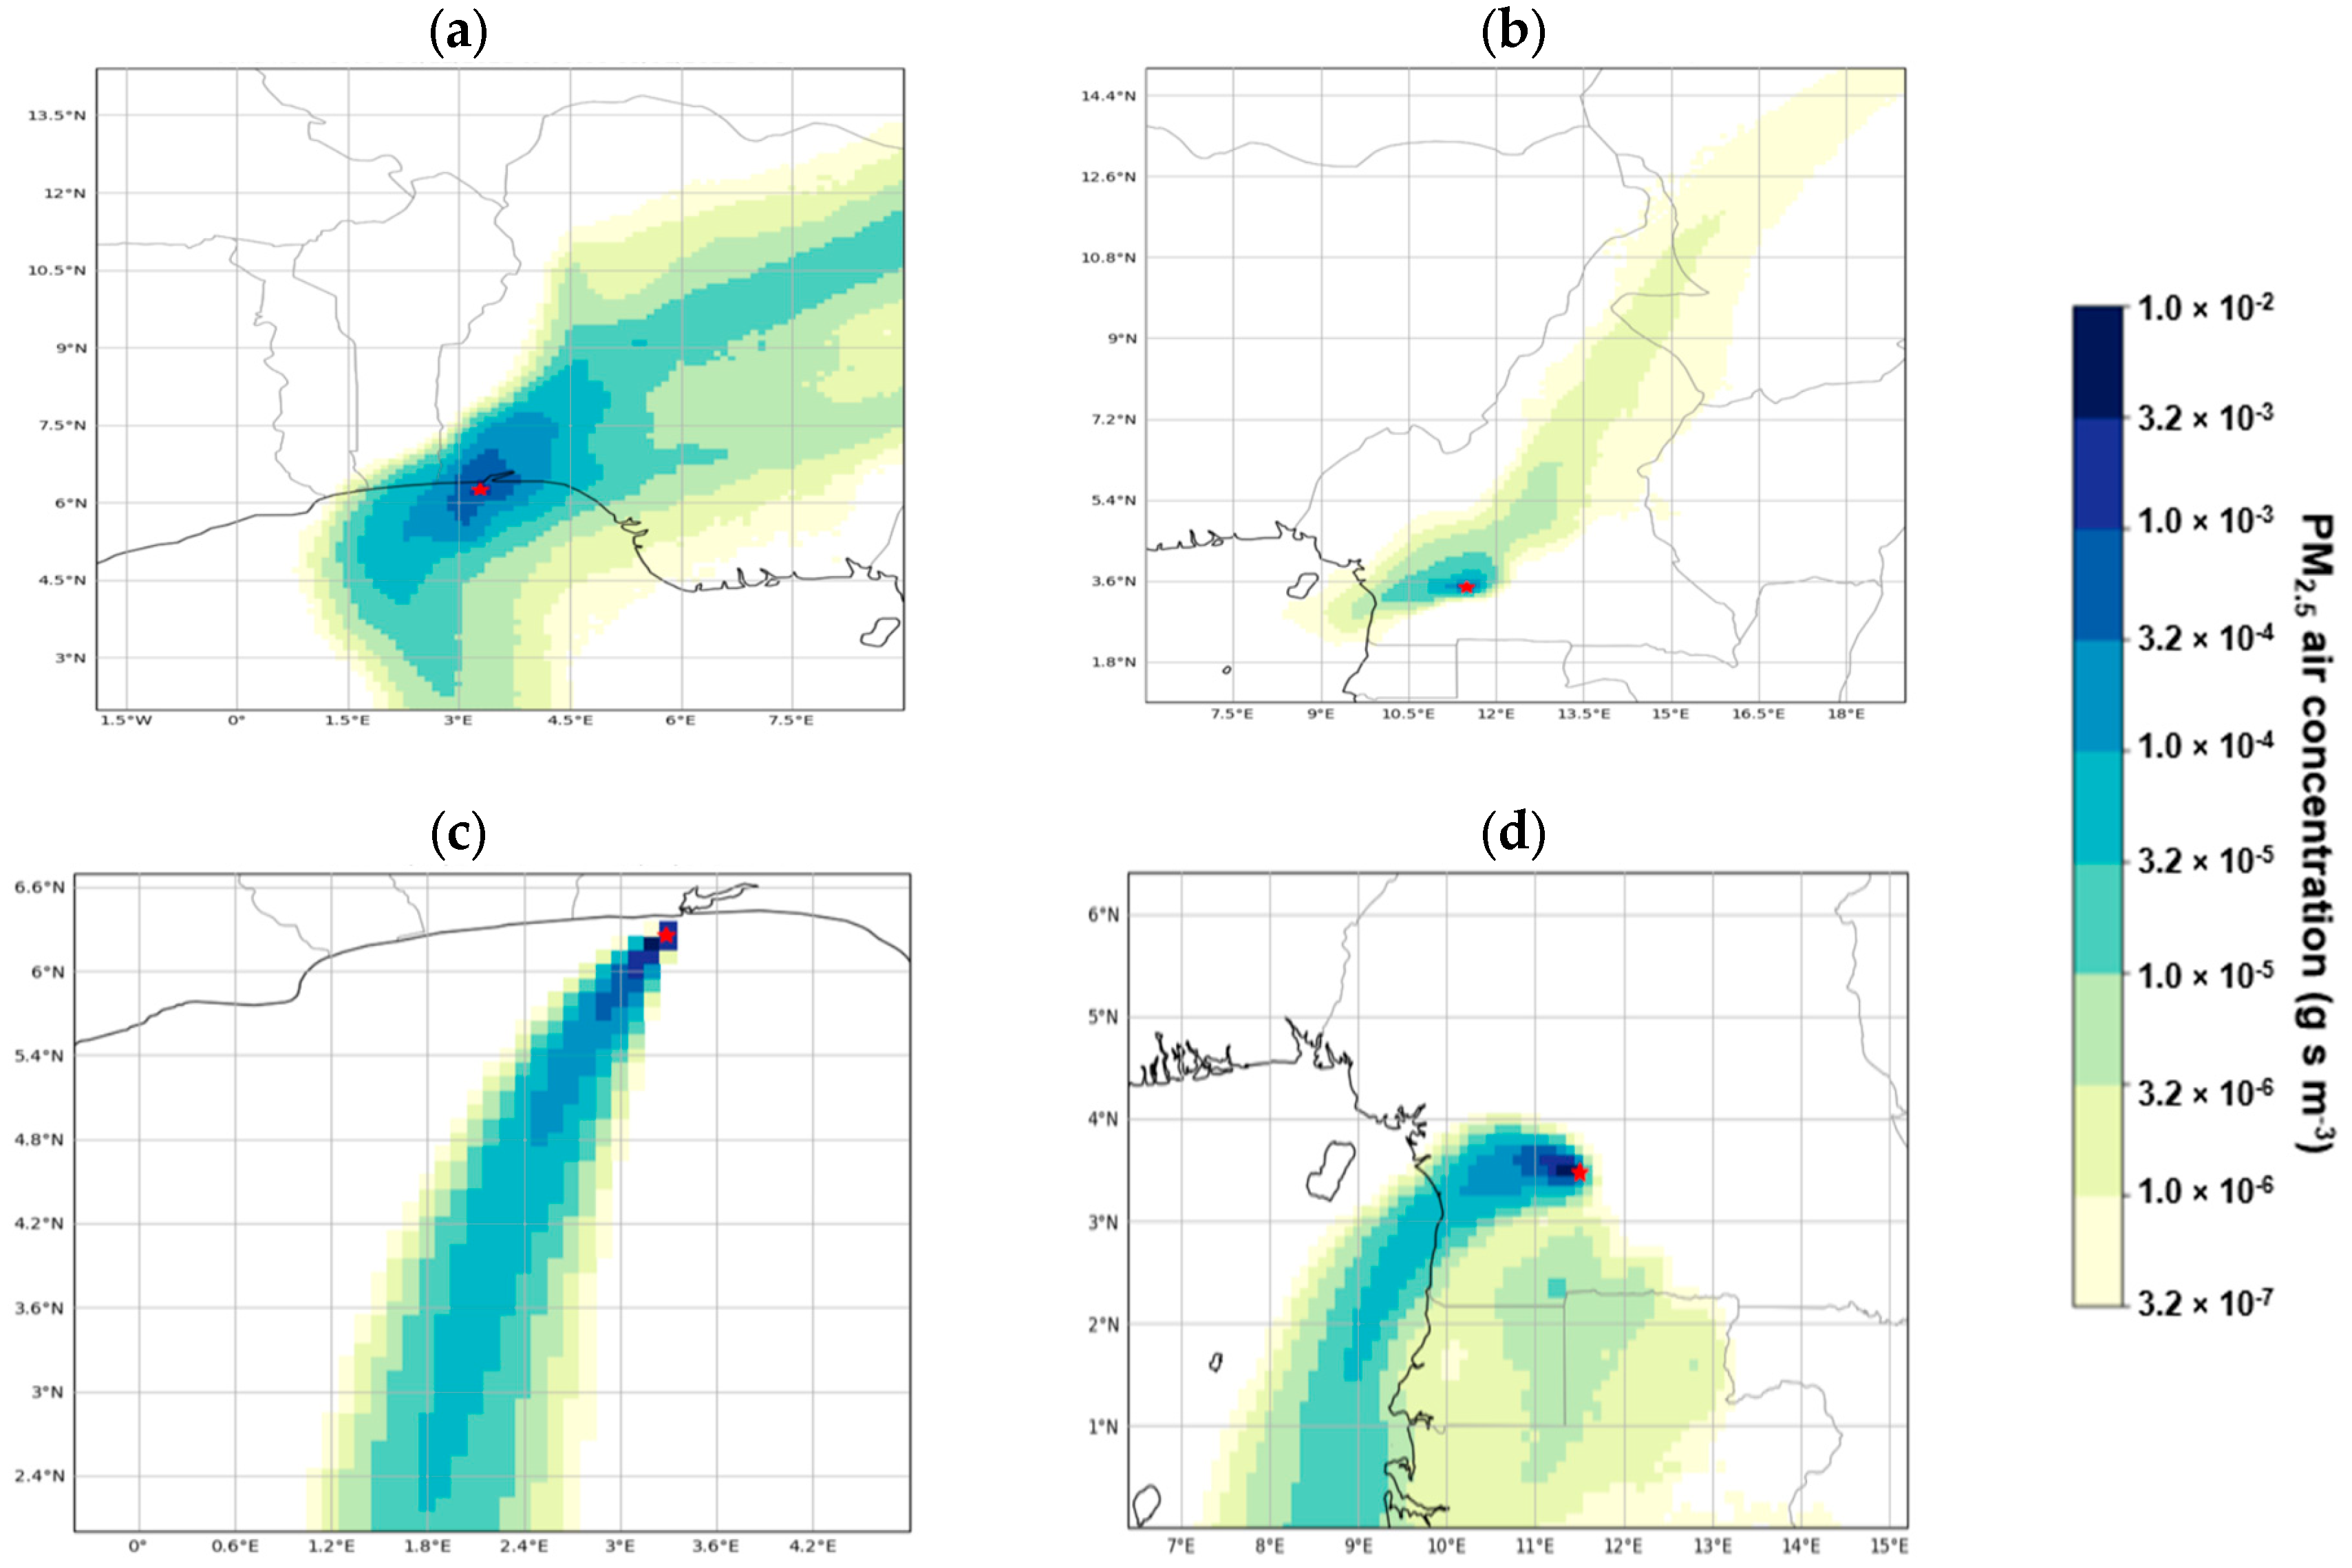
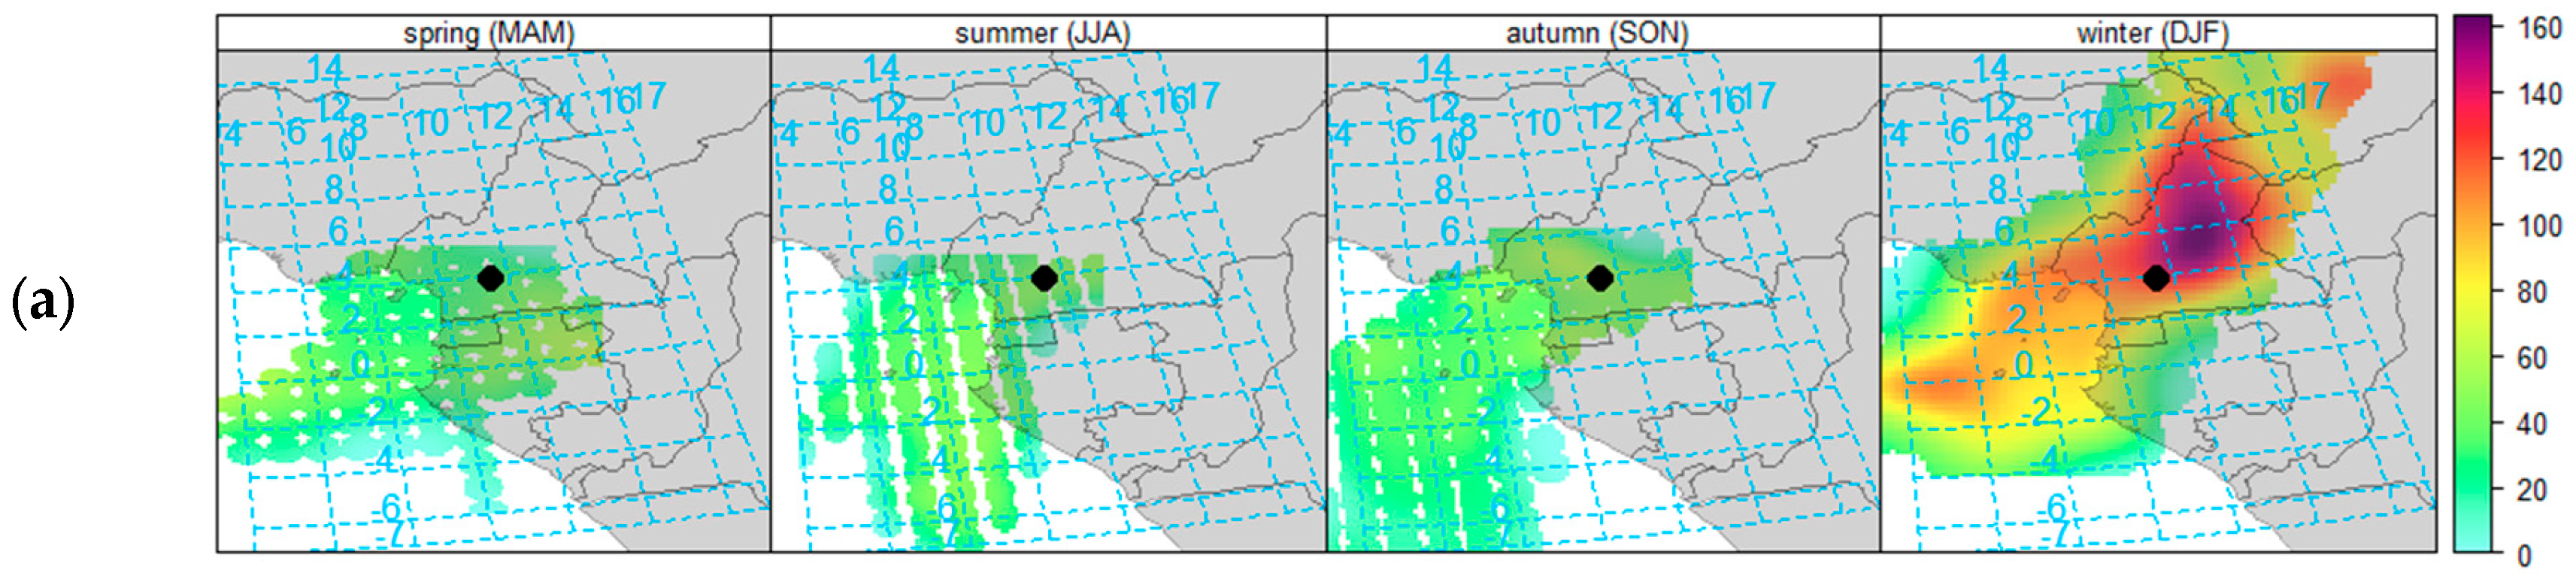
3.4. Impact of Meteorology on PM Observation

The observed long-term PM concentrations at the two locations were impacted by changes in meteorological conditions particularly related to the Harmattan haze. By comparison, south and southwest sea breezes dominate the long-range transport at other times of the year. Figure 11 shows the back trajectory plotted as a smooth average of PM10 mass concentration presented as quarterly groups starting in March 2021 for both locations. Elevated PM levels were observed between December 2021 and February 2022 (December, January, February = DJF) when the air mass originated from the north-easterly region. The similar origin of the air mass is consistent with the similarities in the RH diel profiles between the two locations which tended to differ significantly outside of non-haze events (Figure S2). This interpretation also agrees with diary logs for the ambient conditions recorded by researchers during this period, which were described generally as foggy and hazy for both locations.
To further verify the impact and origin of the high PM episodes, we ran a back trajectory model using the NAME model [29]. Two dates were chosen for the model run: (I) 4 January 2022, when we noticed elevated PM values, and (II) 9 July 2021, when the PM concentrations were less impacted by long-range transport. The results for the runs for the January at both locations showed (Figure 12a,b) that the history of the air over the past 6 days extended through the northeast of both countries, traversing the Sahel regions and would have been impacted by the natural mineral dusts. In contrast, on typical no-haze days, (Figure 12c,d), the air originates from the coast travelling across the Gulf of Guinea predominantly from south and southwest of the locations. Both the CWT and the NAME back trajectory runs showed evidence of long-range transport importing the local PM, leading to high PM concentrations. Although only two models are presented here, previous studies [32] have shown that the three widely used Lagrangian particle-dispersion models (LPDM) including hybrid single-particle Lagrangian integrated trajectory (HYSPLIT), stochastic time-inverted Lagrangian transport (STILT) and flexible particle (FLEXPART) have comparative performances, and we expect the results from these other models will be similar when applied to our study locations.
These elevated PM episodes in these regions of the continent are consistent with the atmospheric phenomenon, the Harmattan haze, when dust-dominated particles originating from the Sahara desert are blown across the western coast of the continent. Although the air trajectory is, over 90% of the time, from the coast during our study (Figure S3), the smaller fraction of time when it switches to a northeast long-range transport is significant enough to impact the mean daily exposure, as presented in Figure 13.
If one were to exclude the Harmattan-haze period (shaded region in Figure 13), the daily PM2.5 measurement was generally below the 2015 WHO guidelines (25 µg/m3) at AW-VI, Lagos and MM-F, Yaoundé. However, both locations would exceed the 2021 WHO guideline of 15 µg/m3 if this standard is used. In contrast, observed daily PM10 levels were generally above the guidelines at both study locations even if the haze periods were excluded. PM10 levels only get close to the 2015 guidelines during the wet season. Our study shows that the haze episode resulted in PM loading that was more than five times the recommended exposure levels based on the WHO 2021 guidelines. This is of particular interest for policy implementation because the elevated levels of PM during these episodes are driven by natural emissions. Whilst the mass PM loading during the haze episodes was significantly high, they may not necessarily be as toxic as the local emissions (which can sometimes be dominated by heavy metals [30]) because the particles associated with the haze episodes are mostly composed of mineral dust. However, such high levels can still cause severe irritation of the respiratory system, particularly in vulnerable groups, and can also worsen conditions for individuals with underlying ailments such as asthma. The daily mean PM2.5 and PM10 levels from our study both fell within the range of daily average concentrations reported in other studies in Sub-Saharan Africa which ranged between 21–49.4 µg/m3 for PM2.5 and 49–534.7 µg/m3. Note that most of these studies are for locations with different characteristics and generally a shorter monitoring duration [18,19]. In addition, most of the study period did not necessarily fall within the Harmattan haze which we found contributed significantly to the high daily concentrations recorded in our study.

3.5. Implications of Observations on Leisure-Time Physical Activity

The appropriation of public spaces for leisure-time physical activity is one of the ways city dwellers can keep fit and improve their wellbeing. In doing this, they may try to avoid obvious visible dangers and safety issues. However, the lack of awareness of the negative impact of air pollution could negate the benefits of engaging in leisure-time physical activity. Our temporal analysis of long-term observations at two typical outdoor locations in Lagos and Yaoundé suggests that careful consideration of the time of day, day of the week and the time of year for partaking in exercise would reduce exposure risk. Weekends and periods outside the rush hour on most days tended to have the best air quality in both cities and so would be most conducive to physical activity. A significant reduction in ambient pollution is associated with the wet season, so utilising sheltered outdoor spaces during this period would also maximise the health benefits of exercise. The Harmattan period poses a conundrum for public health, with conflict between the consistency of public health messaging that encourages physical activity and minimising harm from air pollution exposure when PM levels are highest. This would require evidence-informed public health interventions with tailored messaging for different population groups. For example, early warning systems to encourage indoor physical activity, notifying the most vulnerable to avoid exercising outdoors when PM levels are over a particular threshold and to use PM nose masks if they need to go outdoors. Beyond messaging, urban design interventions could be explored to increase green infrastructure including encouraging non-motorised transport to improve air quality and safer exercise routes, as well as providing more accessible and free spaces for physical activity indoors when air pollution is highest. This evidence is also critical to drive increased demand for action on air pollution. Our findings also suggest stronger regulations are needed in both cities to reduce emissions from vehicles.

3.6. Strengths and Limitations

This study extends the research providing long-term air quality data in Sub-Saharan Africa and it is one of the first studies with multiple air pollutant measurements in Yaoundé. It should be noted that the air quality observations in this study were limited to a single site in both cities. However, it nonetheless generated extended air quality data that were used as evidence to engage relevant stakeholders and create community awareness of the importance of air pollution measurement in both cities. Another caveat to this study was low data capture at one of the locations (Lagos) due to frequent power failures, although we accounted for this in our inter-site comparisons. This experience highlights the importance of using devices that are tailored to a given context; in this case, the need for devices that can be powered by solar energy to reduce data loss.

4. Conclusions

We present observations of air pollution in two major African cities (Lagos, Nigeria and Yaoundé, Cameroon) over a 12-month period. We explored the effect of meteorology, particularly long-range transport and the seasonal effect on pollution levels. While combustion-dominated pollutants are strongly influenced by local emissions, we noted that the average PM levels in our study period were dominated by haze events during the dry season. An analysis of the temporal profiles of the gaseous pollutants gave insights into the local drivers for the observations in both cities which varied in patterns from more sustained high pollution levels at the Yaoundé site to rush-hour patterns related to traffic emissions particularly on weekdays in Lagos. We explored the implications of our results on leisure-time physical activity in public spaces in both locations. Our findings highlight the importance of continuous air quality monitoring to inform public health messaging campaigns, shape urban design and protect health for all.

Supplementary Materials

The following supporting information can be downloaded at: https://www.mdpi.com/article/10.3390/atmos14111693/s1, Figure S1: Time series and scatter plots of NO, NO2, PM10, temperature and pressure for the two AQMesh nodes during the co-location trial at the urban background station in Cambridge, UK. Statistics shown inset in the time series are for S1 relative to S2; Figure S2: Diel profiles at AW-VI, Lagos and MM-F, Yaoundé for a 4-day period during haze and non-haze episodes; Figure S3. Map showing the 6-cluster solution to back trajectories for AW-VI, Lagos, Nigeria (pink bordered area) for the duration of the campaign (2021–2022). The number represents the percentage mean for each cluster relative to the overall trajectory. Figure S4. Time series of 15-min CO, NO, NO2, O3 and CO2 observation from June 2021 to May 2022. (a) MM-F, Yaoundé, Cameroon and (b) AW-VI, Lagos, Nigeria. Gaps in data are due to power outages at the sites. Figure S5. Time series of 15-min CO2, pressure, temperature and RH observation from May 2021 to May 2022. (a) MM-F, Yaoundé, Cameroon and (b) AW-VI, Lagos, Nigeria. Gaps in data are due to power outages at the sites. Table S1. Summary statistics of measured parameters for the entire duration (May 2021 to May 2022) of the deployment at AW-VI, Lagos, Nigeria and MM-F, Yaoundé, Cameroon.

Author Contributions

Conceptualisation, O.A.M.P. and T.O. (Tolu Oni) methodology, O.A.M.P. and R.A.; software, O.A.M.P.; validation, O.A.M.P. and R.A.; formal analysis, O.A.M.P. and R.A.; investigation, O.A.M.P., R.A., T.L., D.O., R.U., A.K.T., C.M.-T., N.B., V.A.O., F.A. and T.O. (Tolu Oni); resources, T.O. (Tolu Oni), T.L., R.A. and F.A.; data curation, O.A.M.P. and R.A.; writing—original draft preparation, O.A.M.P. and R.A.; writing—review and editing, O.A.M.P., R.A., T.L., F.A., D.O., R.U., T.O. (Toluwalope Ogunro), A.K.T., C.M.-T., N.B., V.A.O., T.O. (Tolu Oni), M.T. and R.L.J.; visualization, O.A.M.P.; supervision, T.O. (Tolu Oni), R.L.J., T.L. and F.A.; project administration, T.O. (Tolu Oni); funding acquisition, T.O. (Tolu Oni). All authors have read and agreed to the published version of the manuscript.

Funding

This research is funded by the British Academy Urban Infrastructures of Wellbeing Programme [Grant reference UWB190032] awarded to T.O. F.A., T.O and T.L. are in part funded by the National Institute for Health Research (NIHR) (16/137/34) using UK aid from the UK Government to support global health research. The views expressed in this publication are those of the author(s) and not necessarily those of the NIHR or the UK government. T.L. is also supported by United Kingdom Research and Innovation (UKRI) under the ARUA-UKRI GCRF Partnership Programme for Capacity Building (Ref: ES/T003804/1) which established the African Research Network for Urbanisation and Habitable Cities.

Institutional Review Board Statement

The study was conducted in accordance with the Declaration of Helsinki, and approved by local ethics committees; in Yaoundé, by the Centre Regional Committee of Ethics for Research in Human Health, CE No. 1557 CRERSHC/2020 of 20/07/2020, and in Lagos, by the College of Medicine, University of Lagos, CMUL/HREC/0753/19; We also obtained approval from the University of Cambridge ethics committee (PRE.2019.105).

Informed Consent Statement

While some other activities in the overall funded project required ethical approval which are stated in the Institutional review Board Statement, the authors confirm that the research work presented here does not involve human participation.

Data Availability Statement

The data presented in this study are openly available at Apollo—University of Cambridge Repository at https://doi.org/10.17863/CAM.104097.

Acknowledgments

For the purpose of open access, the author has applied a Creative Commons Attribution (CC BY) licence to any Author Accepted Manuscript version arising from this submission. The authors would like to thank Jayaprakash Murulitharan, University of Cambridge for providing the NAME model maps.

Conflicts of Interest

The authors declare no conflict of interest.

References

  1. Apte, J.S.; Julian, D.M.; Aaron, J.C.; Brauer, M. Addressing Global Mortality from Ambient PM2.5. Environ. Sci. Technol. 2015, 49, 8057–8066. [Google Scholar] [CrossRef] [PubMed]
  2. WHO. Guidelines on Physical Activity and Sedentary Behavior; World Health Organization: Geneva, Switzerland, 2020. [Google Scholar]
  3. Mogo, E.R.; Lawanson, T.; Foley, L.; Mapa-Tassou, C.; Assah, F.; Ogunro, T.; Onifade, V.; Odekunle, D.; Unuigboje, R.; Blanche, B.; et al. A Systematic Review Protocol of Opportunities for Noncommunicable Disease Prevention via Public Space Initiatives in African Cities. Initiatives in African Cities. Int. J. Environ. Res. Public Health 2022, 19, 2285. [Google Scholar] [CrossRef] [PubMed]
  4. WHO. Quantification of the Disease Burden Attributable to Environmental Risk Factors (China Country Profile); World Health Organization: Geneva, Switzerland, 2009. [Google Scholar]
  5. Klepeis, N.; Nelson, W.; Ott, W.; Robinson, P.J.; Tsang, A.M.; Switzer, P.; Behar, J.V.; Hern, S.C.; Engelmann, W.H. The National Human Activity Pattern Survey (NHAPS): A resource for assessing exposure to environmental pollutants. J. Expo. Sci. Environ. Epidemiol. 2001, 11, 231–252. [Google Scholar] [CrossRef] [PubMed]
  6. Kim, D.; Chen, Z.; Zhou, L.-F.; Huang, S.-X. Air pollutants and early origins of respiratory diseases. Chronic Dis. Transl. Med. 2018, 7, 75–94. [Google Scholar] [CrossRef] [PubMed]
  7. Hernandez, C.I.; Bakola, M.; Stuckler, D. The impact of air pollution on COVID-19 incidence, severity, and mortality: A systematic review of studies in Europe and North America. Environ. Res. 2022, 215, 114155. [Google Scholar] [CrossRef] [PubMed]
  8. WHO. More Than 90% of the World’s Children Breathe Toxic Air Every Day; World Health Organization: Geneva, Switzerland, 2018. [Google Scholar]
  9. Osmond, C.; Barker, D.J. Fetal, infant, and childhood growth are predictors of coronary heart disease, diabetes, and hypertension in adult men and women. Environ. Health Perspect. 2000, 108, 545–553. [Google Scholar] [PubMed]
  10. Veras, M.; Waked, D.; Saldiva, P. Safe in the womb? Effects of air pollution to the unborn child and neonates. J. Pediatr. 2022, 98, 27–31. [Google Scholar] [CrossRef] [PubMed]
  11. Ye, X.; Song, Y.; Cai, X.; Zhang, H. Study on the synoptic flow patterns and boundary layer process of the severe haze events over the North China Plain in January 2013. Atmos. Environ. 2016, 124, 129–145. [Google Scholar] [CrossRef]
  12. Wu, P.; Ding, Y.; Liu, Y. Atmospheric circulation and dynamic mechanism for persistent haze events in the Beijing–Tianjin–Hebei region. Adv. Atmos. Sci. 2017, 34, 429–440. [Google Scholar] [CrossRef]
  13. Dai, H.; Huang, G.; Wang, J.; Zeng, H. VAR-tree model based spatio-temporal characterization and prediction of O3 concentration in China. Ecotoxicol. Environ. Saf. 2023, 257, 114960. [Google Scholar] [CrossRef] [PubMed]
  14. Dai, H.; Huang, G.; Zeng, H. Multi-objective optimal dispatch strategy for power systems with Spatio-temporal distribution of air pollutants. Sustain. Cities Soc. 2023, 98, 104801. [Google Scholar] [CrossRef]
  15. Hu, X.-M.; Ma, Z.; Lin, W.; Zhang, H.; Hu, J.; Wang, Y.; Xu, X.; Fuentes, J.D.; Xue, M. Impact of the Loess Plateau on the atmospheric boundary layer structure and air quality in the North China Plain: A case study. Sci. Total Environ. 2014, 499, 228–237. [Google Scholar] [CrossRef]
  16. Ayanlade, A.; Atai, G.; Jegede, M. Spatial and seasonal variations in atmospheric aerosols over Nigeria: Assessment of influence of intertropical discontinuity movement. Int. J. Ocean Clim. Syst. 2019, 9, 1–13. [Google Scholar] [CrossRef]
  17. UNICEF Nigeria. 2019. Available online: https://www.unicef.org/nigeria/education (accessed on 21 March 2023).
  18. Ngangmo, Y.C.; Mezoue, C.A.; Ellah, C.R.E.; Mbog, S.M.; Fantah, C.A.C.; Dantse, Y.M. Monitoring and Control of Particle Matter Concentration’s Traffic-Related Air Pollution Using Low-Cost Mobile Sensors at Six Intersections in Yaoundé, Cameroon. Int. J. Environ. Clim. Change 2023, 13, 1376–1389. [Google Scholar] [CrossRef]
  19. Gnamien, S.; Yoboué, V.; Liousse, C.; Ossohou, M.; Keita, S.; Bahino, J.; Siélé, S.; Diaby, L. Particulate Pollution in Korhogo and Abidjan (Cote d’Ivoire) during the Dry Season. Aerosol Air Qual. Res. 2021, 21, 200201. [Google Scholar] [CrossRef]
  20. ALPHA, The Informal Appropriation of Public Space for Leisure Physical Activity in Lagos and Yaoundé. Available online: https://urbanbetter.science/alpha/ (accessed on 7 June 2023).
  21. Meteoblue. Climate Lagos and Yaoundé. 2023. Available online: https://www.meteoblue.com/en/weather/historyclimate/climatemodelled (accessed on 21 March 2023).
  22. Car Mart. Lagos State Vehicle Registration and Plate Number Verification. 2022. Available online: https://www.carmart.ng/blog/?s=Lagos+state+vehicle+registration+and+plate+number+verification (accessed on 10 June 2022).
  23. Ayodele, E.; Okolie, C.; Akinnusi, S.; Mbu-Ogar, E.; Alani, R.; Daramola, O.; Tella, A. An assessment of the spatio-temporal dynamics of Landsat-derived aerosol concentration in relation with land cover and road networks in the Lagos megacity. Environ. Sci. Pollut. Res. 2023, 30, 43279–43299. [Google Scholar] [CrossRef] [PubMed]
  24. Yusuf, K.A.; Oluwole, S.; Abdusalam, I.O.; Adewusi, G.R. Spatial patterns of urban air pollution in an industrial estate, Lagos, Nigeria spatial patterns of urban air pollution in an industrial estate, Lagos, Nigeria. Int. J. Eng. Invent. 2013, 2, 1–9. [Google Scholar]
  25. About Lagos, Demography. 2023. Available online: https://lagosstate.gov.ng/about-lagos/ (accessed on 7 June 2023).
  26. Koko, A.F.; Yue, W.; Abubakar, G.A.; Hamed, R.; Alabsi, A.A.N. Analyzing urban growth and land cover change scenario in Lagos, Nigeria using multi-temporal remote sensing data and GIS to mitigate flooding. Geomat. Nat. Hazard Risk 2021, 12, 631–652. [Google Scholar] [CrossRef]
  27. UN World Urbanization Prospects. 2018. Available online: https://population.un.org/wup/DataQuery/ (accessed on 7 June 2023).
  28. Carslaw, D.C.; Ropkins, K. Openair-An R package for air quality data analysis. Environ. Mod. Softw. 2012, 27–28, 52–61. [Google Scholar] [CrossRef]
  29. Jones, A.R.; Thomson, D.J.; Hort, M.; Devenish, B. The U.K. Met Office’s next-generation atmospheric dispersion model, NAME III. In Air Pollution Modeling and Its Application XVII, Proceedings of the 27th NATO/CCMS International Technical Meeting on Air Pollution Modelling and its Application, Banff, BC, Canada, 25–29 October 2004; Borrego, C., Norman, A.-L., Eds.; Springer: Berlin/Heidelberg, Germany, 2007; pp. 580–589. [Google Scholar]
  30. Akpokodje, J.E.; Weaver, C.S.; Fagbeja, M.A.; Forastiere, F.; Spadaro, J.V.; Johnson, T.M.; Ugochuku, O.; Osunderu, O.A.; Guttikunda, S.K. Air Quality Management Planning for Lagos State (English); World Bank Group: Washington, DC, USA, 2022. [Google Scholar]
  31. Greenhouse Gases Continued to Increase Rapidly in 2022. Carbon Dioxide, Methane and Nitrous Oxide Rise Further into Uncharted Levels. 2023. Available online: https://www.noaa.gov/news-release/greenhouse-gases-continued-to-increase-rapidly-in-2022 (accessed on 13 October 2023).
  32. Hegarty, J.; Draxler, R.R.; Stein, A.F.; Brioude, J.; Mountain, M.; Eluszkiewicz, J.; Nehrkorn, T.; Ngan, F.; Andrews, A. Evaluation of Lagrangian particle dispersion models with measurements from controlled tracer releases. J. Appl. Meteorol. Climatol. 2013, 52, 2623–2637. [Google Scholar] [CrossRef]
Figure 1. Simulated climatology at the two cities, showing monthly information of precipitation and temperature. (a) Yaoundé, Cameroon and (b) Lagos, Nigeria. Note that the primary and secondary axes in (a) and (b) differ.
Atmosphere 14 01693 g001
Figure 2. Map showing the locations of air quality monitoring in the two cities including a high-resolution image of the two sites.
Atmosphere 14 01693 g002
Figure 3. Images of study locations and the installed low-cost air quality sensor devices. (a) Melen Mini-Ferme area, Yaoundé, Cameroon and (b) Admiralty Way, VI, Lagos, Nigeria.
Atmosphere 14 01693 g003
Figure 4. Time series and scatter plots of CO, O3, PM2.5, RH and CO2 for the two AQMesh nodes (S1 and S2) during the co-location trial at the urban background station in Cambridge, UK. Statistics shown inset in the time series are for S1 relative to S2.
Atmosphere 14 01693 g004
Figure 5. Comparison of reference and calibrated AQMesh data for CO, NO2, PM2.5, and CO2 the co-location trial at the urban background station in Cambridge, UK. (a) Raw dataset and (b) calibrated dataset.
Atmosphere 14 01693 g005aAtmosphere 14 01693 g005b
Figure 6. Time series of daily CO, NO, NO2, O3 and CO2 observations from June 2021 to May 2022. (a) MM-F, Yaoundé, Cameroon and (b) AW-VI, Lagos, Nigeria. Gaps in data are due to power outages at the sites.
Atmosphere 14 01693 g006aAtmosphere 14 01693 g006b
Figure 7. Time series of daily CO2, pressure, temperature and RH observations from May 2021 to May 2022. (a) MM-F, Yaoundé, Cameroon and (b) AW-VI, Lagos, Nigeria. Gaps in data are due to power outages at the sites.
Atmosphere 14 01693 g007
Figure 8. Diel plot of all the temperature and relative humidity (RH) observations from May 2021 to May 2022 in Yaoundé (blue) and Lagos (red).
Atmosphere 14 01693 g008
Figure 9. Temporal variation as day of week diel, average diel, monthly averages and day of week averages for the entire deployment period at the two locations. (a) CO and (b) NO.
Atmosphere 14 01693 g009aAtmosphere 14 01693 g009b
Figure 10. Temporal variation for PM2.5 as day of week diel, average diel, monthly averages and day of week averages at the two locations. (a) For the entire deployment period and (b) excluding the Harmattan haze episodes. Note: a similar pattern was observed for PM10.
Atmosphere 14 01693 g010aAtmosphere 14 01693 g010b
Figure 11. Gridded and smoothed back trajectory concentrations showing mean PM10 concentrations using the concentration-weighted trajectory (CWT) methodology grouped by three months (MAM = March, April, May, JJA = June, July August, SON = September, October, November and DJF = December, January, February). (a) MM-F, Yaoundé and (b) AW-VI, Lagos.
Atmosphere 14 01693 g011aAtmosphere 14 01693 g011b
Figure 12. Maps showing the output run of NAME back trajectory over six days for daily continuous particle release of 2000 units/hour at 1 g/s at 0.1 × 0.1 grid resolution at the two locations (red star in maps). (a) Trajectory run for Lagos covering the period 30 December 2021–4 January 2022, (b) trajectory run for Yaoundé covering the period 30 December 2021–4 January 2022, (c) trajectory run for Lagos covering the period 4–9 July 2022 and (d) trajectory run for Yaoundé covering the period 4–9 July 2022.
Atmosphere 14 01693 g012
Figure 13. Daily observed average of PM2.5 and PM10 in relation to the 2015 and 2021 daily WHO air quality guidelines at the two study locations for the duration of the campaign.
Atmosphere 14 01693 g013
Disclaimer/Publisher’s Note: The statements, opinions and data contained in all publications are solely those of the individual author(s) and contributor(s) and not of MDPI and/or the editor(s). MDPI and/or the editor(s) disclaim responsibility for any injury to people or property resulting from any ideas, methods, instructions or products referred to in the content.

