Article

Investigation on the Intensification of Supertyphoon Yutu (2018) Based on Symmetric Vortex Dynamics Using the Sawyer–Eliassen Equation

by
Thi-Chinh Nguyen
and
Ching-Yuang Huang
*
Department of Atmospheric Sciences, National Central University, Taoyuan City 320317, Taiwan
*
Author to whom correspondence should be addressed.
Atmosphere 2023, 14(11), 1683; https://doi.org/10.3390/atmos14111683
Submission received: 21 August 2023 / Revised: 31 October 2023 / Accepted: 11 November 2023 / Published: 13 November 2023
(This article belongs to the Special Issue Typhoon/Hurricane Dynamics and Prediction (2nd Edition))

Abstract

:
This study used the revised Sawyer–Eliassen (SE) equation, taking the relaxed thermal wind balance into account, to chart the development of Supertyphoon Yutu (2018) based on symmetric vortex dynamics. The mean vortex and associated forcing sources for solving the SE equation were taken from three-dimensional numerical simulations using the ocean-coupled HWRF. The SE solutions indicate that the induced transverse circulation is sensitive to the static stability of the mean vortex, which can be significantly underestimated when the static instability is greatly increased. The impacts on the SE solution, caused by the agradient imbalance and nonhydrostatics, were not significantly large in the troposphere. Moreover, the impact of numerical residue in the tangential wind tendency equation mainly occurred in the upper troposphere, below a height of 18 km, and near the lower eyewall. Furthermore, the structural misplaced change in the forcing source may have caused a more disorganized induced transverse circulation, whereas the collocated intensity change only resulted in a proportional enhancement during the same phase. During the rapid intensification of Yutu, the tangential-wind velocity tendency, caused by the revised SE solution, was close to the actual nonlinear tendency; however, the lowest boundary layer exhibited stronger turbulent friction. The mid- to upper-tropospheric vortex intensification inside of the eyewall and outside of the eyewall can mainly be attributed to the mean and asymmetric horizontal advection and vertical advection, respectively; conversely, most of the spindown that occurred in the eyewall was caused by the mean and asymmetric horizontal advection. At lower levels, the vortex intensification near the inner eyewall was mainly induced by the effects of asymmetric vertical advection.

1. Introduction

Tropical cyclones (TCs) are characterized by a low-pressure center, strong winds, and heavy rains, and they are one of the most devastating weather processes due to their strong destructive capability via winds, waves, and surges. The degree of destruction caused by TCs is related to their intensity (e.g., [1,2]). The TC track forecasting has been improved dramatically over the past several decades ([3,4,5]); for example, the track forecast of the National Hurricane Center (NHC) (e.g., [3,5,6]). However, TC intensity forecasting is still a challenge at present ([6,7]). Cangialosi et al. [6] indicated that the errors in TC intensity forecasting from the NHC have slightly changed from the 1970s to the early 2000s, though the errors in TC track forecasts have reduced to a greater extent. Hendricks [8] showed that one of the reasons for the lack of intensity in terms of skill improvement is due to internal storm processes. Rogers [9] described relationships between TC structure and TC intensity change, and indicated that TC intensity change is partly related to TC structure. Thus, improving the understanding of the inner-core dynamics of TCs is necessary to improve TC intensity forecasting.
The primary circulation of a TC generally comprises a warm-core that has a near circular vortex that ensures its thermal wind balance (e.g., [10,11,12,13,14]). Balance dynamics were applied to diagnose the transverse circulation and spinup of an idealized TC simulation (e.g., [15,16,17,18]). From the viewpoint of balanced dynamics, Montgomery and Smith [19] showed that the heat and momentum forces ‘spin up’ the primary circulation by driving a low-level radial inflow. Möller and Shapiro [20] indicated that although the spinup of the inner-core vortex was much greater due to symmetric heating and friction, the role of the asymmetric eddy processes could not be ignored. Moreover, the Sawyer–Eliassen (SE) equation, derived as a linear partial differential equation (e.g., [16,21,22,23,24,25,26,27,28]), can be applied to investigate the responses of a primary mean vortex, different force sources, and the intensification of the vortex.
However, there has been a lot of discussion and debate concerning solving the SE equation (e.g., [22,23,26,27,28,29]). The SE equation is based on the approximations of thermal wind balance for an axisymmetric TC. Bui et al. [22] employed a mean tangential wind field from model simulations to obtain its corresponding balanced thermodynamic fields when solving the balanced SE equation. They found that the balanced SE solution can capture the transverse circulation of a TC from the model simulation, except in the boundary layer. Montgomery and Persing [26] have also shown that the balanced SE solution underestimated the boundary-layer peak inflow of the model simulation. Heng et al. [23] did not take into account the thermal wind balance, and they directly used the mean temperature field from the idealized numerical simulation to reexamine the balanced SE equation for a TC. They found that the pseudo-balanced SE solution can improve the capturing ability of the transverse circulation, even within the boundary layer in the vortex inner-core region.
Considering this deficiency, the balanced SE equation was revised taking the relaxation of the thermal wind balance into account, as well as the residual terms from the tangential wind tendency equation and the potential temperature tendency equation (e.g., [27]). The major difference between the balanced SE equation (e.g., [22,23,26]) and unbalanced SE equation (e.g., [27,28]) is the involvement of imbalanced components; these are derived from the gradient wind and hydrostatics, as well as the residual components of tangential wind, and the potential temperature equations in the unbalanced SE equation. However, not all of these factors are included in the balanced SE equation. Ji and Qiao [27] indicated that the unbalanced SE solution captures the overall structure of the simulation’s secondary circulation well. Furthermore, it captures the inflow of the boundary layer, which surpasses the balanced SE solution (e.g., [22,26,30]) and pseudo-balanced SE solution (e.g., [23,24]). The TC boundary layer structure was closer to the nonlinear simulation when the imbalanced components were added to the SE equation.
Most previous studies focus on the balanced SE equation that uses the basic-state vortex and thermal wind balance (e.g., [22,26,30]), instead of the unbalanced SE equation and relaxed thermal wind balance (e.g., [27,28]). However, the most common contribution to the induced transverse circulation and the spinup of the inner-core vortex mainly comes from the diabatic heating (e.g., [20,27,31]). The contribution of surface friction is mainly found in the boundary layer, whereas the role of the asymmetric eddy processes is insignificant, but cannot be ignored (e.g., [20,27]). However, only the unbalanced SE solution considers the residual terms from the gradient wind, hydrostatic, tangential wind tendency, and potential temperature equations. Ji and Qiao [27] indicated that the residual terms only contribute to a small change in the SE solution, for a moderate TC. In this study, we also applied the unbalanced SE equation to explore the contributions of the residual terms to the induced transverse circulation that is associated with a super-intense typhoon.
Moreover, in this study, we also investigated “regularization” when seeking to obtain the convergent solution of the SE equation; this is used to satisfy the ellipticity condition that will be violated, particularly in the lower boundary layer or upper outflow layer, when in the presence of un-modified coefficients in the SE equation (e.g., [22,23,26,27]). The coefficients appearing in the SE equation can be adjusted, which may affect the results of the solution to some extent. Ji and Qiao [27] adjusted the vertical shear of the tangential wind and they found that the boundary layer inflow of the unbalanced SE solution was not sensitive to the adjustments; however, it was sensitive when the pseudo-balanced SE solution was used. We adjusted a coefficient that appeared in the SE equation, specifically, the coefficient related to static stability, to explore its impact on the induced transverse circulation.
It is worth noting here that most earlier studies focused on an idealized vortex instead of a real TC to examine the balanced and unbalanced dynamics of TC intensification (e.g., [22,23,24,26,27,28,30]). However, in this study, we focused on a real, super-intense TC to explore the balanced dynamics and balanced vortex. We employed a high-resolution ocean-coupled HWRF model to simulate Typhoon Yutu (2018). The ocean-coupled HWRF, and its simulation results of the typhoon track and intensity, will be introduced in Section 2. The unbalanced SE formulation, their solution, and their sensitivity experiments are presented in Section 3. In Section 4, we focused on the sensitivity of static instability, residual terms, and total force sources to examine the induced transverse circulation of the model simulation. Finally, conclusions are given in Section 5.

2. Simulations

2.1. Model Configuration and Numerical Experiments

This study used the Hurricane Weather Research and Forecasting (HWRF) model, version 3.7 ([32]), to conduct the numerical simulations. The HWRF model was developed by the National Oceanic and Atmospheric Administration (NOAA), the U.S. Naval Research Laboratory, the University of Rhode Island, and Florida State University. It is an atmosphere–ocean coupled model and it is specifically used to forecast the track and intensity of TCs. The atmosphere component contains three domains with horizontal resolutions of 18, 6, and 2 km, respectively. There are 61 vertical levels with the model top set to 2 hPa for the three domains. In this model, the Princeton Ocean Model (POM) for TCs (POM-TC [33]) was used for updating the sea surface temperature (SST). More details on the HWRF model configuration may be found in [34]. The cumulus parameterization and cloud microphysics schemes used in this study include the Kain–Fritsch scheme and the Tropical–Ferrier scheme, respectively. Other physical model schemes include the NCEP Global Forecast System’s planetary boundary layer parameterization, Troen and Mahrt’s non-local scheme for vertical diffusion, the Monin–Obukhov scheme for surface flux calculations, and the RRTMG scheme for radiation effects. For references concerning the physics schemes, please see the WRF users’ guide ([32]). Note that the HWRF vortex initialization technique (including vortex relocation and modification) was turned on for the HWRF simulations in this study.
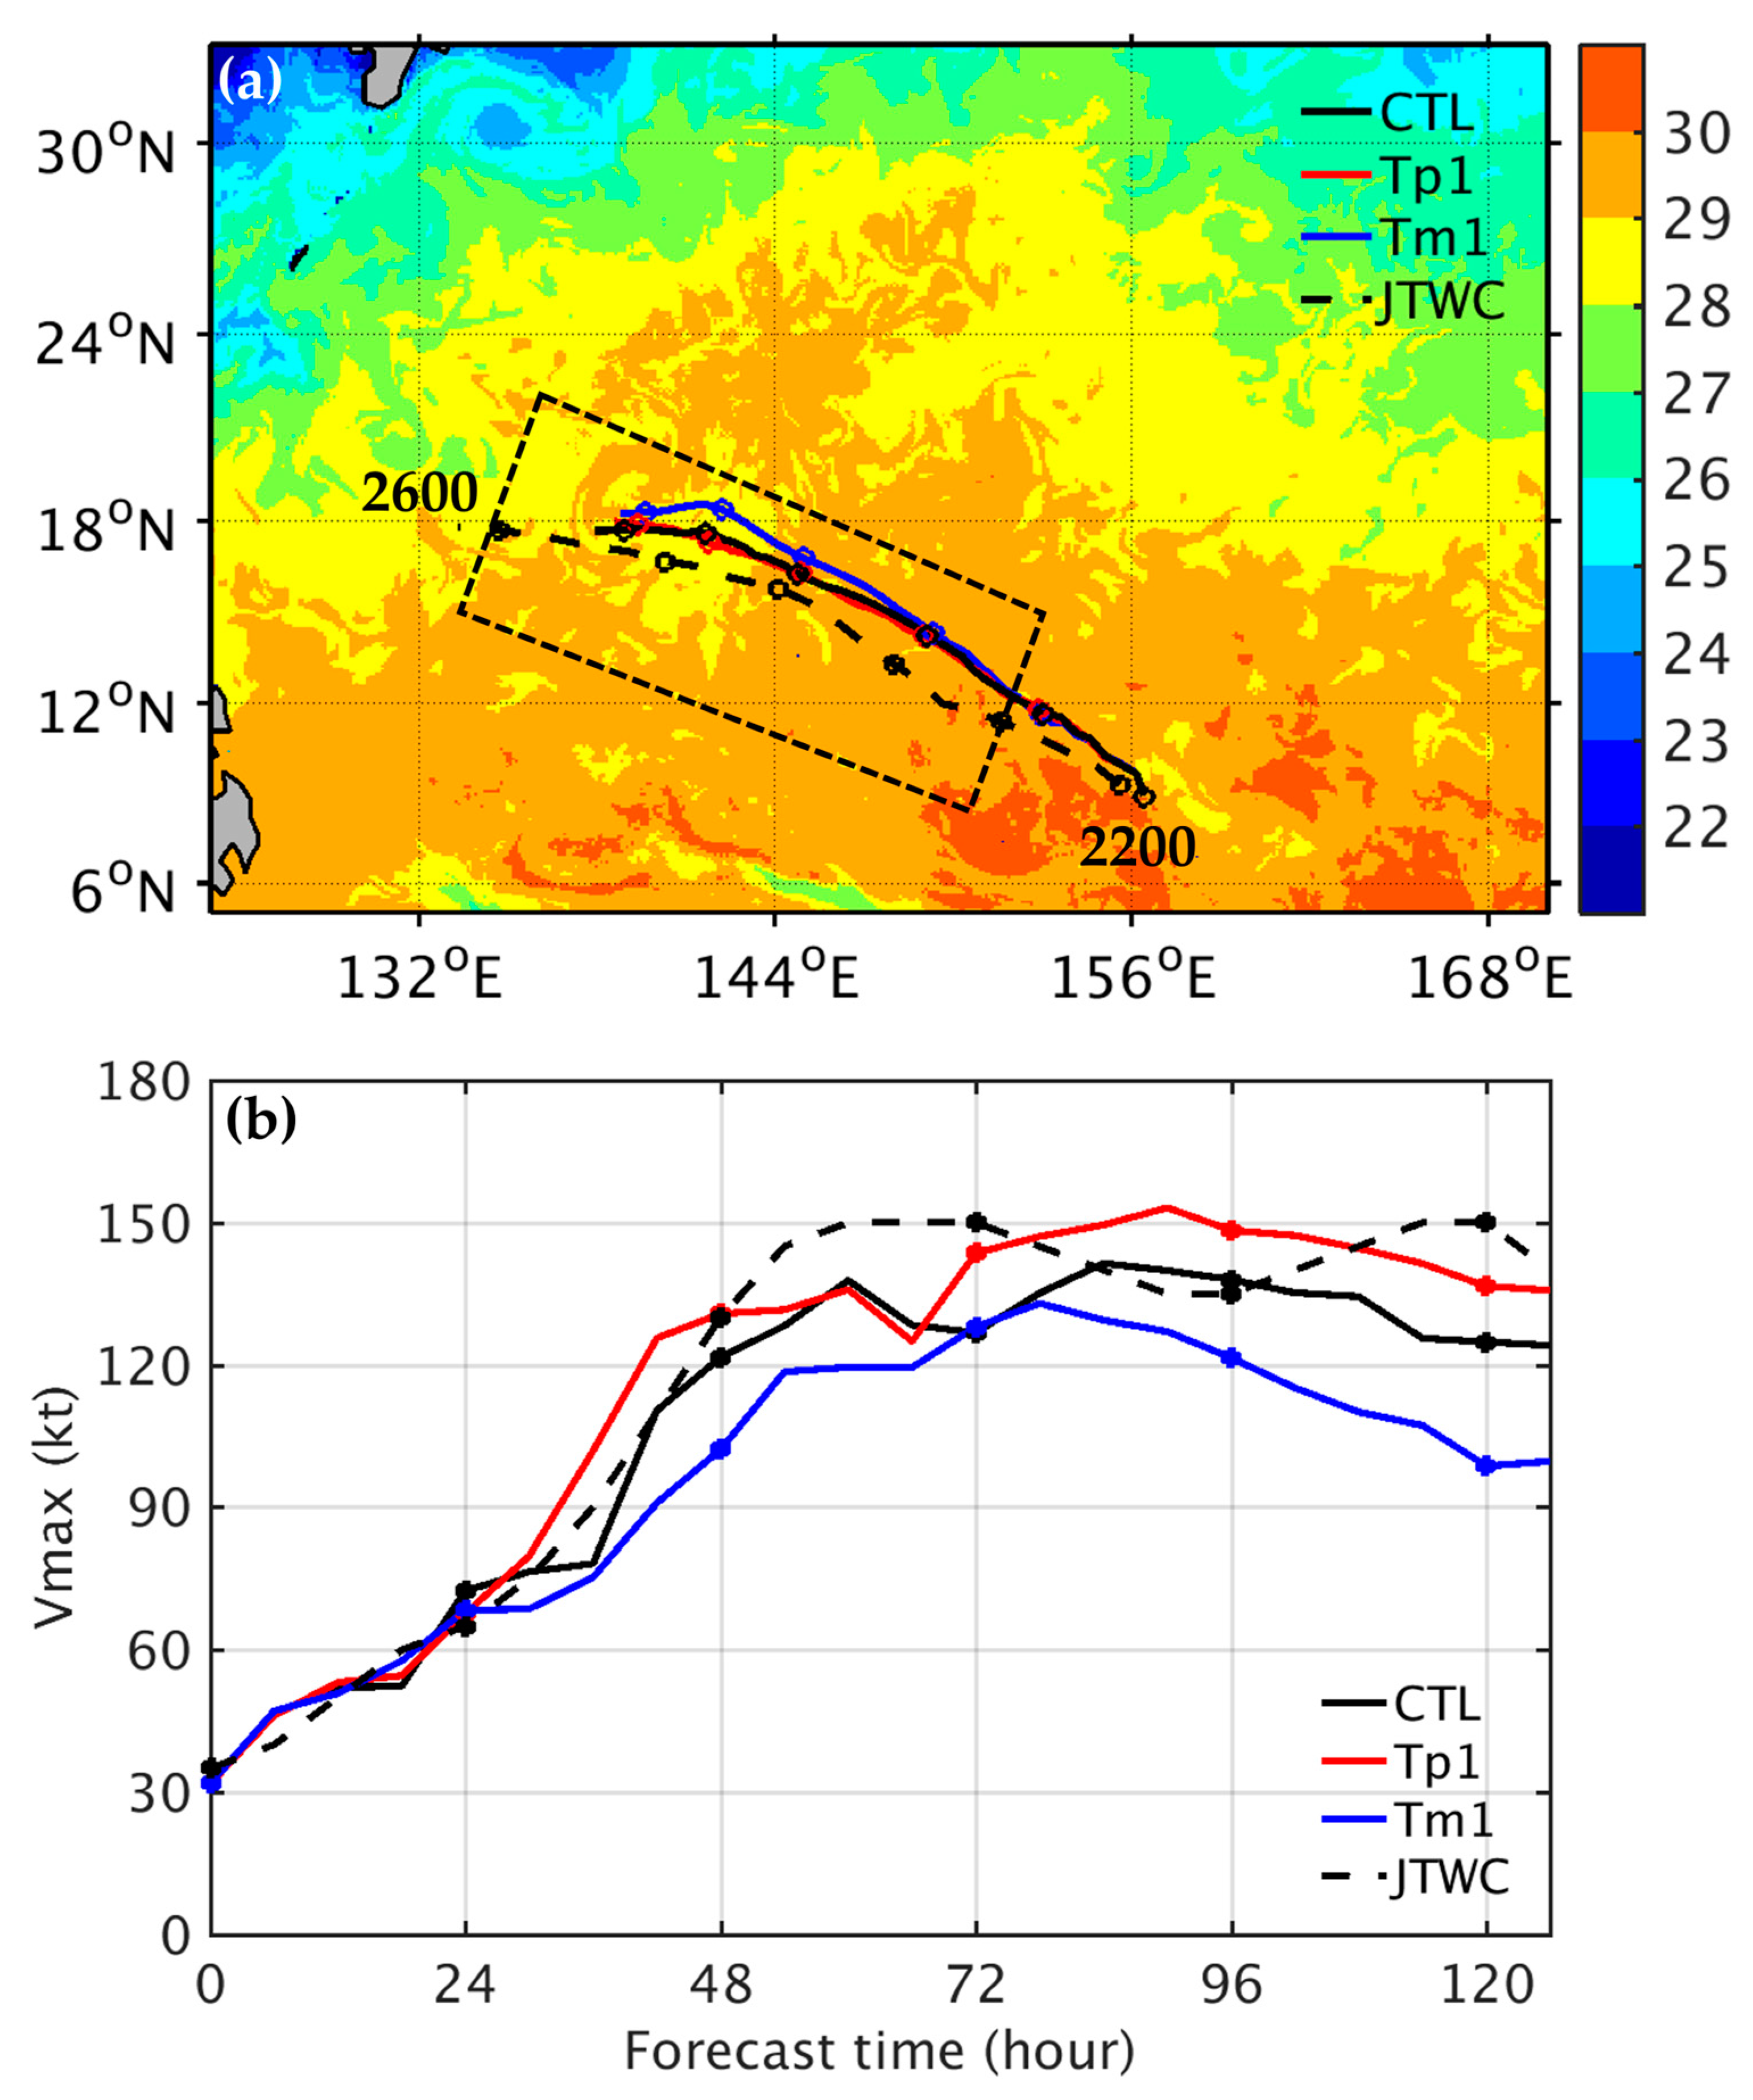
In this study, we chose Yutu for the numerical experiments. Typhoon Yutu was formed over a warm ocean in the Western North Pacific (WNP). Yutu originated east of Guam and the Northern Mariana Islands, and it organized into a tropical depression by 2000 UTC, 21 October, according to the Joint Typhoon Warning Center (JTWC), as shown in Figure 1. As increasingly favorable conditions allowed Yutu to intensify, the system strengthened into a tropical storm by 0800 UTC, 22 October, and it became a supertyphoon at 0800 UTC, 24 October. Yutu reached its peak intensity at 1800 UTC, 24 October, with the minimum sea-level pressure deepening to 904 hPa, and the maximum wind speed (Vmax) increasing to 150 kt, according to the JTWC. Yutu then mainly moved west-northwestward over the WNP.
The total simulation time in this study is 126 h from 0000 UTC, 22 October, to 0600 UTC, 27 October 2018. The initial and boundary conditions of the atmosphere model use the NCEP Global Data Assimilation System (GDAS) Final Analysis with a horizontal resolution of 0.25° × 0.25°. The ocean conditions of HWRF were initialized using the initial ocean condition obtained from daily finer Hybrid Coordinate Ocean Model (HYCOM) analysis; a 1/12° horizontal resolution was applied to all ocean layers. The EN4.2.0 monthly temperature was used to provide the boundary condition for HYCOM. MPIPOM-TC then predicted the ocean temperature using the initial conditions from HYCOM. We used the typhoon observation data from the JTWC, including the best track and Vmax of the TC (one-minute average maximum wind speed), to determine the TC track and intensity.

2.2. HWRF Simulations

The atmosphere–ocean coupled experiment (CTL) was conducted to consider the influences of the ocean conditions on the intensity of the typhoon. To explore the impact of different total force sources on the intensity of the typhoon when using the SE solution below, two sensitivity experiments were conducted, wherein the initial ocean temperature tracks, indicated by the targeted region (see the marked dashed boxes in Figure 1a), increased by 1 °C in experiment Tp1, and decreased by 1 °C in experiment Tm1. Note that all the simulation experiments in this set are ocean-coupled experiments. In this study, the initial ocean temperature throughout the depths of the ocean is changed by the same magnitude.
Yutu was initially formed over the warm region, with SSTs close to 30 °C, and it traveled over the warm region, SST, at a temperature of over 28 °C, along the tracks shown in Figure 1a. These were good ocean conditions for the intensification of the typhoon. The translation of Yutu for CTL compares well with the best track from JTWC, but it deviated slightly northward at a slower speed (Figure 1a). The simulated track for Tp1 is similar to that for CTL, whereas the simulated track for Tm1 showed a northward deviation, as compared with the CTL over the preceding two days. In general, the simulated intensity for CTL compares well with the best track intensity in the first two days, but with a slight underestimation in the last three days (Figure 1b). In general, CTL captures the observed rapid intensification (RI) of Yutu well. The RI for CTL actually started from the initial time (0000 UTC 22 October) since it fits the RI definition (30 kt/24 h) noted in [35]. However, the largest increase in Vmax for CTL occurred between 18 and 42 h; the Vmax increased to approximately 60 kt. All the ocean temperature sensitivity experiments (Tp1 and Tm1) obtained comparable typhoon intensities on the first day when the simulated Yutu did not yet move into the region with the modified ocean temperature. The strongest intensity for the simulated Yutu was found in Tp1, and the strongest Vmax reached approximately 150 kt, at 90 h. Moreover, Tm1 still produces a RI, but the intensification rate was weaker than CTL, indicating the more dominant effect of the ocean temperature reduction. Tp1 and Tm1 obtained comparably fast intensifications in their first-day forecasts, whereas their later developments, before reaching their peak intensities, is closely related to the initial increases or reductions in ocean temperature, respectively.

3. The Sawyer–Eliassen Equation in Height Coordinates

3.1. The Unbalanced SE Formulation

The SE equation can be applied to investigate the responses of an axisymmetric vortex to different force sources ([16]). We used an alternative form of the SE equation, using height coordinates that do not form a linearized pressure gradient force, and the buoyancy effect of water vapor. The derivation of the SE equation essentially follows the method in [26], which was extended by [27], with regard to unbalanced dynamics. In this study, we have used the unbalanced SE equation with the relaxation of the gradient wind and hydrostatic balance. We first defined Exner’s pressure, as follows:
Π = c p ( p / p s ) k
where p is the simulated pressure from the nonlinear model simulation, p s = 1000 hPa is a standard reference pressure, and k = R / c p = 0.286 . For moist air, the virtual potential temperature is given using the following:
θ v = θ 1 + ϵ q v
where θ is the potential temperature, q v is the specific humidity of water vapor, and ϵ = 0.609 . This results in the following:
Π θ v = c p T v
where T v = T 1 + ϵ q v is the virtual temperature. Next, we considered a symmetric vortex, expressed in cylindrical coordinates (r, λ, z), where r and z are the radial and vertical coordinates, respectively, and λ is the azimuthal angle. The radial pressure gradient force can be expressed as follows:
1 ρ p r = θ v Π r
The anelastic flow continuity equation is expressed for TCs, as follows:
ρ 0 r u r r + ρ 0 w z = 0
where u and w are the radial and vertical wind components, respectively, and   ρ 0 = ρ 0 ( r , z ) is the azimuthal-mean density. The axisymmetric primitive equations in cylindrical coordinates may be expressed, as follows:
v 2 r + f v θ v Π r = U ˙
v t + u η + w v z = F v + V ˙
θ v Π z + g = W ˙
where v is the tangential wind component; U ˙ ,   V ˙ , and W ˙ are the residual parts of the radial–wind tendency equation, tangential–wind tendency equation, and the non-hydrostatic equation, respectively. g is the gravitational acceleration, f is the Coriolis parameter, F v is the tangential friction, and η = f + v / r + v / r is the azimuthal-mean absolute vorticity. Defining C = v 2 r + f v as the sum of the centrifugal and Coriolis terms, Equations (6) and (8) can be expressed, as follows:
Π r = C θ v U ˙ θ v
Π z = g θ v W ˙ θ v
Combining the z-derivative of Equation (9) and the r-derivative of Equation (10), we obtain the following:
z C θ v U ˙ θ v + r g θ v + W ˙ θ v = 0
With χ = 1 / θ v , Equation (11) can be rewritten as follows:
C z = ξ v z = C χ χ z + 1 χ χ U ˙ z g χ χ r 1 χ χ W ˙ r
where ξ = f + 2 v / r is twice the absolute angular velocity. Equation (12) can also be rewritten, as follows:
χ C z = χ U ˙ z g χ r χ W ˙ r
Taking the time-derivative of the sum of the centrifugal and Coriolis terms, (C), and based on Equation (7), we obtain the following:
C t = ξ v t = ξ u η ξ w v z + ξ F v + ξ V ˙
For moist air, the thermodynamic energy equation is given, as follows:
d θ v d t = d θ d t 1 + ϵ q v + ϵ θ d q v d t
where the second term ϵ θ ( d q v ) / d t on the right side has been ignored, whereas the first term in this study has not. With θ v χ = 1 that gives χ d θ v / d t + θ v d χ / d t = 0 , we obtain
d χ d t = χ t + u χ r + w χ z = χ 2 d θ v d t
Based on Equations (15) and (16), we can obtain the following:
χ t = χ 2 1 + ϵ q v H θ u χ r w χ z
where H θ = d θ / d t . The potential temperature tendency equation may be expressed as follows:
H θ = θ t + u θ r + w θ z = θ c p T Q ˙ + F θ
where Q ˙ is the diabatic heating rate, F θ is the turbulent mixing of heat, and H θ is the total potential temperature tendency. In (18), the tangential advection term v θ r λ is non-existent for a symmetric vortex.
To include the effect of asymmetric eddy motions on the vortex, we decomposed Equation (18) (with the tangential advection term included) using u = u ¯ + u , w = w ¯ + w , v = v ¯ + v , and θ = θ ¯ + θ , where the overbar (prime) is the azimuthal mean (deviation) of a variable. By calculating the azimuthal mean of all the decomposed terms, it will result in the following:
θ ¯ t = u ¯ θ ¯ r w ¯ θ ¯ z u θ r ¯ v θ r λ ¯ w θ z ¯ + H θ
where H θ = d θ ¯ + θ / d t , which includes both diabatic heating and turbulent mixing. Thus, H θ in Equation (19) is expressed as follows:
θ ¯ t + u ¯ θ ¯ r + w ¯ θ ¯ z = u θ r ¯ v θ r λ ¯ w θ z ¯ + F ¯ θ + 1 Π ¯ Q ˙ ¯ = H θ
where the five terms on the right side represent the asymmetric eddy terms (the first three terms) which concern the transport of heat, F ¯ θ turbulent heat diffusion, and the Q ˙ ¯ diabatic heating rate caused by both cloud and radiation effects.
Similarly, the prognostic equation for the azimuthal-mean tangential wind velocity can be expressed as follows:
v ¯ t + u ¯ η ¯ + w ¯ v ¯ z = u η ¯ w v z ¯ + ρ ρ ¯ 2 1 r p λ ¯ + F ¯ v + V ˙ = G v + V ˙
where η ¯ is the azimuthal-mean absolute vorticity, and the terms on the right side represent the asymmetric eddy contributions (the first three terms), and F ¯ v turbulent momentum diffusion (including surface friction). Therefore, in this study, the momentum force source ( G v ) used for the unbalanced SE equation are the transportation mechanisms of asymmetric eddy momentum and turbulent momentum. Equation (21) can be rewritten as follows:
v ¯ t = V ˙ + G v u ¯ η ¯ w ¯ v ¯ z
After taking the derivative of Equation (13), with respect to time, the following result is obtained:
z χ ξ v ¯ t + z C χ t = t χ U ˙ z g r χ t t χ W ˙ r
Based on Equations (17) and (22), Equation (23) can be recast, as follows:
z χ ξ V ˙ + ξ G v ξ u ¯ η ¯ ξ w ¯ v ¯ z + z C χ 2 1 + ϵ q v H θ u ¯ χ r w ¯ χ z = g r χ 2 1 + ϵ q v H θ u ¯ χ r w ¯ χ z + t χ U ˙ z t χ W ˙ r
We introduced the streamfunction, ψ , for the transverse circulation compound of u ¯ and w ¯ , which was expressed as follows:
u ¯ = 1 r ρ 0 ψ z ;       w ¯ = 1 r ρ 0 ψ r
where ρ 0 = ρ ¯ .
We may rewrite the unbalanced SE equation for Equation (24) as follows:
          r A ~ ψ r + B ~ 1 ψ z + z C ~ ψ z + B ~ 2 ψ r = z χ ξ G v + r g χ 2 1 + ϵ q v H θ + z C χ 2 1 + ϵ q v H θ z χ ξ V ˙ + t χ U ˙ z t χ W ˙ r = S
where
A ~ = g ρ 0 r χ z = χ ρ 0 r N 2       ( N 2 = g θ v θ v z = g χ χ z )
B ~ 1 = 1 ρ 0 r g χ r ;       B ~ 2 = 1 ρ 0 r ( χ C ) z
C ~ = 1 ρ 0 r ξ η χ + C χ r
Note that Equation (26) is the same as in [27], except that the factor of 1 + ϵ q v   in Equation (15) has been included in Equation (26) to account for the buoyancy effect of water vapor; moreover, the residual of potential temperature tendency equation is ignored in this study. Regarding the unbalanced mean vortex, B ~ 1 is different from B ~ 2 . Using the revised SE equation of Equation (26) may improve the accuracy when compared with the nonlinear simulation, as shown in [27]. Note that the equations of motion concerning cylindrical coordinates use the original velocity of flow.
After obtaining the transverse streamfunction, ψ , from Equation (26), the radial and vertical wind components were obtained using Equation (25).

3.2. Solution of the SE Equation

In this study, we used the azimuthal-mean tangential wind field from the nonlinear simulation directly to solve the SE equation, and this equation is solved numerically by using the iteration method of successive over-relaxation. The iteration is determined to have converged when the residue values of the stream function (which is solved using the SE equation at all interior grids after iteration) are smaller than 10−20. The domain for the SE equation is 0–25 km in the vertical direction, with a vertical resolution of 200 m and 0–3 degrees in the radial direction, with a radial resolution of 0.025 degrees. The boundary conditions for the vortex when solving Equation (26) are ψ = 0 at r = 0 , ψ r = 0 at r = 3 degrees, and ψ = 0 at z = 0 and 25 km.
To obtain the convergent numerical solution, the SE equation should satisfy the ellipticity condition, as follows:
1 = B ~ 1 2 A ~ C ~ < 0 ;       2 = B ~ 2 2 A ~ C ~ < 0
The SE equation is not elliptic and the iterations will lead to symmetric instability when the discriminant is 1 0 and 2 0 at the local grids ([22]). Thus, the regularization of the coefficients ( A ~ , B ~ 1 , B ~ 2 ,   a n d   C ~ ) in the SE equation is required for the convergence of the solution (e.g., [23,26,27]). The regions that were regularized to ensure a convergent solution to the SE equation appear in the boundary layer that was less than 1 km in height, 15–21 km in height, and in large regions of the upper-tropospheric outflow layer. Following the method [26], we thus set A ~ = χ ρ 0 r N 2 with static stability N 2 10 5   s 2 and C ~ = 10 3 × C ~ at points where C ~ < 0 . If the ellipticity condition is still violated at any grid point, then we reduced B ~ 1   a n d   B ~ 2 to 0.98 × A ~ C ~ in these grids. Our method is similar to [26], although the treatment of both B ~ 1   a n d   B ~ 2 differed.

3.3. Sensitivity Experiments of the SE Solution

To explore the effect of the residual terms from the radial wind, tangential wind, and hydrostatic equations ( U ˙ ,   V ˙ , and W ˙ , respectively), and the total force sources (S in Equation (26)) in the SE equation, along with their induced transverse circulation, two sets of sensitivity experiments were conducted and described in Table 1. The first set of sensitivity experiments explores the contributions of U ˙ ,   V ˙ , and, W ˙ to the induced transverse circulation. The sensitivity tests which included U ˙ ,   V ˙ , and, W ˙ are denoted as U1, V1, and W1, respectively, and those that did not take U ˙ ,   V ˙ , and, W ˙ into account are denoted as U0, V0, and, W0, respectively. Note that the momentum source G v and heat source H θ are always included when solving the solution in this set. For example, the total force source of the U1V0W1 solution comprises the momentum source G v , heat source H θ , and the forcing terms associated with U ˙ and W ˙ , but not V ˙ . In the second set, to explore the sensitivity of the total force sources (S) to their induced transverse circulation, we used the total force sources of Tm1 (S48Tm1) and Tp1 (S48Tp1) for 48 h. We also applied the total force sources from the nonlinear simulation to CTL, but they were increased by 1.3 times to obtain the SE solution. Herein, 1.3xS24CTL and 1.3xS48CTL thus represent the applied amplified force sources after 24 and 48 h, respectively.

4. Results

4.1. Sensitivity Tests on Static Stability

The ellipticity condition for the convergent numerical solution of the SE equation requires a standard discriminant that is less than zero ( 1 < 0 and 2 < 0 ). Generally, A ~ < 0 results from static instability ( N 2 < 0 ). The static instability of the typhoon vortex was mainly observed in the boundary layer that is less than 1 km in height, and in the upper outflow layer, in the radius of 0.5–1 degrees, at approximately 16 km in height. Therefore, we reset N 2 = 10 5   s 2 at any grid where N 2 < 10 5   s 2 to create the vortex in static stability conditions. We investigated the effects of the lower limit value of the static stability on the transverse circulation of Yutu. We chose U1, V0, and W1 for three sensitivity experiments, with the lower limit value of N 2 capped at 10 3 , 10 4 , and 10 5   s 2 , referred to as N3, N4, and N5, respectively.
The azimuthal-mean radial and vertical wind components of the nonlinear model simulation for CTL, at 48 h, are shown in Figure 2a,b. There was a strong inflow (with a maximum value of about 28 m s−1) at a height of less than 2 km, a relatively weak inflow in the mid-troposphere outside the eyewall at 3–9 km height, and a relatively deep outflow in the upper troposphere at 12–18 km height (Figure 2a). Note that inflow and outflow occurs at heights that are less than and over 19 km, respectively. The vertical velocity field shows an intense updraft at a radius of 0.5 degrees from the typhoon center which extends to the upper troposphere at a height of approximately 17 km, with the strongest upward motion evident at a height of about 9–12 km (Figure 2b). Moreover, there is a relatively strong updraft in the typhoon center, at a radius of 0.9 degrees, with the strongest updraft occurring at a height of nearly 12 km height and a relatively weak updraft inside the eyewall. Furthermore, there is a weak subsidence in the mid- to upper-troposphere inside the eyewall at a height of 9–18 km, and a relatively larger subsidence in the upper troposphere above heights of 17 km, at a radius of 0.4–0.7 degrees.
The transverse circulations with different lower limit values of N 2 are shown in Figure 2c–h. Compared with the nonlinear simulation (Figure 2a,b), the induced transverse circulation is sensitive to the adjustment of the static instability of the typhoon vortex. It is evident that the broad features of the transverse circulation in the nonlinear simulation, such as the three intense updrafts, upper troposphere deep outflow, boundary layer inflow, weak mid-troposphere inflow, and the inflow and outflow at a height of 19 km, are captured in N4 and N5, but they are missing in N3 (Figure 2c,d). The transverse circulation for N4 aligned well with the nonlinear simulation, although it did not capture the upper-tropospheric subsidence above a height of 17 km, at a radius of 0.4–0.7 degrees, as in the nonlinear simulation; rather, it produced inflow–outflow at a height of 15 km (Figure 2e,f). In general, the transverse circulation for N5 was most consistent with the nonlinear simulation, and it captured the flow intensity and the height of the upper-level outflow (Figure 2g,h). The results with the lower limit value of N 2 , reset to 10 6 s 2 (N6), are similar to the N5 results. For N3, a large portion of the static stability is reset to a larger stability, thus suppressing the transverse circulation. This stability reset is more relieved in N4 and N5. Based on our tests, stability relief, as in N5, is sufficient and will preserve most of the original stability in the nonlinear simulation, without producing divergence in the solution. For N6, we found that the solution may occasionally diverge, and the solution, if converged, is very similar to N5. Thus, we used the lower limit value of N 2 , capped at 10 5   s 2 , in the experiments shown in Table 1.

4.2. Sensitivity Tests on the Residual Terms

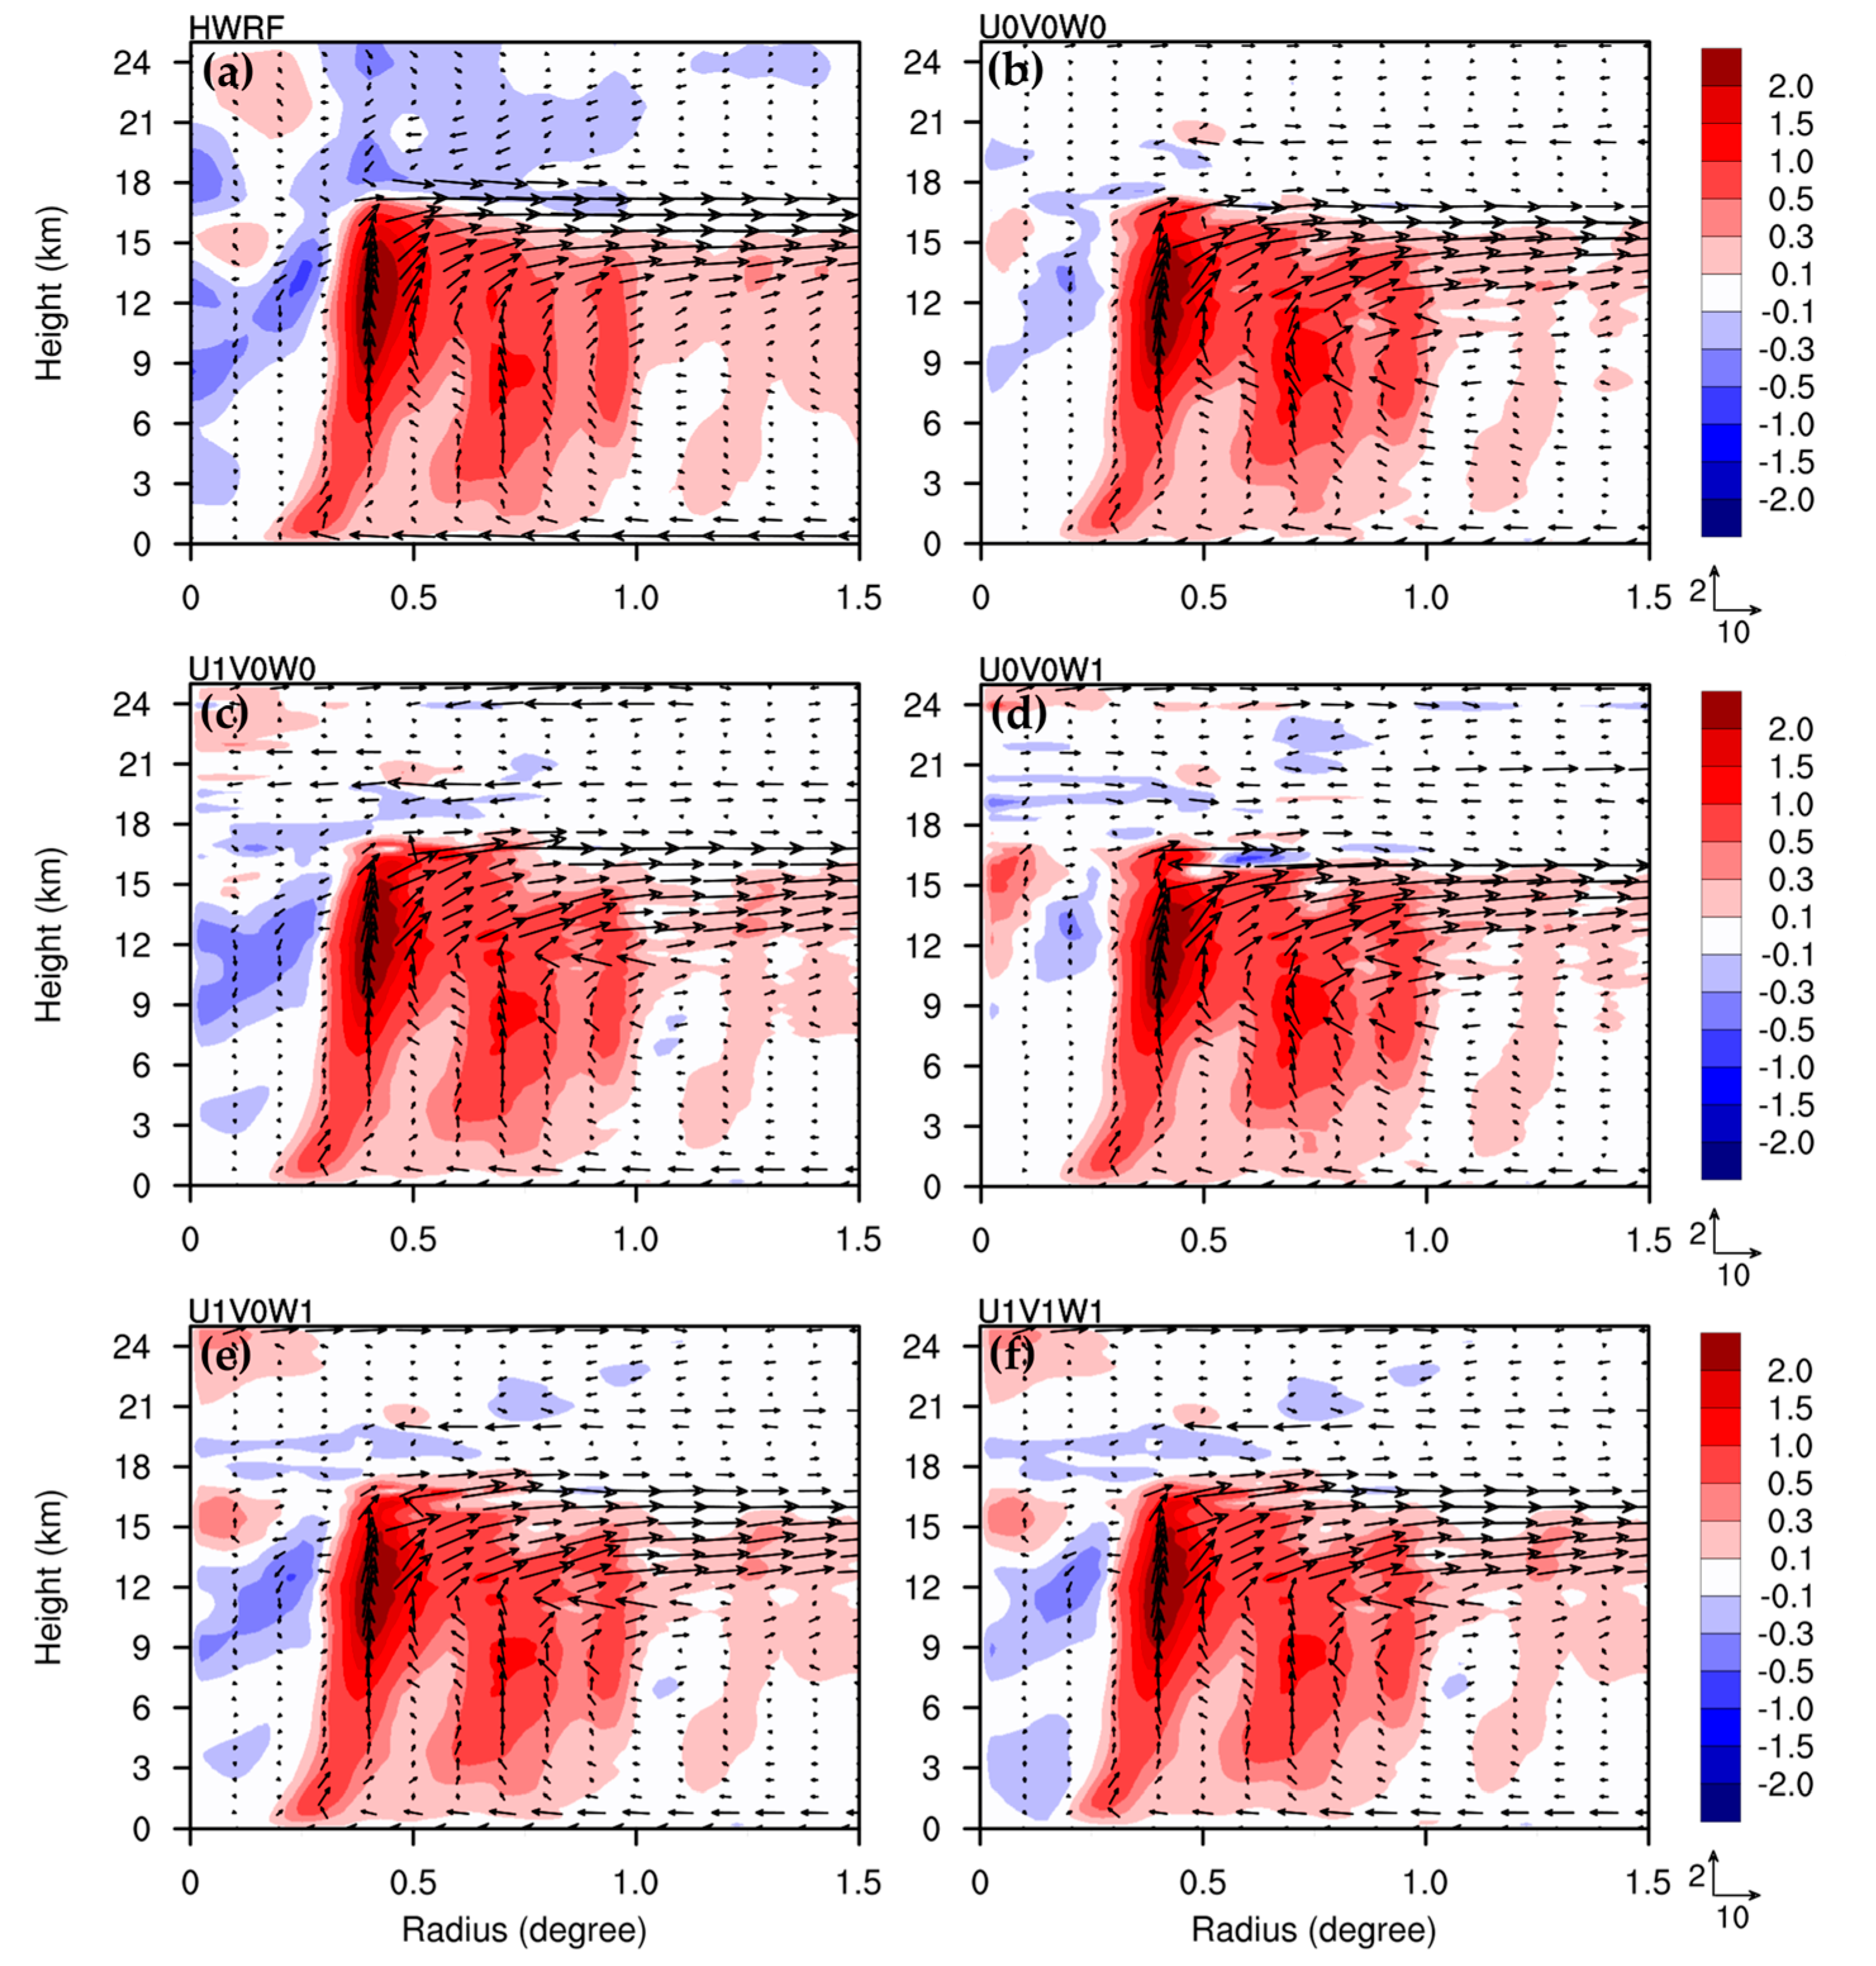
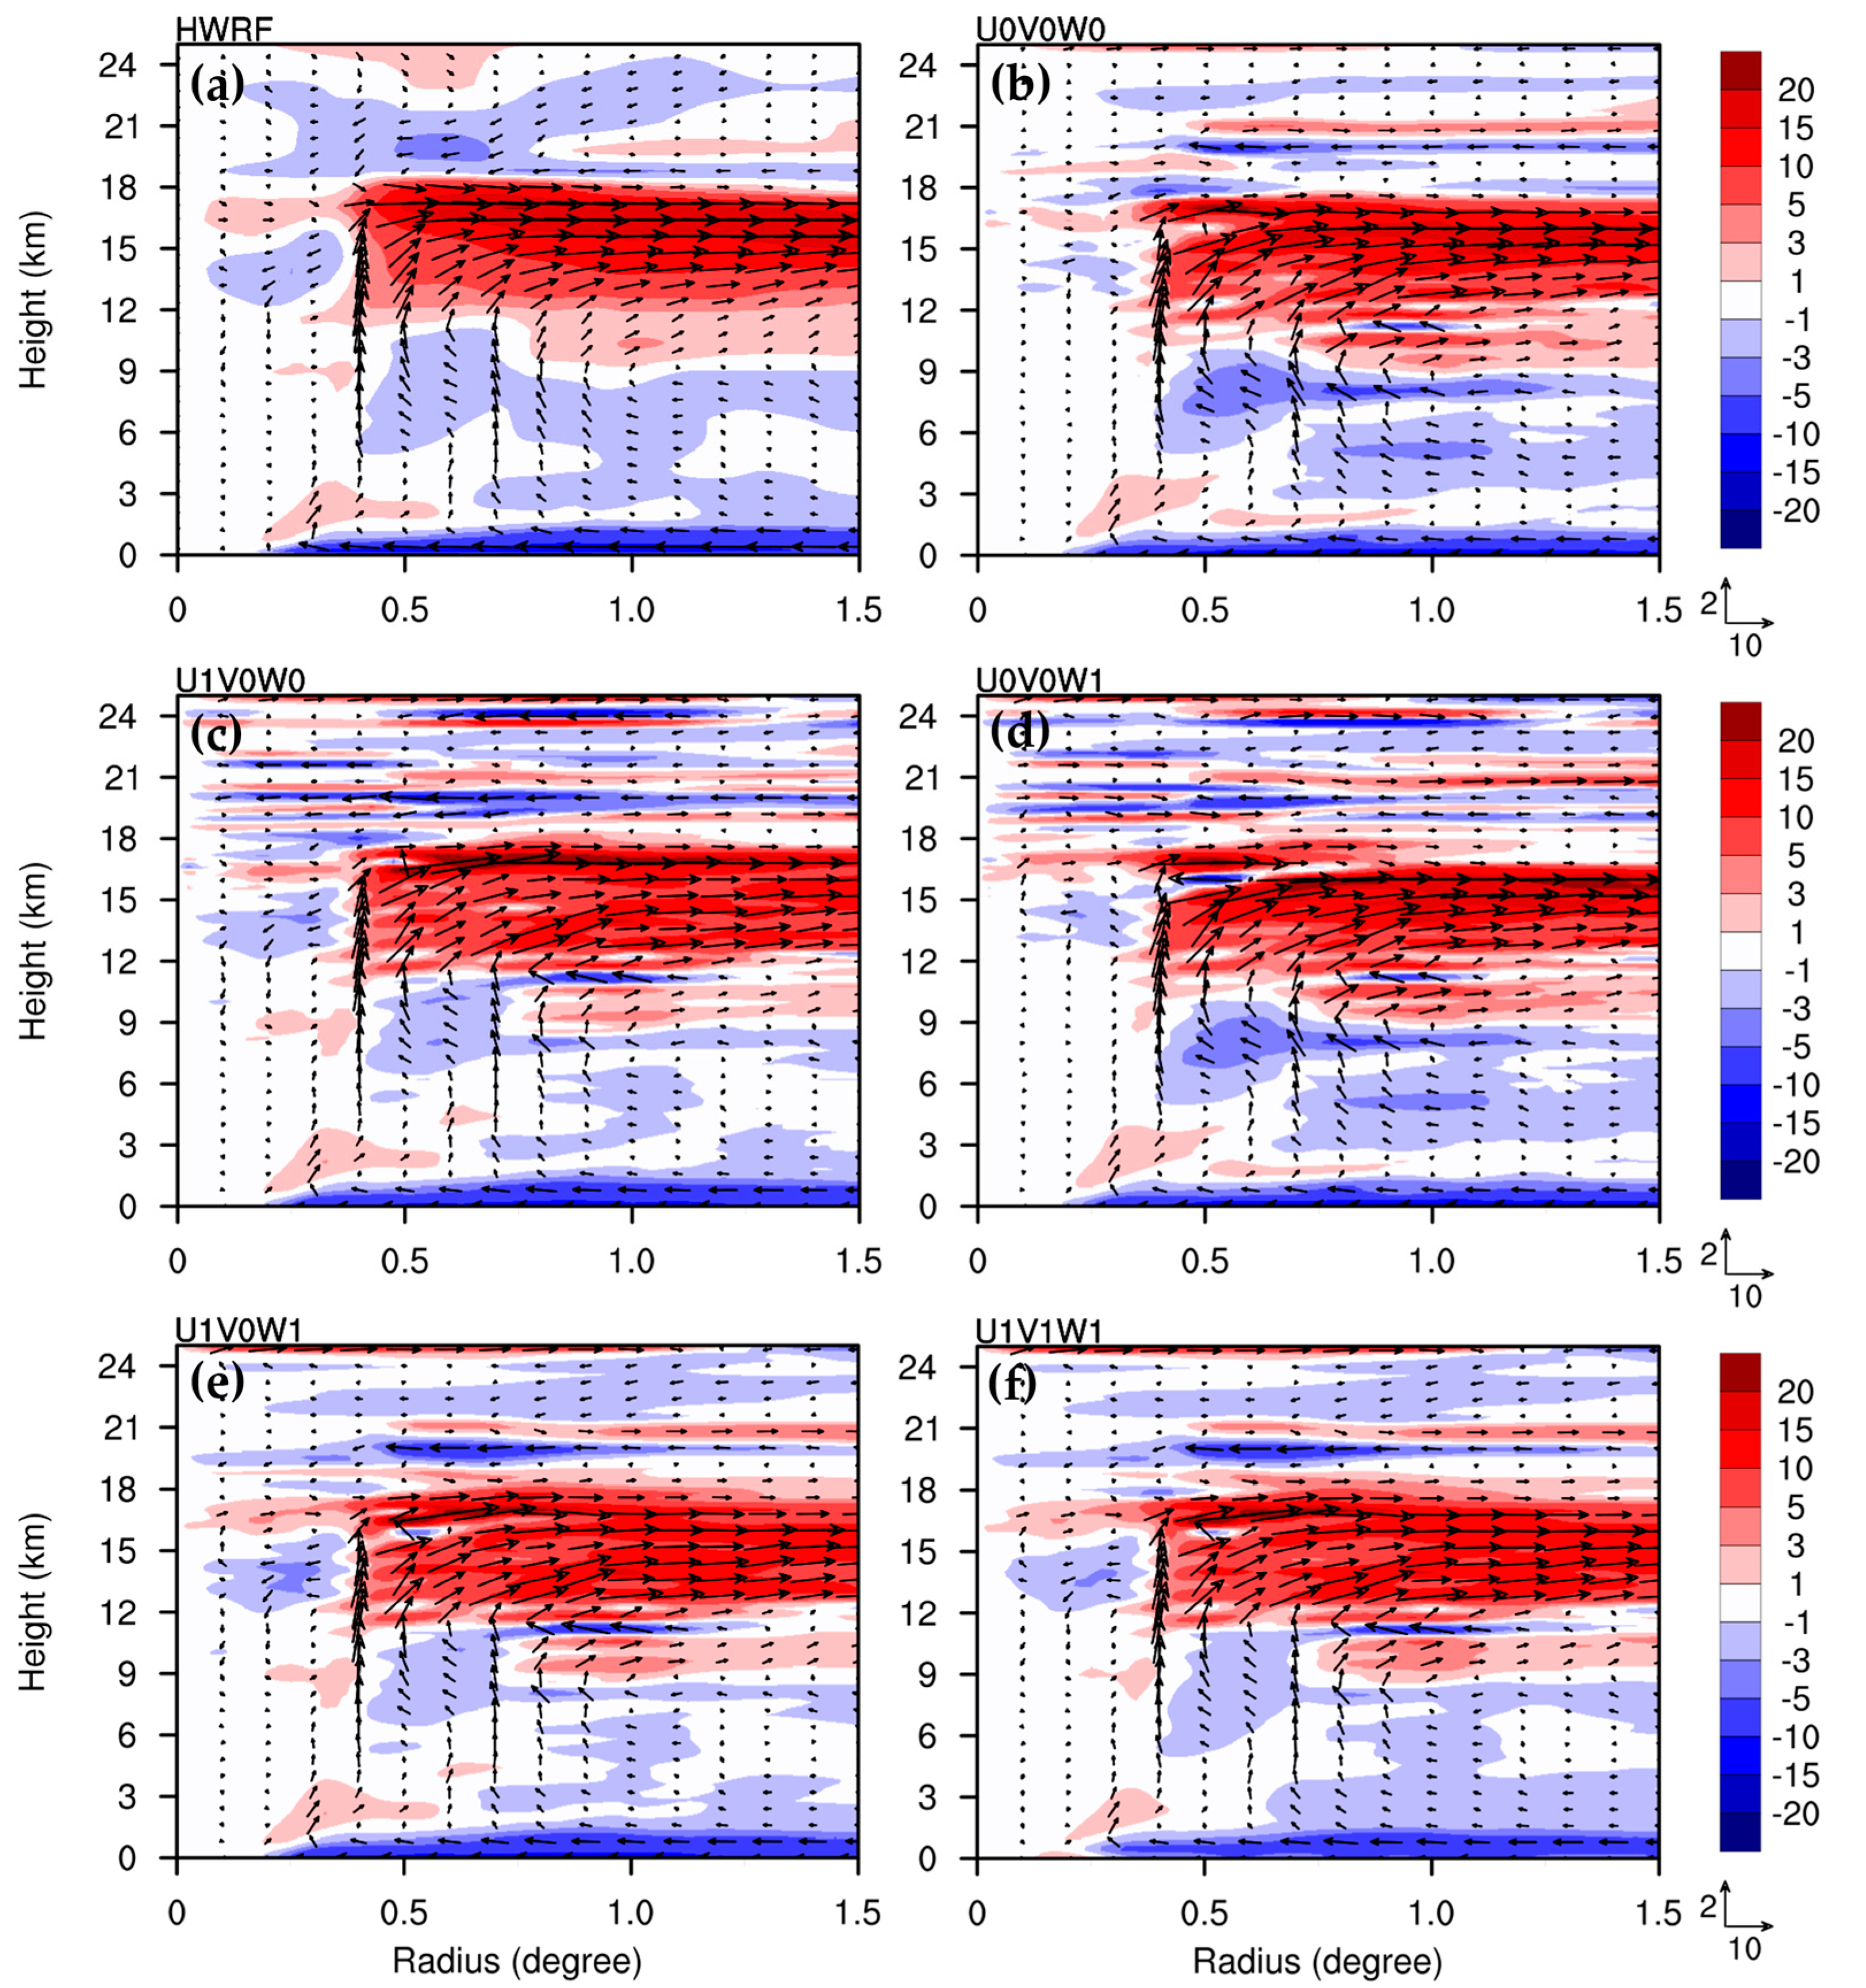
Figure 3 shows the radial wind component for the sensitivity tests, including or ignoring the residual terms in the radial wind, tangential wind, and hydrostatic equations ( U ˙ ,   V ˙ , and W ˙ , respectively) at 24 h, for the nonlinear simulation, CTL. The induced transverse circulation for U0V0W0 is consistent with the nonlinear simulation (Figure 3a), except for the somewhat overestimated radial inflow in the mid-troposphere, at a height of 3–9 km, and an overestimated radial flow above a height of 18 km. The features of our U0V0W0 solution in this study align with the unbalanced solutions noted in [27]. We found that at this time, including U ˙ only slightly reduces the radial inflow in the mid-troposphere, and it reduced the radial outflow at a height of 15–18-km (Figure 3c); however, it produced non-negligible changes in the upper layer, above a height of 18 km. Furthermore, the contribution of W ˙ to transverse circulation mainly occurs in the upper layer, above a height of 18 km (Figure 3d). As the impacts from U1 and W1 cancel each other out above a height of 18 km for U1V0W0 and U0V0W1, the upper-level flow above heights of 18 km in U1V0W1 (Figure 3e) aligns better with the nonlinear simulation. When all the residual terms are included in U1V1W1 (Figure 3f), the radial inflow in the boundary layer is somewhat weaker inside the 0.5 degree radius in the typhoon center. In general, the solution of U1V0W1 captures the radial flow better than the solutions of other sensitivity tests (Table 1). Comparing the results of heights above 20 km, for all tests involving the nonlinear simulation, including any of the three residual terms, resulted in more perturbations in radial flow. We also tested the impacts of U1, V1, and W1 on the SE solution in the absence of the asymmetric eddy heat (the first three terms on the right-hand side (rhs) of Equation (21)) above a height of 20 km. The results indicate that the perturbations exist for U1 and W1, but they disappear for V1. This implies that the effects of the additional source terms (U1 and W1) on the SE solution are treated as part of the known force sources, rather than the implicit solution itself.
Figure 4 shows the vertical wind components produced by the sensitivity tests, including or ignoring U ˙ ,   V ˙ , and, W ˙ , at 24 h, for CTL. At 24 h, U0V0W0 (Figure 4b) captured the upward motions in the eyewall well, within 0.5 degrees and a region of approximately 0.6–1.0 degrees, as compared with the nonlinear simulation (Figure 4a). However, it misses the subsidence of the latter above heights of 17 km height, within 0.3–1 degrees, and it causes underestimated downward motions in the mid-troposphere inside of the eyewall. The induced upward motions for the other sensitivity tests (Figure 4c–f) are similar to U0V0W0, and they are also consistent with the nonlinear simulation. Thus, the contributions of U ˙ ,   V ˙ , and W ˙ to the upward motions of Yutu are not significant. All the sensitivity tests cannot capture the upper-tropospheric subsidence well at a radius of 0.3–1.0 degrees in the nonlinear simulation. It appears that the SE solution produces a more perturbed radial flow above the outflow layer, which may be due to the assumption of symmetric vortex dynamics. Only the sensitivity tests, including U ˙ (Figure 4c,e,f), can further capture the subsidence in the mid-troposphere, inside of the eyewall, despite the intensity occasionally being underestimated. The similar vertical motions between U0V0W0 and U1V1W1 (Figure 4b and Figure 4f, respectively) indicate that the impacts of including U ˙ ,   V ˙ , and W ˙ are not significant as compared with the impacts of the other force terms (momentum source G v and heat source H θ ).
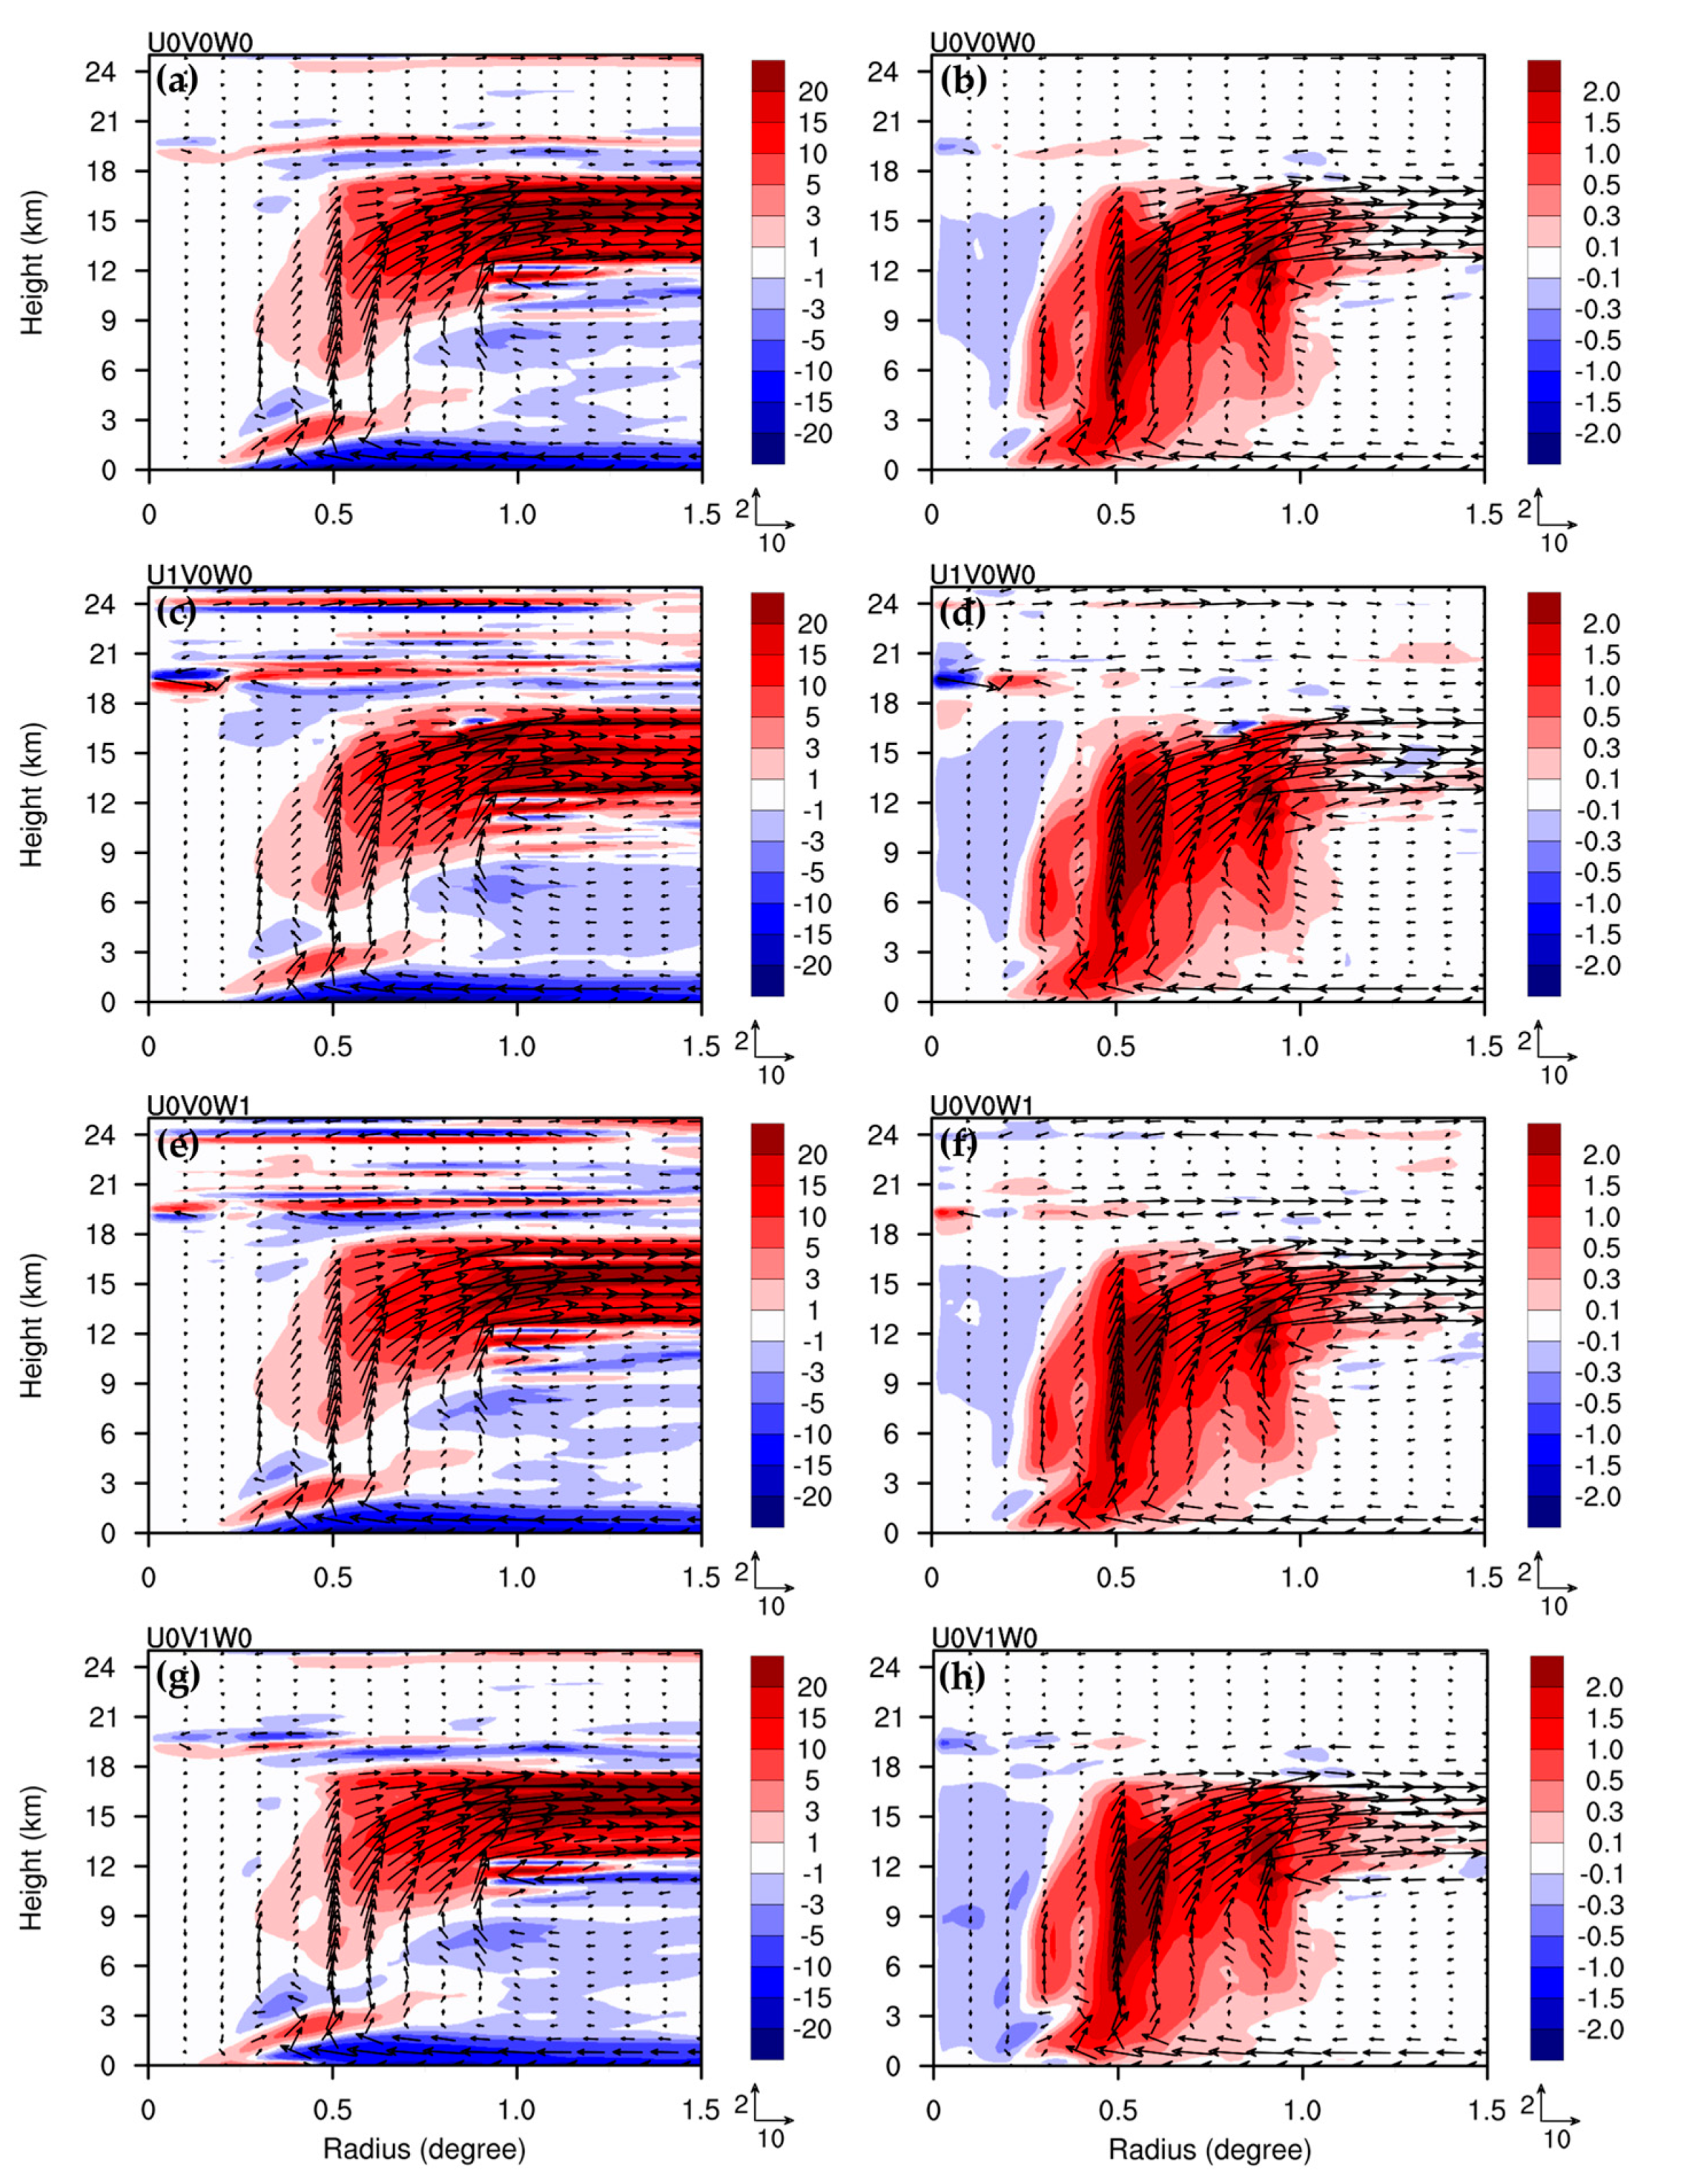
Figure 5 shows the radial and vertical wind components for the sensitivity tests including or ignoring U ˙ ,   V ˙ , and W ˙ , at 48 h, for CTL. The transverse circulation for Yutu at this time was further intensified compared with its state at 24 h. U0V0W0 (Figure 5a,b) captures the transverse circulation of the nonlinear simulation well, except for the subsidence above heights of 17 km, at a radius of 0.4–0.7 degrees (Figure 2a,b). Indeed, for U0V0W0, there was a strong inflow at heights less than 2 km, a relatively weak inflow outside the eyewall at heights of 3–9 km, and a relatively deep outflow in the upper troposphere at heights of 12–18 km (Figure 5a). Moreover, there was an intense updraft at a radius of 0.5 degrees from the typhoon center that extended to the upper troposphere at heights of approximately 17 km, a relatively strong updraft at a radius of 0.9 degrees, and a relatively weak updraft inside the eyewall (Figure 5b). The contributions of U ˙ and W ˙ to the radial wind component mainly occurred above heights of 18 km (Figure 5c,e). These contributions also largely canceled each other out when both U ˙ and W ˙ were included (see Figure 2g). This result is similar to those obtained at 24 h (see Figure 3e). When V ˙ was included, the radial outflow increased in the boundary layer, inside a radius of 0.5 degrees from the typhoon center (Figure 5g). We note that the weaker boundary-layer inflow was obtained for U0V1W0, rather than U0V0W0, which aligns with the results in [27], regarding the impact of V ˙ . In summary, the contributions of U ˙ ,   V ˙ , and W ˙ are more pronounced in the boundary layer of heights less than 1 km, in the mid-troposphere outside the eyewall, and in the upper level above heights of 18 km. For vertical motions, all the sensitivity tests cannot capture the subsidence above heights of 17 km in the eyewall well, nor inside the eyewall at heights less than 18 km in the nonlinear simulation. The sensitivity test with U1, V0, and W1 provides the most consistent solution with the nonlinear simulation than the other tests. Thus, we only included U ˙ and W ˙ when solving the SE equation in the experiments described in the next section, which investigated the impacts of the total force sources.
As mentioned in the introduction, the SE equation is a linear partial differential equation; thus, to clarify the contributions of U ˙ ,   V ˙ , and W ˙ to the induced transverse circulation of the vortex, sensitivity tests, including only U ˙ ,   V ˙ , and W ˙ (denoted as U1, V1, and W1, respectively), were conducted. Note that the momentum source G v , and heat source H θ , were not used to solve the solution in these tests. For example, the total force sources of the U1 solution include the forcing terms associated with U ˙ only, without the momentum source G v , heat source H θ , or the residual terms, V ˙ and W ˙ . Figure 6 shows the radial and vertical wind components for U1, V1, and W1 at 48 h for CTL. The contributions of U ˙ to the radial wind component mainly occurred in the upper layer, though it slightly contributed to the radial outflow at heights of approximately 8–13 km (Figure 6a). However, U ˙ does not affect the induced radial inflow in the boundary layer of the SE solution. The contributions of U ˙ to the vertical wind component are mainly observed in the mid-troposphere, at heights of approximately 6–17 km (Figure 6b). Indeed, the induced downward motions for U1 occur in the eyewall and outside the inner eyewall in the mid-troposphere. However, this was not especially evident, as shown in Figure 5d. The contribution of V ˙ to the induced transverse circulation mainly occurred in the layer comprising heights less than 18 km, particularly in the upper-level outflow and in the boundary layer inflow (Figure 6c,d). Note that a weak radial outflow was observed near the surface in V1, which is the reason for a weaker boundary-layer inflow for U0V1W0, as compared with U0V0W0. The contributions of W ˙ to the radial wind component mainly occurred at heights above 15 km (Figure 6e). We found that including W ˙ can reduce the radial outflow in the upper layer comprising heights of nearly 17 km, while increasing the radial outflow below that layer. The contribution of W ˙ to the vertical wind component is not significant in the troposphere (Figure 6f). In general, the contributions of the residual terms are not significant in the troposphere, as compared with the impacts of the heat source H θ . V ˙ comprises uncertain numerical residues in the tangential-wind tendency equation. We simply ignored this uncertain contribution to the SE solution, and it did not affect vortex intensification in the troposphere.

4.3. Sensitivity Tests on the Total Force Sources

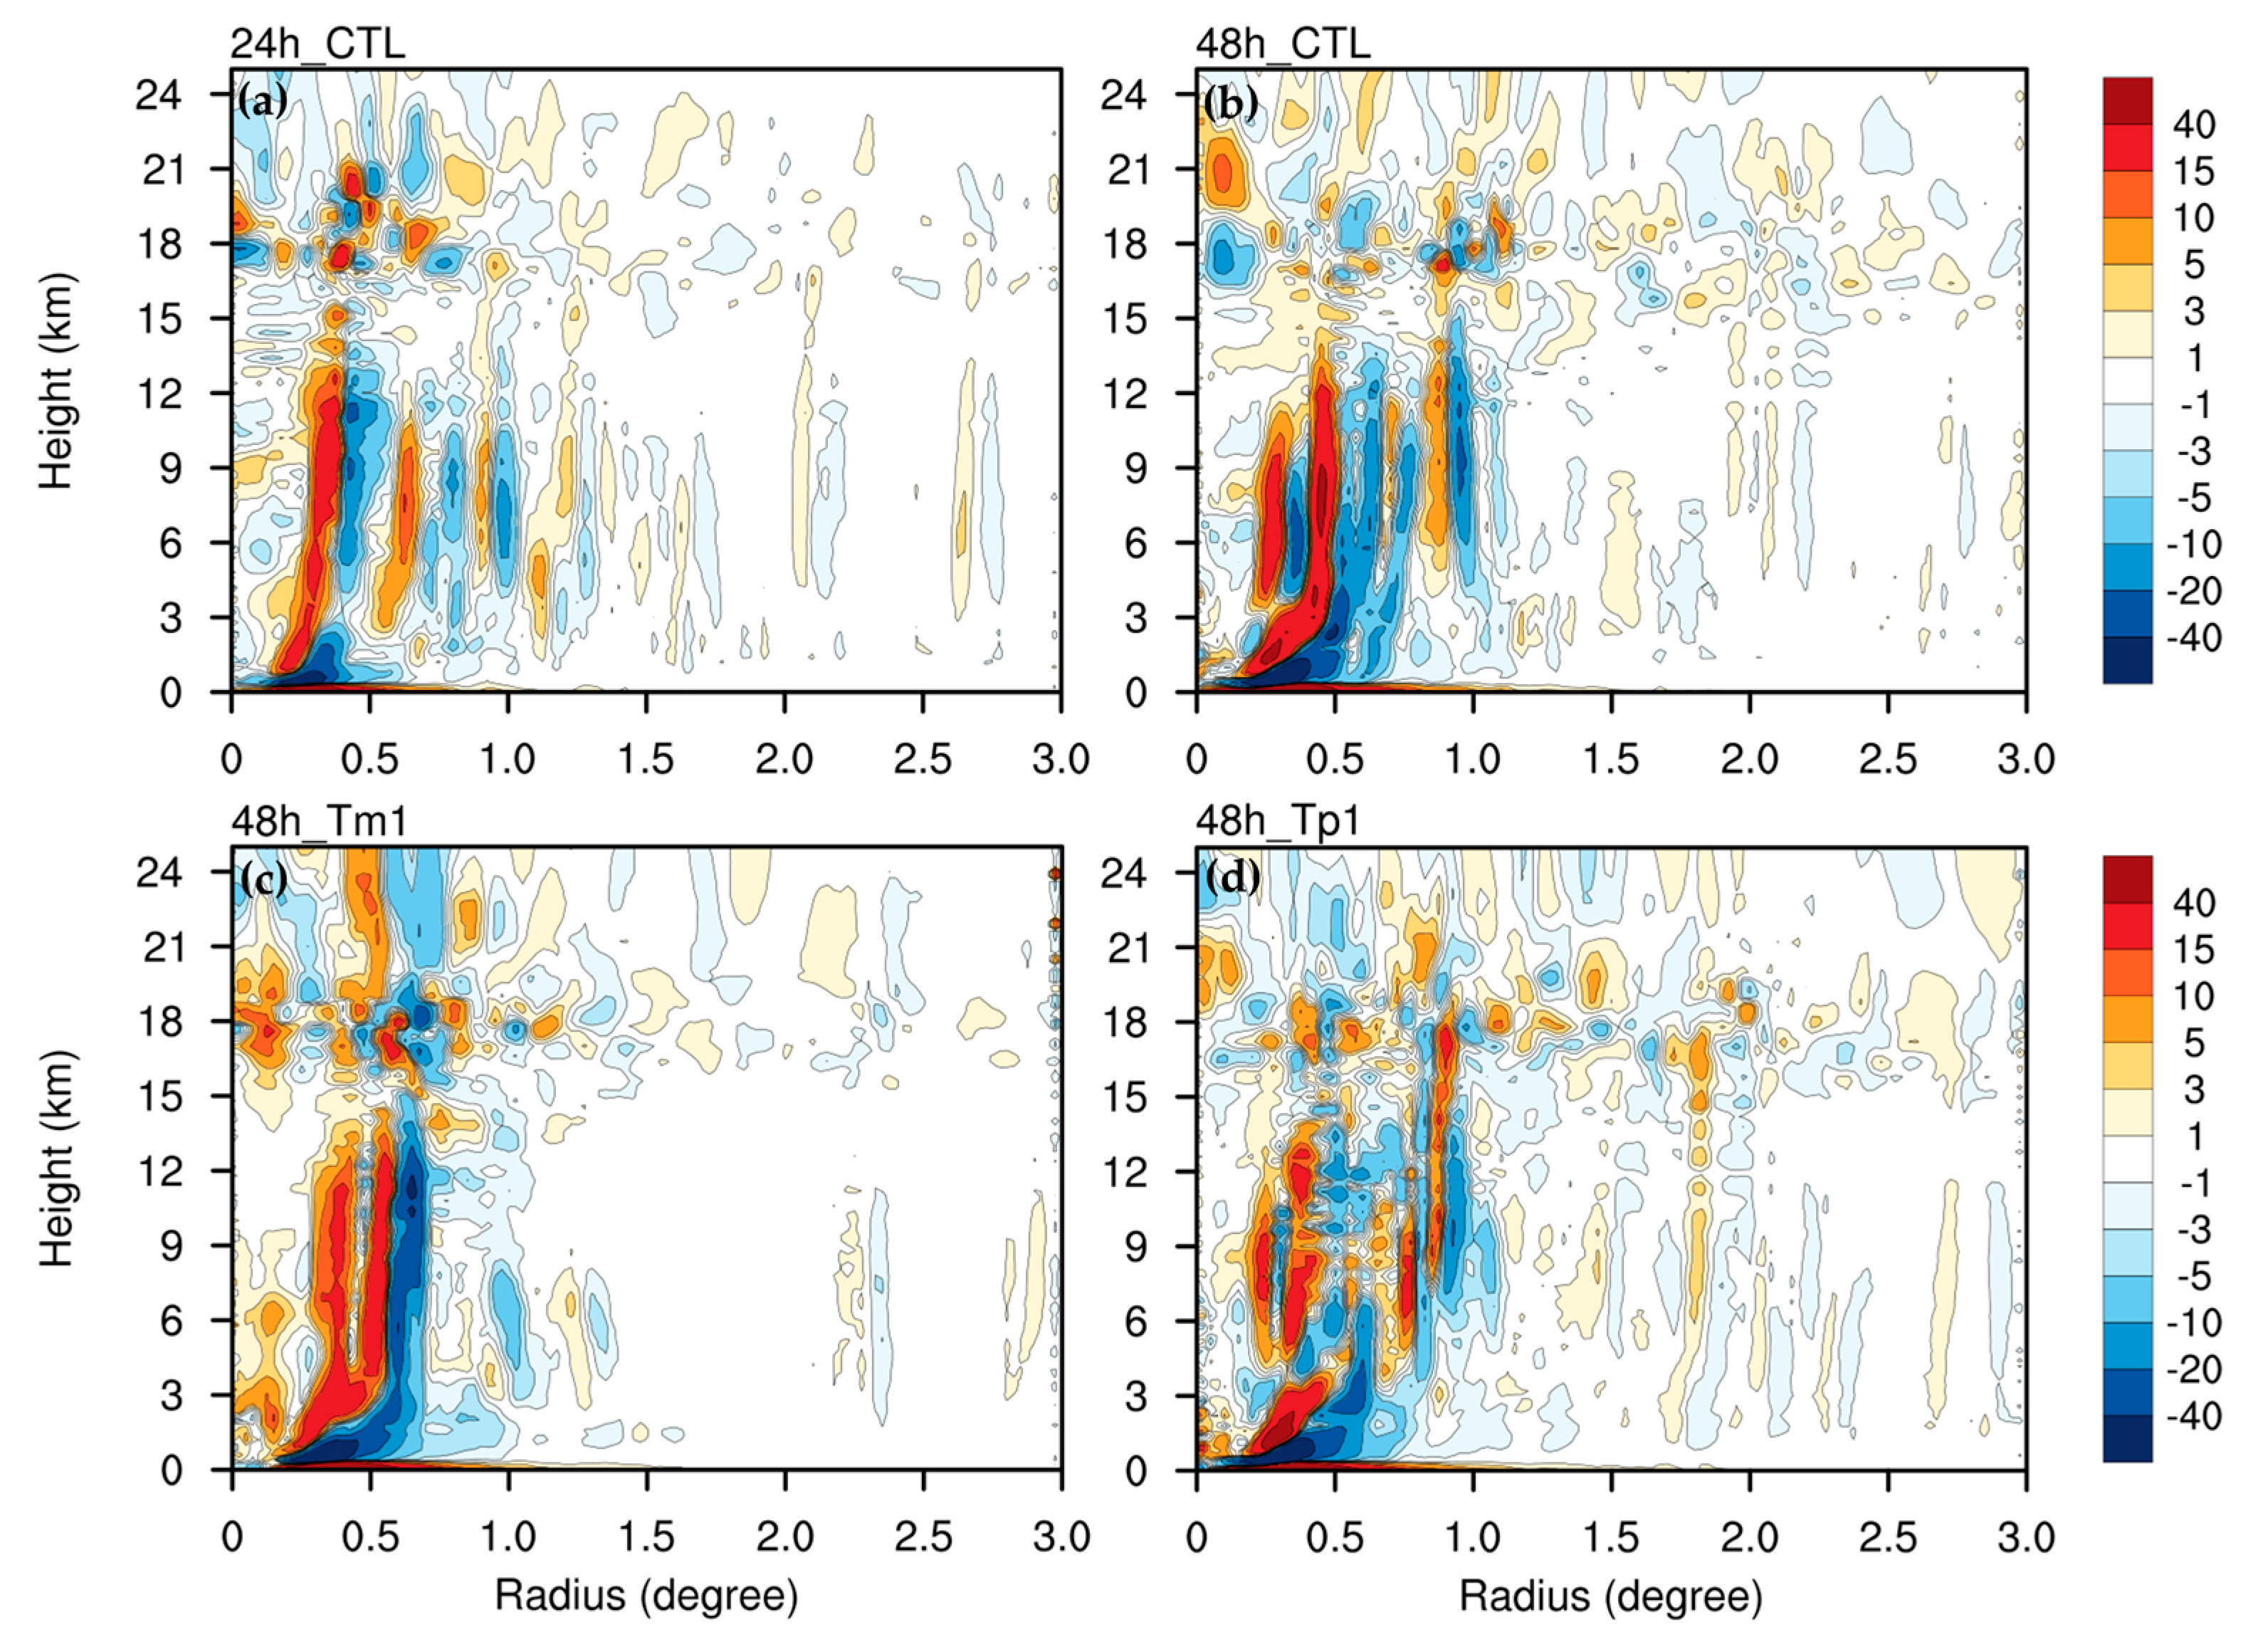
The total force sources (force terms on the rhs of Equation (26), except the fourth term) in the entire domain of the SE solution for CTL, Tp1, and Tm1 are shown in Figure 7. The total force was mostly concentrated within a radius of 1 degree from the typhoon center for CTL at both 24 h and 48 h, as well as for Tp1 at 48 h (Figure 7a,b,d); however, it was only concentrated within a radius of 0.6 degrees for Tm1 at 48 h (Figure 7c). For CTL, the maximum total force source in the inner vortex core at 48 h was approximately double that at 24 h, which is consistent with the stronger intensity of Yutu at 48 h compared with 24 h, as shown in Figure 1b. Tp1 showed a stronger intensity at 48 h than Tm1 (see Figure 1b), however, the total force source in the mid-troposphere for Tm1 is stronger than Tp1, in spite of its associated smaller heating force at a height of 2 km in the eyewall (Figure 7c,d). For Tp1, the structure of the total force source in the mid-troposphere is much different from that of CTL and Tm1. Note that the total force sources in the tropospheric eyewall region, at heights less than 15 km, are mainly caused by the effect of diabatic heating, whereas the total force sources above heights of 15 km contributed to asymmetric eddy heating. Since the total force is insignificant outside a radius of 1.5 degrees from the typhoon center, we focused on the induced transverse circulation within 1.5 degrees.
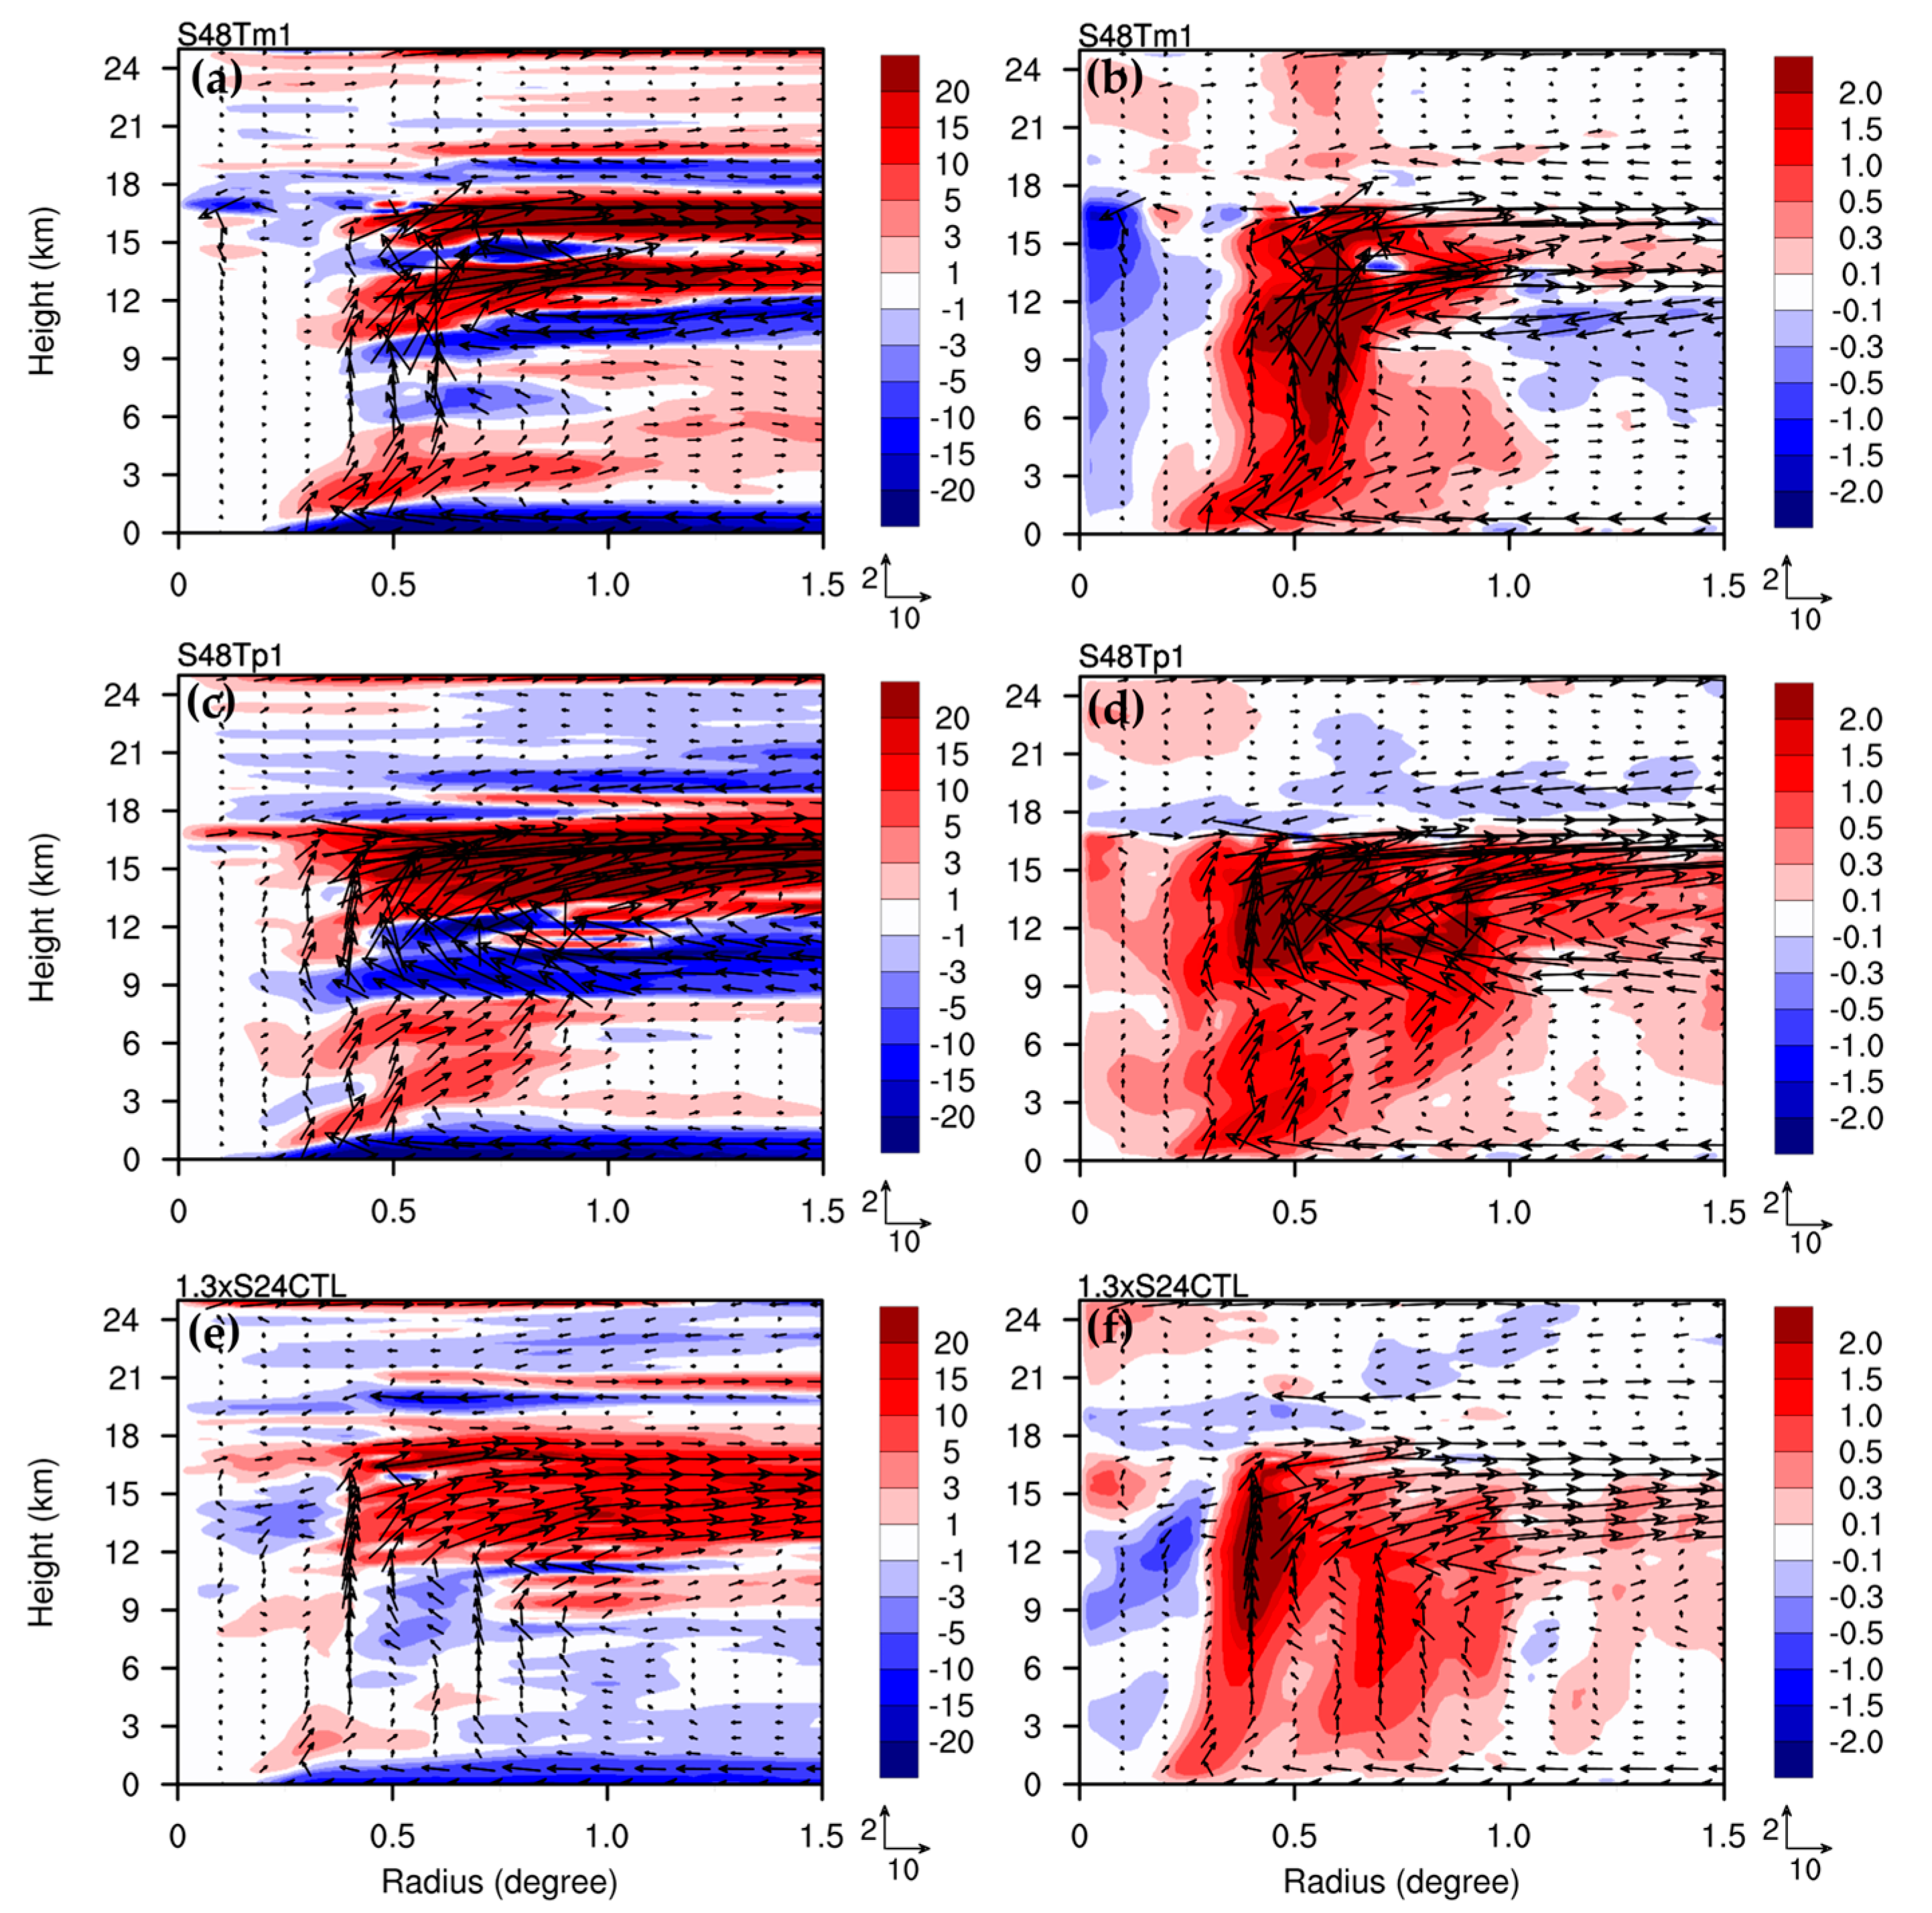
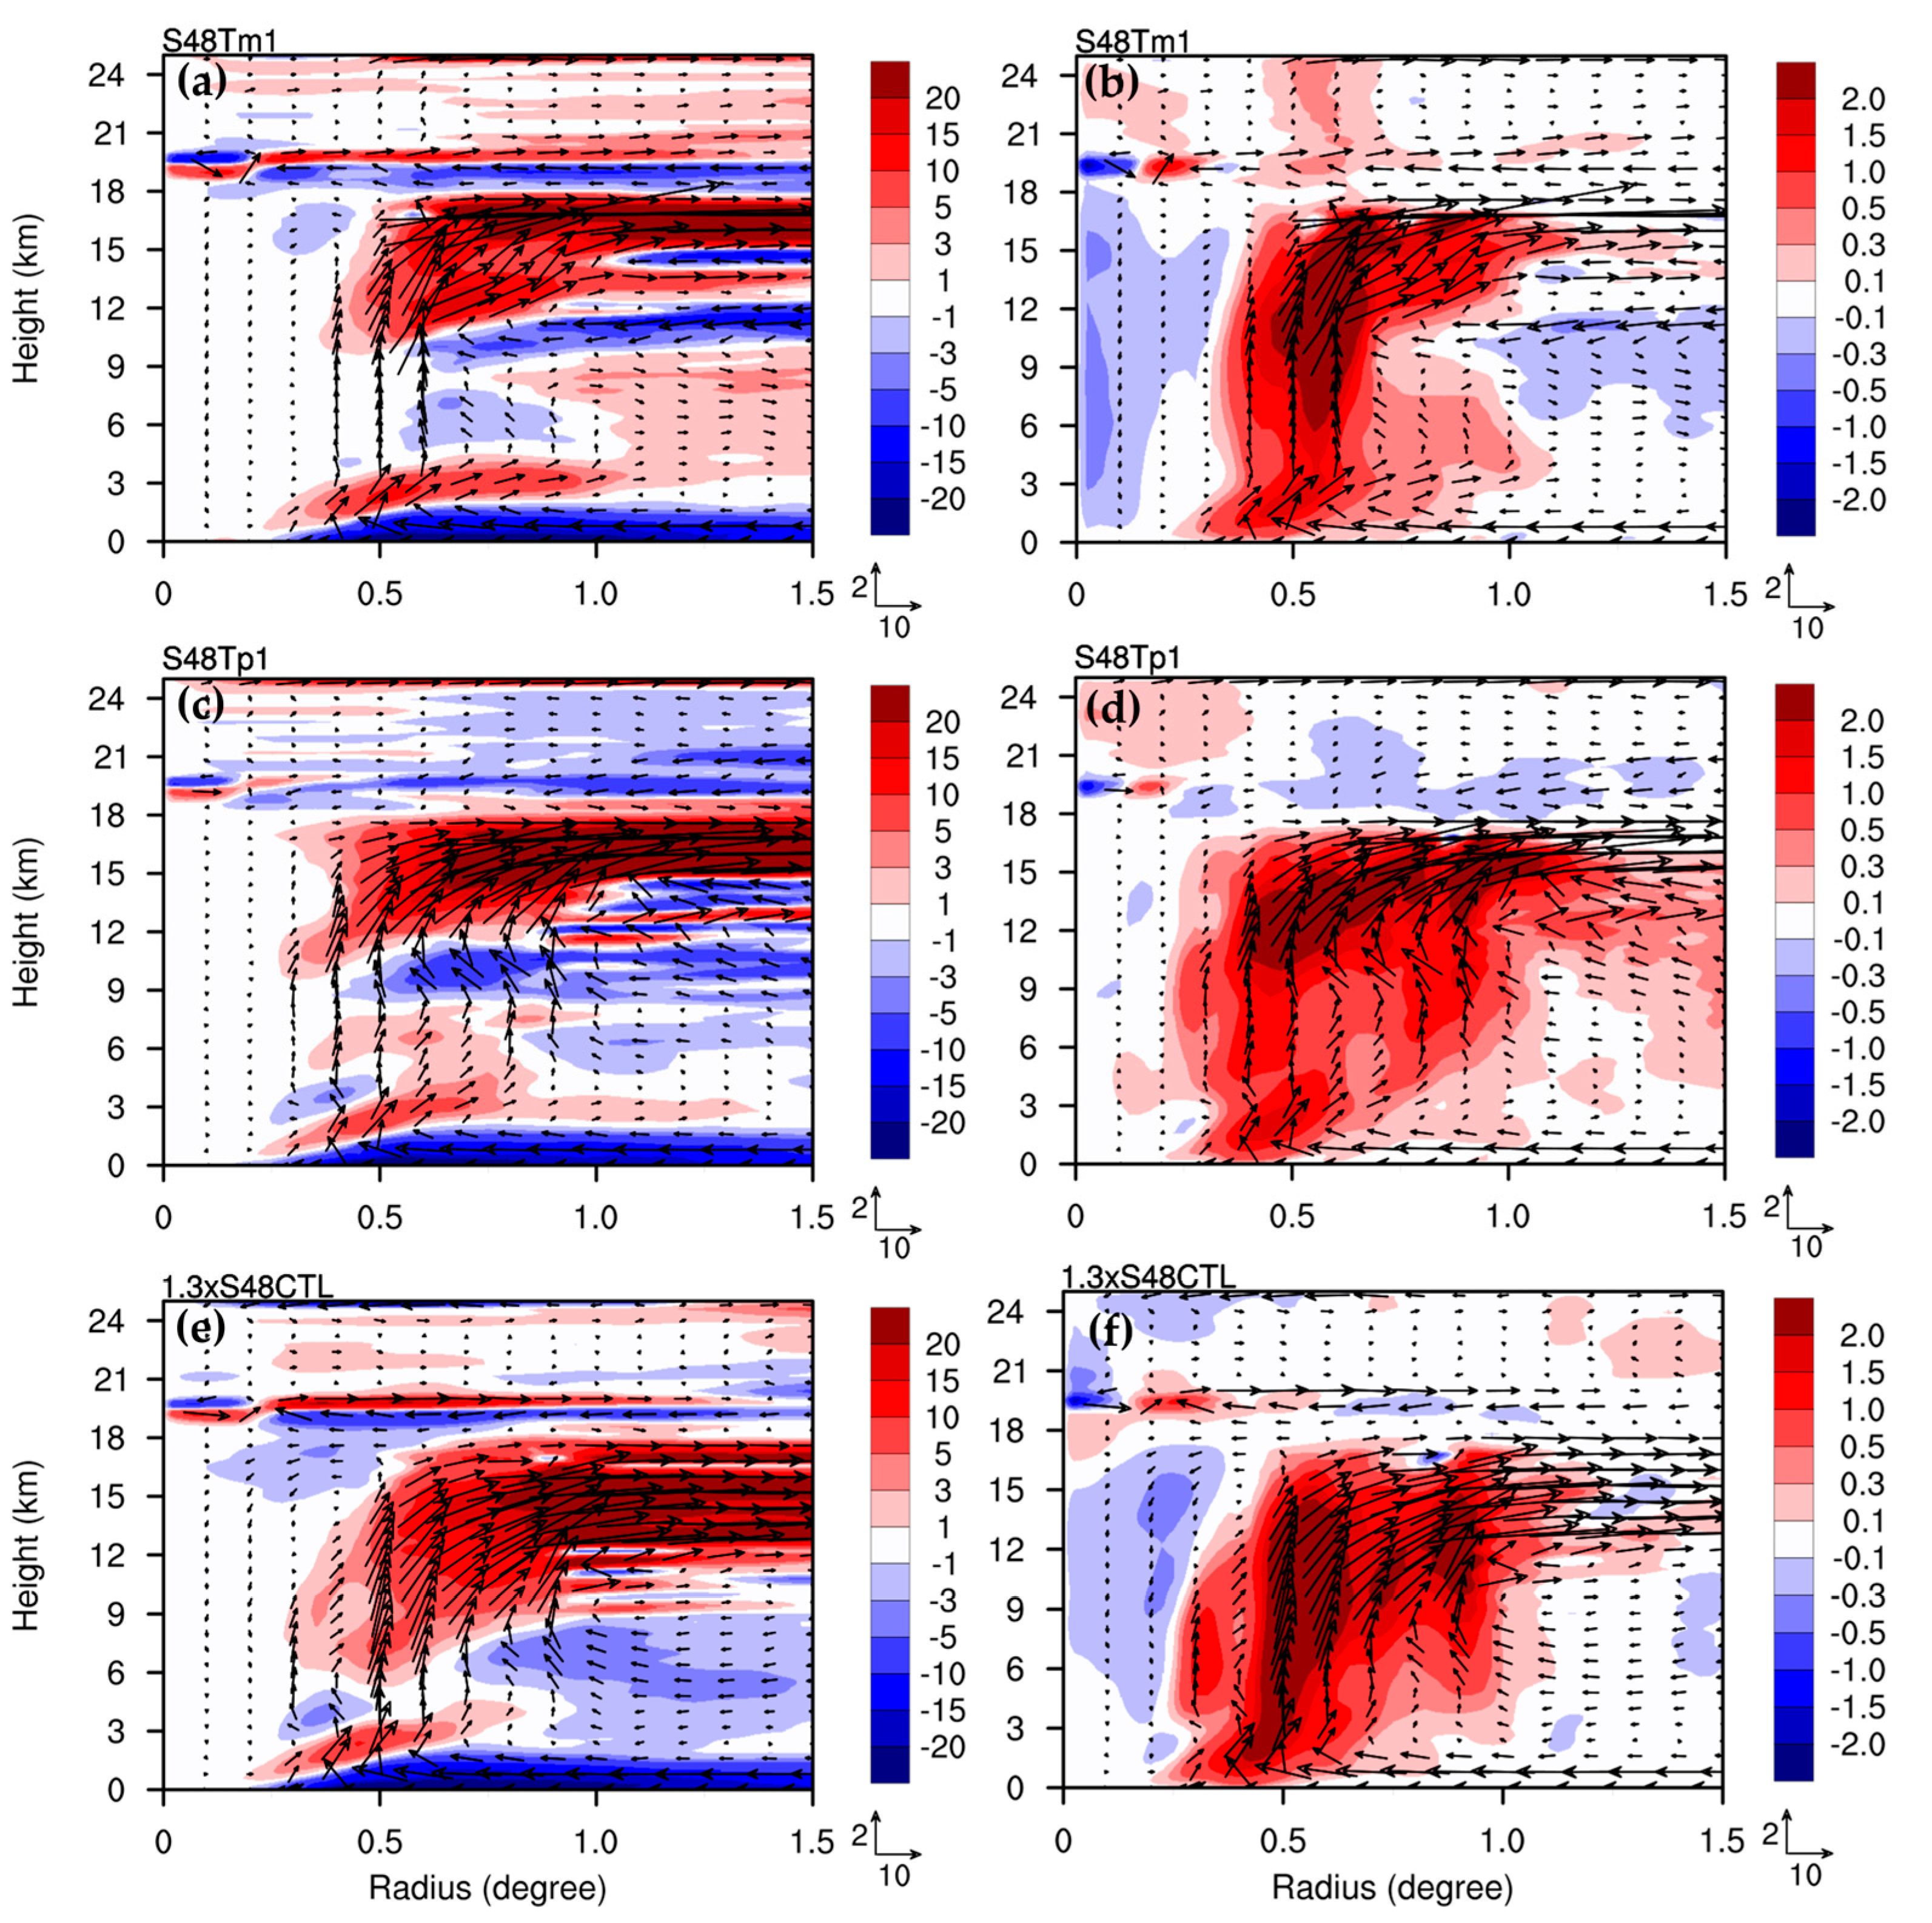
To explore the sensitivity of the induced transverse circulation to the total force sources, the force term (S) of Tm1 and Tp1 at 48 h was used to replace the force in the nonlinear simulation, for CTL, at 24 h, in the experiments S48Tp1 and S48Tm1, respectively. The total force sources for CTL at 24 h, and for S48Tm1 and S48Tp1 at 48 h, are shown in Figure 7a, Figure 7c, and Figure 7d, respectively. At 24 h, the induced transverse circulations for S48Tm1 and S48Tp1 (Figure 8a–d) were much stronger than those obtained by the original total force of CTL at 24 h (Figure 3e and Figure 4e) for the lower-level inflow, upper-level outflow, and upward motion in the eyewall. As shown in Figure 7, the force sources of S48Tm1 and S48Tp1, inside a radius of 1 degree, were larger than those at 24 h for CTL. Furthermore, the distributions of the force sources of S48Tm1 and S48Tp1 at 48 h were inconsistent with those for CTL at 24 h. Consequently, the induced transverse circulation for S48Tm1 and S48Tp1 at 24 h was overestimated and significantly disorganized. Indeed, the radial inflow at a height of 2–9-km, at 24 h, for U1V0W1, corresponded with the nonlinear CTL, and it was replaced with the radial outflow of the SE solution in S48Tm1 and S48Tp1 (Figure 8a,c). There was a much stronger radial inflow below the upper-level outflow at a height of 9–12-km that was missing in U1V0W1 and in the nonlinear simulation CTL (see Figure 3a). The induced transverse circulation for S48Tp1 was stronger than S48Tm1. The subsidence inside the eyewall was observed in S48Tm1, but it was overestimated (Figure 8b). However, it was not produced in S48Tp1, as an upward motion in the inner TC vortex was produced instead (Figure 8d). The upward motion at a radius of 0.7 degrees was not clearly induced in S48Tm1 at 24 h, and it was overestimated in S48Tp1 at 24 h. We also conducted one sensitivity experiment with the total force source of CTL at 24 h, but we increased it by 1.3 times (denoted as 1.3xS24CTL). The induced transverse circulation for 1.3xS24CTL (Figure 8e,f) was similar to U1V0W1 (Figure 3e and Figure 4e), which is consistently collocated, but with stronger intensity.
We also used the force terms of S48Tm1 and S48Tp1 at 48 h for U1V0W1 at 48 h to obtain the SE solutions. The induced transverse circulations for S48Tm1 and S48Tp1 at 48 h are shown in Figure 9a–d. The induced transverse circulations for S48Tm1 and S48Tp1 were more organized at 48 h than 24 h. There was a radial inflow below the upper-level outflow, at a height of 9–12 km, at 48 h, which is similar to the results obtained at 24 h. Note that this radial inflow is missing in U1V0W1 at both 24 h and 48 h. There is a radial outflow and radial inflow above heights of 18 km for S48Tm1 and S48Tp1, respectively (Figure 9a,c). Upward motions outside the eyewall were not found in S48Tm1 (Figure 9b), which can be explained by the confined total force of S48Tm1 that was only concentrated in the radius of 0.3 to 0.6 degrees (see Figure 7c). The experiment, 1.3xS48CTL, conducted with 1.3 times the total force source of CTL at 48 h, provided a similar induced transverse circulation (Figure 9e,f), but at stronger intensity, compared with U1V0W1 at 48 h. In brief, the sensitivity tests indicate that a structural misplaced change in total force source may cause greater disorganization in the induced transverse circulation, whereas collocated intensity change only results in a proportional enhancement. This also implies that the intensification of the primary vortex in nonlinear processes requires a dynamically consistent force enhancement following the development of transverse circulation. Based on symmetric vortex dynamics, a weaker mean vortex cannot correctly ‘spin up’ with a misplaced stronger force that will produce a largely distorted transverse circulation.
The induced transverse circulation is mainly caused by the effect of diabatic heating (e.g., [20,27,31]). Diabatic heating drives a deep inflow layer in the middle–lower troposphere, and a broad outflow layer in the upper troposphere. Moreover, the upward motion forced by diabatic heating is dominant in the eyewall. The diabatic heating rates derived from the nonlinear simulation for CTL at 24 h, and CTL, Tm1, and Tp1 at 48 h are shown in Figure 10. At 24 h, there were two maxima of the diabatic heating rate; one occurred near a radius of 0.4 degrees, and the other occurred near a radius of 0.7 degrees, with a maximum magnitude of approximately 10 K h−1 and 8 K h−1, respectively (Figure 10a). The two maxima diabatic heating rates are consistent with the two strong upward motions of CTL at 24 h (see Figure 4a), and their locations are also consistent with the positions of stronger force sources, as shown in Figure 7a. At 48 h, diabatic heating developed with three maximum zones (Figure 10b), which were collocated with the stronger total force, shown in Figure 7b. The maximum heating rate over 12 K h−1, at heights of approximately 6–8 km, is stronger than that at 24 h. The diabatic heating rate was largely confined to a vertical column in an annular region, with radii between 0.4–0.6 degrees for Tm1 (Figure 10c). However, the maximum diabatic heating rate occurred at heights less than 2 km for Tp1 (Figure 10d). The heating rate was mostly concentrated at heights less than 14 km. The diabatic heating distribution was similar to the vertical motion, as both followed the total force distribution shown in Figure 7. This implies that the transverse circulation of the intense typhoon was dominated by diabatic heating in the inner vortex.

4.4. Tangential Velocity Tendency

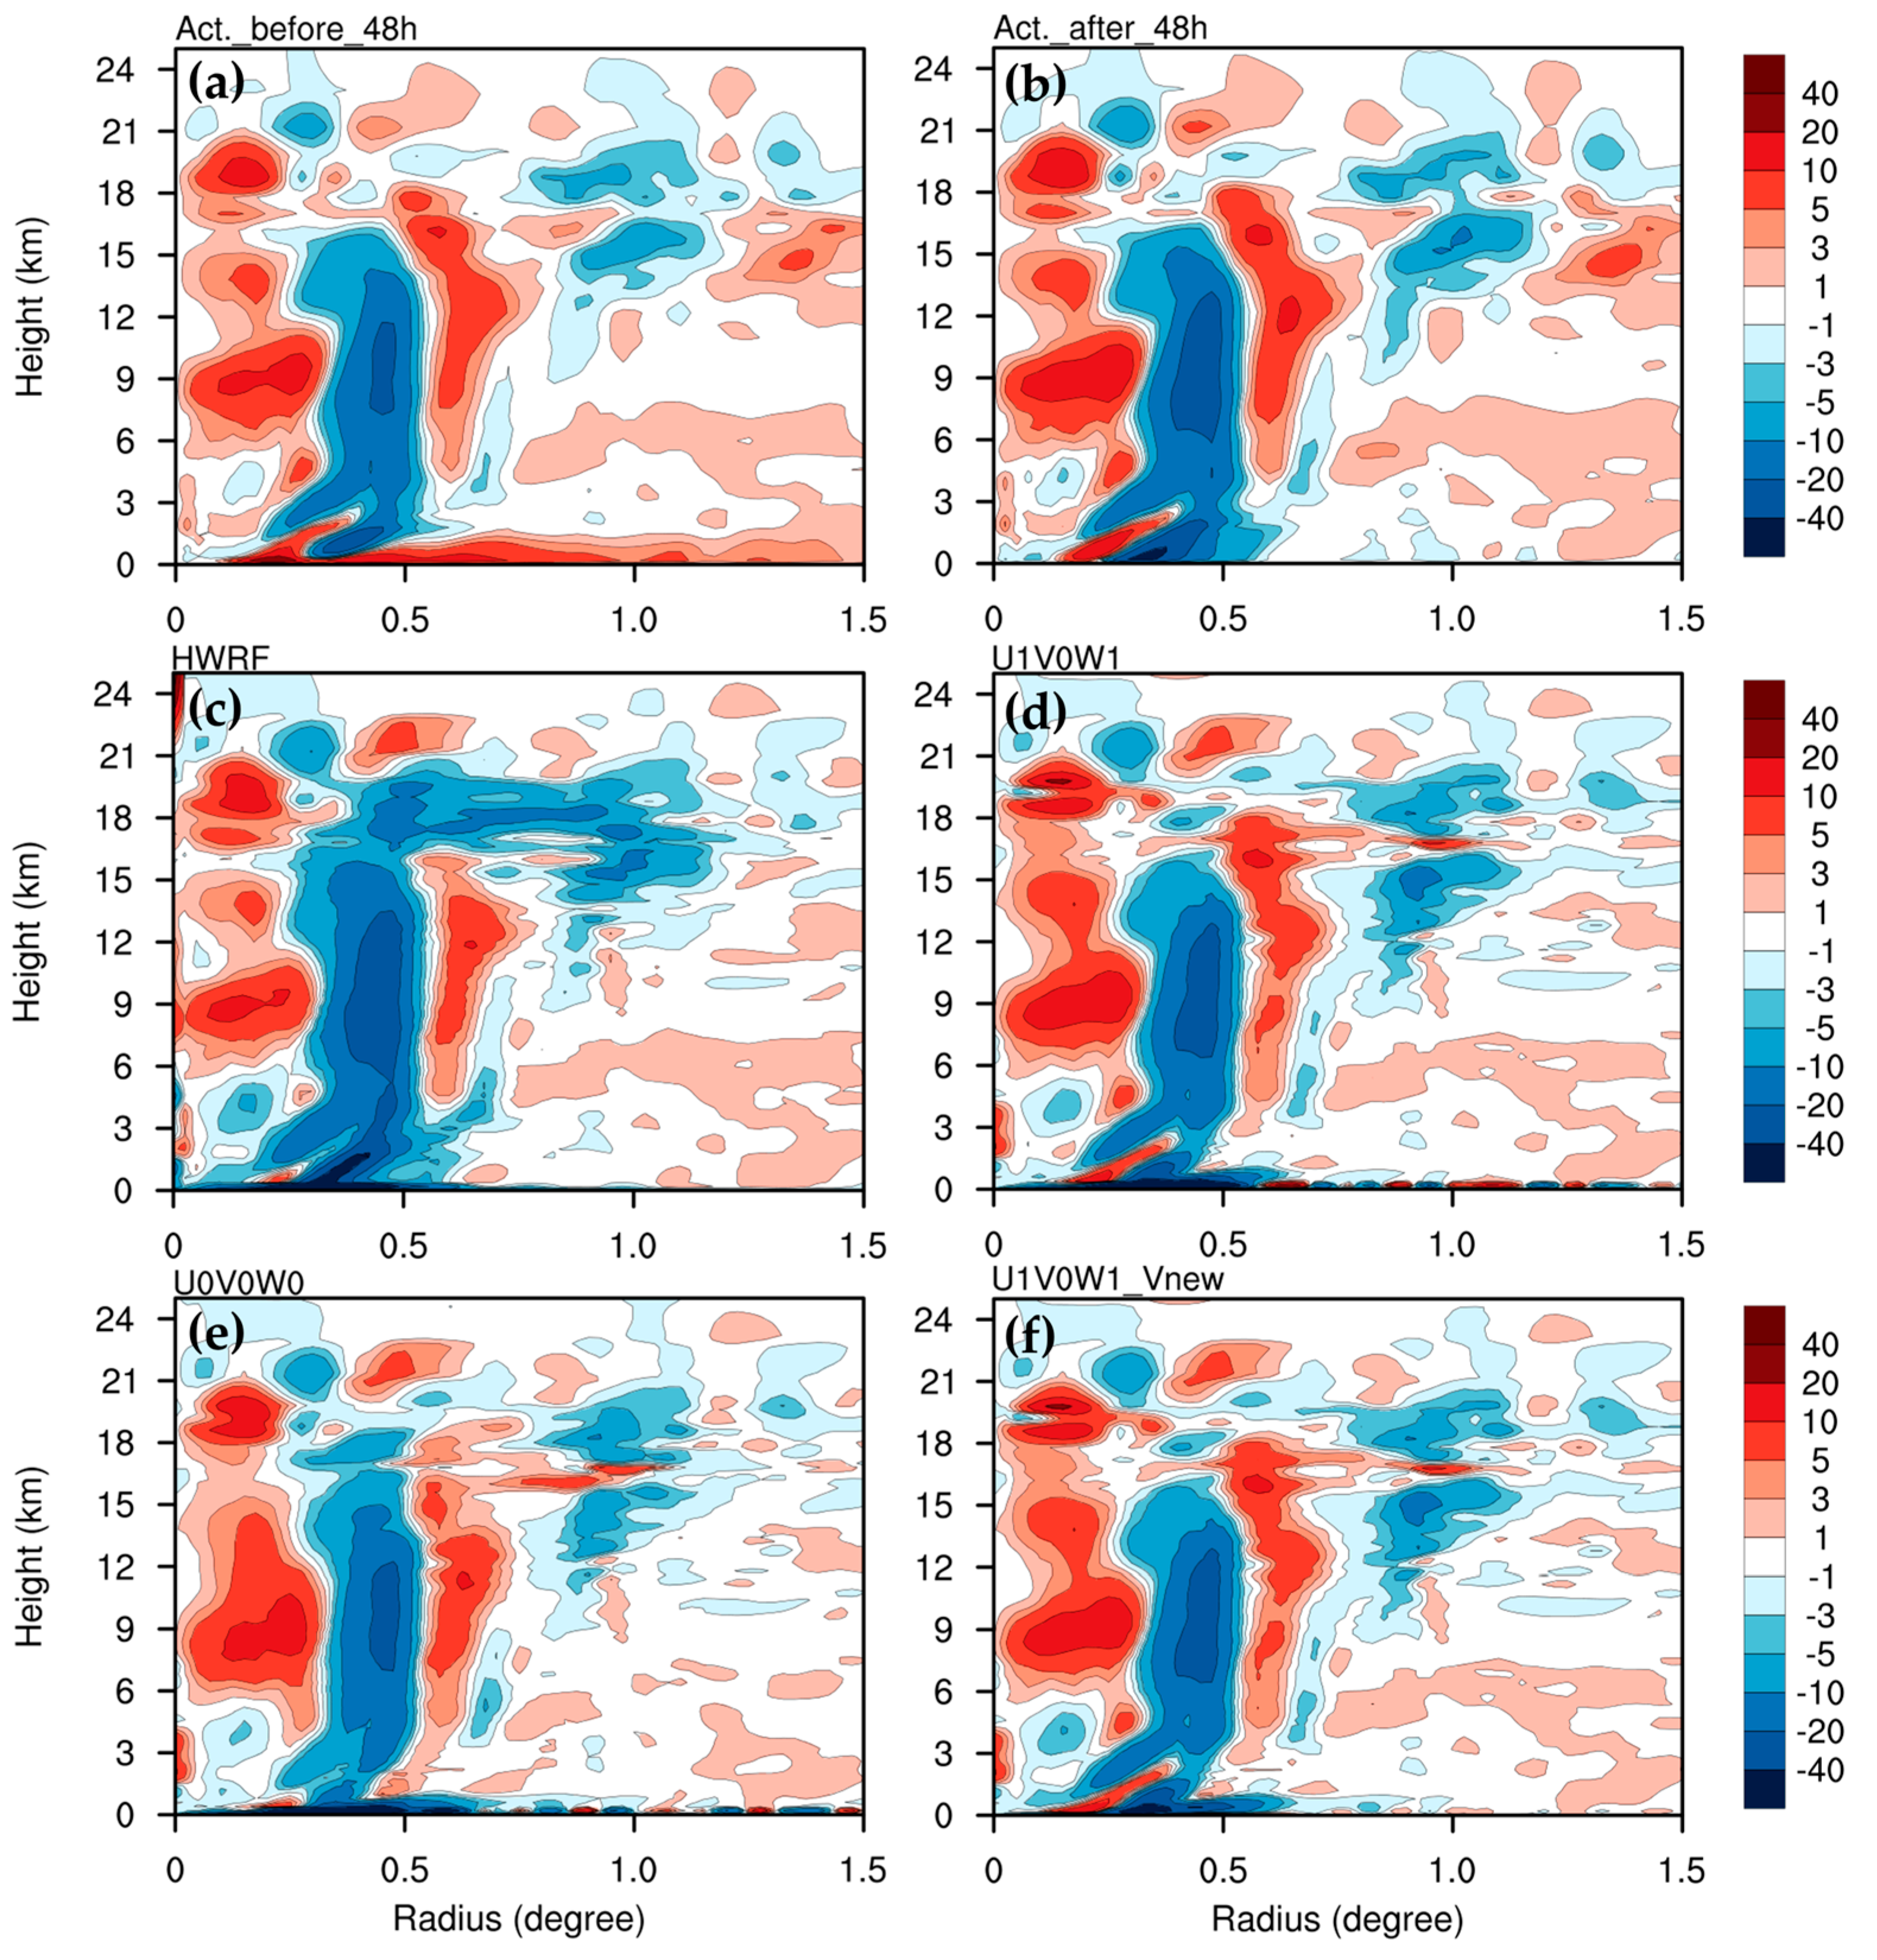
To check the accuracy of the induced tangential wind velocity tendency, we calculated the actual temporal change in tangential velocity, with the model output exhibiting 20 s intervals before (i.e., the result at 48 h minus the result at 20 s before 48 h) and after 48 h (i.e., the result at 20 s after 48 h minus the result at 48 h), as well as the sum of the tangential wind velocity tendency in budgeting terms (the first term on the left-hand side (lhs) of Equation (22)) in the nonlinear simulation and different SE solutions at 48 h. The actual tangential wind velocity tendency and the computed budgets for the tangential wind velocity tendency for the nonlinear simulation, and for the SE solutions, are shown in Figure 11. The two actual tangential wind velocity tendencies were very similar, with a spinup inside of the inner eyewall, outside of the inner eyewall at heights of 4–18 km in radii of 0.5–0.7 degrees, and in the boundary layer at heights less than 2 km (Figure 11a,b), except in the lowest boundary layer. In this layer only, the actual velocity change can be swiftly modified from a strong spinup for the former, to a weak spindown for the latter, within a very short period. The nonlinear budget (ignoring all numerical smoothing inherently applied by the non-linear model) captured the actual spinup in the boundary layer well, in addition to the distribution of spinup and spindown in the mid-troposphere (Figure 11c). However, it did not capture spindowns that occurred at heights of 17–20 km, in radii of 0.4–1.1 degrees, caused by the mean vertical advection of tangential velocity. The nonlinear budget at 48 h was closer to the latter actual nonlinear tendency than the former, particularly in the boundary layer. This may imply that numerical smoothing may introduce some noted differences between the current budget and the two nonlinear tendencies, particularly in the upper-outflow layer and boundary layer. The distributions of spinup and spindown in U1V0W1 are quite similar to the two actual tangential-wind velocity tendencies in the inner vortex, except in the boundary layer comprising heights of less than 2 km with a wavy radial structure of alternating tendency signs near the surface (Figure 11d). This near-surface, radially alternating tendency was also produced in U0V0W0 (Figure 11e). This may imply that the irregular spinup and spindown near the surface was not due to the contribution of U ˙ and W ˙ .
To understand whether the boundary conditions have a significant impact on spinup and spindown in the boundary layer, we set 2 v / z 2 = 0 at z = 0 km in the sensitivity test of U1V0W1_Vnew, instead of the no-slip condition, v = 0 at z = 0 km, which was used in U1V0W1. The tangential-wind velocity tendency for U1V0W1_Vnew is shown in Figure 11f. The distributions of spinup and spindown in U1V0W1_Vnew were nearly identical to those in U1V0W1, except in the lowest boundary layer. The induced tangential-wind velocity tendency in the boundary layer of U1V0W1_Vnew better aligned with the latter’s actual tendencies, but not the former’s. The vortex intensification within the lowest boundary layer only, was affected by the specified boundary condition for the mean tangential velocity. The constant gradient condition, rather than no-slip condition, was preferred for the SE solution, despite the fact that the nonlinear simulation applied a no-slip condition.
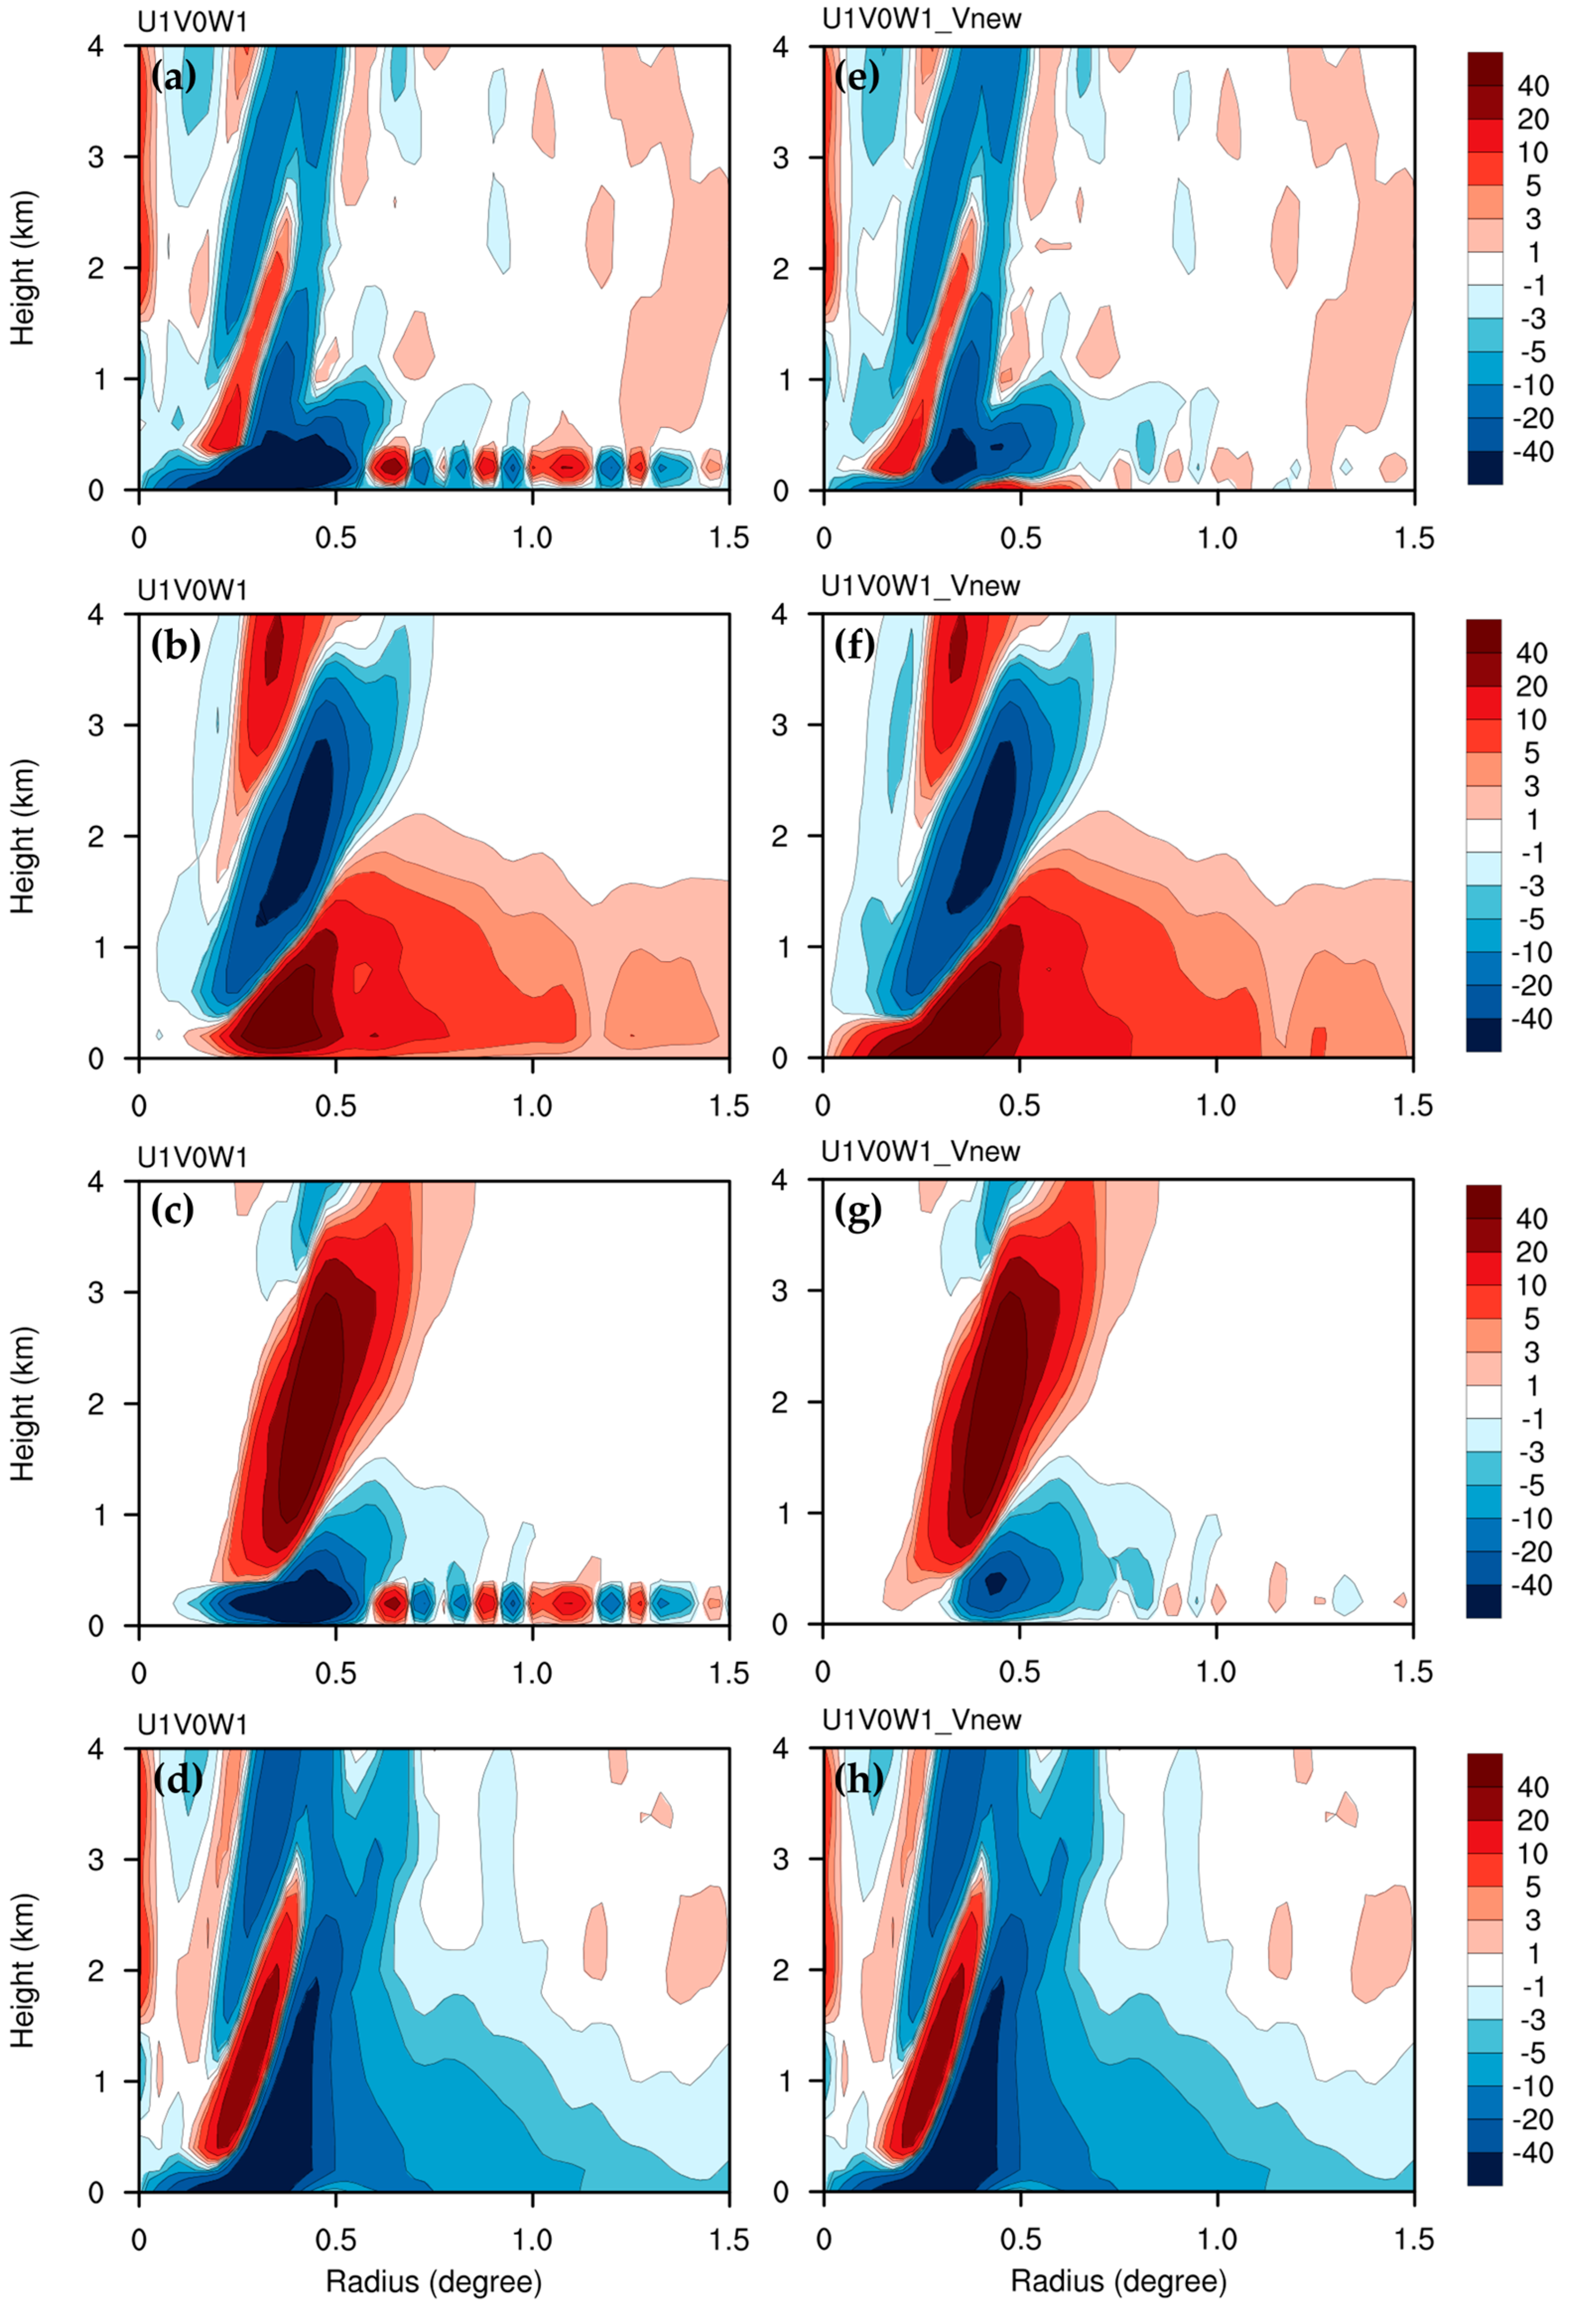
Figure 12 shows the budgeting terms of the tangential-wind velocity tendencym including mean horizontal advection (the first term on the lhs of Equation (22)), mean vertical advection (the second term on the lhs of Equation (22)), as well as the sum of the asymmetric eddy force and mean friction (the first four terms on the rhs of Equation (22)) at heights less than 4 km, at 48 h, for U1V0W1 and U1V0W1_Vnew. Herein, we do not include the mean advection induced by each source term for its contribution. The mean horizontal advection of tangential velocity, contributed by the total source terms, caused a spinup in the inflow layer at heights less than 2 km (Figure 12b). Most of the tendencies that contributed to the mean horizontal advection in the eyewall were largely counteracted by the mean vertical advection (Figure 12c). In addition, the radial wavy alternation near the lower surface was clearly induced by the mean vertical advection, with a strong vertical gradient of tangential wind in the presence of a no-slip condition. The asymmetric eddy force and mean friction caused spinup and spindown in the inner part and outer part of the eyewall, respectively. In general, the vortex intensification in the boundary layer, at a height of less than 3 km, near the inner eyewall, was mainly induced by the effects of asymmetric vertical advection and mean friction. The tendency near the surface and outside the eyewall was induced by the mean vertical advection of tangential velocity. The budgeting terms of the tangential wind velocity tendency for U1V0W1_Vnew are similar to those of U1V0W1 (Figure 12e–h), except that the latter’s are present near the boundary layer at heights of less than 500 m. Similar to U1V0W1, the large tangential wind velocity tendency near the surface was also mainly induced by the mean vertical advection of tangential velocity in U1V0W1_Vnew (Figure 12g). Comparing the net budget for both tests (Figure 12a vs. Figure 12e), major differences existed only within the lowest layer at a height of 500 m. Based on our sensitivity tests, the use of the gradient boundary condition, will ensure that the tangential wind velocity tendency aligns better with the actual tendency.
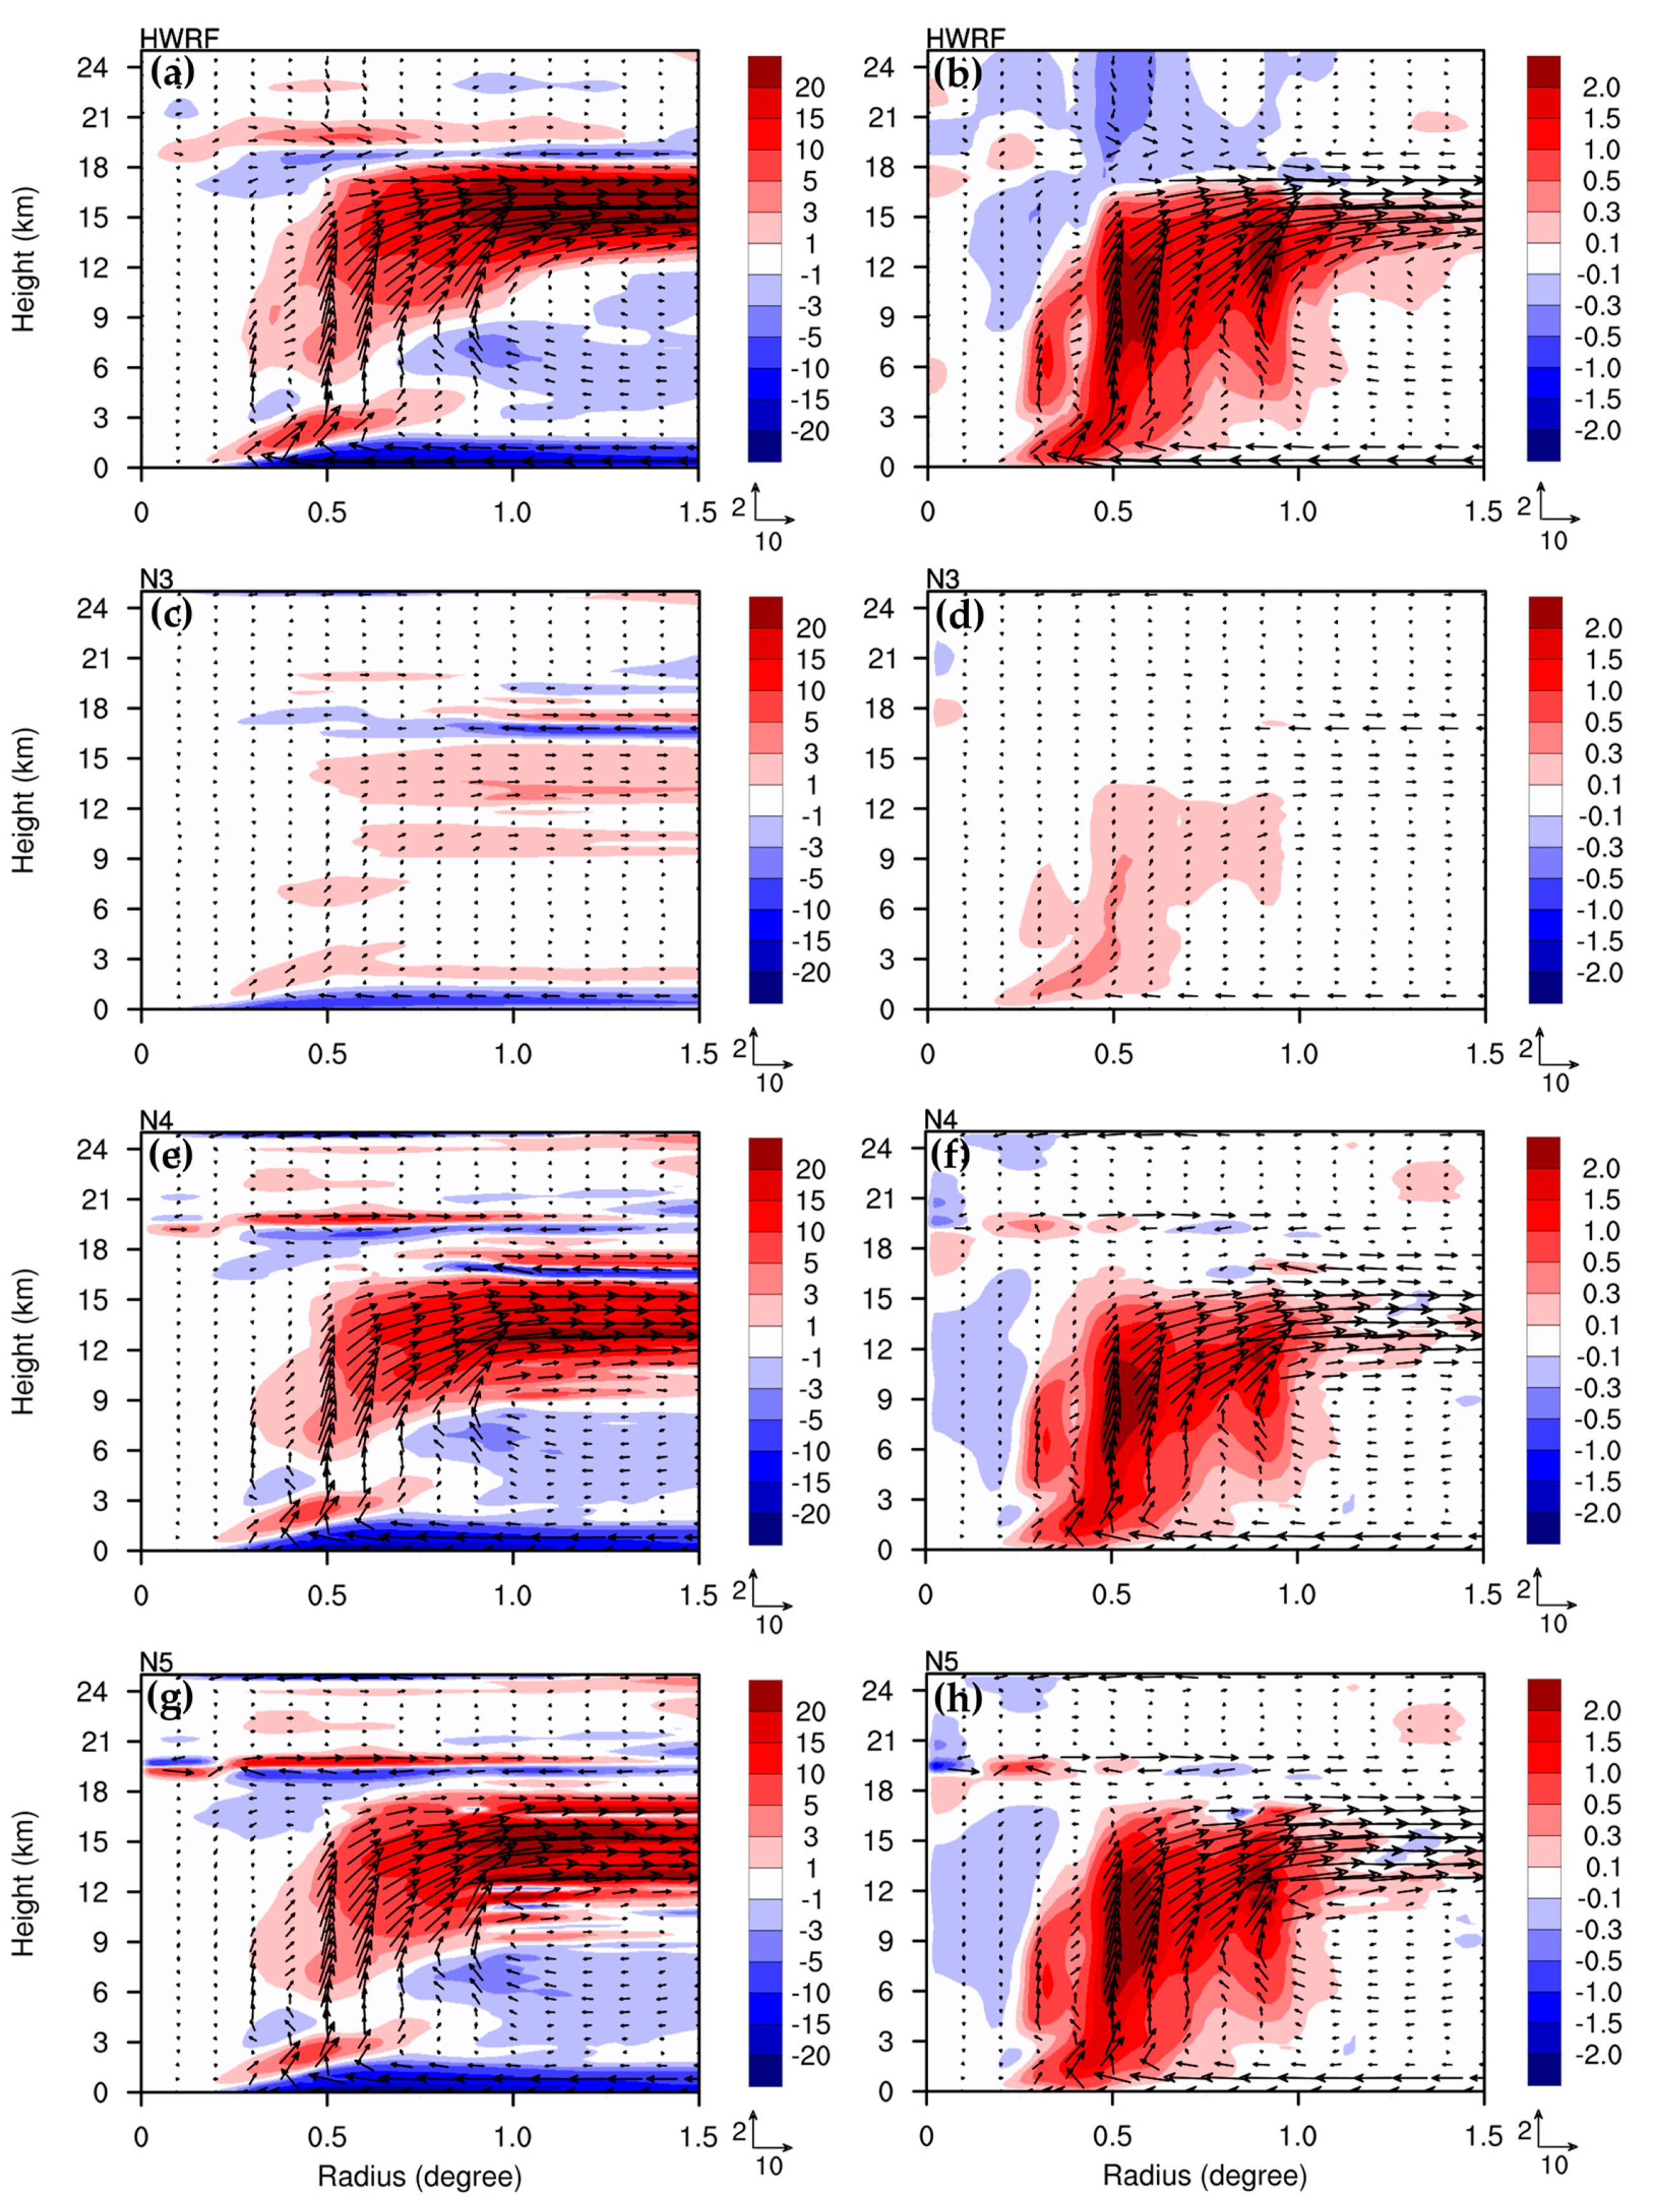
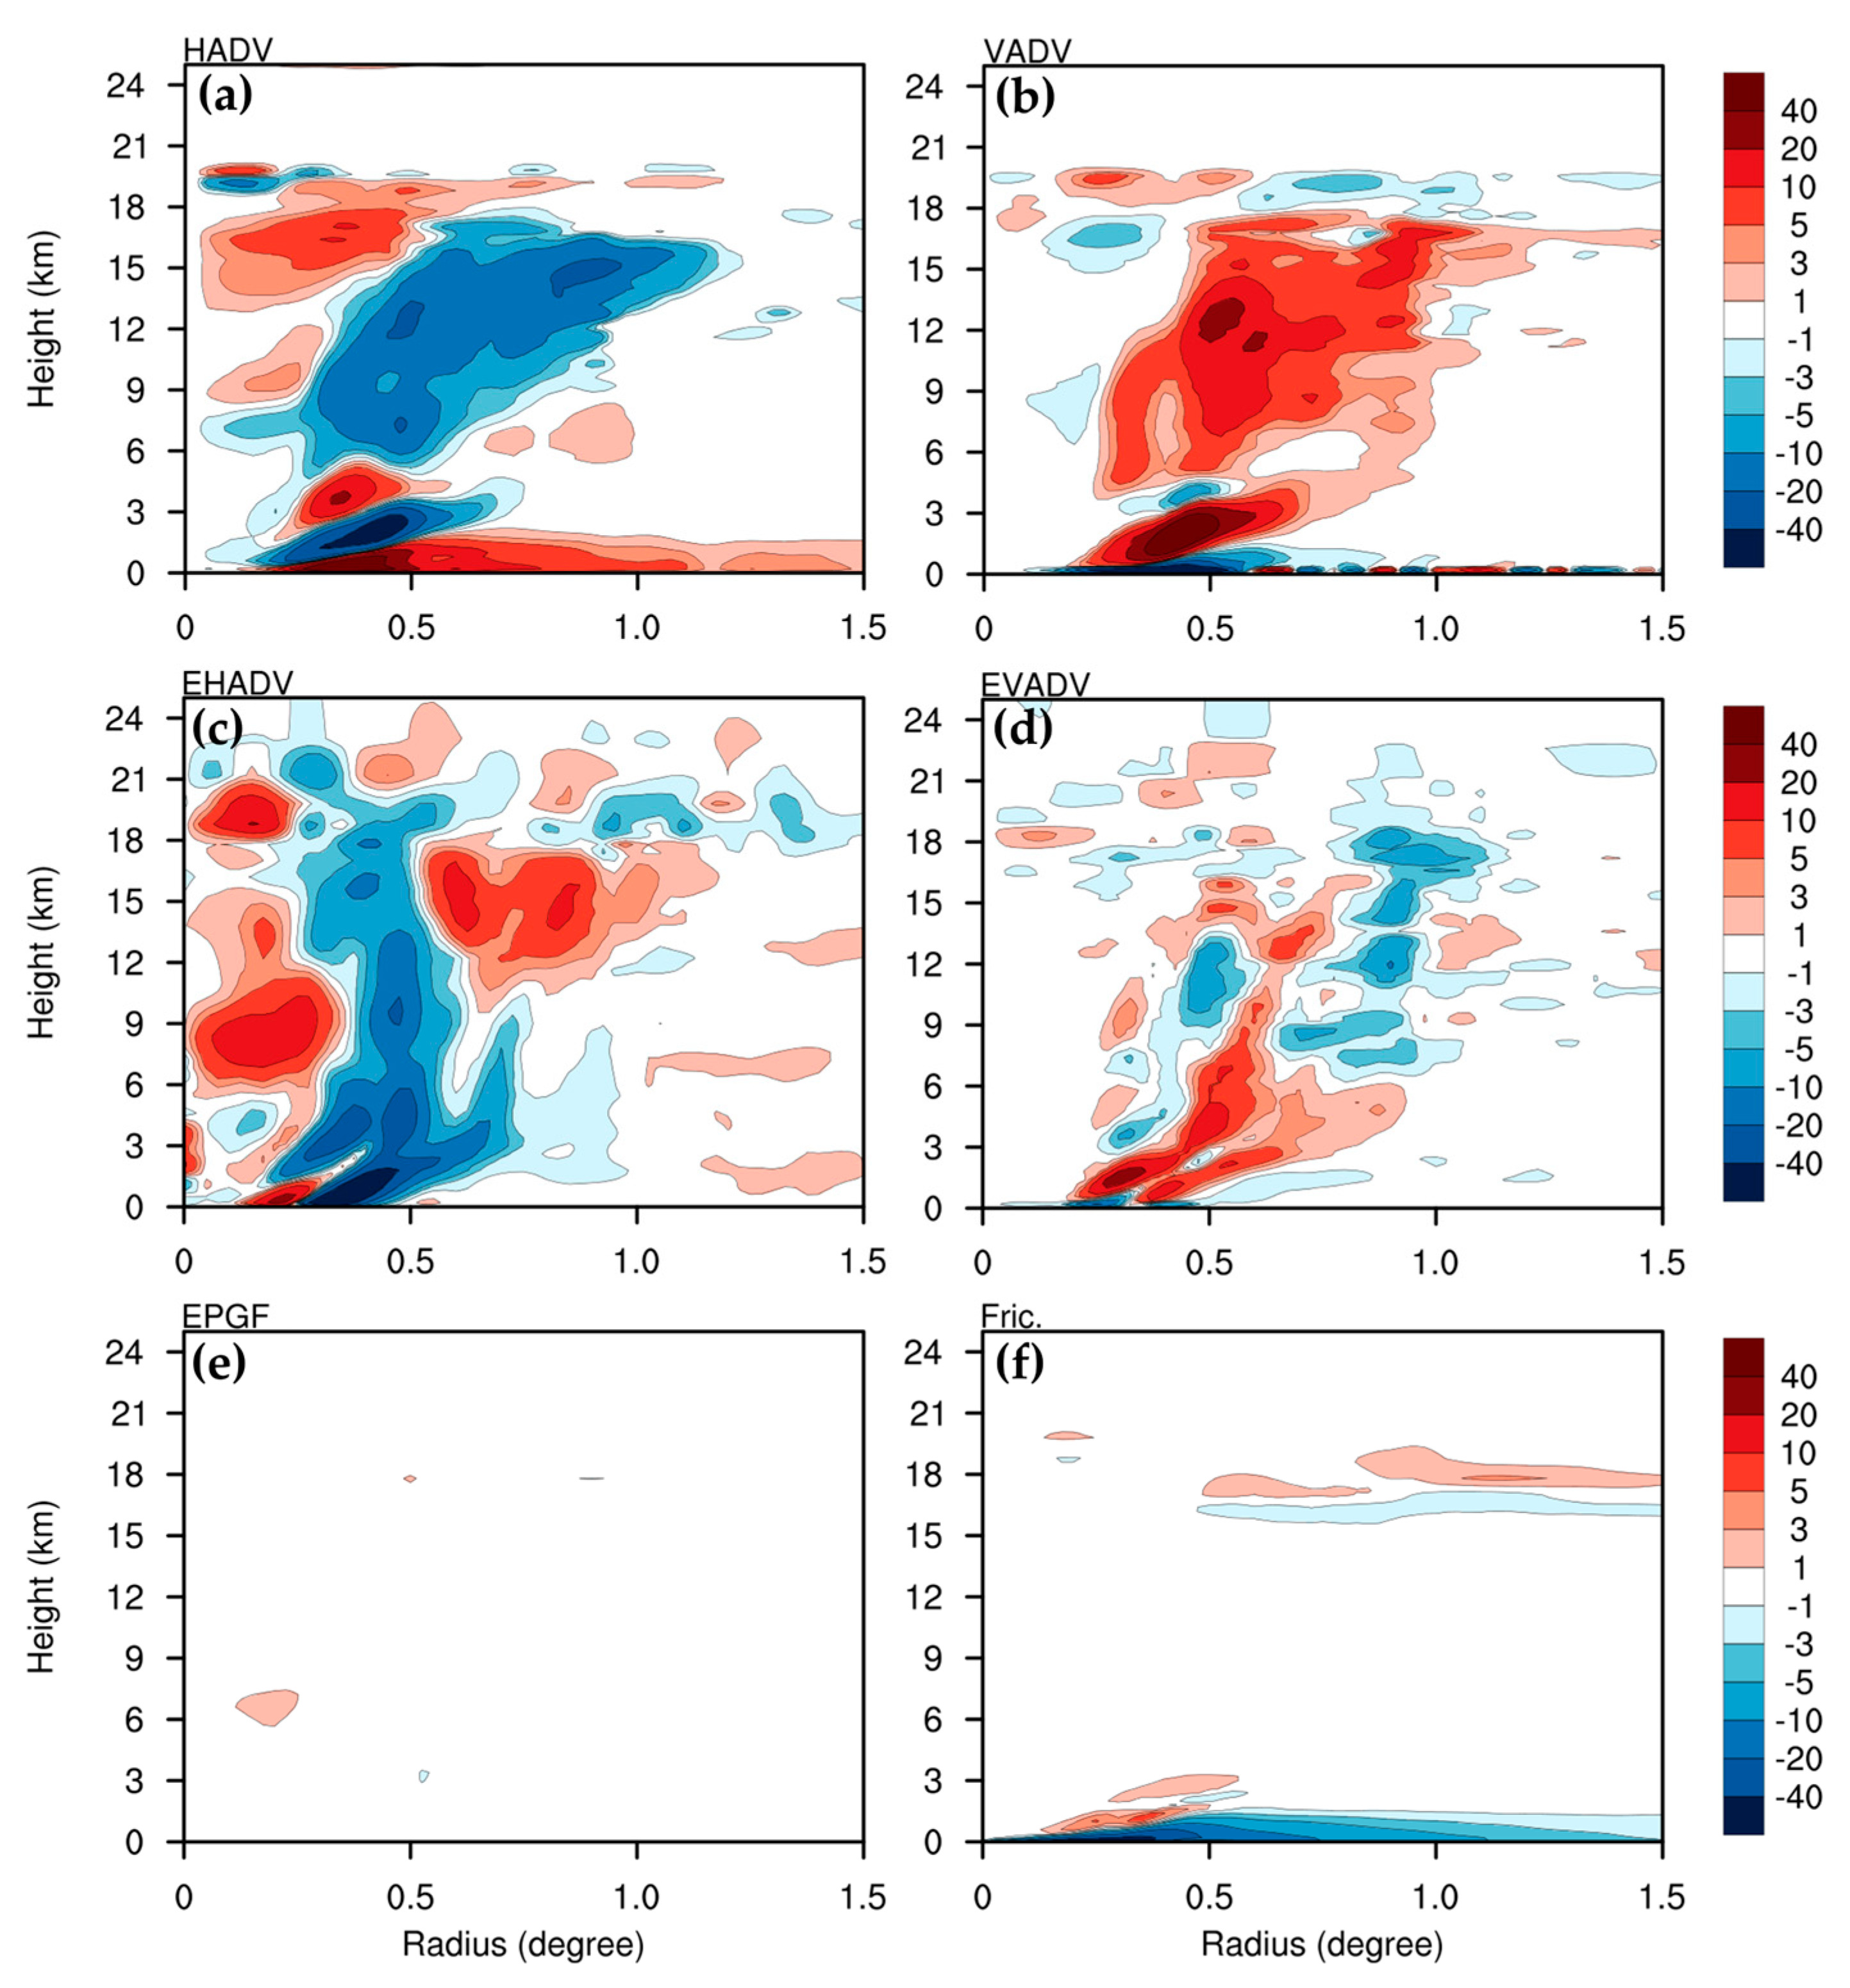
Figure 13 shows all budgeting terms of the tangential wind velocity tendency in Equation (22), at 48 h, for U1V0W1. The mean horizontal advection of the tangential velocity that is caused by all of the induced transverse circulations, as derived from the source terms, caused a spindown in the eyewall at a height of 5–17 km, and less than 3 km. Moreover, it contributed to a spinup inside of the inner eyewall at a height of 13–19-km, in the eyewall at a height of 2–5 km, and in the boundary layer at a height of less than 2 km height (Figure 13a). Most of the spindown caused by the mean horizontal advection tended to offset the spinup via the mean vertical advection (Figure 13b). The asymmetric horizontal advection provided a spindown in the eyewall, as well as a spinup inside of the inner eyewall, at a height of 6–20 km. Spinup also occurred outside of the inner eyewall at a height of 11–18 km (Figure 13c). The tendency caused by the asymmetric vertical advection tends to partially offset the tendency caused by the asymmetric horizontal advection in the eyewall and outside of the inner eyewall (Figure 13d). The tendency caused by the asymmetric tangential pressure gradient force was much smaller than the other budgeting terms in Equation (22) (Figure 13e). The turbulent momentum diffusion directly spins down the vortex in the inflow layer at heights less than 2 km (Figure 13f). In general, the sum of all the budgeting terms (Figure 11d) shows a spinup inside of the inner eyewall and a spindown in the eyewall; this can be attributed to the mean and asymmetric horizontal advection of tangential velocity, whereas most of the spinup outside of the inner eyewall was caused by the mean vertical advection and asymmetric horizontal advection. Furthermore, as mentioned above, the spinup near the surface in the mean horizontal advection was mainly offset by the spindown caused by the turbulent momentum diffusion; this indicates that the radially alternating tendency in the net budget near the surface (Figure 11d) is clearly caused by the mean vertical advection of tangential velocity.
4.5. SE Diagnostics on the Original Vertical Heights

Vertical interpolation to uniform vertical resolution for the SE solution has frequently been performed in previous studies [23,26,27]. As mentioned above, the domain for the SE equation used in this study is 0–25 km in the vertical direction, with a constant resolution of 200 m. With such a resolution, there is a finer interpolation of coarser HWRF grids in the upper troposphere and lower stratosphere. As shown, this finer interpolation incur some radial-flow wiggles in the SE solution in the upper domain, in spite of the application of second-order vertical differencing applied. To tackle this issue, we applied the original vertical coordinate of the HWRF model to minimize the occurrence of such misrepresentation-related errors. The radial wind component of the sensitivity tests, including or ignoring U ˙ ,   V ˙ , and W ˙ at 48 h, for the nonlinear simulation of CTL, using the original vertical coordinates, are shown in Figure 14. It is clear that the use of the original vertical coordinate effectively removed the wind wiggles of the SE solution in the upper domain, especially for heights above 18 km. It should be noted that the SE solution and the derived vortex spinup at heights less than 18 km were hardly affected by the two vertical coordinates, and both results were very close at heights less than 9 km; this was due to their comparable grid intervals in the troposphere. The impact of vertical differencing can be realized in that the finer interpolation of the nonlinear simulation for the SE equation introduced some differences in original residues and force terms, especially at upper levels. Note that most of the SE solutions in the past are shown without residues at heights less than 18 km; thus, the vertical differencing issue is not illustrated.

5. Conclusions

This study used the revised SE equation to examine the development of Supertyphoon Yutu (2018), based on symmetric vortex dynamics. Nonlinear simulations were used to provide the mean vortex, and both symmetric and asymmetric force sources for the SE equation used the ocean-coupled HWRF. The simulated intensification of Yutu using the ocean-coupled model was compared well against the best track data, and it showed RI during the development of Yutu. The typhoon intensification was sensitive to the initial ocean temperature. The hypothetical 1 °C increase in initial ocean temperature along the typhoon path appeared to have a greater impact on the later intensification rate of Yutu than the 1 °C reduction in temperature.
Sensitivity analyses show that the induced transverse circulation of the SE solution is sensitive to the adjustments of the static instability ( N 2 ) of the typhoon vortex. All sensitivity tests of N 2 can capture the overall structure of transverse circulation, such as the boundary layer inflow, upper-level outflow, and upward motion in the eyewall. However, compared with the nonlinear simulation, the induced transverse circulation was considerably underestimated, with N 2 = 10 3   s 2 , whereas it was only slightly weaker for N 2 = 10 4   s 2 , and it was reasonable for N 2 = 10 5   s 2 . In general, the induced transverse circulation for the lower limit value of N 2 =   10 5   s 2 was sufficient, and it preserved most of the original stability obtained in the nonlinear simulation, without causing the divergence of the solution. The contributions of the agradient wind and nonhydrostatics to the induced transverse circulation were mainly concentrated at the upper level, at heights above 15 km. They had much less impact on the tropospheric vortex in the revised SE solution, whereas the contribution of the residuals from the imbalance in the tangential wind tendency equation mainly occurred in the upper troposphere at heights less than 18 km and near the lower eyewall. However, the overestimated radial flow at heights greater than 18 km in the SE solution can be canceled out when both residuals from the agradient wind and nonhydrostatics are included in the total force sources. However, the radial outflow in the boundary layer was overestimated when the numerical residue of the tangential wind tendency equation was included, which aligns with the findings in [27]. It was found that this numerical residue, with some uncertainty in general, results in a larger impact on the upper-tropospheric vortex than both effects caused by agradient imbalance and nonhydrostatics. Based on our sensitivity tests using the SE solution, the physical effect caused by the agradient wind is more desirable as it induces more sinking motions near the eyewall, and it partially benefits from the physical effect caused by nonhydrostatics. Currently, the relief caused by the gradient wind balance, or even thermal wind balance, has been studied using the SE solution (e.g., [23,27]). However, our tests indicate that an adherence of the agradient imbalance and nonhydrostatics to the force source produced larger upper-level perturbations in the SE solution than in the nonlinear simulation.
In the control experiment, U1V0W1 (ignoring the numerical residue of the tangential wind tendency equation), the force source was replaced by a different force source with a structural misplaced change that occurred at the same time as the nonlinear simulations, S48Tm1 (with initial SST one degree smaller) and S48Tp1 (with initial SST one degree larger), and by amplified, but collocated, force sources. The sensitivity tests indicate that the induced transverse circulation is highly sensitive to the geometric structure in the force source. The structural misplaced change in the force source may cause a greater disorganization-based impact on the induced transverse circulation, whereas a collocated intensity change only results in a proportional enhancement in the same phase. Thus, the intensification of the primary vortex in non-linear processes requires a dynamically consistent force enhancement as transverse circulation develops. Based on symmetric vortex dynamics, a weaker mean vortex cannot correctly spin up using a largely misplaced stronger force that produces a distorted transverse circulation, as it is vital to the mean vortex.
For the RI of Yutu in later stages, the tangential wind velocity tendency provided by the revised SE solution is close to the actual nonlinear tendency, except for the lowest boundary layer with stronger turbulent friction. The nonlinear vortex is highly transient in the boundary layer, which causes a possible deviation from the SE solution associated with the mean vortex. The SE solution shows that the radially alternating tendency between spinup and spindown occurs in the lowest boundary layer, and this does not result from the agradient imbalance and nonhydrostatics, but the no-slip condition for the mean tangential velocity at the lower boundary. However, use of the no-slip condition has very little impact on the SE solution above the near-surface. The mid- to upper-tropospheric vortex intensification, inside of the eyewall and outside of the eyewall, can be attributed to mean and asymmetric horizontal advection and vertical advection, respectively; However, most spindown in the eyewall only contributes to the mean and asymmetric horizontal advection. At lower levels, the vortex intensification near the inner eyewall is mainly induced by the effects of asymmetric vertical advection, as the contributions of both mean horizontal advection and vertical advection are largely canceled out. This implies the important role of the asymmetric convective updrafts in the RI processes of the super-intense typhoon.

Author Contributions

Conceptualization, C.-Y.H.; Methodology, C.-Y.H.; Software, Formal analysis, and Data curation, C.-Y.H. and T.-C.N.; Writing—original draft preparation, T.-C.N.; Writing—review and editing, C.-Y.H.; Project administration, C.-Y.H. All authors have read and agreed to the published version of the manuscript.

Funding

This study was supported by the National Science and Technology Council (NSTC) (grant no. NSTC 112-2111-M-008-014) in Taiwan.

Institutional Review Board Statement

Not applicable.

Informed Consent Statement

Not applicable.

Data Availability Statement

The best track data are obtained from the JTWC, and the model forecasts are available from the workstation of the typhoon laboratory at the Department of Atmospheric Sciences, National Central University from 140.115.35.103.

Conflicts of Interest

The authors declare no conflict of interest.

References

  1. Powell, M.D.; Reinhold, T.A. Tropical cyclone destructive potential by integrated kinetic energy. Bull. Am. Meteorol. Soc. 2007, 88, 513–526. [Google Scholar] [CrossRef]
  2. Esteban, M.; Thao, N.D.; Takagi, H.; Shibayama, T. Increase in port downtime and damage in Vietnam due to a potential increase in tropical cyclone intensity. In Climate Change and the Sustainable Use of Water Resources; Springer: Berlin/Heidelberg, Germany, 2012; pp. 101–125. [Google Scholar]
  3. McAdie, C.J.; Lawrence, M.B. Improvements in tropical cyclone track forecasting in the Atlantic basin, 1970–1998. Bull. Am. Meteorol. Soc. 2000, 81, 989–998. [Google Scholar] [CrossRef]
  4. Chen, H.; Zhang, D.-L. On the rapid intensification of Hurricane Wilma (2005). Part II: Convective bursts and the upper-level warm core. J. Atmos. Sci. 2013, 70, 146–162. [Google Scholar] [CrossRef]
  5. Landsea, C.W.; Cangialosi, J.P. Have we reached the limits of predictability for tropical cyclone track forecasting? Bull. Am. Meteorol. Soc. 2018, 99, 2237–2243. [Google Scholar] [CrossRef]
  6. Cangialosi, J.P.; Blake, E.; DeMaria, M.; Penny, A.; Latto, A.; Rappaport, E.; Tallapragada, V. Recent progress in tropical cyclone intensity forecasting at the National Hurricane Center. Weather Forecast. 2020, 35, 1913–1922. [Google Scholar] [CrossRef]
  7. Gall, R.; Franklin, J.; Marks, F.; Rappaport, E.N.; Toepfer, F. The hurricane forecast improvement project. Bull. Am. Meteorol. Soc. 2013, 94, 329–343. [Google Scholar] [CrossRef]
  8. Hendricks, E.A.; Peng, M.S.; Li, T. Evaluation of multiple dynamic initialization schemes for tropical cyclone prediction. Mon. Weather Rev. 2013, 141, 4028–4048. [Google Scholar] [CrossRef]
  9. Rogers, R.F. Recent advances in our understanding of tropical cyclone intensity change processes from airborne observations. Atmosphere 2021, 12, 650. [Google Scholar] [CrossRef]
  10. La Seur, N.; Hawkins, H.F. An analysis of Hurricane Cleo (1958) based on data from research reconnaissance aircraft. Mon. Weather Rev. 1963, 91, 694–709. [Google Scholar] [CrossRef]
  11. Hawkins, H.F.; Rubsam, D.T. Hurricane Hilda, 1964: II. Structure and budgets of the hurricane on October 1, 1964. Mon. Weather Rev. 1968, 96, 617–636. [Google Scholar] [CrossRef]
  12. Jorgensen, D.P. Mesoscale and convective-scale characteristics of mature hurricanes. Part II. Inner core structure of Hurricane Allen (1980). J. Atmos. Sci. 1984, 41, 1287–1311. [Google Scholar] [CrossRef]
  13. Willoughby, H.E. Gradient balance in tropical cyclones. J. Atmos. Sci. 1990, 47, 265–274. [Google Scholar] [CrossRef]
  14. Willoughby, H. Tropical cyclone eye thermodynamics. Mon. Weather Rev. 1998, 126, 3053–3067. [Google Scholar] [CrossRef]
  15. Willoughby, H. Forced secondary circulations in hurricanes. J. Geophys. Res. Ocean. 1979, 84, 3173–3183. [Google Scholar] [CrossRef]
  16. Shapiro, L.J.; Willoughby, H.E. The response of balanced hurricanes to local sources of heat and momentum. J. Atmos. Sci. 1982, 39, 378–394. [Google Scholar] [CrossRef]
  17. Pendergrass, A.G.; Willoughby, H.E. Diabatically induced secondary flows in tropical cyclones. Part I: Quasi-steady forcing. Mon. Weather Rev. 2009, 137, 805–821. [Google Scholar] [CrossRef]
  18. Vigh, J.L.; Schubert, W.H. Rapid development of the tropical cyclone warm core. J. Atmos. Sci. 2009, 66, 3335–3350. [Google Scholar] [CrossRef]
  19. Montgomery, M.T.; Smith, R.K. Paradigms for tropical cyclone intensification. Aust. Meteorol. Oceanogr. J. 2014, 64, 37–66. [Google Scholar] [CrossRef]
  20. Möller, J.D.; Shapiro, L.J. Balanced contributions to the intensification of Hurricane Opal as diagnosed from a GFDL model forecast. Mon. Weather Rev. 2002, 130, 1866–1881. [Google Scholar] [CrossRef]
  21. Eliassen, A. Slow thermally or frictionally controlled meridional circulation in a circular vortex. Astrophisica Nor. 1951, 5, 19. [Google Scholar]
  22. Bui, H.H.; Smith, R.K.; Montgomery, M.T.; Peng, J. Balanced and unbalanced aspects of tropical cyclone intensification. Q. J. R. Meteorol. Soc. J. Atmos. Sci. Appl. Meteorol. Phys. Oceanogr. 2009, 135, 1715–1731. [Google Scholar] [CrossRef]
  23. Heng, J.; Wang, Y.; Zhou, W. Revisiting the balanced and unbalanced aspects of tropical cyclone intensification. J. Atmos. Sci. 2017, 74, 2575–2591. [Google Scholar] [CrossRef]
  24. Heng, J.; Wang, Y.; Zhou, W. Reply to “Comments on ‘Revisiting the balanced and unbalanced aspects of tropical cyclone intensification’”. J. Atmos. Sci. 2018, 75, 2497–2505. [Google Scholar] [CrossRef]
  25. Wang, S.; Smith, R.K. Consequences of regularizing the Sawyer–Eliassen equation in balance models for tropical cyclone behaviour. Q. J. R. Meteorol. Soc. 2019, 145, 3766–3779. [Google Scholar] [CrossRef]
  26. Montgomery, M.T.; Persing, J. Does balance dynamics well capture the secondary circulation and spinup of a simulated hurricane? J. Atmos. Sci. 2021, 78, 75–95. [Google Scholar] [CrossRef]
  27. Ji, D.; Qiao, F. Does Extended Sawyer–Eliassen Equation Effectively Capture the Secondary Circulation of a Simulated Tropical Cyclone? J. Atmos. Sci. 2023, 80, 871–888. [Google Scholar] [CrossRef]
  28. Ji, D.; Qiao, F. What are the Balanced and Unbalanced Dynamics of Tropical Cyclone? J. Atmos. Sci. 2023, 80, 1719–1737. [Google Scholar] [CrossRef]
  29. Smith, R.K. Accurate determination of a balanced axisymmetric vortex in a compressible atmosphere. Tellus A Dyn. Meteorol. Oceanogr. 2006, 58, 98–103. [Google Scholar] [CrossRef]
  30. Montgomery, M.T.; Smith, R.K. Comments on “Revisiting the balanced and unbalanced aspects of tropical cyclone intensification”. J. Atmos. Sci. 2018, 75, 2491–2496. [Google Scholar] [CrossRef]
  31. Ohno, T.; Satoh, M. On the warm core of a tropical cyclone formed near the tropopause. J. Atmos. Sci. 2015, 72, 551–571. [Google Scholar] [CrossRef]
  32. Tallapragada, V.; Bernardet, L.; Biswas, M.; Ginis, I.; Kwon, Y.; Liu, Q.; Marchok, T.; Sheinin, D.; Thomas, B.; Tong, M. Hurricane Weather Research and Forecasting (HWRF) Model: 2015 Scientific Documentation (No. NCAR/TN-522+ STR). HWRF Dev. Testbed Cent. Tech. Rep. 2016. [Google Scholar] [CrossRef]
  33. Yablonsky, R.M.; Ginis, I.; Thomas, B.; Tallapragada, V.; Sheinin, D.; Bernardet, L. Description and analysis of the ocean component of NOAA’s operational Hurricane Weather Research and Forecasting Model (HWRF). J. Atmos. Ocean. Technol. 2015, 32, 144–163. [Google Scholar] [CrossRef]
  34. Nguyen, T.-C.; Huang, C.-Y. A comparative modeling study of Supertyphoons Mangkhut and Yutu (2018) past the Philippines with ocean-coupled HWRF. Atmosphere 2021, 12, 1055. [Google Scholar] [CrossRef]
  35. Kaplan, J.; DeMaria, M. Large-scale characteristics of rapidly intensifying tropical cyclones in the North Atlantic basin. Weather Forecast. 2003, 18, 1093–1108. [Google Scholar] [CrossRef]
Figure 1. (a) Initial sea surface temperature at 0000 UTC, 22 October 2018. The dashed box indicates the ocean region where the associated temperature changed, according to the ocean temperature sensitivity experiments. (b) Time evolution of simulated 10 m maximum wind speed (kt) for Yutu from 0000 UTC 22 (0 h) to 0600 UTC, 27 October 2018 (126 h). The best tracks in (a,b) are from JTWC (dashed black line), and the simulated typhoon tracks and intensities are shown for CTL (solid black line), Tp1 (red line), and Tm1 (blue line).
Atmosphere 14 01683 g001
Figure 2. Azimuthal-mean (a) radial velocity (shaded colors at units of m s−1) and (b) vertical velocity (shaded colors at units of m s−1) of the nonlinear simulation at 48 h for CTL. (c) and (d), as in (a) and (b), respectively, but for N3. (e) and (f), as in (c) and (d), respectively, but for N4. (g) and (h), as in (c) and (d), respectively, but for N5. The wind vectors (m s−1) induced by the sources, overlapped at each panel, indicate the radial and vertical wind components, with their reference vectors given at the lower right corner.
Atmosphere 14 01683 g002
Figure 3. Azimuthal-mean radial velocity (shaded colors at units of m s−1) at 24 h for (a) the nonlinear model simulation of CTL, and the SE solutions for the different sensitivity experiments of (b) U0V0W0, (c) U1V0W0, (d) U0V0W1, (e) U1V0W1, and (f) U1V1W1. The wind vectors (m s−1) induced by the sources, overlapped in each panel, indicate the radial and vertical wind components, with their reference vectors shown in the lower right corner.
Atmosphere 14 01683 g003
Figure 4. As in Figure 3, but for vertical velocity (shaded colors in units of m s−1) for (a) the nonlinear model simulation of CTL, and the SE solutions for the different sensitivity experiments of (b) U0V0W0, (c) U1V0W0, (d) U0V0W1, (e) U1V0W1, and (f) U1V1W1.
Atmosphere 14 01683 g004
Figure 5. (a) Radial velocity (shaded colors at units of m s−1) and (b) vertical velocity (shaded colors at units of m s−1) at 48 h for U0V0W0. (c) and (d), as in (a) and (b), respectively, but for U1V0W0; (e) and (f), as in (a) and (b), respectively, but for U0V0W1; (g) and (h), as in (a) and (b), respectively, but for U0V1W0. The wind vectors (m s−1) induced by the sources, overlapped at each panel, indicate the radial and vertical wind components, with their reference vectors shown in the lower right corner.
Atmosphere 14 01683 g005
Figure 6. (a) Radial velocity (shaded colors at units of m s−1) and (b) vertical velocity (shaded colors at units of m s−1) at 48 h for U1. (c) and (d), as in (a) and (b), respectively, but for V1. (e) and (f), as in (a) and (b), respectively, but for W1. The wind vectors (m s−1) induced by the sources, overlapped at each panel, indicate the radial and vertical wind components, and their reference vectors are shown in the lower right corner.
Atmosphere 14 01683 g006
Figure 7. The total force sources (shaded colors at units of 10−12 K−1 s−2 h−1) at the radius–height cross-section at (a) 24 h for CTL, (b) 48 h for CTL, (c) 48 h for Tm1, and (d) 48 h for Tp1.
Atmosphere 14 01683 g007
Figure 8. (a) Radial velocity (shaded colors at units of m s−1) and (b) vertical velocity (shaded colors at units of m s−1) at 24 h for S48Tm1. (c) and (d), as in (a) and (b), respectively, but for S48Tp1. (e) and (f), as in (a) and (b), respectively, but for 1.3xS24CTL. The wind vectors (m s−1) induced by the sources, overlapped at each panel, indicate the radial and vertical wind components, and their reference vectors are shown in the lower right corner.
Atmosphere 14 01683 g008
Figure 9. As in Figure 8, but at 48 h for (a) radial velocity (shaded colors at units of m s−1) and (b) vertical velocity (shaded colors at units of m s−1) at 24 h for S48Tm1. (c) and (d), as in (a) and (b), respectively, but for S48Tp1. (e) and (f), as in (a) and (b), respectively, but for 1.3xS24CTL.
Atmosphere 14 01683 g009
Figure 10. Diabatic heating rate (units of 3.6 K h−1) at the radius–height cross-section at (a) 24 h for CTL, (b) 48 h for CTL, (c) 48 h for Tm1, and (d) 48 h for Tp1.
Atmosphere 14 01683 g010
Figure 11. Tangential velocity tendency (shaded colors at units of m s−1 h−1) at the radius–height cross-section for CTL at 48 h for (a) actual change in tangential wind, with the model output at a 20-s interval before 48 h; (b) actual change in tangential wind, with the model output at a 20-s interval after 48 h; (c) the azimuthal-mean budget of tangential wind velocity using the nonlinear simulation from the SE solutions for (d) U1V0W1, (e) U0V0W0, and (f) U1V0W1_Vnew.
Atmosphere 14 01683 g011
Figure 12. Azimuthal mean of tangential velocity tendency budgeting terms (shaded colors; m s−1 h−1) at the radius–height cross-section, produced by U1V0W1, at 48 h, for (a) net total budget, (b) u ¯ η ¯ , (c) w ¯ v ¯ z , and (d) u η ¯ w v z ¯ + ρ ρ ¯ 2 1 r p λ ¯ + F ¯ v in Equation (22). (e), (f), (g), and (h), as in (a), (b), (c), and (d), respectively, but for U1V0W1_Vnew.
Atmosphere 14 01683 g012
Figure 13. Azimuthal mean of tangential velocity tendency budgeting terms (shaded colors) at the radius–height cross-section, produced by U1V0W1, at 48 h for (a) u ¯ η ¯ (unit: m s−1 h−1), (b) w ¯ v ¯ z (unit: m s−1 h−1), (c) u η ¯ (unit: m s−1 h−1), (d) w v z ¯ (unit: m s−1 h−1), (e) ρ ρ ¯ 2 1 r p λ ¯ (unit: 10−1 m s−1 h−1), and (f) F ¯ v (unit: m s−1 h−1) in Equation (22).
Atmosphere 14 01683 g013
Figure 14. Azimuthal-mean radial velocity (shaded colors at units of m s−1) calculated at 48 h for (a) the nonlinear model simulation of CTL, and the SE solutions for different sensitivity experiments of (b) U1V0W1, (c) U1V0W0, (d) U0V01W0, (e) U0V0W1, and (f) U1V1W1. Note that these results were calculated using the original vertical coordinate of the HWRF model. The wind vectors (m s−1) induced by the sources, overlapped at each panel, indicate the radial and vertical wind components, with their reference vectors shown in the lower right corner.
Atmosphere 14 01683 g014
Table 1. Sensitivity experiments for the SE solution.
ExperimentsIncluding Residual TermsChanging Total Forcing Sources
U ˙ V ˙ W ˙
U0V0W0NoNoNoNo
U1V0W0YesNoNoNo
U0V1W0NoYesNoNo
U0V0W1NoNoYesNo
U1V0W1YesNoYesNo
U1V1W1YesYesYesNo
S48Tm1YesNoYesS at 48 h of Tm1
S48Tp1YesNoYesS at 48 h of Tp1
1.3xS24CTLYesNoYes1.3 times S at 24 h of CTL
1.3xS48CTLYesNoYes1.3 times S at 48 h of CTL
Disclaimer/Publisher’s Note: The statements, opinions and data contained in all publications are solely those of the individual author(s) and contributor(s) and not of MDPI and/or the editor(s). MDPI and/or the editor(s) disclaim responsibility for any injury to people or property resulting from any ideas, methods, instructions or products referred to in the content.