Article

The Responses of N2O, CO2 Emissions, and Bacterial Communities to Nitrogen Addition in Saline–Alkaline Wetlands of Northeast China

1
Centre for Urban Environmental Remediation, Beijing University of Civil Engineering and Architecture, Beijing 100044, China
2
Collaborative Innovation Center of Energy Conservation & Emission Reduction and Sustainable Urban-Rural Development in Beijing, Beijing University of Civil Engineering and Architecture, Beijing 100044, China
3
Heilongjiang Zhalong National Natural Reserve Administrative Bureau, Heilongjiang 161002, China
*
Author to whom correspondence should be addressed.
Atmosphere 2023, 14(11), 1675; https://doi.org/10.3390/atmos14111675
Submission received: 24 September 2023 / Revised: 1 November 2023 / Accepted: 8 November 2023 / Published: 13 November 2023
(This article belongs to the Section Biosphere/Hydrosphere/Land–Atmosphere Interactions)

Abstract

:
The Zhalong Wetland is impacted by elevated atmospheric nitrogen (N) deposition and N inputs from agricultural fertilization, which in turn affect greenhouse gas (GHG) emissions. It is unclear how N addition affects nitrous oxide (N2O) and carbon dioxide (CO2) emissions in this wetland. Therefore, we conducted a short-term experiment, collecting soil samples from three representative points with different water levels, and five N addition levels (N0 = 0 mg N kg−1, N10 = 10 mg N kg−1, N30 = 30 mg N kg−1, N50 = 50 mg N kg−1, N100 = 100 mg N kg−1) were used to simulate N input. Overall, N2O emissions were significantly increased by N addition. Differently, N addition had a significant suppressive effect on CO2 emissions in high-flooded soils, whereas the highest CO2 emissions were regarded under the N30 treatment in middle-flooded and dry soils. Through Pearson’s correlation analysis, we found a significant positive correlation between N2O emissions and ammonium (NH4+), and CO2 emission was significantly positively correlated with pH and total organic carbon (TOC). Meanwhile, the bacterial community of the soil was analyzed via high-throughput sequencing. The results revealed that N addition was not significantly affecting soil bacterial community structure, while the three points were significantly different. Among them, the relative abundance of the dominant genera of Trichoderma and Pseudomonas were significantly enhanced after N addition. Furthermore, the bacterial communities were found to be significantly correlated with soil pH, TOC, NH4+, and nitrate contents, which affected N2O and CO2 emissions.

1. Introduction

The global deposition of atmospheric nitrogen (N) is experiencing a rise as a result of human activities, with projections indicating it will reach 200 Tg a−1 by the mid-21st century. Furthermore, it has been reported that the rate of nitrogen deposition is expected to double or potentially even triple in the near future [1]. A study conducted using the GEOS-Chem Chemical Transport Model estimated the global inorganic N deposition from 1984 to 2016, revealing a notable 8% rise [2]. China has undergone a notably significant escalation in atmospheric N deposition, with estimates indicating an approximate 60% increase since the 1980s [3]. The increase in greenhouse gas (GHG) emissions from wetlands has significant implications. There are still some wetlands around the world that are not internationally recognized, and studies have shown that remote sensing technology is able to define wetlands [4]. At the same time, after extracting the area of wetlands, it is possible to estimate GHG emissions, which is of great significance for the prevention of global warming [5]. The Zhalong Wetland is a typical inland alkaline wetland ecosystem in Northern China, with an area of about 2100 km2, with vegetation types mainly dominated by Phragmites australis [6]. The water entering the wetland is mainly from the Uygur River, thus creating a large swamp downstream. In addition, the water quality of the wetland is affected by surface source pollution due to disturbances from human activities, such as domestic sewage discharge and increased fertilizer application upstream. These external inputs of N may also impact the process of soil GHG emissions, thereby exacerbating the issue of global warming. Consequently, it is crucial to comprehend the influence of N input on GHG emissions in the Zhalong Wetland.
In ecosystems, carbon (C) and N cycles are intricately intertwined, and a moderate input of nitrogen can increase microbial activity, thereby contributing to GHG emissions. However, excessive N addition may have adverse effects [7]. A study conducted in saline soil in North Dakota (USA) revealed that nitrous oxide (N2O) emissions were 84% higher in saline compared to non-saline soils. Additionally, the nirS gene expression was 42 times higher in non-saline soils, indicating that nitrogen addition did not reduce N2O emissions from saline soils [8]. Furthermore, N addition significantly increased N2O emissions in paddy ecosystems, while no significant effect was observed in specific context or reference to Qinghai–Tibetan Plateau meadow ecosystems [9,10]. Microorganisms play a key role in the sequestration of mineral N, as was demonstrated in a 15N-labeling experiment in forest soils, thereby mitigating the risk of substantial N loss [11]. At the same time, one study concluded that long-term N addition had a low effect on nitrogen-fixing bacteria in grassland globally, whereas it had a considerable effect on ammonia-oxidizing bacteria [12]. Moreover, the influence of soil N on microorganisms can modulate C cycling processes by facilitating the decomposition and formation of soil organic matter, consequently exerting an indirect impact on carbon dioxide (CO2) emissions [13]. Soil respiration, as a crucial metric reflecting the metabolic activity of organisms, represents the primary contributor of CO2 emissions from terrestrial ecosystems to the atmosphere [14]. Previous studies commonly employed N addition experiments to simulate high sedimentation rates, resulting in a negative response in soil respiration [15,16], potentially restricting CO2 emissions by augmenting C storage [17]. However, a moderate quantity of N stimulates CO2 emissions in paddy systems, while it does not impact grassland ecosystems [10]. However, the impact of soil respiration on low levels of N input in terrestrial ecosystems is generally positive, as it contributes to microbial growth and enhances resource availability [2]. A recent review on the effects of N addition on soil C cycling in grasslands globally showed that low levels of N addition to soils had the greatest C sequestration capacity [18]. Moreover, a recent mapping analysis has revealed that N deposition has generally stimulated soil respiration in the last two decades [19]. As a result, atmospheric N deposition has been lower than the levels used in simulated N addition experiments in most ecosystems. Taking these factors into consideration, this study explores the impact of varying levels of N addition on N2O and CO2 emissions in inland alkaline wetlands.
GHG emissions primarily stem from the metabolic activity of microorganisms [20]. As the level of N addition increases, microbial diversity and activity exhibit a negative response, primarily attributed to changes in nutrient content rather than acidification effects [21,22]. While organic N typically serves as the primary source for microorganisms, inorganic N can provide 13–45% of the total N required by these microorganisms [23]. N addition promotes the growth of nitrifying and denitrifying bacteria, particularly inorganic N. However, the amount of nitrogen-fixing microorganisms reduce with higher levels of N addition. Due to variations in tolerance levels toward high osmotic potential, certain individuals exhibited a reduced microbial biodiversity [24]. Consequently, rising atmospheric N deposition rates may further exacerbate the decline of soil microbial diversity in the future, which will disrupt the ecological equilibrium. In summary, while the effects of N addition have been explored in ecosystems such as forests, grasslands, and agricultural lands, there has been limited research on its effects in natural wetland environments. In addition, most wetland studies have focused on peatlands and coastal wetlands, with minimal attention to inland alkaline wetlands. Hence, the effects of N addition in these ecosystems remain unclear. In particular, no studies have looked at both GHG emissions and microbial communities in response to N input in Zhalong Wetland specifically.
In light of the escalating atmospheric N deposition and the consequential influence of upstream agricultural activities, we procured soil samples from three distinct water level locations to replicate augmented N concentrations. Subsequently, we assessed the processes of N2O and CO2 emissions, as well as the physicochemical attributes of the soil. Furthermore, we employed high-throughput sequencing to analyze the composition and relative abundance of the bacterial community. Overall, the primary aims of this investigation were to elucidate the repercussions of heightened N concentration on N2O and CO2 emissions, as well as the structural characteristics of the bacterial community in the Zhalong Wetland. In addition, we analyzed them with physicochemical properties to elucidate the pivotal environmental factors affecting GHG emissions and bacterial communities. This study aimed to address the knowledge gap and elucidate the impacts of N addition within inland alkaline wetlands. It offers theoretical backing for future investigations on the effects of N addition on GHG emissions and bacterial communities in alkaline wetlands.

2. Materials and Methods

2.1. Soil Samples and Experimental Design

Zhalong Wetland (46°52′–47°32′ N, 123°47′–124°37′ E) is located in the Songnen Plain, China. At three points, the top (0–20 cm) layer of soil was sampled: high-flooded point (water level above ground is 10–20 cm) with Phragmites australis as the main vegetation (HF), middle-flooded point (water level above ground is 0–10 cm) with Phragmites australis as the main vegetation (MF), and dry point (no surface water) with Axonopus compressus and Medicago Sativa Linn as the main vegetation (D) in October of 2021 [25]. The collected soil was removed from coarse roots and stones, put into sealed bags, and immediately sent to the laboratory at 4 °C. One part was kept in an ultra-low temperature incubator for analysis of microorganisms, and the other part was used for microcosmic experiments and the determination of physicochemical properties. As compared with D soils, HF and MF soils contained significantly higher contents of total nitrogen (TN), total organic carbon (TOC), and dissolved organic carbon (DOC) (Table 1, p < 0.05). As a result, HF soils had a higher salinity than the other two points, which were 0.10% (HF), 0.05% (MF), and 0.04% (D), respectively (Table 1, p < 0.05).
In this study, a total of 15 treatments and three replicates were set up in the microcosmic experiment, which was used for three soils (i.e., HF, MF, and D) × five N levels (i.e., 0, 10, 30, 50, and 100 mg N kg−1). The N selected was ammonium nitrate (NH4NO3) with five N-addition-level treatments (N0 = 0 mg N kg−1, N10 = 10 mg N kg−1, N30 = 30 mg N kg−1, N50 = 50 mg N kg−1, N100 = 100 mg N kg−1), where no added N (N0 = 0 mg N kg−1) was the control for this study. NH4NO3 was formulated into a treatment solution of the appropriate concentration. Only deionized water was used in the control treatment. Fresh soil equivalent to 15 g of dried soil was weighed and spread on the bottom of a 125 mL glass jar. After 7 days of pre-incubation, 1 mL of each treatment solution was evenly pipetted into the flask, adjusting to 60% water holding capacity, and sealed with a permeable sealing film, which was incubated at 20 °C in dark conditions for 40 days. Deionized water was replenished every 2 days by weighing to maintain water content. After the incubation, soil pH, TOC, electrical conductivity (EC), nitrate (NO3), and ammonium (NH4+) contents were measured for subsequent analysis.

2.2. Soil Gas Emissions and Physicochemical Characteristics Analysis

There were gas samples with syringes taken on days 1, 3, 5, 7, 9, 12, 15, 18, 21, 25, 30, 35, and 40 of incubation. After removing the bottle sealing film, the room was ventilated for 30 min to equilibrate with ambient air before each gas collection, at which time, 5 mL of gas was withdrawn with a syringe as an initial value. The sample jar was then sealed with a rubber stopper for 10 h and then 5 mL of gas was drawn again. N2O and CO2 concentrations were measured in a gas chromatograph (Agilent 8890A, Agilent Technologies, Palo Alto, CA, USA). In this case, CO2 was measured using a flame ionization detector (FID) with an operating temperature of 300 °C to determine its concentration. N2O concentrations were measured using an electron capture detector (ECD) with an operating temperature of 350 °C. The carrier gas was high-purity N2. The GHG emission rates and cumulative emissions were calculated using the following equation [26]:
F = ρ × V / W × c / t × 273 / ( 273 + T ) ,
Cummulative gas emission = [ F 1 + F 2 2 ] × 24 × t × W ,
where F is the emission rate (μg N2O-N kg−1 h−1 or mg CO2-C kg−1 h−1), ρ is density at standard conditions (kg m−3), V is headspace volume (m3), W is the weight of the dry soil (kg), ∆c is the concentration difference, ∆t is sealing time (h), T is the incubation temperature (20 °C), t is the time interval between two adjacent, and (F1 + F2)/2 is the average of the two adjacent gas emission rates.
The soil was ground and sieved after using a freeze dryer at −60 °C for 2 days, which was used to determine soil pH, EC, TOC, and TN. Soil pH (water/soil = 2.5:1) was measured with a pH meter (PHS-2F, Yidian Technology, Shanghai, China). Soil EC was measured with a conductivity meter (DDS-307, Leici, Shanghai, China). Soil DOC was determined (water/soil = 5:1) on a total organic carbon analyzer (NC3100, Analytik Jena, Germany). Soil TOC was analyzed using the potassium dichromate oxidation method. Soil TN was analyzed using the elemental analyzer (vario PYRO cube, Elementar, Germany). An automated continuous flow injection analyzer (AA3 HR, SEAL Analytical, Norderstedt, Germany) measured NO3 and NH4+ with 1 M KCl extraction.

2.3. High-Throughput Sequencing Analysis

Soil samples from the N0, N30, and N100 treatments were collected from three points. Extraction samples mainly consisted of soil (HF, MF, and D) at day 0, control group (HF_CK, MF_CK, and D_CK) at day 40, group treated with 30 mg N kg−1 (HF_N1, MF_N1 and D_N1) and group treated with 100 mg N kg−1 (HF_N2, MF_N2, and D_N2) at day 40, respectively. DNA was extracted from 0.5 g soil with the kit (MP Biomedicals), and then the concentration was measured with NanoDrop (NanodropOneC, Thermo Scientific, USA). The bacterial 16S rRNA was amplified using primers 338F (5′-ACTCCTACGGGAGGCAGCAG-3′) and 806R (5′-GGACTACHVGGGTWTCTAAT-3′). The sequences were deposited for this study in the NCBI Sequence Read Archive database under the PRJNA993375 (https://www.ncbi.nlm.nih.gov/sra/PRJNA993375 (accesed on 31 August 2023)). Sequencing was performed on the Illumina MiSeq PE300 platform (Majorbio Bio-Pharm Technology Co., Ltd., Shanghai, China). Analysis of microbial data was conducted on the Majorbio platform (www.majorbio.com (accesed on 8 July 2023)).

2.4. Statistical Analysis

The analysis of variance (ANOVA) was used to perform statistical and analytical analyses of the data using IBM SPSS Statistics 26.0 software. GHG emissions, bacterial communities, and physicochemical properties were correlated using Pearson’s correlation analysis. Furthermore, the study used redundancy analysis (RDA) to investigate the relationship between soil physicochemical properties and bacterial communities. All graphs were plotted using Origin 2021.

3. Results

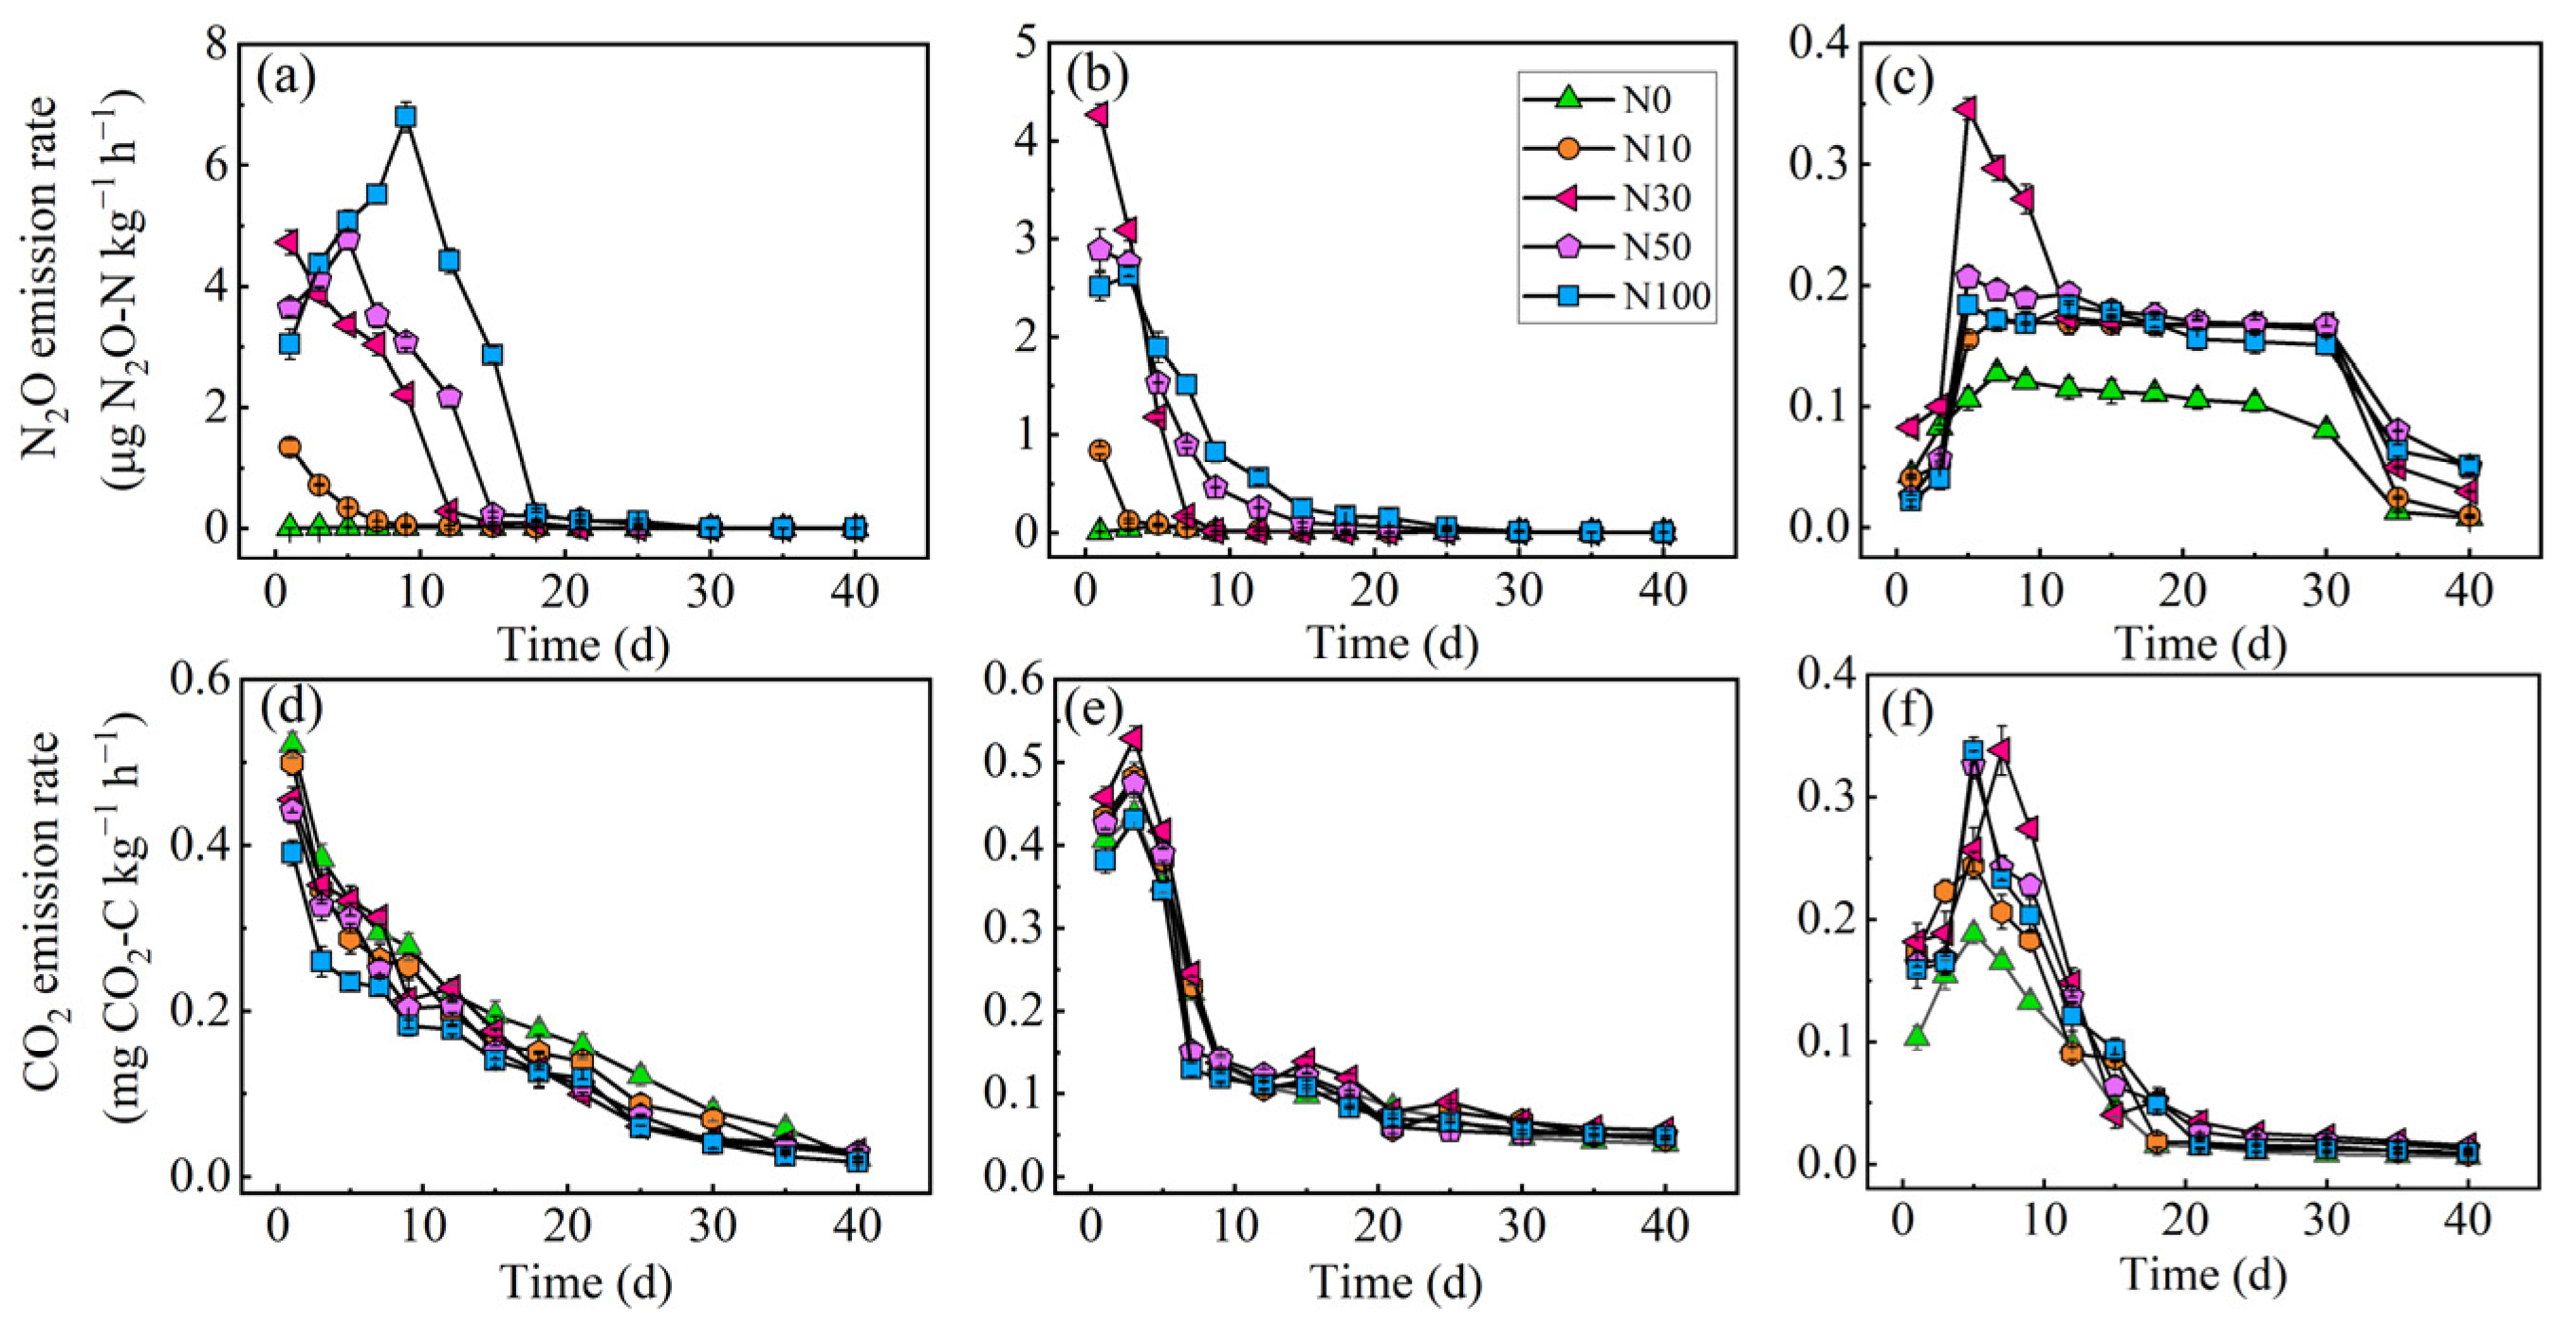
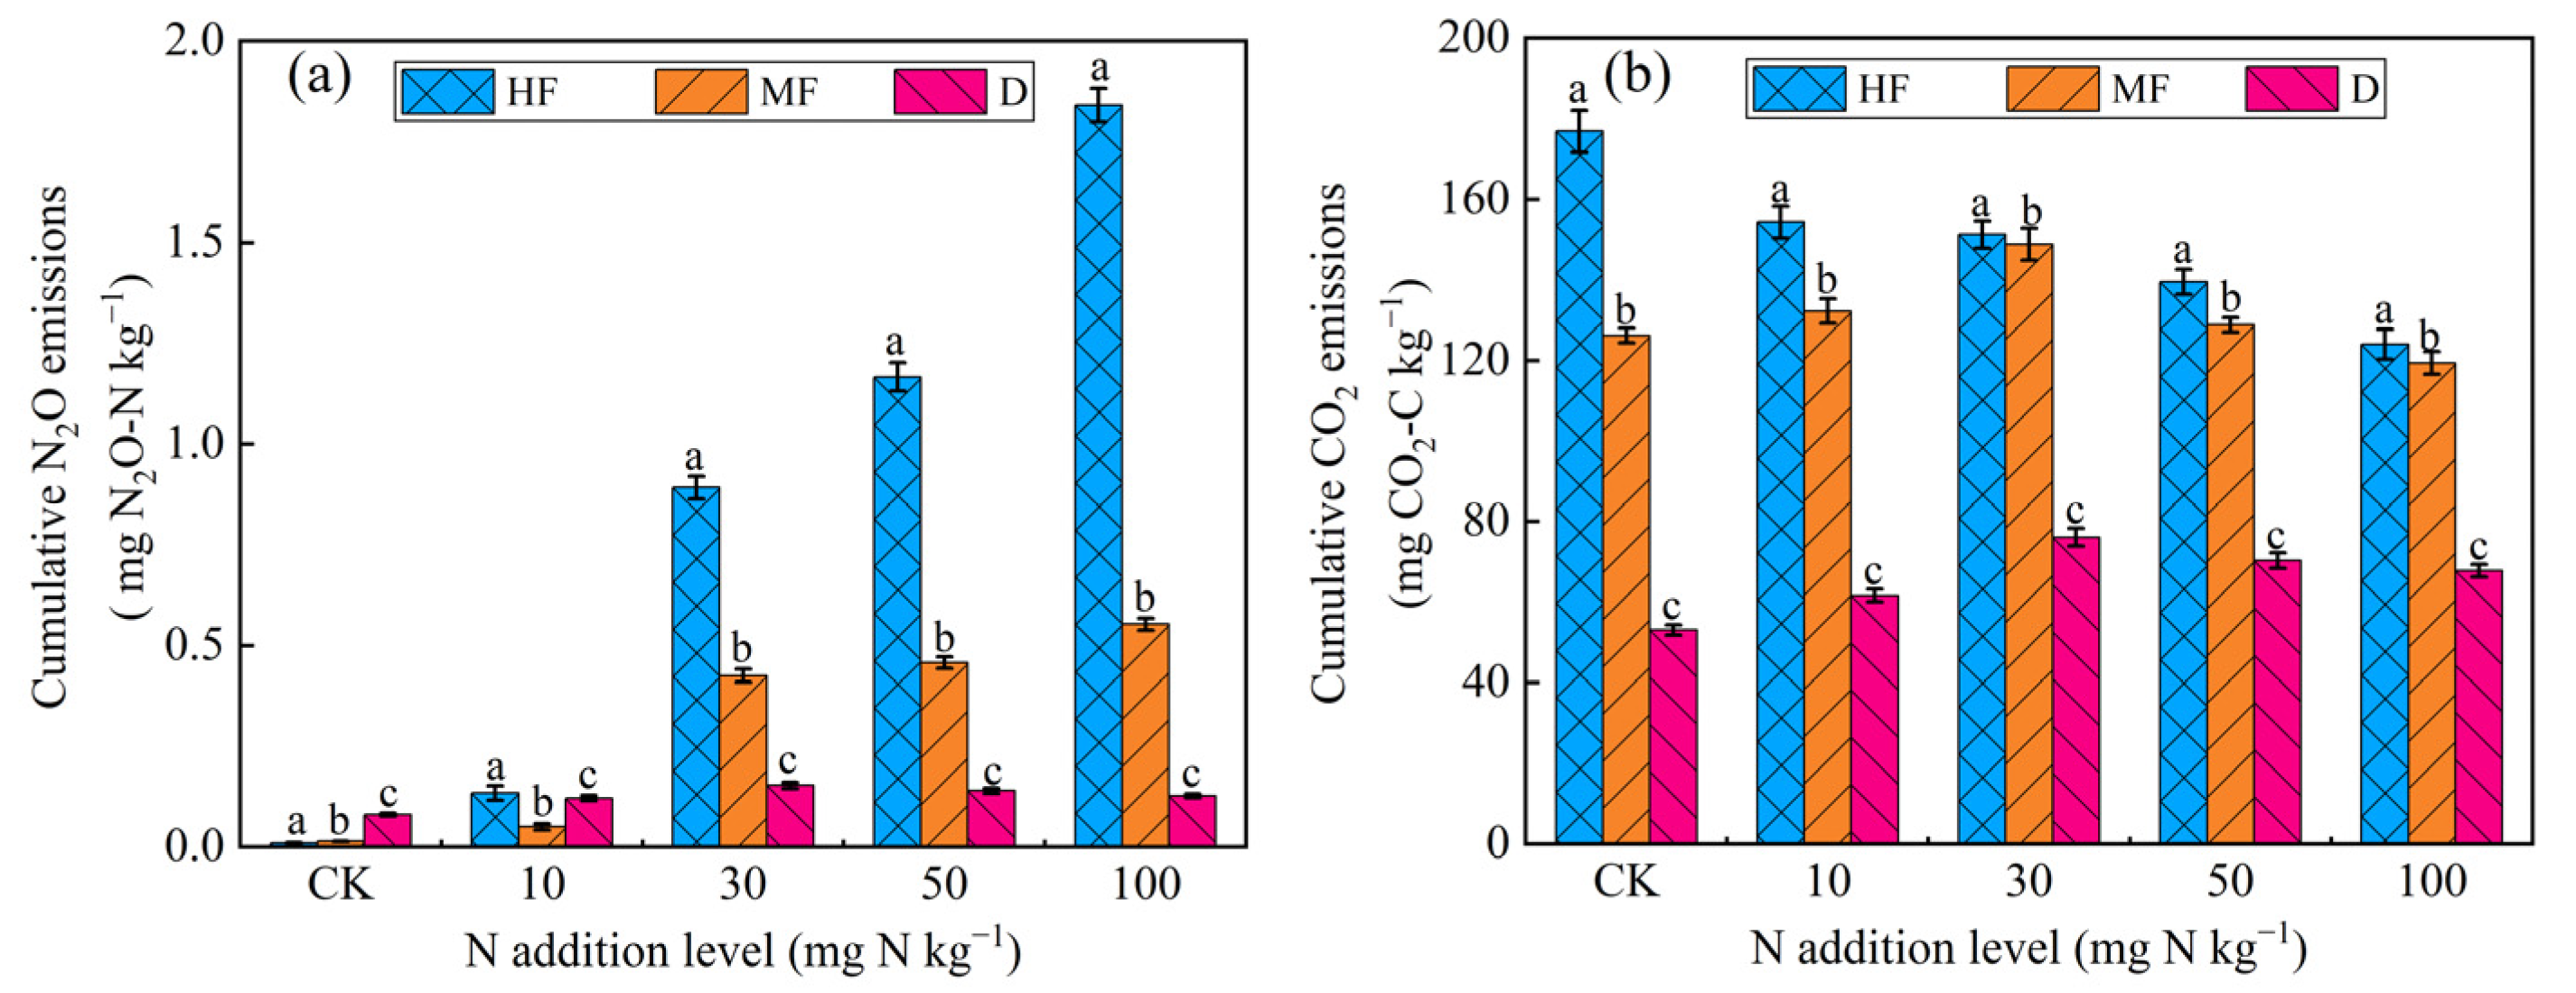
3.1. Greenhouse Gas Emissions and Soil Physicochemical Properties

The N2O emission rates were recorded and remained stable after 21, 25, and 35 days of incubation under different N addition levels in HF, MF, and D, respectively (Figure 1a–c). Moreover, there was a significant impact of N addition level, sampling site, and their interactions on N2O emissions (Table 2, p < 0.001). Among them, the cumulative N2O emissions ranged from 9.49 to 1841.39 μg N2O-N kg−1 (HF), 13.83 to 552.98 μg N2O-N kg−1 (MF), and 79.65 to 152.84 μg N2O-N kg−1(D) under different N addition levels (Figure 2a). Cumulative N2O emissions were significantly positively correlated between 0 and 100 mg N kg−1 in HF (p < 0.01), while they were significantly positively correlated from 30 to 100 mg N kg−1 in MF (p < 0.05). Furthermore, it showed a significant positive correlation from 0 to 30 mg N kg−1 (p < 0.05) and a significant negative correlation from 30 to 100 mg N kg−1 (p < 0.01) in D (Table 3). N2O emissions were significantly and positively affected by ammonium (NH4+) content from Pearson’s correlation analysis (Table 4).
Furthermore, CO2 emission rates decreased with the fluctuation of cultivation time and remained stable after 20 days under different N addition levels (Figure 1d–f). N addition level, sampling site, and their interactions also significantly affected CO2 emission (Table 2, p < 0.001). The cumulative CO2 emissions were HF (176.91, 154.32, 151.27, 139.53 and 124.01 mg CO2-C kg−1), MF (126.22, 132.22, 148.86, 128.86 and 119.40 mg CO2-C kg−1), and D (53.13, 61.70, 76.13, 70.35and 67.89 mg CO2-C kg−1), respectively (Figure 2b). Among them, cumulative CO2 emissions were significantly negatively correlated at 0–100 mg N kg−1 in HF (p < 0.05), while were significantly positively correlated at 0–30 mg N kg−1 (p < 0.05) and negatively correlated at 30–100 mg N kg−1 (p < 0.01) in MF and D (Table 5). CO2 emissions were significantly and positively affected by total organic carbon (TOC) content and pH (p < 0.05) from Pearson’s correlation analysis (Table 4).

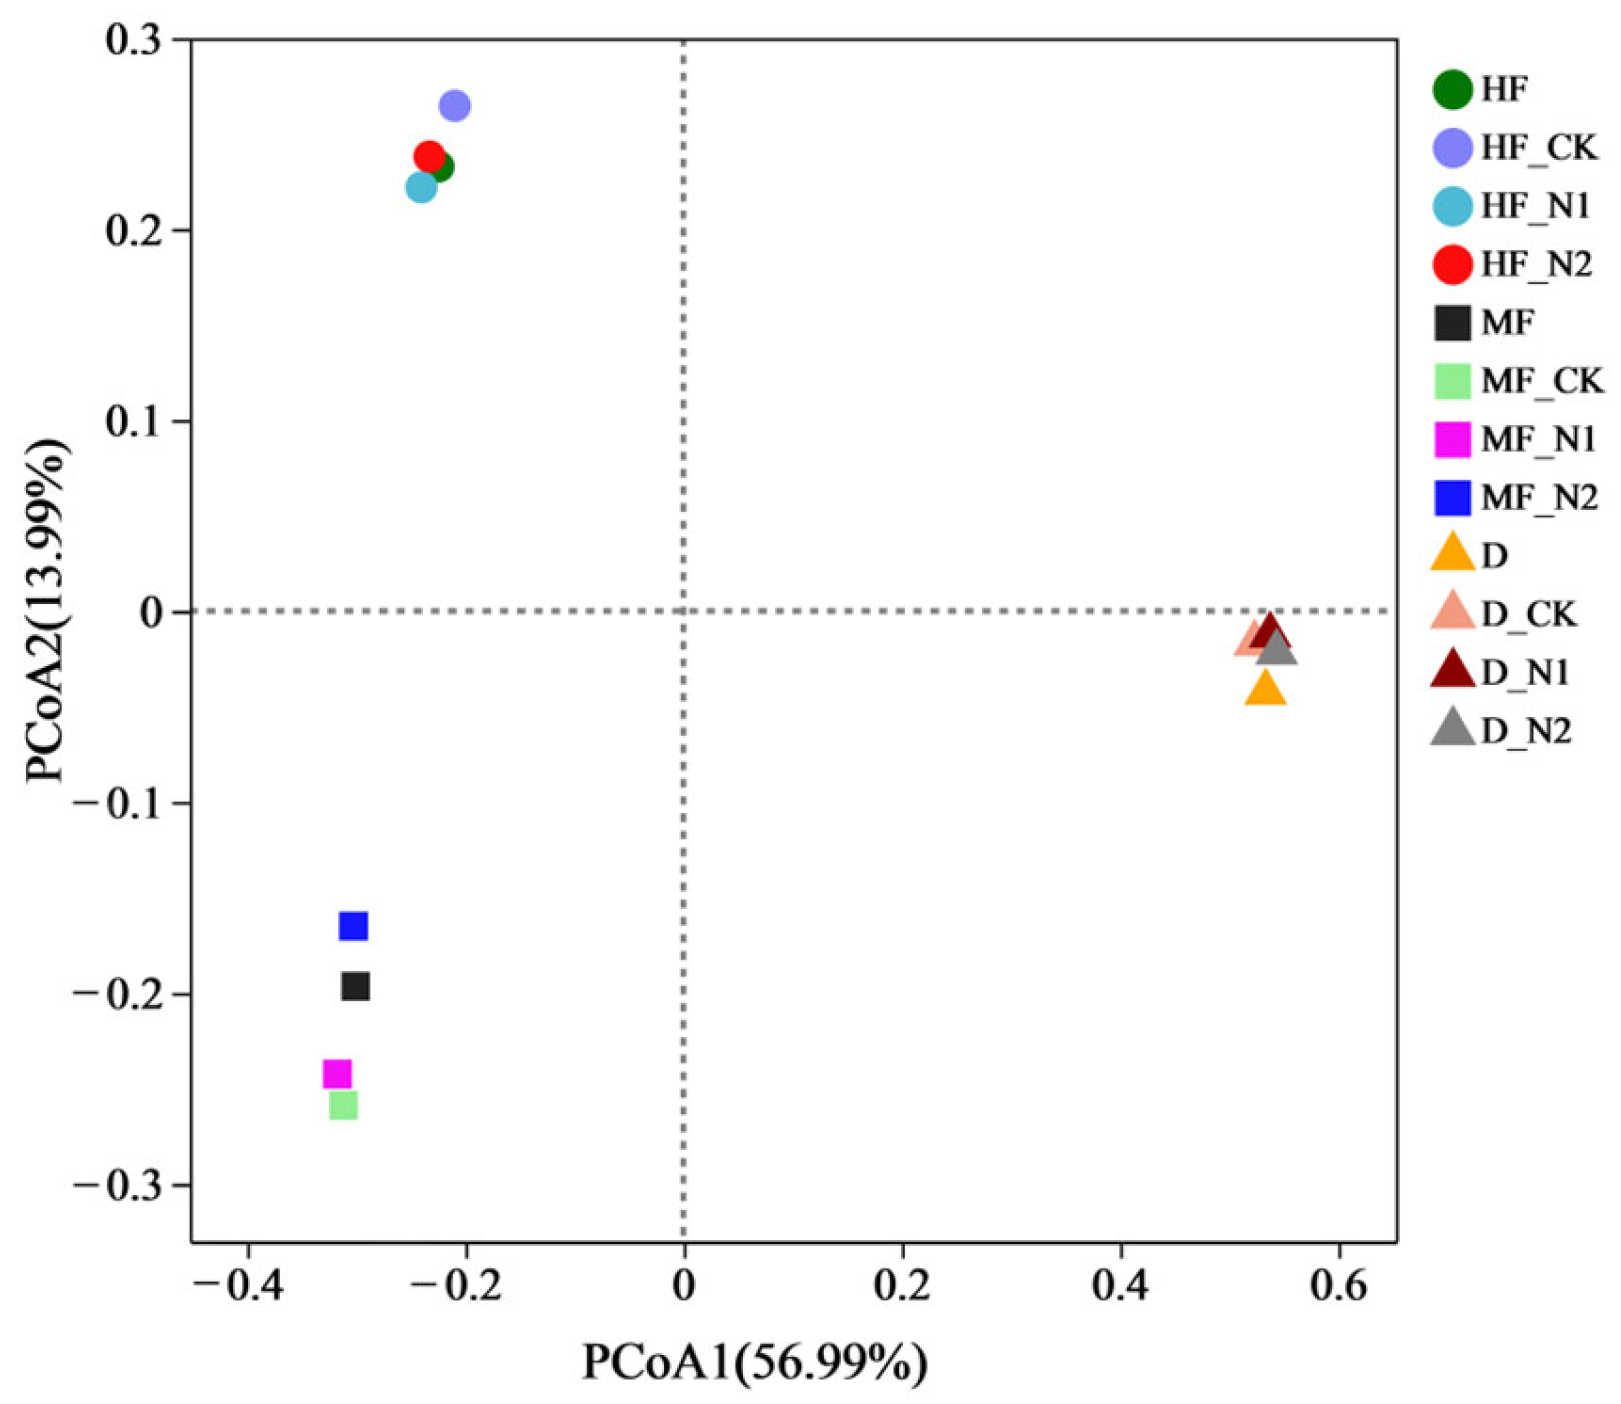
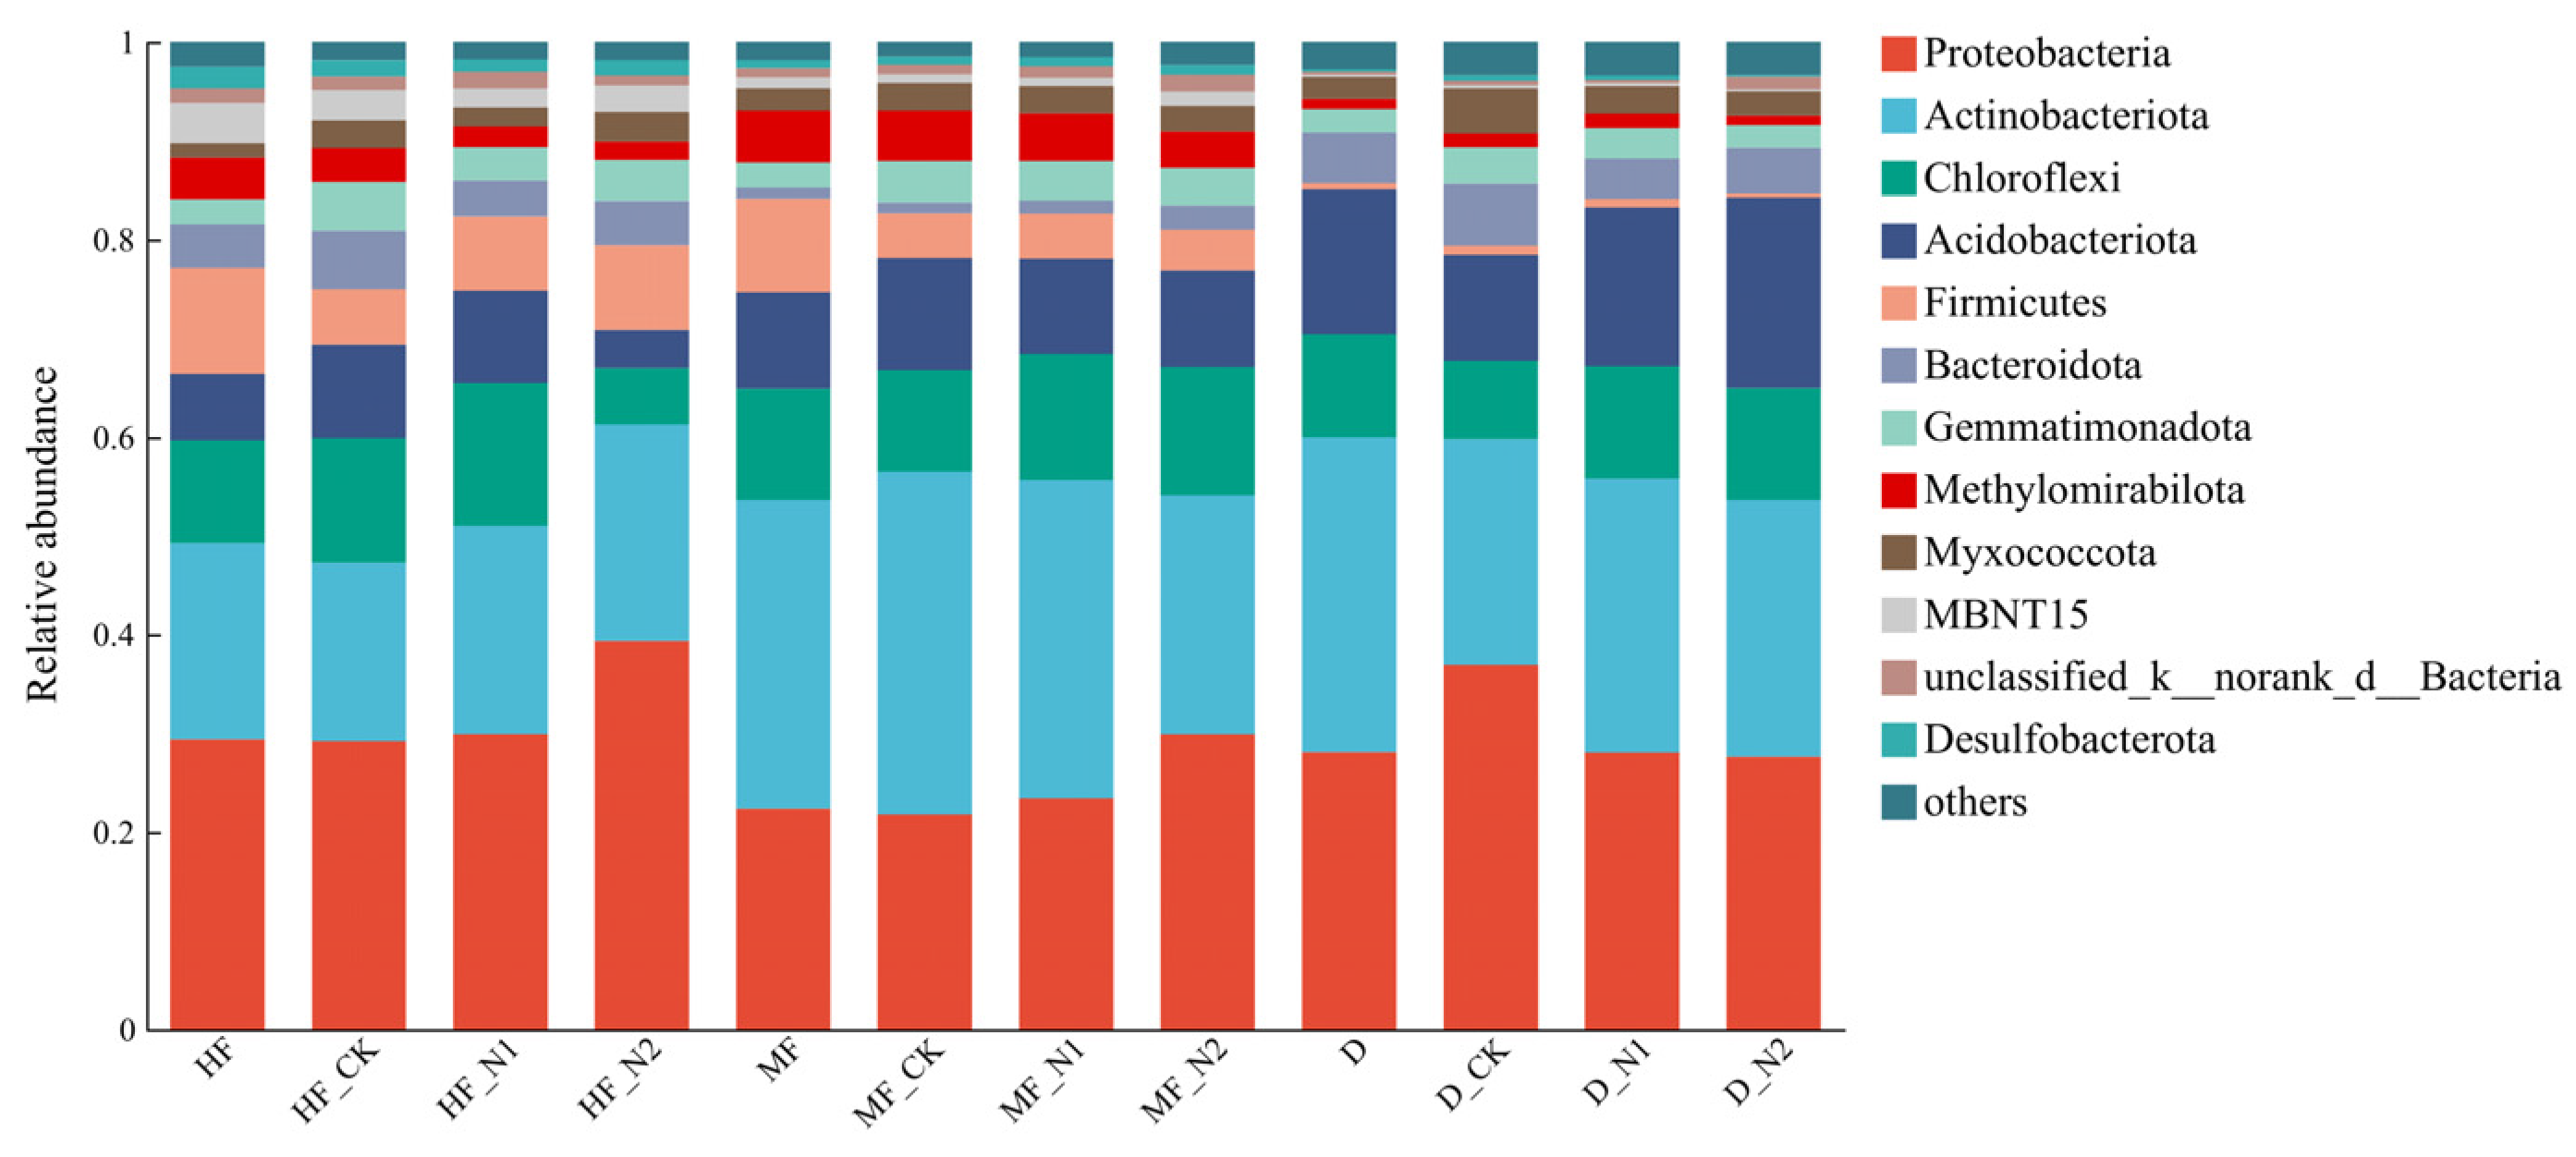
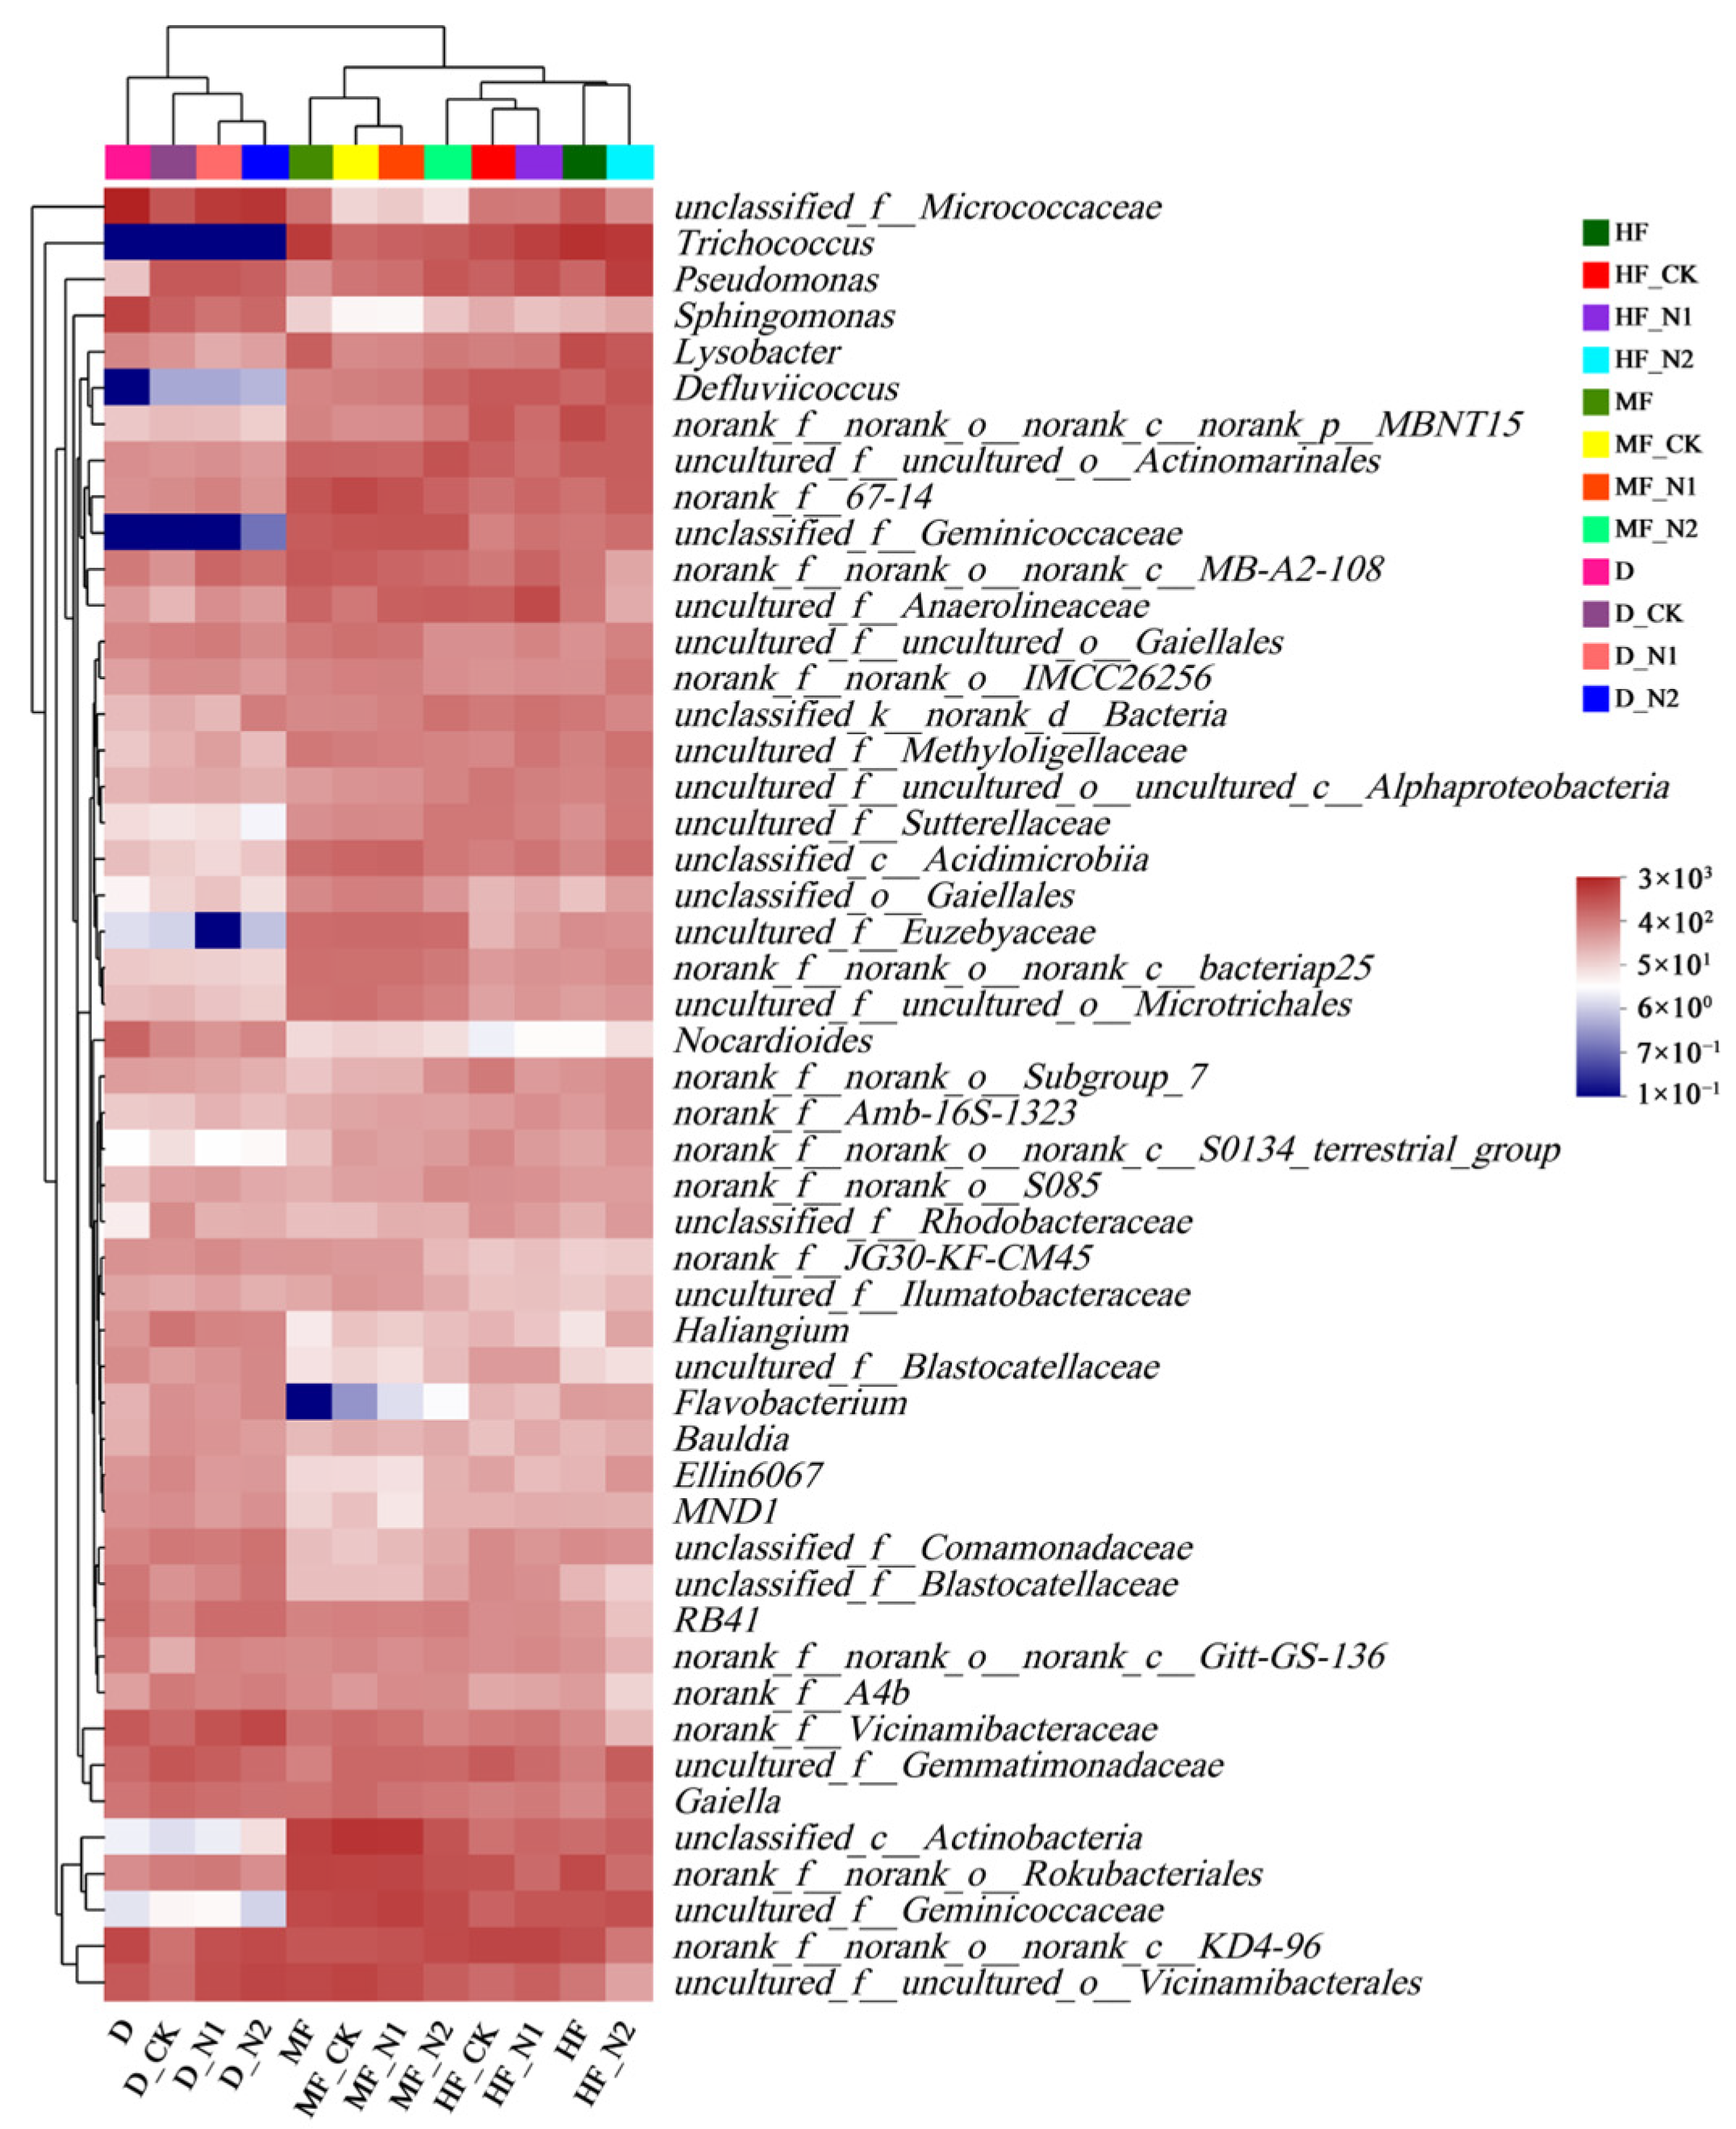
3.2. Bacterial Community Diversity and Composition

As a result of N addition, the diversity of bacteria alpha (Chao1 and Shannon) significantly increased in MF and D soils. Conversely, it significantly decreased at N100 treatment in HF (Table 6). PCoA analysis of bacterial community structure was shown (Figure 3). In the bacterial community of three points, 13.99% and 56.99% of the variances could be explained by the first and second axes, respectively. Clearly, the bacterial community structure was similar across treatments of the same site, while significant differences were found between different sites (p < 0.05). It indicates that the structural difference of the bacterial community was determined by the sampling site.
In three points, there is a relative abundance (more than 1%) of bacteria in the bacterial phylum (Figure 4). Proteobacteria and Actinobacteria dominated the bacterial communities, with relative abundances of 49.25–61.27% at three points. In HF, HF_N1 and HF_N2, treatments increased the relative abundance of Proteobacteria by 0.75% and 10.18%, Actinobacteriota by 2.98% and 3.83%, and Firmicutes by 1.92% and 2.99%, respectively, compared with HF_CK treatment. The relative abundance of Chloroflexi and Acidobacteriota was the lowest in HF_N2 treatment and significantly lower than in HF_CK (p < 0.05). In MF, N addition significantly raised Proteobacteria and Chloroflexi relative abundances (p < 0.05) by 8.11% and 2.72% in MF_N2 treatment, respectively. On the other hand, the relative abundance of Acidobacteriota and Actinobacteriota was the highest in the MF_CK treatment, which decreased by 1.59% and 10.50% in the MF_N2 treatment, respectively. Furthermore, as a result of the MF_N2 treatment, the relative abundance of Firmicutes minimized by 0.41%. In D, the relative abundance of Proteobacteria and Firmicutes minimized with increasing levels of N addition, with 9.30% and 0.51% decreases in D_N2 treatment, respectively. However, the relative abundance of Acidobacteriota enhanced by 8.49% in D_N2 treatment (p < 0.05). As a result of the D_N1 treatment, the relative abundance of Chloroflexi and Actinobacteriota were the highest, increasing by 3.51% and 4.85%, respectively.
Heatmap of bacterial communities’ (relative abundance > 1%) distribution at the genus level (Figure 5). According to the results, N addition increased the relative abundance of some non-dominant bacteria in three points. In HF, HF_N2 treatment significantly reduced the relative abundance of KD4-96 (from 4.67% to 1.46%) and increased Trichococcus (from 3.75% to 6.34%) and Pseudomonas (from 2.43% to 5.66%) (p < 0.05). MF_N2 treatment significantly reduced Actinobacteria (from 7.25% to 3.34%), Rokubacteriales (from 4.85% to 3.60), Vicinamibacterales (from 4.78% to 2.64%), and 67-14 (from 4.37% to 2.35%) (p < 0.05) in MF soil. In addition, D_N2 treatment significantly increased Micrococcaceae (from 3.25% to 6.94%), KD4-96 (from 1.68% to 4.22%), Vicinamibacteraceae (from 1.97% to 4.47%), and Vicinamibacterales (from 1.80% to 4.73%), while significantly reducing the Gemmatimonadaceae (from 3.21% to 1.95%) in D soil (p < 0.05), with no significant effect on other flora.

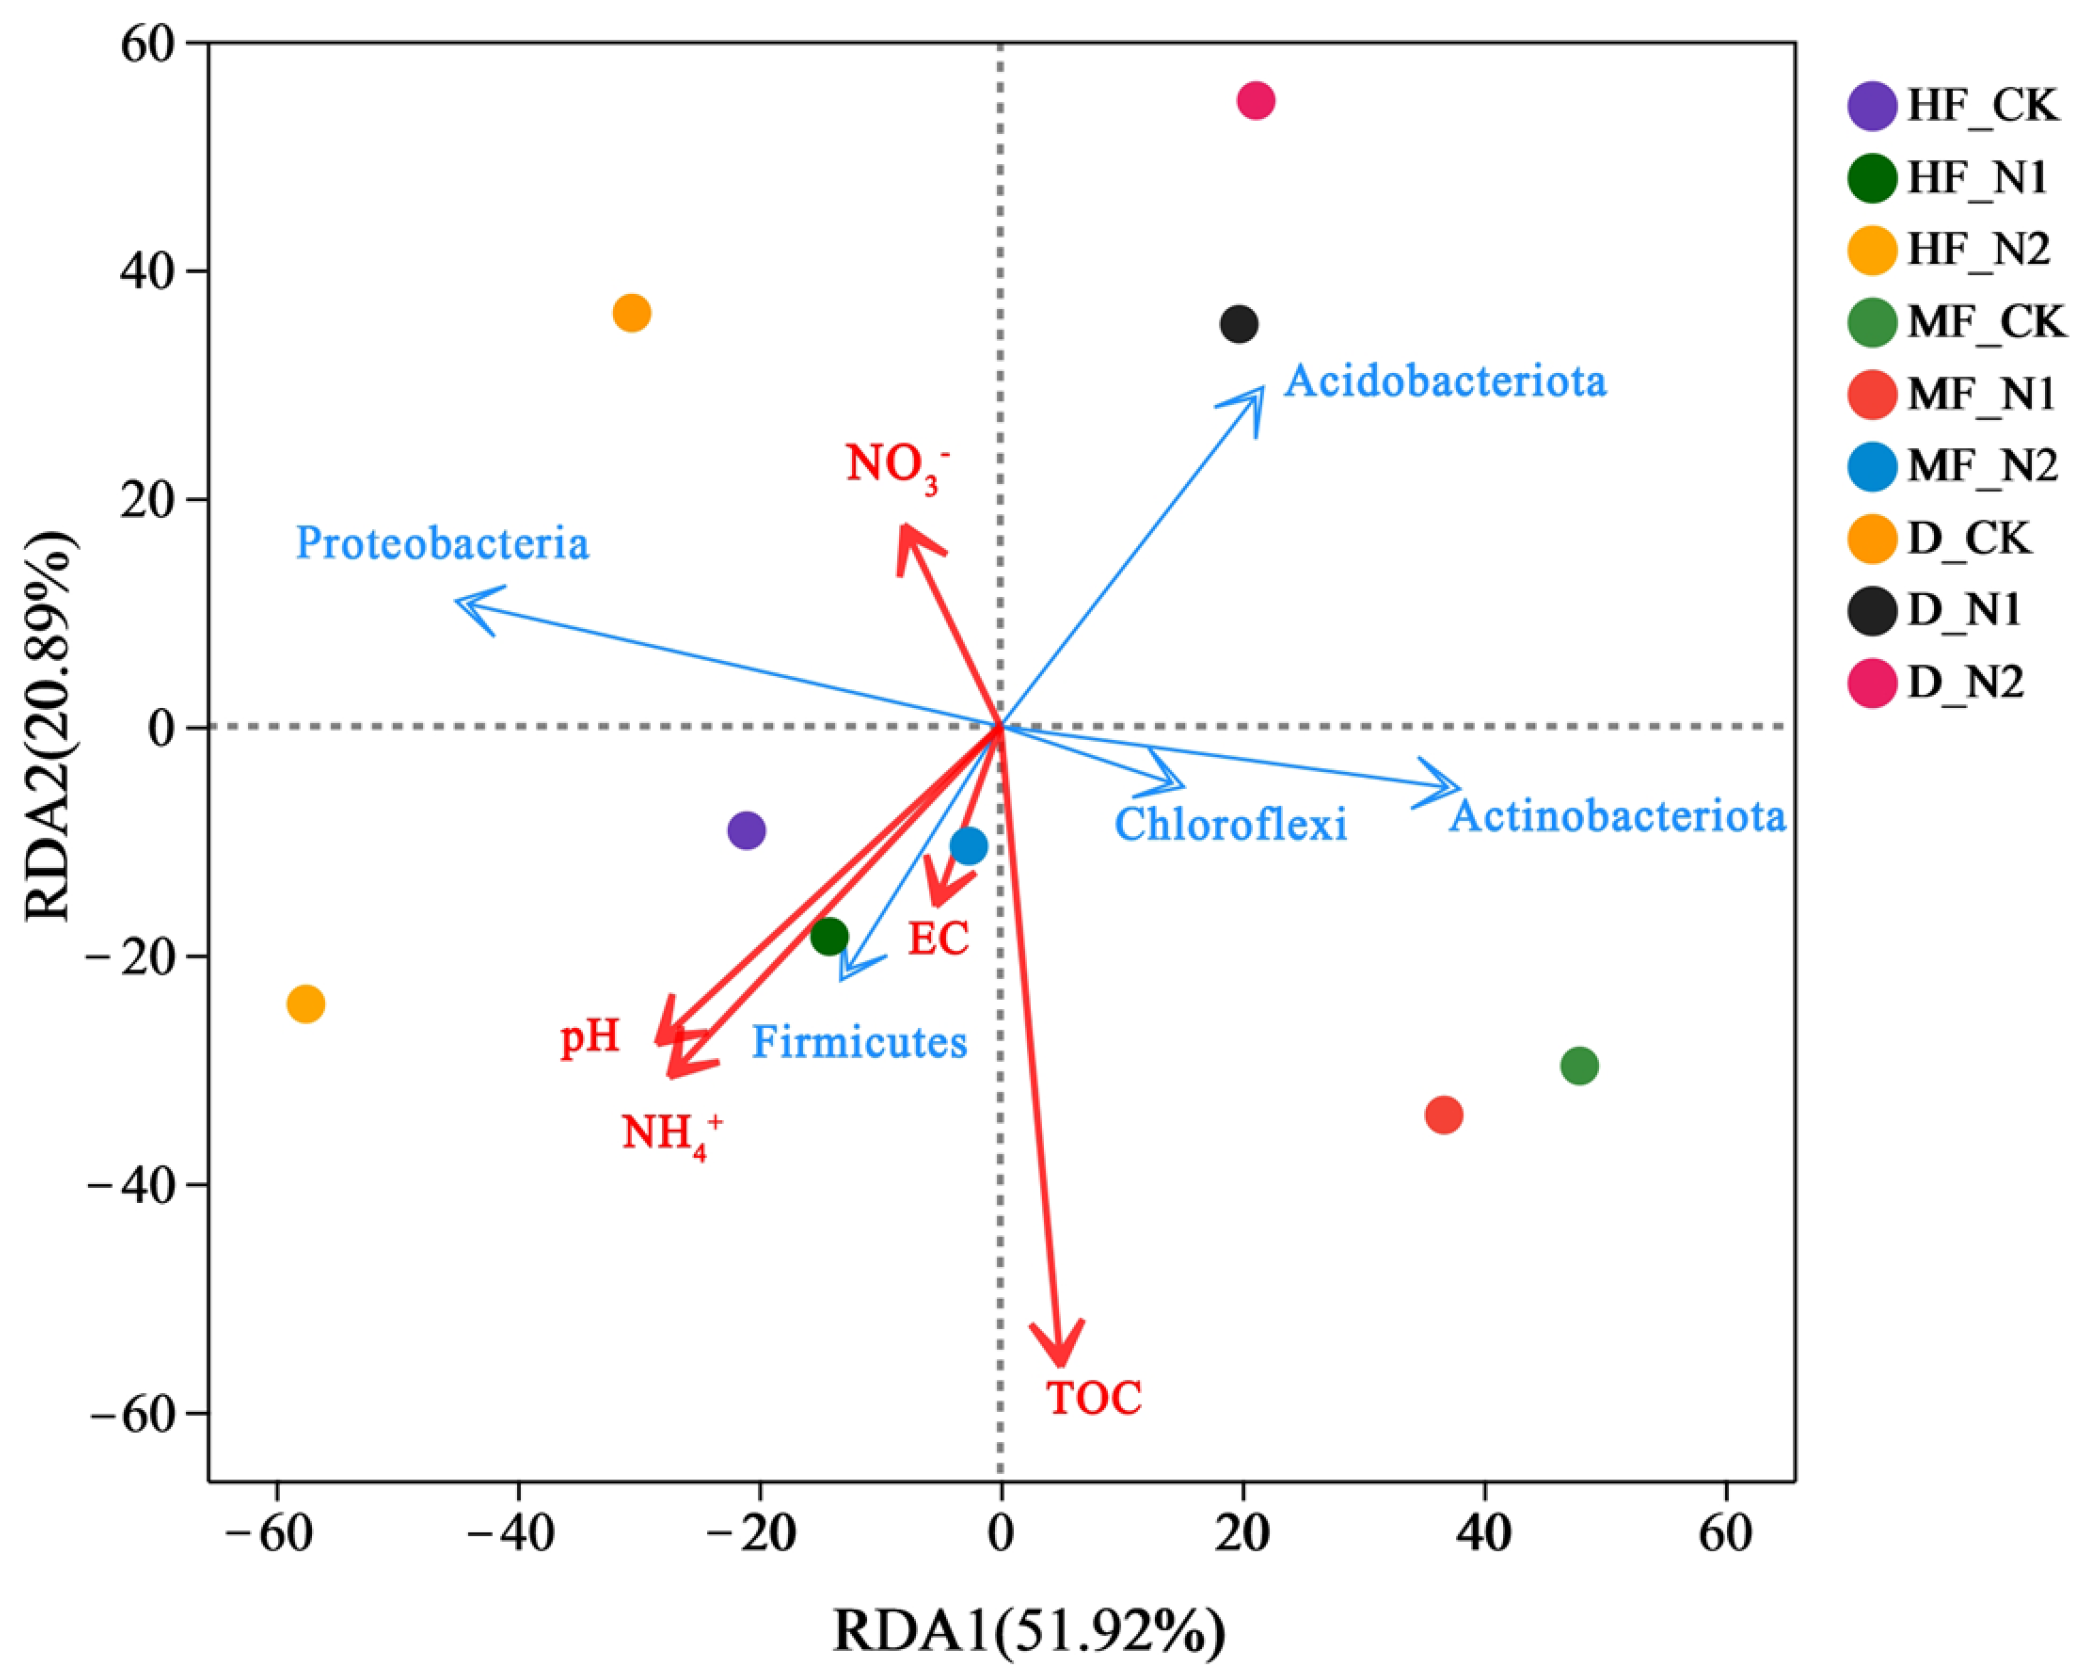
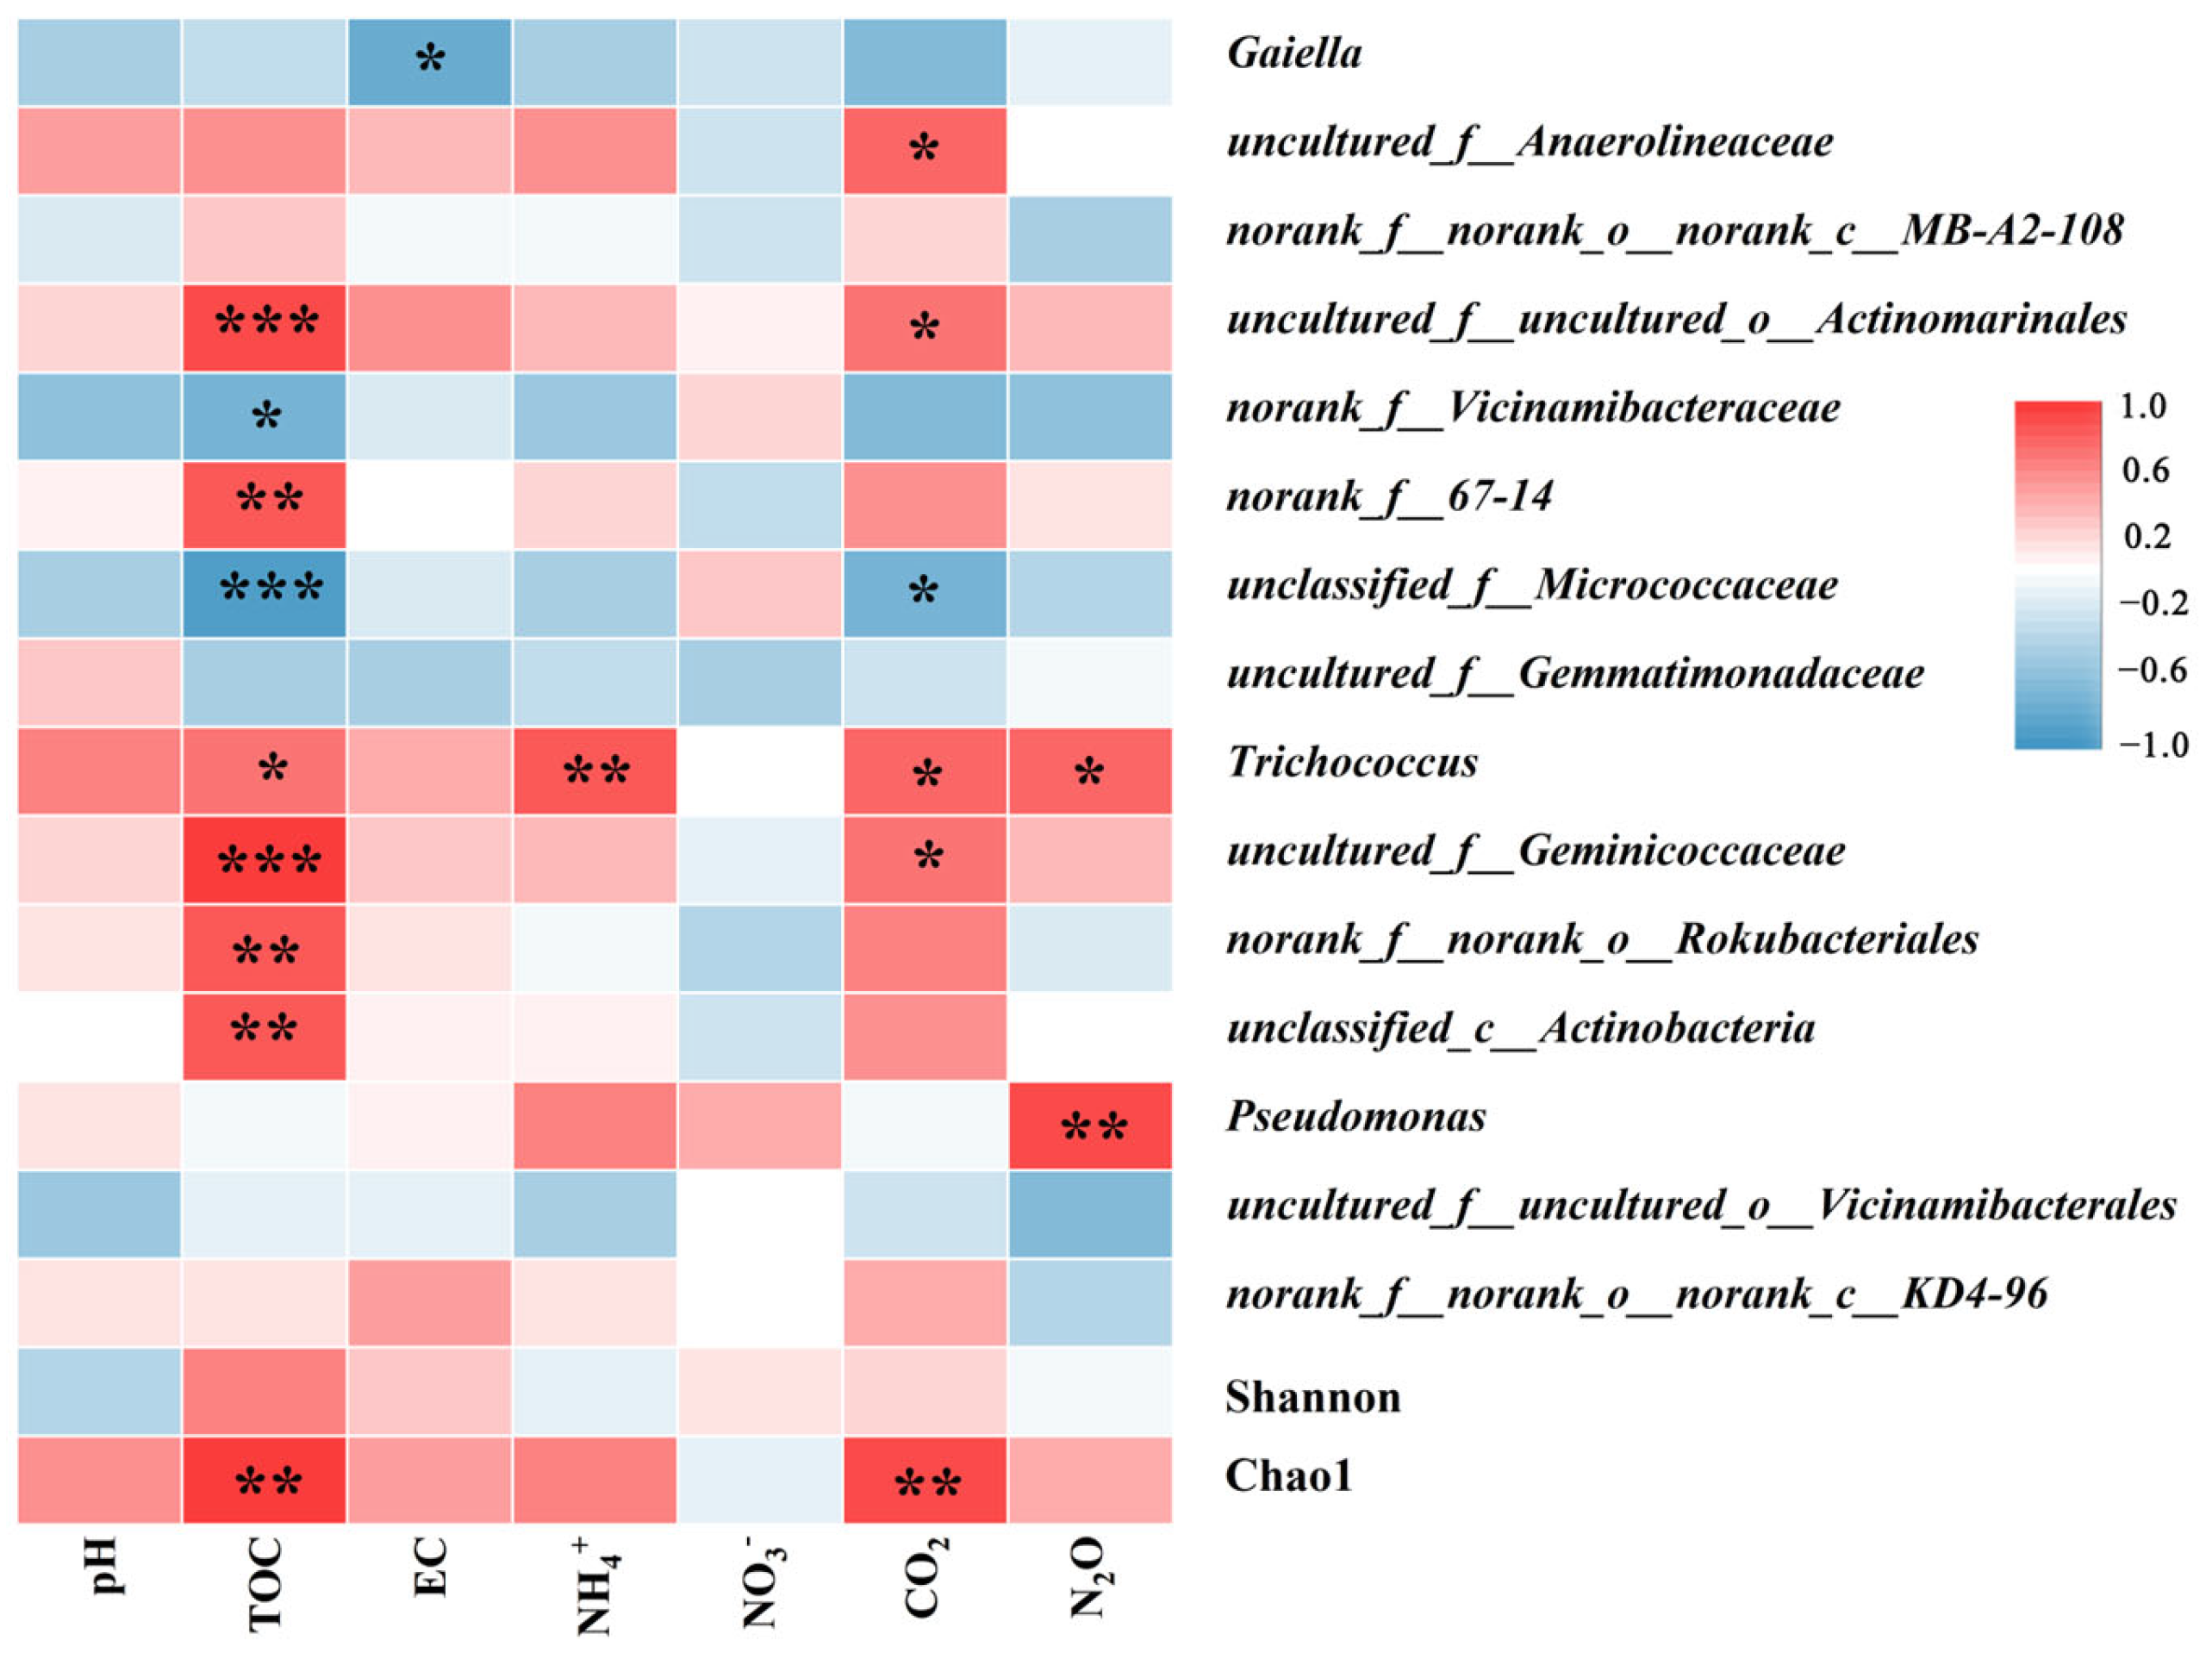
3.3. The Relationship between Bacterial and Soil Physicochemical Properties, Greenhouse Gas Emissions

Physicochemical factors influencing soil bacterial communities were evaluated using redundancy analysis (RDA) (Figure 6). In terms of bacterial community composition, the first and second axes explained 51.92% and 20.89% of the variance, respectively. TOC was positively correlated with the first axis, while pH, electrical conductivity (EC), and NH4+ were negatively correlated. However, the second axis was positively correlated with nitrate (NO3), and negatively correlated with pH, EC, and NH4+. There was a significant impact of t soil TOC on the bacterial community (p < 0.05). Among them, Actinobacteriota and Chloroflexi had a positive correlation with TOC, while Proteobacteria had a positive correlation with NO3. Hence, soil organic C and inorganic N were important influences on the bacterial community.
We plotted a heatmap of bacterial and physicochemical properties to reveal how environmental factors affect genus-level bacteria (top 15) (Figure 7). It was clear that the TOC factor was most strongly correlated with the dominant genus. Among them, Geminicoccaceae, Actinomarinales, and TOC were significantly positively correlated (p < 0.001). Micrococcaceae was significantly negatively correlated with TOC (p < 0.001) and CO2 emissions (p < 0.05). Trichococcusand and NH4+ content were significantly positively correlated (p < 0.001). Gaiella was significantly negatively correlated with soil EC (p < 0.05). Meanwhile, a significant positive correlation was found between the Chao1 index and TOC and CO2 emissions (p < 0.01). Pseudomonas (p < 0.01) and Trichococcusand (p < 0.05) were significantly negatively correlated with N2O emissions. Geminicoccaceae, Trichococcusand, Actinomarinales and, Anaerolineaceae, and CO2 emissions were significantly positively correlated (p < 0.05).

4. Discussion

In this study, N addition significantly positively affected soil N2O emissions in three points, with similar phenomena observed in irrigated maize in a Mediterranean agroecosystem [27]. N addition tends to promote N2O emissions, and it has been found that among the various factors affecting soil N2O emissions, the amount of N application is the most decisive [28,29]. The nitrification process gradually depletes the soil of energy materials and easily decomposable organic N, so the gas emissions gradually stabilize in the later stages [30]. Jia et al. found that N2O emissions increased by 134% under high N treatment in a study of coastal wetlands [31]. Similarly, N levels significantly contribute to N2O emissions in the urban wetland in Zhejiang Province, China [32]. Song et al. concluded that N addition increased N2O emissions by 54.53% in permafrost peatland [33]. Meanwhile, cumulative N2O emissions in the paddy system were positively correlated between N addition levels of 60 to 100 mg N kg−1 [9]. In particular, low N treatment decreased by 87.93–91.48% compared to high N treatment. Zhang et al. found that N2O emissions increased significantly in both agricultural and forest soils by adding ammonium nitrate, and were higher in agricultural soil [34]. In summary, N addition has a positive effect on N2O emissions, consistent with the findings of this study. Meanwhile, this conclusion was also confirmed in mangrove wetlands [35]. Moreover, a significant positive correlation was found between N2O emission and NH4+ content in this study. In addition, soil acidification due to high inputs of NH4+ affects the expression of nosZ genes, promoting N2O emissions [36]. This phenomenon was more evident in the HF and MF sample sites, which may have been due to the fact that the in situ environments of the HF and MF sample sites are more suitable for the survival of denitrifying bacteria.
Our study found that moderate N additions promoted CO2 emissions, while high N additions inhibited them. Under controlled laboratory conditions, soil microbial respiration is the primary source of CO2 emissions, so high or low CO2 emissions can represent the strength of soil microbial activity. The addition of inorganic N (NO3 and NH4+) and organic N in the coastal wetland increased CO2 emissions by 23.24%, 32.92%, and 49.02%, respectively [37]. It was also found that N addition increased N2O emissions by 54.53% in permafrost peatlands [33]. Similarly, Qu et al. found that N addition to grasslands on the Tibetan Plateau increased CO2 emissions by 1.55–22.6% [38]. This is mainly because the low N addition provides additional N for microbial growth, increasing its activity and thus promoting soil respiration [7]. However, increasing N reduces soil CO2 emissions in forest ecosystems [39]. High addition levels lead to soil acidification, allowing ions that are harmful to cells (e.g., Al3+) to run off the soil and significantly inhibit microbial metabolism [40]. The study also demonstrated that CO2 emissions were significantly positively correlated with NH4+ and pH, while the opposite phenomenon was found in saline–alkaline paddy fields [41]. In addition, it may also be due to the effect of the form of N addition. In the maize field, CO2 emissions were 22% lower in the form of N addition as NO3 than NH4+ [42]. In summary, the increase in N addition levels causes the accumulation of organic C and enhances soil C sequestration. Furthermore, the same treatment showed HF > MF > D. Soil TOC is the substrate required for soil respiration, especially when dissolved organic C is more easily decomposed by microorganisms. The highest DOC content was found in HF and the lowest in D, which is consistent with the results obtained from field experiments [25].
The diversity of bacterial alpha in this study responded differently to different N addition levels, which were consistent within the rhizosphere soil of sugarcane and in citrus orchard soil studies [43,44]. In general, soil bacterial abundance and diversity showed an increase, especially in the D soils. In the alpine wetland of Qinghai–Tibet Plateau, where NH4NO3 was also used as a N source, the soil Shannon indices were found to increase with increasing N addition [45]. However, this phenomenon was not found in a coastal nontidal wetland ecosystem, where N levels did not significantly affect soil bacterial diversity [46]. A meta-analysis showed that Shannon and Chao1 indices increased or did not change significantly under the added ammonium N treatment. However, other forms of N decreased the diversity of bacterial alpha, so it is possible that the added nitrate caused a negative effect in this study [21]. It was evident that bacterial diversity was significantly smaller in HF and MF than in D with inconsistent vegetation. It is speculated that this may be due to the ability of different root secretions to screen for specific bacterial species [25].
Although the effect of N addition on bacterial diversity was significant, it did not significantly affect bacterial community composition. It was shown that N addition affected the relative abundance of the dominant bacterial phylum. The dominant taxa were Proteobacteria and Actinobacteria, the most widespread phyla in nature. Among them, Proteobacteria contain many large numbers of bacteria capable of N fixation [47]. N addition significantly enhanced the relative abundance of Proteobacteria in HF and MF, while it decreased in D. Actinobacteriota is a significant phylum in many extreme environments, such as extreme drought, perennial permafrost, and degraded soils [48,49,50]. The relative abundance of Chloroflexi enhanced under the N30 treatment and decreased or had no effect under the N100 treatment. Chloroflexi can participate in the C and N cycle, among others, not only in CO2 fixation, but also in nitrite oxidation, which has enriched the understanding of nitrification [51,52]. N addition minimized the relative abundance of Acidobacteriota in the HF and MF. Li et al. also concluded that the N addition decreased its relative abundance by 28.73% in the alpine wetland ecosystem of Qinghai Province [53]. In contrast, the relative abundance was as high as 19.27% under the D_N2 treatment in D. This was consistent with the results of the alpine wetland study, both of which had the highest relative abundance under the high N treatment [45]. Acidobacteriota can decompose plant and animal carcasses and participate in material recycling processes [54]. Interestingly, MBNT15 was detected in this wetland with a relative abundance of 4.01%, 1.01%, and 0.23% in HF, MF, and D, respectively. Among them, it was more susceptible to the presence of 10–20 cm water level wetlands with no significant effect of N addition treatment. The present study further confirms the proven greater susceptibility to anoxic layers rich in organic matter and the ability to mineralize low-molecular-weight organic matter completely [55].
The dominant genera differed significantly from one sample site to another. The KD4-96 belongs to Chloroflexi, the dominant genus in HF soils, and the reduction in the relative abundance may be detrimental to soil C and N fixation [51]. The 67-14 was the dominant genus in the MF, belonging to Thermoleophilia, with relatively high-temperature tolerance [56]. The Micrococcaceae had the highest relative abundance in D, belonging to Actinomycetes, and its activity was enhanced by N addition. Sphingomonas was the dominant genus with high relative abundance in D. It survived in poor soils, and the low organic matter content of the site may have contributed to the high relative abundance [57]. In addition, Ellin6067 was detected in the wetland, belonging to the Nitrosomonas, with relative abundances of 0.35%, 0.15%, and 0.72% in HF, MF, and D, respectively [58,59]. This result further indicates that nitrification was the strongest in D. The relative abundance of Ellin6067 increased with the rise in N addition, and the input N provided a sufficient substrate for Ellin6067 to enhance the nitrification of the soil. Defluviicoccus belongs to a-Proteobacteria, which is reported to belong to glycogen-accumulating organisms (GAOs), and GAOs were found to have a denitrification ability to reduce NO3 or NO2 to N2 through the study [60]. The relative abundance of Defluviicoccus was found to be 2.19% and 1.05% in HF and MF soils, respectively, which was the dominant genus in HF soil in this study. At the same time, the relative abundance was too low, so it was not detected in D. It further indicates that the most significant potential for denitrification was found in HF. It confirms that N2O emissions from the HF soil were the lowest among the three points without N addition in this study.
In this study, bacterial communities received the influence of soil pH, TOC, NH4+, and NO3 contents. Most of the dominant bacteria were positively correlated with TOC, indicating that the amount of organic matter significantly affects bacterial growth. However, Micrococcaceae was significantly negatively correlated with TOC. Micrococcaceae were widely found in organic matter-poor soils, so the relative abundance of Micrococcaceae may be higher in soils with low organic C content [50]. Hence, Micrococcaceae and CO2 emissions are negatively correlated in this study. Proteobacteria was significantly positively correlated with NO3 content, where Proteobacteria were found to contain a large number of bacteria capable of fixing N, which was found in potato soils [47]. In addition, Firmicutes was positively correlated with pH and EC, which was detected as a dominant phylum in saline soils [61]. There was a significant negative correlation between Gaiella and EC. The highest initial salinity and the lowest relative abundance of Gaiella were found in HF soils, suggesting that Gaiella is influenced by soil salinity. Geminicoccaceae, Trichococcusand, Actinomarinales and, Anaerolineaceae, and CO2 emission were significantly positively correlated. Among them, Trichococcus was shown to degrade a variety of carbohydrates, explaining the significant positive correlation between Trichococcus and TOC in this study [62]. Furthermore, Trichococcus showed a significant positive correlation with NH4+ content and N2O emission. Trichococcus was shown to reduce Fe3+ to Fe2+, providing electrons to nitrate for denitrification [63]. Meanwhile, Pseudomonas recorded a significant positive correlation with N2O emission. It has been demonstrated that Pseudomonas plays a key role in heterotrophic denitrification, which could promote the oxidation of NH4+ [64].

5. Conclusions

Using short-term indoor experiments in this study, we not only estimated N2O and CO2 emissions from inland saline wetlands with different N addition levels, but also analyzed the effects on soil bacterial communities using high-throughput sequencing. Our results revealed that N addition significantly increased N2O emissions in HF and MF soil, while CO2 emissions were significantly suppressed in HF soil. Among them, there was a significant positive correlation between N2O emissions and NH4+ content, and CO2 emission was significantly positively correlated with pH and TOC. High-throughput sequencing revealed that the addition of N had no significant effect on soil bacterial community structure, but there were significant differences between the three points. The relative abundance of the dominant genera of Trichococcus and Pseudomonas was significantly increased by N addition. In addition, we found that bacterial communities were significantly correlated with soil pH, TOC, NH4+, and NO3 content, thus affecting N2O and CO2 emissions. The results of this study provide a theoretical basis for future investigations of N2O, CO2 emissions, and bacterial community response to nitrogen inputs in alkaline wetlands. A mixed N source (NH4NO3) was selected for the culture test in this study. The effect of a single N source (NO3 or NH4+) on GHG emissions and microorganisms in the Zhalong Wetland could be investigated in the future to further deepen our understanding of the field.

Author Contributions

Investigation, data curation, and writing—original draft preparation, H.S.; supervision, writing—review and editing, funding acquisition, and conceptualization, H.L. (Hong Liang); investigation and data curation, F.L.; writing—review and editing, A.X.; investigation, H.L. (Huiju Li), W.D. and Z.G. All authors have read and agreed to the published version of the manuscript.

Funding

This research was supported by the National Natural Science Foundation of China (No. 31971468).

Institutional Review Board Statement

Not applicable.

Informed Consent Statement

Not applicable.

Data Availability Statement

The sequences were deposited for this study in the NCBI Sequence Read Archive database under the PRJNA993375 (https://www.ncbi.nlm.nih.gov/sra/PRJNA993375 (accessed on 31 August 2023)). A reasonable request for additional data for this study can be made to the corresponding author (H.L.).

Conflicts of Interest

The authors declare no conflict of interest.

References

  1. Kanakidou, M.; Myriokefalitakis, S.; Daskalakis, N.; Fanourgakis, G.; Nenes, A.; Baker, A.; Tsigaridis, K.; Mihalopoulos, N. Past, present, and future atmospheric nitrogen deposition. J. Atmos. Sci. 2016, 73, 2039–2047. [Google Scholar] [CrossRef] [PubMed]
  2. Ackerman, D.; Millet, D.B.; Chen, X. Global estimates of inorganic nitrogen deposition across four decades. Glob. Biogeochem. Cycles 2019, 33, 100–107. [Google Scholar] [CrossRef]
  3. Liu, X.; Zhang, Y.; Han, W.; Tang, A.; Shen, J.; Cui, Z.; Vitousek, P.; Erisman, J.W.; Goulding, K.; Christie, P. Enhanced nitrogen deposition over China. Nature 2013, 494, 459–462. [Google Scholar] [CrossRef]
  4. Aslam, R.W.; Shu, H.; Yaseen, A.; Sajjad, A.; Abidin, S.Z.U. Identification of time-varying wetlands neglected in Pakistan through remote sensing techniques. Environ. Sci. Pollut. Res. 2023, 30, 74031–74044. [Google Scholar] [CrossRef]
  5. Song, Q.; Zhao, R.; Fu, H.; Zhu, J.; Li, Y. Water Area Extraction and Water Level Prediction of Dongting Lake Based on Sentinel-1 Dual-Polarization Data Decomposition. Remote Sens. 2023, 15, 4655. [Google Scholar] [CrossRef]
  6. Liu, F.; Zhang, Y.; Liang, H.; Gao, D. Long-term harvesting of reeds affects greenhouse gas emissions and microbial functional genes in alkaline wetlands. Water Res. 2019, 164, 114936. [Google Scholar] [CrossRef]
  7. Tian, D.; Niu, S. A global analysis of soil acidification caused by nitrogen addition. Environ. Res. Lett. 2015, 10, 024019. [Google Scholar] [CrossRef]
  8. Fiedler, D.J.; Clay, D.E.; Joshi, D.R.; Engel, A.; Marzano, S.Y.; Jakubowski, D.; Bhattarai, D.; Reese, C.L.; Bruggeman, S.A.; Clay, S.A. CO2 and N2O emissions and microbial community structure from fields that include salt-affected soils. Wiley Online Libr. 2021, 50, 567–579. [Google Scholar] [CrossRef] [PubMed]
  9. Chen, D.; Liu, H.; Ning, Y.; Xu, C.; Zhang, H.; Lu, X.; Wang, J.; Xu, X.; Feng, Y.; Zhang, Y. Reduced nitrogen fertilization under flooded conditions cut down soil N2O and CO2 efflux: An incubation experiment. J. Environ. Manag. 2022, 324, 116335. [Google Scholar] [CrossRef]
  10. Zhao, Z.; Dong, S.; Jiang, X.; Liu, S.; Ji, H.; Li, Y.; Han, Y.; Sha, W. Effects of warming and nitrogen deposition on CH4, CO2 and N2O emissions in alpine grassland ecosystems of the Qinghai-Tibetan Plateau. Sci. Total Environ. 2017, 592, 565–572. [Google Scholar] [CrossRef]
  11. Tahovská, K.; Kaňa, J.; Bárta, J.; Oulehle, F.; Richter, A.; Šantrůčková, H. Microbial N immobilization is of great importance in acidified mountain spruce forest soils. Soil Biol. Biochem. 2013, 59, 58–71. [Google Scholar] [CrossRef]
  12. Frey, B.; Moser, B.; Tytgat, B.; Zimmermann, S.; Alberti, J.; Biederman, L.A.; Borer, E.T.; Broadbent, A.A.; Caldeira, M.C.; Davies, K.F.; et al. Long-term N-addition alters the community structure of functionally important N-cycling soil microorganisms across global grasslands. Soil Biol. Biochem. 2023, 176, 108887. [Google Scholar] [CrossRef]
  13. Xu, X.; Shi, Z.; Li, D.; Rey, A.; Ruan, H.; Craine, J.M.; Liang, J.; Zhou, J.; Luo, Y. Soil properties control decomposition of soil organic carbon: Results from data-assimilation analysis. Geoderma 2016, 262, 235–242. [Google Scholar] [CrossRef]
  14. Lei, J.; Guo, X.; Zeng, Y.; Zhou, J.; Gao, Q.; Yang, Y. Temporal changes in global soil respiration since 1987. Nat. Commun. 2021, 12, 403. [Google Scholar] [CrossRef]
  15. Tian, J.; Dungait, J.A.; Lu, X.; Yang, Y.; Hartley, I.P.; Zhang, W.; Mo, J.; Yu, G.; Zhou, J.; Kuzyakov, Y. Long-term nitrogen addition modifies microbial composition and functions for slow carbon cycling and increased sequestration in tropical forest soil. Glob. Change Biol. 2019, 25, 3267–3281. [Google Scholar] [CrossRef]
  16. Yang, F.; Zhang, Z.; Barberán, A.; Yang, Y.; Hu, S.; Guo, H. Nitrogen-induced acidification plays a vital role driving ecosystem functions: Insights from a 6-year nitrogen enrichment experiment in a Tibetan alpine meadow. Soil Biol. Biochem. 2021, 153, 108107. [Google Scholar] [CrossRef]
  17. Zak, D.R.; Freedman, Z.B.; Upchurch, R.A.; Steffens, M.; Kögel-Knabner, I. Anthropogenic N deposition increases soil organic matter accumulation without altering its biochemical composition. Glob. Change Biol. 2017, 23, 933–944. [Google Scholar] [CrossRef]
  18. Liu, H.Y.; Huang, N.; Zhao, C.M.; Li, J.H. Responses of carbon cycling and soil organic carbon content to nitrogen addition in grasslands globally. Soil Biol. Biochem. 2023, 186, 109164. [Google Scholar] [CrossRef]
  19. Chen, C.; Chen, H.Y. Mapping global nitrogen deposition impacts on soil respiration. Sci. Total Environ. 2023, 871, 161986. [Google Scholar] [CrossRef]
  20. Stein, L.Y. The long-term relationship between microbial metabolism and greenhouse gases. Trends Microbiol. 2020, 28, 500–511. [Google Scholar] [CrossRef]
  21. Wang, C.; Liu, D.; Bai, E. Decreasing soil microbial diversity is associated with decreasing microbial biomass under nitrogen addition. Soil Biol. Biochem. 2018, 120, 126–133. [Google Scholar] [CrossRef]
  22. Zhou, Z.; Wang, C.; Zheng, M.; Jiang, L.; Luo, Y. Patterns and mechanisms of responses by soil microbial communities to nitrogen addition. Soil Biol. Biochem. 2017, 115, 433–441. [Google Scholar] [CrossRef]
  23. Moser, G.; Gorenflo, A.; Brenzinger, K.; Keidel, L.; Braker, G.; Marhan, S.; Clough, T.J.; Müller, C. Explaining the doubling of N2O emissions under elevated CO2 in the Giessen FACE via in-field 15N tracing. Glob. Change Biol. 2018, 24, 3897–3910. [Google Scholar] [CrossRef] [PubMed]
  24. Berthrong, S.T.; Yeager, C.M.; Gallegos-Graves, L.; Steven, B.; Eichorst, S.A.; Jackson, R.B.; Kuske, C.R. Nitrogen fertilization has a stronger effect on soil nitrogen-fixing bacterial communities than elevated atmospheric CO2. Appl. Environ. Microbiol. 2014, 80, 3103–3112. [Google Scholar] [CrossRef] [PubMed]
  25. Wang, W.; Liang, H.; Li, F.; Su, H.; Li, H.; Gao, D. Water level of inland saline wetlands with implications for CO2 and CH4 fluxes during the autumn freeze–thaw period in Northeast China. Environ. Sci. Pollut. Res. 2023, 30, 50125–50133. [Google Scholar] [CrossRef] [PubMed]
  26. Shaaban, M.; Wu, Y.; Peng, Q.A.; Lin, S.; Mo, Y.; Wu, L.; Hu, R.G.; Zhou, W. Effects of dicyandiamide and dolomite application on N2O emission from an acidic soil. Environ. Sci. Pollut. Res. 2016, 23, 6334–6342. [Google Scholar] [CrossRef] [PubMed]
  27. Pareja-Sánchez, E.; Cantero-Martínez, C.; Álvaro-Fuentes, J.; Plaza-Bonilla, D. Impact of tillage and N fertilization rate on soil N2O emissions in irrigated maize in a Mediterranean agroecosystem. Agric. Ecosyst. Environ. 2020, 287, 106687. [Google Scholar] [CrossRef]
  28. Deng, L.; Huang, C.; Kim, D.G.; Shangguan, Z.; Wang, K.; Song, X.; Peng, C. Soil GHG fluxes are altered by N deposition: New data indicate lower N stimulation of the N2O flux and greater stimulation of the calculated C pools. Glob. Change Biol. 2020, 26, 2613–2629. [Google Scholar] [CrossRef]
  29. Zhang, B.; Huang, Y.; Qu, Z.; Zhu, T.; Yu, L. Responses of Soil N2O Emission and CH4 Uptake to N Input in Chinese Forests across Climatic Zones: A Meta-Study. Atmosphere 2022, 13, 1145. [Google Scholar] [CrossRef]
  30. Kuypers, M.M.; Marchant, H.K.; Kartal, B. The microbial nitrogen-cycling network. Nat. Rev. Microbiol. 2018, 16, 263–276. [Google Scholar] [CrossRef]
  31. Jia, J.; Bai, J.; Wang, W.; Yin, S.; Zhang, G.; Zhao, Q.; Wang, X.; Liu, X.; Cui, B. Salt stress alters the short-term responses of nitrous oxide emissions to the nitrogen addition in salt-affected coastal soils. Sci. Total Environ. 2020, 742, 140124. [Google Scholar] [CrossRef]
  32. Li, Q.W.; Zhang, X.Y.; Gao, J.Q.; Song, M.H.; Liang, J.F.; Yue, Y. Effects of N addition frequency and quantity on Hydrocotyle vulgaris growth and greenhouse gas emissions from wetland microcosms. Sustainability 2019, 11, 1520. [Google Scholar] [CrossRef]
  33. Song, Y.; Cheng, X.; Song, C.; Li, M.; Gao, S.; Liu, Z.; Gao, J.; Wang, X. Soil CO2 and N2O emissions and microbial abundances altered by temperature rise and nitrogen addition in active-layer soils of permafrost peatland. Front. Microbiol. 2022, 13, 1093487. [Google Scholar] [CrossRef]
  34. Zhang, P.; Wen, T.; Hu, Y.; Zhang, J.; Cai, Z. Can N Fertilizer Addition Affect N2O Isotopocule Signatures for Soil N2O Source Partitioning? Int. J. Environ. Res. Public Health 2021, 18, 5024. [Google Scholar] [CrossRef]
  35. Jia, D.; Qi, F.; Xu, X.; Feng, J.; Wu, H.; Guo, J.; Lu, W.; Peng, R.; Zhu, X.; Luo, Y.; et al. Co-regulations of Spartina alterniflora invasion and exogenous nitrogen loading on soil N2O efflux in subtropical mangrove mesocosms. PLoS ONE 2016, 11, e0146199. [Google Scholar] [CrossRef] [PubMed]
  36. Bakken, L.R.; Bergaust, L.; Liu, B.; Frostegård, Å. Regulation of denitrification at the cellular level: A clue to the understanding of N2O emissions from soils. Philos. Trans. R. Soc. B Biol. Sci. 2012, 367, 1226–1234. [Google Scholar] [CrossRef] [PubMed]
  37. Tao, B.; Liu, C.; Zhang, B.; Dong, J. Effects of inorganic and organic nitrogen additions on CO2 emissions in the coastal wetlands of the Yellow River Delta, China. Atmos. Environ. 2018, 185, 159–167. [Google Scholar] [CrossRef]
  38. Qu, S.; Ri, X.; Yu, J.; Li, F.; Wei, D.; Borjigidai, A. Nitrogen deposition accelerates greenhouse gas emissions at an alpine steppe site on the Tibetan Plateau. Sci. Total Environ. 2021, 765, 144277. [Google Scholar] [CrossRef] [PubMed]
  39. Ge, X.; Cao, Y.; Zhou, B.; Xiao, W.; Tian, X.; Li, M. Combined application of biochar and N increased temperature sensitivity of soil respiration but still decreased the soil CO2 emissions in moso bamboo plantations. Sci. Total Environ. 2020, 730, 139003. [Google Scholar] [CrossRef]
  40. Meng, C.; Tian, D.S.; Zeng, H.; Li, Z.; Yi, C.; Niu, S. Global soil acidification impacts on belowground processes. Environ. Res. Lett. 2019, 14, 074003. [Google Scholar] [CrossRef]
  41. Tang, J.; Liang, S.; Li, Z.; Zhang, H.; Wang, S.; Zhang, N. Emission laws and influence factors of greenhouse gases in saline-alkali paddy fields. Sustainability 2016, 8, 163. [Google Scholar] [CrossRef]
  42. Gagnon, B.; Ziadi, N.; Rochette, P.; Chantigny, M.H.; Angers, D.A.; Bertrand, N.; Smith, W.N. Soil-surface carbon dioxide emission following nitrogen fertilization in corn. Can. J. Soil Sci. 2016, 96, 219–232. [Google Scholar] [CrossRef]
  43. Gu, Y.; Wang, J.; Cai, W.; Li, G.; Mei, Y.; Yang, S. Different amounts of nitrogen fertilizer applications alter the bacterial diversity and community structure in the rhizosphere soil of sugarcane. Front. Microbiol. 2021, 12, 2490. [Google Scholar] [CrossRef] [PubMed]
  44. Wan, Y.; Li, W.; Wang, J.; Shi, X. Bacterial Diversity and Community in Response to Long-Term Nitrogen Fertilization Gradient in Citrus Orchard Soils. Diversity 2021, 13, 282. [Google Scholar] [CrossRef]
  45. Xu, R.; Wang, Z.; Zhu, J. Effects of Climate Change and Nitrogen Addition on Carbon Loss in Alpine Wetland of Qinghai–Tibet Plateau. Atmosphere 2023, 14, 1342. [Google Scholar] [CrossRef]
  46. Sun, K.; Cai, J.; Liu, X.; Yang, L.; Li, H.; Wang, G.; Xu, X.; Yu, F. Effects of nitrogen and phosphorus supply levels and ratios on soil microbial diversity-ecosystem multifunctionality relationships in a coastal nontidal wetland. Sci. Total Environ. 2023, 874, 162472. [Google Scholar] [CrossRef]
  47. Ge, Y.; Sun, T. Soil Microbial Community Structure and Diversity of Potato in Rhizosphere and Non-rhizosphere Soil. Ecol. Environ. 2020, 29, 141. [Google Scholar] [CrossRef]
  48. Goordial, J.; Davila, A.; Greer, C.W.; Cannam, R.; DiRuggiero, J.; McKay, C.P.; Whyte, L.G. Comparative activity and functional ecology of permafrost soils and lithic niches in a hyper-arid polar desert. Environ. Microbiol. 2017, 19, 443–458. [Google Scholar] [CrossRef]
  49. Tian, X.Y.; Zhang, C.S. Illumina-based analysis of endophytic and rhizosphere bacterial diversity of the coastal halophyte Messerschmidia sibirica. Front. Microbiol. 2017, 8, 2288. [Google Scholar] [CrossRef]
  50. Zhou, H.; Zhang, D.; Jiang, Z.; Sun, P.; Xiao, H.; Yu, X.W.; Chen, J. Changes in the soil microbial communities of alpine steppe at Qinghai-Tibetan Plateau under different degradation levels. Sci. Total Environ. 2019, 651, 2281–2291. [Google Scholar] [CrossRef]
  51. Hanada, S. Filamentous anoxygenic phototrophs in hot springs. Microbes Environ. 2003, 18, 51–61. [Google Scholar] [CrossRef]
  52. Sorokin, D.Y.; Lücker, S.; Vejmelkova, D.; Kostrikina, N.A.; Kleerebezem, R.; Rijpstra, W.I.C.; Damsté, J.S.S.; Le, P.D.; Muyzer, G.; Wagner, M.; et al. Nitrification expanded: Discovery, physiology and genomics of a nitrite-oxidizing bacterium from the phylum Chloroflexi. ISME J. 2012, 6, 2245–2256. [Google Scholar] [CrossRef]
  53. Li, Y.T.; He, J.S.; Wang, H.; Zhou, J.Z.; Yang, Y.F.; Chu, H.Y. Lowered water table causes species substitution while nitrogen amendment causes species loss in alpine wetland microbial communities. Pedosphere 2021, 31, 912–922. [Google Scholar] [CrossRef]
  54. Wang, G.H.; Liu, J.J.; Yu, Z.H.; Wang, X.Z.; Jin, J.; Liu, X.B. Research progress of Acidobacteria ecology in soils. Biotechnol. Bull. 2016, 32, 14. [Google Scholar] [CrossRef]
  55. Begmatov, S.; Beletsky, A.V.; Dedysh, S.N.; Mardanov, A.V.; Ravin, N.V. Genome analysis of the candidate phylum MBNT15 bacterium from a boreal peatland predicted its respiratory versatility and dissimilatory iron metabolism. Front. Microbiol. 2022, 13, 951761. [Google Scholar] [CrossRef]
  56. Hu, D.; Zang, Y.; Mao, Y.; Gao, B. Identification of molecular markers that are specific to the class thermoleophilia. Front. Microbiol. 2019, 10, 1185. [Google Scholar] [CrossRef]
  57. Al, D.A.; Alkufeidy, R.M.; Alkubaisi, N.A.; Alshammari, M.K. Polynuclear aromatic anthracene biodegradation by psychrophilic Sphingomonas sp., cultivated with tween-80. Chemosphere 2021, 263, 128115. [Google Scholar] [CrossRef]
  58. Wang, L.; Qiu, S.; Guo, J.; Ge, S. Light irradiation enables rapid start-up of nitridation through suppressing nxrB gene expression and stimulating ammonia-oxidizing bacteria. Environ. Sci. Technol. 2021, 55, 13297–13305. [Google Scholar] [CrossRef] [PubMed]
  59. Zhen, J.; Zhao, Y.; Yu, X.; Guo, W.; Qiao, Z.; Ismail, S.; Ni, S.Q. Feasibility of Partial Nitrification Combined with Nitrite-Denitrification Phosphorus Removal and Simultaneous Nitrification–Endogenous Denitrification for Synchronous Chemical Oxygen Demand, Nitrogen, and Phosphorus Removal. ACS ES&T Water 2022, 2, 1119–1131. [Google Scholar] [CrossRef]
  60. Wang, X.; Wang, S.; Xue, T.; Li, B.; Dai, X.; Peng, Y. Treating low carbon/nitrogen (C/N) wastewater in simultaneous nitrification-endogenous denitrification and phosphorous removal (SNDPR) systems by strengthening anaerobic intracellular carbon storage. Water Res. 2015, 77, 191–200. [Google Scholar] [CrossRef] [PubMed]
  61. Zhao, S.; Liu, J.J.; Banerjee, S.; Zhou, N.; Zhao, Z.Y.; Zhang, K.; Tian, C.Y. Soil pH is equally important as salinity in shaping bacterial communities in saline soils under halophytic vegetation. Sci. Rep. 2018, 8, 4550. [Google Scholar] [CrossRef] [PubMed]
  62. Strepis, N.; Naranjo, H.D.; Meier-Kolthoff, J.; Göker, M.; Shapiro, N.; Kyrpides, N.; Klenk, H.P.; Schaap, P.J.; Stams, A.J.; Sousa, D.Z. Genome-guided analysis allows the identification of novel physiological traits in Trichococcus species. BMC Genom. 2020, 21, 24. [Google Scholar] [CrossRef]
  63. Tian, L.; Yan, B.; Ou, Y.; Liu, H.; Cheng, L.; Jiao, P. Effectiveness of exogenous Fe2+ on nutrient removal in gravel-based constructed wetlands. Int. J. Environ. Res. Public Health 2022, 19, 1475. [Google Scholar] [CrossRef] [PubMed]
  64. Li, L.; Feng, J.; Zhang, L.; Yin, H.; Fan, C.; Wang, Z.; Zhao, M.; Ge, C.; Song, H. Enhanced nitrogen and phosphorus removal by natural pyrite–based constructed wetland with intermittent aeration. Environ. Sci. Pollut. Res. 2021, 28, 69012–69028. [Google Scholar] [CrossRef] [PubMed]
Figure 1. N2O and CO2 emission rate with five N-addition-level treatments. (a) N2O emission rate in HF; (b) N2O emission rate in MF; (c) N2O emission rate in D; (d) CO2 emission rate in HF; (e) CO2 emission rate in MF; (f) CO2 emission rate in D.
Atmosphere 14 01675 g001
Figure 2. Cumulative N2O emissions and CO2 emissions at different treatments in HF, MF, and D. (a) Cumulative N2O emissions; (b) Cumulative CO2 emissions. a—HF, b—MF, c—D.
Atmosphere 14 01675 g002
Figure 3. PCoA analysis of bacterial community structure.
Atmosphere 14 01675 g003
Figure 4. Relative abundance of soil bacteria phyla.
Atmosphere 14 01675 g004
Figure 5. Heatmap of bacterial communities’ (relative abundance > 1%) distribution at the genus level.
Atmosphere 14 01675 g005
Figure 6. Analysis of soil physicochemical characteristics and bacterial communities at the phylum level via redundancy analysis (RDA).
Atmosphere 14 01675 g006
Figure 7. Pearson’s correlation of bacterial genus (top 15) and environmental factors. * p < 0.05; ** p < 0.01; *** p < 0.001.
Atmosphere 14 01675 g007
Table 1. Soil physicochemical properties.
Sampling SitepHSalt
(%)
NH4+
(mg N kg−1)
NO3
(mg N kg−1)
TOC
(g kg−1)
DOC
(mg kg−1)
TC
(g kg−1)
TN
(g kg−1)
HF9.14 ± 0.09a0.10 ± 0.02a5.90 ± 0.19a9.57 ± 0.72a21.22 ± 0.18a176.05 ± 2.15a22.98 ± 0.82a1.05 ± 0.08a
MF8.95 ± 0.10a0.05 ± 0.01b9.00 ± 0.17b8.32 ± 0.16b25.94 ± 0.17b136.95 ± 1.34b31.50 ± 0.34b1.37 ± 0.11b
D9.08 ± 0.05a0.04 ± 0.01c7.84 ± 0.03c9.59 ± 0.18a10.42 ± 0.21c48.40 ± 0.68c12.69 ± 0.56c0.41 ± 0.02c
Significant differences are indicated by the letters a, b, and c (p < 0.05).
Table 2. Effects of N addition level, sampling site, and their interactions on N2O and CO2 emission.
Cumulative N2O
Emissions
Cumulative CO2
Emissions
N addition level******
Sampling site******
N addition level × sampling site******
*** represents significant effects at p < 0.001.
Table 3. Analysis of linear regression between N2O cumulative emissions and N addition level.
PointN Addition Level
(mg N kg−1)
Linear Regression EquationR2p Value
HF0–100y = 0.019x + 0.1010.95p < 0.01
MF30–100y = 0.002x − 0.0370.99p < 0.05
D0–30y = 0.002x + 0.0870.93p < 0.05
30–100y = −3.484x + 0.1610.93p < 0.01
x is the N addition level, and y is the N2O cumulative emissions.
Table 4. Analysis of soil physicochemical properties and GHG emissions using Pearson’s correlation coefficient.
N2OCO2pHTOCECNH4+NO3
N2O10.220.150.340.260.73 *0.43
CO2 10.71 *0.80 *0.530.52−0.30
pH 10.300.090.50−0.60
TOC 10.440.43−0.08
EC 10.250.10
NH4+ 10.56
NO3 1
* represents significant effects at p < 0.05.
Table 5. Analysis of linear regression between CO2 cumulative emissions and N addition level.
PointN Addition Level
(mg N kg−1)
Linear Regression EquationR2p Value
HF0–100y = −0.456x + 165.9230.86p < 0.05
MF0–30y = 0.765x + 125.6010.99p < 0.05
30–100y = −0.376x + 154.9530.81p < 0.01
D0–30y = 0.760x + 53.5140.99p < 0.05
30–100y = −0.105x + 77.7330.79p < 0.01
x is the N addition level, and y is the cumulative CO2 emissions.
Table 6. Alpha diversity index of soil bacteria.
TreatmentsChao1ShannonTreatmentsChao1ShannonTreatmentsChao1Shannon
HF1831.606.27MF1549.966.07D2415.506.84
HF_CK1898.856.61MF_CK1623.226.18D_CK2537.347.21
HF_N12224.126.71MF_N11725.656.25D_N13215.647.31
HF_N21705.276.25MF_N22065.516.50D_N26298.187.55
Disclaimer/Publisher’s Note: The statements, opinions and data contained in all publications are solely those of the individual author(s) and contributor(s) and not of MDPI and/or the editor(s). MDPI and/or the editor(s) disclaim responsibility for any injury to people or property resulting from any ideas, methods, instructions or products referred to in the content.

