1. Introduction
Today it is well accepted that atmospheric aerosols play an important role in influencing the radiative flux of solar radiation in the atmosphere. Estimating the radiative forcing of particulate pollution requires knowledge of the height distribution of particle microphysical parameters. Multiwavelength Raman and high spectral resolution lidars (HSRL) have become an established method of providing this kind of information during the past two decades. Aerosol extinction
α and backscattering
β coefficients measured with these lidars at multiple wavelengths can be inverted into aerosol microphysical properties, using different inversion methods [
1,
2,
3,
4,
5,
6].
Numerous theoretical and experimental studies carried out in the context of development of these inversion methods have demonstrated that a relatively simple configuration of a Nd:YAG laser can be used for estimating vertical profiles of particle properties, such as number, surface-area and volume concentrations, effective radius, complex refractive index (CRI) and single-scattering albedo (SSA). This laser set-up is usually referred to as 3β + 2α configuration. This configuration uses the fundamental as well as the frequency-doubled and frequency-tripled radiation and provides us with vertical profiles of two aerosol extinction coefficients at 355, 532 nm and three backscattering coefficients at 355, 532 and 1064 nm.
Results of particle-properties profiling from previous studies are comparably favorable and confirm that the considered inverse problem can be resolved. Unfortunately, only a few studies on validating the retrieval results of particle microphysical parameter profiles [
7,
8] and size distributions [
9] are available. Here, we aim to extend that list of validation studies and estimate the reliability of the retrieval of both the profiles of the particle parameters and the corresponding particle size distributions (PSDs). Another aim of this study is to develop an approach that allows us to balance the theoretical and measurement (experimental) data. In this regard, we find (1) conditions on which remote (lidar) and in-situ data converge, (2) theoretical estimations that corroborate the high quality of the experimental (lidar and in-situ) results, and (3) a measure and its corresponding magnitude that can be used for assessing the reliability of the particle microphysical parameters retrieved with an inversion method.
The inverse problem that underlies the process of retrieving PSDs from 3
β + 2
α observations is underdetermined [
10]. In fact, the number of input information (5 data points in total) is much smaller than the number of radius grid bins at which the sought size distribution function must be approximated, including sufficient retrieval accuracy [
11]. Moreover, the particle-size and spectral dependence of the refractive index, the complexity of the shape of non-spherical particles and their morphology make the underlying ill-posed inverse problem even more complex. Thus, the estimation of particle microphysical properties requires not only numerous assumptions in the retrieval process but also calls for constraints with regard to the range of particle sizes we want to retrieve. Thus, the degree of uncertainty of the retrieved particle parameters and how to compute this uncertainty have always been major concerns [
12]. The uncertainty depends for obvious reasons on many factors and includes the type of the investigated aerosols. Estimations of particle microphysical parameters can be performed more accurately when the aerosol size distribution shows a predominant fine mode [
7,
8].
Another critical factor that influences the quality of the inversion data products is the quality of the input optical data, i.e., their measurement uncertainty, which is defined by bias and noise. In the case of Raman lidar, the extinction coefficient is calculated from relatively weak nitrogen Raman backscatter signals. The corresponding uncertainties depend on temporal and height resolution of the optical profiles. The uncertainties are normally in the range of 10–20% for well-calibrated systems. In observations made with HSRL, the uncertainties of the optical data are generally smaller. The reason for the lower uncertainties compared to uncertainties of Raman lidar observations is the use of signals from comparably strong Rayleigh scattering. Aside from this advantage, the frequency shift between the signal from the molecular channel of HSRL and the laser line is comparably small. Therefore, there is no need to assume the Ångström exponent in the calculation of the backscattering coefficient, which is a fundamental requirement in the analysis of data acquired with Raman lidar. Thus, the best way to validate the results of microphysical retrievals is based on the inversion of HSRL observations and comparison to in-situ data taken with airborne platforms.
The multiwavelength HSRL-2 of NASA Langley Research Center is the world’s most advanced airborne lidar instrument of its kind. The HSRL-2 instrument aboard the ER-2 aircraft has been deployed to a multitude of field campaigns since 2012; for example, the Two-Column Aerosol Project (TCAP) and the DISCOVER-AQ campaigns [
7,
8]. One of the most recent field campaigns in which HSRL-2 took part was
Observations of Aerosols Above Clouds and Their Interactions (ORACLES). ORACLES was carried out in south-western Africa during September 2016. The campaign review, including descriptions of instrumentation, flight tracks, observation methods and measurement data, can be found in Refs. [
13,
14,
15]. Data collected with HSRL-2 and in-situ data are publicly accessible
https://espoarchive.nasa.gov/archive/browse/oracles (accessed on 1 September 2023). This campaign provides us with 3
β + 2
α + 3
δ measurements, i.e., particle linear depolarization ratio observations (
δ) were carried out at 355, 532 and 1064 nm. Collocated in-situ data that were taken aboard the P-3B aircraft provide us with a unique opportunity for validating the inversion results of the optical data collected with HSRL-2 [
9] during ORACLES. The in-situ data are PSDs, number concentrations of cloud condensation nuclei (CCN) and SSA. In our study we retrieved profiles of particle microphysical parameters and SSA from HSRL-2 data using the regularization algorithm described in Ref. [
3].
The methodology of our approach is presented in
Section 2. In
Section 3, we present the results of four measurement cases. We discuss the results in
Section 4.
Section 5 summarizes our findings.
3. Case Studies
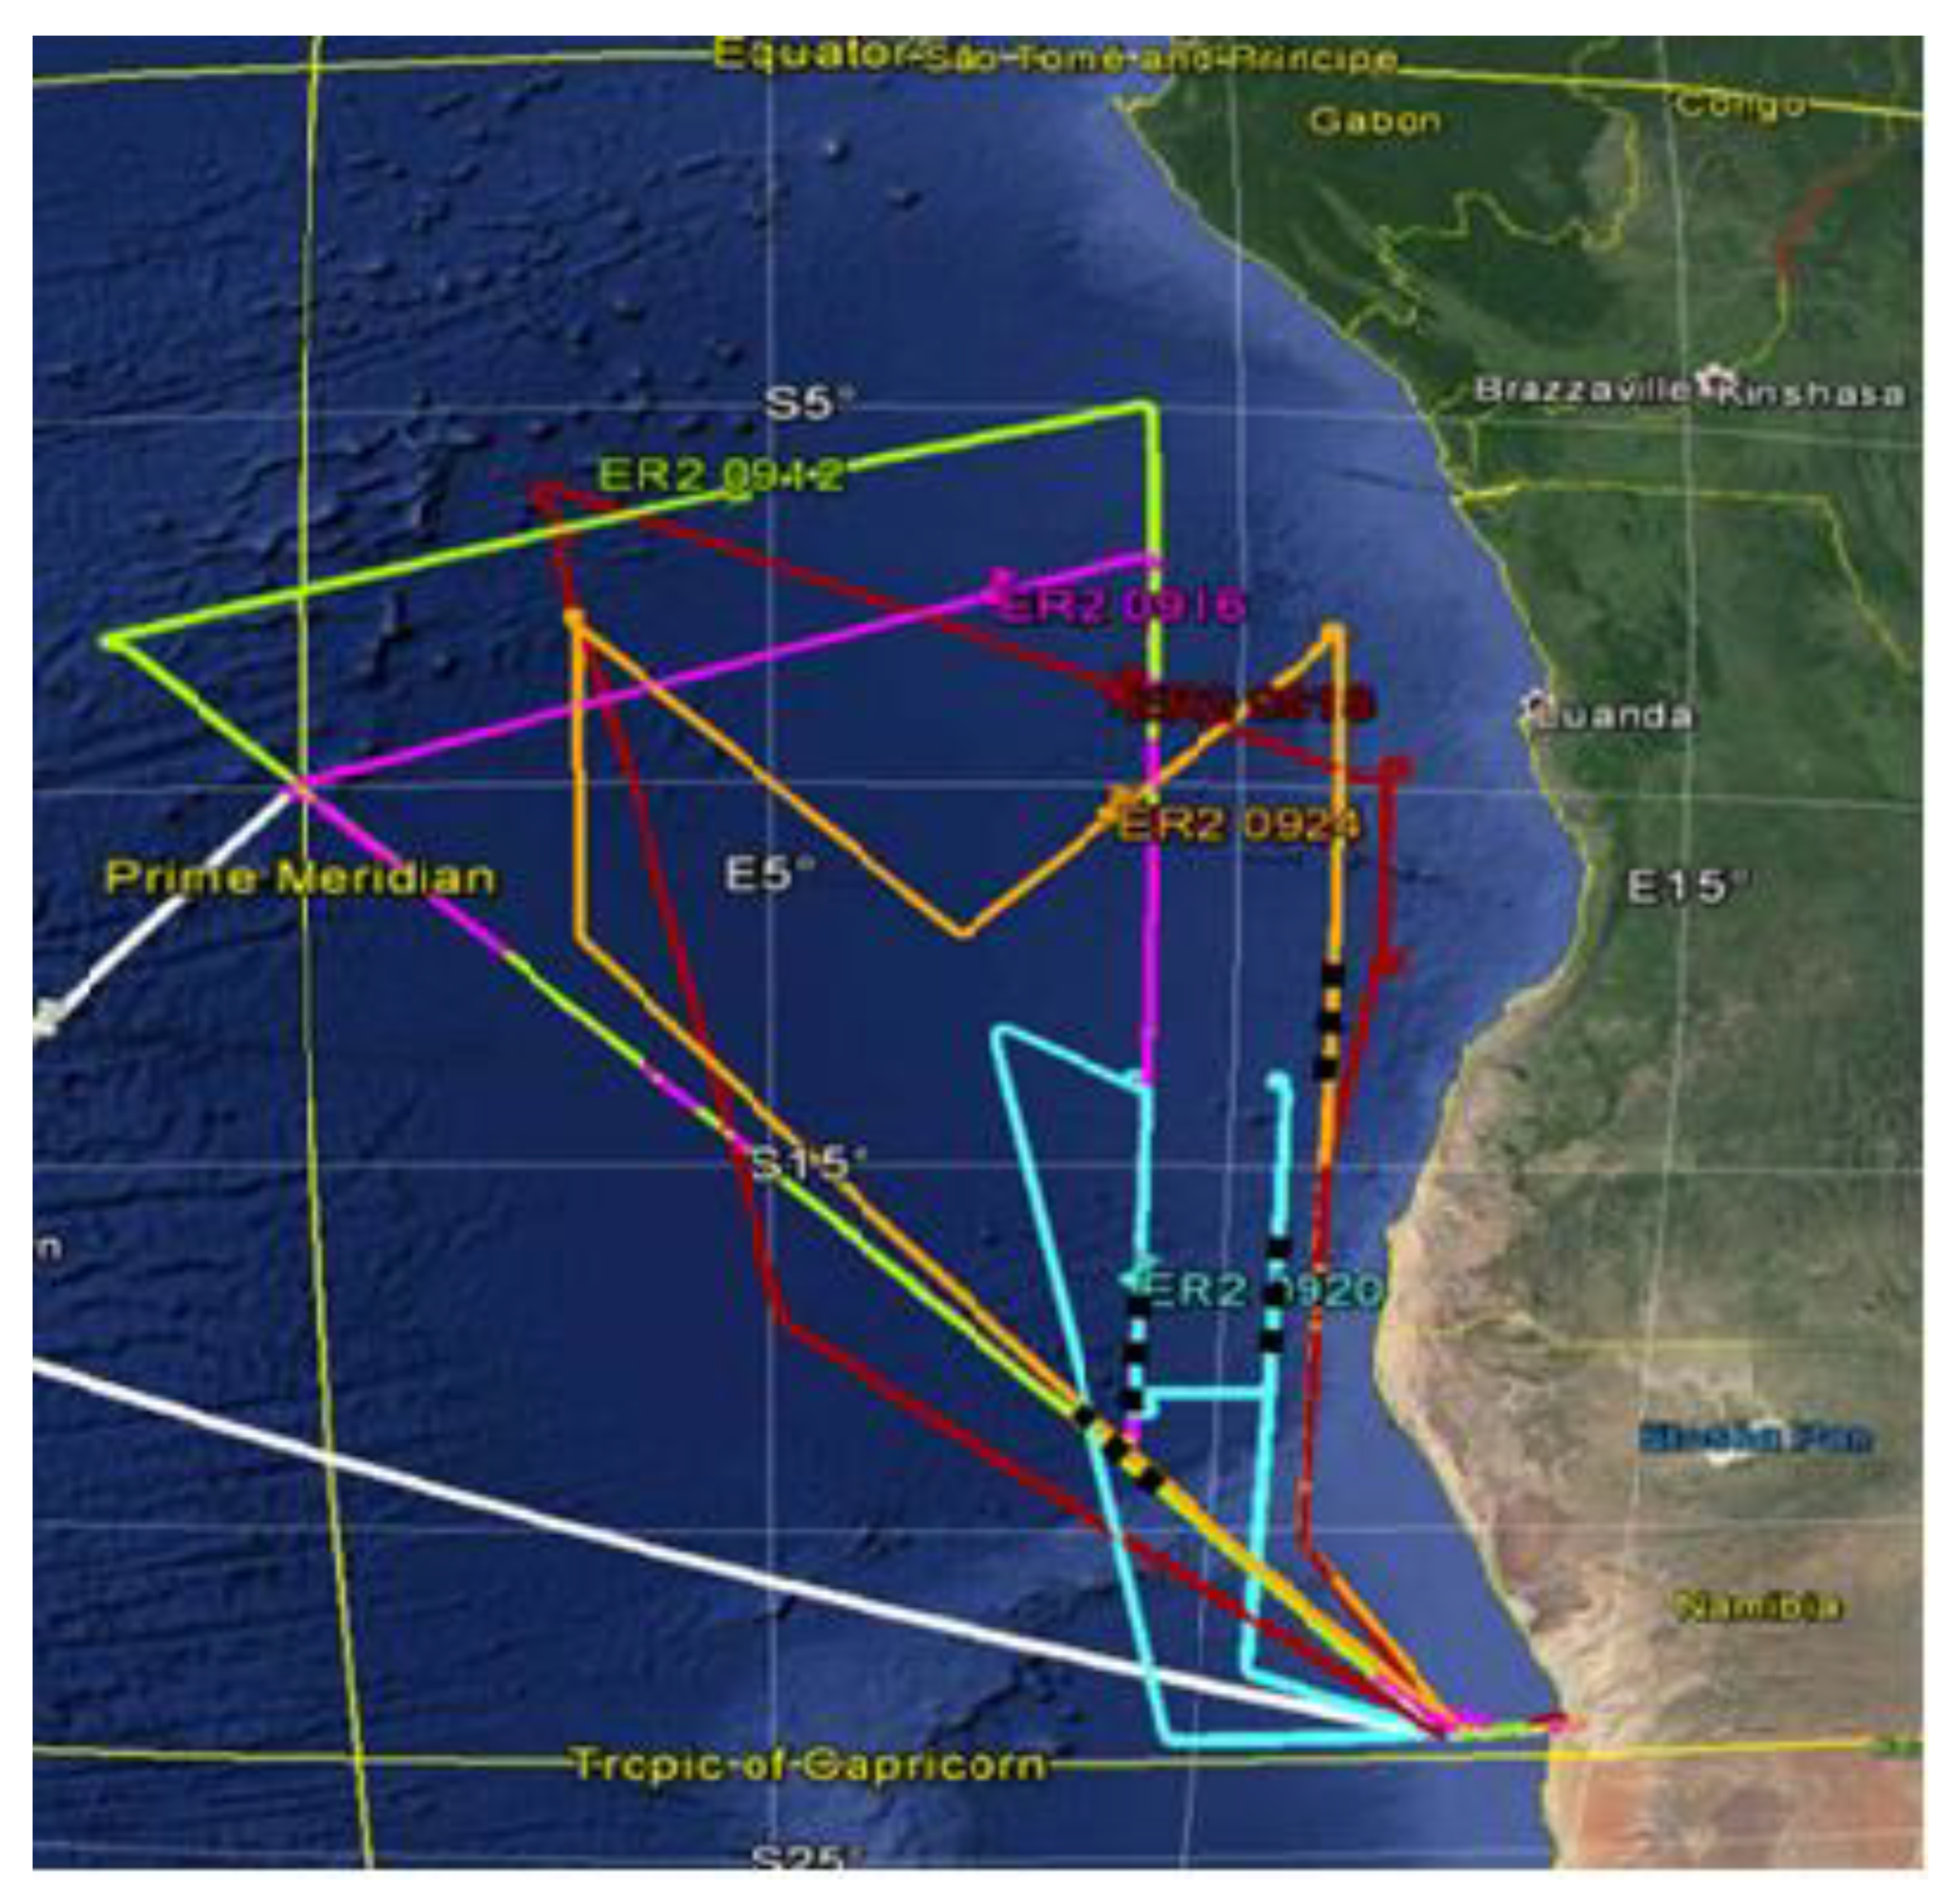
We now describe in detail the results of the four cases of HSRL-2 observations. Optical data were collected along flight tracks marked by the black dots in
Figure 1. As noted previously, the time intervals of the lidar observations and the in-situ measurements are summarized in
Table 1 and
Table 2, respectively.
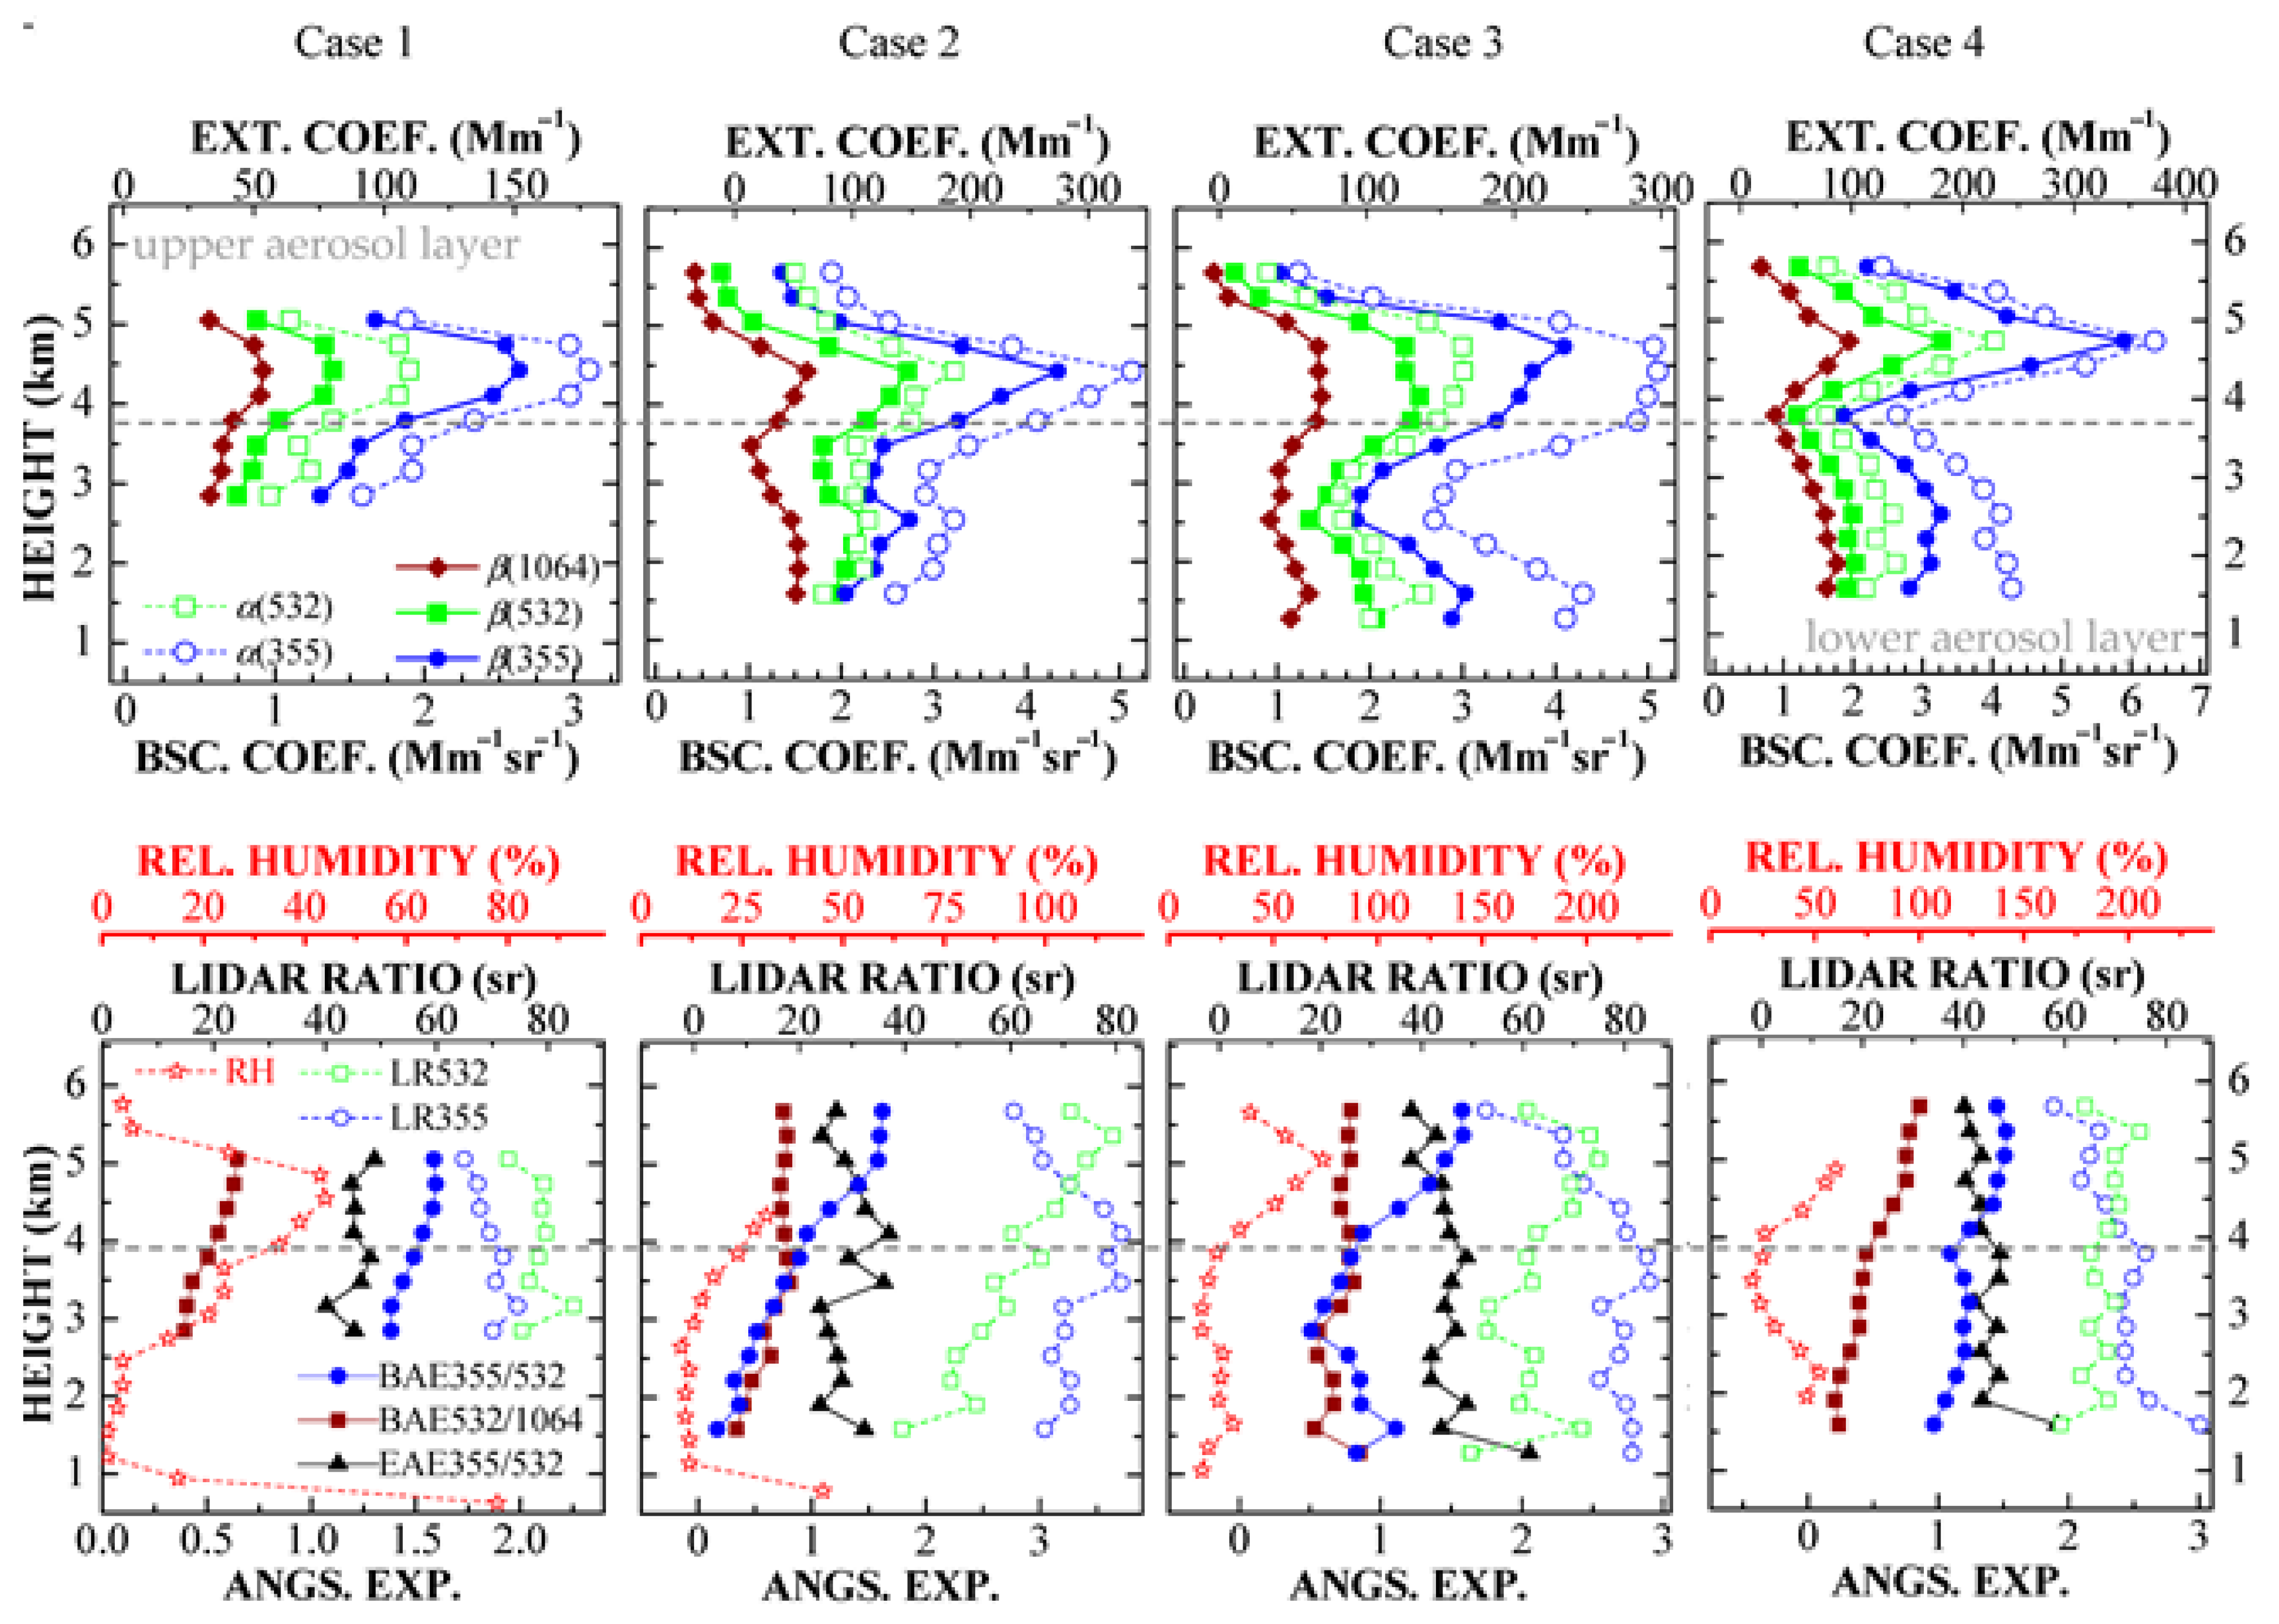
For Case 1, we show optical data of the 3
β + 2
α-profiles in the height range from 3–5 km (above sea level). For Cases 2–4, we show the optical data in the height range from 1.5–6 km (see the first line in
Figure 3). The upper and lower layers in
Figure 3 are separated by horizontal lines (dashed lines). The profiles show two pronounced aerosol layers. The upper aerosol layer (above 3.5–3.7 km) shows maximum values of the backscatter and extinction coefficients in the height range from 4.5–4.8 km. The extinction coefficient
α(355) peaks at the value of 380 Mm
−1 for Case 4 (measurement from 24 September 2016, 9:13–9:33 UTC). The extinction coefficient in the layer below 3.5–3.7 km is lower and considerably more variable.
The particle intensive properties for Cases 1–4, such as lidar ratios
Λ(
λ) at 355 and 532 nm and extinction-related (EAE)- and backscatter-related (BAE) Ångström exponents are shown in
Figure 3 (see second line). Below 3.5 km we see that the lidar ratio
Λ(355) >
Λ(532) for Cases 2–4. In contrast, we find larger lidar ratios at 532 nm compared to the lidar ratios at 355 nm in the center of the upper aerosol layer, i.e., at around 4.5 km. In that case,
Λ(532) increased to a value close to 80 sr (see open symbols).
EAE (
) at the wavelength pair 355/532 nm varied comparably little between 1.0–1.5 (see triangles in
Figure 3) if we exclude from our analysis the lowest height bins in the third and 4fourth cases and some intermediate height bins in the second case (3.5–4.0 km above sea level). The excluded height bins represent outliers, i.e., their values strongly deviate from the mean values of the profiles. The strong deviations were most probably caused by high measurement uncertainty. Values of the EAE in the range from 1.0–1.5 indicate that the PSD was dominated by particles in the fine mode fraction.
The BAE at the wavelength pair 355/532 nm (
) was the most variable intensive parameter in our study (blue bullets in the second line of
Figure 3). It grew nearly monotonically with height, from 1.4 to 1.6 in the first case, from 0.4 to 1.6 in the second case and from 1.0 to 1.5 in the fourth case. The only exception was the third case. The
decreased from 1.0 to 0.5 with height in the lower aerosol layer and increased to a value of 1.6 in the upper aerosol layer. The BAE for the wavelength pair 532/1064 nm monotonically grew from 0.25 to 0.5 in the lowest height bins (1.5–3.5 km). It varied between 0.6 and 0.8 in the upper height bins in all four cases (brown lines).
Results of the inversion of the optical data, based on the methodology described in
Section 2.2, are presented in
Figure 4. The extensive microphysical parameters, i.e., number, surface-area, and volume concentrations, are proportional to the magnitude of the optical input data. This variability of these microphysical particle properties can be particularly seen from the variability of the extinction coefficient
α(355); see the first and second lines in
Figure 4. Surface-area concentration varied from 80 to 600 μm
2cm
−3, number concentration from 350 to 5200 cm
−3 and volume concentration from 5 to 60 μm
3cm
−3 in all four cases.
We found different values for the CRI in the two aerosol layers (see the third line in
Figure 4). The difference in the CRI in the two aerosol layers increased with increasing BAE in cases 2 and 3. The average value of the CRI is approximately 1.62–
i0.03 in the lower aerosol layer. In contrast, we found an average value of 1.58–
i0.02 in the upper aerosol layer. The difference in the CRIs between the two aerosol layers became smaller in the first case, i.e., we found values of 1.62–
i0.03 and 1.62–
i0.025. In the fourth case, the profile of the CRI did not change significantly with height in the two aerosol layers. We found on average 1.6–
i0.02. The scatter of the real part was ±0.1 in the different height bins. The scatter was ±
i0.01 for the imaginary part in the different height bins.
The SSA is one of the key parameters in calculating the impact of aerosol pollution on the sun’s radiation field in the atmosphere. We obtained this parameter by computing it from our retrieval products.
Figure 4 (third line) shows these calculated profiles at 355 (blue), 532 (green) and 1064 (brown) nm. The profiles reflect the features (variations of values with height) found for the vertical profiles of the imaginary parts of the CRI in the four cases.
SSA at 532 nm (green square) increased on average from 0.85 in the lower aerosol layer to 0.9 in the upper aerosol layer in the first and third cases and from 0.8 (lower layer) to 0.9 (upper layer) in the second case. In the fourth case, the mean values of the data points of the SSA profile at 532 nm oscillated (i.e., increased and decreased) with height in the same manner as the CRI. The uncertainty bars of SSA at 532 nm are ±0.04. We note that the disagreement we found between the SSA we retrieved at 532 nm and the SSA measured in-situ at 550 nm did not exceed 0.05. We excluded in this comparison the lowest height bins at which the measurement uncertainty was largest.
The available in-situ measurements included CCN number concentration (
n). The corresponding profiles are shown in
Figure 4 (stars in the first line). We observe that the
n-profiles retrieved with the regularization algorithm systematically overestimated the values obtained from the in-situ observations. The bias was minimal in the first case (about 25% difference), increased in the fourth case (values differed by 50%, apart from the lowest height bins) and was maximal in the second and third cases (100% and more). We stress that CCN number concentration derived from the in-situ measurements includes particles larger than 0.05 μm radius. In contrast, the radius domain in which the regularization algorithm was used covered the interval
r∈[0.03; 10] μm [see intervals given in Equation (2)]. If we consider in data inversion only particles with radius larger than 0.05 μm, we find that number concentration decreased by approximately 10% in the first case, by 50% in the second and third case, and by 25% in the fourth case.
The maximal and minimal values of
n and
s are found in the upper aerosol layer, whereas volume concentration reaches its maximal value in the lower aerosol layer (except in the third case). This particularity of the
v-profiles can be understood if we analyze the particle sizes and their corresponding PSDs. The upper aerosol layer contained particles of smaller effective radius, i.e., less than 0.3 μm, whereas effective radii of particles in the lower aerosol layer exceeded 0.3 μm (see the first line in
Figure 4). Simultaneously,
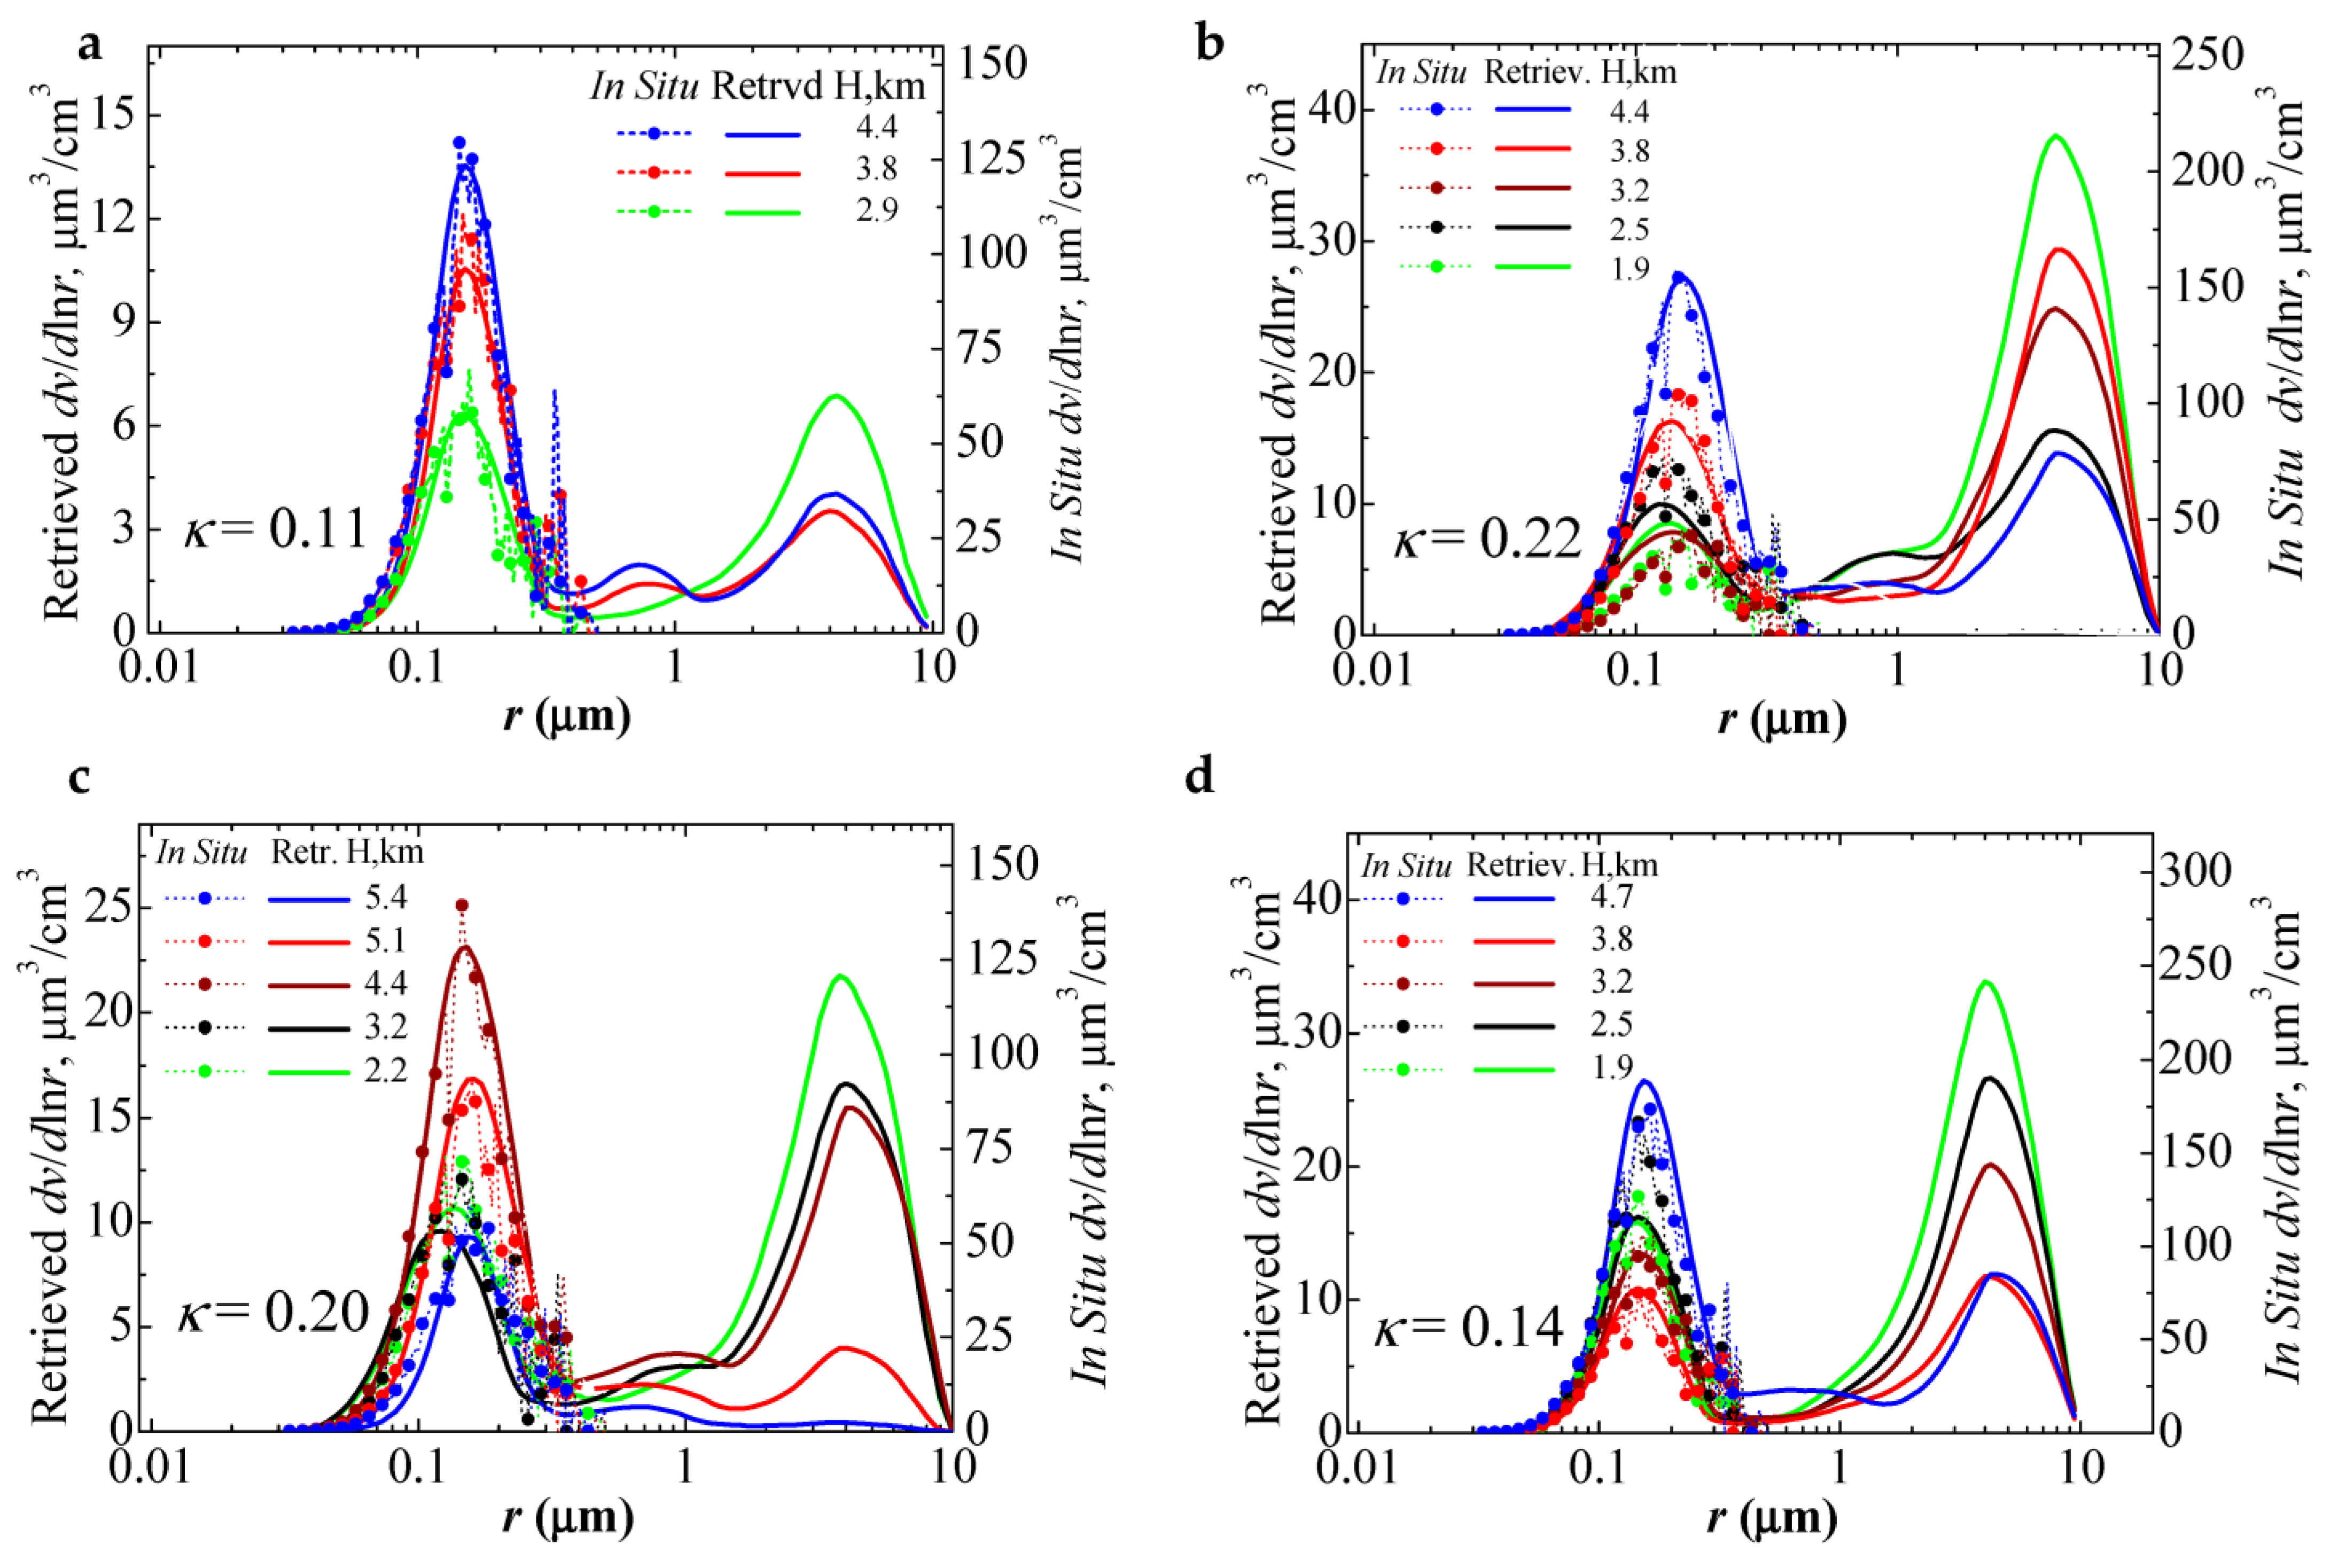
Figure 5 shows the PSDs retrieved for all four cases in height bins that were closest to the height bins used for the in-situ observations. We see that the mean (or effective) radius varied with height within a relatively narrow band around 0.15–0.20 μm, which was indicative of particles in the fine-mode fraction of the PSD. The contribution of coarse-mode particles with
rmean (
reff) equal to 3–4 μm increased within the lower aerosol layers. Furthermore, the concentration of particles in the coarse mode was maximal in the lowest height bins (see green curves). The larger contribution of coarse-mode particles in the lower layer, compared with the conditions in the upper layer, led to an increase in the total effective radius and volume concentration.
We note that the relative humidity profiles reached 80% in the upper aerosol layer of the third case. We hypothesize that this maximal value of 80% that we found from all four cases might be a threshold (condition) at which particle hygroscopic growth became significant, thus leading to an increase in the particle mean (effective) radius and volume concentration in the upper aerosol layer (see blue and red PSDs for the third case in
Figure 5). This observation may explain why the volume concentration of the monomodal PSDs in the upper aerosol layer (blue, red) was higher than the volume concentration of the bimodal PSDs in the lower aerosol layer (black, green) for the third case. The third case also demonstrated that the profile of the mean/effective radius of the fine mode particles was not constant and varied with height. A similar effect was observed for coarse-mode particles during the SAMUM campaign [
20].
Figure 5 also shows the PSDs measured in-situ (dotted curves with bullets). We see a strong disagreement between the retrieved and the in-situ measured PSDs. The magnitude of the differences was approximately one order of magnitude for the peak values in the first and fourth case, respectively, and a factor five in the second and third cases, respectively. However, the disagreements are biased. If we properly fit the correction factor in Equation (3) so that
κ is equal to 0.11, 0.22, 0.20 and 0.14 for the first, second, third and fourth cases, respectively, this bias vanishes. In the next section, we analyze the magnitude of the correction factors and the sources of the retrieval uncertainties.
4. Discussion
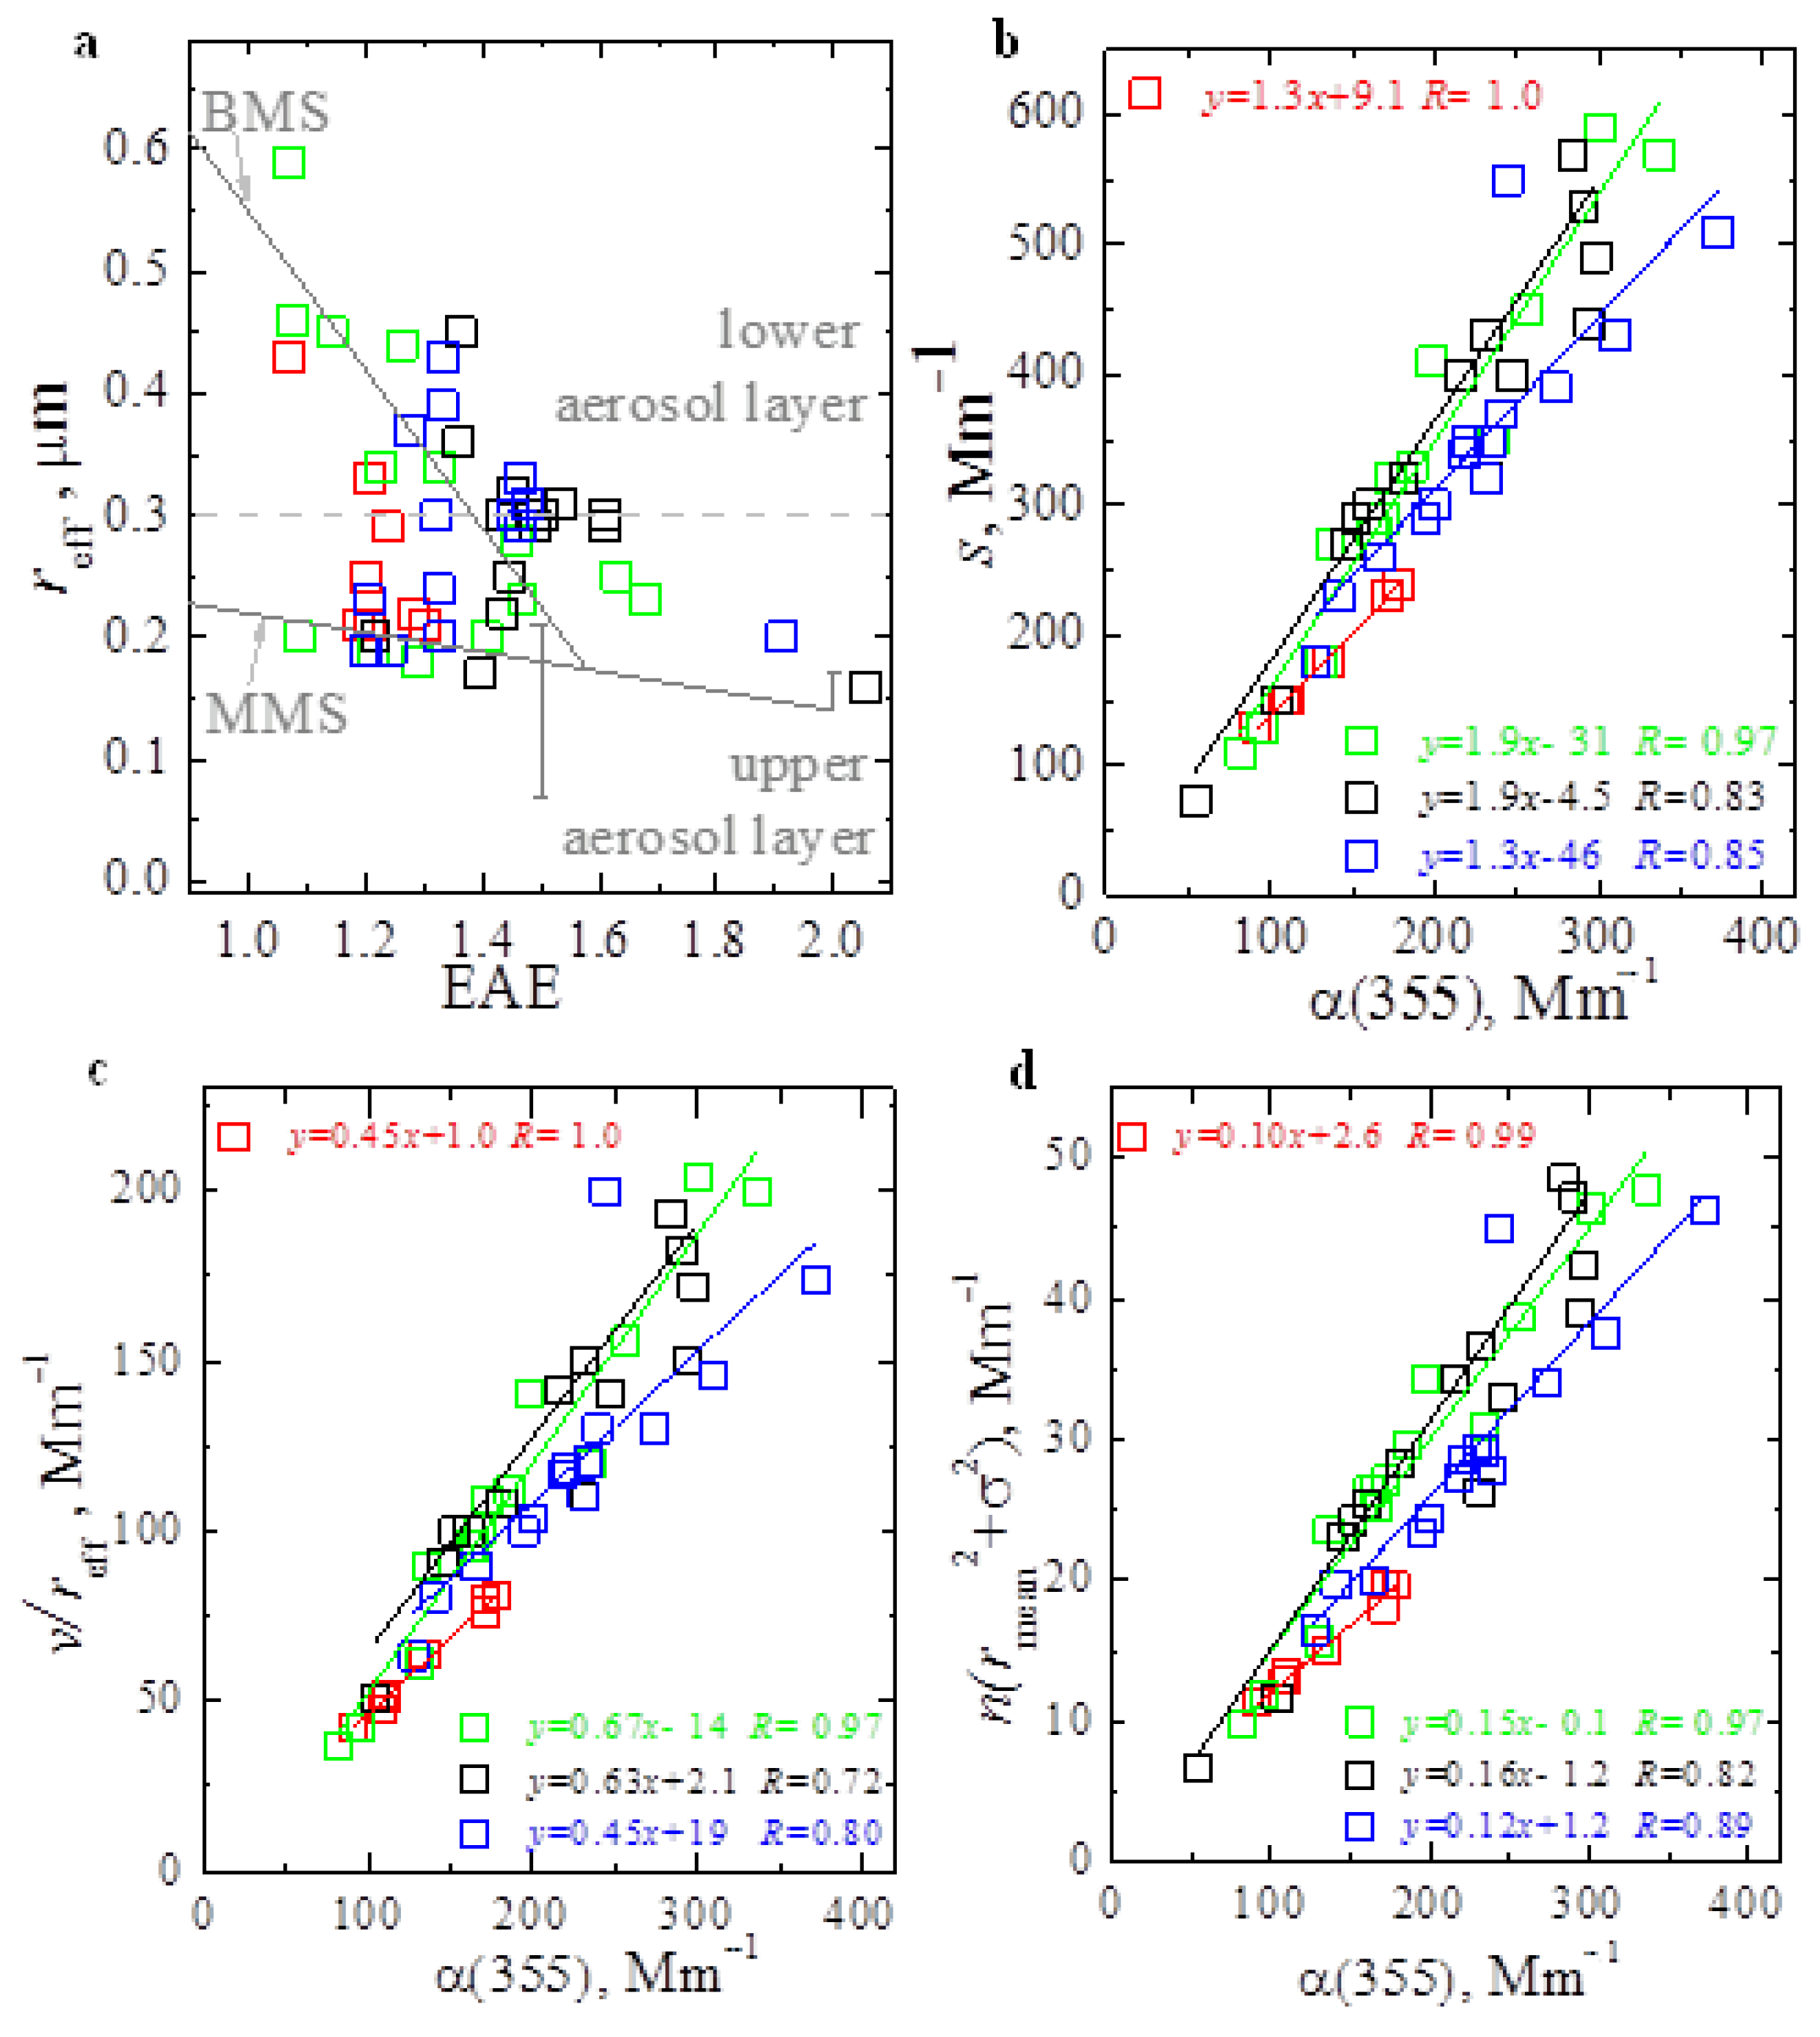
In this section, we describe the quality of the HSRL-2 measurement data and how this data quality affected the accuracy of the retrieved data products. We started our study with the analysis of correlation relationships and regression equations (y = ax + b) that described the interdependencies between particle bulk microphysical parameters and optical data.
The parameters
s [b],
v/
reff [c],
n (
rmean2 + σ
2) [d] and
α(355) were linearly correlated (see
Figure 6). The correlation coefficients were
R = 0.83, 0.72, and 0.82, or larger for all four measurement cases. The regression coefficients
a and
b described the linear correlation relationships (see legends). We conclude that the HSRL-2 3
β + 2
α data were of high quality for two reasons. (1) The regression coefficients agreed with the values we used in [
20], and (2) the values for
as,
av and
an varied inside the intervals [1.3; 1.9], [0.45; 0.67] and [0.10; 0.16], respectively.
We note that the maximal correlation coefficient (
R = 0.99–1.0) corresponded to the first measurement case (red symbols), whereas the minimal correlation coefficient (
R = 0.72–0.83) was found for the third case (black markers). Simultaneously, the bias between the retrieved and the in-situ number concentration profiles (see previous section) was minimal for the first case (25%) and maximal for the third case (more than 100%). The magnitudes of the correlation coefficients and biases meant that the quality of the retrieval results and hence the quality of the measurement data was best in the first case and worst in the third case. In view of the different data qualities found for the four cases, we used a data averaging time of 38 min for the third case, as the data were the noisiest. We used 16–20 min for the other three cases, as they contained less noisy data (see
Table 1). More details on the procedure of estimating averaging times can be found in Ref. [
21].
The biases for number concentrations and PSDs in the radius interval
r∈[0.03; 10] μm were inversely correlated to each other. We applied compensation factors that lead to a reduction in number concentrations in the retrieved profiles. We used 0.9 in the first case, 0.5 in the second and third case, and 0.75 in the fourth case. This meant that if we applied these factors, we obtained the same solution as if we considered the inversion problem (1) over the radius range [0.05; 10] μm (see previous section). The
n-profiles retrieved with these compensation factors then converged with the profiles of CCN number concentration that were measured in-situ. At the same time, the correction factor for the retrieved PSDs became approximately constant, i.e., we obtained
for all four cases. This result means that the data obtained from the lidar observations and the in-situ data converged with each other. We will test in our future studies whether the correction factor
κ (≈0.1) needs to be used for a more accurate definition of the volume PSD in Equation (3) in general.
Figure 6a shows effective radius versus EAE for the wavelength pair 355/532 nm for all four cases. The retrieval and measurement results are barely correlated. However, we can remove from our analysis all data for which EAE exceeds 1.5. We are of the opinion that these data are affected by strong errors. In this case, the two patterns that correspond to the monomodal strategy (MMS) and the bimodal strategy (BMS) become more distinguishable. MMS and BMS are explained in detail in Ref. [
20]. The MMS represents the upper aerosol layer. Here, we mainly find smaller particles that belong to monomodal PSDs. In contrast, the BMS better matches the conditions in the lower aerosol layer. Here we find bigger particles that may be part of bimodal PSDs. The strategies are described by the regression equations
y = −0.08
x + 0.26 ± 0.07 = −0.08
x +
and
y = −0.65
x + 1.2, respectively: for details, we refer to Ref. [
22].
In the next step of our data analysis, we compare the fine-mode radii
rmod and the modal (peak) values
fmod =
f(
rmod) =
fmax (open and solid squares in
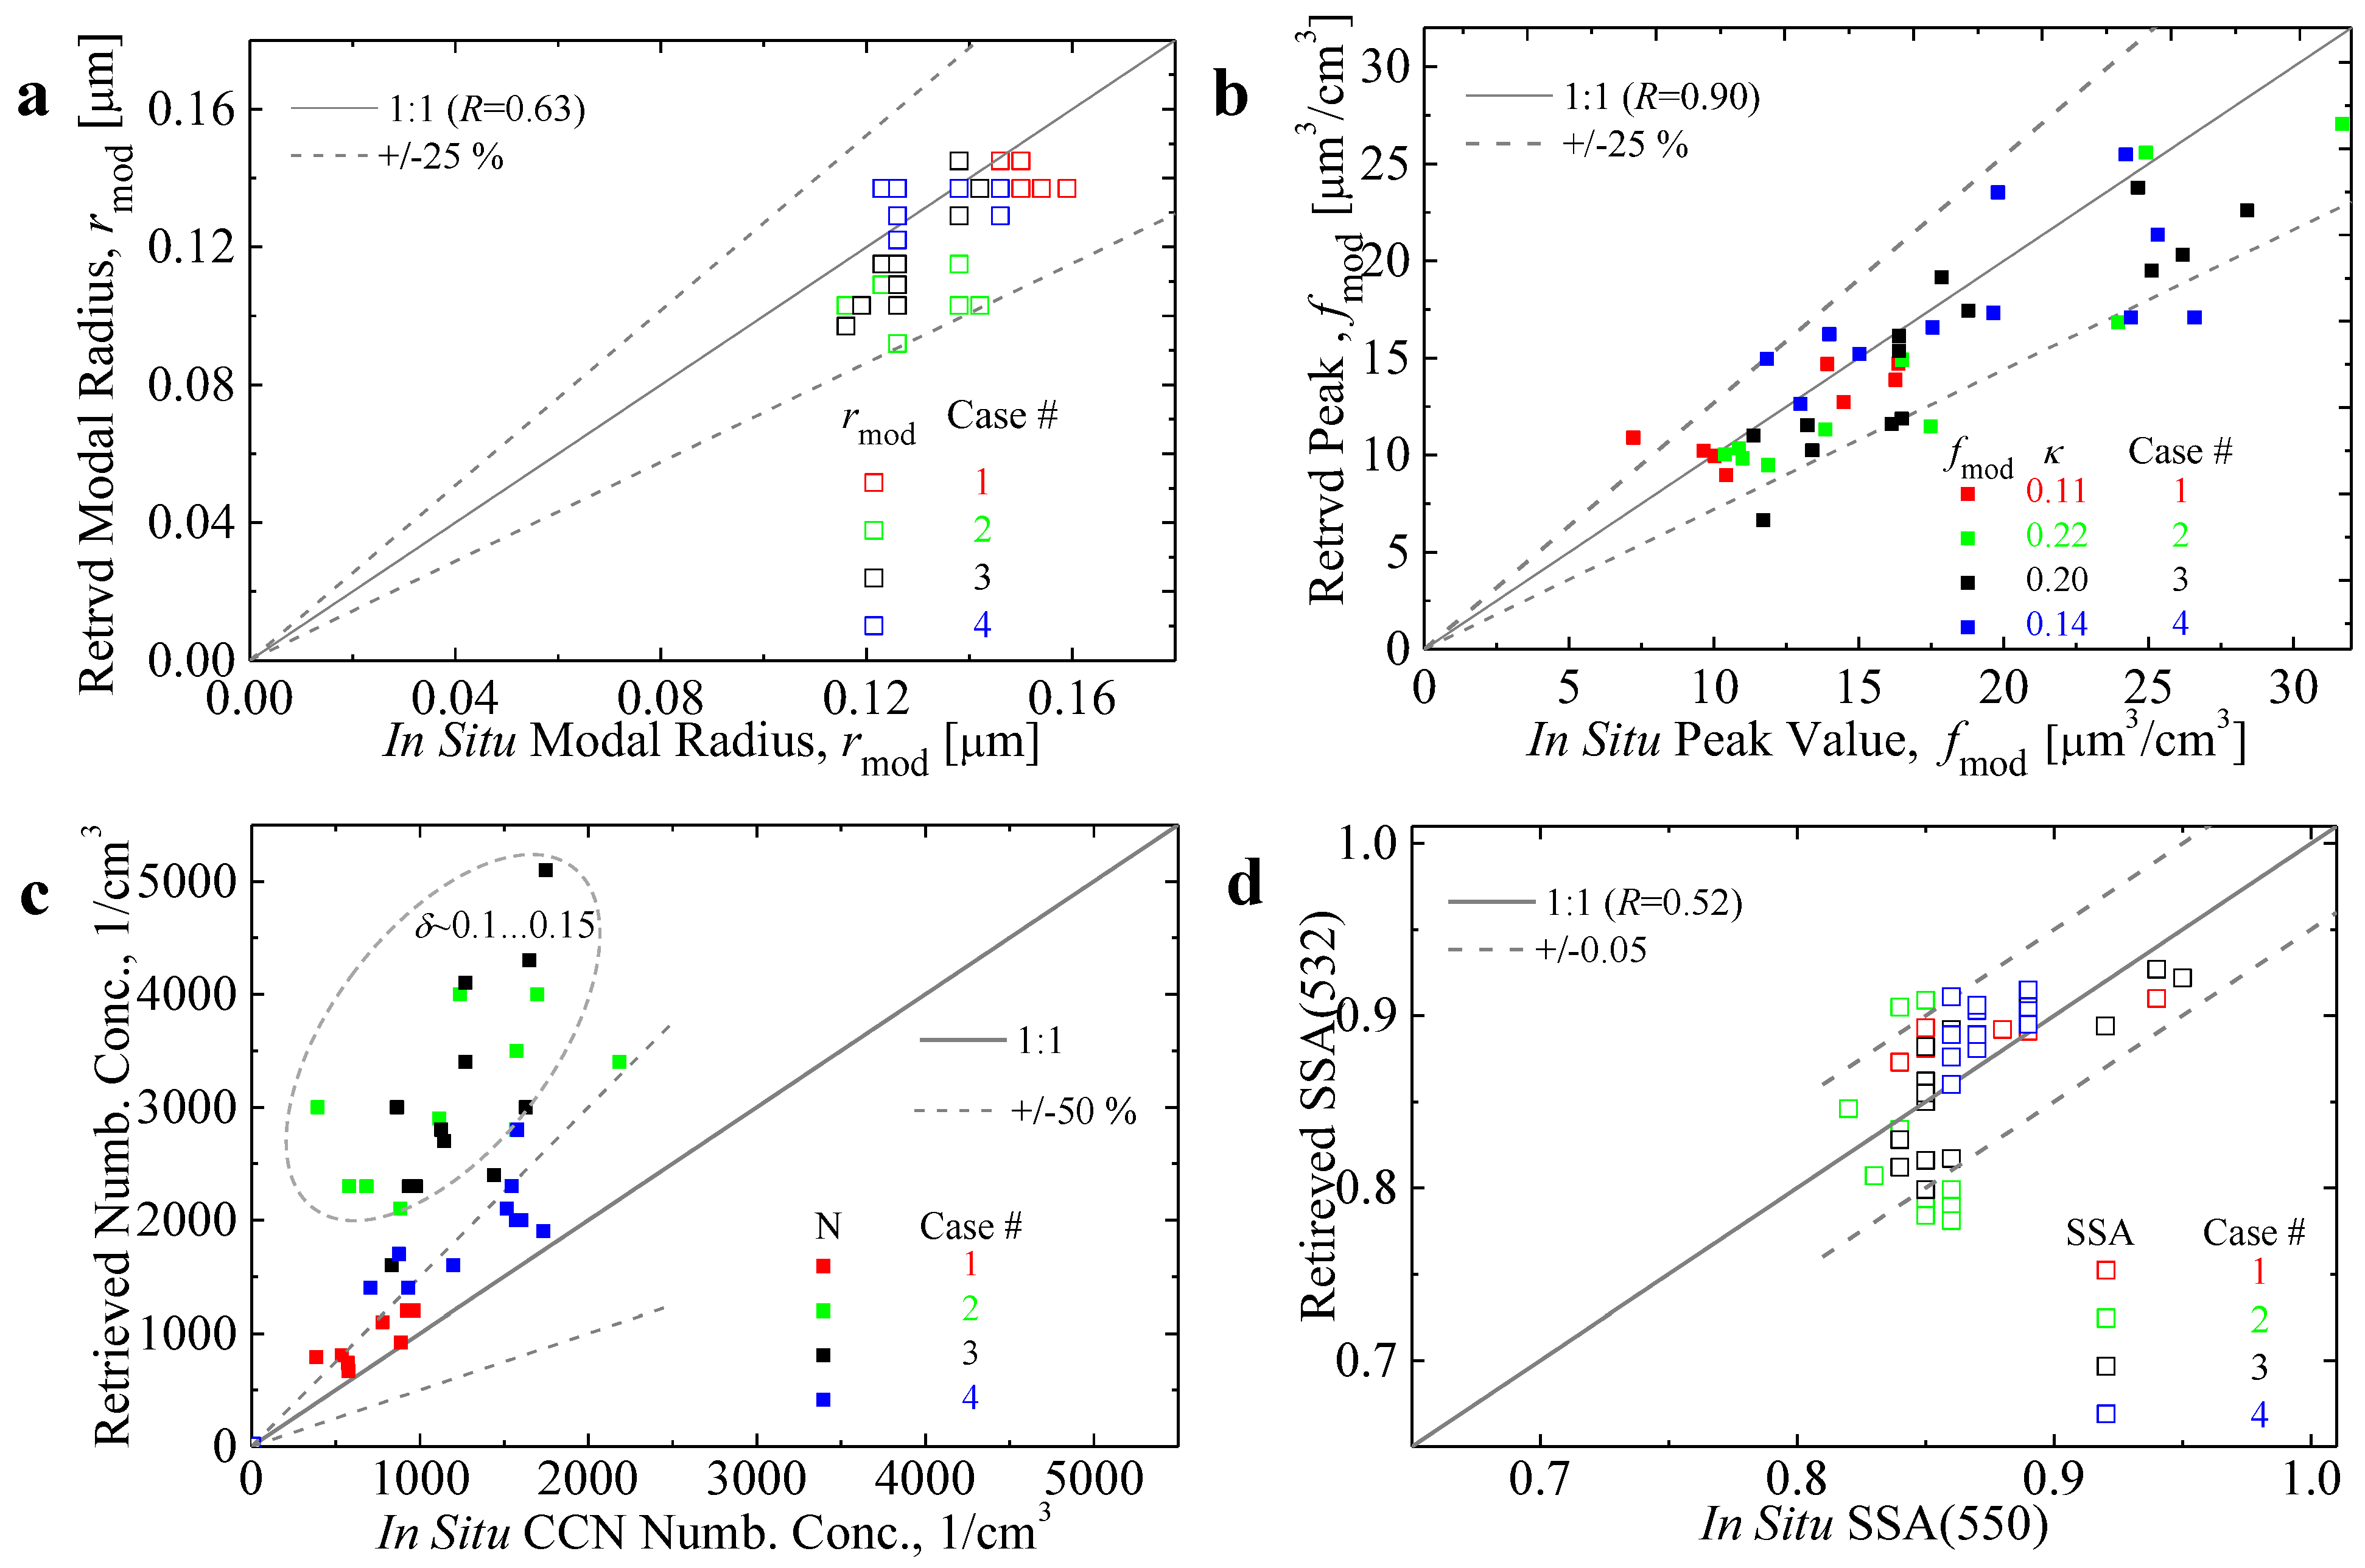
Figure 7a,b, respectively), number concentrations and single-scattering albedos (solid and open squares in
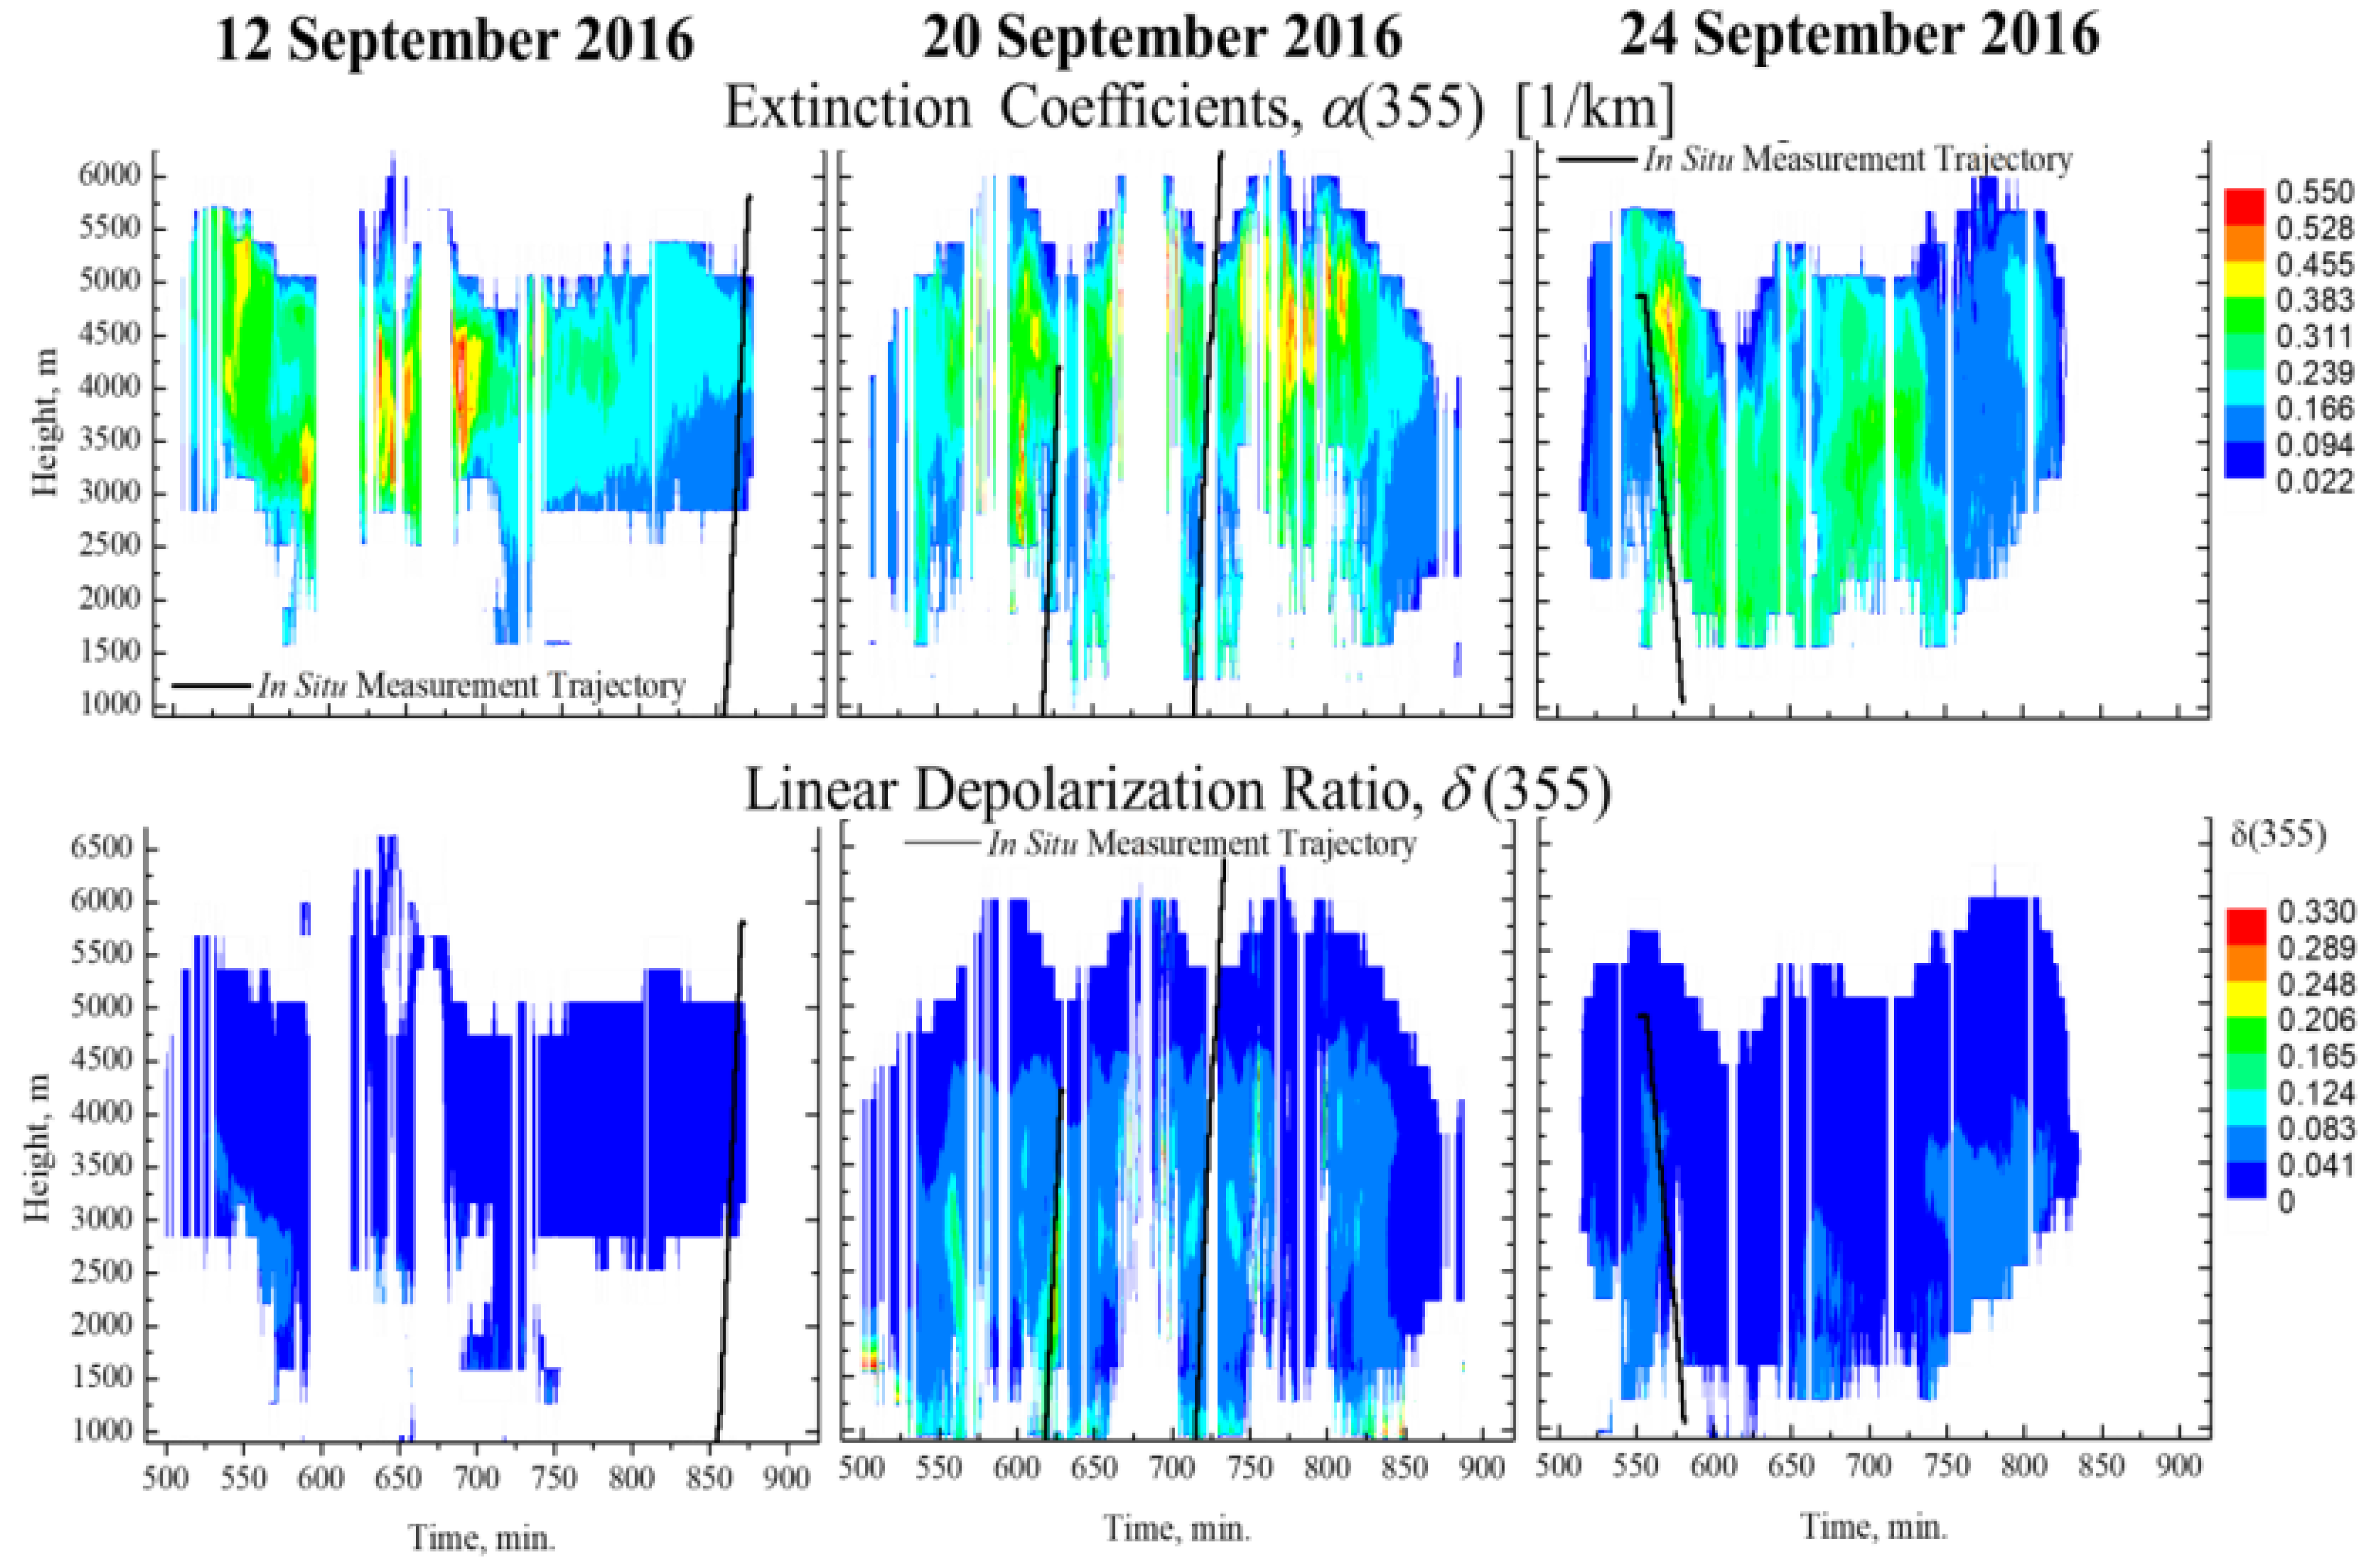
Figure 7c,d, respectively). We see that all data are distributed along the 1–1-line (grey solid). The deviation of the data points from this 1–1-line does not exceed ±30% for the modal radii and peak values, and ±0.06 for single-scattering albedo (dotted grey lines). However, the scattering of the data around the 1–1 line becomes larger for number concentration. The increased scatter is caused by the two measurement cases from 20 September 2016. Particle linear depolarization ratios were comparably large, i.e., values reached 0.10–0.15 (see
Figure 2). The use of the spherical light-scattering model [
18] may not work properly for these two cases. Aside from this reason, the measurement uncertainties of the data of the second and third cases are comparably high, which may also lead to the increased scattering of the data points.
With regard to single-scattering albedo at 532 nm, we found in all four cases a strong correlation to the BAE measured at 355/532 nm (see
Figure 8b). The linear correlation coefficient was 0.85, and the regression analysis results in
y = 0.09
x + 0.77 (see legend, dotted line). In the next step, we investigated whether this comparably strong correlation can be explained from the theoretical point of view.
Firstly, we analyzed the statistics of BAE versus SSA from our reference (etalon) look-up table (RLUT). This RLUT consisted of 345,168 synthetic optical sets of 3
β + 2
α coefficients. The RLUT elements were computed on the basis of logarithmic-normal size distributions for various mean radii, standard deviations and CRIs. For details we refer to [
20]. For the analysis of ORACLES optical data, we collected all RLUT elements that fulfill the constraints, i.e.,
and simultaneously also represent the fine-mode particles we found in our study (see
Figure 3,
Figure 5 and
Figure 7a).
Figure 8a shows the statistics of the entries denoted by solid circles and a solid grey line. Each of these elements can be described by a mean radius
rmean (in terms of number size distribution) in the interval [0.055; 0.115] μm (see legend) and an imaginary part of the complex refractive index in the interval [0.0; 0.05]. Both BAE and SSA depend on particle size. Hence, we found a layer structure (
Figure 8a) in which each layer corresponded to a different standard deviation σ. However, the major factor that decided on the values of these parameters was the imaginary part. Variations in
mI between 0 and 0.05 resulted in an interdependency between BAE and SSA. This interdependency can be described by the linear regression equation
y = 0.19
x + 0.61. The correlation coefficient in this case was
R = 0.75.
We also analyzed the statistics of BAE versus SSA using the RLUT elements that fulfilled the constraints (5) at
mR = 1.4 (see open circles and dotted grey line in
Figure 8a). The behavior of BAE versus SSA was similar to the one we found for
mR = 1.6. The main difference was the bias along the ordinate axis. As a result, the intercept of the regression equation (
y = 0.21
x + 0.72) at
mR = 1.4 increased.
Secondly, we investigated the influence of coarse-mode particles on BAE
and SSA
ω(532). In the case of bimodal PSDs the following equations hold true:
The parameter ϕβ(532) denotes the coarse-mode portion of the total (fine + coarse) backscatter coefficient β(532). BAE and SSA are monotonically decreasing functions if plotted versus ϕβ(532) because coarse-mode parameters and ωcoarse(532) are typically lower than the respective parameters for the fine-mode particles and ωfine(532).
To illustrate this interdependency of BAE and SSA for different portions of
ϕβ(532), we selected two RLUT elements that can be described by such parameters of fine- and coarse-mode particles, i.e.,
Figure 8a shows the curve (grey asterisks) computed at values
ϕβ(532) = 0.30, 0.39, 0.50, 0.63, 0.79, and 1.00. The regression equation for these data was
y = 0.09
x + 0.78. The correlation coefficient
R was close to 1. The main property of this interdependency of BAE and SSA for a bimodal PSD was the slope, which was
a = 0.09. This number was lower than the one we found for fine-mode particles, i.e.,
a = 0.19 and 0.21. We note that the regression equations for the bimodal PSDs (theoretical values) and the retrieved PSDs (experimental values) were close to each other (see grey dotted and asterisk lines in
Figure 8b). We believe that the use of a priori information that takes account of this strong correlation between BAE and SSA may be useful for future studies.
We found another pattern for the retrieval and measurement results. It was the magnitude of ratios between the parameters from the upper (up) and lower (low) aerosol layers in all four cases. The magnitude was equal to
ρ = 1.5–2 for the extinction coefficient (for example, at 532 nm) and number concentration. In the case of effective radius, we can use the inverse value 1/
ρ, i.e.,
We show in the
Appendix A the equations that can be used when particles of the fine-mode coalesce. This process simultaneously increases the portion of coarse-mode particles in accordance with the law of mass conservation if no scavenging effects (particle loss) happen. Particle transformation from fine to coarse mode and vice versa may explain why the extinction coefficient is inversely proportional to particle size, in spite of the fact that for theoretical reasons extinction coefficients at the shortest measurement wavelength were proportional to the cross section or even the volume of particles of one and the same mode.
Finally, we assessed the level of reliability of the results retrieved with the regularization algorithm. We used the correlation coefficient
R that described the degree of interdependency of the data. We considered R as a measure of the reliability of the retrieval results. In our study, the correlation coefficients of the retrieved and in-situ results were 0.52, 0.63 and 0.9 for SSA, modal radius and modal (peak) values of volume PSD, respectively (see
Figure 7a,b,d). This result implies that the data points from both methods were comparatively well-correlated to each other, especially in the case of the parameter
fmod. Based on this observation, we conclude that the degree of reliability of the retrieval results reached 90%. Moreover, in view of the data spread, the uncertainties of the retrieval results for the parameters SSA,
rmod and
fmod were ±0.06, ±25% and ±30%, respectively (see dotted lines in
Figure 7). However, we stress that this magnitude of 90% was achievable mainly because the correction factor
κ could be optimally fitted in this study, which eventually allowed for reaching the best agreement between lidar and in-situ data. More generally, the regularization algorithm tends to overestimate number concentration [
1]. Therefore, in practice, an overestimation mainly of number concentration needs to be suppressed in the inversion routine. This suppression can be achieved if we choose a value for the parameter
rmin (it describes the lower limit of the inversion window) that is not too small. For example, we selected
rmin ≥ 0.05 μm. We can achieve a similar effect if we narrow down the CRI intervals used by the inversion algorithm in the search routines. Another, more sophisticated manner of suppression includes the use of the proper correlation relationships between microphysical parameters and optical data (see
Figure 6). We recently published these results; see [
20,
21].
5. Conclusions
We present the first results of a comparison of particle microphysical characteristics retrieved with a regularization algorithm [
3] and measured with airborne in-situ instruments during the ORACLES campaign. The campaign took place off the southwest coast of Africa in September 2016. NASA Langley Research Center’s airborne HSRL-2 instrument provides optical profiles of 3
β + 2
α data which can be used as input for our retrieval algorithm. These data are publicly accessible and can be downloaded from
https://espoarchive.nasa.gov/archive/browse/oracles/id8/ER2 (accessed on 1 September 2023). We found in total four measurement cases for which HSRL-2 and in-situ measurements were co-located in space and in time close enough so that we could carry out a detailed comparison of the data products provided by the two particle characterization methodologies.
We identified two distinct aerosol layers in all four measurement cases. The lower aerosol layers reached up to 3.5 km height above sea level in all four cases. This layer was characterized by a bimodal particle size distribution and effective radii (reff) exceeding 0.3 μm. In the upper aerosol layer above 3.5 km height the coarse mode disappeared. Particle effective radius dropped to values less than 0.3 μm. Simultaneously, the imaginary part of the complex refractive index (single-scattering albedo at 532 nm) tended to decrease (increase) to 0.02 (0.90) in the upper aerosol layer compared to values of 0.025–0.03 (0.80–0.85) in the lower layer. Particle extensive microphysical parameters, i.e., number (n), surface-area (s) and volume (v) concentrations, are proportional to the magnitude of optical data taken with HSRL-2. These three parameters varied between 350 and 5200 cm−3, 80 and 600 μm2cm−3 and 5 and 60 μm3cm−3, respectively.
Our analysis of interdependencies between bulk microphysical parameters and optical data showed a high linear correlation of the parameters s, v/reff and n (rmean2 + σ2) with the extinction coefficient α(355). We found comparably high correlation coefficients for the interdependency of v/reff versus α(355). Correlations vary between R = 0.72 and R = 1.0. We also found high correlations between effective radius and the extinction-related Ångström exponent (wavelength pair 355 and 532 nm) considering separately the interdependencies in the upper aerosol layer (characterized by monomodal particle size distributions) and the lower aerosol layer (characterized by bimodal particle size distributions).
The data products obtained with our regularization algorithm agree within reasonable limits to the same data products measured with the in-situ instruments. We obtained the following results:
particle size distributions agreed within ±25% uncertainty if we used the correction factor in the interval κ∈[0.11; 0.22];
single-scattering albedo at 532 nm agreed with an uncertainty of ±0.05;
number concentrations (obtained with our regularization algorithm) versus CCN number concentrations (measured with in-situ instrumentation) agreed within an uncertainty of ±50%. The uncertainty increased to 100% and above with increasing particle linear depolarization ratio δ and measurement noise.
We found a comparably high correlation coefficient of R = 0.85 between single-scattering albedo retrieved with our regularization algorithm at 532 nm and the backscatter-related Ångström exponent measured with HSRL-2 at the wavelength pair 355 and 532 nm. We found comparably good agreement between the results retrieved with the regularization algorithm and measured in-situ. The degree of reliability was as large as 90% if HSRL-2 data were averaged for at least 16–20-min.
We shall carry out a more detailed study in future research work (1) to test the correction factors
κ that describe the bias between retrieved and in-situ particle size distributions, (2) to investigate the influence of different light-scattering models, including the light-scattering model that uses spheroidal particle shape [
23], on our results, as well as (3) to analyze the uncertainties of the optical input data and uncertainties of the data products we inferred from the regularization algorithm and measured with the in-situ instruments.
