Article

Multi-Index Analysis of Spatiotemporal Variations of Dry Heat Waves and Humid Heat Waves in China

1
State Key Laboratory of Disaster Prevention and Reduction for Power Grid, Longhua Road, Langli Town, Changsha 410129, China
2
State Grid Hunan Electric Power Company Limited Disaster Prevention and Reduction Center, Longhua Road, Langli Town, Changsha 410129, China
*
Author to whom correspondence should be addressed.
Atmosphere 2023, 14(11), 1660; https://doi.org/10.3390/atmos14111660
Submission received: 19 September 2023 / Revised: 29 October 2023 / Accepted: 2 November 2023 / Published: 6 November 2023
(This article belongs to the Special Issue Climate Extremes in China)

Abstract

:
Heat waves, particularly humid heat waves that occur together with high temperatures and humidity, pose a severe hazard to human health in the context of global warming. In this work, daily observations from more 1500 sites are used to define dry and humid heat waves in a warm season (May to September) and assess their spatiotemporal characteristics during 1960–2015. Dry heat waves are identified with daily maximum temperatures, while humid heat waves are identified based on the wet bulb temperature, derived from both temperature and humidity. We compare dry and humid heat waves from various aspects based on multiple heat wave indices, including their frequency, duration, and intensity. Results suggest that the occurrence of both dry and humid heat wave days in China is higher in the southern than in the northern part of China, due to the higher air temperature and humidity therein. Compared to dry heat waves, humid heat waves are of higher amplitude but shorter duration. The long-term trend analysis shows that the occurrence of both dry and humid heat waves has increased overall over the last 50 years, with an especially rapid increase in the last 20 years, which may be related to China’s rapid warming since the late 1980s. The future projections with multiple global climate models indicate that China will experience more frequent, stronger, and longer-duration dry and humid heat waves in the future, under both intermediate and high-emission pathways.

1. Introduction

Heat waves are typical extreme weather events, characterized by extreme high temperatures that often last for several days and have a non-negligible impact on people’s lives. Extreme heat events have been increasing in recent decades in the context of global warming. Heat waves have significant impacts on human mortality, regional economies, and natural ecosystems [1]. Luo et al. [2] showed that the frequency, intensity, scope, and duration of heat waves exhibit significant global increasing trends. These long-term changes are attributed to global warming and other human activities—for instance, urbanization and land-use change. Grundstein et al. [3] and Anderson et al. [4] found that the 1995 heat wave in Chicago, the worst natural disaster in the U.S., caused more than 700 deaths. In 2003, a heat wave event swept across the globe, resulting in a rapid short-term increase in mortality rates in Eurasia, a major reduction in crop yields, economic losses of USD 12.3 billion, and more than 70,000 deaths [5]. At the same time, Liu et al. [6] discovered that the south of China was also affected by the heat wave, with temperatures sharply exceeding the record high in numerous regions. Russia saw persistent high temperatures in 2010, resulting in a number of forest fires. Since the beginning of summer in 2013, the southern region of China has been affected by a strong heat wave, particularly from mid-July to late August, with persistent high temperatures in Jianghuai, Chongqing, and other cities, with the highest temperature exceeding 40 °C in 28 districts and counties and the highest temperature in Chongqing reaching 43 °C, exceeding the historical high of 42.2 °C and setting a record for the highest extreme temperature.
On the other hand, Peng et al. [7] and Deng et al. [8] have pointed out that it is difficult for the body to sweat under very humid and warm conditions. The accumulation of environmental and metabolic heat in the body may lead to physical illness and even death. According to Wang et al. [9], humid heat waves are persistent high-temperature and high-humidity events, and both dry and hot and humid environments are typical of the extreme environments encountered by humans and other organisms in their survival and production; either one can have a strong psychological and physiological impact on the population. Humid heat waves, according to Wang et al. [9], are persistent high-temperature and high-humidity events, which have a strong psychological and physiological impact on humans.
Therefore, humid heat and dry heat have different indications, with humid heat characterized by stronger effects on human health than dry heat. According to Ning et al. [10] and Shi et al. [11], dry heat waves are associated with a sharp increase in temperature and a decrease in relative humidity, whereas humid heat waves are accompanied by a relatively weaker, but more expansive, increase in temperature and a more intense increase in humidity. It was pointed out that, in recent decades, both humid and dry heat waves have occurred frequently in China, and, with global warming, it is expected that, in the coming decades, such extreme heat waves will be even more frequent and severe [6,9].
Earlier works have mostly concentrated on extreme air temperatures, whereas the concurrent high humidity can exacerbate the adverse impacts of extreme heat on humans (e.g., Wang et al. [12]). Moreover, less attention has been paid to the spatial and temporal characteristics of the differences between humid and dry heat in China. Understanding the differences between humid and dry heat waves allows us to better adopt effective strategies to mitigate their threats to public health, especially their increasing trends under global warming. Thus, in this work, based on the observed daily air temperature and humidity, we define dry and humid heat waves and study their spatial and temporal characteristics and the potential differences in the past several decades in China.

2. Data and Methods

2.1. Dataset Used in This Study

The daily observations including air temperature and humidity were provided by the China Meteorological Data Service Center (http://data.cma.cn/en/, accessed on 25 July 2023), and the datasets were obtained from more than 1500 stations for the period 1960–2015. Considering the consistency of data statistics, stations with more than 20% missing data were excluded. These datasets are quality controlled, homogenized, and widely used in the study of extreme events in China. In addition, this study focuses only on the extreme high temperatures from May to September each year, and the calculation of the climatology of heat wave index is based on the period of 1960–2015. For future projections of humid and dry heat waves, we use 15 global climate models (GCMs, Table 1) from the CMIP5 project, including three periods, i.e., historical (Hist, 1981–2005) and future (Fut, 2076–2100). Both the intermediate and high-emission scenarios, RCP4.5, are considered (Table 1). The multi-model ensemble mean (MME) will reduce the internal variability and isolate the effects of global warming. Thus, the MME is calculated as the average of the 15 CMIP5 models. The future changes in different scenarios are regarded as anomalies between Hist and RCP4.5/RCP8.5 for all indices defined below.

2.2. Methods

2.2.1. Calculation of Wet Bulb Temperature

In this paper, using the algorithm described in Davies-Jones [13], we calculate the daily maximum wet bulb temperature (TW) from the daily maximum air temperature (T), the daily average relative humidity, and the daily average surface pressure (p).

2.2.2. Definitions and Indices of Dry and Humid Heat Waves

As demonstrated in Wang et al. [14], a heat wave is a period of abnormally high temperatures that lasts for a period of time, but, currently, there is no standardized or uniform definition of a heat wave [15,16,17]. Smith et al. [18] summarized 15 definitions of heat waves, which are based on different temperature data, including daily maximum/minimum/average temperatures and apparent temperatures calculated from temperature and humidity [19], with durations ranging from one to several days. According to the temperature criteria, the definition of a heat wave can be divided into two categories: one is based on the definition of an absolute threshold, using a fixed temperature value, such as 35 °C, shown on a general thermometer; the other is based on the definition of a relative threshold described by Anderson and Bell et al. [20], in which the local climate is considered to determine the temperature threshold, such as the 90th percentile. Thus, compared with the fixed threshold, the percentile-based thresholds are more appropriate to represent weather extremes as they consider significant differences in regional climatology across China, and they have been widely used to study heat wave variability [12]. Specifically, for each date from May through September, dry (humid) heat waves are defined using a threshold of the 90th percentile of the 21-day moving center window of the daily maximum temperature T (TW) from 1960 through 2015. For humid and dry heat wave events, the definition requires that the daily maximum temperature (wet bulb temperature) exceeds the threshold for no less than four days.
In this study, we use a total of six heat wave metrics, including singularity and comprehensiveness, to quantitatively characterize the different features of dry and humid heat waves. They are defined and described in detail in Wang et al. [14]. Specifically, heat wave indices include the heat wave number (HWN), heat wave frequency (HWF), average heat wave duration (HWD), heat wave intensity (HWI), heat wave total intensity (HWTI), and average heat wave amplitude (HWA). In addition, we use the heat wave total intensity (HWTI), which is a summary of the total intensity of all heat waves in a year. The indices are calculated as follows for a particular observation point in a given year:
HWN = N
HWDU = i = 1 N ( D i ) N
HWM = i = 1 N j D i ( T i j T R i j ) D i N
HWI = i N j D i ( T i j T R i j ) N
where N is the total number of heat wave events in the year. For heat wave i, its duration is D and its intensity is calculated as i D i ( T i j T R i j ) , which is the sum of temperature deviations above the threshold during its duration D. The variables Tij and TRij are the daily maximum surface temperatures and their high temperature thresholds for day j during the ith heat wave. From the above equation, the integral index HWF is calculated by combining HWN and HWD. HWI combines HWD and HWA, incorporating features of both, but is not simply equal to HWD × HWA. HWTI combines the indices HWN, HWD, and HWA, i.e., it contains the characteristics of all three indices. The information on each index is presented in Table 2.

3. Results

3.1. Characteristics of the Spatial Distribution of Dry and Humid Heat Waves

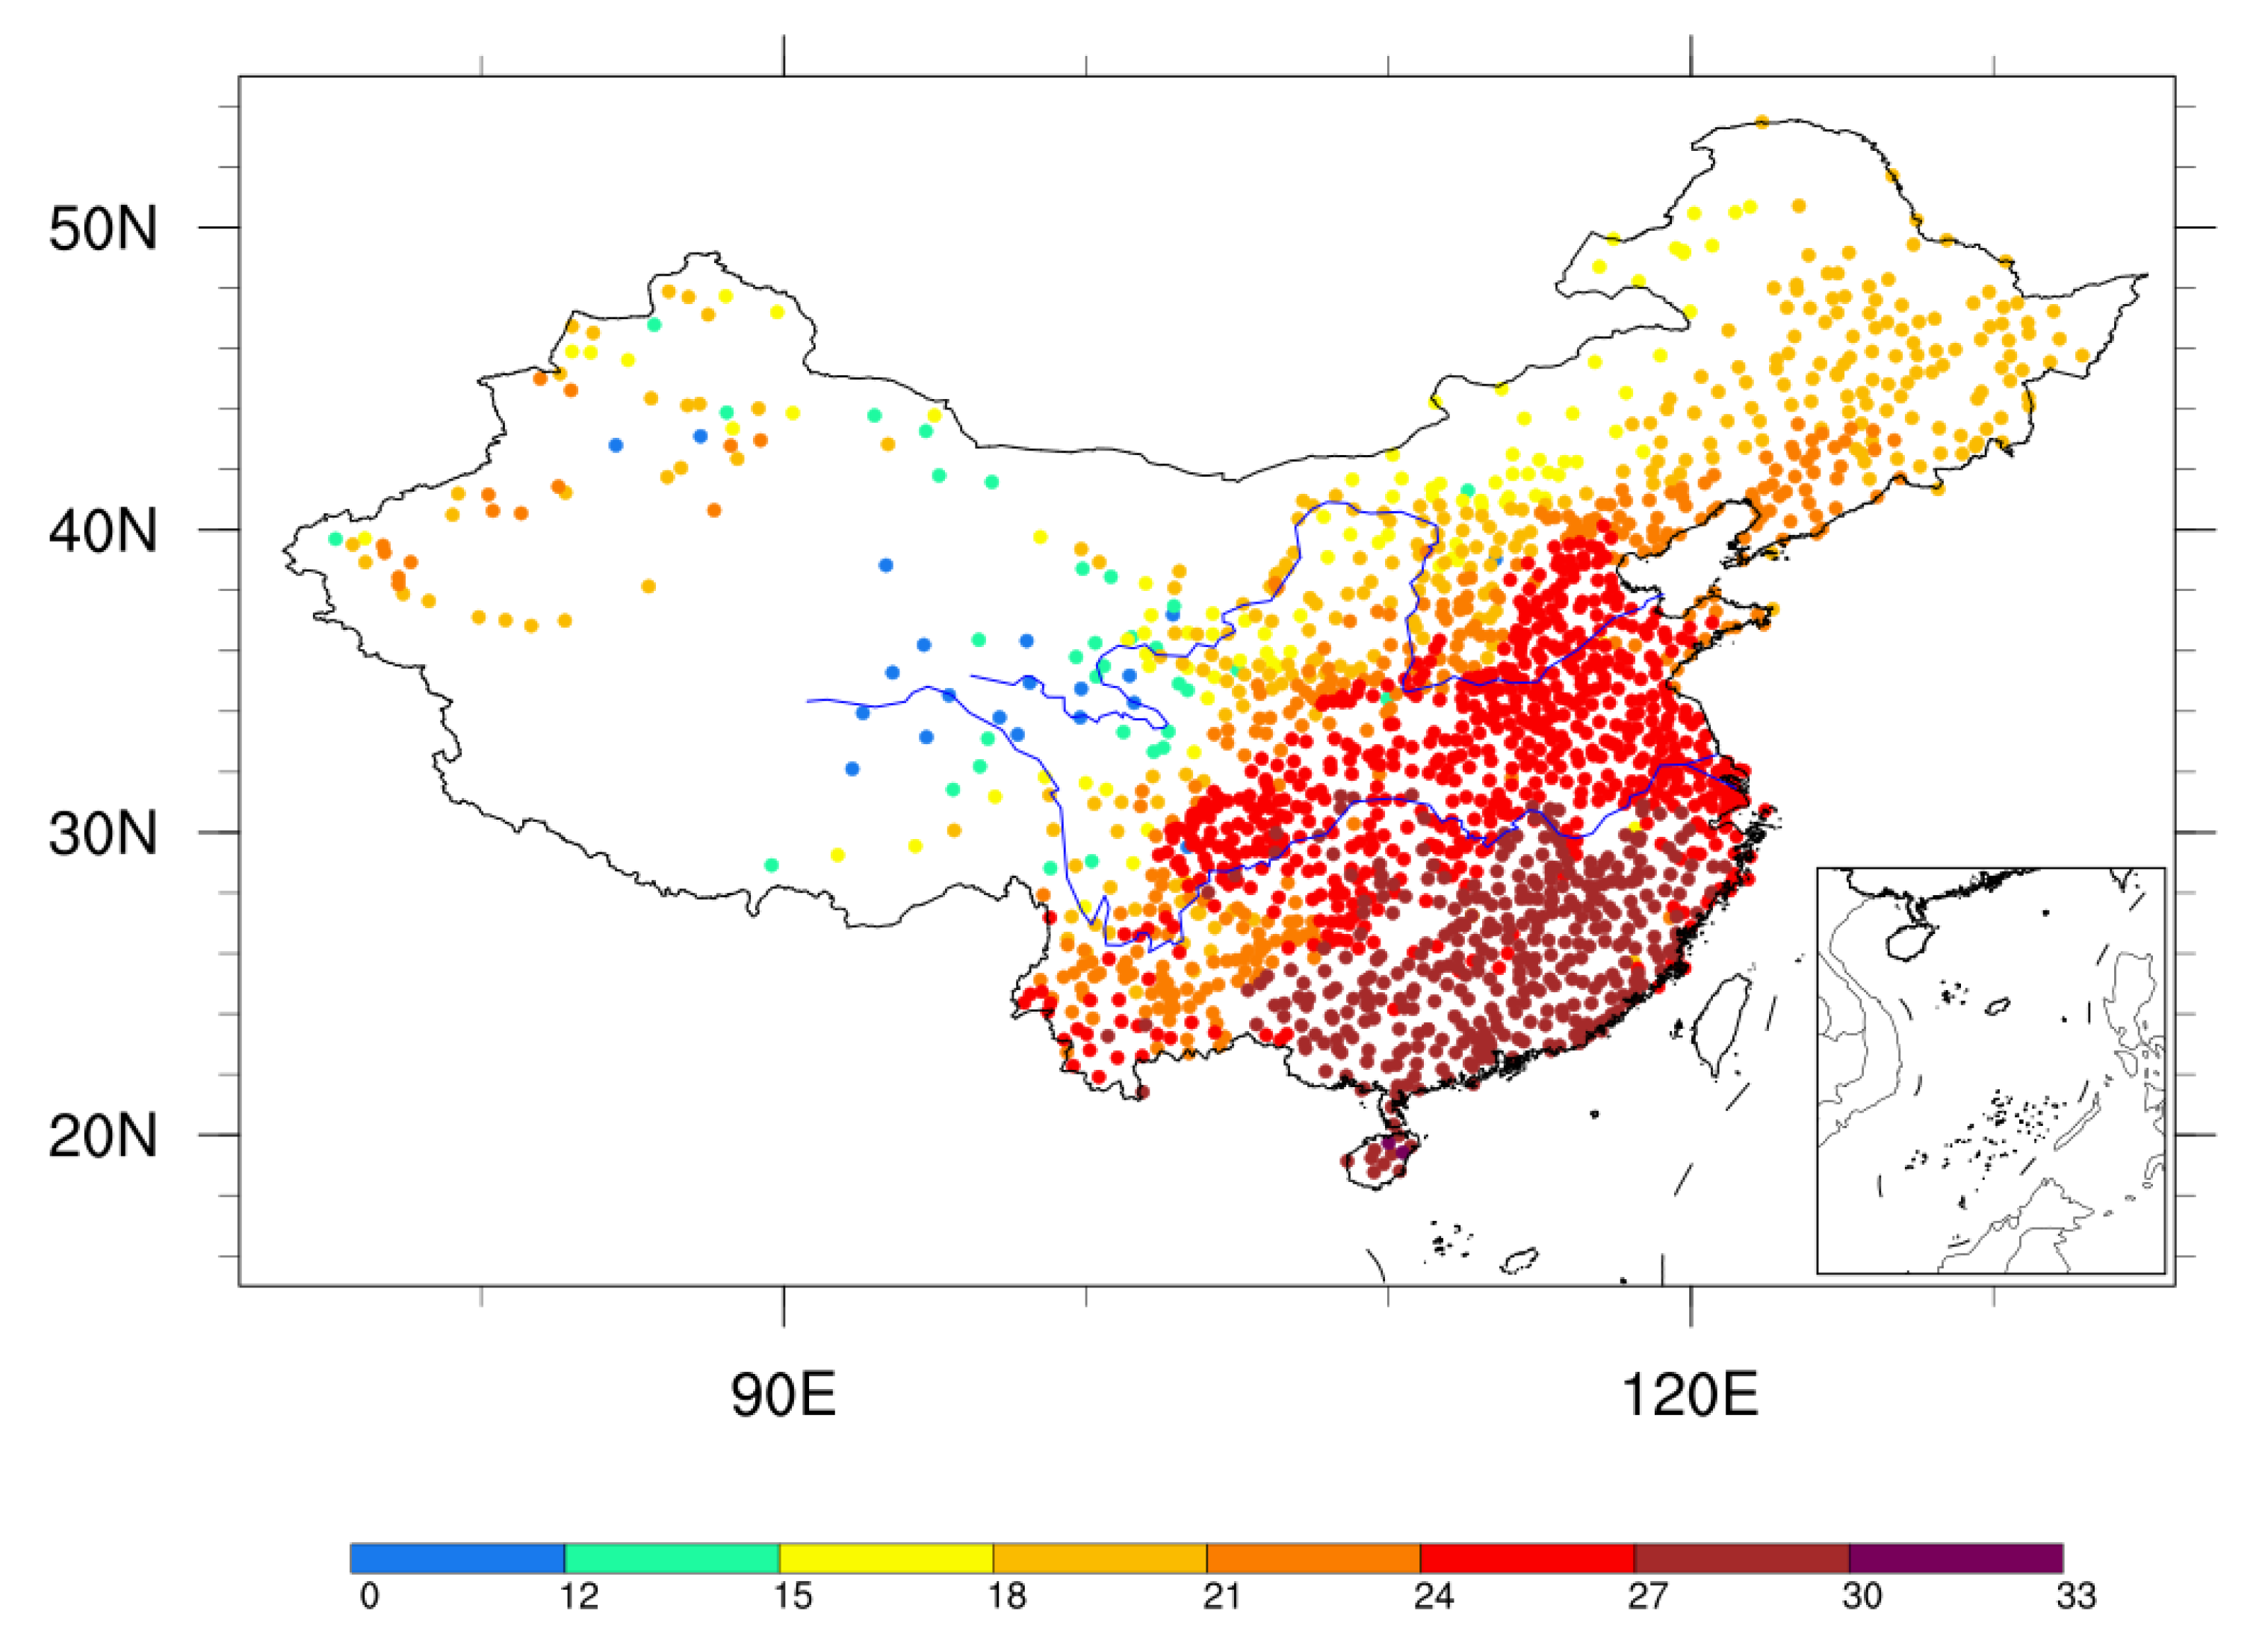
Figure 1 illustrates the spatial distribution of the climatic regimes of the average daily maximum wet bulb temperature TW (°C) for the months of May–September from 1960 to 2015. As shown in the figure, the overall spatial distribution of the mean daily maximum wet bulb temperature decreases from the southern to northern regions. In the northeastern and northwestern areas of China, the average TW value is lower than 24 °C, and in the Guangzhou and Yunnan Provinces, the average TW value is higher than 27 °C, especially in Hainan, where the maximum value reaches 33 °C. These areas belong to the tropical and subtropical regions. In line with recent studies, extreme TWs are highly prevalent in the southernmost part of China, and extreme TWs usually persist for a long time in Southeastern and Northeastern China [20]. If the minimum duration of extreme TWs is required to be three days for the statistics, the highest incidence of extreme TWs will be located in Southeastern China, which is consistent with the region of extreme TWs with longer durations. Moreover, the annual maximum magnitude of extreme TWs shows a positive gradient from Southern to Northern China [12]. This is consistent with the spatial distribution of the daily maximum wet bulb temperatures for the statistics in this paper.
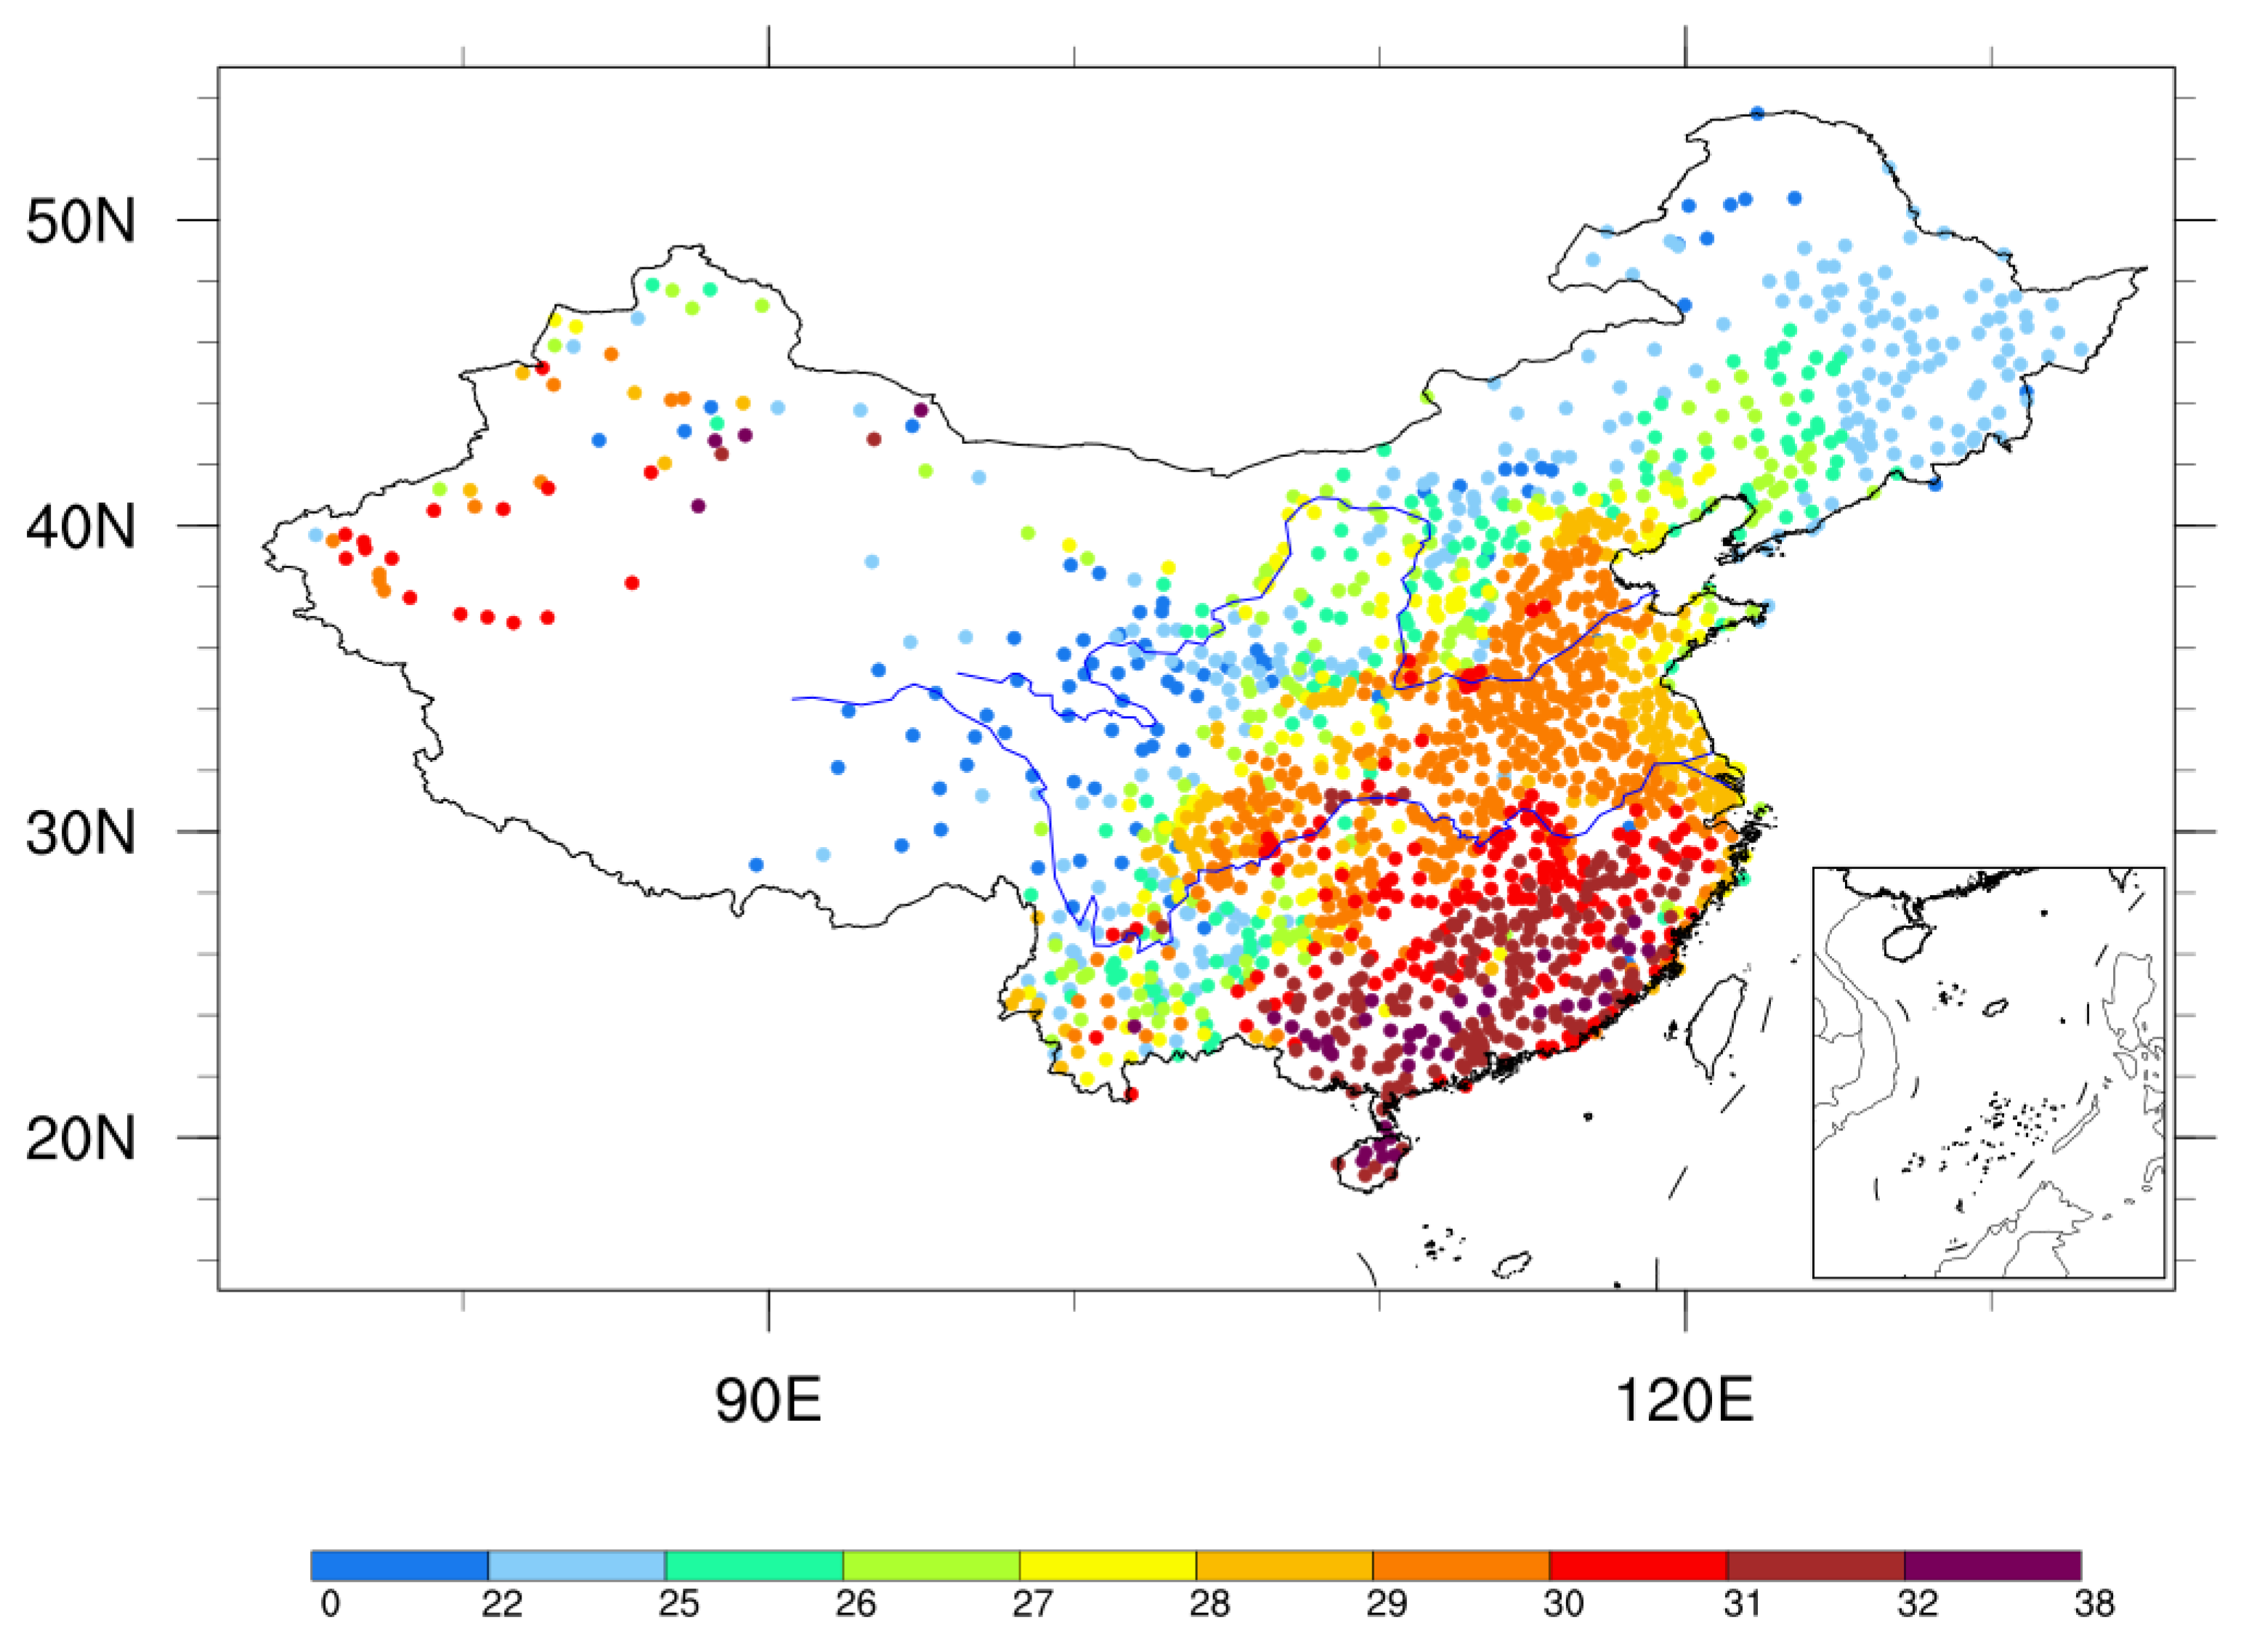
Figure 2 shows the spatial distribution of the climatic patterns of the average daily maximum temperatures in China between May and September from 1960 to 2015. From the multi-year average map, the average Tmax is more than 30 °C in Southeastern and Northwestern China, and the average Tmax in Northeastern China is less than 26 °C. On the other hand, due to the high altitude, the average daily maximum temperature does not exceed 22 °C in the Tibetan Plateau region, which is significantly lower than in other regions. From Figure 2, we can find that the mean Tmax change at the northern stations is larger than that at the southern stations. In line with Wang et al. [14], the linear trend of the temperature change in Northern China is higher than that in Southern China, and within the range of the southern region of China, the trend of the change is stronger in the eastern coastal region. Taken together, this shows that over the past 55 years, the warming in Northern China has been stronger than that in Southern China. In summer, the northwestern region is dominated by strong solar radiation and has a dry climate, while the eastern region is dominated by the northwestern subtropical cyclone. Combined with Figure 2, it can be seen that the Tmax can easily reach 35 °C or even 38 °C in these two regions, but the Tmax in the Tibetan Plateau is usually less than 21 °C in May–September due to the higher terrain.
From the spatial distribution of the daily maximum wet bulb temperatures and daily maximum temperatures shown in Figure 1 and Figure 2, we find that the spatial distribution of the two factors is similar, showing a spatial pattern of “high in the south and low in the north”, which is generally reflected in the frequent occurrence of high-temperature events in the middle and lower reaches of the Yangtze River. However, the frequency of high-temperature events is relatively low in the provinces along the Yellow River Basin, except in Tibet, where high temperature events hardly occur because the average wet bulb temperature in Tibet does not exceed 21 °C and the average dry bulb temperature does not exceed 22 °C from May to September. In Northwestern China, where temperatures are relatively high, the specific humidity is the lowest, a phenomenon that reflects the potentially large differences in the extreme dry and wet bulb temperatures between arid and semi-arid climatic regions. In contrast, the overall daily maximum wet bulb temperature is lower than the daily maximum wet bulb temperature because it is subject to a mixture of temperature and relative humidity, and the difference between the two is more pronounced in arid and semi-arid Northern China. Yao et al. [21] proposed that wet bulb temperature is a mixed index combining temperature and relative humidity, which will bring a sense of thermal discomfort to the human body, i.e., from the point of view of air temperature alone, the temperature of a dry heat wave is higher than that of a humid heat wave, but from the point of view of the heat index, the heat index of a humid heat wave will be higher.
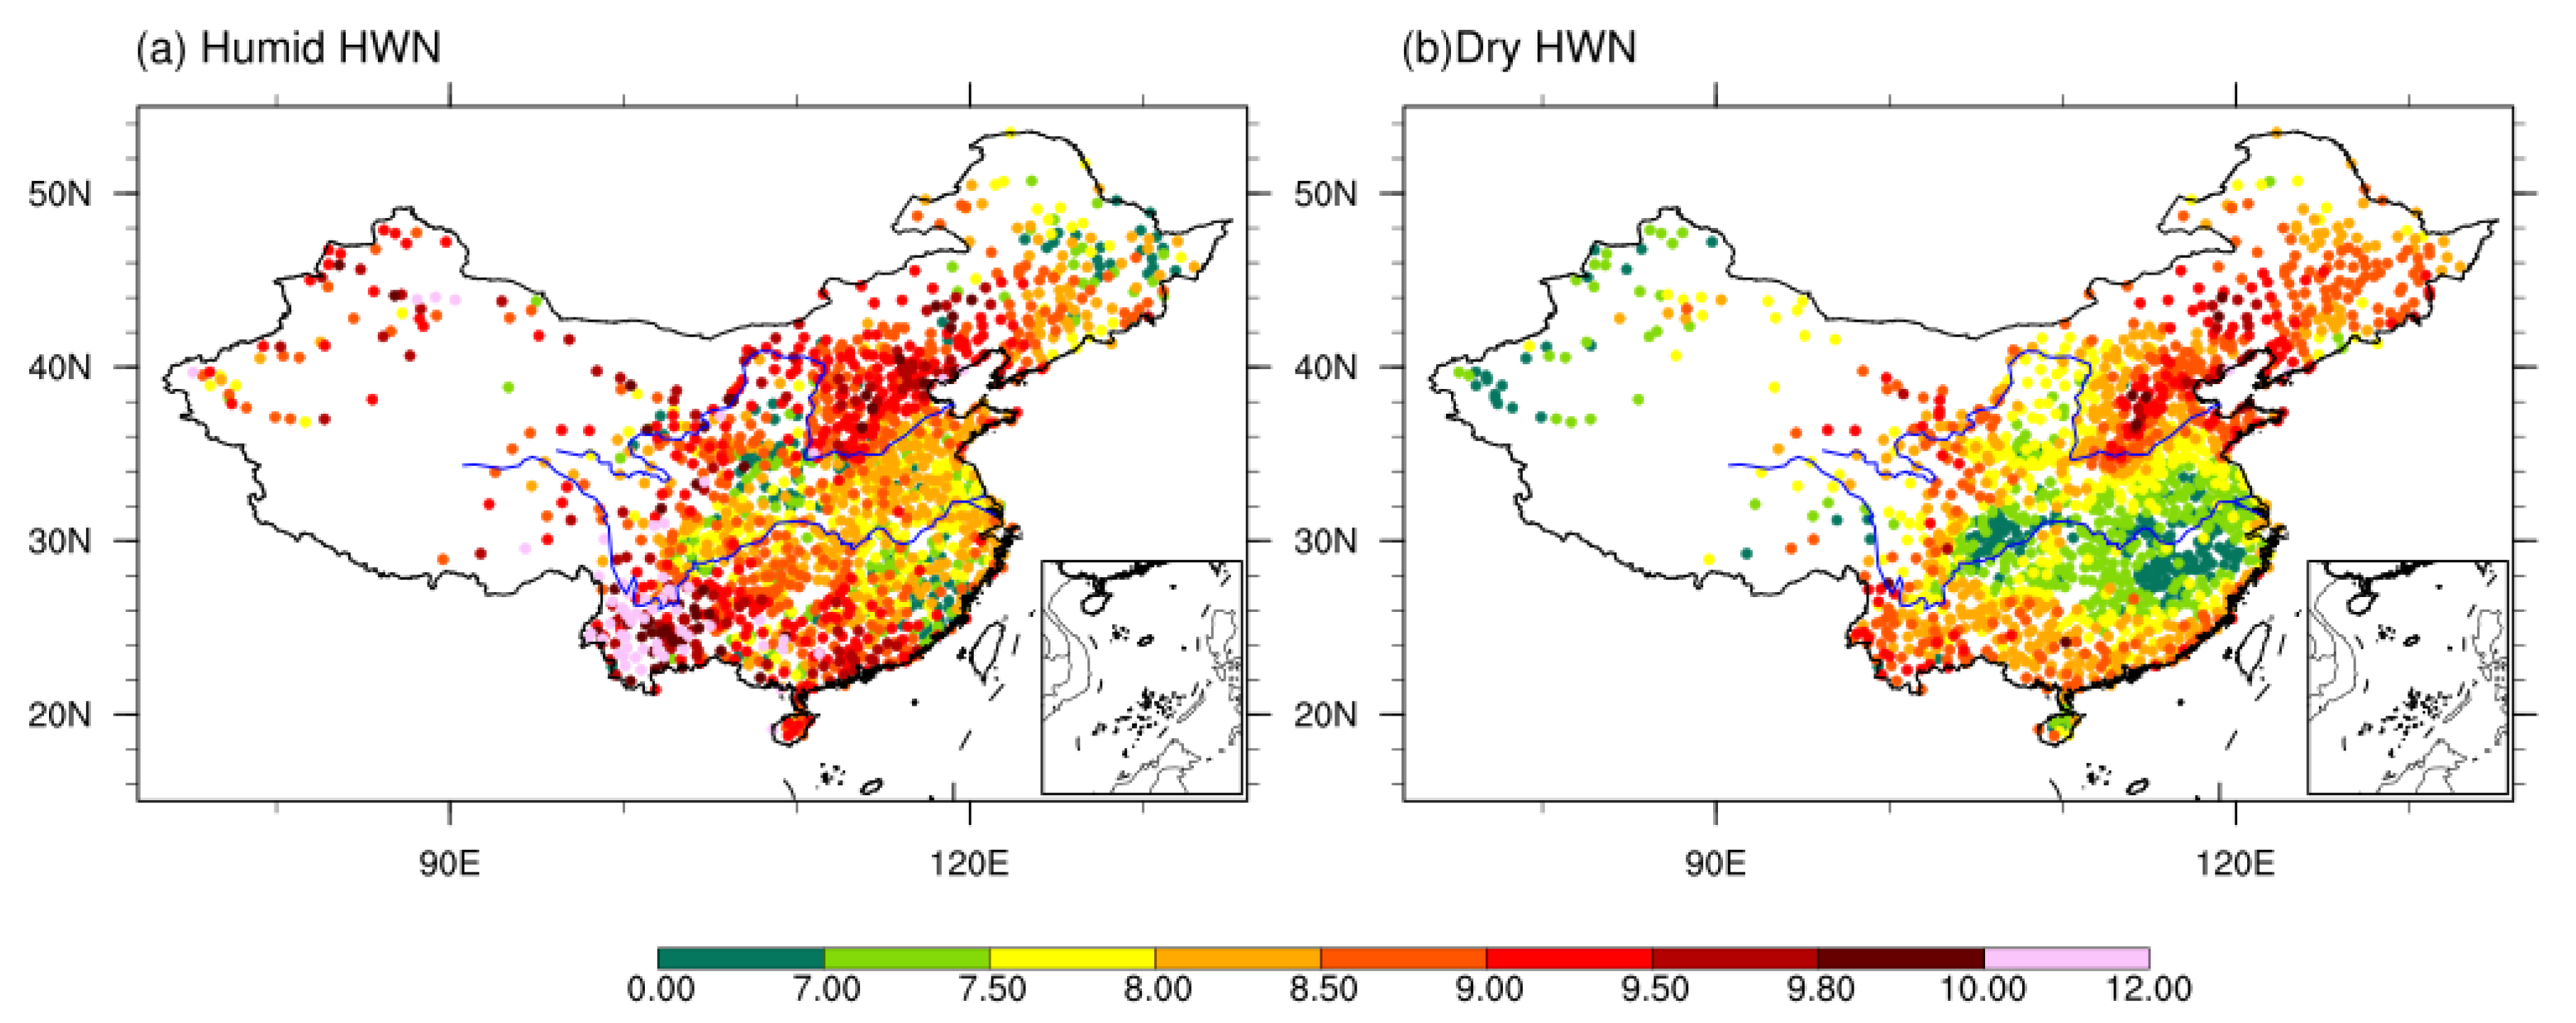
Figure 3 shows the spatial distribution of the humid heat wave HWN (Figure 3a) and dry heat wave HWN (Figure 3b), and it is found that the number of humid heat waves is higher in the northwestern region of China, such as Inner Mongolia in Xinjiang, as well as most of the stations in the east and south of the country; in the northeastern region, i.e., in the northern part of the Yellow River Basin, the number of dry heat waves is comparable to the number of humid heat waves. From the spatial distribution of the dry heat wave HWN in Figure 3b, we find that the dry heat wave frequency is mainly concentrated in Liaoning Province, Jilin Province, and the central region of Inner Mongolia, which experience more than nine high-temperature heat wave events per year, and the frequency of dry heat waves decreases and then increases in the direction of north to south. The dry heat wave HWN along the Jianghuai and Hanjiang rivers is less than that on the northwestern and southeastern sides of the river, which can be seen in the figure, forming a low frequency of dry heat waves, with an average annual dry heat wave frequency of less than seven. The humid heat wave shows a similar distribution, but the magnitude of the value change is smaller than that of the dry heat wave, and the minimum frequency reaches more than seven. As shown by the average annual number of summer heat waves at individual stations from 1960 to 2015 (Figure 3a), Southern China, such as Yunnan and Hainan Provinces, has the highest number of humid heat wave events, especially in Yunnan Province, where the average annual number of humid heat waves at most stations in the region can reach 11 per year. In the northeast, there are also individual stations with an annual average of up to 10 humid heat wave events per year. Western Inner Mongolia, Southwestern Shanxi, and Southern Hebei are the main areas in North China with a high incidence of heat wave events. In line with the study of Lin et al. [22], the high dry heat wave frequency areas in Southwest China are mainly located in the eastern Sichuan Basin and Southern Yunnan, while high-temperature heat wave events seldom occur in Western Sichuan and Northwestern Yunnan, which is consistent with the dry heat wave frequency distribution shown in Figure 3a.
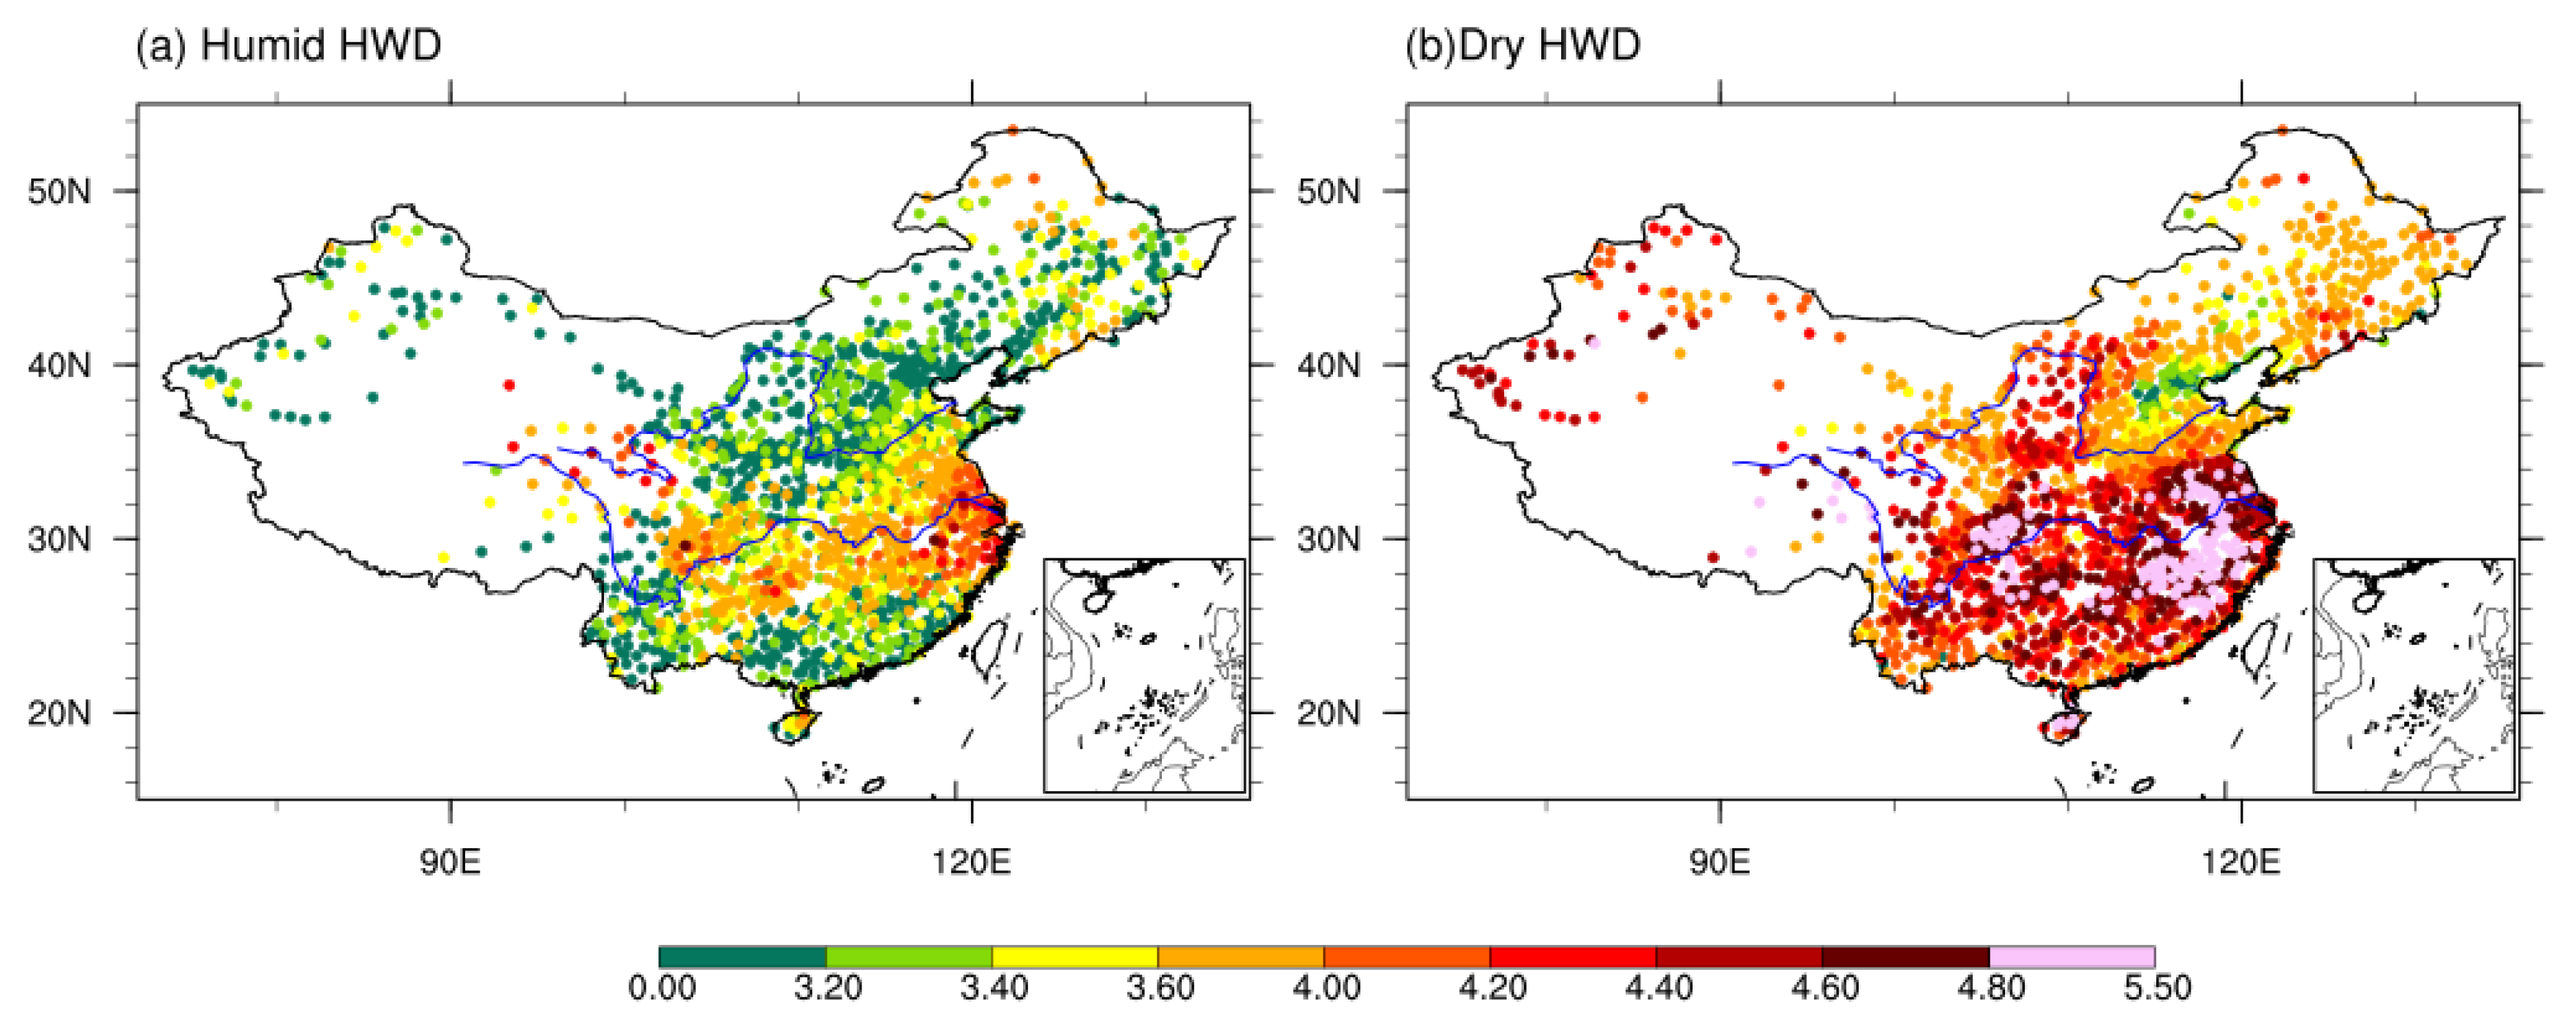
The spatial distribution of regional dry and humid heat waves in China is shown in Figure 4. In terms of temporal characteristics, dry heat waves last longer in the summer months (May–September) (Figure 4b), while humid heat waves are more evenly distributed in all regions of the country (Figure 4a). Both types of heat wave durations are located near the Yangtze River basin, with maximum values of 5.5 for dry heat waves and 4.8 for humid heat waves. According to Wang et al. [14], the high-temperature heat waves in the Yangtze River Basin are mainly influenced by the subsurface conditions and the Western Pacific sub-high, and they are controlled by the westward-extending high-pressure ridge in the middle and lower reaches of the Yangtze River and form a high-temperature and low-rainfall climate [23]. In addition, the region is low-lying and has a large number of lakes and rivers, so heat is not easily lost, and the urban heat island effect exacerbates the heat effect to some extent. Thus, heat waves last longer in the Yangtze River Basin region. In the northwestern region, the duration of dry heat waves is significantly longer than that of humid heat waves, which is related to the fact that the region is mainly heated by solar radiation, the humidity is low, the water vapor conditions are insufficient, and the wet bulb temperature is lower than the dry bulb temperature.
In addition, dry heat wave events are events defined on the basis of maximum daily temperatures, whereas humid heat wave events are defined on the basis of wet bulb temperatures, i.e., they need to take into account both temperature and humidity as co-conditions. Therefore, the occurrence and persistence of humid heat wave events require that the humidity conditions in the region also meet the definitional requirements. Thus, the average duration of dry heat waves in the whole China region is greater than the average duration of humid heat waves, especially in the northern region of China, where the maximum difference between the dry and humid heat wave HWDs reaches more than 2 days. In addition, Wang et al. [12] revealed that humid heat waves over Southern China are dominated by large-scale circulations similar to those during dry heat waves, while humid heat waves over semi-arid and arid regions are usually accompanied by upward motions (convections), which inhibit the persistence of humid heat waves [12], consistent with the shorter duration of humid heat waves compared to the dry ones.
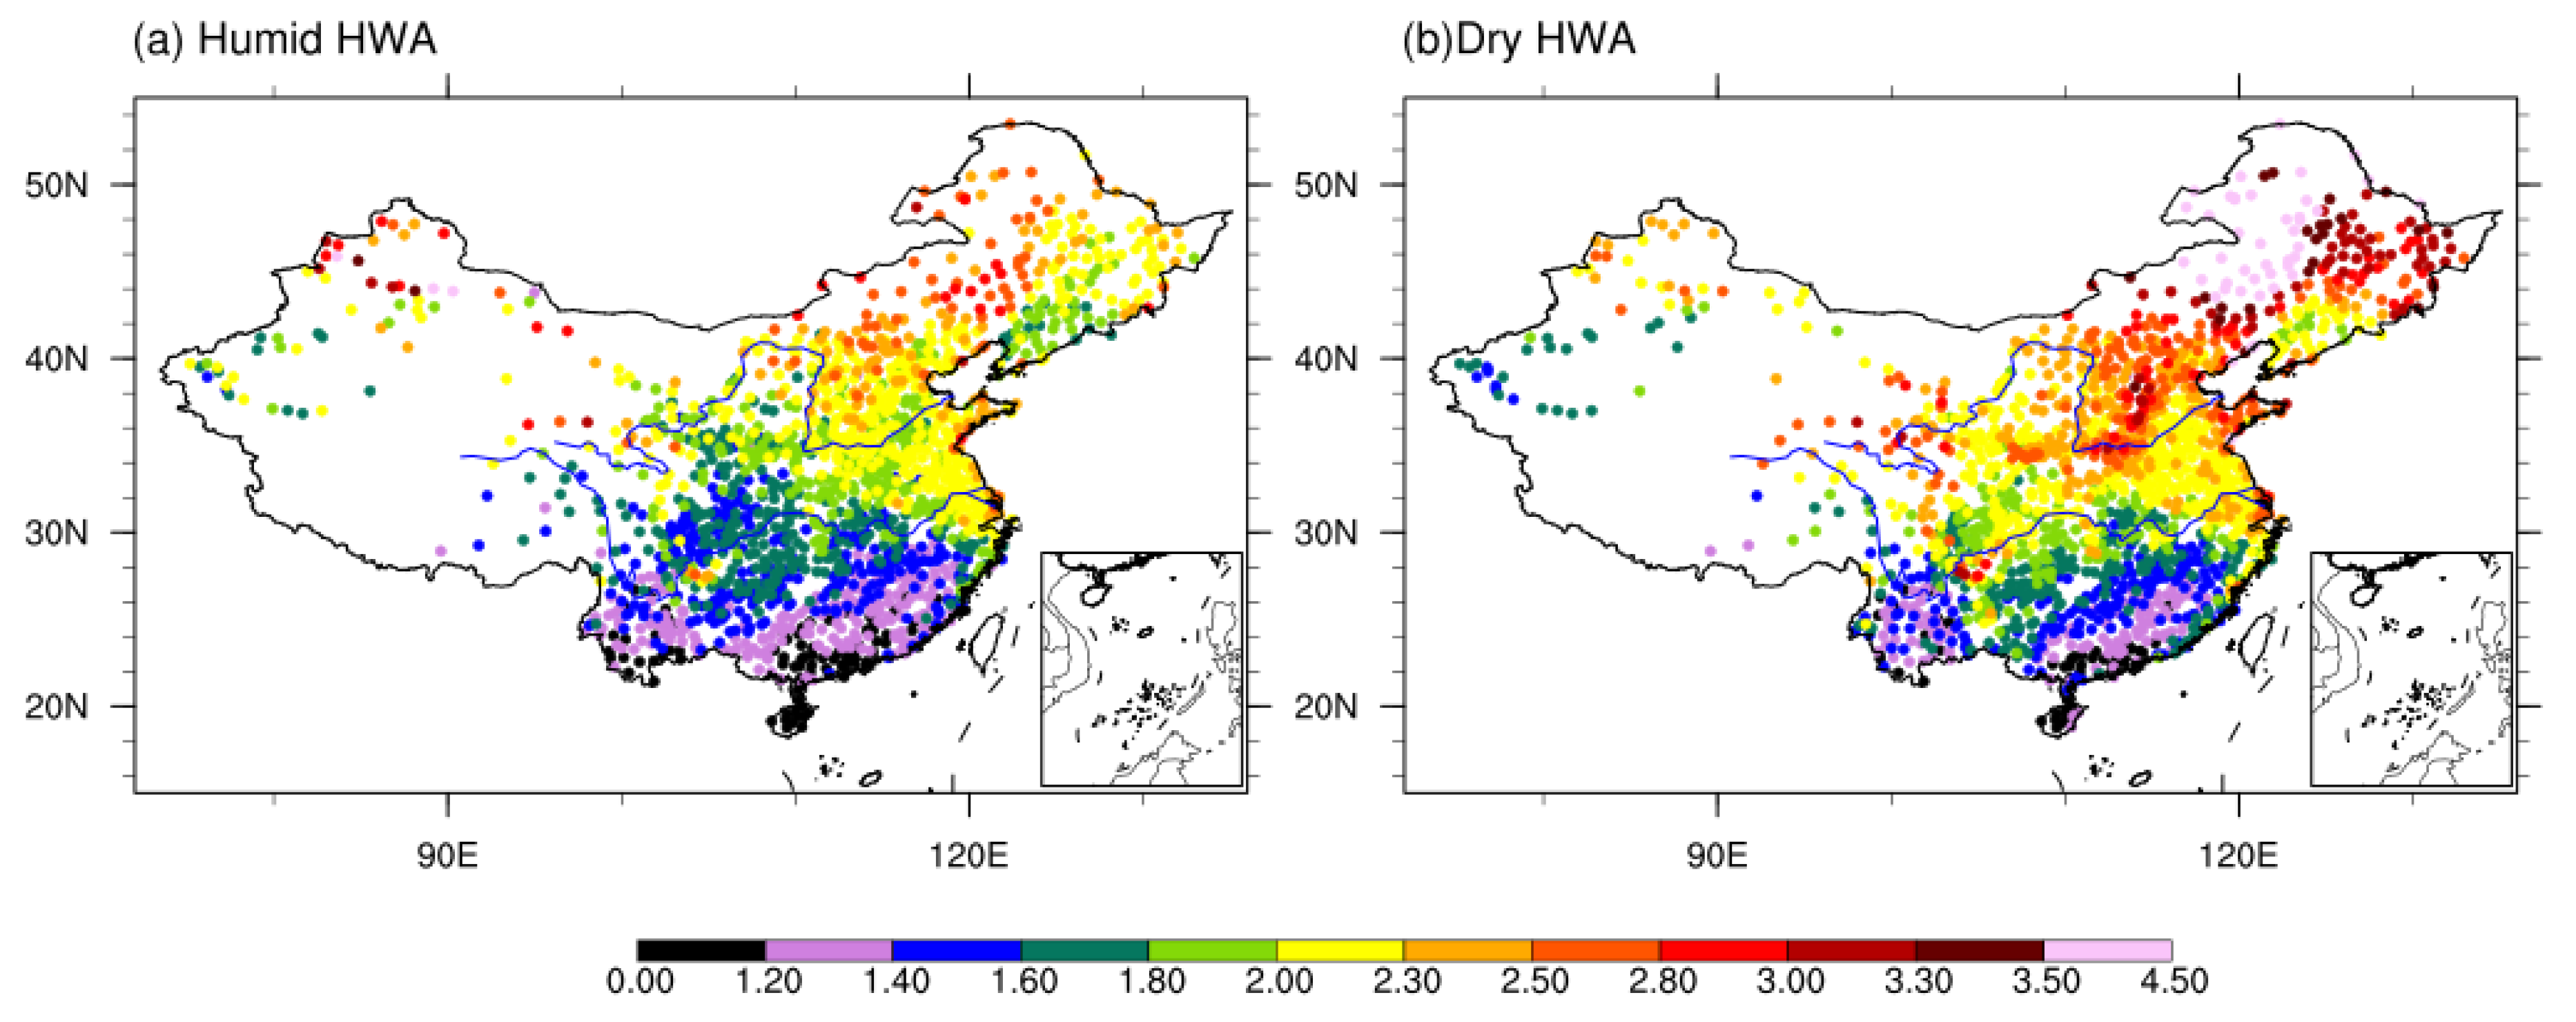
The HWA index of a heat wave represents the average daily temperature value above the threshold temperature during a heat wave event, and the spatial distribution of its climatic state is shown in Figure 5. The spatial characteristics of both the humid and dry HWA show a gradient distribution from south to north, with the largest values occurring in Northeastern China, reaching a maximum of 3.0 °C/day and 3.5 °C/day for humid and dry heat waves, respectively. The HWA minima are located in Southern China, where the minimum amplitude of humid and dry heat waves is less than 2 °C/day, which is consistent with the previous results suggesting that the warming is stronger in the north than in the south. From the overall spatial distribution of the HWA, the HWA values of dry heat waves in China are larger than those of humid heat waves, which indicates that the intensity of dry heat waves in China in summer is stronger than that of humid heat waves, and the phenomenon is more significant in the northern part of China.
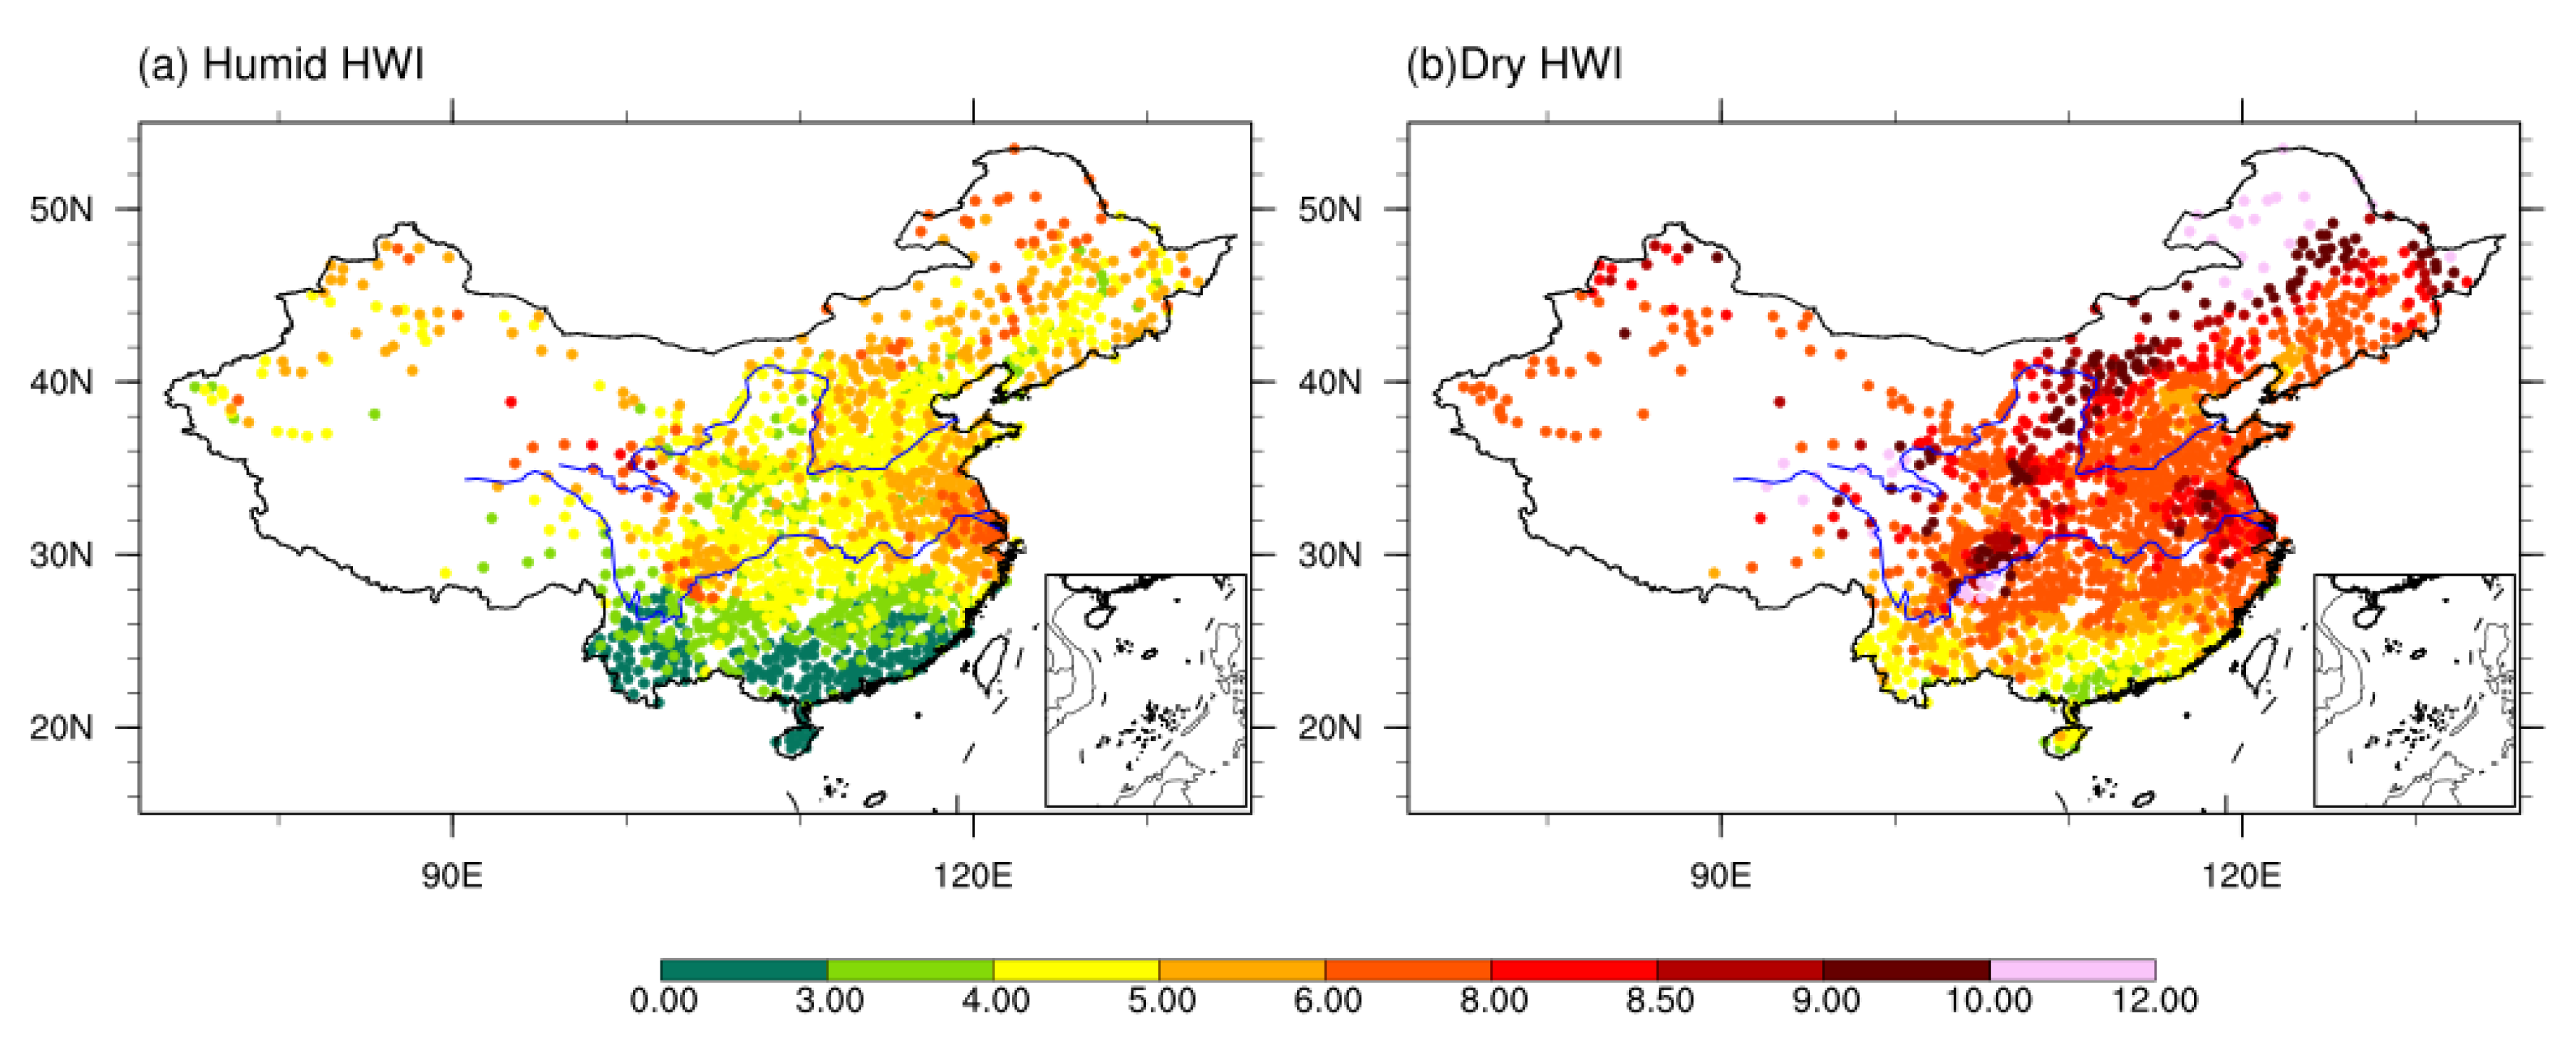
The spatial distribution of the composite indicator intensity (HWI) and frequency (HWF), for the May–September seasonal average over the period 1960–2015, is shown in Figure 6 and Figure 7. As shown in Figure 6a, the intensity of the humid heat wave (HWI) is similar to that of the humid heat wave (HWA), with the annual average maximum area basically located in the upper part of the Yangtze River Basin in China, where the maximum intensity value reaches 12, and a few stations in the north also have a larger heat wave intensity value of 10 °C/event, while the minimum area is located in the Yunnan area, where the intensity value is less than 4. The spatial distribution of the dry heat wave HWI climate state is similar to that of the HWA, and its large-value area is located in Northern China, with the intensity of 12 °C/event. A relative large-value area of dry heat waves is distributed in Southeastern China, with the HWI value of 10. The large values in the southeast are mainly due to the relatively longer duration (HWD) of dry heat waves in the south, while the large-value area in the north is due to the higher maximum amplitude (HWA) of dry heat waves in the north (Figure 6b). In the middle part of the Yellow River Basin, the intensity of the dry heat wave is significantly stronger than that of the humid heat wave, with a difference of 2 °C, which is mainly related to the duration of the dry and humid heat waves (HWD) and the intensity of the heat wave (HWA). Note that the HWTI distribution of dry and humid heat waves in China is consistent with the spatial distribution of the heat wave intensity (HWI) and HWA, with higher values over the northern part of China.
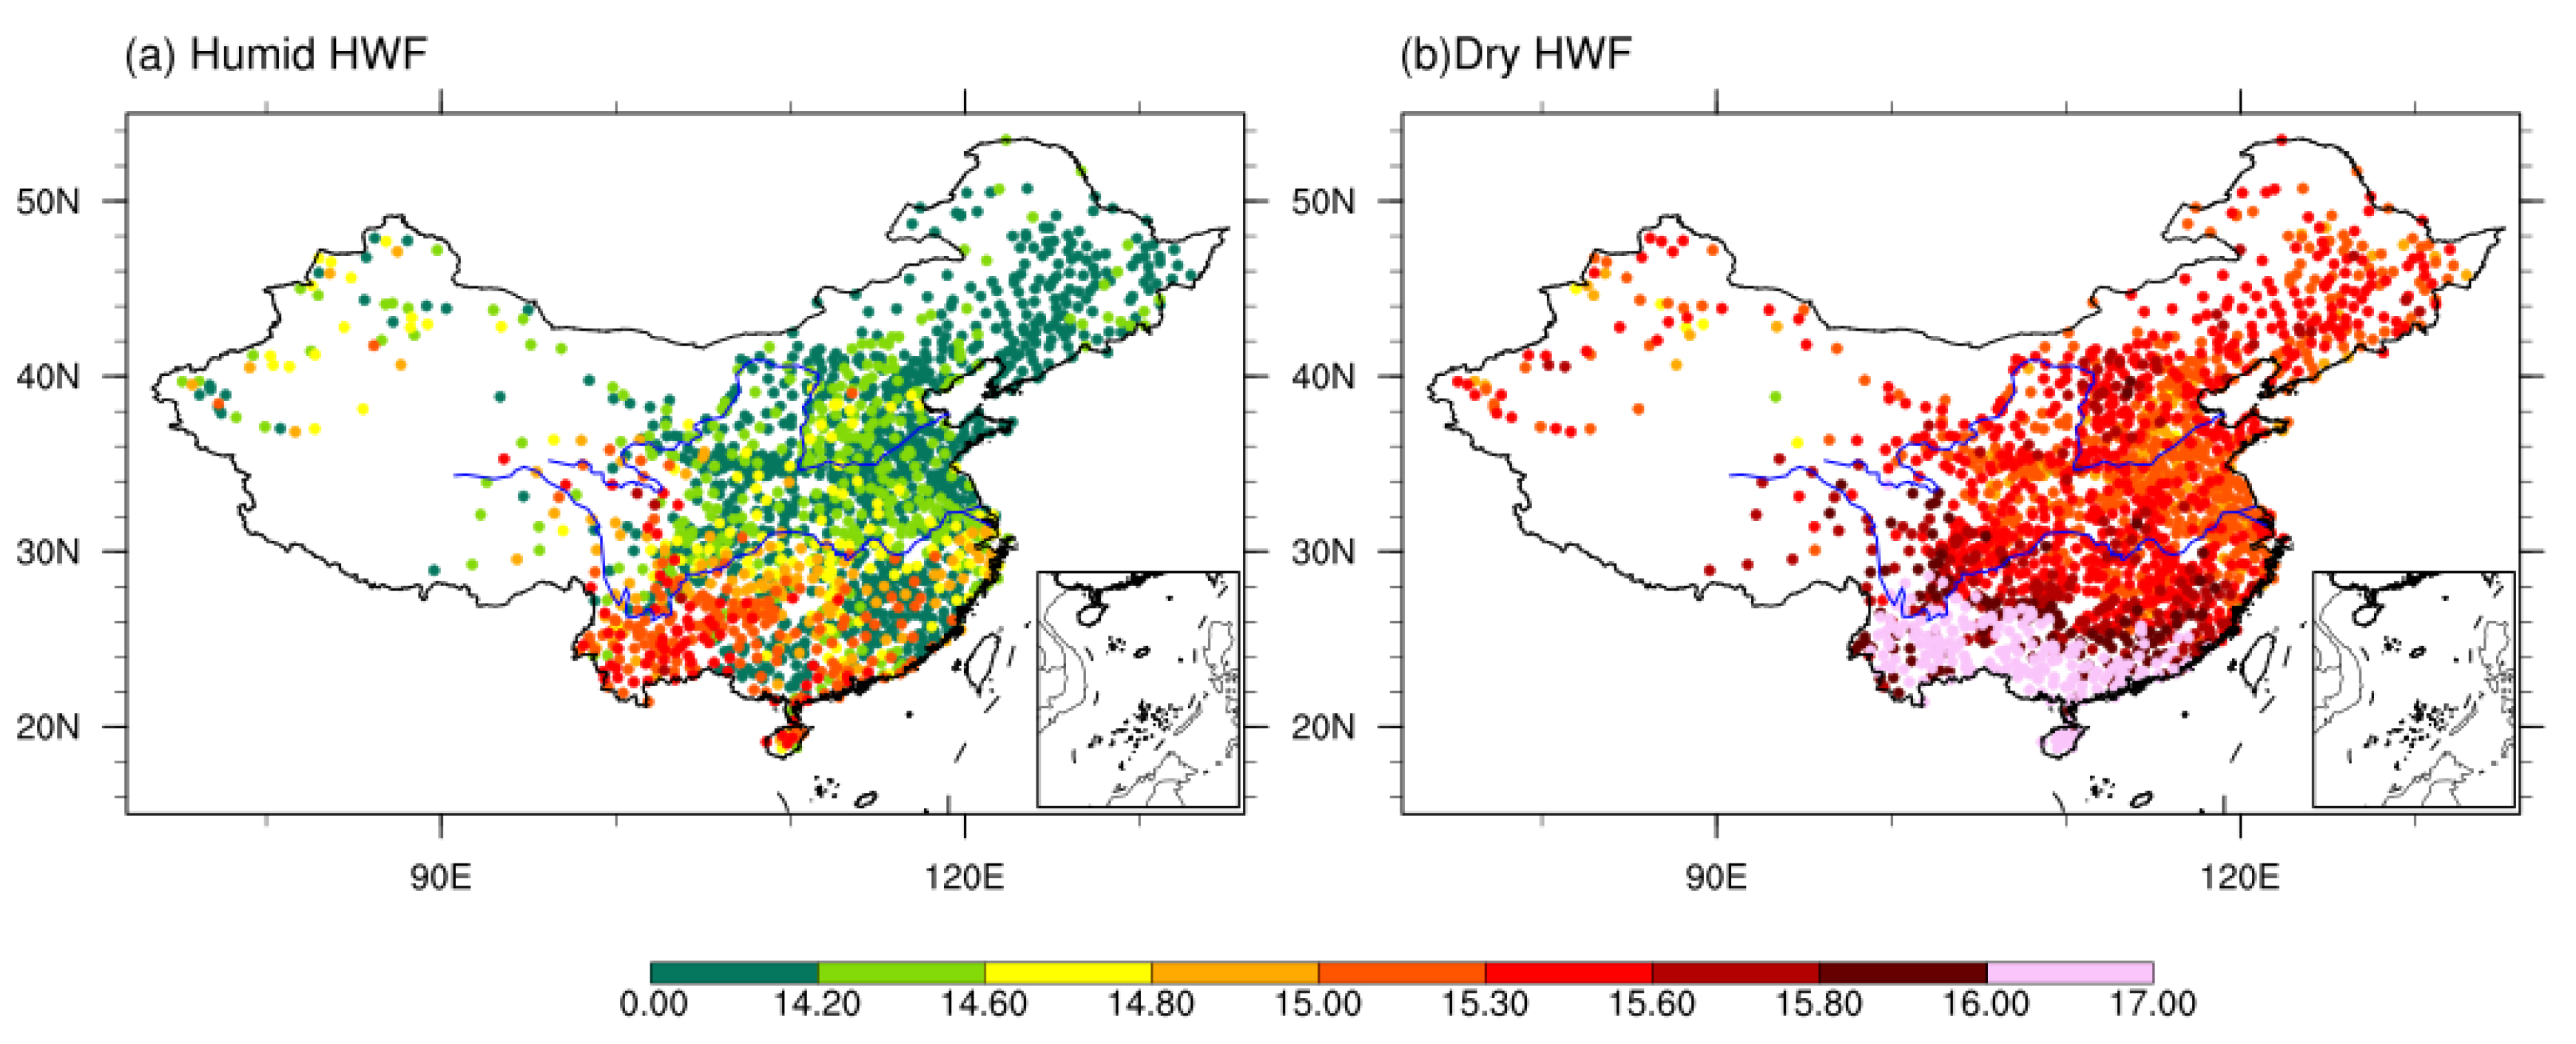
Figure 7 shows the spatial distribution of the heat wave frequency (HWF) from May to September in summer in China from 1960 to 2015. Wang et al. [16] showed that the HWF is a comprehensive indicator that is related to the number of heat waves (HWN) and the duration of heat waves (HWD). Generally speaking, the annual mean number of days of humid heat waves is less than the annual mean number of days of dry heat waves (HWF). As shown in Figure 7a, the annual mean number of days of humid heat wave events shows a spatial pattern of “high in the south and low in the north”, and the frequency of humid heat waves is high in the middle and lower reaches of the Yangtze River and in Southern China, with a maximum heat wave frequency of 16, while the provinces along the Yellow River Basin have a relatively low frequency of humid heat waves, with the frequency of heat waves in some stations being lower than 14.2 days/year, which may be caused by changes in the HWN (Figure 3a), HWD (Figure 4a), and HWI (Figure 6a) simultaneously. In Yunnan, Guangxi, Guangdong, and Hainan, where heat waves occur frequently, the HWF of dry heat waves reaches 17 days per year, while the HWF of humid heat waves is relatively small, at 15.5 days per year. Figure 7b shows that the distribution of dry heat waves is relatively uniform throughout the country, and the overall dry heat wave frequency is higher than 15 days per year, with more days of dry heat waves occurring in the southern region than in the northern region, but the difference in HWF between the north and the south is less than 2 days. Indeed, due to relatively higher humidity, the southern regions also experience more hot nights than the northern part of China.

3.2. Characteristics of Interannual Variability in Dry and Humid Heat Waves

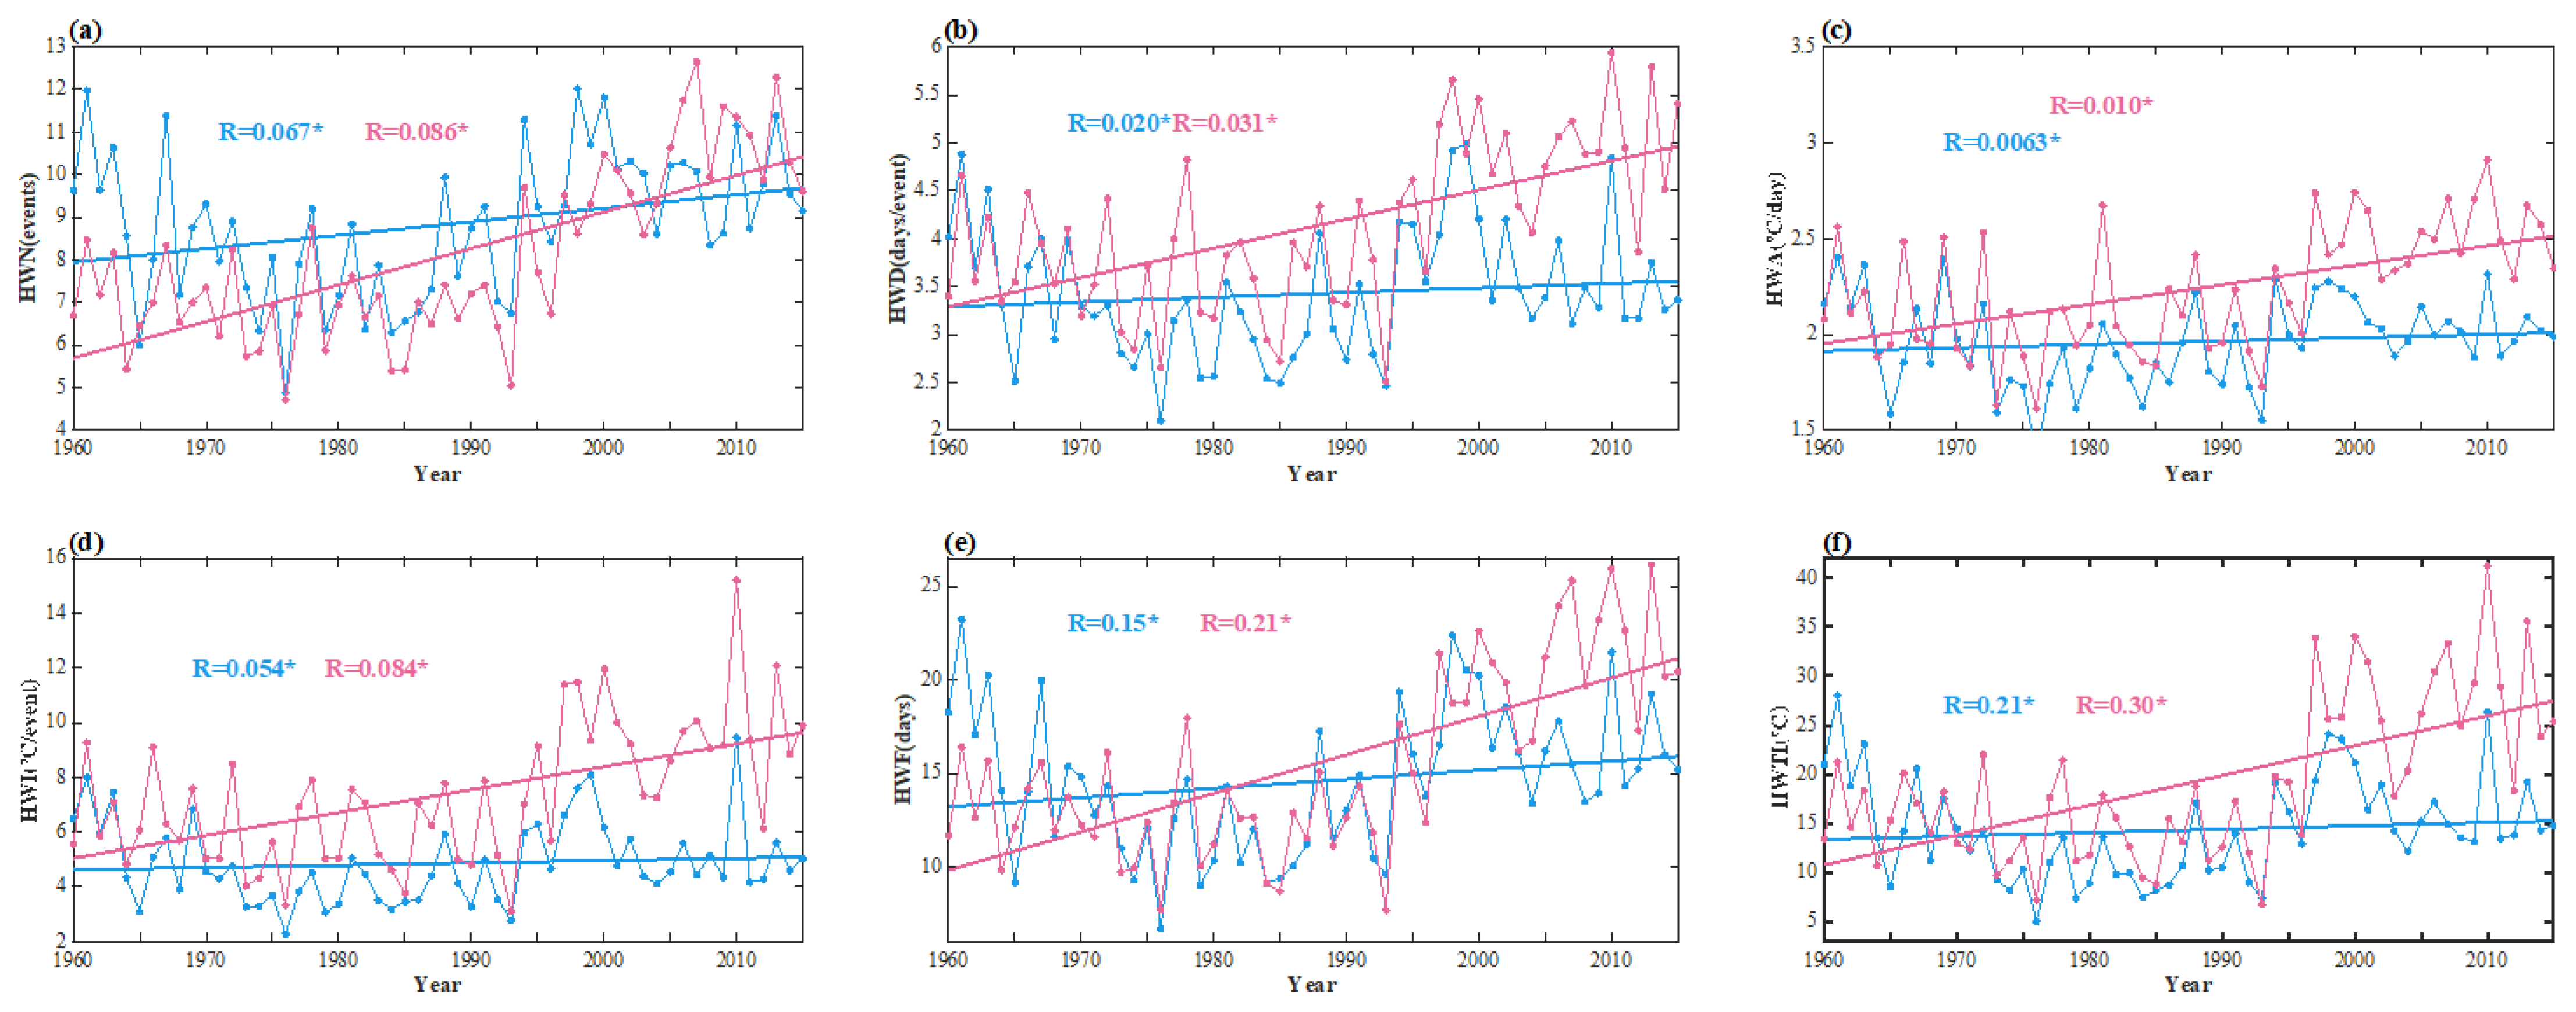
The above discusses the spatial distribution characteristics of the climate states of dry and humid heat waves from various comparative perspectives. In Figure 8, we further give the linear trend of each index, including HWN, HWF, HWD, HWI, HWTI, and HWA, from 1960 to 2015, and use the nonparametric Kendall’s method [24] to estimate the significance of the linear trends at the 95% confidence level. As shown in Figure 9, the annual trends of the dry and humid heat wave indices in China are very similar, i.e., a weak downward trend until the late 1980s, followed by a significant upward trend, and maintained at a high level for many years. The interannual variability of the heat wave indices is higher in 1997, 2010, and 2013, and lower in 1973 and 1993. All trends are significant at the 95% confidence level. The interdecadal variation of heat waves is consistent with the shift in the mean temperature in China around the 1990s [17], and, since the 1990s, more frequent and longer-lasting heat waves have been found for both dry and humid heat waves. All of the heat wave indices in Figure 9 are not independent but are interrelated, although they represent different aspects of heat waves.
Figure 8a–c show the interannual variation of the single metrics HWN, HWD, and HWA, respectively, and we find that the linear trend values of dry heat waves are all larger than those of humid heat waves, i.e., a more significant increase in the number, duration, and maximum number of dry heat waves has occurred in the last 55 years, and that the rate of increase in dry heat waves is higher than that for humid heat waves. Both the dry and humid heat wave HWNs experienced a large and abrupt change in 1994, with the dry heat waves increasing to an average of 9.5 events per year, and the humid heat waves’ maximum interannual number of events reaching 11.5, which is second only to the maximum number of dry heat wave events of 12 in 2010. In addition, dry heat wave events occurred 12.7 times in 2007, the highest number of heat wave events among the years considered in this study (Figure 8a). Prior to 1995, the interannual trends of the dry and humid heat waves’ HWD and HWN were very similar, and both were in a stable up–down range. Since then, humid heat waves have stabilized at HWD values between 3.5 and 4.5 in all years, except for two abrupt increases in 1997 and 2010, while dry heat waves have shown a continuous increasing trend, with a maximum duration of 6 days in 2010 (Figure 8b). Both the dry and humid heat wave HWAs declined weakly until the 1980s and then rose slowly. The maximum heat wave amplitude (HWA) of humid heat waves is consistently larger than that of dry heat waves, probably because humid heat waves are more influenced by temperature factors than dry heat waves. The amplitude of humid heat waves is stronger than that of dry heat waves in the context of increasing air temperatures due to global warming (Figure 8c). The interannual variations of the combined heat wave event indicators HWI, HWF, and HWTI are shown in Figure 8d–f, with the HWI and HWTI showing consistent trends, both decreasing weakly and then significantly increasing. The HWF showed similar trends to the HWD and HWN, fluctuating slightly until the 1990s, and then increasing rapidly after the 1990s.
Based on the above analysis of different aspects of heat waves, it can be concluded that although dry and humid heat waves are two types of thermal events under relative definitions, i.e., the indicator temperatures chosen for their definitions are different, dry and humid heat waves and their frequency, duration, and intensity have increased in China over the past 55 years, especially after the 1990s. These changes are consistent with previous expectations of more frequent, sustained, and intense heat waves discussed by [14,25].

3.3. Future Changes in Dry and Humid Heat Waves within Multi-Indices

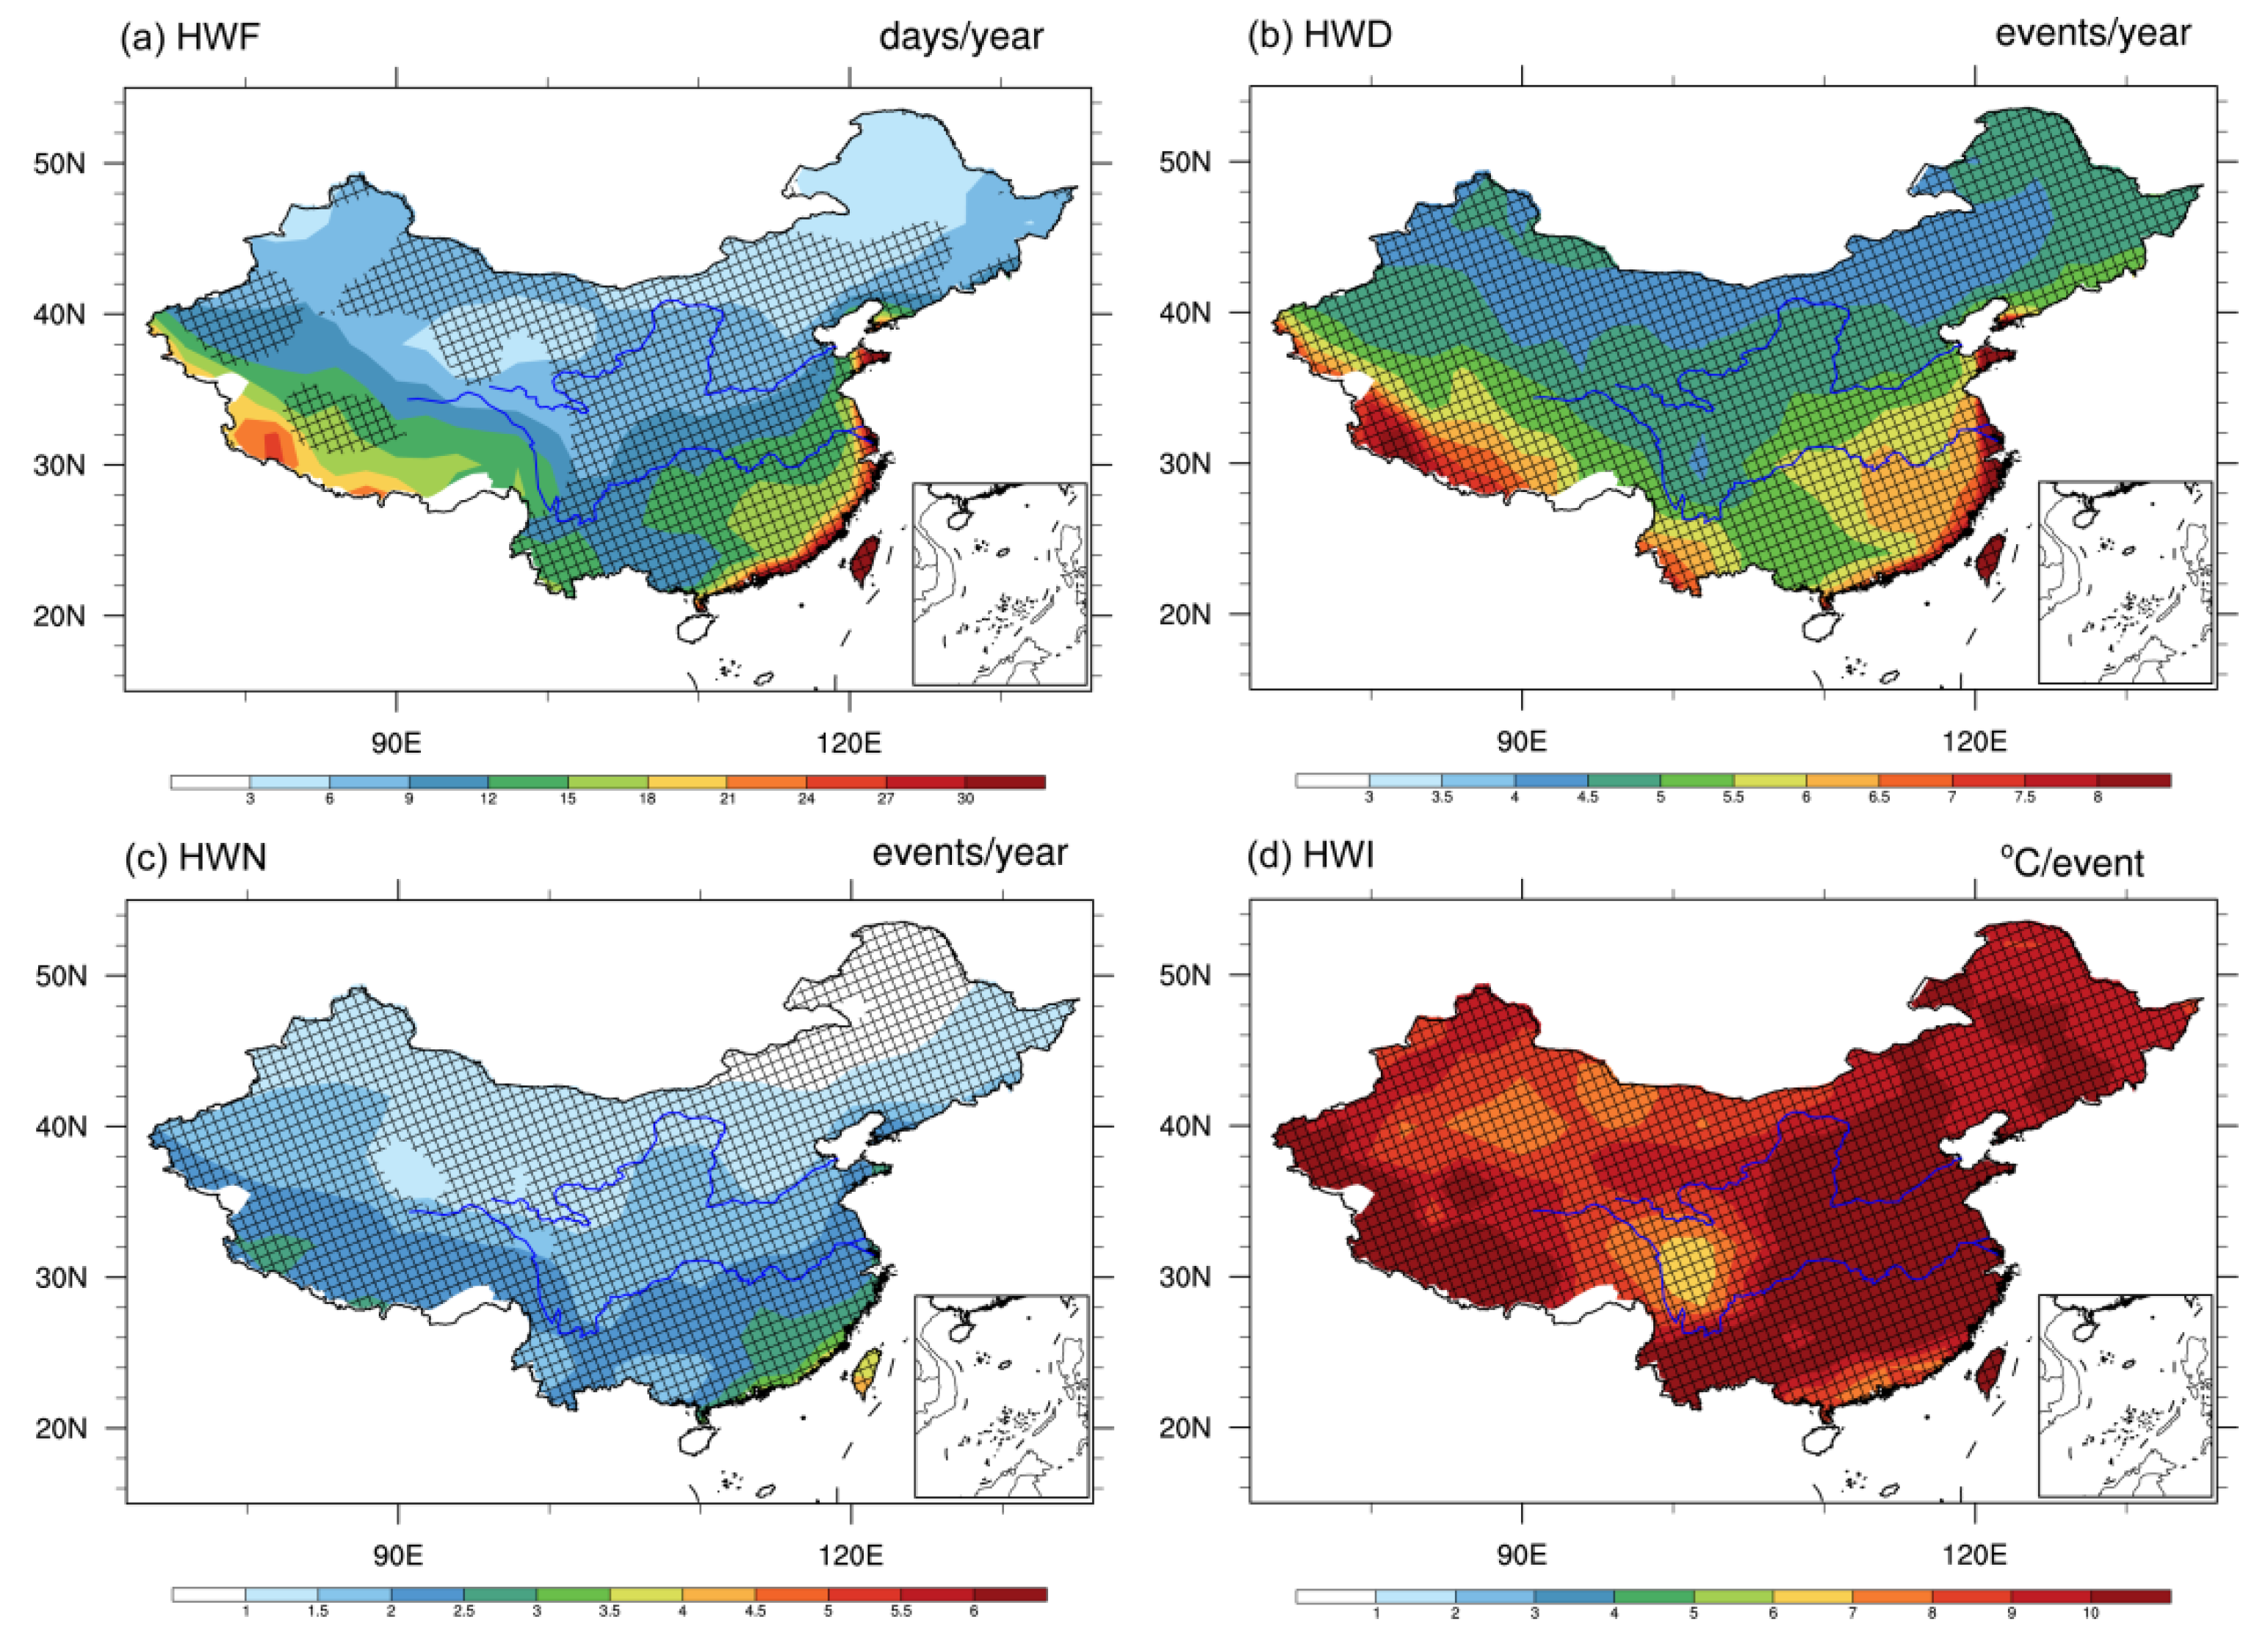
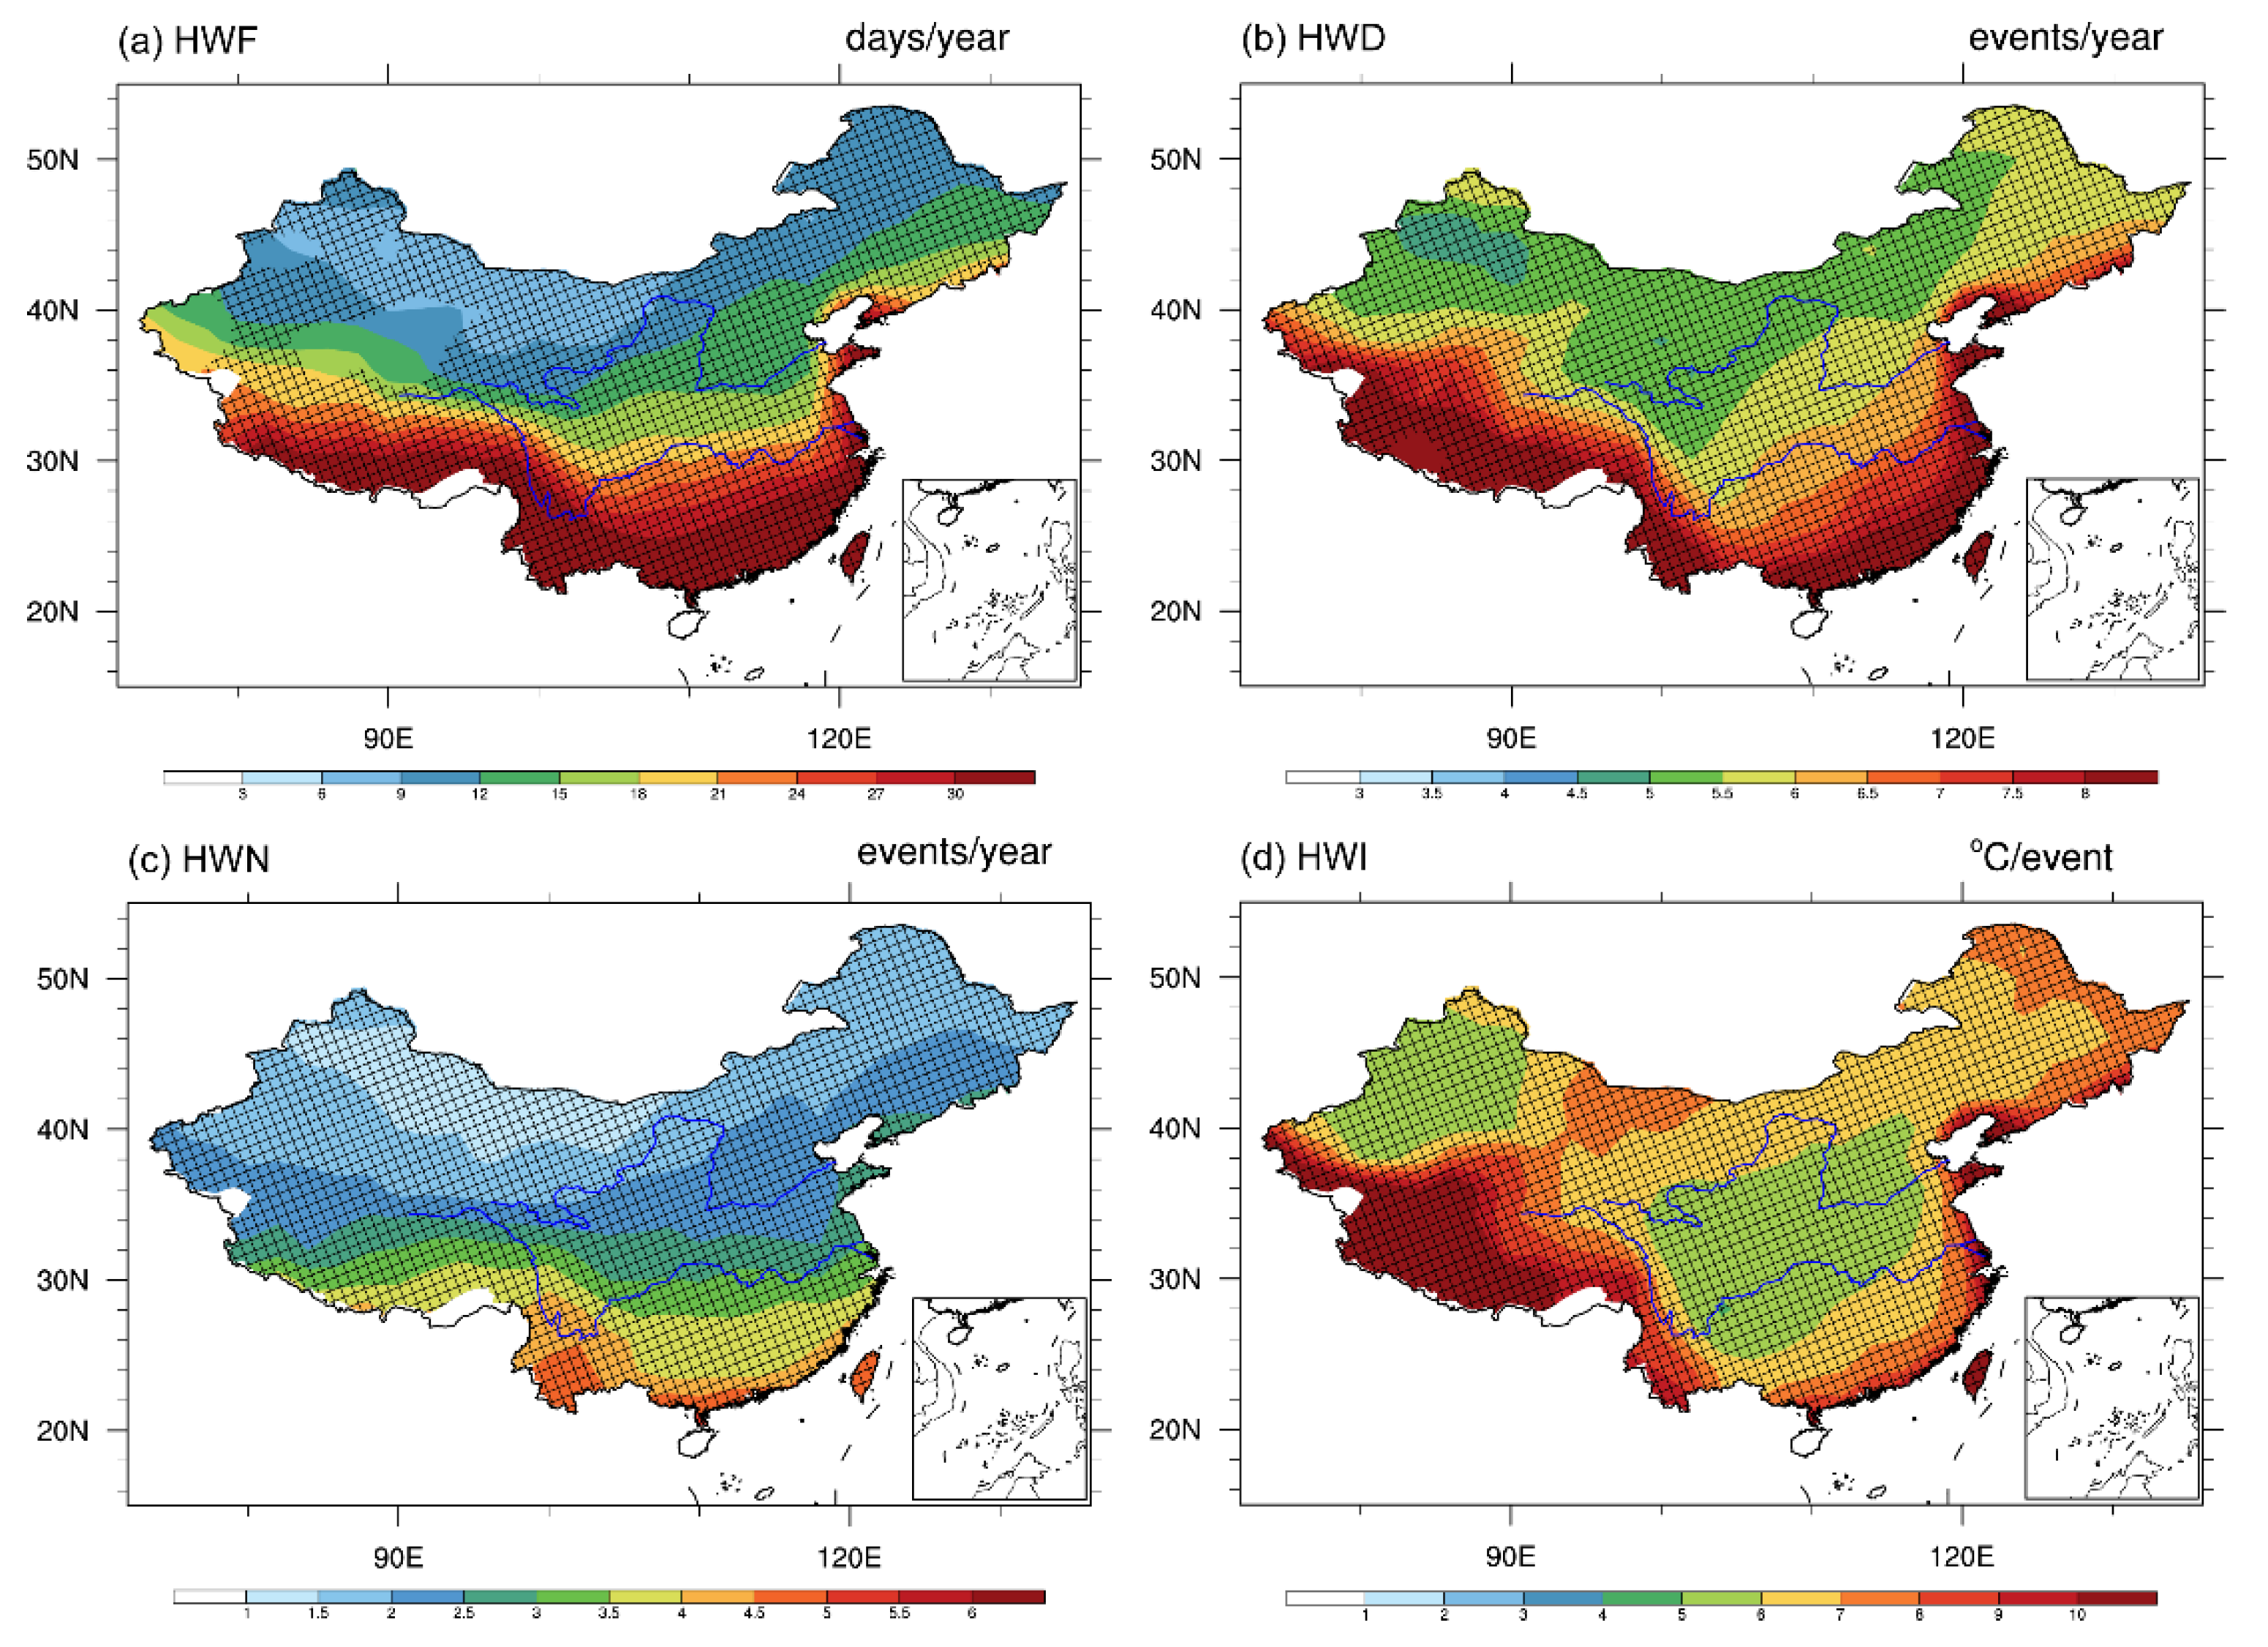
The above analyses focus on the spatial and temporal features of dry and humid heat waves in the observed climatological period. As both extremes are expected to be more severe and frequent in a warming climate, the future changes in dry and humid heat waves need to be further examined. Based on the discussions in the previous sections, here, we only choose the HWF, HWD, HWN, and HWI as the primary characteristics for simplification. First, under the RCP4.5 scenario, the future features of dry heat waves are as displayed in Figure 9. It can be seen that the frequency, duration, and number of dry heat waves all show a “south more, north less” pattern, with the high values being located over Southern China and the southwestern areas of Tibet and low values being located over the northern areas of Xinjiang and Mongolia. However, the intensity of dry heat waves is increased in the whole region of China, which corresponds to the increasing temperature under global warming. As a comparison, the frequency, duration, and number of humid heat waves also show a “south more, north less” pattern, with higher magnitudes than those of dry heat waves (Figure 10). For the intensity of humid heat waves, the pattern is rather different from that of dry heat waves. Although the increased intensity is seen over the whole of China, the higher values are mainly located over south, the coastline, and Tibet.
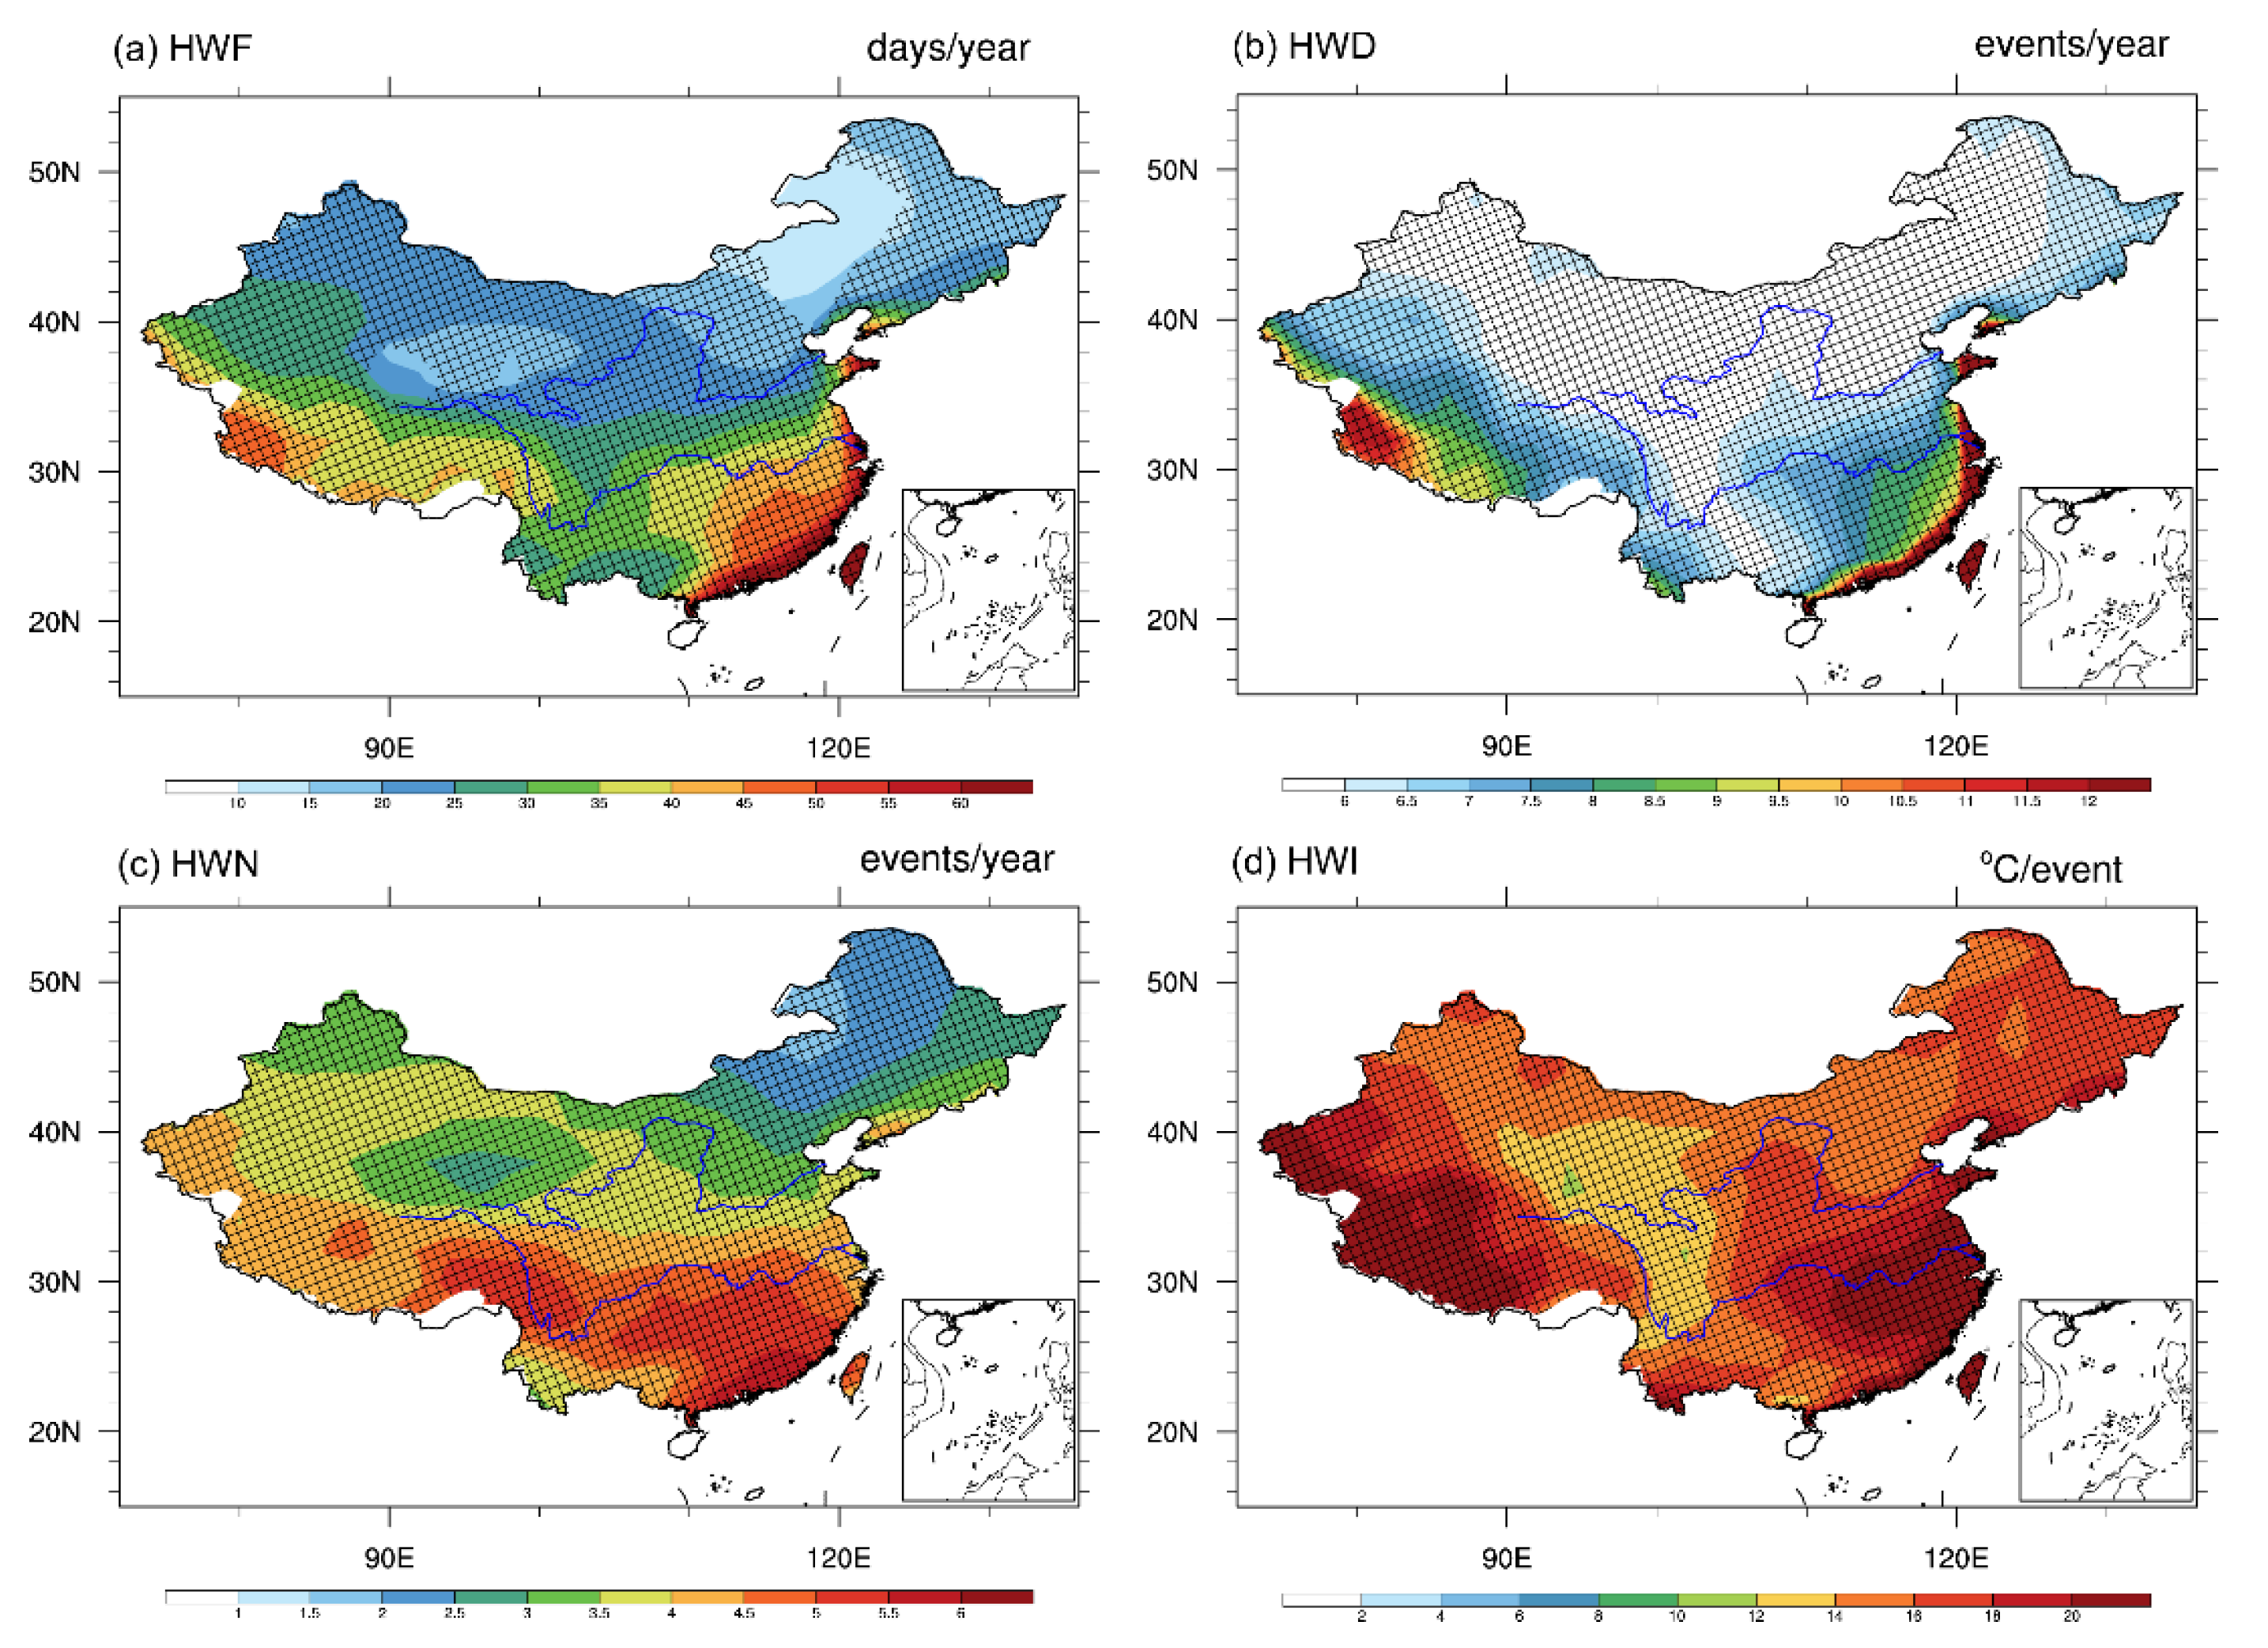
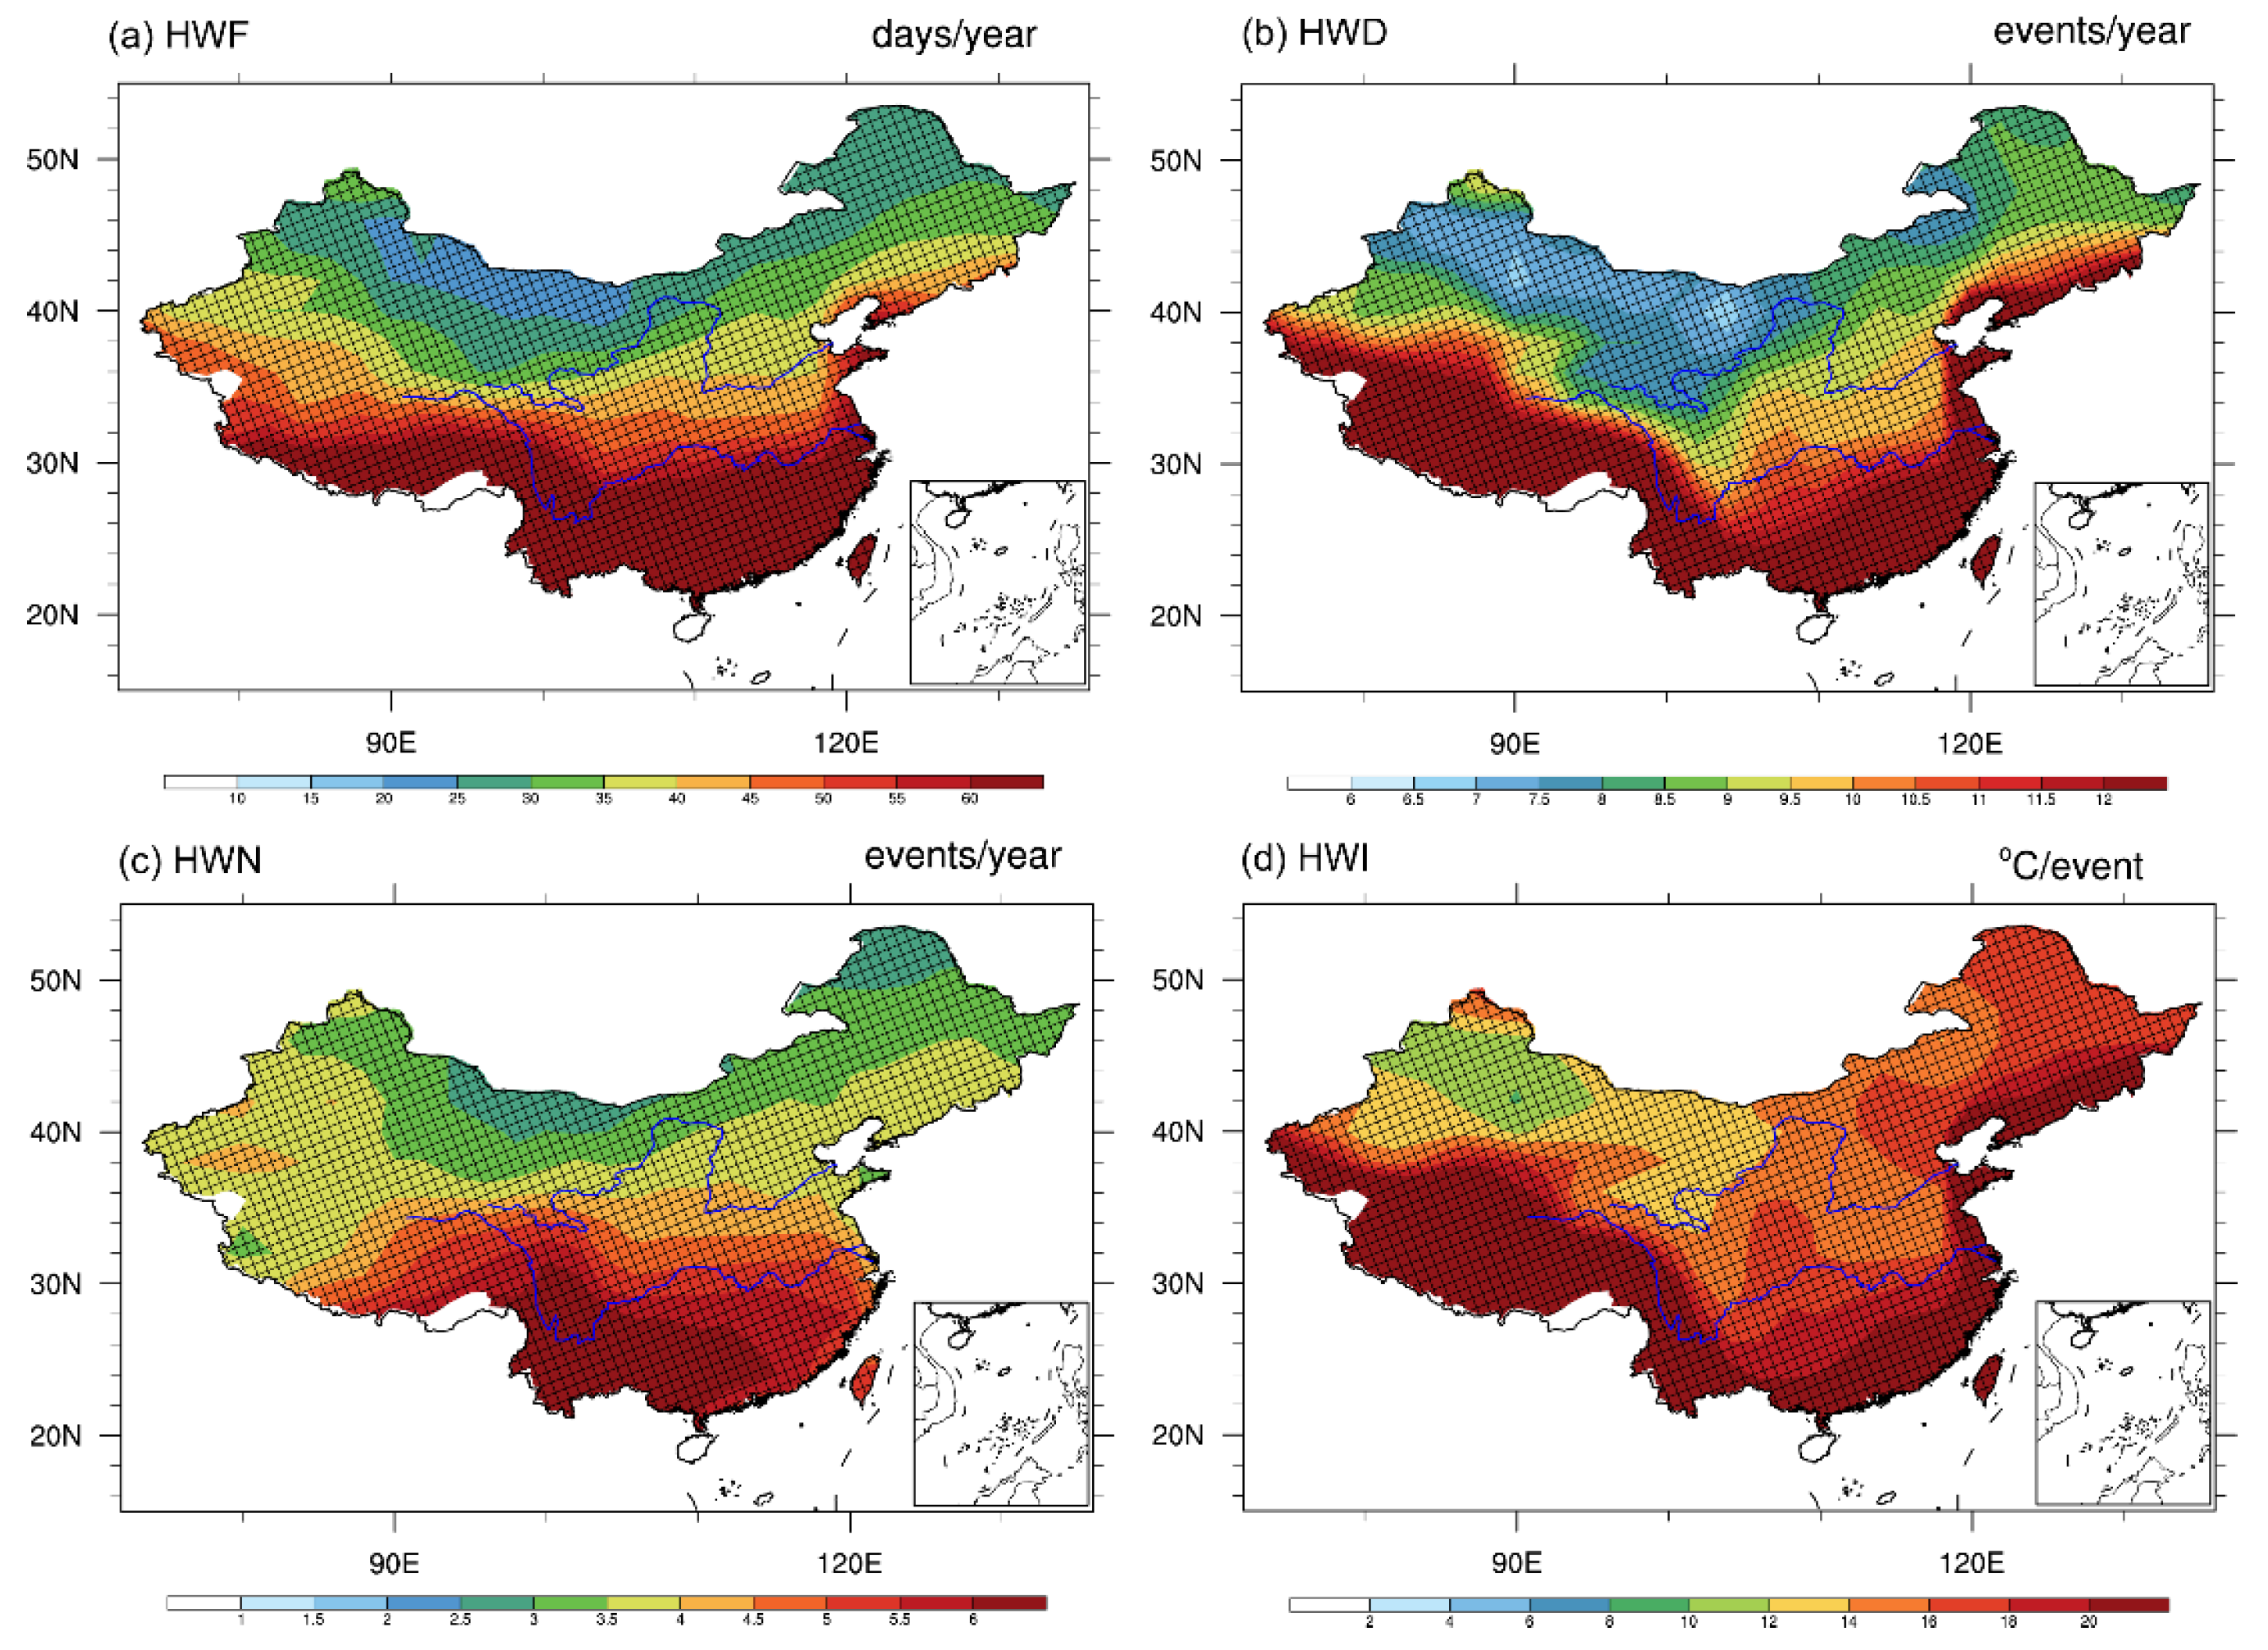
For the case of higher-emission scenarios (RCP8.5), the features of the dry and heat waves indices are shown in Figure 11 and Figure 12, respectively. As shown in Figure 11, the spatial patterns of the frequency, duration, and number of dry heat waves still display a “south more, north less” pattern, but with a higher (almost double) magnitude than that in the RCP4.5 scenario. Especially in the case of the HWN, all the regions show a greater number of heat waves, with higher values over the southern parts of China (more than five times per year). The spatial distributions of the HWF, HWD, HWN, and HWI for humid heat waves under the RCP8.5 scenario (Figure 12) show similar patterns to those under the RCP4.5 scenario, but with more than double the magnitude for all indices according to the values indicated by the color bar. Compared to the dry heat waves (Figure 11), all of the indices have much higher values, especially over the southern regions and the coastline of China, which indicates more severe heat extremes thereof. These results suggest that when the effects of moisture are included, humid heat waves are projected to have a longer duration and higher number, intensity, and frequency than dry heat waves in the future, under both the RCP4.5 and RCP8.5 scenarios. Hence, more areas in China will experience higher-frequency, more intense, and longer-duration humid heat waves with a greater total number of days than dry heat waves in the future.
4. Conclusions and Discussion

Based on the daily Tmax and TW, this paper defines two types of extreme high-temperature events in China, i.e., dry heat wave events and humid heat wave events, and discusses their spatial and temporal characteristics and differences from 1960 to 2015 in terms of six heat wave characteristic indices.
From the overall view of the spatial distribution of China’s dry heat and humid heat, the two types of high-temperature events show a spatial distribution of being more frequent in the southeastern regions and less in the northwestern regions. Dry heat waves mainly occur in Northern China, where the northwest shows the maximum value; a larger-value area is located in Huanghuai and Northern China, most of the humid heat waves occur in Southern China, and the region north of the Yellow River also experiences a relatively large number of humid heat wave events. Spatial and temporal characterizations of the frequency, duration, and intensity of heat waves show that the average annual number of days of occurrence of humid heat waves is generally less than that of dry heat waves, that heat wave events in the Yangtze River Basin last longer than in other regions, and that dry heat waves in the northwestern region last longer. Nationwide, dry heat waves occur more frequently and last longer compared to humid heat waves. The intensity of both dry and humid heat waves in the northern region is higher than that in the southern region, indicating stronger warming in the north than in the south, which is consistent with the fact that the warming in Northern China has been stronger than that in Southern China in recent decades.
Although the spatial distribution of dry and humid heat waves differ significantly, the interannual variation in the mean heat wave index is similar. The linear trends of the heat wave indices for both dry and humid heat waves show a weak decreasing trend until the mid to late 1980s, after which they show a clear increasing trend. The number of heat wave days in most of the stations in China showed an increasing trend, among which a dry heat wave occurred 12 times in 2010, which was the largest annual average occurrence of dry heat waves among the years studied in this work, and the largest frequency of humid heat waves occurred in 2007, with an annual average occurrence of 12.7 times. The average duration of the two types of thermal events is very similar to their frequency. They experienced stable upward and downward fluctuations and continuous increases before and after 1995, respectively, and the maximum annual average duration of the humid heat waves in 2010 even reached 6 days, which was strongly related to the rapid warming of China in the late 1980s. Overall, the years 1997, 2010, and 2013 showed large values, and the years 1973 and 1993 showed small values. This suggests that both dry and humid heat waves in the mid to late 1980s in China became more frequent, long-lasting, and intense. Note that there are significant linkages between humid and dry heat waves, especially in Southern China, as more than 60% (less than 50%) of humid heat wave days are accompanied by dry heat wave days over Southern (Northern) China (figure not shown).
Regarding the future changes, the frequency, duration, and number of dry and heat waves all show a “south more, north less” pattern, with the high values being located over Southern China and relatively low values being located over northern areas. Under different scenarios, all the heat extreme indices are increased in magnitude in specific regions. Meanwhile, the comparison between dry and humid heat waves under different scenarios shows that when the effects of moisture are included, humid heat waves are projected to have a longer duration and higher number, intensity, and frequency than dry heat waves in the future. Hence, more areas in China will experience higher-frequency, more intense, and longer-duration humid heat waves, with a greater total number of days, than dry heat waves in the future.
This study systematically analyzed the spatial and temporal features of dry and heat extremes over China, with consideration of the intensity, duration, number, and frequency of heat waves. Multi-indices were used for the comparison between dry and humid extremes, both in the context of the observed climatology and model simulations including historical and future scenarios within CMIP5 experiments. Although the characteristics of different heat extremes were well displayed, the background mechanism driving the correlated changes was not discussed, as it was beyond the scope of this paper. More analyses of the atmospheric anomalies, external forcing such as sea surface temperature anomalies, and also land–atmosphere processes will be performed in future research.

Author Contributions

Conceptualization, L.W. and L.L.; methodology and formal analysis, L.L., T.F. and J.H.; investigation, L.L. and J.T.; writing—original draft preparation, L.L.; writing—review and editing, L.L. and T.F.; visualization, J.T. and Z.C.; supervision, L.W.; resource: J.H. All authors have read and agreed to the published version of the manuscript.

Funding

This research was funded by State Grid Technology Project, grant number [5200-202319382A-2-3-XG] and The APC was funded by [5200-202319382A-2-3-XG].

Institutional Review Board Statement

Not applicable.

Informed Consent Statement

Not applicable.

Data Availability Statement

In this study, the observed daily station records of temperature were taken from the China Meteorological Data Center (http://data.cma.cn/en/?r=data/detail&dataCode=A.0012.0001, accessed on 25 July 2023.).

Acknowledgments

This research was funded by State Grid Technology Project, grant number [5200-202319382A-2-3-XG]. The authors acknowledge all reviewers for kind and helpful comments. All the data are provided by the China Meteorological Administration (CMA). The atmospheric circulation data can be downloaded from https://rda.ucar.edu/data-sets/ds628.3/#!access, accessed on 26 October 2023.

Conflicts of Interest

The authors declare no conflict of interest.

References

  1. Xu, Z.; FitzGerald, G.; Guo, Y.; Jalaludin, B.; Tong, S. Impact of heatwave on mortality under different heatwave definitions: A systematic review and meta-analysis. Environ. Int. 2016, 89, 193–203. [Google Scholar] [CrossRef] [PubMed]
  2. Luo, M.; Wu, S.; Liu, Z.; Lau, N.C. Contrasting circulation patterns of dry and humid heatwaves over southern China. Geophys. Res. Lett. 2022, 49, e2022GL099243. [Google Scholar] [CrossRef]
  3. Grundstein, A.J.; Ramseyer, C.; Zhao, F.; Pesses, J.L.; Akers, P.; Qureshi, A.; Becker, L.; Knox, J.A.; Petro, M. A retrospective analysis of American football hyperthermia deaths in the United States. Int. J. Biometeorol. 2012, 56, 11–20. [Google Scholar] [CrossRef] [PubMed]
  4. Anderson, G.B.; Bell, M.L. Heat waves in the United States: Mortality risk during heat waves and effect modification by heat wave characteristics in 43 US communities. Environ. Health Perspect. 2011, 119, 210–218. [Google Scholar] [CrossRef] [PubMed]
  5. Sardon, J.P. The 2003 heat wave. Eurosurveillance 2007, 12, 11–12. [Google Scholar] [CrossRef]
  6. Liu, G.; Wu, R.; Sun, S.; Wang, H. Synergistic Contribution of Precipitation Anomalies over Northwestern India and the South China Sea to High Temperature over the Yangtze River Valley. Adv. Atmos. Sci. 2015, 32, 1255–1265. [Google Scholar] [CrossRef]
  7. Peng, R.D.; Bobb, J.F.; Tebaldi, C.; McDaniel, L.; Bell, M.L.; Dominici, F. Toward a quantitative estimate of future heat wave mortality under global climate change. Environ. Health Perspect. 2011, 119, 701–706. [Google Scholar] [CrossRef]
  8. Deng, K.; Jiang, X.; Hu, C.; Chen, D. More frequent summer heat waves in southwestern China linked to the recent declining of Arctic sea ice. Environ. Res. Lett. 2020, 15, 074011. [Google Scholar] [CrossRef]
  9. Wang, Y.; Ren, F.; Zhang, X. Spatial and temporal variations of regional high temperature events in China. Int. J. Climatol. 2014, 34, 3054–3065. [Google Scholar] [CrossRef]
  10. Ning, G.; Luo, M.; Wang, S.; Liu, Z.; Wang, P.; Yang, Y. Dominant modes of summer wet bulb temperature in China. Clim. Dyn. 2022, 59, 1473–1488. [Google Scholar] [CrossRef]
  11. Shi, X.; Lu, C.; Xu, X. Variability and trends of high temperature, high humidity, and sultry weather in the warm season in China during the period 1961–2004. J. Appl. Meteorol. Climatol. 2011, 50, 127–143. [Google Scholar] [CrossRef]
  12. Wang, P.; Leung, L.R.; Lu, J.; Song, F.; Tang, J. Extreme wet-bulb temperatures in China: The significant role of moisture. J. Geophys. Res. Atmos. 2019, 124, 11944–11960. [Google Scholar] [CrossRef]
  13. Davies-Jones, R. An efficient and accurate method for computing the wet-bulb temperature along pseudoadiabats. Mon. Weather. Rev. 2008, 136, 2764–2785. [Google Scholar] [CrossRef]
  14. Wang, P.; Tang, J.; Sun, X.; Wang, S.; Wu, J.; Dong, X.; Fang, J. Heat waves in China: Definitions, leading patterns, and connections to large-scale atmospheric circulation and SSTs. J. Geophys. Res. Atmos. 2017, 122, 10–679. [Google Scholar] [CrossRef]
  15. Russo, S.; Dosio, A.; Graversen, R.G.; Sillmann, J.; Carrao, H.; Dunbar, M.B.; Singleton, A.; Montagna, P.; Barbola, P.; Vogt, J.V. Magnitude of extreme heat waves in present climate and their projection in a warming world. J. Geophys. Res. Atmos. 2014, 119, 12–500. [Google Scholar] [CrossRef]
  16. Barriopedro, D.; García–Herrera, R.; Ordóñez, C.; Miralles, D.G.; Salcedo–Sanz, S. Heat waves: Physical understanding and scientific challenges. Rev. Geophys. 2023, 61, e2022RG000780. [Google Scholar] [CrossRef]
  17. Zhang, Q.; Yao, Y.; Li, Y.; Huang, J.; Ma, Z.; Wang, Z.; Wang, S.; Wang, Y.; Zhang, Y. Causes and changes of drought in China: Research progress and prospects. J. Meteorol. Res. 2020, 34, 460–481. [Google Scholar] [CrossRef]
  18. Smith, T.T.; Zaitchik, B.F.; Gohlke, J.M. Heat waves in the United States: Definitions, patterns and trends. Clim. Chang. 2013, 118, 811–825. [Google Scholar] [CrossRef]
  19. Steadman, R.G. A universal scale of apparent temperature. J. Clim. Appl. Meteorol. 1984, 23, 1674–1687. [Google Scholar] [CrossRef]
  20. Lu, R.Y.; Chen, R.D. A review of recent studies on extreme heat in China. Atmos. Ocean. Sci. Lett. 2016, 9, 114–121. [Google Scholar] [CrossRef]
  21. Yao, R.; Hu, Y.; Sun, P.; Bian, Y.; Liu, R.; Zhang, S. Effects of urbanization on heat waves based on the wet-bulb temperature in the Yangtze River Delta urban agglomeration, China. Urban Clim. 2022, 41, 101067. [Google Scholar] [CrossRef]
  22. Lin, W.; Wen, C.; Wen, Z.; Gang, H. Drought in Southwest China: A review. Atmos. Ocean. Sci. Lett. 2015, 8, 339–344. [Google Scholar]
  23. Li, J.; Ding, T.; Jia, X.; Zhao, X. Analysis on the extreme heat wave over China around Yangtze River region in the summer of 2013 and its main contributing factors. Adv. Meteorol. 2015, 15, 1–15. [Google Scholar] [CrossRef]
  24. Sen, P.K. Estimates of the regression coefficient based on Kendall’s tau. J. Am. Stat. Assoc. 1968, 63, 1379–1389. [Google Scholar] [CrossRef]
  25. Ding, T.; Qian, W.; Yan, Z. Changes in hot days and heat waves in China during 1961–2007. Int. J. Climatol. 2010, 30, 1452–1462. [Google Scholar] [CrossRef]
Figure 1. Spatial distribution of climatological mean daily maximum wet bulb temperature TW (°C) from May to September, 1960–2015.
Atmosphere 14 01660 g001
Figure 2. Spatial distributions of climatological mean daily maximum temperature (°C) from May to September, 1960–2015.
Atmosphere 14 01660 g002
Figure 3. Spatial distributions of seasonal averages of (a) humid and (b) dry HWN (events/year) during 1960–2015.
Atmosphere 14 01660 g003
Figure 4. Spatial distributions of seasonal averages of (a) humid and (b) dry HWD (days/event) during 1960–2015.
Atmosphere 14 01660 g004
Figure 5. Spatial distributions of seasonal averages of (a) humid HWA and (b) dry HWA (°C/day) during 1960–2015.
Atmosphere 14 01660 g005
Figure 6. Spatial distributions of seasonal mean (a) humid and (b) dry HWI (°C/event) during 1960–2015.
Atmosphere 14 01660 g006
Figure 7. Spatial distributions of seasonal averages of (a) humid and (b) dry HWF (days/year) during 1960–2015.
Atmosphere 14 01660 g007
Figure 8. Annual mean of (a) HWN, (b) HWD, (c) HWA, (d) HWI, (e) HWF, and (f) HWTI for dry and humid heat waves over time, where the value R denotes the linear trend of interannual variability over a period of 55 years. (*) denotes the values at 95% significance level, with the solid blue line denoting humid heat waves and the solid red line denoting dry heat waves.
Atmosphere 14 01660 g008
Figure 9. Future changes in different heat indices based on dry heat waves in the MME under the RCP4.5 scenario, including the spatial pattern of (a) mean HWF (days/year), (b) HWD (days/event), (c) HWN (events/year), and (d) HWI (°C/event).
Atmosphere 14 01660 g009
Figure 10. Future changes in different heat indices based on humid heat waves in the MME under the RCP4.5 scenario, including the spatial pattern of (a) mean HWF (days/year), (b) HWD (days/event), (c) HWN (events/year), and (d) HWI (°C/event).
Atmosphere 14 01660 g010
Figure 11. Future changes in different heat indices based on dry heat waves in the MME under the RCP8.5 scenario, including the spatial pattern of (a) mean HWF (days/year), (b) HWD (days/event), (c) HWN (events/year), and (d) HWI (°C/event).
Atmosphere 14 01660 g011
Figure 12. Future changes in different heat indices based on humid heat waves in the MME under the RCP8.5 scenario, including the spatial pattern of (a) mean HWF (days/year), (b) HWD (days/event), (c) HWN (events/year), and (d) HWI (°C/event).
Atmosphere 14 01660 g012
Table 1. Basic information for the selected 15 CMIP5 GCMs.
ModelInstitute/Country Grid   ( Lat × Lon)
ACCESS1-0CSIRO-BOM/Australia145 × 192
ACCESS1-3CSIRO-BOM/Australia145 × 192
BCC-CSM1-1BCC/China64 × 128
CANESM2CCCMA/Canada64 × 128
CNRM-CM5CNRM-CERFACS/France128 × 256
CSIRO-MK3-6-0CSIRO-QCCCE/Australia96 × 192
FGOALS-G2LASG-IAP/China64 × 128
GFDL-CM3NOAA-GFDL/United States90 × 144
GFDL-ESM2MNOAA-GFDL/United States90 × 144
IPSL-CM5A-LRIPSL/France96 × 96
IPSL-CM5A-MRIPSL/France143 × 144
MIROC5MIROC/Japan128 × 256
MIROC-ESMMIROC/Japan64 × 128
MRI-CGCM3MRI/Japan160 × 320
NORESM1-MNCC/Norway96 × 144
Table 2. Definitions of different heat wave indices.
IndexDefinitionTypeUnits
HWNNumber of HWsSingleTimes
HWDDuration of HWsSingleDays/time
HWAAmplitude of HWsSingle°C/day
HWIIntensity of HWsComprehensive°C/time
HWFFrequency of HWsComprehensiveDays
HWTITotal intensity of HWsComprehensive°C
Disclaimer/Publisher’s Note: The statements, opinions and data contained in all publications are solely those of the individual author(s) and contributor(s) and not of MDPI and/or the editor(s). MDPI and/or the editor(s) disclaim responsibility for any injury to people or property resulting from any ideas, methods, instructions or products referred to in the content.