Article

Effects of Ocean-Land Thermal Contrast on the Organized Cloud: Preliminary Results from a Squall Line Case on Hainan Island

1
Key Laboratory for Aerosol-Cloud-Precipitation of China Meteorological Administration, Collaborative Innovation Center on Forecast and Evaluation of Meteorological Disasters (CIC-FEMD), Nanjing University of Information Science and Technology, Nanjing 210044, China
2
College of Ocean and Meteorology, Guangdong Ocean University, Zhanjiang 524088, China
3
State Key Laboratory of Severe Weather, Chinese Academy of Meteorological Sciences, Beijing 100081, China
*
Author to whom correspondence should be addressed.
Atmosphere 2023, 14(11), 1651; https://doi.org/10.3390/atmos14111651
Submission received: 12 August 2023 / Revised: 19 October 2023 / Accepted: 31 October 2023 / Published: 3 November 2023
(This article belongs to the Special Issue Microphysics of Cloud Processes (MCP))

Abstract

:
Using the high-resolution numerical weather research and forecasting (WRF) model, study the squall line process that occurred on Hainan Island on 22 April 2020. The findings indicate that high terrain blocks the swift accumulation of water vapor carried by the sea breeze and aids in preserving the accumulated water vapor. According to the sensitivity experiment, terrain height has minimal impact on the macroscopic effects of mesoscale weather processes. However, it does influence where the sea breeze converges. During this process, the ocean-land thermal contrast not only takes the main responsibility for the sea breeze but also leads to uplift motion, which affects the formation, intensity, and duration of the squall line. Additionally, the unstable conditions suggest that a thermal and dynamic environment promote the scale of this squall line. Utilizing the Rotunno–Klemp–Weisman theory (RKW), this study analyzes the effects of the cold pool and vertical wind shear. The analysis reveals that significant vertical wind shear at lower levels and the ground-cold pool contribute to the sustenance and growth of the squall line system. This squall line process has had the greatest impact on the Haikou area due to the strong low-level vertical wind shear and prolonged interaction with the cold pool. When the interaction between the cold pool and the vertical wind shear weakens, the squall dissipates.

1. Introduction

The development of squall line systems is a complex process that is often accompanied by disastrous weather conditions, such as thunderstorms, gales, heavy precipitation, and hail. Many squall-line events have occurred around the world. These events possess substantial destructive power, posing a serious threat to the safety of humans, property, and national economic infrastructure. Squall lines have always presented forecasting challenges, highlighting the importance of research in this area [1].
Numerous scholars have conducted extensive research on the internal structure and life cycle of squall lines since the mid-20th century. Fujita (2010) developed a model examining the impact of vertical wind shear on squall lines, which provided insights into their internal structure [2]. Additionally, Rotunno et al., (1988) identified the positive influence of wind shear and cold pools at different altitudes on the maintenance of squall lines [3]. Through numerical experimentation, Fovell et al., (1988) showed that strong vertical wind shear supports the formation of squall line bands [4]. Johnson (1988) proposed that a pronounced wake low appears at the back edge of the surface stratiform precipitation area, which can be attributed to subsidence warming [5]. Carbone et al., (1990) observed that mesoscale convergence lines in the boundary layer facilitate the initiation and progression of squall line processes [6]. Laird et al., (1995), on the other hand, indicated that the convergence of sea breezes induced by thermal differences contributes to the occurrence of intense convective weather [7]. Furthermore, Dutta et al., (2020) demonstrate the effectiveness of utilizing high-resolution mesoscale models and suitable microphysical schemes for simulating squall lines [8].
The formation and development of squall lines are influenced by environmental factors and dynamic structures. Houze (1977) explained the dynamical structures of a squall line system [9]. Ding et al., (1982) conducted a study on the background weather, triggers, and the physical conditions of squall lines. They identified four types of background weather in China: the trough back type, front trough type, high back type, and typhoon inverted trough or easterly wave type [10]. Yao et al., (2005) found that strong wind vertical shear and the positive feedback of updraft and downdraft in thunderstorms lengthen the duration of squall line systems [11]. Wang et al., (2012) emphasized the importance of the interaction between the self-organizing structure of squall lines and environmental inflow for their development and maintenance [12]. Wang (2013) highlighted the temperature difference between the sea and land as a significant factor in the intensification of the sea-land breeze and the occurrence of local strong convection [13]. In the early stages of a thunderstorm, Wang (2013) demonstrated the correspondence between the sea breeze convergence zone, caused by uneven heating of the underlying surface, and the subsequent excessive cumulative precipitation in the thunderstorm area [14]. Su et al., (2016) noted that the level of free convection on Hainan Island is consistently low, and simple sea breeze convergence often triggers strong local thunderstorms [15]. Through numerical simulation, Huang et al., (2018) identified the long-term maintenance of cold pools as a crucial factor influencing the duration and intensity of squall line processes [16]. Furthermore, Lu et al., (2019) explained how abundant water vapor in the middle and late stages of convective development contributes to the maintenance of the squall line shape and intensity [17].
Weather models, as a means of studying weather processes, are also extensively employed to examine squall lines. Bryan G.H. (2011) used four different microphysical setups and three different horizontal grid spaces and found that squall lines are sensitive to both microphysical setup and horizontal resolution [18]. Lu J. (2022) used the weather research and forecasting (WRF) model coupled with an explicit electrification lightning scheme (E-WRF) to simulate radar reflectivity, which reasonably captured the whole squall line evolution, including the merging of individual cells and storms [19]. Cholette M. (2023) combined triple-moment ice with a predicted liquid fraction of mixed-phase hydrometeors and found that the simulation of mixed-phase particles results in a faster squall line propagation speed and a stronger cold pool [20].
The study of squall lines often overlooks islands surrounded by the sea, such as Hainan. As a result of its tropical location, complex underlying surfaces, and high water vapor content, Hainan Island experiences unique and intricate local convective weather patterns. This paper aims to address this gap by conducting a numerical simulation experiment using the high-resolution WRF model to study a squall line process that occurred on Hainan Island on 22 April 2020. The objective is to explain the reasons for its generation and maintenance and the associated physical mechanisms involved. This may aid in operational forecasts of the squall line over the islands.

2. Data and Methods

2.1. Squall Line Situation

The observational data on mosaics of radar reflectivity were used to identify the squall line that occurred on Hainan Island. In this study, the radar data were downloaded from the China Meteorological Data Network (http://data.cma.cn/ accessed on 22 April 2020). The radar reflectivity of these radar mosaic maps was derived from C band and S band (Figure 1), and this paper focuses on the S-band radar from the Haikou Meteorological Radar Station, which has a scanning radius of 150 km and a scanning cycle of 6 min.
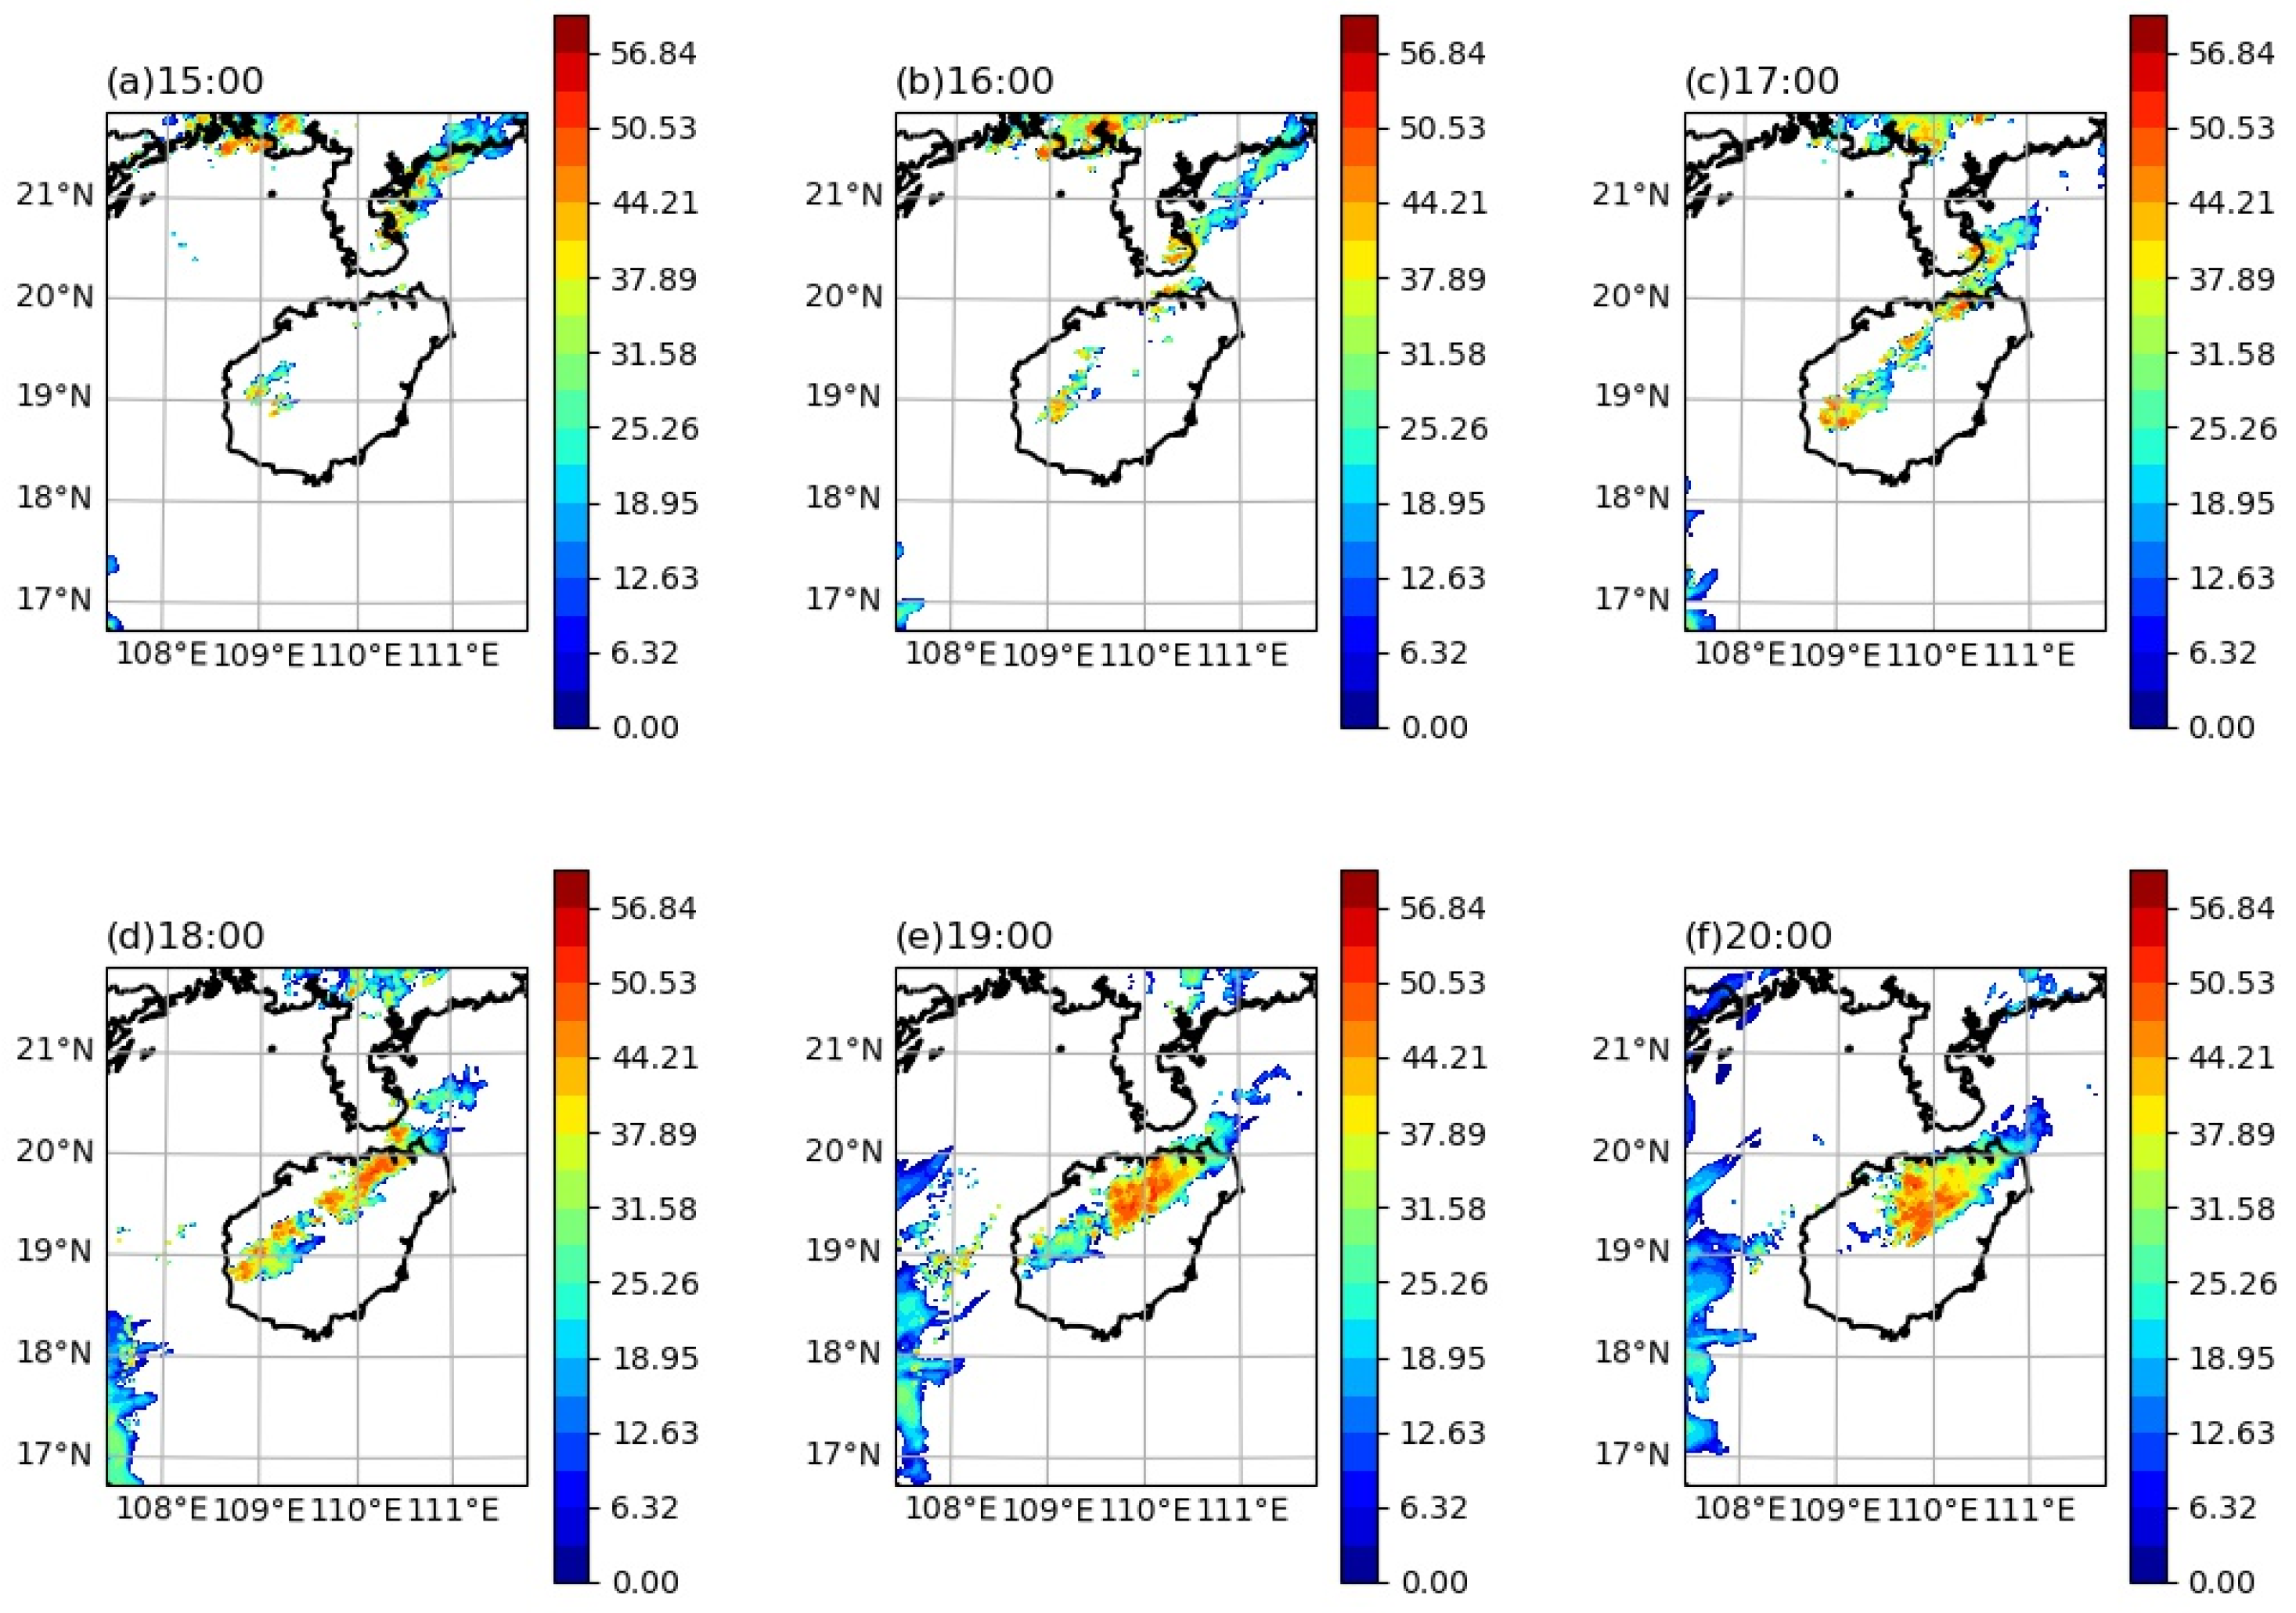
On the afternoon of 22 April 2020, a squall line process occurred from Wuzhishan to Haikou on Hainan Island, resulting in localized heavy precipitation. The squall line process is analyzed in detail using composite reflectivity data from multiple operational weather radars in South China (Figure 1). The squall line process was initiated at approximately 15:00 BST (Beijing time) on the 22nd (all the times mentioned in this paper are BST). Initially, there was a small area of convective cells in the northwest of Wuzhishan, exhibiting a basic reflectivity of approximately 50 dBZ (Figure 1a). Subsequently, at approximately 16:00 (Figure 1b), the convective cloud cluster expanded and intensified, with a reflectivity ranging from approximately 50–55 dBZ. Concurrently, the convective cloud cluster displayed an initial banded distribution above 40 dBZ, stretching from southwest to northeast with a mesoscale length estimation of approximately 100–200 km [21]. By approximately 17:00 (Figure 1c), the squall line system changed from the initial meso-β-scale (20–200 km) to the meso-α-scale (200–2000 km) [22]. This stage had a length of approximately 500–600 km from southwest to northeast. The echo zone above 45 dBZ had an arc shape with a bulging vertex in the forward direction, which matches the attributes of bow echoes on radar reflectivity maps ref. [23] and a strong convective zonal distribution, indicating a significant rear inflow intensity within the squall line system [24]. Subsequently, by approximately 18:00 (Figure 1d), the squall line began to propagate eastward with maximum intensity. By approximately 19:00 (Figure 1e), the majority of the squall line system had moved to the sea area east of Hainan Island. The squall line structure over Hainan Island gradually weakened, with radar echoes mostly below 35 dBZ. At approximately 20:00 (Figure 1f), radar echoes in most areas of Hainan Island were below 10 dBZ. Furthermore, a comprehensive analysis of precipitation data and other sources revealed the complete dissipation of the squall line system within the island [25,26].

2.2. Weather Scale Background

The analysis of the weather scale background of the squall line process utilizes the reanalysis data of ERA5. ERA5 reanalysis data from the fifth-generation European Centre for Medium-Range Weather Forecasts (ECMWF) of the global climate have a horizontal resolution of 0.25° × 0.25° and 37 vertical levels.
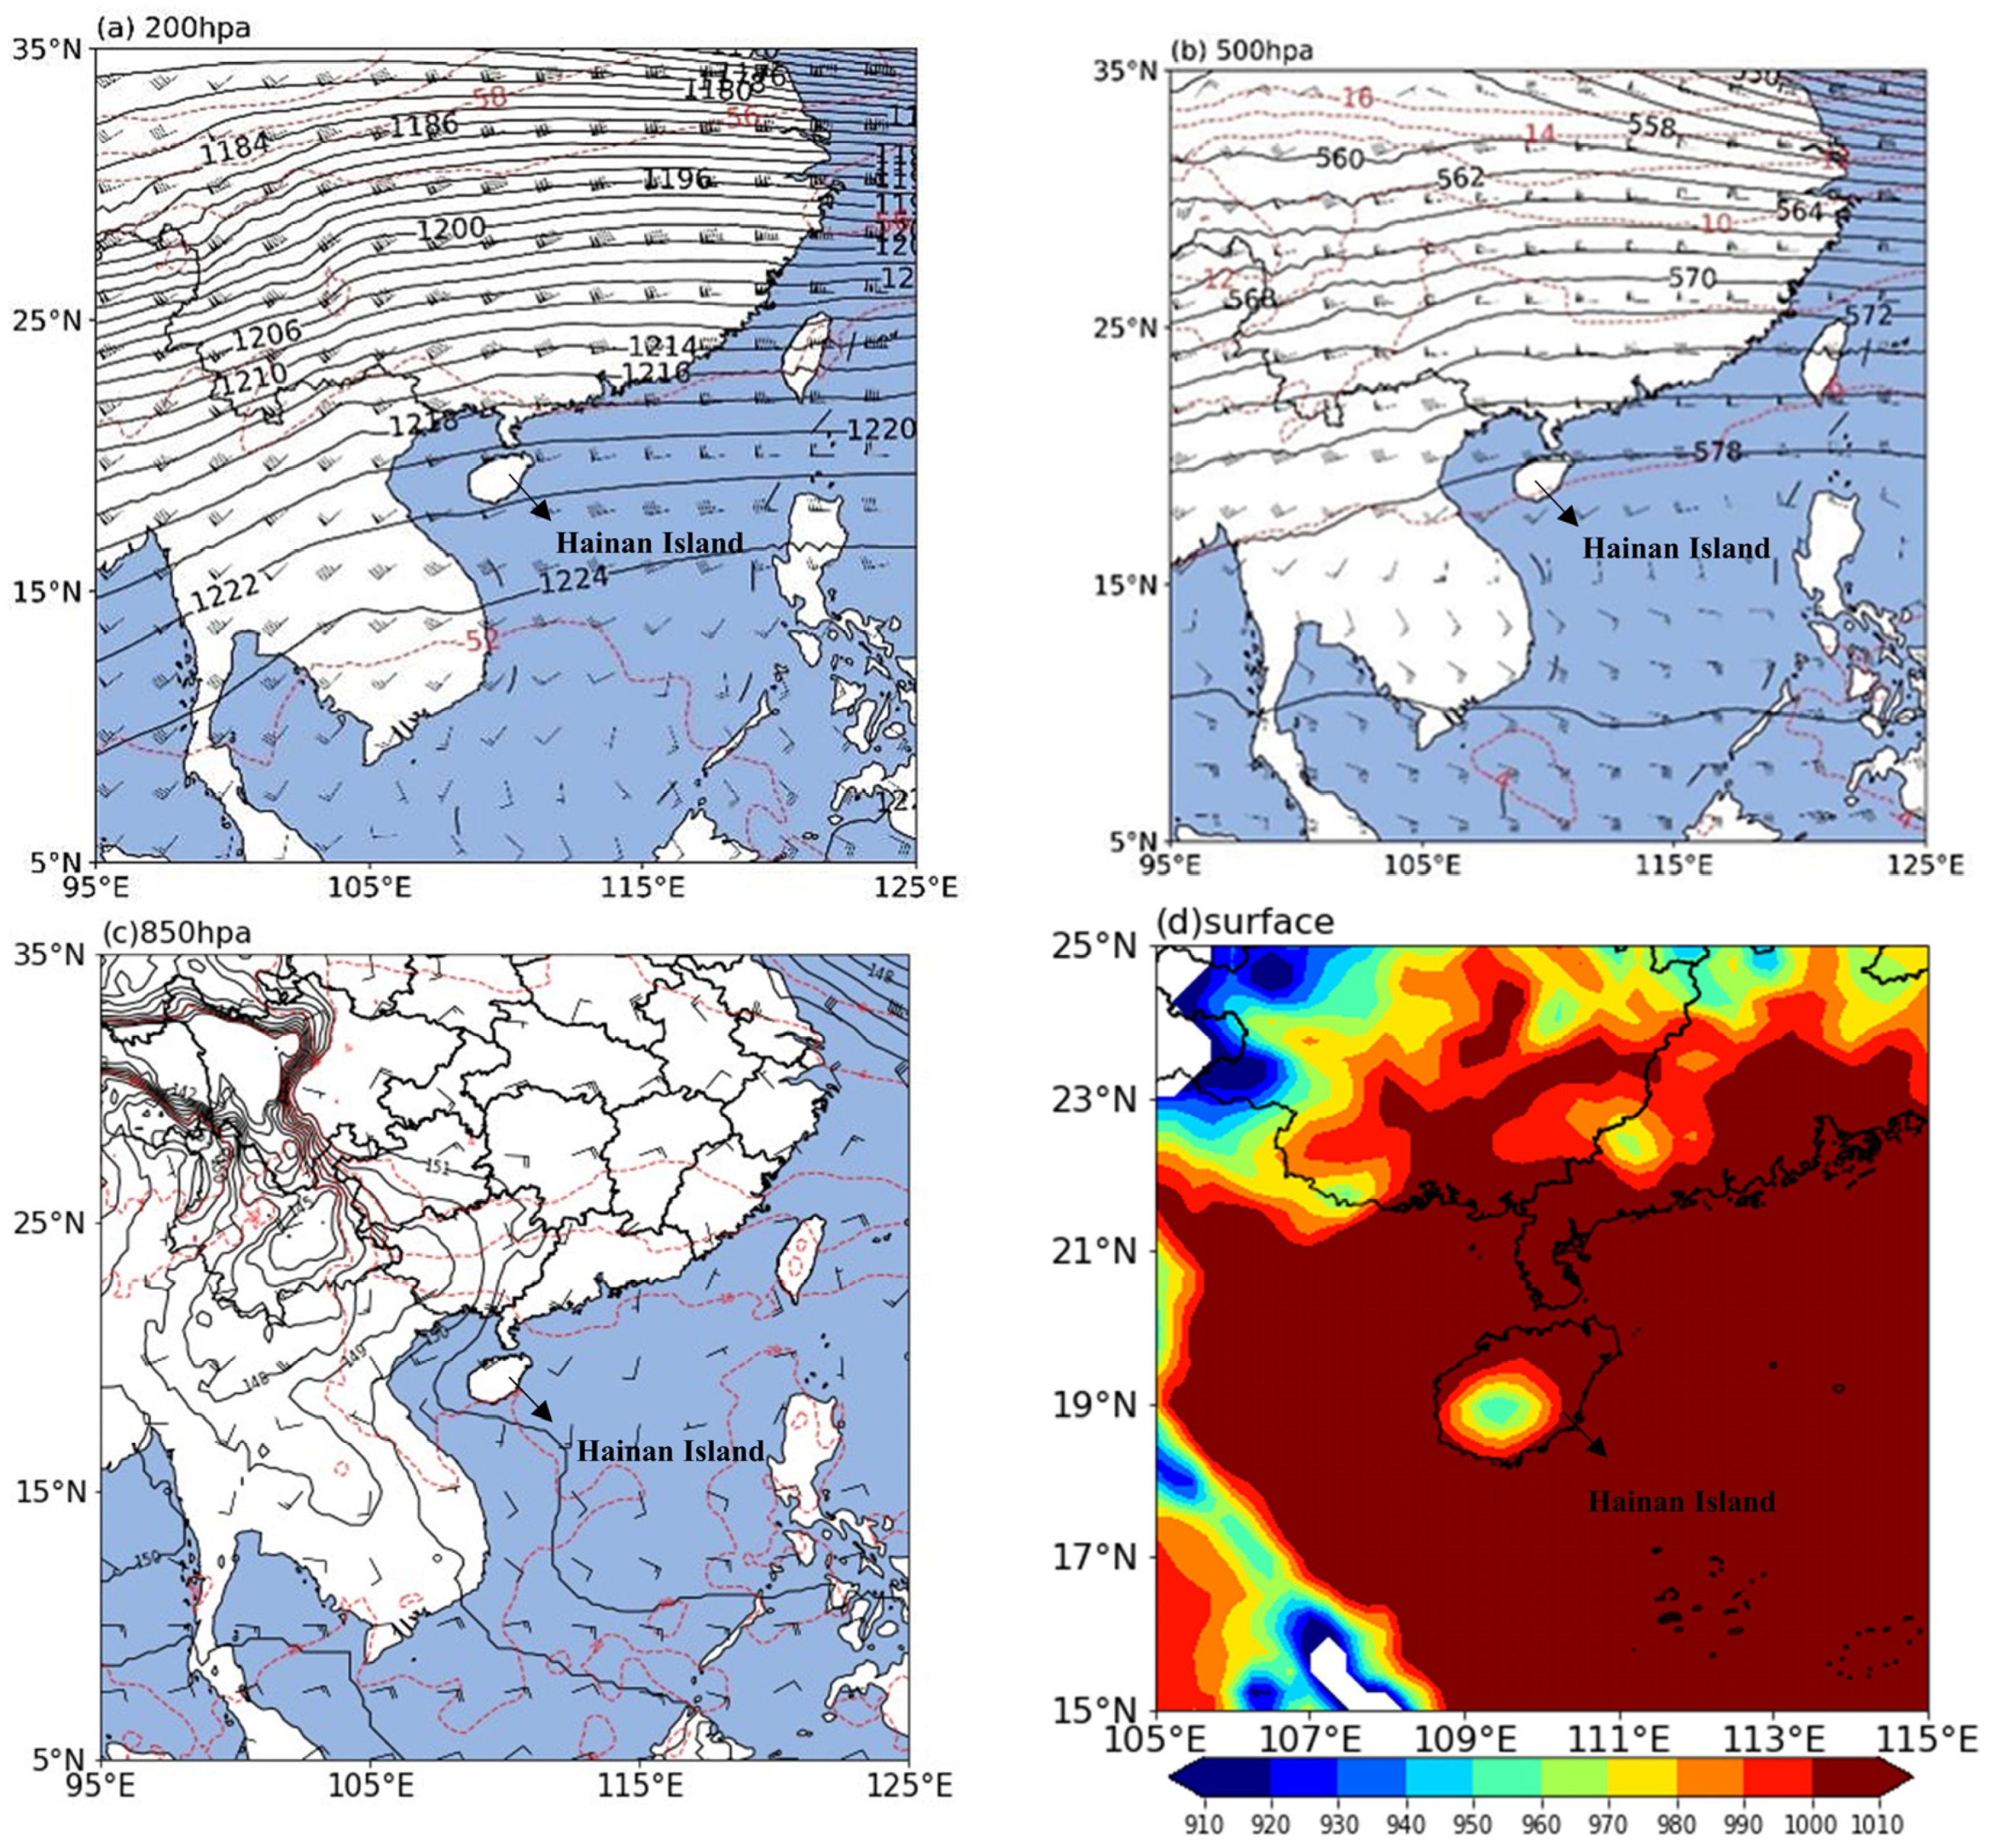
Firstly, the 200 hPa altitude situation at 14:00 on 22 April 2020 (Figure 2a) reveals a high-pressure ridge in the upper reaches of Hainan Island. This ridge corresponds to a sinking motion that is not favorable for the occurrence of severe convective weather. However, given that the squall line occurs in the lower atmosphere, the influence of the 200 hPa height system on this process is minimal. On the other hand, for the 500 hPa altitude situation (Figure 2b), there is a trough of low pressure in the upper reaches of Hainan Island. In front of this trough, upward motion is related to a positive relative vorticity advection over Hainan Island. A closed high-pressure system at both 500 hPa and 850 hPa (Figure 2c) on the ocean surface southeast of Hainan Island supports the inland migration of sea breezes via the pressure gradient force. As shown on the pressure field chart (Figure 2d), there is a conspicuous inverted trough on Hainan Island, further enhancing frontogenesis. To summarize, the weather-scale background conditions associated with this process are favorable for the development of the squall line.

2.3. Numerical Simulation Design

This paper uses the 6-hourly ERA5 reanalysis data from ECMWF as the initial field and boundary field for numerical simulation experiments. The ERA5 can provide data with a horizontal resolution of 0.25° × 0.25° and 37 vertical levels. The model was initiated at 20:00 on 21 April 2020, (BST), and ended at 4:00 on 23 April 2020 (BST). The reanalysis data were provided for d01 initial boundary conditions.
This paper uses the ARW V3.8 version of the Weather Research and Forecasting Model (WRF) as the numerical simulation tool, which can effectively simulate and predict the development and evolution of mesoscale convective systems. [27]. Additionally, the WRF model demonstrates better simulation capabilities for the development of precipitation and squall line systems [28].
For this simulation, a four-fold nesting scheme with two-way feedback (Figure 3) was employed. A simulation spin-up time of 22 h and a total integration period of 46 h were employed. The outermost layer of the model covers most of South Asia; the outermost nested grid had a horizontal resolution of 27 km and covered a domain of 217 × 229 grid points in the directions, respectively. The second grid had a horizontal resolution of 9 km and covered a domain of 100 × 100 grid points in both directions. The third grid has a horizontal resolution of 3 km and covers a domain of 343 × 385 grid points in the directions, respectively. The innermost layer focuses on Hainan Island and its surrounding waters, facilitating the analysis of thermal differences. The time integration step is set to 30 s. The horizontal resolution in the nested areas ranges from 27 km in the outer layer to 1 km in the inner layer, and the inner grid number is 463 × 568. The top model layer in the vertical direction is positioned at 50 hPa, and the vertical is divided into 81 layers. The physical parametric scheme used in the numerical experiment is presented in Table 1.
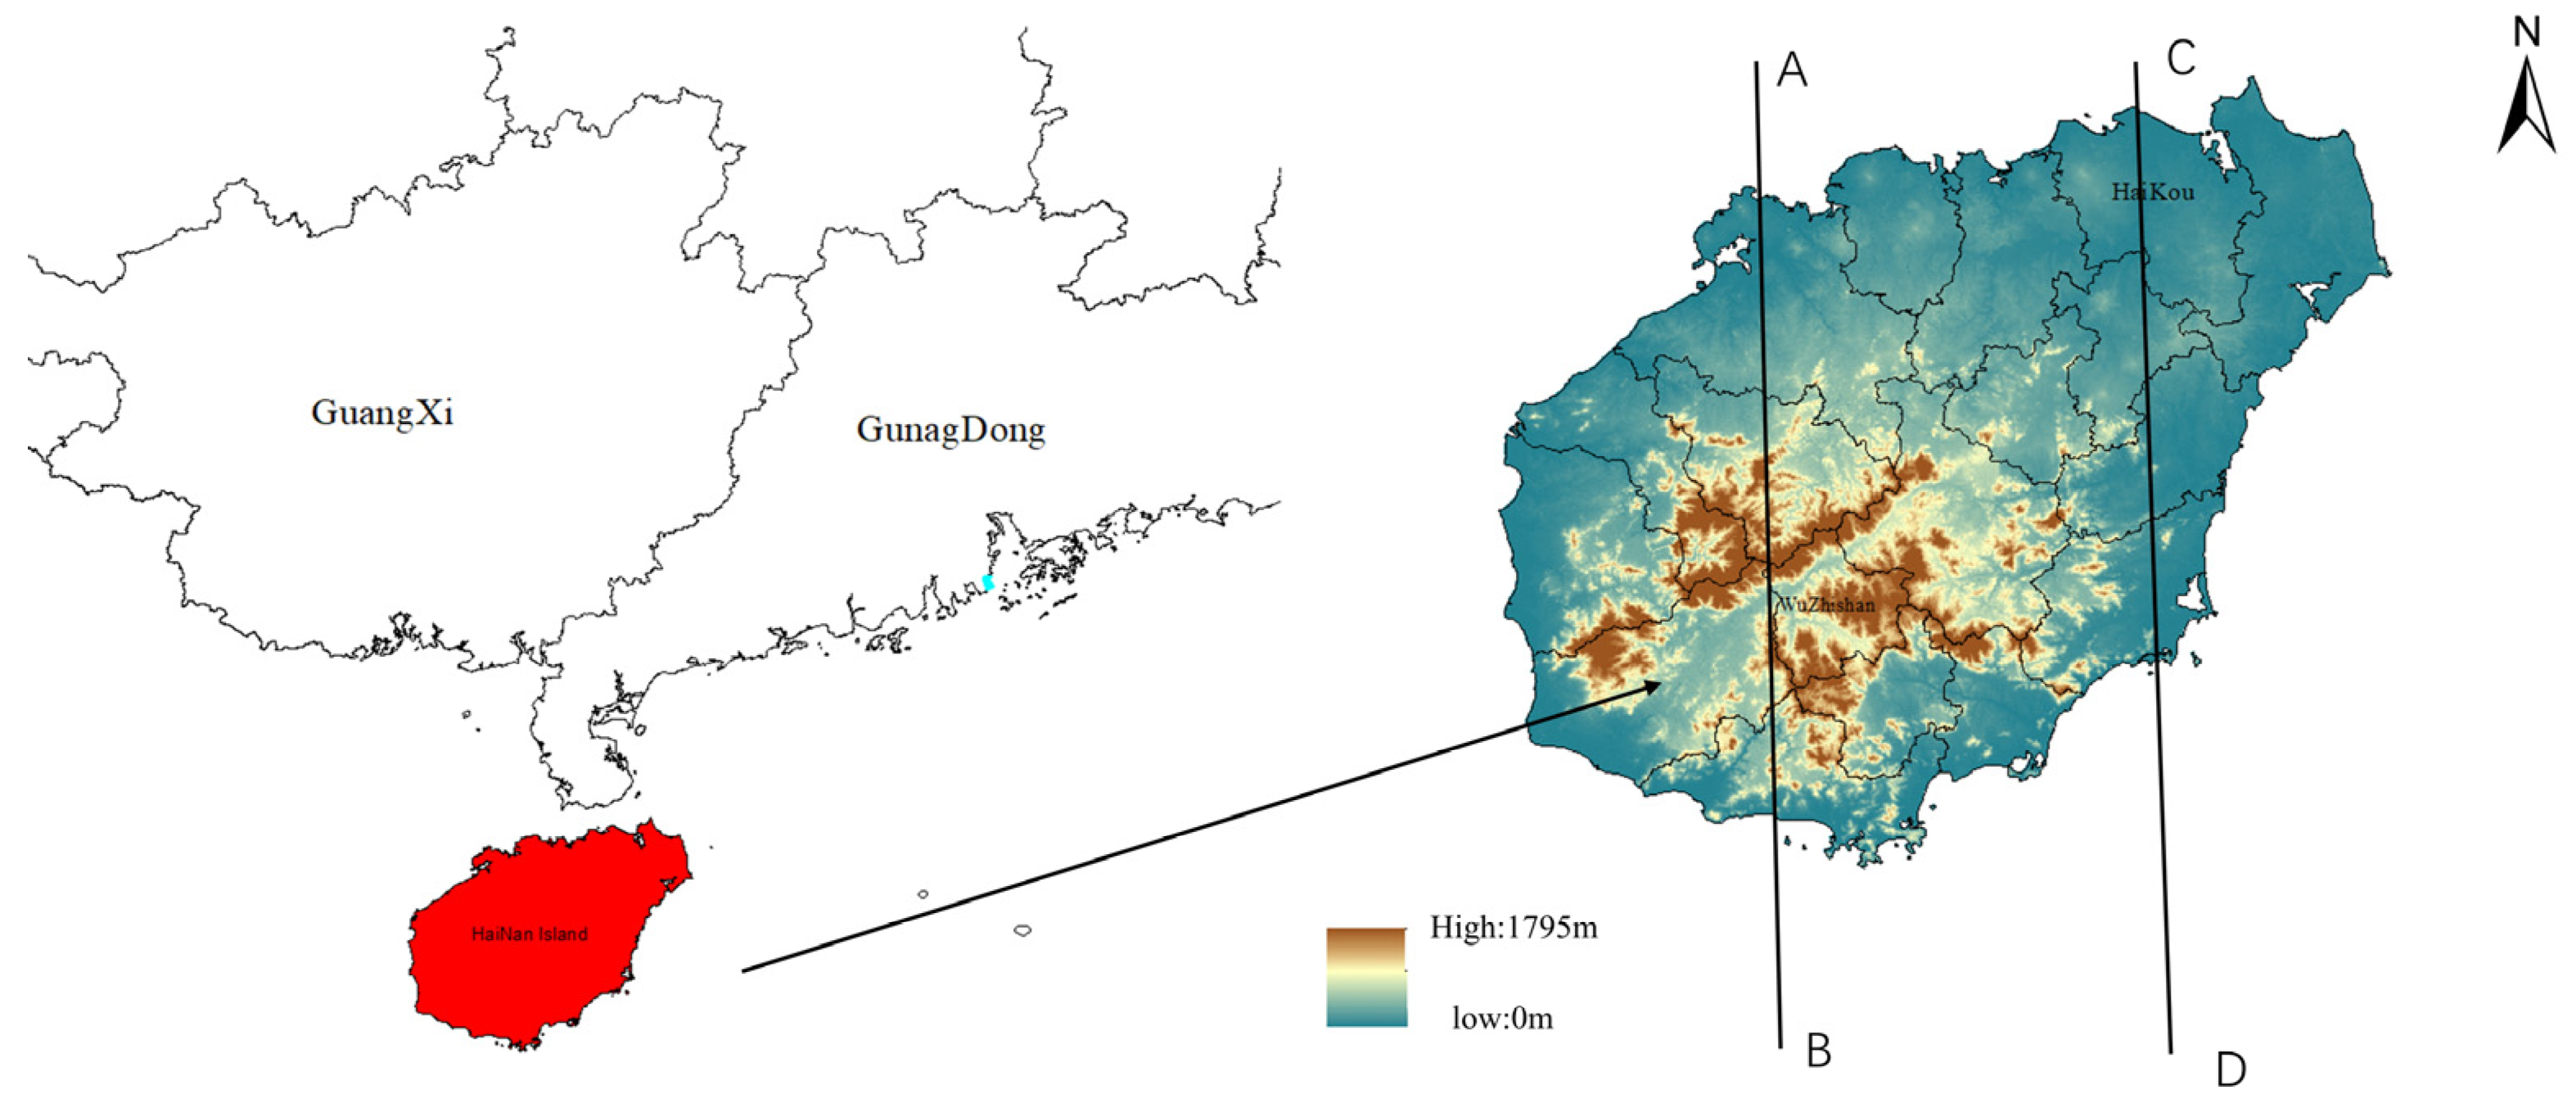
Hainan Island is located in the south of China, 18°09′–20°10′ N, 108°03′–111°03′ E, which has a unique geographical feature (Figure 4). The center of the island, where the mountains are located, is in the southwest region, while the northeast area, where the plains are found, spans both sides of the island. Hainan Island is strongly influenced by the sea breeze [29] and is covered by a lot of vegetation [30].

3. Results

3.1. Comparison between Simulation and Observation

To verify the effectiveness of the numerical simulation experiment, the composite reflectivity of the innermost layer (Figure 5) was selected for comparison with the actual composite reflectivity of the multiple operational weather radars in South China (Figure 1). In the numerical simulation scenario at 15:00 on 22 April 2020 (Figure 5a), scattered thunderstorm cells appeared in the northwest of Wuzhishan. While the simulation displayed more convective cells compared to the actual situation, the location and intensity of the occurrence were similar. Subsequently, these thunderstorm cells continued to develop. The initial meso-β squall line system had developed by 16:00 (Figure 5b), and it was consistent with the current range, area, and scale. At 17:00 (Figure 5c), the squall line system transformed into an evident meso-α-scale convective system, and the radar echo near Haikou reached the maximum, which matched the actual observation. Between 18:00 and 19:00 (Figure 5d,e), the horizontal width of the squall line system started to expand, demonstrating its most vigorous development and initiating eastward movement. While the simulation result moved slower than the speed of the actual situation, the simulated path, range, and life cycle of the squall line were generally consistent with reality. Thus, upon comprehensive examination, the numerical simulation results more closely resembled the ground truth.
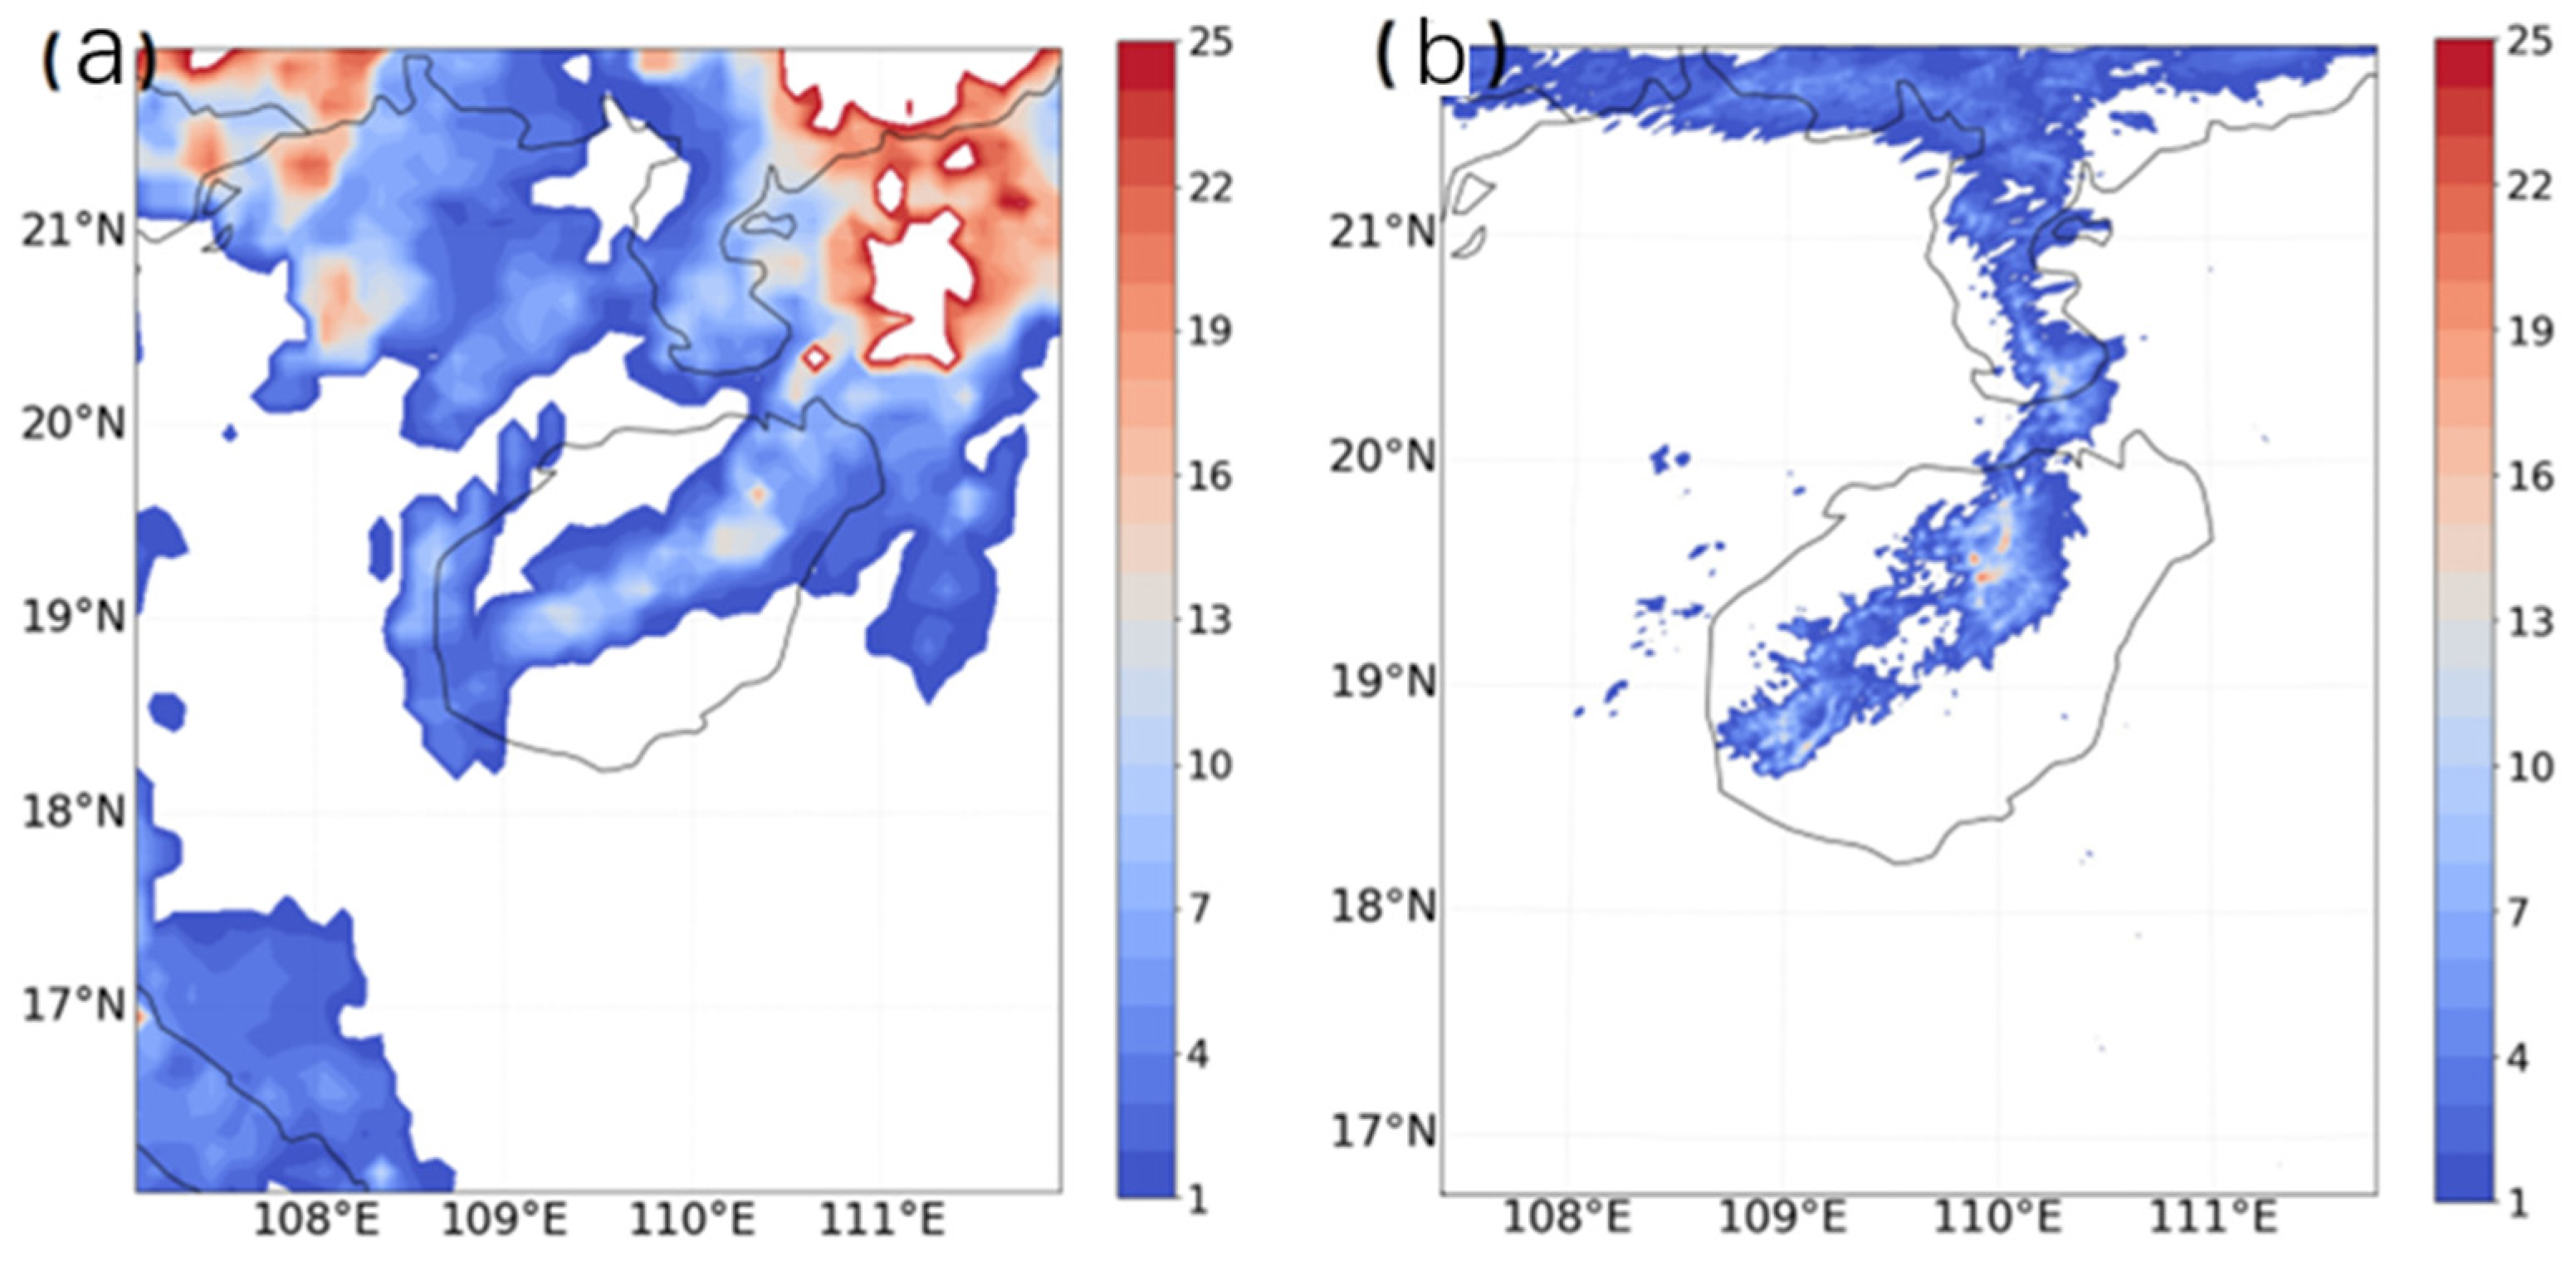
Furthermore, the simulation’s effectiveness was further examined by comparing the distribution of actual and simulated cumulative precipitation. According to the simulated cumulative precipitation (Figure 6a), the precipitation area extended in a southwest-northeast direction, with most of the precipitation located in the south of Haikou. The accumulated precipitation exceeded 20 mm, while most other areas exhibited values above 13 mm. In comparison to the corresponding actual cumulative precipitation (Figure 6b), the magnitude of the central precipitation area in both the actual and simulated cases was approximately similar. However, the actual precipitation area slightly shifted eastward in comparison to the simulated precipitation area, although the deviation was minimal. In summary, this numerical simulation effectively captured the complete precipitation process, with the simulated precipitation intensity and distribution closely resembling the actual situation.
Overall, the numerical simulation of the squall line process on Hainan Island on 22 April 2020, accurately represented the initiation and termination positions of its movement and precipitation distribution, and the affected area’s scope. As a result, the simulation demonstrated good effectiveness in capturing the characteristics of the squall line system’s structure and its developmental mechanism.

3.2. Analysis of Water Vapor Conditions

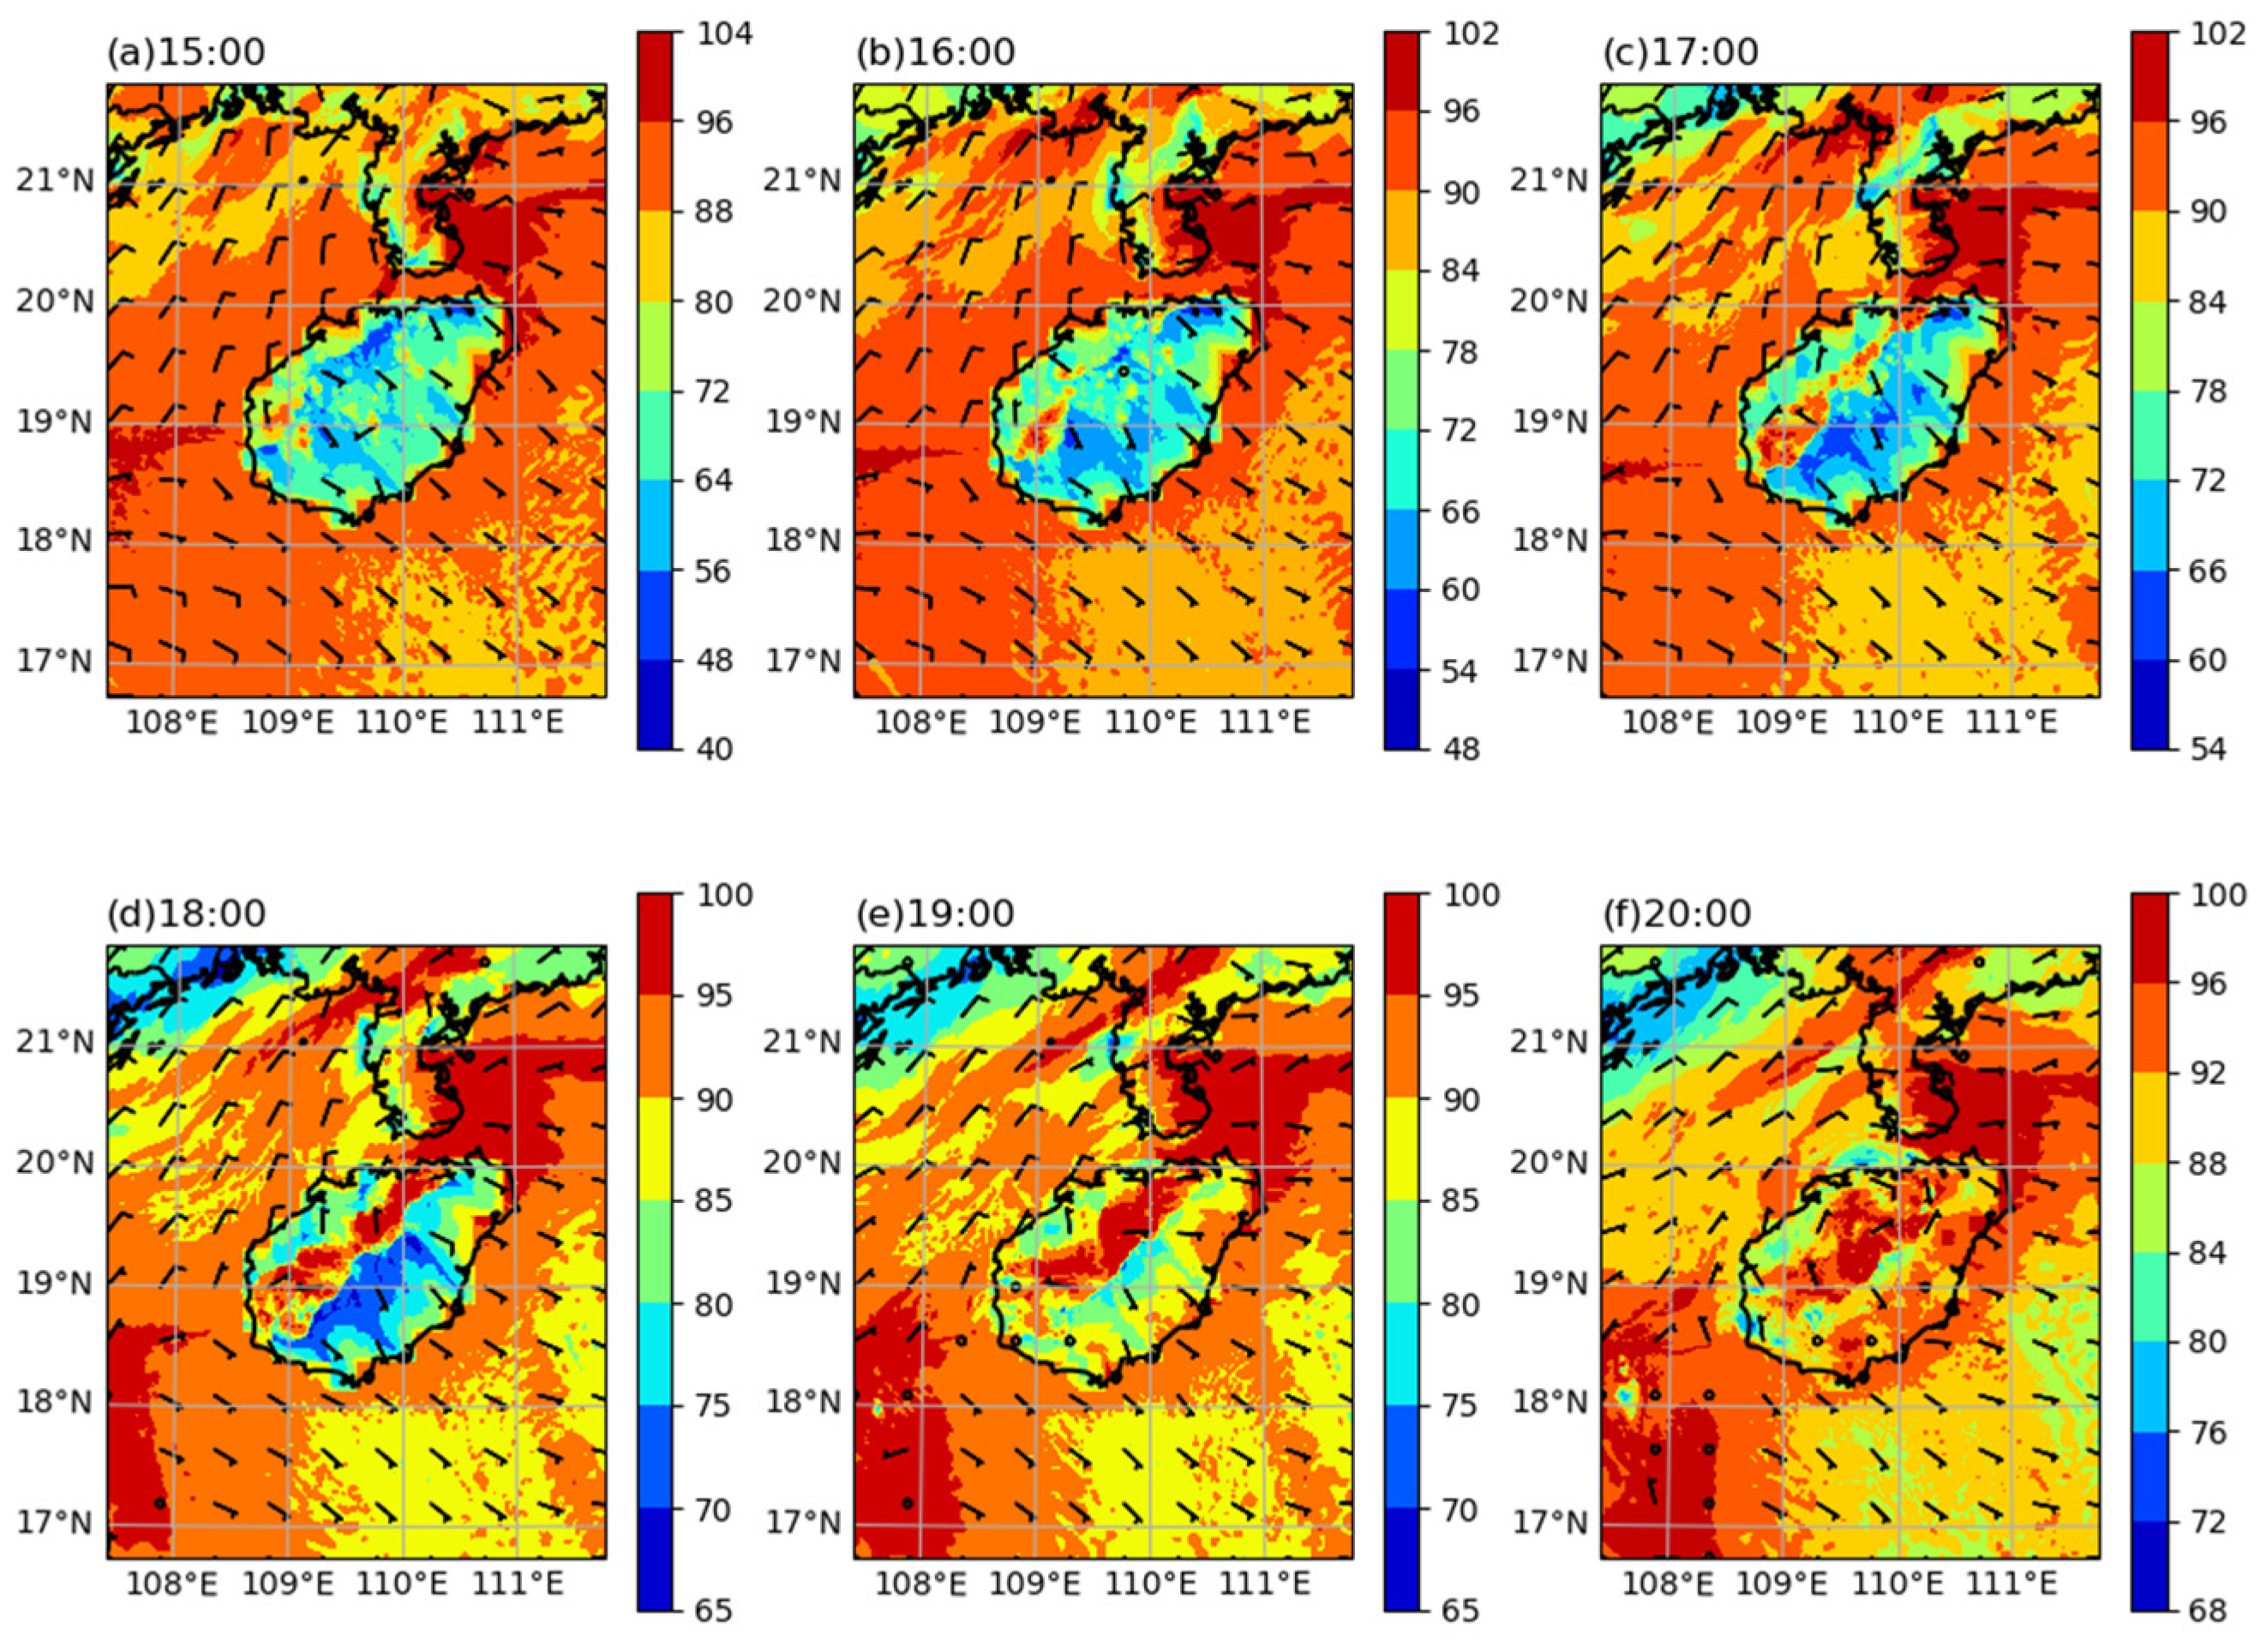
The development of strong convective weather requires the presence of water vapor, as it serves as a raw material for cloud precipitation and affects the stability of the atmosphere. This analysis focuses on the early stage of the squall line process, specifically from 12:00 to 15:00 on the 22nd. From 12:00 to 13:00, the relative humidity is approximately 60% (Figure 7a,b), indicating insufficient water vapor. However, a convergent sea breeze brings water vapor from the ocean surface to the coastal areas. By 14:00, the relative humidity reaches over 90% in the northern area of Wuzhishan (Figure 7c), providing the initial conditions for heavy precipitation. This high-level water vapor zone coincides with the sea breeze convergence zone, where dense vegetation enhances transpiration and increases the local water vapor content. The wind speed in the forest is low, and the temperature is cooler than other underlying surfaces, allowing for the long-term maintenance of water vapor [31]. Additionally, the rainy season contributes three times more water vapor flux than the dry season, further enhancing the water vapor conditions in this region [32].
By 15:00, a large amount of water vapor had accumulated in the northwest of Wuzhishan (Figure 7d), forming a belt-like distribution of high-level water vapor spanning approximately 100 km. This provided ample water vapor for the squall line process.
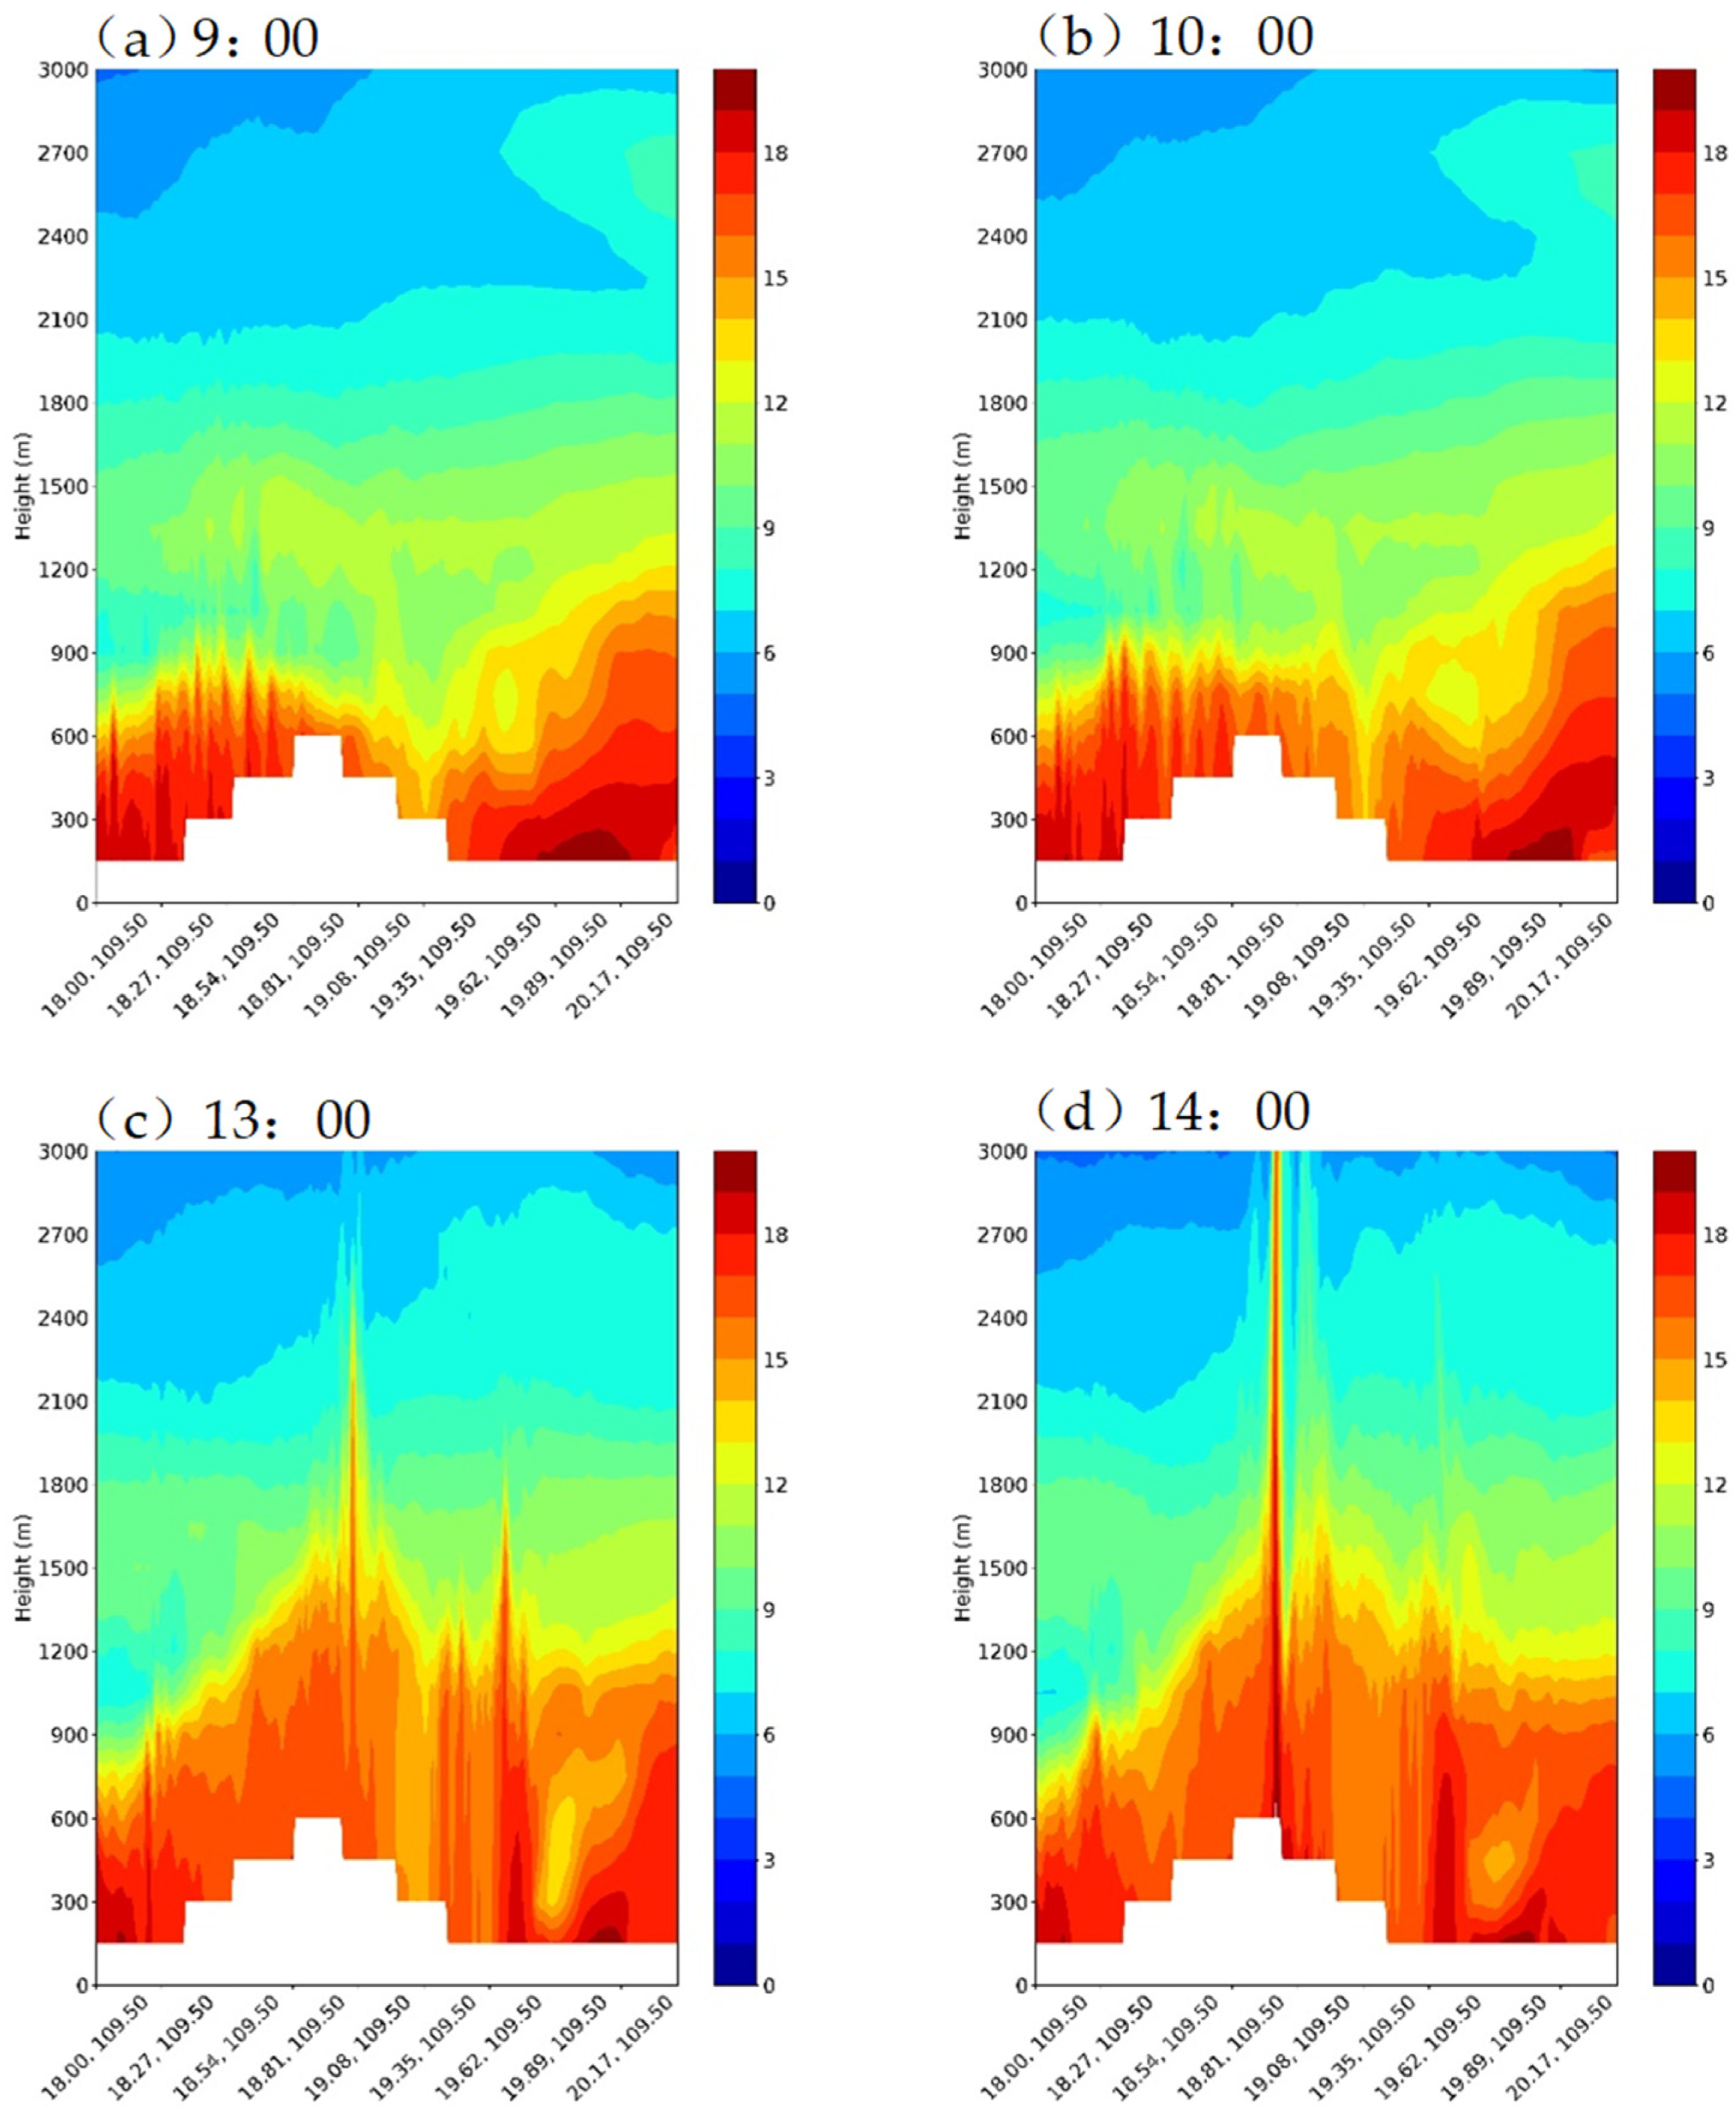
The squall line process is closely tied to the convergence of sea breezes on the north and south sides of Hainan Island. To study the transport of water vapor via the sea breeze, a meridional cloud water profile is constructed from (18°N, 109.5° E) to (20.4° N, 109.5° E). The vertical distribution of the water vapor mixing ratio, cloud water mixing ratio, and rainwater mixing ratio is examined. From 9:00 to 10:00, the cloud water content primarily resides in the boundary layer below 1000 m (Figure 8a,b), with a higher content in coastal areas. As the sea breeze transports water vapor inland and converges, the cloud water content rapidly increases between 13:00 and 14:00 (Figure 8b,c), which is two hours before the squall line occurs. The vertical distribution of cloud water content expands at 0–1500 m, indicating a significant increase in water vapor in the vertical direction. This upward movement is attributed to the convergence of the sea breeze, resulting in a pyramid-shaped distribution with higher content in the middle and lower areas.
To examine the impact of terrain height on water vapor conditions, a topographic sensitivity test is conducted by reducing the terrain height of Hainan Island to 0.1 m. Comparing the results with the original simulation, it is observed that the starting time, range, and movement of the squall line remain almost the same (Figure 9). However, in the test of water vapor accumulation, the test occurs one hour later (Figure 10) and has a more westerly location compared to the simulation without changes in the underlying surface. Furthermore, the intensity of water vapor accumulation in the test is smaller. Based on the comparison above, it can be concluded that terrain height has a minimal macro impact on mesoscale weather processes, but it does influence the position of sea breeze convergence. High terrain facilitates the rapid accumulation of water vapor transported via the sea breeze and helps maintain concentrated water vapor.
In summary, the analysis demonstrates the crucial role of water vapor in the development of strong convective weather and highlights the significance of sea breeze convergence and terrain height in influencing water vapor conditions.

3.3. Analysis of Unstable Conditions

When the sea breeze converges, the transportation of water vapor and ground heating significantly increase the convective available potential energy (CAPE) [33]. To better understand atmospheric instability, we analyze the horizontal distribution of maximum convective available potential energy (MCAPE) and maximum convective inhibition energy (MCIN) on Hainan Island. At 14:00 on the 22nd, one hour before the formation of squall lines, MCAPE (Figure 11a) exhibited two zonal distributions from southwest to northeast. In the entire zonal region, the majority of the maximum convective available potential energy exceeds 3000 J·kg−1. Strong convection can be triggered at values between 2500–4000 J·kg−1, while extreme convection can occur above 4000 J·kg−1 [34]. This indicates a significant amount of unstable energy, which favors the development of strong convective weather. Moreover, at this time, in the northwest of Wuzhishan, the maximum convective inhibition energy showed a patchy and discontinuous pattern in the northwest of Wuzhishan, which displayed a localized, discontinuous distribution (Figure 11b), with a maximum value of approximately 80 J·kg−1 and a minimum value below 10 J·kg−1. Consequently, at the onset of the squall line at 15:00, a discrete thunderstorm cell appeared in this area, as depicted in Figure 5a. Examining the distribution at 16:00, the two previously observed band-shaped areas of high MCAPE exhibited a converging trend (Figure 11c) and formed a band-shaped area with stronger unstable energy. The local small-scale MCAPE even reached 3200 J·kg−1. Simultaneously, the MCIN distribution (Figure 11d) revealed that the maximum convective inhibition energy in Haikou was very low, close to 0. This laid the foundation for the emergence of the squall line system with the greatest intensity near Haikou after 17:00 and allowed for the potential upgrade of the squall line system from the initial β mesoscale scale to the meso-α-scale.

3.4. Thermal Difference between Sea and Land

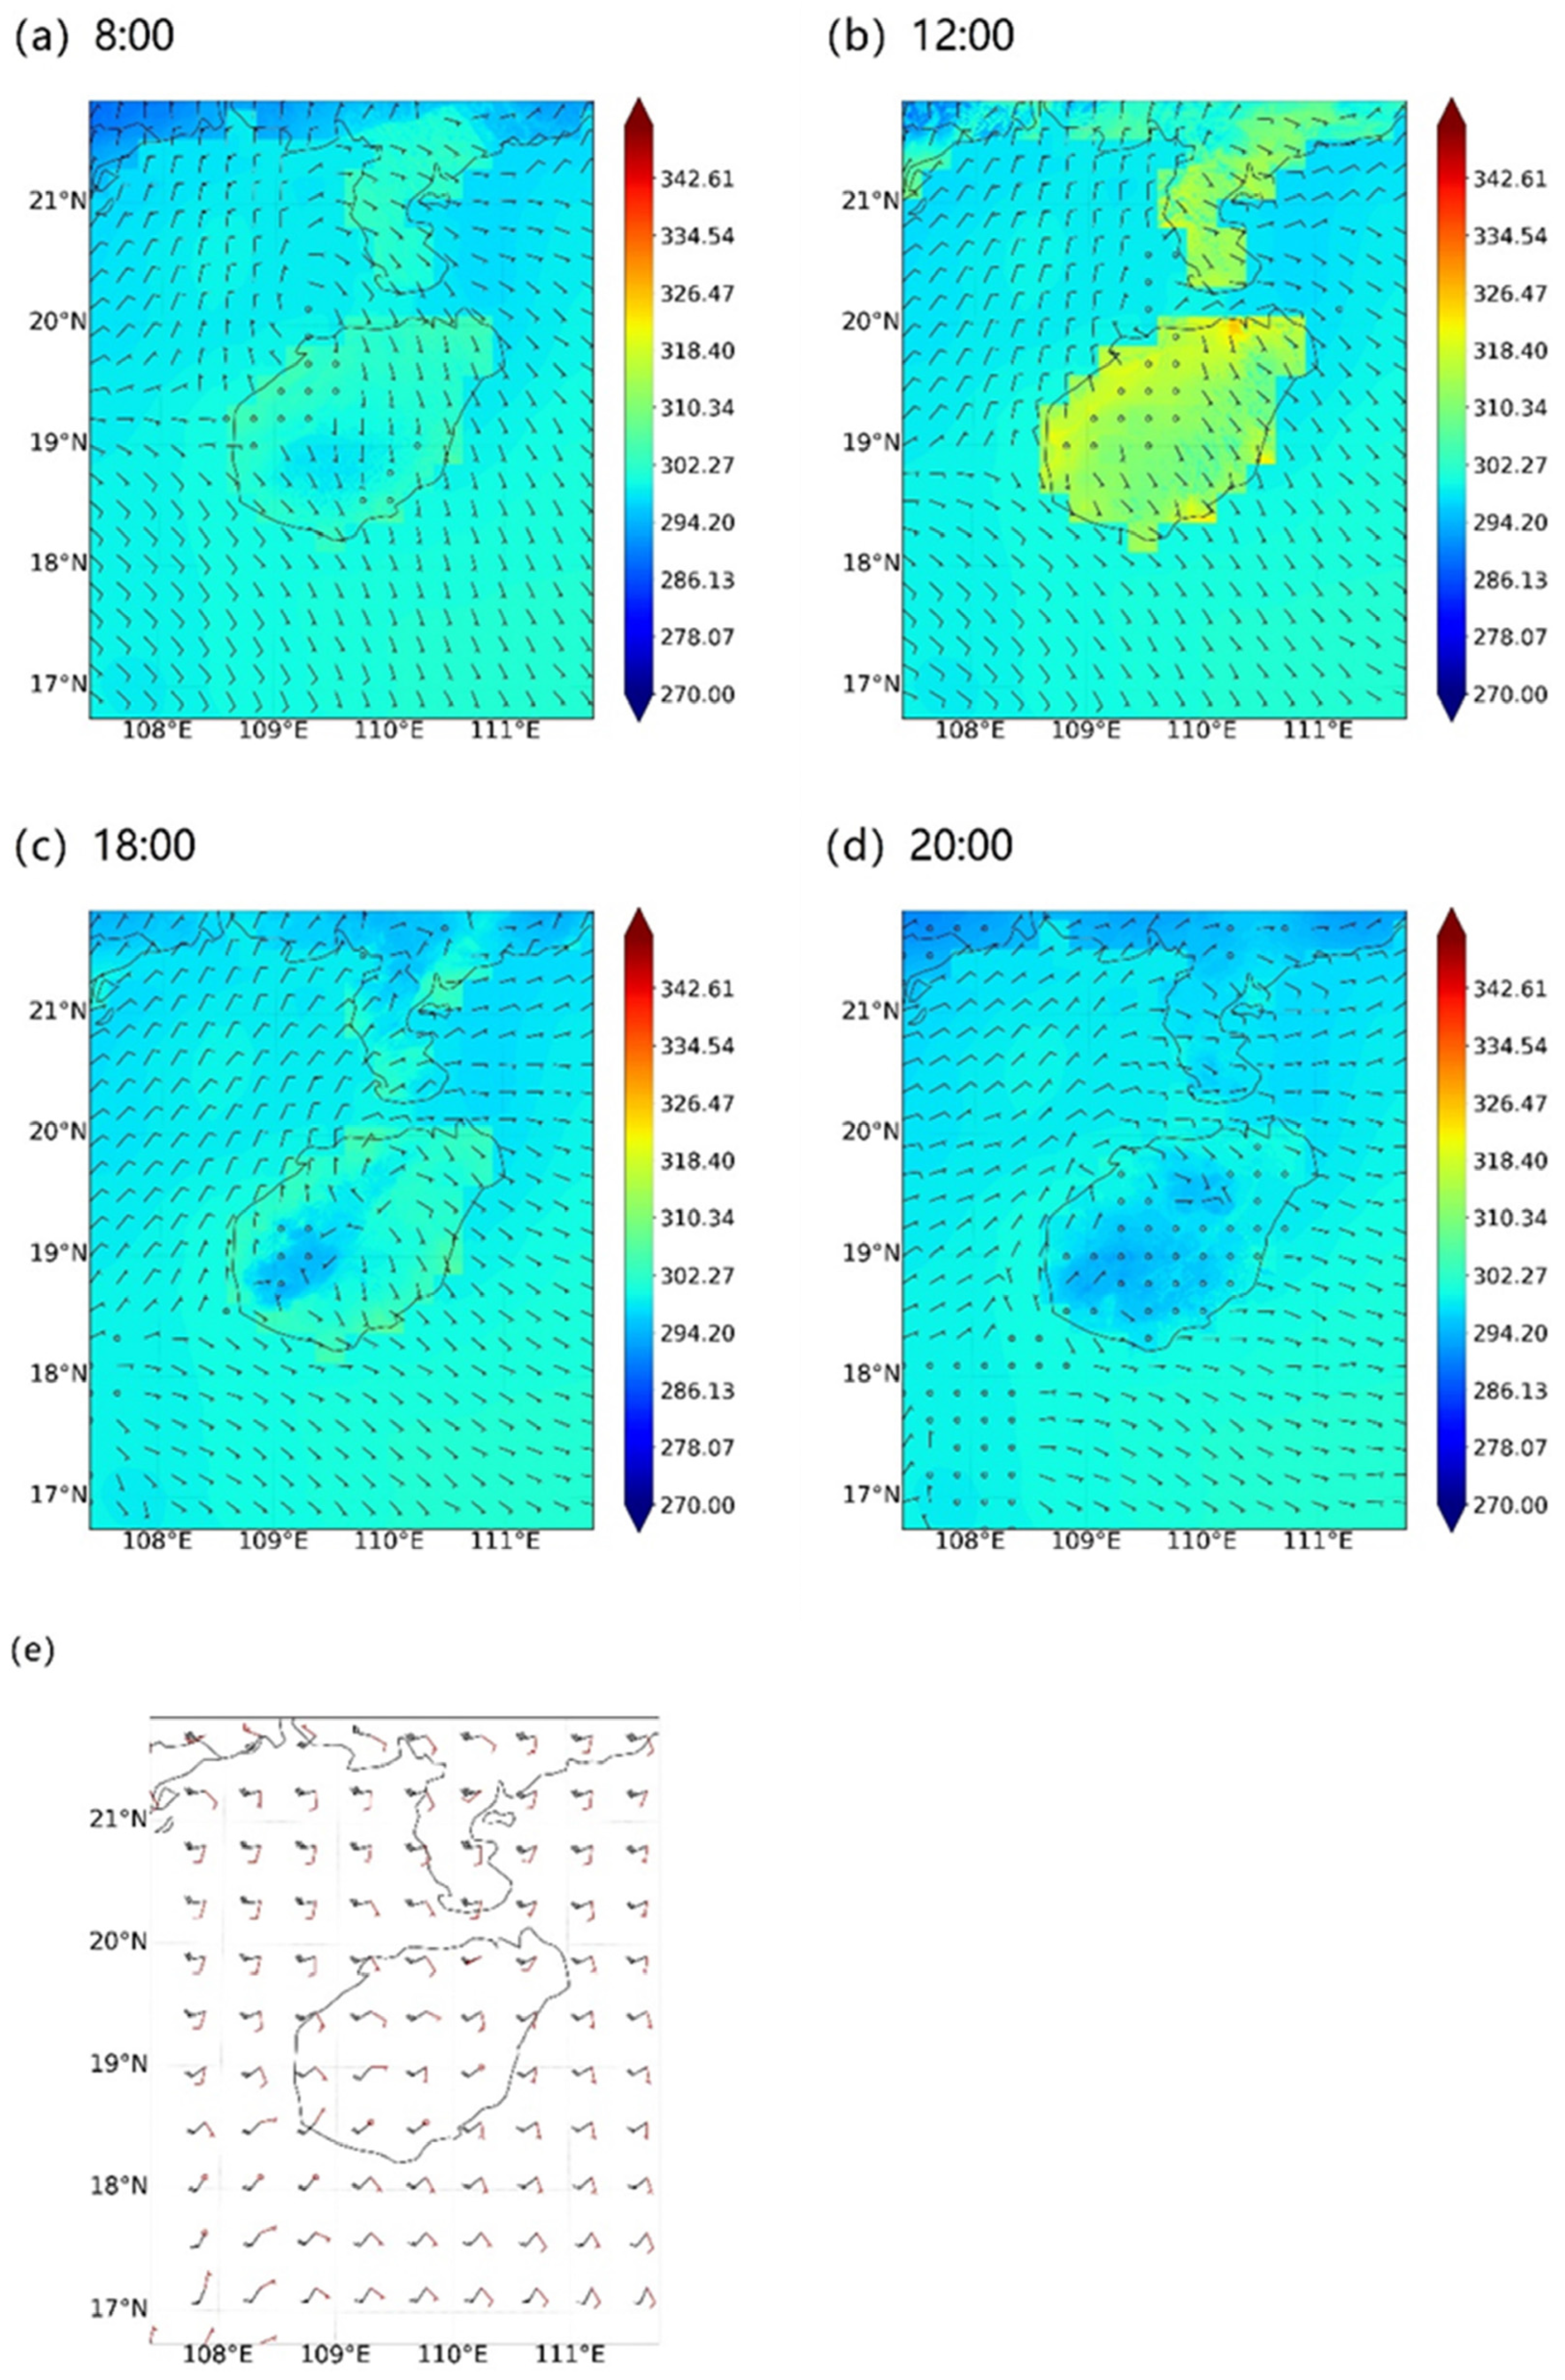
Analyzing the trigger mechanism of this severe convective weather is necessary to better understand the whole process. Firstly, the sea breeze is caused by the thermal difference between the sea and the land. It occurs during local mesoscale circulation at the sea-land junction. It is generally located in the atmospheric boundary layer and has a significant impact on the water and air transmission and weather characteristics of coastal areas [35,36,37,38]. In this process, due to the existence of a closed high-pressure system in the southeast of Hainan Island (Figure 2c), it was controlled by a southerly sea breeze all day on the 22nd. At the same time, there was a pressure gradient on the mainland in the northwest of Hainan (Figure 2d), resulting in the control of the north wind in the north of Hainan. According to the distribution of sea and land temperature and wind field at 8:00 on the 22nd (Figure 12a), there was a low vortex system in the northwest sea area of Hainan, and the sea wind convergence on the island was not obvious at this time.
At 12:00 (Figure 12b), due to the effect of solar radiation and warm advection (Figure 12e, the wind rotates clockwise with height), the land temperature increased, which made the thermal difference between the land and the surrounding sea area approximately 20 K. At this time, the obvious temperature difference made the wind field around Hainan Island begin to change, and the southerly sea breeze in the southeast of Hainan Island gradually became a southeast sea breeze. Meanwhile, the sea breeze convergence zone appeared from Wuzhishan to Haikou on the island. Through the above research, this sea breeze convergence zone played a key role in the squall line system. At 18:00 (Figure 12c) and 20:00 (Figure 12d), the squall line reduced the temperature on the island to a lower level than that in the external sea area. The above is the horizontal structure analysis of the squall line process due to the thermal difference between sea and land.
To better study the uplift caused by sea breeze convergence, the vertical structure of this process is analyzed. The vertical velocity profiles are created at the time when the convection system appears in Wuzhishan and Haikou. Firstly, (Figure 13a) analyzes the profile of cloud water and the vertical velocity superposition created at 15:00 from (18° N, 109.5° E) to (20.4° N, 109.5° E) (AB in Figure 4). It can be seen that the vertical velocity caused by sea wind convergence near Wuzhishan is approximately 3–6 m·s−1, the maximum lifting velocity of the bottom layer is 6 m·s−1 and the velocity decreases with height.
By taking another look at the cloud water profile and vertical velocity superposition created at 16:00 (Figure 13b) from (18° N, 110.2° E) to (20.4° N, 110.2° E) (CD in Figure 3b), it can be seen that the vertical velocity near the Haikou is approximately 4–8 m·s−1. The highest lifting velocity of the bottom layer is 8 m·s−1, which is larger than that of the bottom layer of Wuzhishan, and the decline rate of vertical velocity with height is smaller than that of the former. The increased vertical uplift in Haikou compared to that in Wuzhishan also indicates that there is a more intense squall line system near Haikou. At the same time, it can be seen that the vertical velocity at both times extends to approximately 3000 m, breaks through the boundary layer height, and reaches the free convection height (LFC) near 2000 m. When the gas block rises to this height, it rises freely and creates convection that develops independently [39].

3.5. Ground-Cold Pool

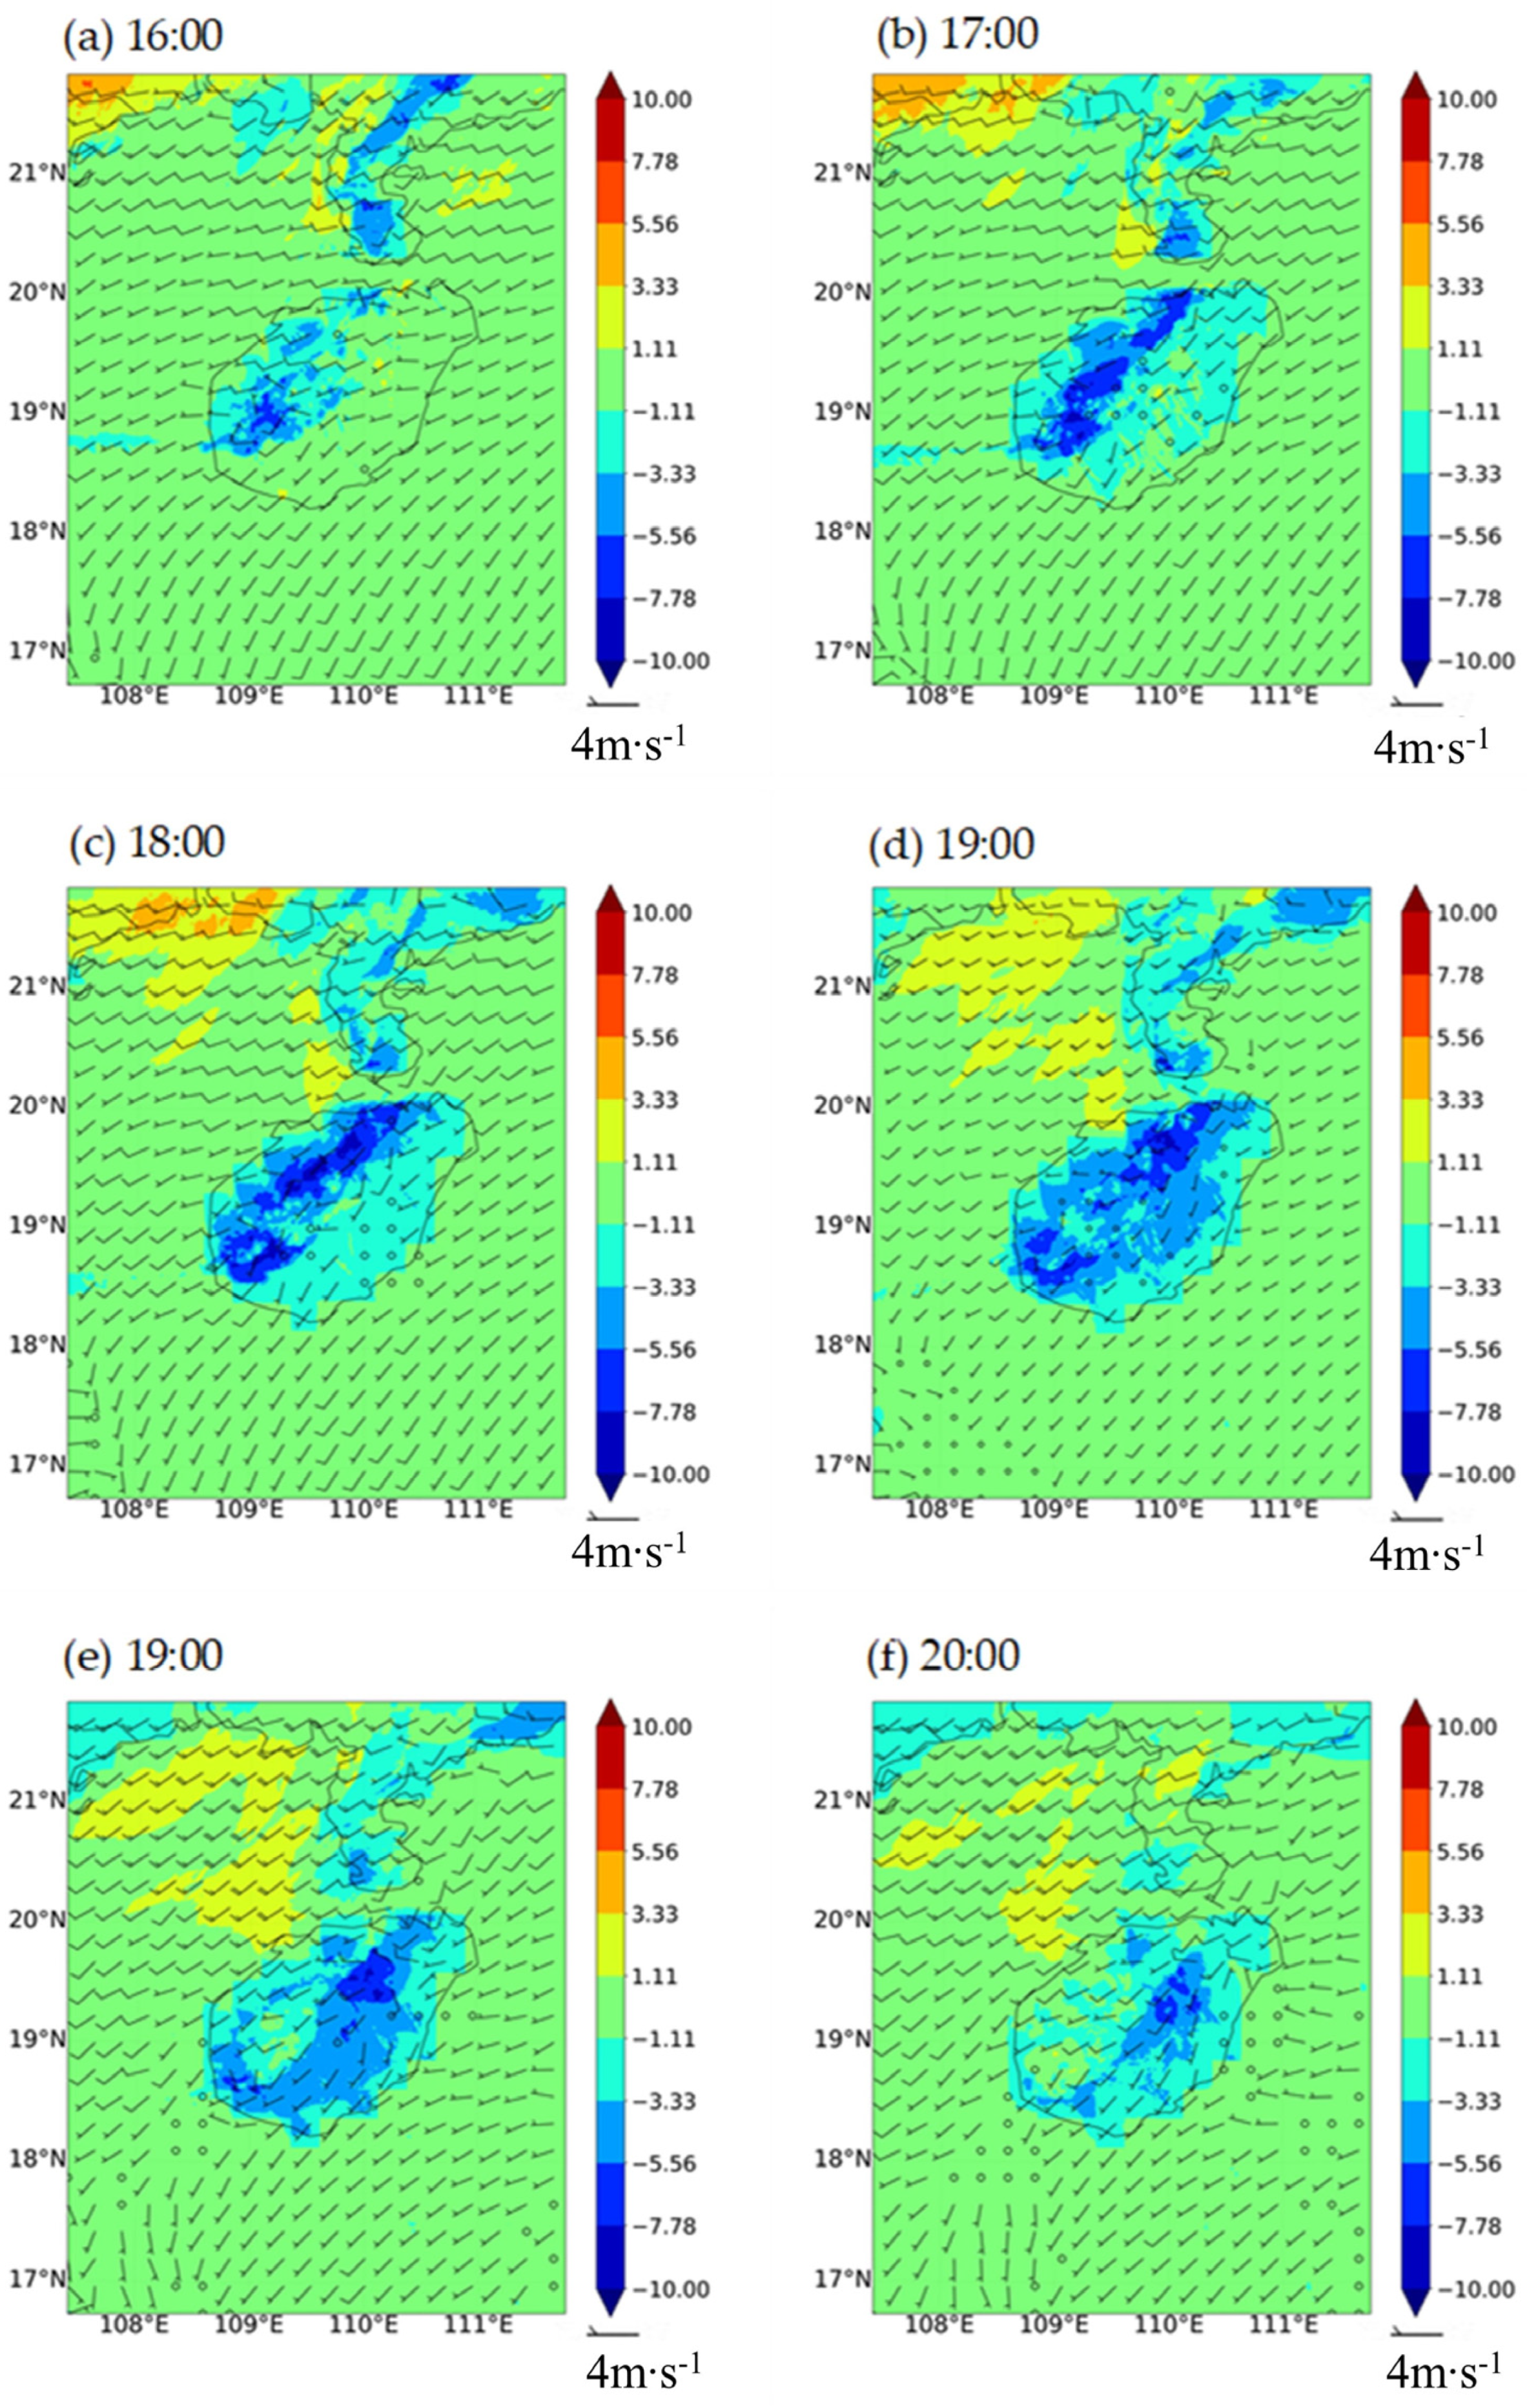
According to the RKW theory, the transformation of convective cells into squall lines is influenced by the interaction between the cold pool and low-level wind shear. This interaction causes the squall lines to move perpendicular to the low-level vertical wind shear, enhancing their strength and development [40]. The formation of a squall line leads to a sudden drop in local air temperature, and the sinking cold air accumulates on the ground, creating a cold pool. The intensity of the cold pool can be estimated by analyzing the change in ground-10-m potential temperature three hours before and after. Additionally, the impact of the cold pool and wind shear on the squall line process is studied using the vertical wind shear from 900 hPa to 700 hPa.
At 16:00 (Figure 14a), the local temperature change is approximately −5 K, while the associated vertical wind shear is approximately 8 m·s−1. Below 6 km, the wind shear is categorized as weak (below m·s−1), medium (m·s−1), or strong (above 20 m·s−1). Therefore, the squall line system’s strength is relatively small at this time. By 17:00 (Figure 14b), the squall line upgrades from meso-β-scale to meso-α-scale. The temperature experienced a change of −5 to −7 K over three hours, suggesting a significant intensification of the cold pool. Moreover, the maximum wind shear in the southwest reaches 12 m·s−1. Additionally, the low-level vertical wind shear gradually becomes perpendicular to the development direction of the squall line, promoting further enhancement of the squall line. At 18:00 (Figure 14c), the squall line reaches its maximum strength. Then, like the previous time, the area with a temperature change between −5 and −7 K expands. The vertical wind shear in the southwest of the squall line reaches 24 m·s−1, representing a very strong shear. Additionally, the area with wind shear perpendicular to the development direction of the squall line enlarges more at these times.
By 19:00 (Figure 14d) and 20:00 (Figure 14e), the wind shear in the southwest region of the squall line gradually decreases. The regions with strong wind shear become concentrated near Haikou, and the interaction between wind shear and the cold pool diminishes. Most areas experience a temperature drop of approximately −5 K, with only Haikou maintaining a temperature change between −5 and −7 K. This observation verifies that the prolonged interaction between vertical wind shear and the cold pool near Haikou significantly affects the squall line process. By 21:00 (Figure 14f), the squall line dissipates completely. The cold pool weakens considerably, and the wind shear decreases to 8 m/s. As the wind shear no longer interacts with the cold pool, the squall line dissipates.

4. Summary and Discussion

Using WRF simulation, this paper discussed the effects of the land-sea thermal contrast on the formation and development of squall lines via a squall line case that happened on 22 April 2020, over Hainan Island. Additionally, a sensitivity experiment was conducted to investigate the influence of terrain on this squall line case. The main findings can be summarized as follows:
The sea breeze is blocked by Wuzhishan mountain, which induces moisture convergence in the northwest of the hill. This process leads to the rapid accumulation of water vapor over the zone, from Wuzhishan to Haikou, which creates favorable moisture conditions for squall lines and heavy rainfall. During this process, the ocean-land thermal contrast between the ocean and Hainan Island not only takes on the main responsibility of the sea breeze but also leads to uplift motion, which affects the formation, intensity, and duration of the squall line. Results of the topographic sensitivity experiment suggest that the high terrain of Hainan Island can affect the location of the sea breeze convergence zone, which is related to the water vapor accumulation and further affects the squall line development.
It was also found that the scale of this squall line developed from the initial meso-β-scale to the meso-α-scale. Further discussion suggested that there is a banded high-value area for maximum convective available potential energy (MCAPE) in Hainan Island while the minimal maximum convective inhibition energy (MCIN) is almost zero, which implies that there is a friendly thermal and dynamic environment to promote the squall line development.
According to the RKW theory, the maintenance and development of the squall line system are closely related to the cold pool and vertical wind shear. This work focuses on the effects of the ocean-land contrast on the thermal and dynamic environment. The comprehensive analysis of this squall line process associated with changes in the cold pool and vertical wind shear can be discussed in future work.

Author Contributions

All authors contributed to conducting this research. Writing-original draft, validation, formal analysis, software, Q.W. and K.Y.; Conceptualization, methodology, resources, data curation, L.D.; Conceptualization, methodology, software, writing—review and editing, J.C. All authors have read and agreed to the published version of the manuscript.

Funding

Tibetan Plateau Scientific Expedition and Research (STEP) program, Grant/Award Numebr:2019QZKK0105; National Natural Science Foundation of China: Grant No. 42230604, 42075067), the National Key Research and Development Program of China (No. 2023YFC03007500), and the Open Research Program of the State Key Laboratory of Severe Weather (grant No. 2023LASW-B25).

Institutional Review Board Statement

Not applicable.

Informed Consent Statement

Not applicable.

Data Availability Statement

The radar-based data for generating Figure 1 are available at http://data.cma.cn/ (accessed on 11 August 2023). The ERA-Interim reanalysis produced by ECMWF can be downloaded from https://rda.ucar.edu/datasets/ds627.0/ (accessed on 11 August 2023).

Conflicts of Interest

The authors declare no conflict of interest.

References

  1. Wang, L.; Shen, X.Y.; Wang, Y.; Zhang, C.; Wang, Y.; Li, X.F. Mechanism analysis of the upscaling growth process of a squall line in South China. Plateau Meteorol. 2021, 40, 145–158. (In Chinese) [Google Scholar]
  2. Tetsuya, F. Results of Detailed Synoptic Studies of Squall Lines. Tellus 2010, 7, 405–436. [Google Scholar]
  3. Rotunno, R.; Klemp, J.B.; Weisman, M.L. A theory for strong, long-lived squall lines. J. Atmos. Sci. 1988, 45, 448–463. [Google Scholar] [CrossRef]
  4. Fovell, R.G.; Ogura, Y. Numerical simulation of a midlatitude squall line in two dimensions. J. Atmos. Sci. 1988, 45, 3846–3879. [Google Scholar] [CrossRef]
  5. Carbone, R.E.; Conway, J.W.; Crook, N.A.; Moncrieff, M.W. The generation and propagation of a nocturnal squall line. Part I: Observations and implications for mesoscale predictability. Mon. Weather Rev. 1990, 118, 19–26. [Google Scholar] [CrossRef]
  6. Johnson, R.H.; Hamilton, P.J. The Relationship of Surface Pressure Features to the Precipitation and Airflow Structure of an Intense Midlatitude Squall Line. Mon. Weather Rev. 1988, 116, 1444–1473. [Google Scholar] [CrossRef]
  7. Laird, N.F.; Kristovich, D.A.R.; Rauber, R.M. The cape Canaveral sea and river breeaes: Kinematic structure and convectiveinitiation. Mon. Weather Rev. 1995, 123, 2942–2956. [Google Scholar] [CrossRef]
  8. Dutta, S.; Satyanarayana, A. Sensitivity studies of cloud microphysical schemes of WRF-ARW model in the simulation of trailing stratiform squall lines over the Gangetic West Bengal region. J. Atmos. Solar Terr. Phys. 2020, 209, 105396. [Google Scholar]
  9. Houze, R.A. Structure and Dynamics of a Tropical Squall–Line System. Mon. Weather Rev. 1977, 105, 1540–1567. [Google Scholar] [CrossRef]
  10. Ding, Y.H.; Li, H.Z.; Zhang, M.L.; Li, J.S.; Cai, Z.Y. Research on the Conditions of Squall Lines in my country. Chin. J. Atmos. Sci. 1982, 6, 18–27. (In Chinese) [Google Scholar]
  11. Yao, J.Q.; Dai, J.H.; Yao, Z.Q. Analysis of the cause of a strong squall line and its maintenance and strengthening mechanism. J. Appl. Meteorol. Sci. 2005, 16, 746–753+863. (In Chinese) [Google Scholar]
  12. Wang, X.M.; Yu, X.D.; Zhou, X.G.; Niu, S.Z. Analysis on the formation and maintenance of the disaster-causing thunderstorms in the “6.3” area. Plateau Meteorol. 2012, 31, 504–514. (In Chinese) [Google Scholar]
  13. Wang, X.F. Research on Local Strong Convective Weather in Shanghai with Complicated Underlying Surface Environment. Ph.D. Thesis, Chinese Academy of Meteorological Sciences, Beijing, China, 2013. [Google Scholar]
  14. Wang, Y. Numerical Simulation Study on the Influence of the Characteristics of the Underlying Surface of the Sea and Land on the Thunderstorm Process in Ningbo Area. Master’s Thesis, Nanjing University of Information Science and Technology, Nanjing, China, 2013. [Google Scholar]
  15. Su, T. Numerical Simulation Study on the Structure of Sea Breeze and Thunderstorm in Hainan Island. Master’s Thesis, Nanjing University of Information Science and Technology, Nanjing, China, 2016. [Google Scholar]
  16. Huang, L.F.; Bao, F.; Zhi, S.L. Analysis and numerical simulation of an early spring squall line process in Jingdezhen area. Meteorol. Disaster Reduct. Res. 2018, 41, 278–284. (In Chinese) [Google Scholar]
  17. Lu, R.; Sun, J.H.; Li, D.S. Numerical Experiment of the Influence of Initial Water Vapor Field on the Triggering and Mainte-nance of a Severe Squall Line in Spring in South China. J. Trop. Meteorol. 2019, 35, 37–50. (In Chinese) [Google Scholar]
  18. Zhu, Q.G.; Lin, J.R.; Shou, S.W.; Tang, D.S. Principles and Methods of Synoptics; Meteorological Press: Beijing, China, 2007; pp. 407–415. [Google Scholar]
  19. Bryan, G.H.; Morrison, H. Sensitivity of a Simulated Squall Line to Horizontal Resolution and Parameterization of Microphysics. Mon. Weather Rev. 2012, 140, 202–225. [Google Scholar] [CrossRef]
  20. Lu, J.; Qie, X.; Xiao, X.; Jiang, R.; Mansell, E.R.; Fierro, A.O.; Liu, D.; Chen, Z.; Yuan, S.; Sun, M.; et al. Effects of Convective Mergers on the Evolution of Microphysical and Electrical Activity in a Severe Squall Line Simulated by WRF Coupled with Explicit Electrification Scheme. J. Geophys. Res. 2022, 127, e2021JD036398. [Google Scholar]
  21. Cholette, M.; Milbrandt, J.A.; Morrison, H.; Paquin-Ricard, D.; Jacques, D. Combining Triple-Moment Ice With Prognostic Liquid Fraction in the P3 Microphysics Scheme: Impacts on a Simulated Squall Line. J. Adv. Model. Earth Syst. 2023, 15, e2022MS003328. [Google Scholar] [CrossRef]
  22. Ludlam, F.H. Severe Local Storms: A Review. In Severe Local Storms; American Meteorological Society: Boston, MA, USA, 1963; pp. 1–32. [Google Scholar]
  23. Klimowski, B.A.; Hjelmfelt, M.R.; Bunkers, M.J. Radar Observations of the Early Evolution of Bow Echoes. Weather Forecast. 2004, 19, 727–734. [Google Scholar] [CrossRef]
  24. Meng, Z.; Zhang, F.; Markowski, P.; Wu, D.; Zhao, K. A modeling study on the development of a bowing structure and associated rear inflow within a squall line over south China. J. Atmos. Sci. 2012, 69, 1182–1207. [Google Scholar] [CrossRef]
  25. Meng, Z.; Zhang, F.; Markowski, P.; Wu, D.; Zhao, K. An Observational Analysis of a Persistent Extreme Precipitation Event in the Post-Flood Season over a Tropical Island in China. Atmosphere 2022, 13, 679. [Google Scholar]
  26. Li, H.; Cao, J.; Li, X.; Wu, Z. Application of wind partitioning technique in a limited domain to the characteristics of the evolution of a squall line over Hainan Island. J. Nat. Disasters 2021, 30, 24–35. [Google Scholar]
  27. Zhang, C.; Shen, X.Y.; Zhang, L.; Wang, L.; Guo, C.Y.; Li, X.F. Multiscale energy interaction analysis of squall line upscale growth in South China. J. Trop. Meteorol. 2021, 37, 102–111. (In Chinese) [Google Scholar]
  28. Cui, Q.; Wang, C.M.; Zhang, Y.; Huang, H.; Yue, F.L. Analysis and numerical simulation of a squall line with thunderstorm and gale. Sci. Meteorol. Sin. 2017, 37, 673–682. (In Chinese) [Google Scholar]
  29. Liang, Z.; Wang, D. Sea breeze and precipitation over Hainan Island. Q. J. R. Meteorol. Soc. 2017, 143, 137–151. [Google Scholar] [CrossRef]
  30. Sun, R.; Wu, Z.; Chen, B.; Yang, C.; Qi, D.; Lan, G.; Fraedrich, K. Effects of land-use change on eco-environmental quality in Hainan Island, China. Ecol. Indic. 2020, 109, 105777. [Google Scholar] [CrossRef]
  31. Kelliher, F.M.; Hollinger, D.Y.; Schulze, E.D.; Vygodskaya, N.N.; Byers, J.N.; Hunt, J.E.; McSeveny, T.M.; Milukova, I.; Sogatchev, A.; Varlargin, A.; et al. Evaporation from an eastern Siberian larch forest. Agric. For. Meteorol. 1997, 85, 135–147. [Google Scholar] [CrossRef]
  32. Geng, S.W.; Wu, Z.X.; Yang, C. Variation characteristics of water vapor flux of rubber forest ecosystem and its response to environmental factors in Danzhou, Hainan. J. Northwest For. Univ. 2021, 36, 77–85. (In Chinese) [Google Scholar]
  33. Fu, S.; Rotunno, R.; Chen, J.; Deng, X.; Xue, H. A large-eddy simulation study of deep-convection initiation through the collision of two sea-breeze fronts. Atmos. Chem. Phys. 2021, 21, 9289–9308. [Google Scholar] [CrossRef]
  34. Li, N.; Ran, L.K.; Gao, S.T. Numerical simulation and diagnostic analysis of a squall line process in East China. Chin. J. Atmos. Sci. 2013, 37, 595–608. (In Chinese) [Google Scholar]
  35. Abbs, D.J.; Physick, W.L. Sea-breeze observations and modeling: A review. Aust. Meteorol. Mag. 1992, 41, 7–19. [Google Scholar]
  36. Miller, S.T.K.; Keim, B.D.; Talbot, R.W.; Mao, H. Sea breeze: Structure, forecasting, and impacts. Rev. Geophys. 2003, 41, 1–31. [Google Scholar] [CrossRef]
  37. Crosman, E.T.; Horel, J.D. Sea and lake breezes: A review of numerical studies. Bound Layer. Meteorol. 2010, 137, 1–29. [Google Scholar] [CrossRef]
  38. Stull, R.S. An Introduction to Boundary Layer Meteorology; Kluwer Academic Publishers: Norwell, MA, USA, 1988; pp. 416–419. [Google Scholar]
  39. Pei, C.C.; Zhao, Y.; Cheng, S. Analysis of the occurrence and development mechanism of a squall line process along the coast of Fujian. Meteorol. Sci. Technol. 2019, 47, 841–850. [Google Scholar]
  40. Johnson, R.H.; Parker, M.D. Structures and dynamics of quasi-2D mesoscale convective systems. J. Atmos. Sci. 2004, 61, 545–567. [Google Scholar]
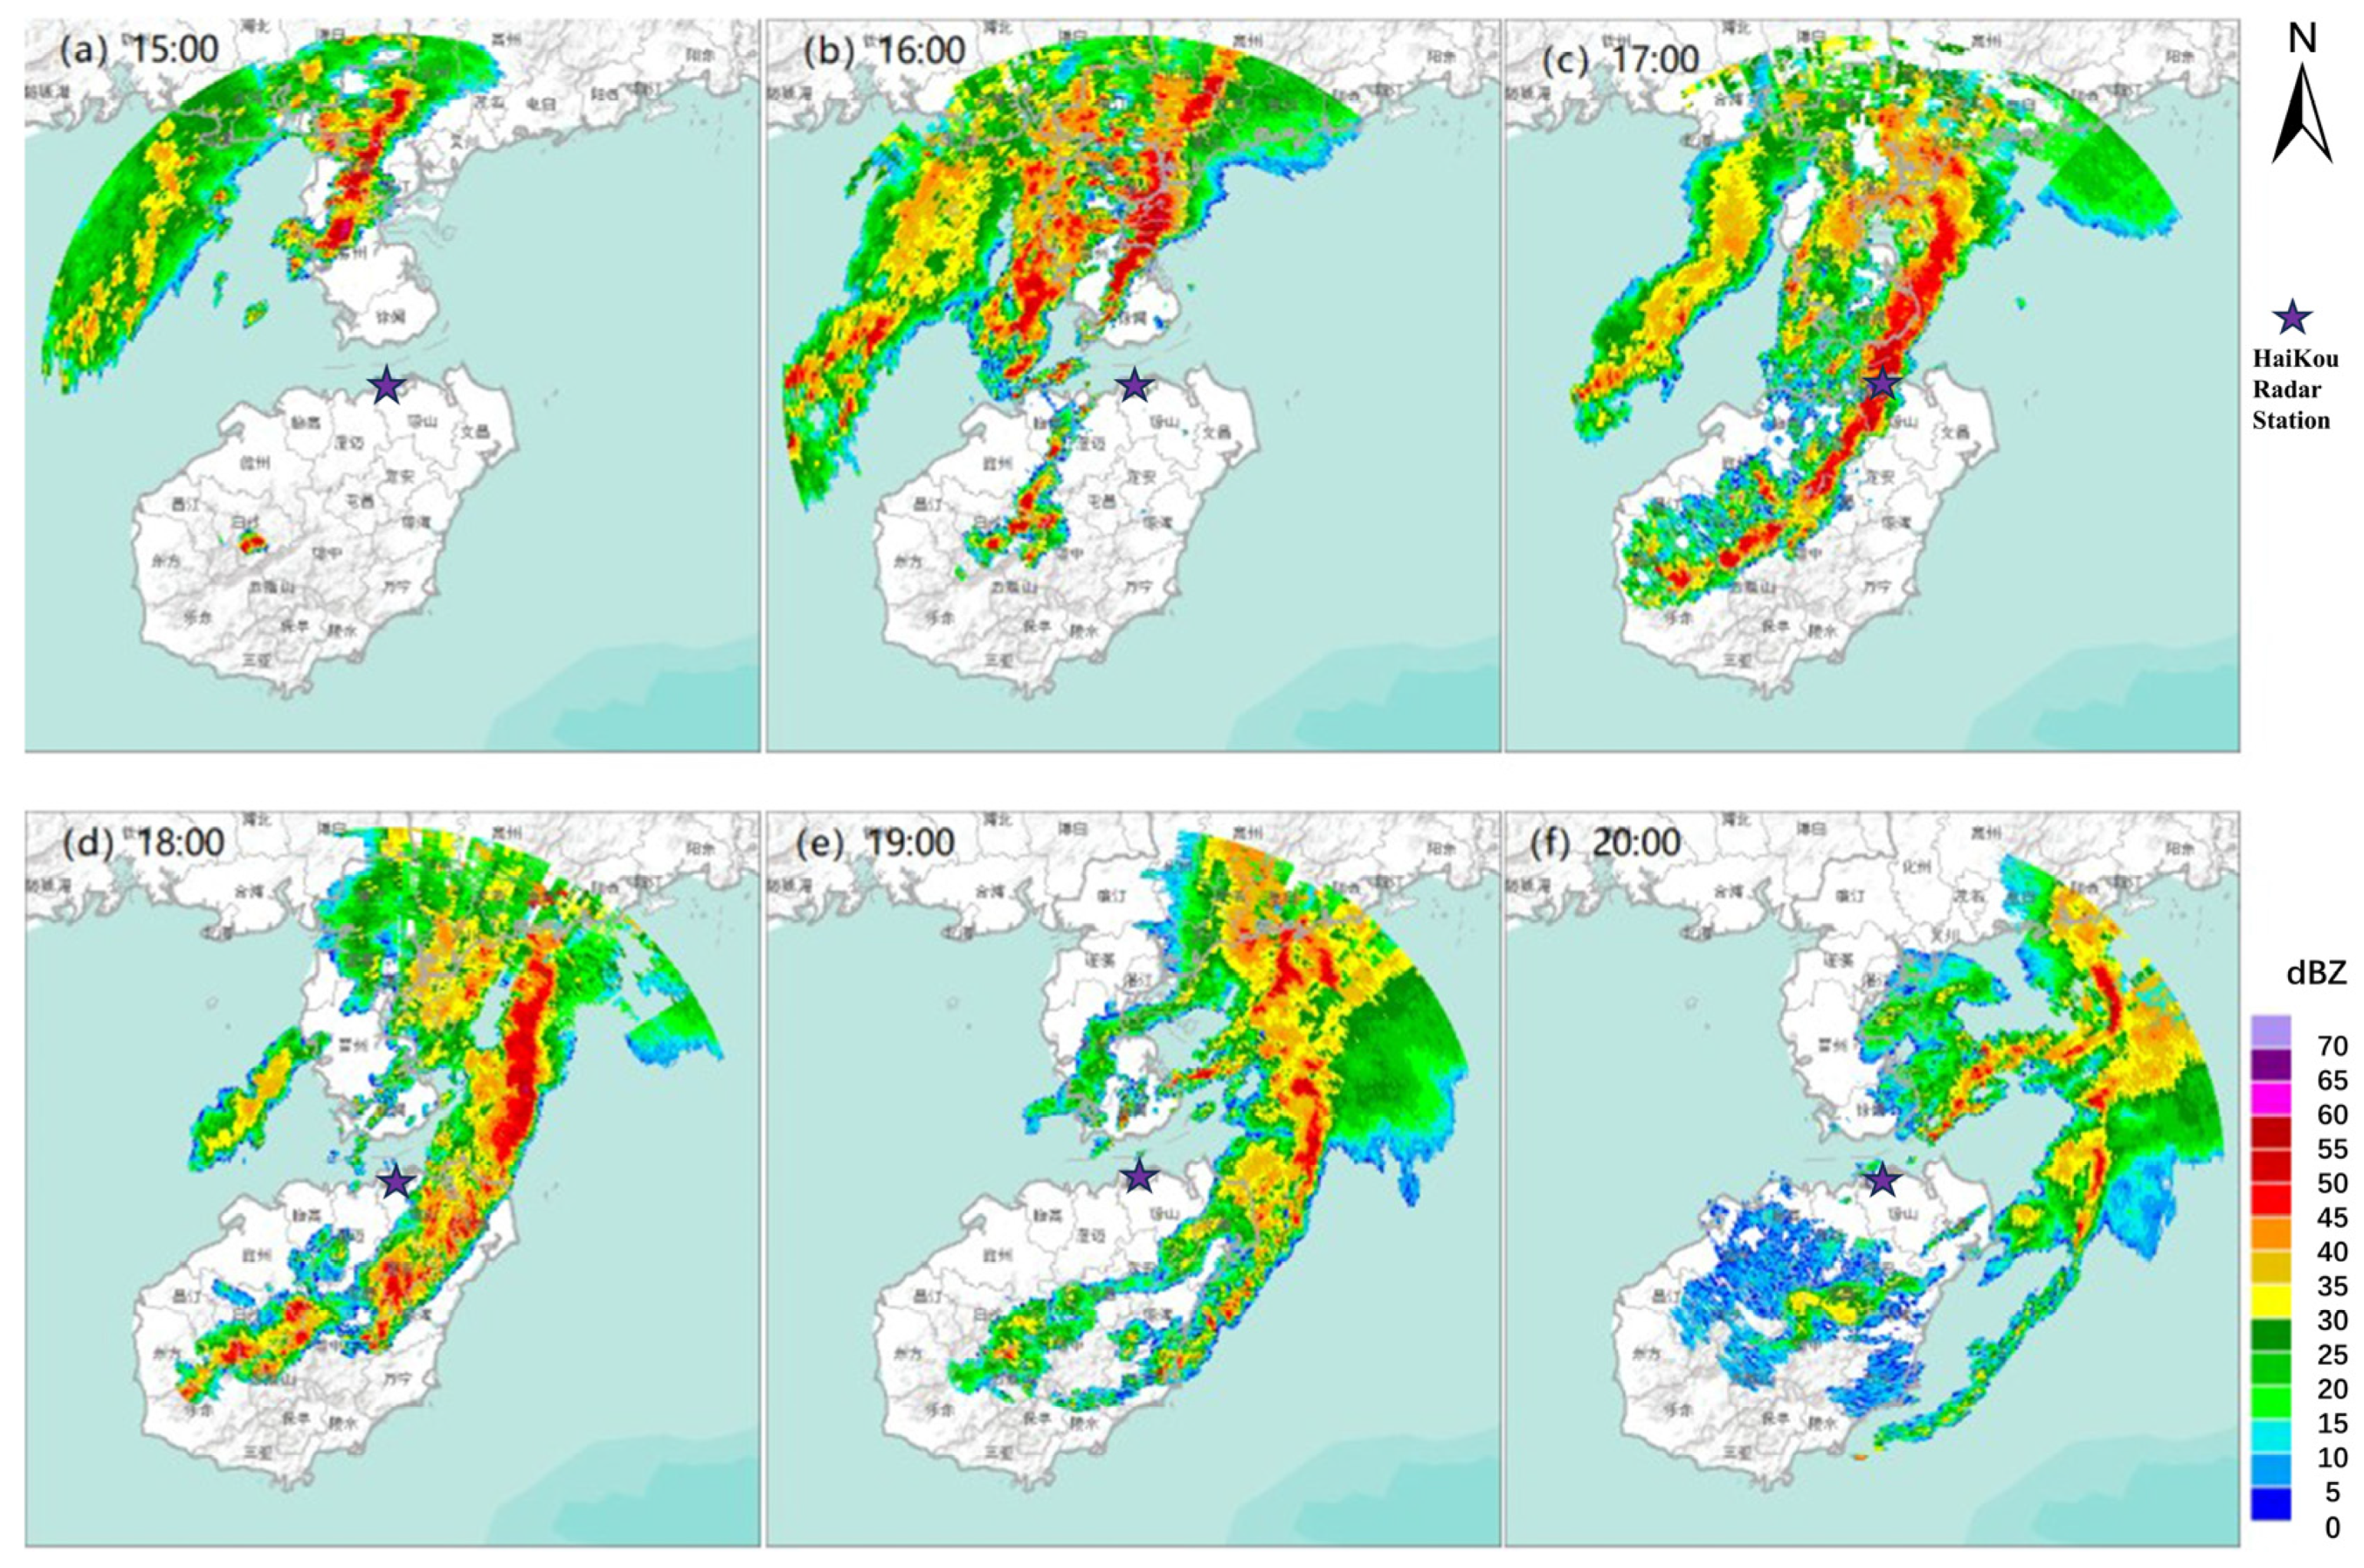
Figure 1. (af) The composite reflectance (unit: dBZ) of multiple operational weather radars in South China from 15:00-20:00(BST) on 22 April 2020, sourced from China Meteorological Data Network (http://data.cma.cn/ accessed on 11 August 2023).
Atmosphere 14 01651 g001
Figure 2. (a) 200 hPa height wind and temperature field (contourf, unit: dagpm) on 22 April 2020 (BST), (b) 500 hPa height wind and temperature field (contourf, unit: dagpm) on 22 April 2020 (BST), (c) 850 hPa height wind and temperature field (contourf, unit: dagpm) on 22 April 2020 (BST), and (d) sea level pressure field (contourf, unit: hPa) on 22 April 2020 (BST).
Atmosphere 14 01651 g002
Figure 3. WRF domain.
Atmosphere 14 01651 g003
Figure 4. Hainan Island terrain height; ABCD is the area of vertical profile.
Atmosphere 14 01651 g004
Figure 5. (af) Simulated basic reflectivity from 15:00 to 20:00 (BST) on 22 April 2020 (unit: dBZ).
Atmosphere 14 01651 g005
Figure 6. (a) Simulated 24-h cumulative precipitation on 22 April 2020 (BST), (unit: mm) (b) observed 24-h cumulative precipitation on 22 April 2020 (BST) (unit: mm).
Atmosphere 14 01651 g006
Figure 7. (ad) Simulated 10-m wind direction field (unit: m·s−1) and 2-m relative humidity field (unit: %) from 12:00 to 15:00 (BST) on 22 April 2020.
Atmosphere 14 01651 g007
Figure 8. (ad) Simulated vertical section of water vapor mixing ratio, cloud water mixing ratio, and rainwater mixing ratio (unit: g·kg−1) along the solid line AB in Figure 3b from 12:00 to 15:00 (BST) on 22 April 2020.
Atmosphere 14 01651 g008
Figure 9. Basic reflectance from 15:00 to 20:00 on 22 April 2020 (BST) simulated by a topographic sensitivity test (Figure (af)) (unit: dBZ).
Atmosphere 14 01651 g009
Figure 10. (af) Topographic sensitivity test of the simulated 10-m wind direction field (unit: m·s−1) and a 2-m relative humidity field (unit: %) from 15:00 to 20:00 on 22 April 2020 (BST).
Atmosphere 14 01651 g010
Figure 11. (a,c) Horizontal distribution of maximum convective available potential energy simulated (MCAPE) at 14:00 and 16:00 (BST). (b,d) Horizontal distribution of maximum convective inhibition energy (MCIN) simulated at 14:00 and 16:00 (unit: J·kg−1) on 22 April 2020 (BST).
Atmosphere 14 01651 g011
Figure 12. (ad) Simulated sea surface and land temperature (unit: k) on 22 April 2020 (BST) with simulated 10-m wind field (unit: m·s−1) (e) simulated superposition of 500 hPa horizontal wind field (black) and 850 hPa horizontal wind field (red) (unit: m·s−1).
Atmosphere 14 01651 g012
Figure 13. (a) Simulated vertical section of water vapor mixing ratio, cloud water mixing ratio, and rainwater mixing ratio (unit: g·kg−1) and vertical velocity (unit: m·s−1) along the solid line AB in Figure 3b at 15:00 BST); (b) simulated vertical section of water vapor mixing ratio, cloud water mixing ratio, and rainwater mixing ratio (unit: g·kg−1) and vertical velocity (unit: m·s−1) along the solid line CD in Figure 3b at 16:00 (BST).
Atmosphere 14 01651 g013
Figure 14. (af) simulated 3 h variation of ground potential temperature at 10 m (unit: k) and simulated vertical wind shear from 700 hPa to 900 hPa (unit: m·s−1) numerically on 22 April 2020 (BST).
Atmosphere 14 01651 g014
Table 1. WRF model setup.
ParametersGrid 1 (d01)Grid 2 (d02)Grid 3 (d03)Grid 4 (d04)
Dimension (x,y)99 × 99216 × 228342 × 384462 × 567
Grid size (km)27931
Map projectionLambert conformal conic projectionLambert conformal conic projectioLambert conformal conic projectioLambert conformal conic projectio
Output time (min)60606060
Microphysical schemeWSM6WSM6WSM6WSM6
Cumulus parameterization schemeTiedtkeTiedtke//
Boundary layer schemeYSUYSUYSUYSU
Radiation schemeRRTMGRRTMGRRTMGRRTMG
Land surface schemeNoahNoahNoahNoah
Surface-layer schemeMonin-ObukhovMonin-ObukhovMonin-ObukhovMonin-Obukhov
Disclaimer/Publisher’s Note: The statements, opinions and data contained in all publications are solely those of the individual author(s) and contributor(s) and not of MDPI and/or the editor(s). MDPI and/or the editor(s) disclaim responsibility for any injury to people or property resulting from any ideas, methods, instructions or products referred to in the content.