Article

A Low-Cost Wireless Sensor Network for Barn Climate and Emission Monitoring—Intermediate Results

1
Leibniz Institute for Agricultural Engineering and Bioeconomy (ATB), Department Sensors and Modeling, Max-Eyth-Allee 100, 14469 Potsdam, Germany
2
Technology and Food Science Unit, Flanders Research Institute for Agriculture, Fisheries and Food (ILVO), Burgemeester Van Gansberghelaan 92, 9820 Merelbeke, Flanders, Belgium
3
VIVES MaakLab, VIVES University of Applied Sciences, Spoorwegstraat 12, 8200 Bruges, Flanders, Belgium
4
Department of Veterinary Medicine, Institute of Animal Hygiene and Environmental Health, Free University Berlin (FUB), Robert-von-Ostertag-Str. 7-13, 14163 Berlin, Germany
5
Leibniz Institute for Agricultural Engineering and Bioeconomy (ATB), Department Technology Assessment, Max-Eyth-Allee 100, 14469 Potsdam, Germany
6
Faculty of Civil Engineering, Architecture and Environmental Engineering, University of Zielona Gora, Licealna 9/9, 65-417 Zielona Gora, Lubusz, Poland
*
Author to whom correspondence should be addressed.
Atmosphere 2023, 14(11), 1643; https://doi.org/10.3390/atmos14111643
Submission received: 10 August 2023 / Revised: 20 October 2023 / Accepted: 22 October 2023 / Published: 31 October 2023
(This article belongs to the Special Issue Observations and Management of Livestock Production Emissions)

Abstract

:
A barn’s climate is vital for animal welfare and emissions control, including greenhouse gases like methane (CH4) and carbon dioxide (CO 2 ) and environmental gases like ammonia (NH 3 ). The goal of this study was to investigate a developed low-cost online tool for monitoring barn climate and air pollutant emissions (OTICE) in naturally ventilated barns. OTICE employed a wireless sensor network with low-cost sensors for gases and climate variables, allowing scalable use across multiple barns. We evaluated the sensors for CO 2 , NH 3 , and CH4 for accuracy, both in controlled lab conditions and in a dairy barn in Germany, where measurements were carried out continuously for a duration of 12 days. For the averaged concentration levels over the measurement period, the low-cost sensors agreed well with the reference system, with relative deviations lower than 7% for all three gases, with maximum peak deviations up to 32% for CO 2 , 67% for NH 3 , and 65% for CH 4 , with strong Spearman correlations for CO 2 and NH 3 ( ρ C O 2 = 0.8, ρ N H 3 = 0.68) and a rather weak correlation for CH4 with ρ C H 4 = 0.24. Further calibration and stability investigations are required, especially for CH4 sensing. However, the overall good results for NH 3 and especially CO 2 measurements indicate a huge potential of the low-cost system as a valuable tool for monitoring relative NH 3 emission levels and the measurement of air exchange rates in naturally ventilated barns.

1. Introduction

In Europe, the dairy sector is of great socio-economic importance but also one of the major emitters of greenhouse gases like CH4, carbon dioxide CO 2 , or nitrous oxide (N 2 O) and environmental relevant gases like NH 3 [1,2]. Usually, dairy housing systems are naturally ventilated, and gaseous emissions from these housing systems are estimated via indirect mass balance methods, where the metabolically produced (CO 2 ) is used as a natural tracer gas (further called CO 2 balance method). When applying indirect mass balance methods, the emissions of pollutant gases E p are estimated as the product of the volume flow and the pollutant gas concentration. The volume flow is computed as the ratio of produced CO 2 by the animals (this term is modeled, as described in [3]) and the difference of CO 2 concentrations in the air inside the barn and the ambient air that is entering the barn. Hence, the most crucial thing is the accurate measurement of pollutant gas and tracer gas concentrations.
In naturally ventilated buildings, pollutant gases like methane (CH 4 ) and ammonia (NH 3 ) are in low concentrations, requiring in most cases the use of an elaborated measurement setup with costly gas analyzers and sampling devices. State-of-the-art analyzers are Fourier transform infrared (FTIR) or cavity ring-down (CRDS) spectroscopes (e.g., [4,5]), where the cost alone for acquisition exceed a EUR 100k threshold [6]. Thus, measurements are often limited to few scientific-focus barns and not suitable for a broad application. This is a drawback, since the availability of information on emission levels at large scale in real time would be of great value, both for a tailored and site-adapted optimization monitoring, control, and management but also to gather new knowledge on, e.g., emission dynamics with big data approaches. A way to overcome this limitation is the use of low-cost sensor systems. The idea behind this is to accept a loss in accuracy due to the cheaper measurement instrument in order to gain the capability of upscaling measurements to several hundreds of barns at the same time. This is beneficial, because the high variability in between different barn systems (including their individual building features, management regimes, animal characteristics, etc.), as shown, e.g., by [7], can be recorded, which enables to draw way more general conclusions than what is currently available.
In recent years, efforts have been made to study the capability of low-cost sensors. These sensors typically rely on other measurement principles like optical absorption, electrochemical, and electrical resistance (metal oxide semiconductors) techniques. The optical absorption technique measures gas concentrations by measuring the amount of lost electromagnetic energy, i.e., attenuation, due to absorption by the target gas [8]. Nondispersive infrared (NDIR) spectroscopy is also an absorption-based technique. Compared with other methods, the NDIR technique is considered the simplest approach due to its moderate sensitivity and fast response. Furthermore, NDIR detectors require low maintenance and are relatively economical compared to other gas detection systems. These detectors have been used to measure the concentration of more than 100 types of gases [9]. The problem associated with this type of sensors are they are greatly affected by humidity and ambient pressure. Electrochemical (EC) sensors detect gases by producing a chemical reaction between the gas and oxygen contained in the sensor. This reaction produces a small current, which is proportional to the concentration of the gas present [10]. EC sensors are moderately accurate, selective, and low-cost. The sensing technique is commonly applied in measurements of NH 3 and NOx at ppmv levels. A major drawback of EC sensors is that the electrolyte is consumed in the measuring process, which greatly limits the sensor’s lifespan especially under continuous or high-concentration exposures. The sensors can also slowly lose sensitivity and drift under clean conditions due to the deterioration of electrodes or drying-up of electrolytes. Frequent accuracy checks and recalibration are often needed. Metal oxide semiconductors (MOS) are widely studied and exploited layers in gas-sensing devices, mainly as conductometric sensors (or chemiresistors), i.e., for transducing the reaction with the gaseous molecules through a change in the electrical resistance. The potential of chemiresistors arises from their sensitivity to several gases, their reduced size and weight, which make them suitable for developing portable instrumentation, the reduced preparation costs, and the compatibility with Si technology [11,12]. However, several drawbacks go along with the benefits of MOS-based sensors. A poor selectivity and strong temperature and humidity dependency is sometimes reported, which can be a major limitation for these sensors under ambient conditions [13].
Only a few studies can be found in the literature that investigated the application of low-cost sensors to monitor relevant gas concentrations and/or emission levels from agriculture, particularly livestock housing. Calvet et al. [14] investigated the suitability of a wireless sensor network to measure CO 2 concentrations in livestock housing systems with low-cost sensors. They tested 12 sensor nodes, each equipped with an NDIR sensor for CO 2 gas concentrations in a laboratory room. After a single sensor calibration, they found a precision in the range of 80 to 110 ppm and concluded that the investigated sensors were suitable to monitor animal welfare and environmental control in poorly ventilated livestock housings. Mendes et al. [15] investigated under real farm conditions the use of low-cost NDIR sensors for the measurement of CO 2 concentrations with two different reference systems (open-path laser and photoacoustic spectroscopy). One sensor was available for around EUR 300. They found an overprediction of the NDIR sensors at 60 ppm and concluded that the sensors were suitable to monitor single-point or averaged spatial CO2 concentrations in livestock barns. von Jasmund et al. [16] tested two types of NH 3 sensors in the lower-price segment (Polytron 8100 and C300) under laboratory conditions with a calibration gas and humidity generator. The tested sensors measured NH 3 following an electrochemical principle; one sensor could be purchased for roughly EUR 1000. They found for test gas concentrations of 2.5 ppm and 5 ppm, an average relative error of around 8% for the C300 and around 18% for the Polytron 8100. The use of a low-cost MOS sensor for the measurements of NH 3 in a poultry house was shown by Lin et al. [17]. They developed a MOS sensor with temperature and humidity correction, the costs for material were around EUR 420. After testing in a poultry barn, they measured a relative error of 7% and concluded that the developed sensor was accurate and suitable to be used as a barn climate control unit. Zhuang et al. [18] evaluated a “cost-effective” monitoring system under real conditions on a pig-fattening farm. The investigated device (Axetris laser gas detection module) measured NH 3 concentrations following an NDIR measurement principle. With a price of around EUR 6500, it could be classified as midcost rather than low-cost. Compared to FTIR reference measurements, they reported relative average errors of 5.9% and 0.5%, respectively, for two different test conditions.
No studies were found that investigated the use of low-cost sensors for the measurement of CH4 for barn climate and emission purpose. Several studies exist for the use of individual-animal measurements of CH4 emissions (so called “sniffer”) in dairy barns e.g., [19,20]. However, these application usually deal with much higher concentrations of CH4 in the exhaled air (at least by a factor 10) and cannot really be compared to barn climate investigations.
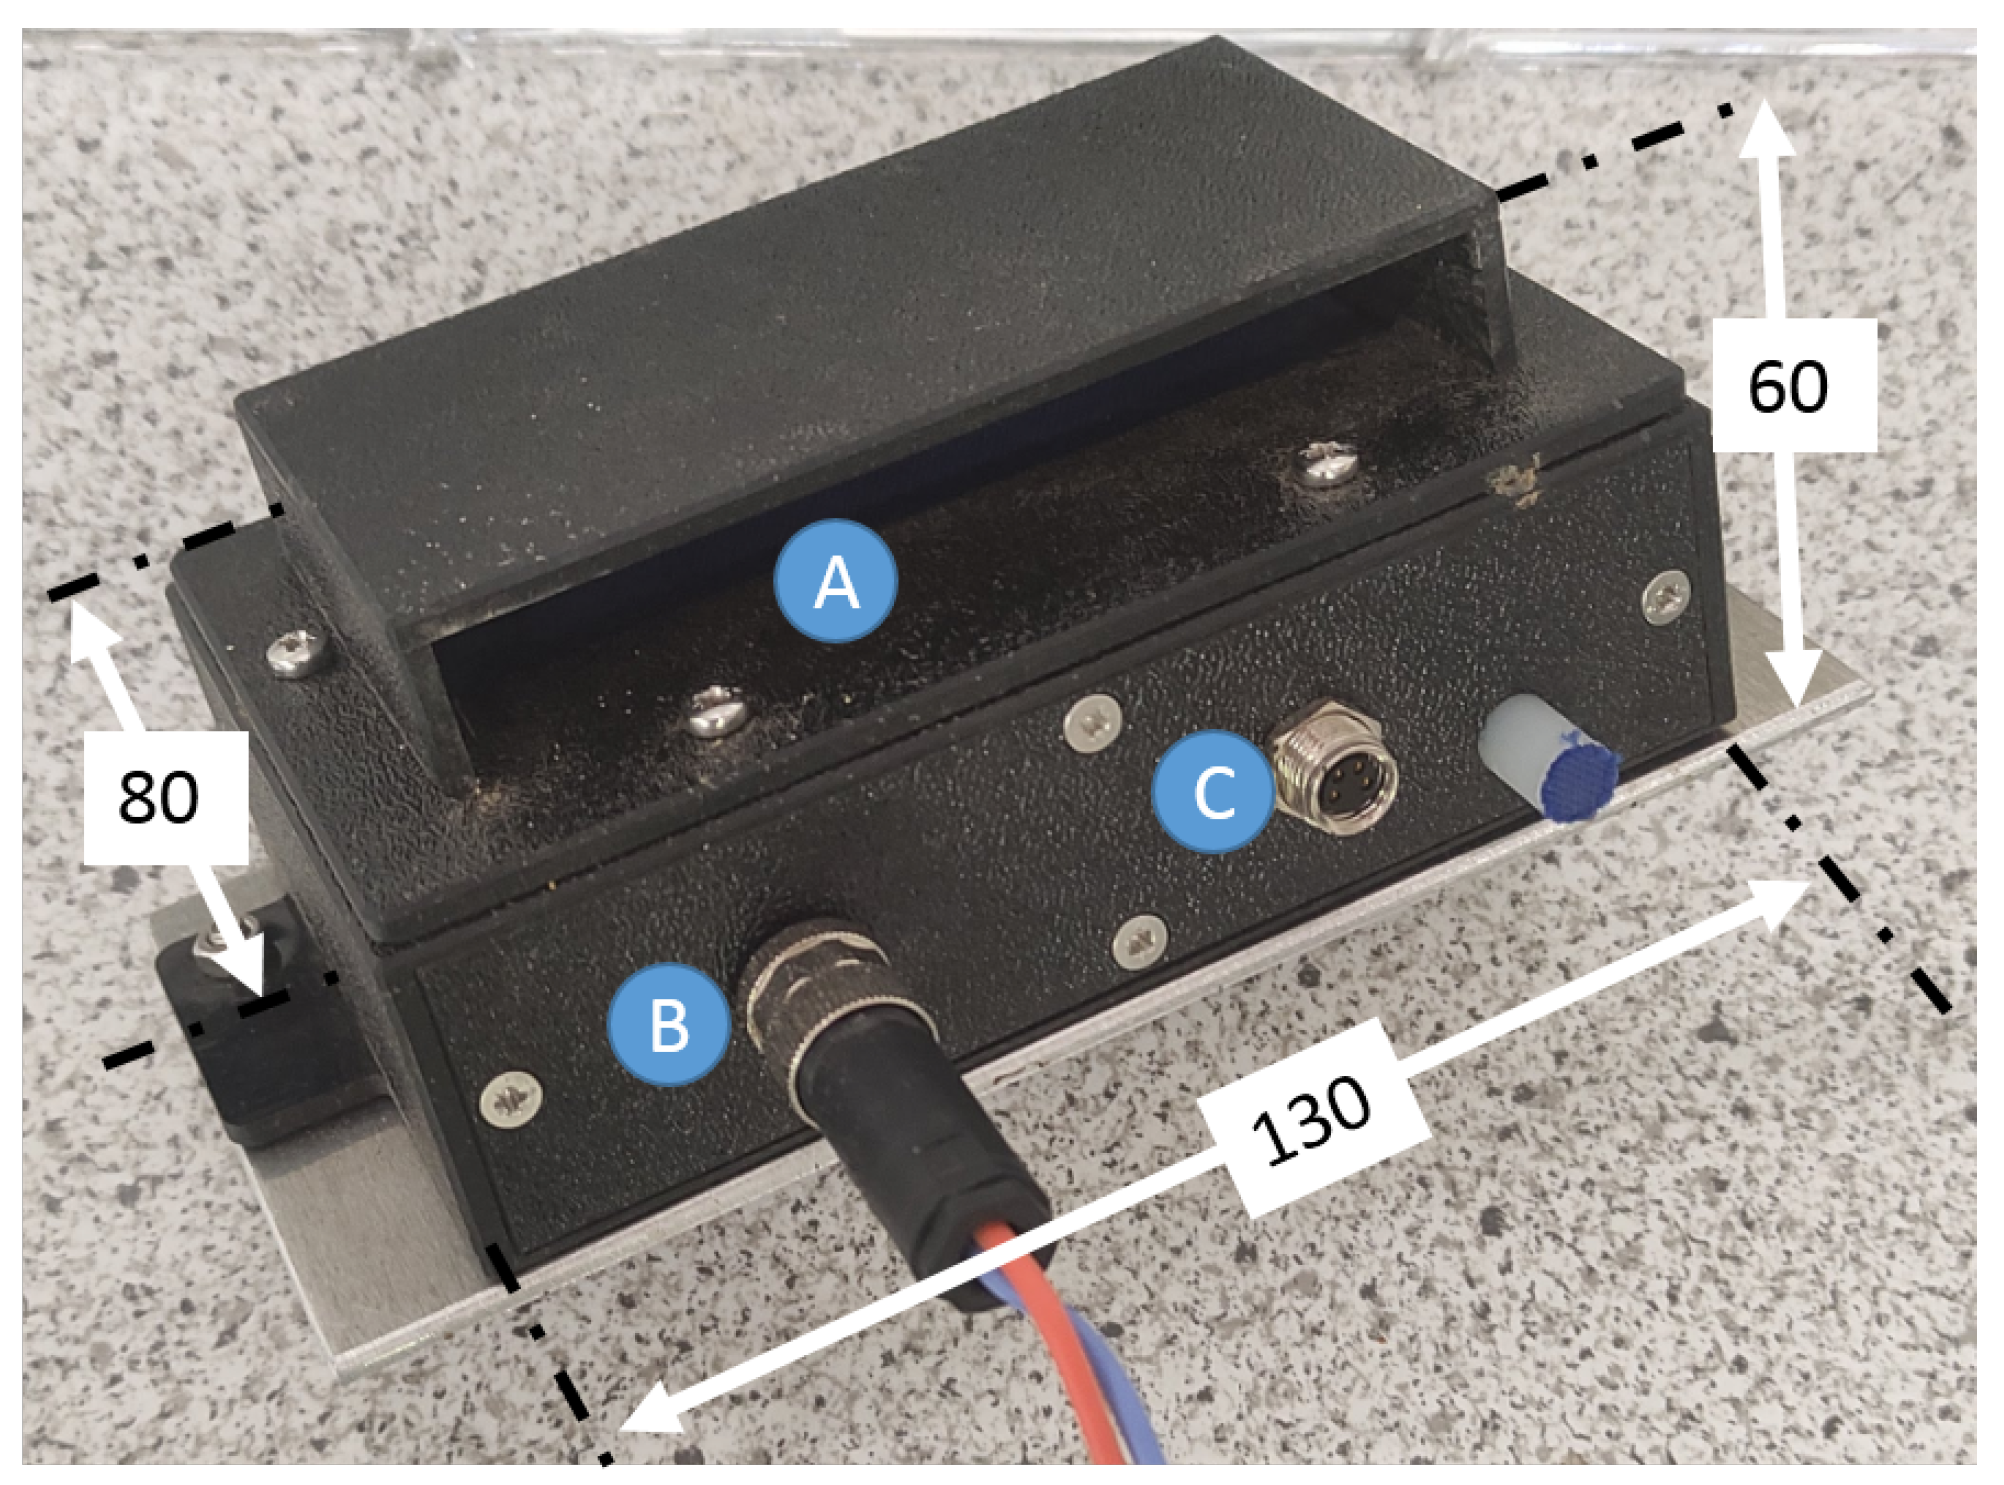
To the knowledge of the authors, no low-cost sensor system is available that enables the estimation of emission levels of methane, carbon dioxide, and ammonia in parallel and real time in naturally ventilated barns. To fill this gap, a wireless, low cow-cost, online tool for monitoring indoor barn climate and emission levels of air pollutants from naturally ventilated barns, further called “OTICE”, was developed. OTICE is equipped with a wireless sensor network (WSN), which consists of spatially distributed WSN nodes.
In this paper, we investigate the feasibility of these OTICE-WSN nodes to accurately measure concentrations of pollutant and tracer gases inside a naturally ventilated barn, which is the basic requirement for emission estimation. The focus is on the pollutant gases CH4 and NH 3 , and the tracer gas CO 2 . The aim of this study is therefore the quantification of uncertainties in the measurement of concentrations of CO 2 , NH 3 , and CH 4 . As a result, the feasibility of the OTICE-WSN as an emission monitoring tool can be assessed.

2. Materials and Methods

The OTICE-WSN nodes were investigated in a two-stage approach. First, the WSN nodes were investigated and calibrated in the lab under controlled atmospheric conditions. Then, with the applied calibration, the system was validated under real-barn conditions, with a state-of-the-art measurement system as a reference.

2.1. Wireless Sensor Network of OTICE

OTICE allows the real-time monitoring and processing of a variety of data measured inside several animal housing systems in parallel. One node is shown in Figure 1. The OTICE-WSN consists of distributed nodes, each equipped with a sensor for NH 3 , CO 2 , CH 4 , carbon monoxide (CO), nitrogen dioxide (NO 2 ), temperature (T), relative humidity (RH), ambient pressure (p), and ambient light (illuminance). The nodes communicate with each other via the MyriaNed protocol and can send their information in real time through a gateway to any end device. For CO 2 concentrations, NDIR-based sensors are used, and chemiresistors-based (metal oxide semiconductor) sensors are used to measure both CH4 and NH 3 concentrations. In the following, the WSN node’s integrated sensors for CO 2 , NH 3 , and CH 4 are described. To give a rough classification of the costs, the price of each sensor to the date of publication of this study is given, based on an online search, where the price of the most expensive supplier was chosen.
For CO 2 measurements, the EE894 gas sensor module from E+E Elektronik was used [21]. It measures CO 2 following dual wavelength NDIR (nondispersive infrared). The working range is stated as 0–2000 ppm in the manufacturer’s specifications, with an uncertainty of ±50 ppm. One sensor is available for EUR 82. For CH4 measurements, the MOS sensor TGS 2611-E00 from FIGARO was used [22], which has a working range of 300–10,000 ppm. One sensor is available for EUR 17. For measuring NH 3 , the MICS-6814 multigas sensor from Amphenol SGX Sensortech was used [23]. It utilizes the metal oxide semiconductor (MOS) principle. According to the manufacturers’ specifications, the sensor performs for concentration ranges between 1 ppm and 300 ppm. One sensor is available for EUR 12. The resolution of the output signals is 1 ppm for CO 2 and 0.01 ppm for NH 3 and CH4. For both the NH 3 and CH4 sensors, no measurement uncertainties were given in the respective data sheets.

2.2. Setup of the Laboratory Conditions

The WSN nodes were tested in a calibration chamber, shown in Figure 2, under different gas concentration mixtures of CH 4 and NH 3 . For that, a calibration gas generator was used (HovaCAL N 122-SP, IAS GmbH, Oberusel, Germany), which flushed the chamber with the desired mixture of the investigated gases with synthetic air as a dilution medium. Two ventilators with a diameter of 5 cm inside the chamber were running while taking the measurements to enable a homogeneous distribution of gas concentration. The gas concentrations inside the chamber were measured permanently with an FTIR gas analyzer (Gasmet CX4000, Gasmet Technologies Inc., Karlsruhe, Germany), which sucked the air from the chamber, analyzed it, and exhausted it back into the chamber. For CH 4 , concentrations of 5, 10, 15, 20, 25, 28, and 30 ppm and for NH 3 , concentrations of 1, 2, 3, 4, and 5 ppm were recorded with the OTICE nodes. These ranges of concentration values were chosen based on preliminary measurements in the barn.
The values measured with the FTIR sensor were used as reference data to generate calibration curves for the recorded output signals of the WSN node at the lower concentration levels. Figure 3 shows the calibration curves for CH4 and NH 3 , as the merging of the calibration curves given by the manufacturer and the curves measured with the calibration chamber. For CH4, the calibration curve was not monotone, with a maximum around 20 ppm. Hence, a monotone extrapolation of the manufacturers’ curve was taken instead.

2.3. Setup of the On-Farm Experiments

In Brandenburg, Eastern Germany, a naturally ventilated dairy facility for teaching and research was used to conduct the validation measurements under real-barn circumstances (approximately 56 km west of Berlin). The dairy building was 18 m wide and 38 m long. The fiber cement roof’s height ranged from 6.2 m at the gable peak to around 3.6 m at the sides. It was designed to accommodate 54 animals. The gable top of the roof, which was roughly 7 m distant from the feeding alley, was asymmetrical. Further detailed information on the barn are given in [24]. Gas concentrations were measured both with OTICE and a reference system at the same time. The reference system consisted of an FTIR gas analyzer (Gasmet CX4000, Gasmet Technologies Inc., Karlsruhe, Germany), which measured concentrations of CO 2 , NH 3 , and CH 4 in parallel, with a relative measurement uncertainty of <6% for all gases. In the barn, a sampling tube made of polytetrafluoroethylene (PTFE) with an inner diameter of 6 mm was installed at a height of 2.7 m along the symmetry line of the barn. Air was sucked constantly through this tube and provided to the gas analyzer. The tubes were equipped with capillary traps (critical orifices) every 5 m to ensure a constant volume flow over the whole length. Ten OTICE nodes were aligned along the tube positioned near the respective capillary traps. A detailed sketch can be found in Figure 4.

2.4. Data Processing

Every 10 min, each node sent out a data set. This contained the resistor ratios Rs/R0 (in the following, referred to as output signal) measured by the NH 3 and CH 4 sensors, a concentration value for CO 2 , and values of the environmental parameters T, RH, and p, all as averages over the 10 min measurement time. The OTICE-WSN measurement results are shown as the averaged value of the 10 nodes. The averaged output signals were assigned to concentration values using the calibration curves shown in Figure 3.

2.5. Data Analysis

The dynamics of the concentration data obtained by OTICE-WSN and FTIR were inspected visually for the individual gases using time series plots and scatter plots. In the case of CH 4 , a color-coded scatter plot was also generated. A cubic spline was fitted to the calibration curve in the range of the on-farm measured resistor ratio values to assign colors to concentration values which corresponded to certain ranges of resistor ratio values.
In addition, as a quantitative measure of similarity, the correlation was calculated between FTIR and OTICE concentration data for all three gases. Spearman’s rank correlation coefficient was used instead of the most common Pearson product moment correlation coefficient, since the distributions of the data were not Gaussian. Besides the dynamics, the distributions of the measured data were also compared to identify potential systematic biases. Here, we considered a standard histogram equalization method, looking for a transfer function such that the intensity histogram of the corrected data matched the intensity histogram of the reference data (here, the FTIR data). Such a transfer function can be obtained by re-sorting both time series by intensity and performing a regression analysis on the ranked data sets [25]. This method focuses only on the distribution of values and neglects any temporal relations. In our analysis, we did not estimate the transfer function explicitly but used the rank-ordered plotting to investigate biases associated with the OTICE-WSN sensors qualitatively.

3. Results

Gas concentrations were measured with both devices, FTIR and OTICE-WSN, from 15 May 2022 until 26 May 2022 inside the barn. With a temporal resolution of 10 min, this measurement duration resulted in 1720 data sets overall, with respective information on concentrations of CO 2 , NH 3 , and CH 4 and on T and RH. 
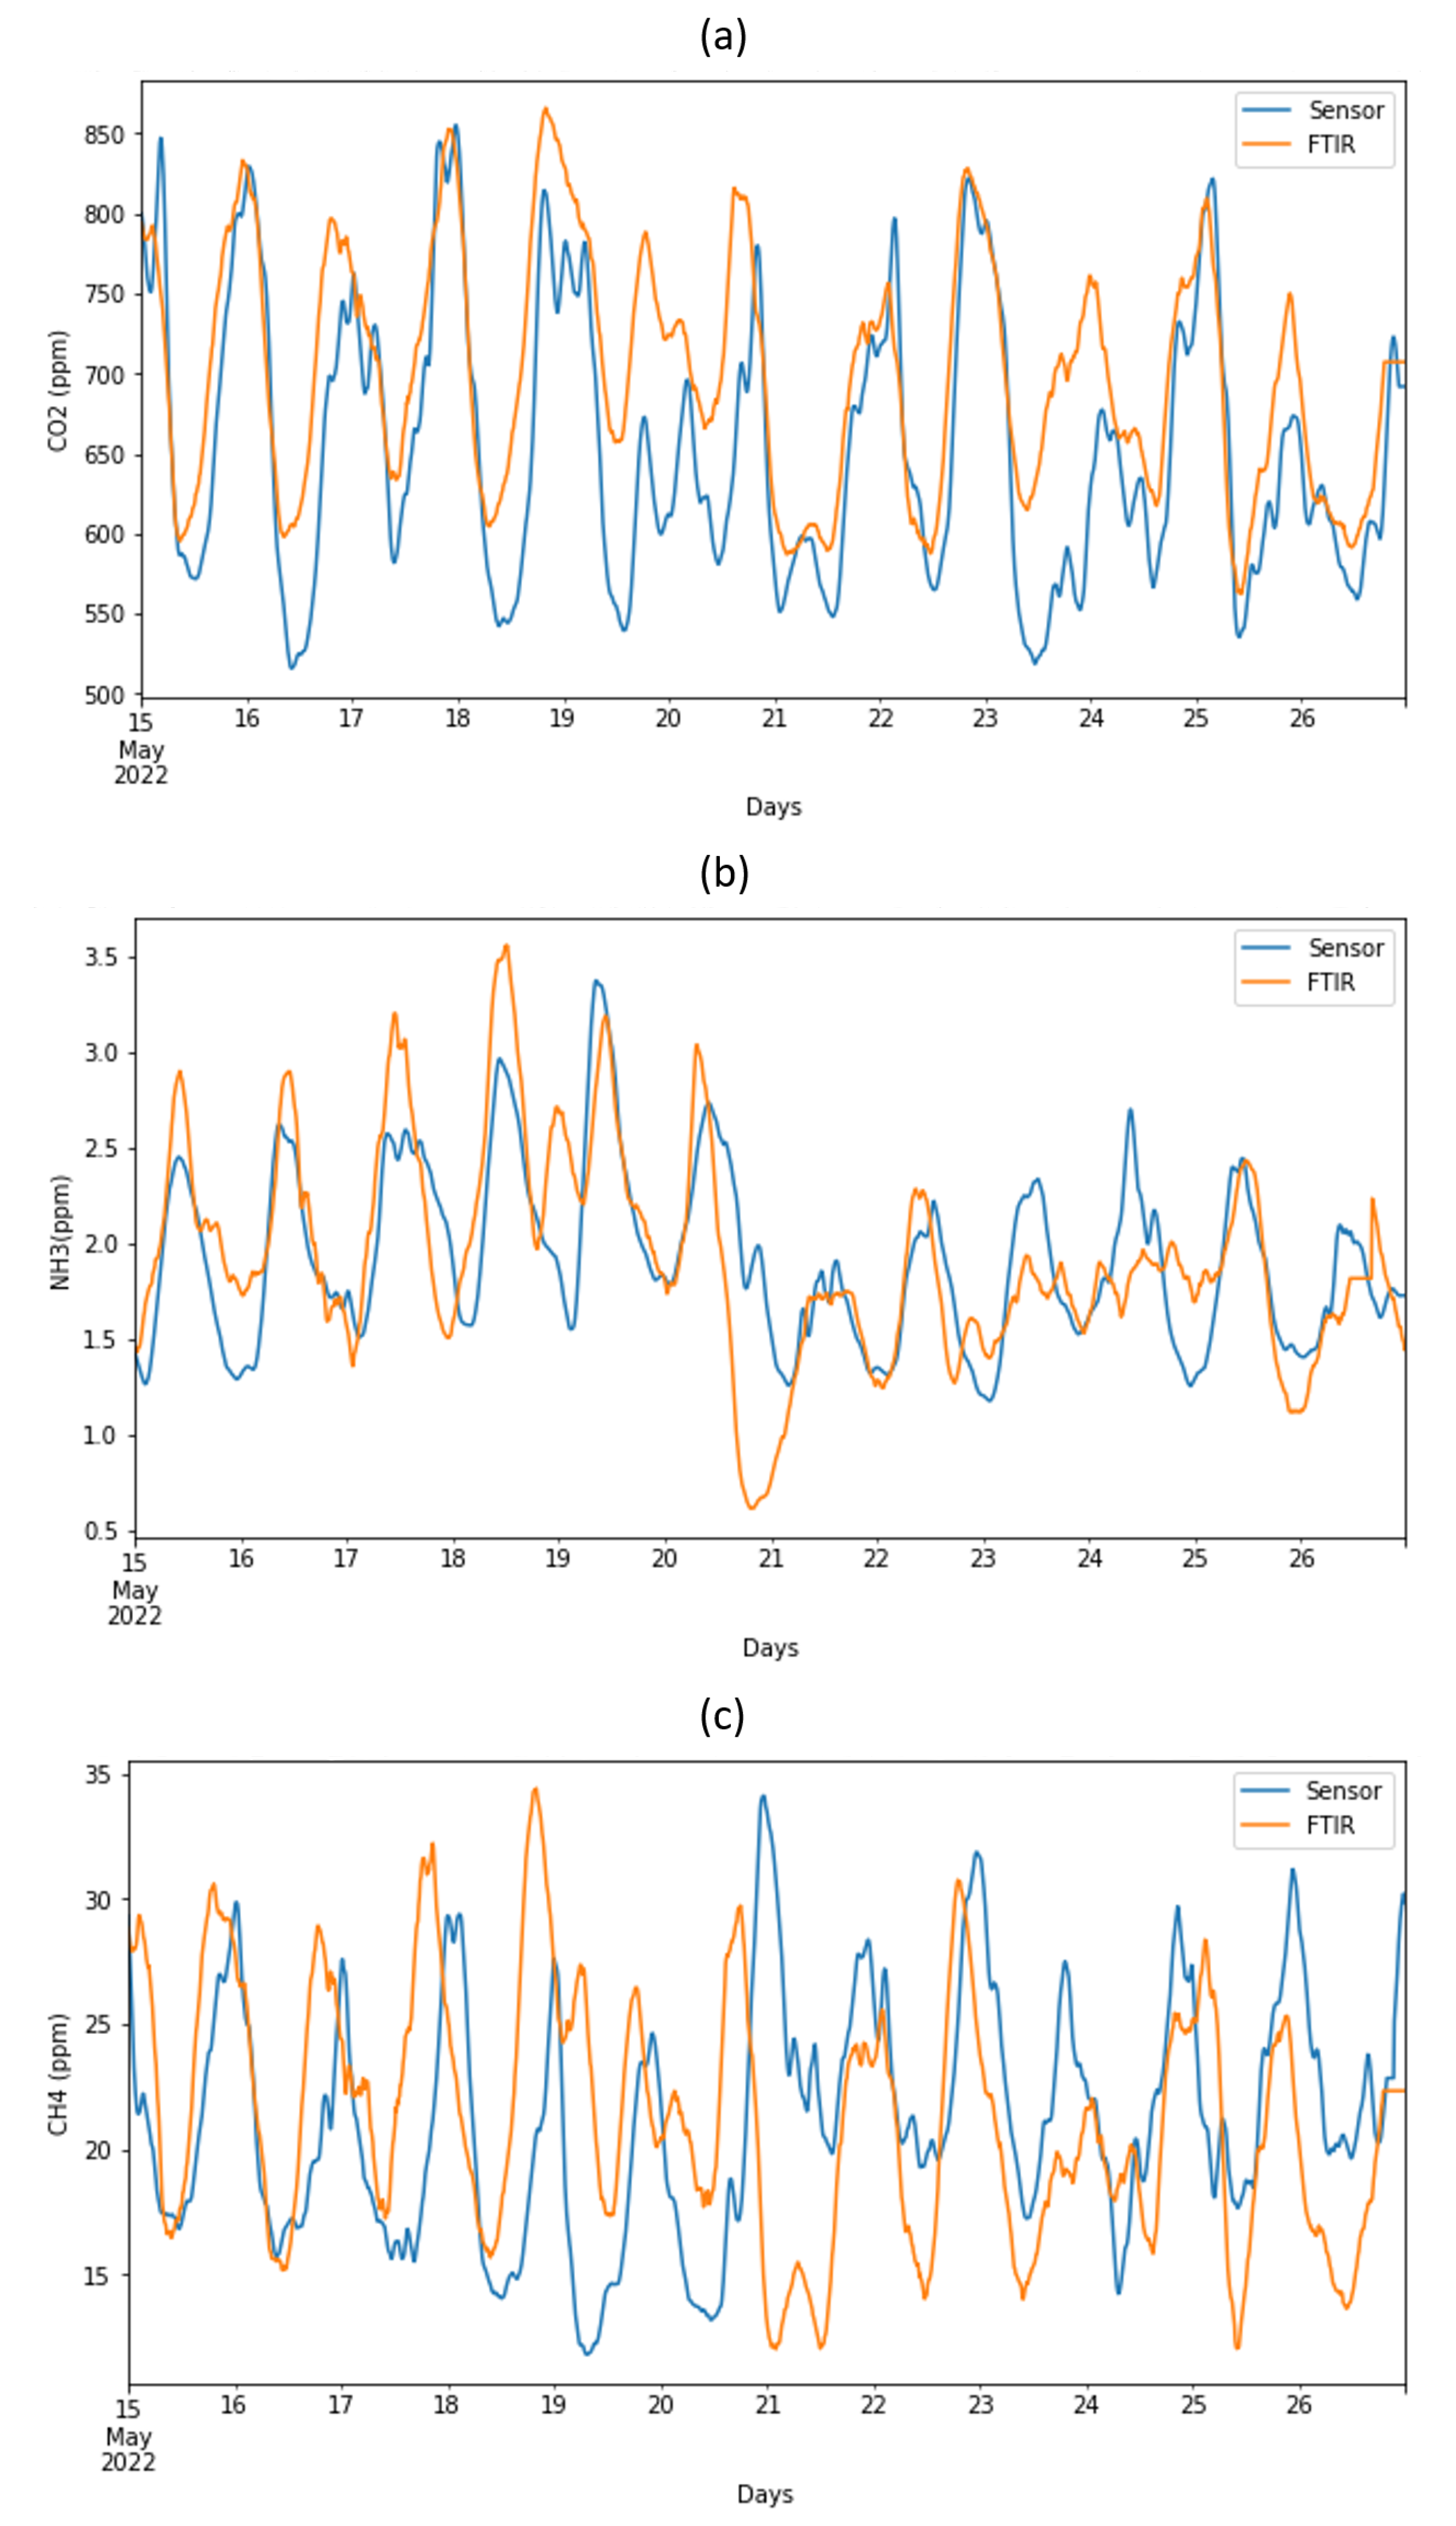
Figure 5 displays the measured concentrations of the three investigated gases as time series.
For the FTIR reference system, the data ranges were between 562 ppm and 866 ppm for CO 2 , between 0.62 ppm and 3.56 ppm for NH 3 , and between 12.0 ppm and 34.4 ppm for CH 4 . For the OTICE-WSN system, the data ranges were between 516 ppm and 855 ppm for CO 2 , between 1.17 ppm and 3.37 ppm for NH 3 , and between 11.8 ppm and 34.1 ppm for CH 4 . The mean values averaged over the whole period for the FTIR measurements were 1.93 ppm for NH 3 , 21.38 ppm for CH 4 , and 700 ppm for CO 2 . The mean values averaged over the whole period for the OTICE-WSN measurements were 1.92 ppm for NH 3 , 21.31 ppm for CH 4 , and 655 ppm for CO 2 . This corresponded to an average relative deviation of <1% for NH 3 and CH 4 , and <7% for CO 2 between the OTICE-WSN and the reference results. When comparing the instantaneous values of OTICE-WSN with the reference, the maximum deviations in the time series were Δ C H 4 = 20 ppm or +62% (day 21), Δ N H 3 = 1.34 ppm or +67% (day 20), and Δ C O 2 = 180 ppm or −32% (day 23).
The time series of all three gas concentrations showed a distinct diurnal pattern, which was captured by both measurement systems. For CO 2 and CH4, the concentrations had their maximum around midnight and a minimum around noon. The NH 3 concentrations showed the opposite behavior with their maxima around daytime and minima around noon. 
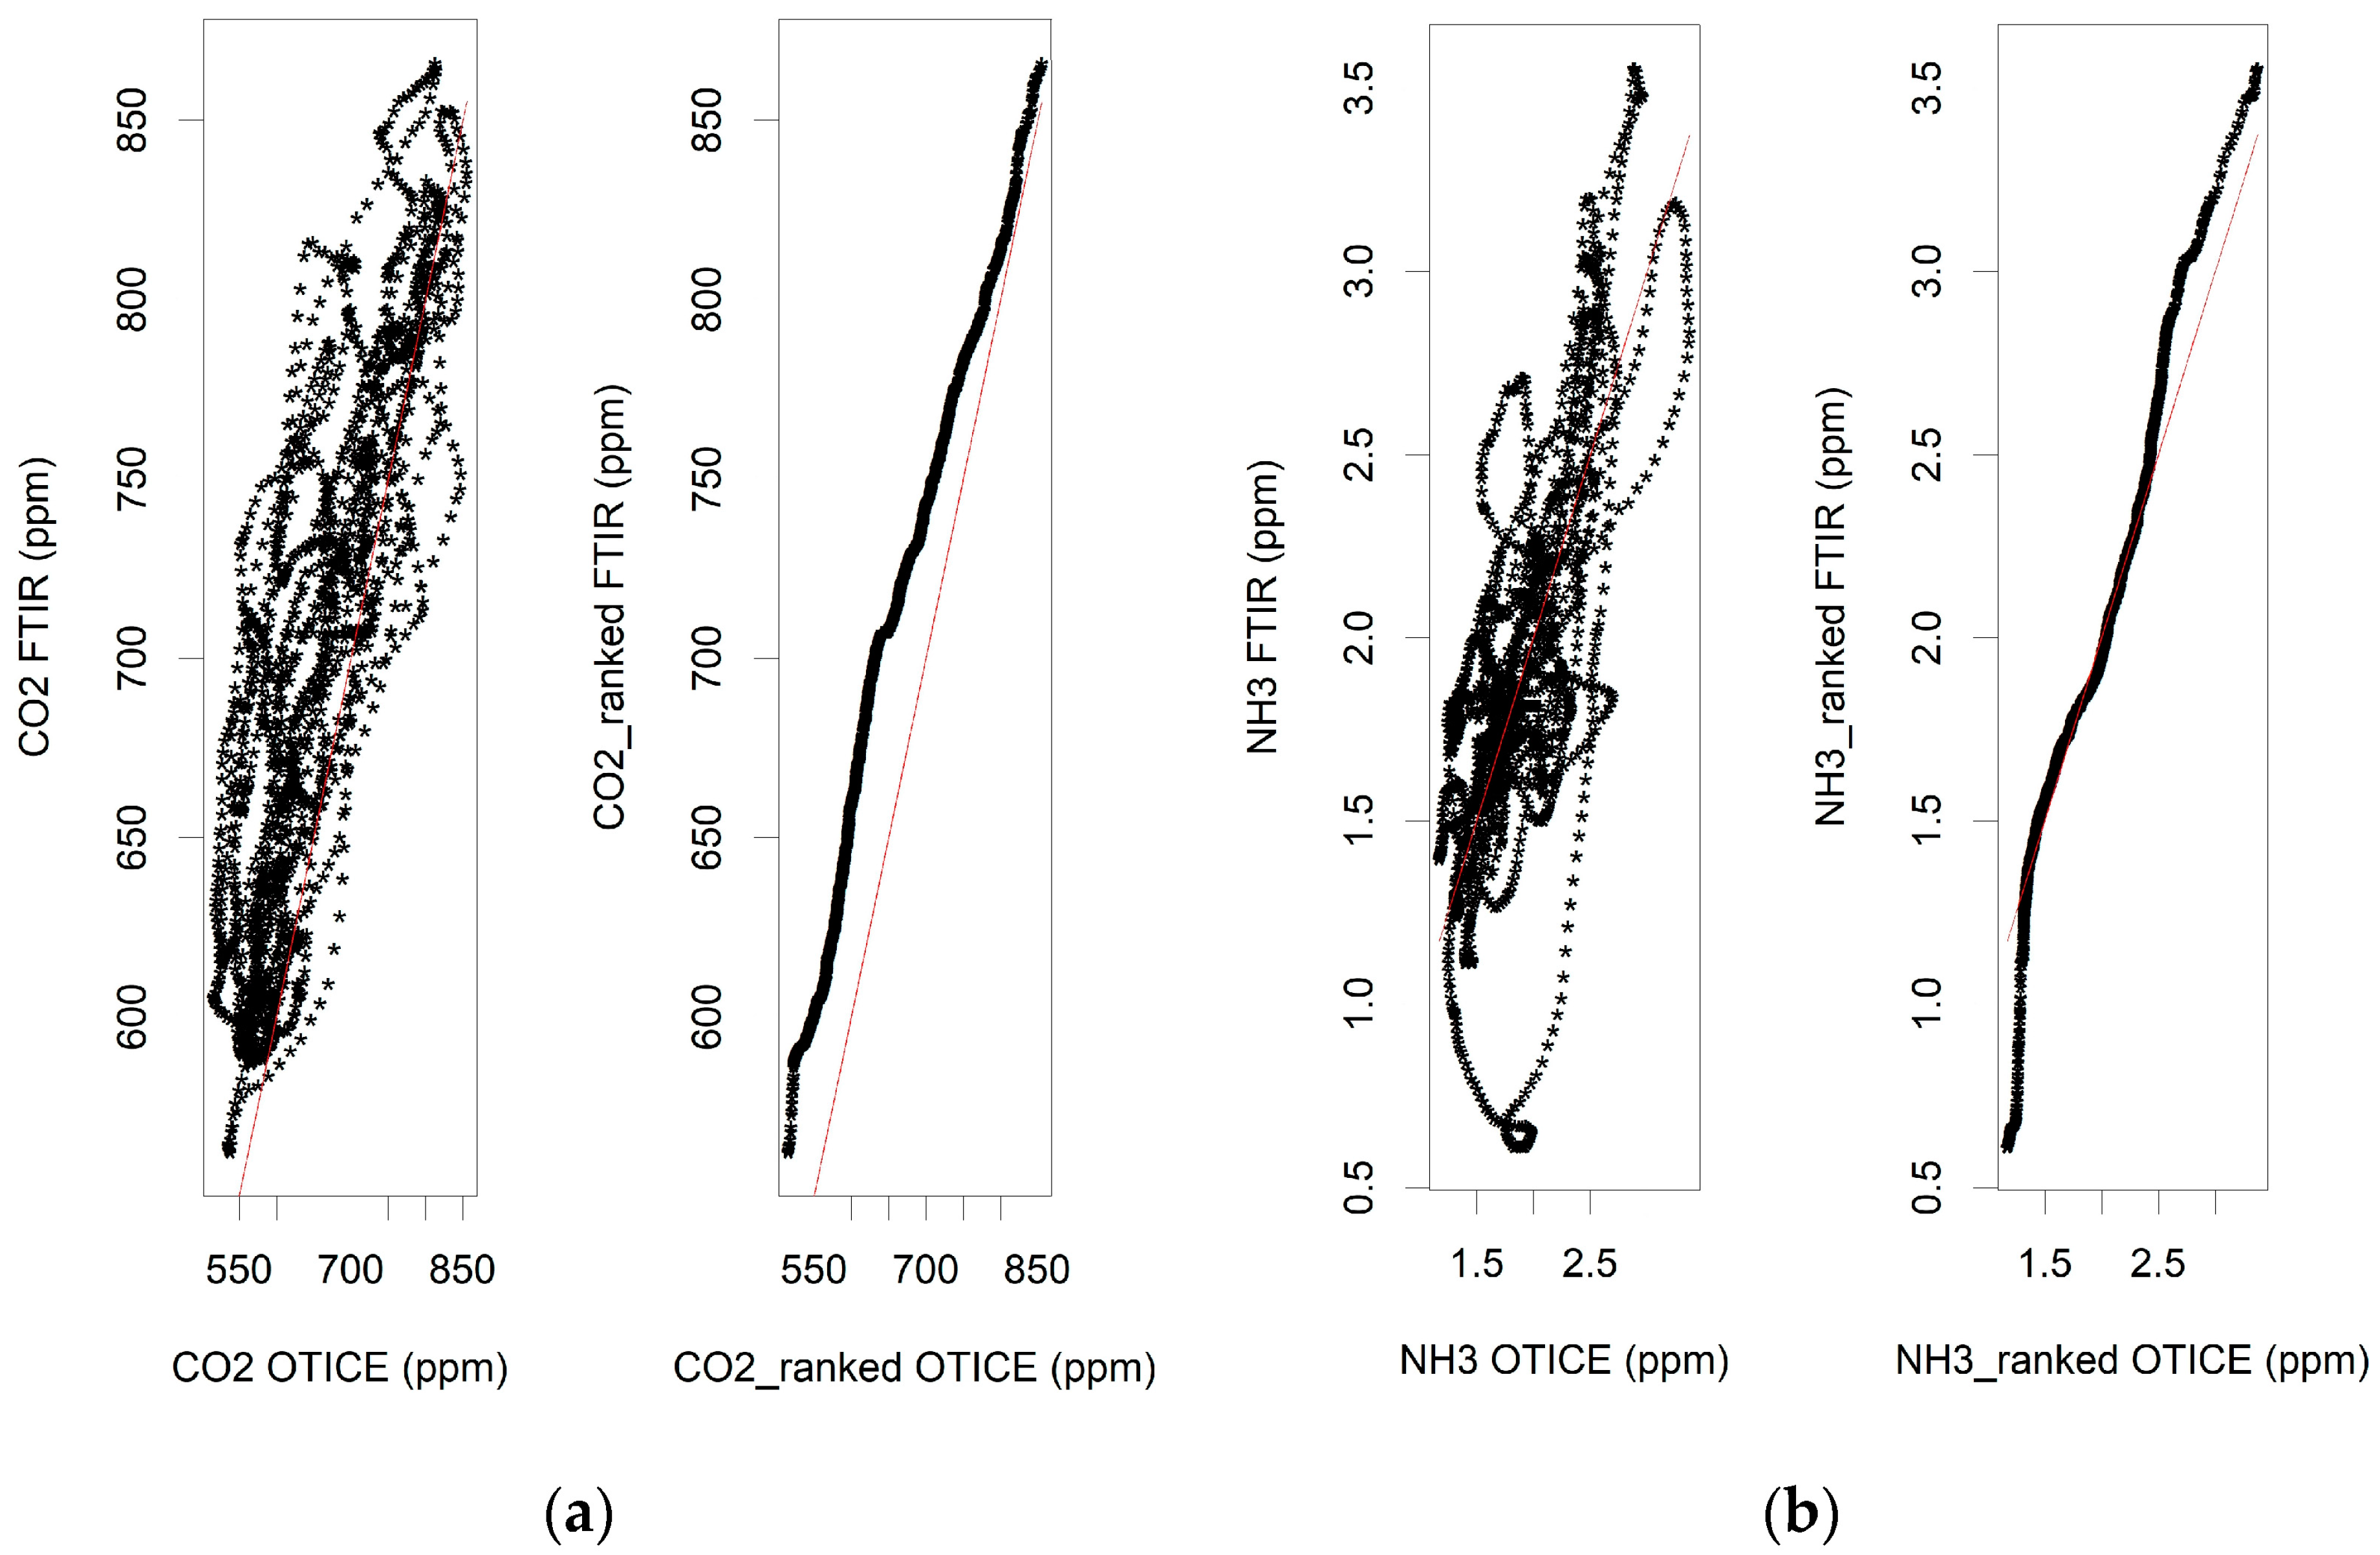
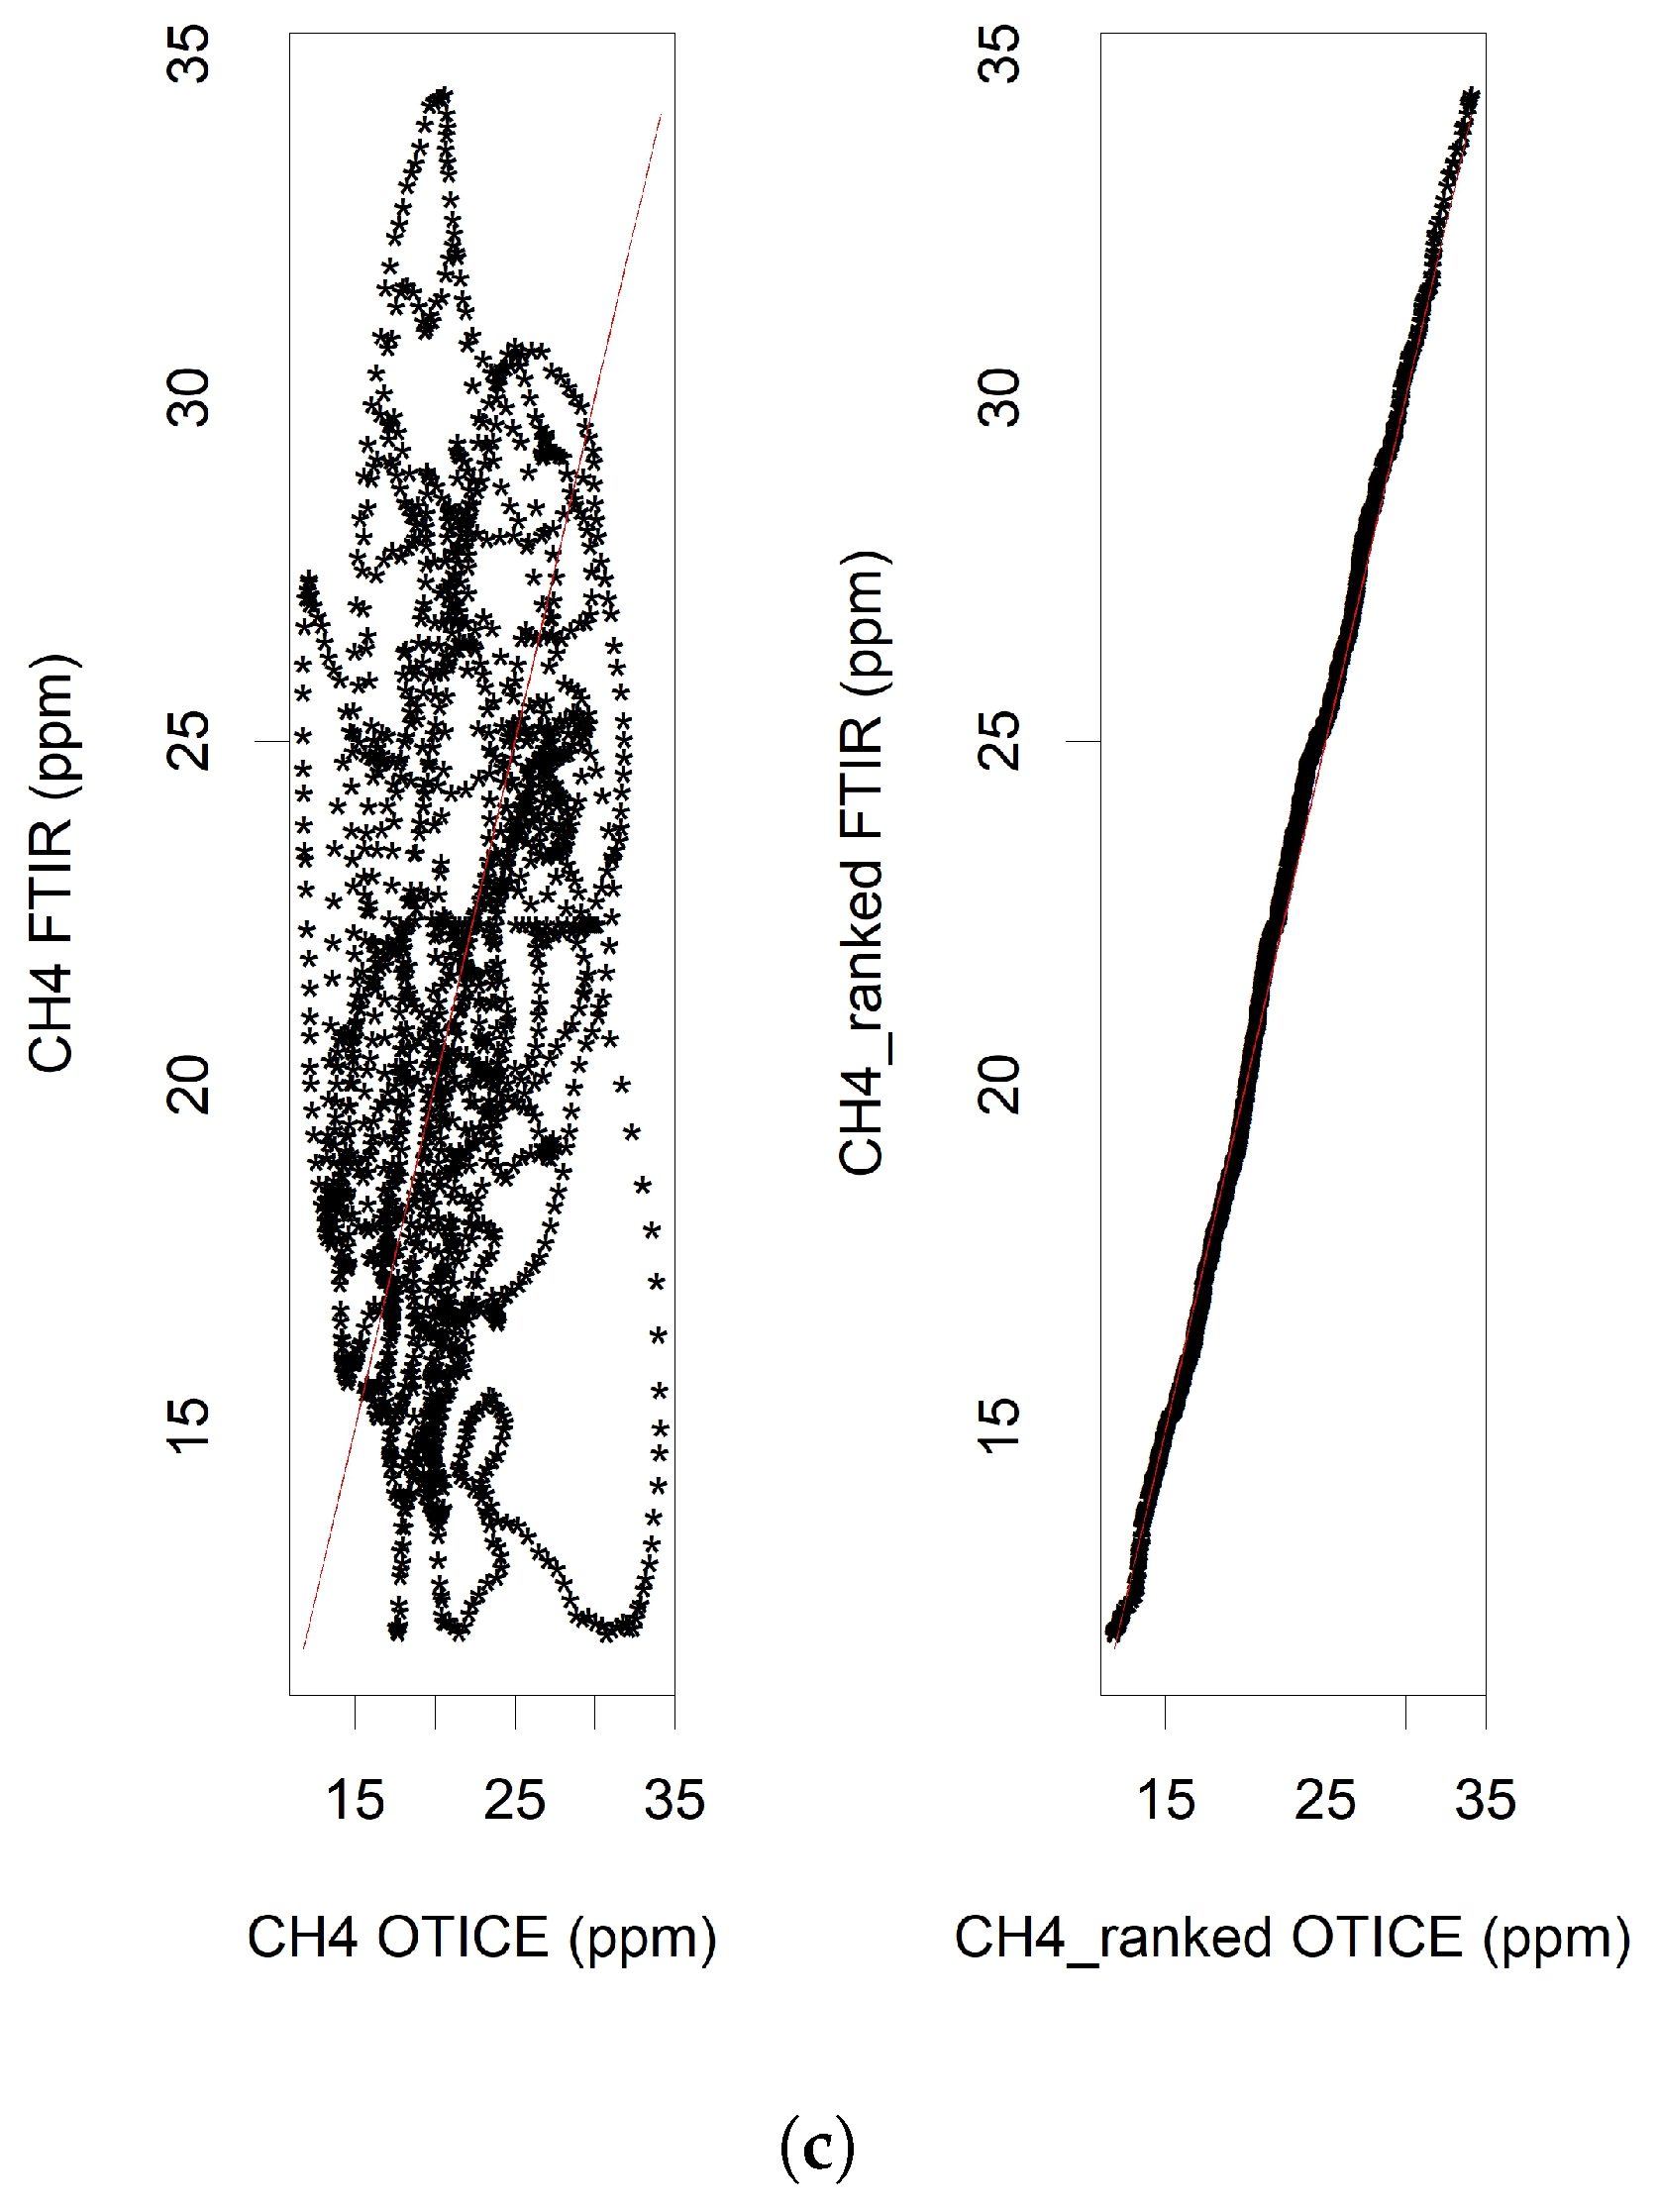
Figure 6 shows the scatter plots and the rank order plots for each of the three gases. The Spearman’s correlation coefficients for CO 2 , NH 3 , and CH4 were ρ C O 2 = 0.8, ρ N H 3 = 0.68, and ρ C H 4 = 0.24, with p < 0.001 in all cases.
In general, the scatter plots showed linear relations between the values measured with OTICE-WSN and the FTIR system. The scattering of the point clouds was large, particularly in the case of CH 4 . This was also reflected in the correlation coefficients. In addition, the rank order plots indicated some systematic bias of the OTICE-WSN system. In the case of CO 2 , OTICE-WSN systematically underestimated the concentration for values below about 800 ppm (see Figure 6a). For higher concentrations, the CO 2 sensor showed no pronounced systematic bias anymore. In the case of NH 3 , OTICE-WSN tended to overestimate the concentration for very low concentration values, while above about 2.5 ppm, concentrations were systematically underestimated (see Figure 6b). For the CH 4 sensor, there was no pronounced systematic bias.

4. Discussion

The ranges of the gas concentrations of all three gases were in agreement with measured gas concentrations inside similar naturally ventilated dairy barns, e.g., by [4,26,27], or [28]. The diurnal pattern for CO 2 and CH4 with maxima at nighttime was also reported by [27,29]. The diurnal pattern for NH 3 with maximum concentrations around noon was also reported by [30] and can be explained by the higher ammonia evaporation rates with higher temperatures, as reported, e.g., by [31], with higher temperatures at daytime, and also by the activity pattern of the animals, resulting in higher urination activity in the daytime and thus a higher NH 3 evaporation potential. The low-cost system was able to capture these diurnal patterns. This is very valuable, because it shows the capability of OTICE-WSN to perform on a daily basis with sufficient reaction times at that scale. This is important, e.g., if emission processes are investigated, which correlate with other phenomena on a (sub)daily time scale, like animal activity, milking events, curtain position changes, etc.
The agreement of the mean values (averaged over the measurement duration) of OTICE-WSN with the FTIR values can be assessed as very good. For NH 3 and CH4, the deviation was below the measurement uncertainty of the reference system. For NH 3 , these values were consistent or better than other studies that investigated low-cost NH 3 sensors. Ref. [32] tested two types of electrochemically based lower-cost sensors and found relative errors of 0.5% and 5.9%, compared to the reference system. Lin et al. [17] developed and tested a low-cost MOS sensor and found a relative error of 7% under real-barn conditions in a poultry housing system. For the measured deviation of CH4, no other studies with low-cost sensors tested could be found in the literature to compare with. For CO 2 , the deviation of 6.7% is near the measurement uncertainty of the FTIR system (≈6%), so the sensor can be considered accurate. The OTICE-WSN showed a systematic bias of −45 ppm compared to that of FTIR. A systematic bias was also reported by Mendes et al. [15], who tested NDIR sensors for barn measurements in a dairy barn. Contrary to our results, they found an overestimation of their sensors, in the range >60 ppm. The strong positive correlation of the CO 2 sensor ( ρ C O 2 = 0.8) indicates a very good recapturing of the FTIR measurement values, following the dynamic characteristics of the concentrations also on smaller time scales than the whole 12-day measurement duration. This would allow the OTICE-WSN with the used CO 2 sensors to be used even for the measurements of emission factors, where a high accuracy of the absolute value is mandatory. Also, the estimation of air change (by applying CO 2 based tracer gas methods), as, e.g., an indicator for the supply of fresh, cooling air, and thus, the animal welfare could be applied with nearly the same accuracy as with high-end analyzers.
The correlation of the NH 3 sensor with the FTIR system can be considered moderately strong ( ρ N H 3 = 0.68). The measurement of absolute emission values on an hourly or daily basis with this performance is questionable. However, the NH 3 sensor would be sufficient for a trend monitoring of emissions on a relative basis.
The poor correlation ( ρ C H 4 = 0.24) of the OTICE-WSN CH4 measurements with the reference system is also visible in the shown time series in Figure 5c). The highest deviations are visible, when low CH4 concentrations were present inside the barn (measured with the FTIR system). Values around 13 ppm measured with the FTIR system correspond to values of up to 34 ppm measured with OTICE-WSN, meaning an overprediction of the low-cost system in these cases. Nagahage et al. [33] investigated the same sensor for CH4 under laboratory conditions, with anaerobic digesters as a benchmark and gas-chromatography as a reference. They found a better correlation of ρ > 0.9, but their measured concentrations were in the range of 960–30,000 ppm, while in this study, values were in the range of 12–34 ppm. An explanation for the low correlation in this study is the used calibration curve for CH
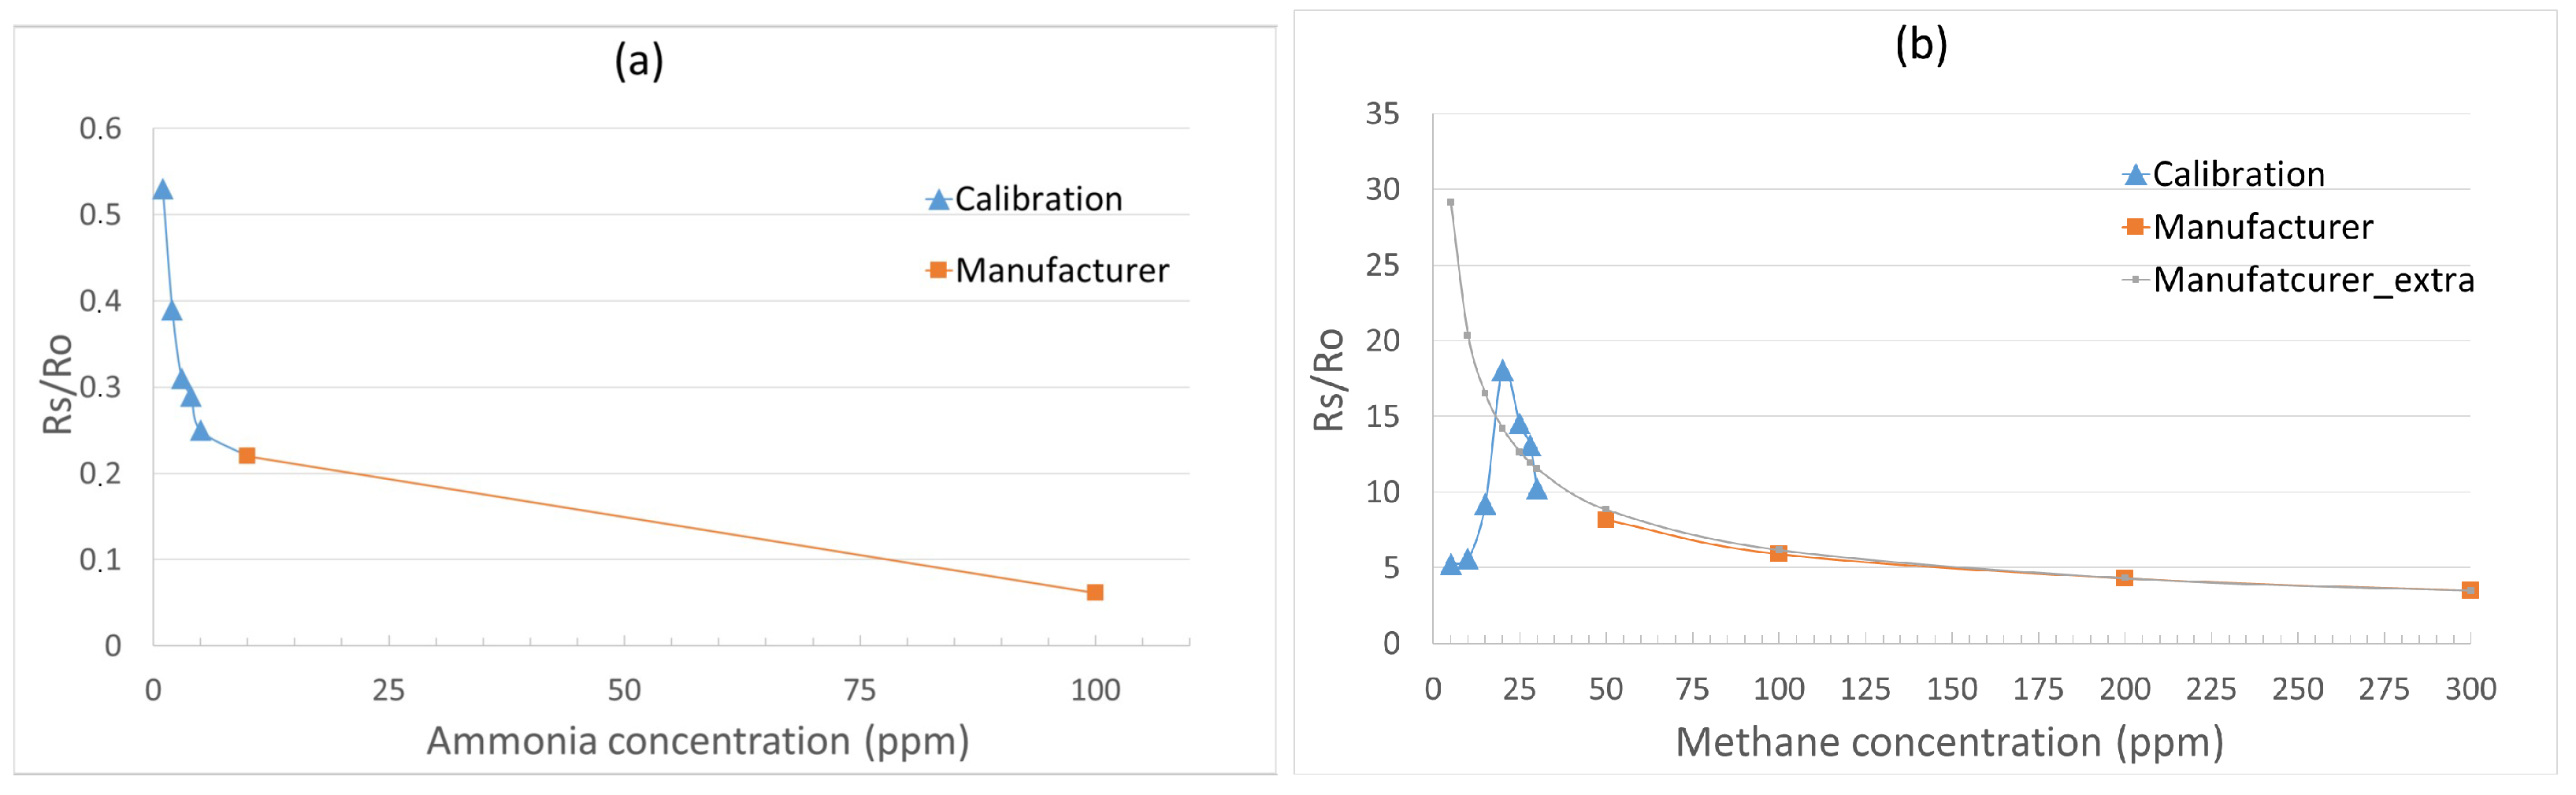
4, shown in Figure 3. Since the measured calibration curve for lower CH4 concentrations was nonmonotone, we chose to apply an extrapolated curve from the manufacturer’s data sheet. For concentration values below 20 ppm, the manufacturer’s extrapolated curve corresponded to increasing output signals, while the calibration chamber curve corresponded to decreasing signals. The lower the output signal, the higher the deviation between the manufacturer’s curve and the calibration chamber curve. This resulted either in higher estimated concentration levels (manufacturer’s curve) or lower concentration levels (chamber’s curve). The most likely explanation to this low performance is that the measurement range given by the manufacturer of the investigated sensor is from 300 to 10,000 ppm, as stated in Section 2.1. The measured concentrations in the barn and in the calibration chamber were all below 50 ppm, so a linear behavior of the sensor could not be expected. Although very good agreements for averaged concentration values of the longer-term measurements were seen, this low correlation makes the CH4 sensor not usable for emission measurements, where the focus is on the absolute values (at higher temporal resolution). However, as a general sensor to monitor the trend of methane concentrations in terms of relative changes, the sensor would probably be sufficient. For improvement, the curve measured in the calibration chamber should be used, along with a method to distinguish between concentrations higher or lower than 20 ppm, which is the vertex of the nonmonotone calibration curve.
We expect the sensors, especially for NH 3 and CH4, to perform better under higher concentration values. An application such as headspace concentrations in slurry pits or directly above emission-active surfaces (shown recently in [34]) might bring good results. In particular, the latter-mentioned application could be a smart one to directly couple the real-time information with kinetic modeling approaches, as shown recently by Hempel et al. [35].

Limitation of this Study

As stated in the introduction, this study was a first step to investigate the feasibility of the OTICS-WSN to monitor barn climate and emission levels and is considered as the prelude of following further investigations. Besides the investigated ability to measure gas concentrations accurately as the basis of emission estimates, the following aspects are also crucial, but were not considered in this study, and recommendations for respective future investigations are given in the Section 5:
(a) The long-term stability of the sensors under barn conditions was not studied, and no information on drift or time-dependent loss of precision was available. (b) Measurements were only carried out in one season, so no information on the influence of the temperature on the measurements was available. (c) The investigations were related only to gas concentrations; the computation of emissions was not performed in this study. (d) No systematic investigation on the influence of humidity and other interfering gases on the accuracy of gas concentration measurements was conducted.

5. Summary and Conclusions

A wireless sensor network equipped with low-cost sensors for NH 3 , CO 2 , and CH 4 was investigated under real-barn conditions. Overall, the cost of the sensors of the investigated system were around EUR 120 per node. The gained results, at least for CO 2 and NH 3 , were surprisingly good for such low costs.
It could be shown that the sensors were feasible for capturing the concentrations of NH 3 , CO 2 , and CH 4 very accurately (in the range of the uncertainty of the reference system), when measured as a time-averaged value over a longer period, in this case, a period of 12 days. For all three gases, a typical diurnal pattern could be recaptured. Strong correlations with the reference system were found for CO 2 and NH 3 , while only weak correlation was found for CH4. This leads to the following conclusions and recommendations for the applicability of the investigated OTICE-WSN system:
The CO 2 sensors are feasible for measuring the concentrations in a sufficient accuracy; therefore, the WSN could be used to measure the air exchange of naturally ventilated barn systems (with the CO 2 balance methods), provided a sufficient spatial resolution with sensor nodes is established. This will be useful for both the estimation of animal welfare in terms of the provision of fresh air and emission levels in terms of volume flow rates.
For NH 3 , a trend monitoring of emission levels is possible, meaning the identification of relative changes of NH 3 emissions. The measurement of absolute emission values (e.g., for emission inventories) is not recommended. For CH4, a trend monitoring over longer periods (several days) of the concentration levels inside the barn is feasible.
Concerning the above-mentioned limitations (a)–(d) of this study, the following recommendations are given:
Future research should include the investigation of potential cross-interference with humidity and other gases. This will be investigated further in the calibration chamber with different gas and humidity matrices.
Long-term measurements should be taken to capture different climatic conditions, so the influence of temperature can be quantified. Additionally, the time-dependence of the measurement accuracy, meaning potential sensor drifts and also the quantification of measurement delay with regards to the reaction times, should be focused on within these long-term measurements.
The outside concentrations of the incoming ambient air should be measured, to be able to compute the emission levels and compare these with the reference system. This will be the main focus of future research.
It should be noted that no attention was paid to the spatial variability of gas concentrations in this study. Further studies should emphasize this by systematically varying the number and position of single-sensor nodes and investigate the influence of node reduction on the achievable accuracy.
Better results are expected for higher concentrations of pollutant gases, so the application of the sensor network, e.g., for headspace concentrations in slurry pits or directly above emission-active surfaces, will be investigated in future studies. The latter could especially be a smart application to directly couple the real-time information gathered with the OTICE-WSN with kinetic modeling approaches.

Supplementary Materials

The following supporting information can be downloaded at https://www.mdpi.com/article/10.3390/atmos14111643/s1.

Author Contributions

Conceptualization, D.J., M.B., T.A. and B.A.; methodology, D.J. and K.C.; software, M.B., S.H. and A.D.; formal analysis, K.C., D.J. and S.H.; investigation, M.B. and A.R.; data curation, A.R.; writing—original draft preparation, M.B., D.J., S.H., T.A., A.D., B.A., A.R. and P.v.O.; writing—review and editing, P.D., B.A., A.R. and D.J.; visualization, S.H., M.B., A.D. and D.J.; funding acquisition, B.A. and P.v.O. All authors have read and agreed to the published version of the manuscript.

Funding

The authors acknowledge the financial support through the partners of the 2018 Joint Call of the Cofund ERA-Nets FACCE ERA-GAS (grant No. 696356), ICT-AGRI 2 (grant No. 618123), and SusAn (grant No. 696231).

Institutional Review Board Statement

Not applicable.

Informed Consent Statement

Not applicable.

Data Availability Statement

The data presented in this study are available in Supplementary Material.

Acknowledgments

The authors would like to thank Andreas Reinhardt, technician at ATB for his great support in all technical questions.

Conflicts of Interest

The authors declare no conflict of interest.

Abbreviations

The following abbreviations are used in this manuscript:
OTICEOnline Tool for monitoring Indoor barn climate and Emission levels
WSNWireless sensor network
FTIRFourier transform infrared spectroscopy
CRDSCavity ring-down spectroscopy
NH 3 Ammonia
CH 4 Methane
CO 2 Carbon dioxide
TTemperature
RHRelative humidity

References

  1. Food and Agriculture Organization of the United Nations (FAO). World Livestock: Transforming the Livestock Sector through the Sustainable Development Goals—Full Report; Technical Report, Licence: CC B Y-NC-SA 3.0 IGO.; FAO: Rome, Italy, 2018; 222p, Available online: http://www.fao.org/3/CA1201EN/ca1201en.pdf (accessed on 20 April 2020).
  2. EEA. European Union Emission Inventory Report 1990–2018—EEA Report No 5/2020; EEA: Copenhagen, Denmark, 2020; Volume 7. [Google Scholar]
  3. Pedersen, S.; Blanes-Vidal, V.; Jørgensen, H.; Chwalibog, A.; Haeussermann, A.; Heetkamp, M.; Aarnink, A. Carbon dioxide production in animal houses: A literature review. Agric. Eng. Int. CIGR J. 2008, X. [Google Scholar]
  4. Janke, D.; Willink, D.; Ammon, C.; Hempel, S.; Schrade, S.; Demeyer, P.; Hartung, E.; Amon, B.; Ogink, N.; Amon, T. Calculation of ventilation rates and ammonia emissions: Comparison of sampling strategies for a naturally ventilated dairy barn. Biosyst. Eng. 2020, 198, 15–30. [Google Scholar] [CrossRef]
  5. Zhuang, S.; Brusselman, E.; Sonck, B.; Demeyer, P. Validation of five gas analysers for application in ammonia emission measurements at livestock houses according to the VERA test protocol. Appl. Sci. 2020, 10, 5034. [Google Scholar] [CrossRef]
  6. Hassouna, M.; Amon, T.; Arcidiacono, C.; Bühler, M.; Calvet, S.; Demeyer, P.; D’Urso, P.; Estellés, F.; Häni, C.; Hempel, S.; et al. Measuring Techniques for Ammonia and Greenhouse Gas Emissions from Naturally Ventilated Housings. In Technology for Environmentally Friendly Livestock Production; Springer: Berlin/Heidelberg, Germany, 2023; pp. 23–63. [Google Scholar]
  7. Poteko, J.; Zähner, M.; Schrade, S. Effects of housing system, floor type and temperature on ammonia and methane emissions from dairy farming: A meta-analysis. Biosyst. Eng. 2019, 182, 16–28. [Google Scholar] [CrossRef]
  8. Hodgkinson, J.; Tatam, R.P. Optical gas sensing: A review. Meas. Sci. Technol. 2012, 24, 012004. [Google Scholar] [CrossRef]
  9. Xu, M.; Peng, B.; Zhu, X.; Guo, Y. Multi-Gas Detection System Based on Non-Dispersive Infrared (NDIR) Spectral Technology. Sensors 2022, 22, 836. [Google Scholar] [CrossRef]
  10. Introduction to Electrochemical (EC) Gas Sensors, A1A-EC Sensors Intro Issue 1, February 2007, SGX Sensortech(IS) Ltd Registered in England No. 08067077. Available online: https://www.sgxsensortech.com/content/uploads/2014/08/Introduction-to-Electrochemical-EC-Gas-Sensors1.pdf (accessed on 12 September 2022).
  11. Barsan, N.; Weimar, U. Conduction model of metal oxide gas sensors. J. Electroceramics 2001, 7, 143–167. [Google Scholar] [CrossRef]
  12. Dey, A. Semiconductor metal oxide gas sensors: A review. Mater. Sci. Eng. B 2018, 229, 206–217. [Google Scholar] [CrossRef]
  13. Wang, C.; Yin, L.; Zhang, L.; Xiang, D.; Gao, R. Metal oxide gas sensors: Sensitivity and influencing factors. Sensors 2010, 10, 2088–2106. [Google Scholar] [CrossRef]
  14. Calvet, S.; Campelo, J.C.; Estellés, F.; Perles, A.; Mercado, R.; Serrano, J.J. Suitability evaluation of multipoint simultaneous CO2 sampling wireless sensors for livestock buildings. Sensors 2014, 14, 10479–10496. [Google Scholar] [CrossRef]
  15. Mendes, L.; Ogink, N.; Edouard, N.; van Dooren, H.; Tinôco, I.; Mosquera, J. NDIR gas sensor for spatial monitoring of carbon dioxide concentrations in naturally ventilated livestock buildings. Sensors 2015, 15, 11239–11257. [Google Scholar] [CrossRef] [PubMed]
  16. Von Jasmund, N.; Schmithausen, A.J.; Krommweh, M.S.; Trimborn, M.; Boeker, P.; Büscher, W. Assessment of ammonia sensors and photoacoustic measurement systems using a gas calibration unit. Comput. Electron. Agric. 2022, 194, 106744. [Google Scholar] [CrossRef]
  17. Lin, T.; Shah, S.B.; Wang-Li, L.; Oviedo-Rondón, E.O.; Post, J. Development of MOS sensor-based NH3 monitor for use in poultry houses. Comput. Electron. Agric. 2016, 127, 708–715. [Google Scholar] [CrossRef]
  18. Zhuang, S.; Van Overbeke, P.; Vangeyte, J.; Sonck, B.; Demeyer, P. Evaluation of a Cost-Effective Ammonia Monitoring System for Continuous Real-Time Concentration Measurements in a Fattening Pig Barn. Sensors 2019, 19, 3669. [Google Scholar] [CrossRef] [PubMed]
  19. Difford, G.F.; Lassen, J.; Løvendahl, P. Interchangeability between methane measurements in dairy cows assessed by comparing precision and agreement of two non-invasive infrared methods. Comput. Electron. Agric. 2016, 124, 220–226. [Google Scholar] [CrossRef]
  20. Garnsworthy, P.C.; Difford, G.F.; Bell, M.J.; Bayat, A.R.; Huhtanen, P.; Kuhla, B.; Lassen, J.; Peiren, N.; Pszczola, M.; Sorg, D.; et al. Comparison of methods to measure methane for use in genetic evaluation of dairy cattle. Animals 2019, 9, 837. [Google Scholar] [CrossRef] [PubMed]
  21. E+E Elektronik—EE894 Datasheet. Available online: https://www.epluse.com/fileadmin/data/product/ee894/datasheet_EE894.pdf (accessed on 12 September 2022).
  22. FIGARO—TGS 2611-E00 Datasheet. Available online: https://cdn.sos.sk/productdata/d5/e0/830bef66/tgs-2611-e00.pdf (accessed on 12 September 2022).
  23. SGX Sensortech—MiCS-6814 Datasheet. Available online: https://www.mouser.de/datasheet/2/18/1143_Datasheet-MiCS-6814-rev-8-1144828.pdf (accessed on 12 September 2022).
  24. Hempel, S.; Saha, C.K.; Fiedler, M.; Berg, W.; Hansen, C.; Amon, B.; Amon, T. Non-linear temperature dependency of ammonia and methane emissions from a naturally ventilated dairy barn. Biosyst. Eng. 2016, 145, 10–21. [Google Scholar] [CrossRef]
  25. Piani, C.; Weedon, G.; Best, M.; Gomes, S.; Viterbo, P.; Hagemann, S.; Haerter, J. Statistical bias correction of global simulated daily precipitation and temperature for the application of hydrological models. J. Hydrol. 2010, 395, 199–215. [Google Scholar] [CrossRef]
  26. Ngwabie, N.; Jeppsson, K.H.; Nimmermark, S.; Swensson, C.; Gustafsson, G. Multi-location measurements of greenhouse gases and emission rates of methane and ammonia from a naturally-ventilated barn for dairy cows. Biosyst. Eng. 2009, 103, 68–77. [Google Scholar] [CrossRef]
  27. Ngwabie, N.M.; Vanderzaag, A.; Jayasundara, S.; Wagner-Riddle, C. Measurements of emission factors from a naturally ventilated commercial barn for dairy cows in a cold climate. Biosyst. Eng. 2014, 127, 103–114. [Google Scholar] [CrossRef]
  28. Herbut, P.; Angrecka, S. Ammonia concentrations in a free-stall dairy barn. Ann. Anim. Sci. 2014, 14, 153. [Google Scholar] [CrossRef]
  29. Wu, L.; Koerkamp, P.W.G.; Ogink, N.W. Temporal and spatial variation of methane concentrations around lying cubicles in dairy barns. Biosyst. Eng. 2016, 151, 464–478. [Google Scholar] [CrossRef]
  30. D’Urso, P.R.; Arcidiacono, C.; Cascone, G. Spatial Variability of Ammonia Concentrations in an Open-Sided Dairy Barn. In Proceedings of the International Conference on Safety, Health and Welfare in Agriculture and Agro-food Systems, 2020, Ragusa, Italy, 16–19 September 2020; Springer: Berlin/Heidelberg, Germany, 2022; pp. 76–84. [Google Scholar]
  31. Schrade, S.; Zeyer, K.; Gygax, L.; Emmenegger, L.; Hartung, E.; Keck, M. Ammonia emissions and emission factors of naturally ventilated dairy housing with solid floors and an outdoor exercise area in Switzerland. Atmos. Environ. 2012, 47, 183–194. [Google Scholar] [CrossRef]
  32. Van Buggenhout, S.; Van Brecht, A.; Özcan, S.E.; Vranken, E.; Van Malcot, W.; Berckmans, D. Influence of sampling positions on accuracy of tracer gas measurements in ventilated spaces. Biosyst. Eng. 2009, 104, 216–223. [Google Scholar] [CrossRef]
  33. Nagahage, I.S.P.; Nagahage, E.A.A.D.; Fujino, T. Assessment of the applicability of a low-cost sensor–based methane monitoring system for continuous multi-channel sampling. Environ. Monit. Assess. 2021, 193, 509. [Google Scholar] [CrossRef]
  34. D’Urso, P.R.; Arcidiacono, C.; Valenti, F.; Janke, D.; Cascone, G. Measuring ammonia concentrations by an infrared photo-acoustic multi-gas analyser in an open dairy barn: Repetitions planning strategy. Comput. Electron. Agric. 2023, 204, 107509. [Google Scholar] [CrossRef]
  35. Hempel, S.; Ouatahar, L.; Janke, D.; Doumbia, E.M.; Willink, D.; Amon, B.; Bannink, A.; Amon, T. Ammonia emission prediction for dairy cattle housing from reaction kinetic modeling to the barn scale. Comput. Electron. Agric. 2022, 199, 107168. [Google Scholar] [CrossRef]
Figure 1. Detailed view of one sensor node. Dimensions on the white arrows are given in mm. A: Opening inlet for air. B: Power supply plug. C: Port to connect optional external sensors.
Atmosphere 14 01643 g001
Figure 2. Setup in the lab for the calibration of the OTICE-WSN. A: Calibration chamber, made of acrylic glass. B: Two sensor nodes. C: FTIR gas analyzer. D: Inlet for the calibration gas from the gas generator (not shown here). E: Inlet and outlet for the FTIR gas analyzer (tube for outlet not installed here). F: Ventilator for homogeneous mixing.
Atmosphere 14 01643 g002
Figure 3. Calibration curves for (a) ammonia (NH 3 ) and (b) methane (CH 4 ). The blue curve shows measured values in the calibration chamber; the orange curve shows the given calibration curve from the data sheet of the manufacturer. The y-axis shows the nondimensional resistor ratio Rs/Ro, which is the output value of the respective sensor. The x-axis shows the respective gas concentration in ppm.
Atmosphere 14 01643 g003
Figure 4. Investigated barn for the validation measurements. (a) View inside the barn. The air sampling tube of the reference system is marked in yellow and red stars. (b) Floor plan with functional areas and measurement positions. The yellow line marks the sampling line with the red stars as critical orifices. Purple triangles mark the positions of the OTICE nodes. Green, blue, orange, and gray areas mark the walking, lying, milking, and facility areas. (c) Outside view of the barn.
Atmosphere 14 01643 g004
Figure 5. Measured gas concentrations in the barn, all values given in ppm. (a) CO 2 concentrations. (b) NH 3 concentrations. (c) CH4 concentrations. The measured values with OTICE-WSN are shown in blue, the values from the reference FTIR measurements are shown in orange. The digits on the x-axis mark the start of a day at 00:00 (night).
Atmosphere 14 01643 g005
Figure 6. Scatter plots and rank order plots of gas concentrations measured with OTICE-WSN (x-axis) and the reference system (y-axis). (a) Scatter plot and rank order plot for CO 2 . (b) Scatter plot and rank order plot for NH 3 . (c) Scatter plot and rank order plot for CH 4 .
Atmosphere 14 01643 g006aAtmosphere 14 01643 g006b
Disclaimer/Publisher’s Note: The statements, opinions and data contained in all publications are solely those of the individual author(s) and contributor(s) and not of MDPI and/or the editor(s). MDPI and/or the editor(s) disclaim responsibility for any injury to people or property resulting from any ideas, methods, instructions or products referred to in the content.

