


Atmospheric CO2 Isotopic Variations, with Estimation of Ocean and Plant Source Contributions

Abstract
:1. Introduction
2. Method, Model and Data
2.1. Deep Ocean and Plant Contributions to CO2
- Ameas is the measured atmospheric concentration of CO2 in ppm;
- Aocean is the component of deep ocean origin, in ppm;
- Aplant is the component of plant origin, in ppm;
- δ13Cmeas is the isotopic value of measured atmospheric CO2;
- δ13Cocean is the isotopic value of “ocean” component atmospheric CO2;
- δ13Cplant is the isotopic value of “plant” component atmospheric CO2.
- R(13C/12C) meas is the ratio for the sample carbon-13 to carbon-12;
- R(13C/12C)std is the ratio for the standard carbon-13 to carbon-12.
2.2. Ocean and Plant Source Component Analysis for Monthly Values
- (a)
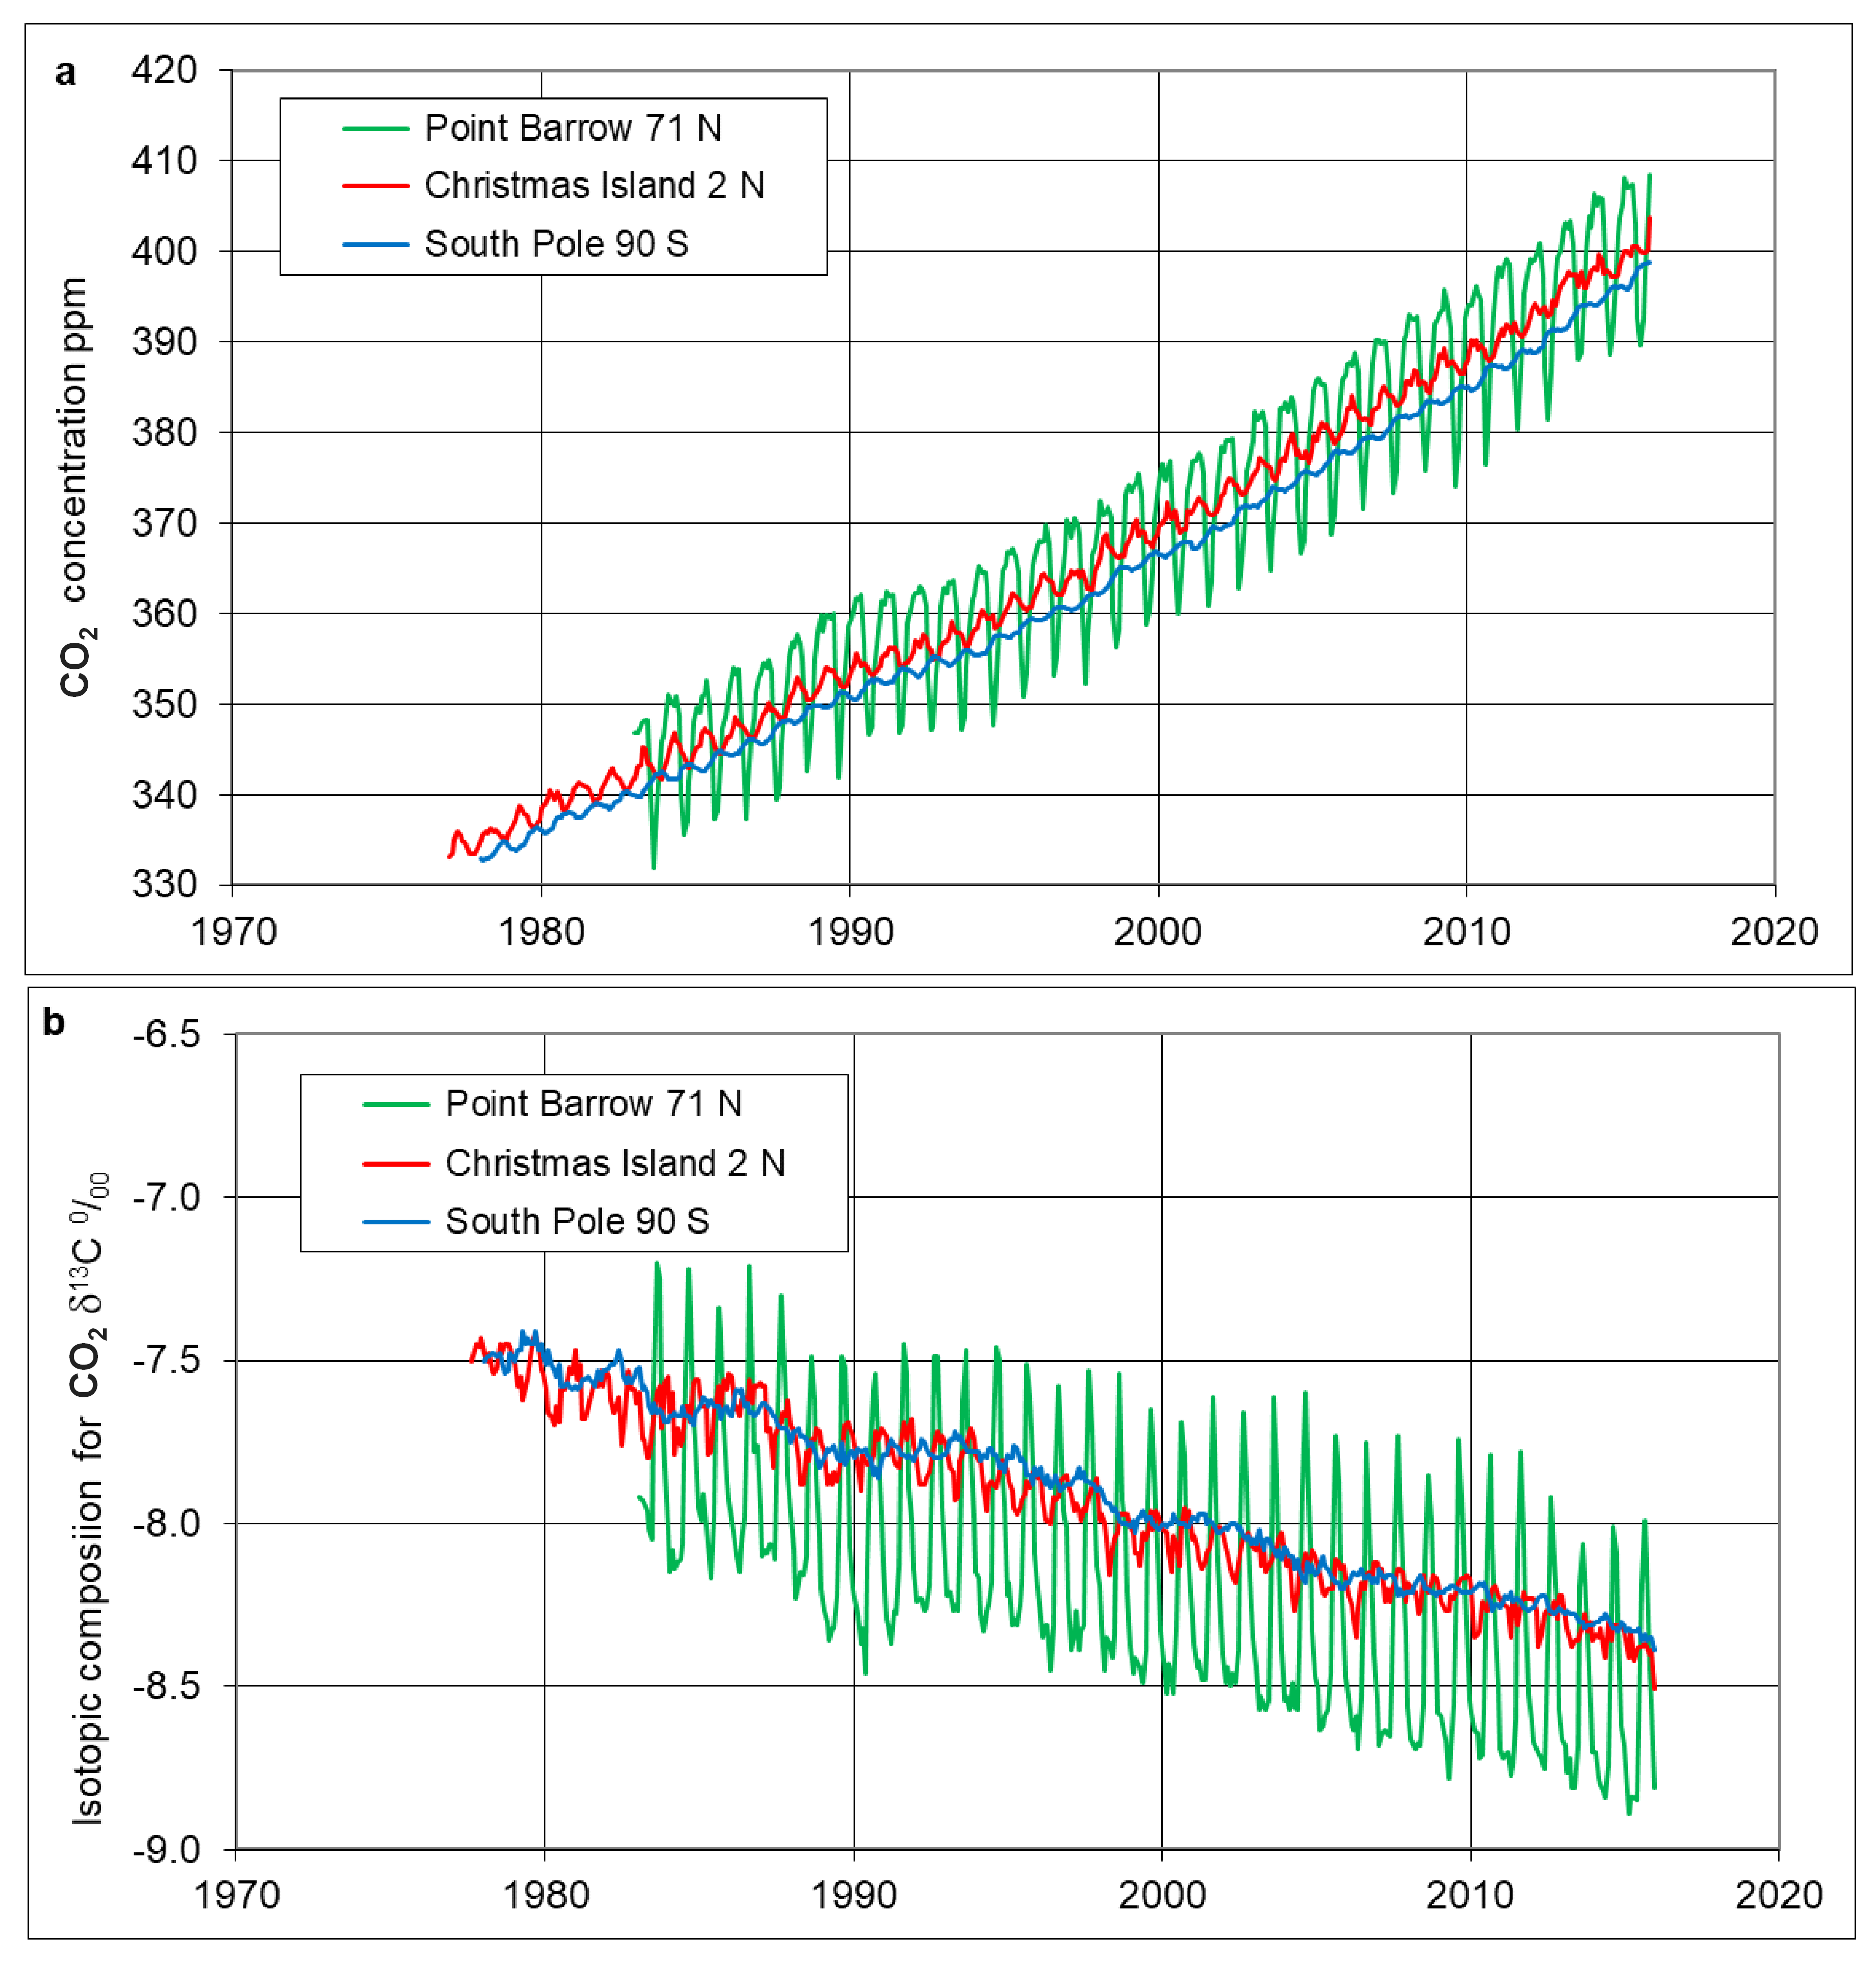
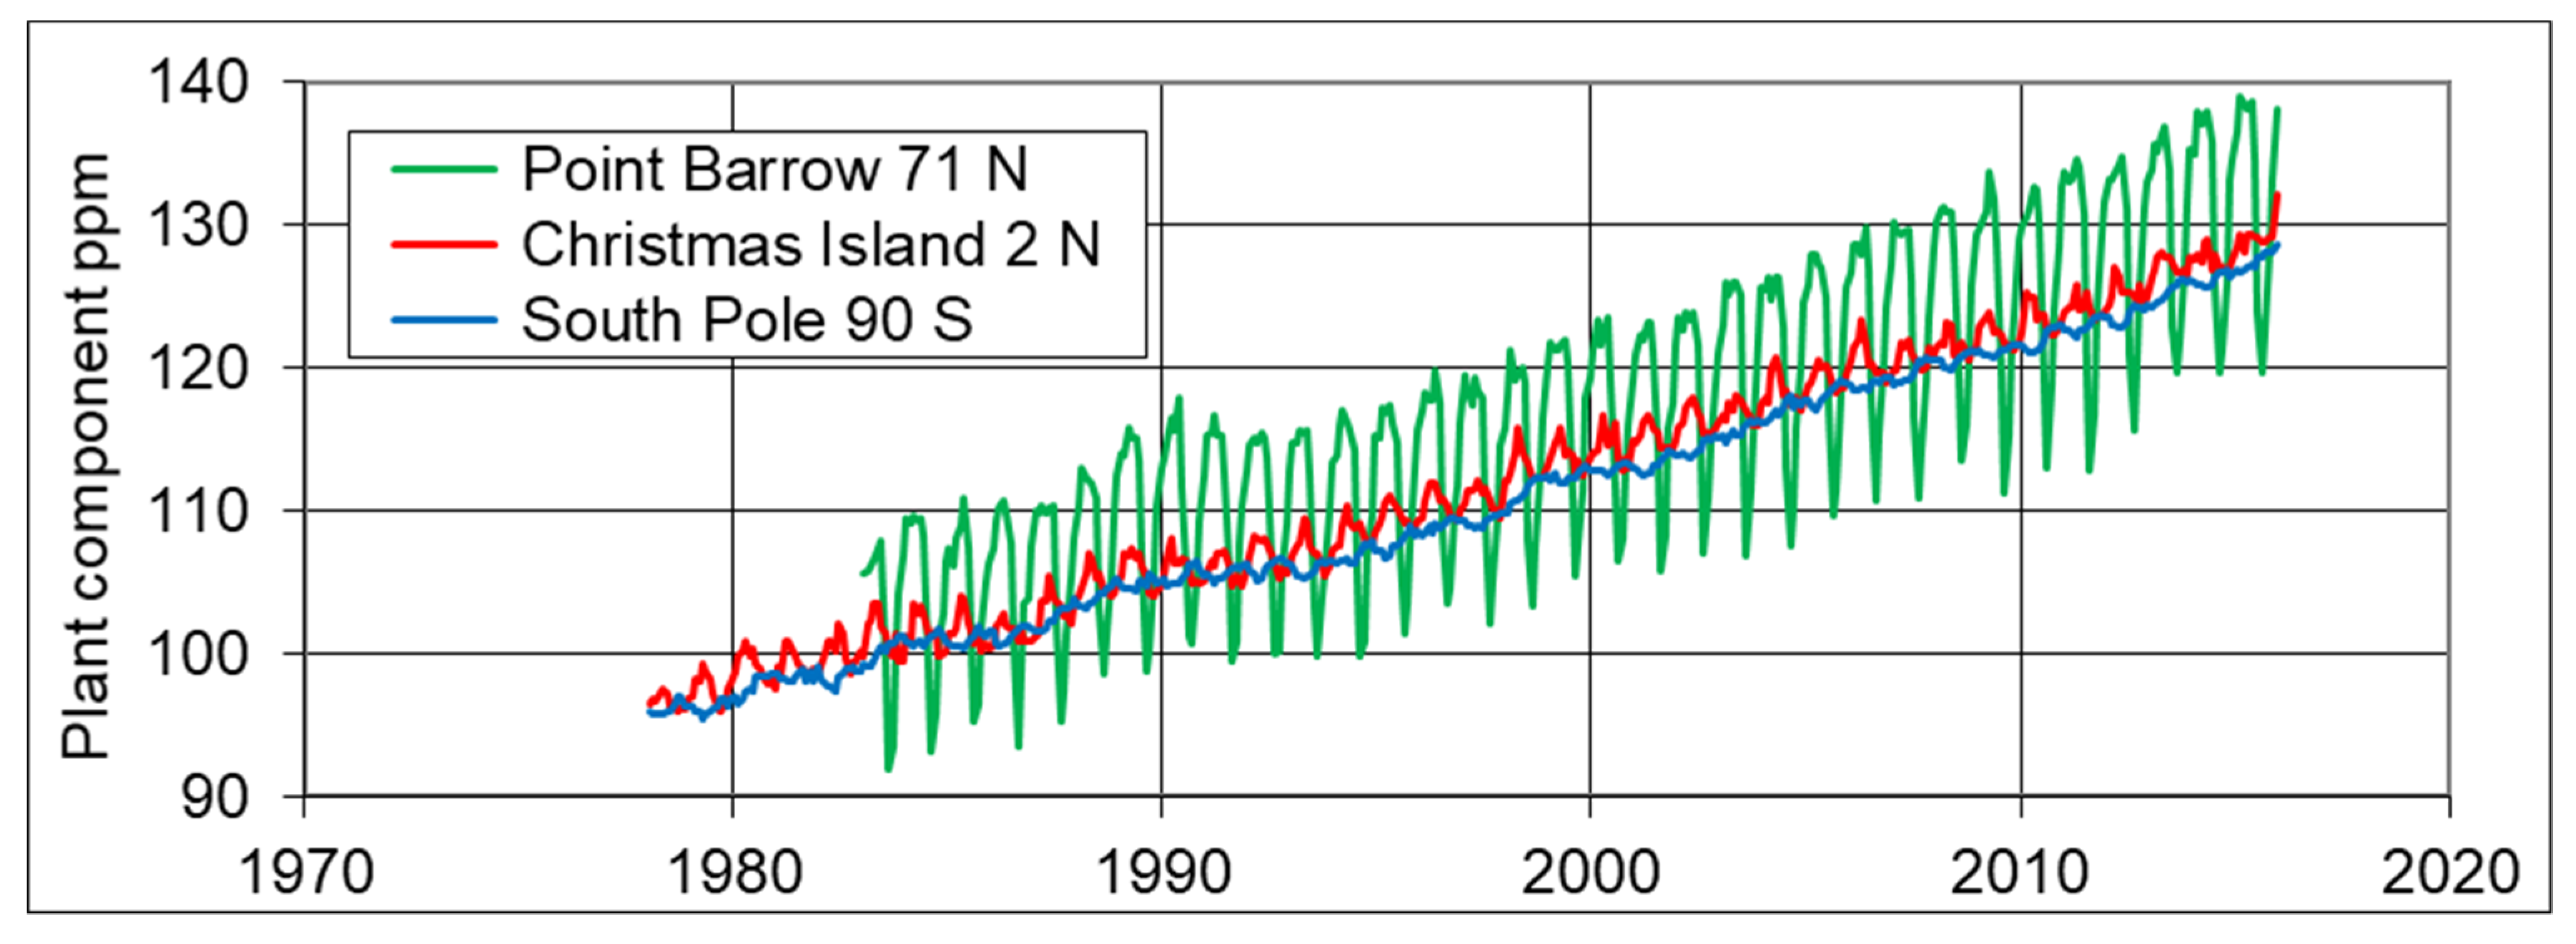
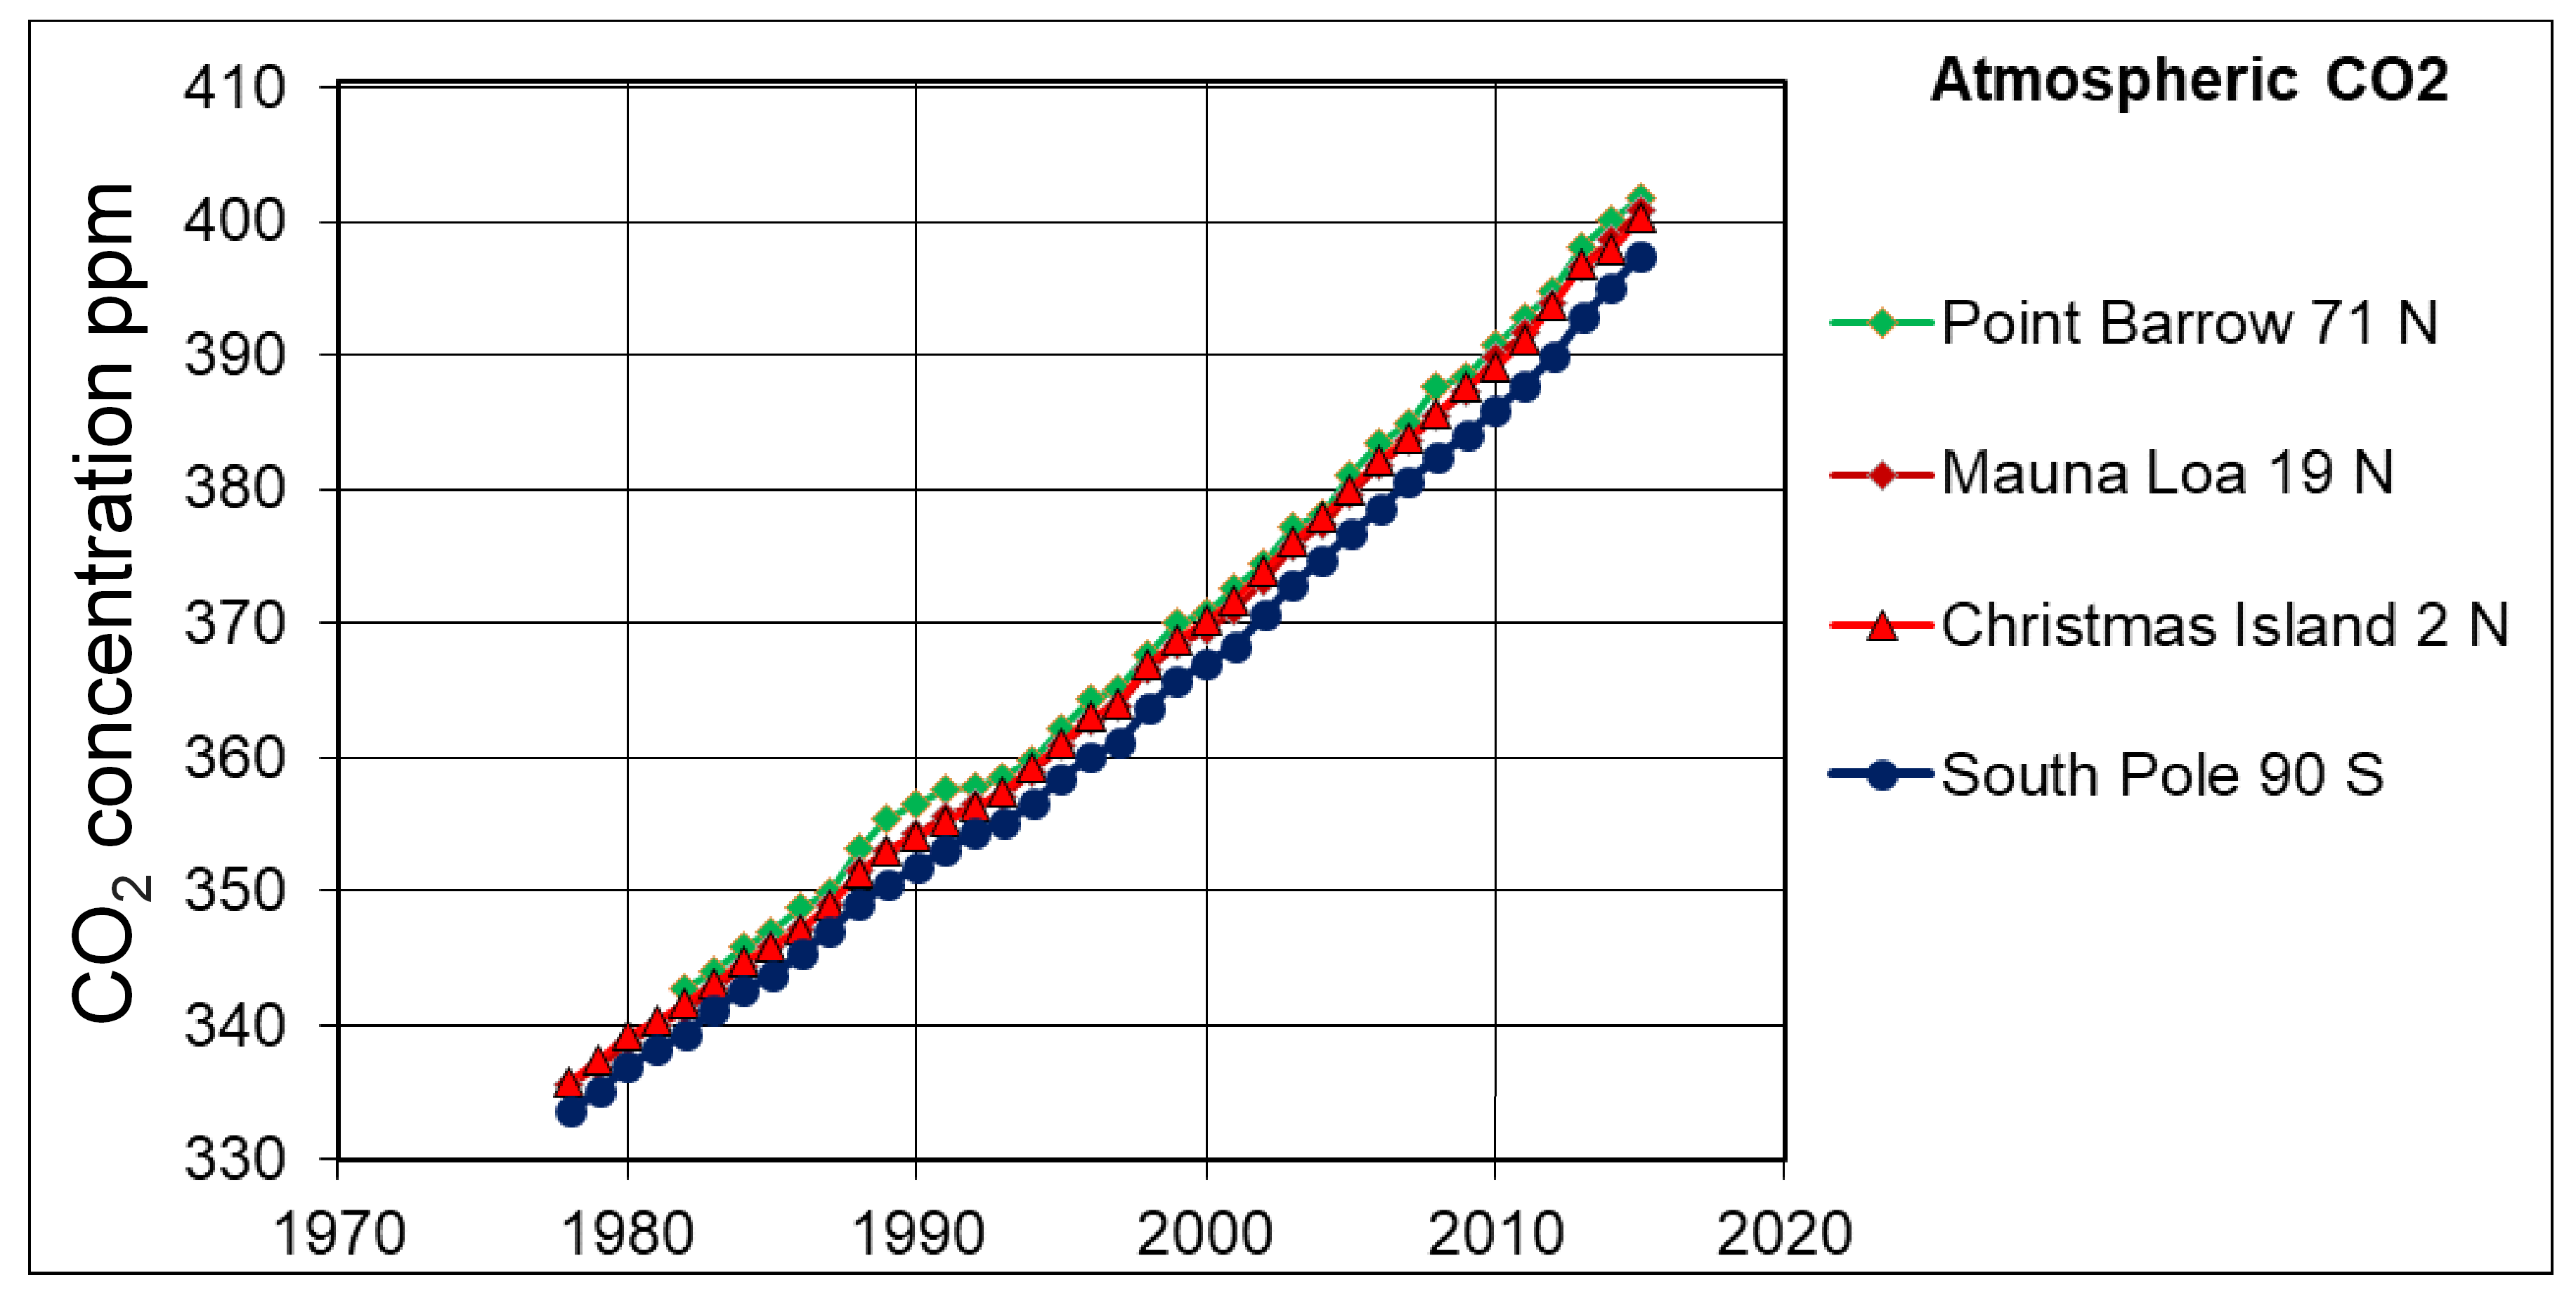
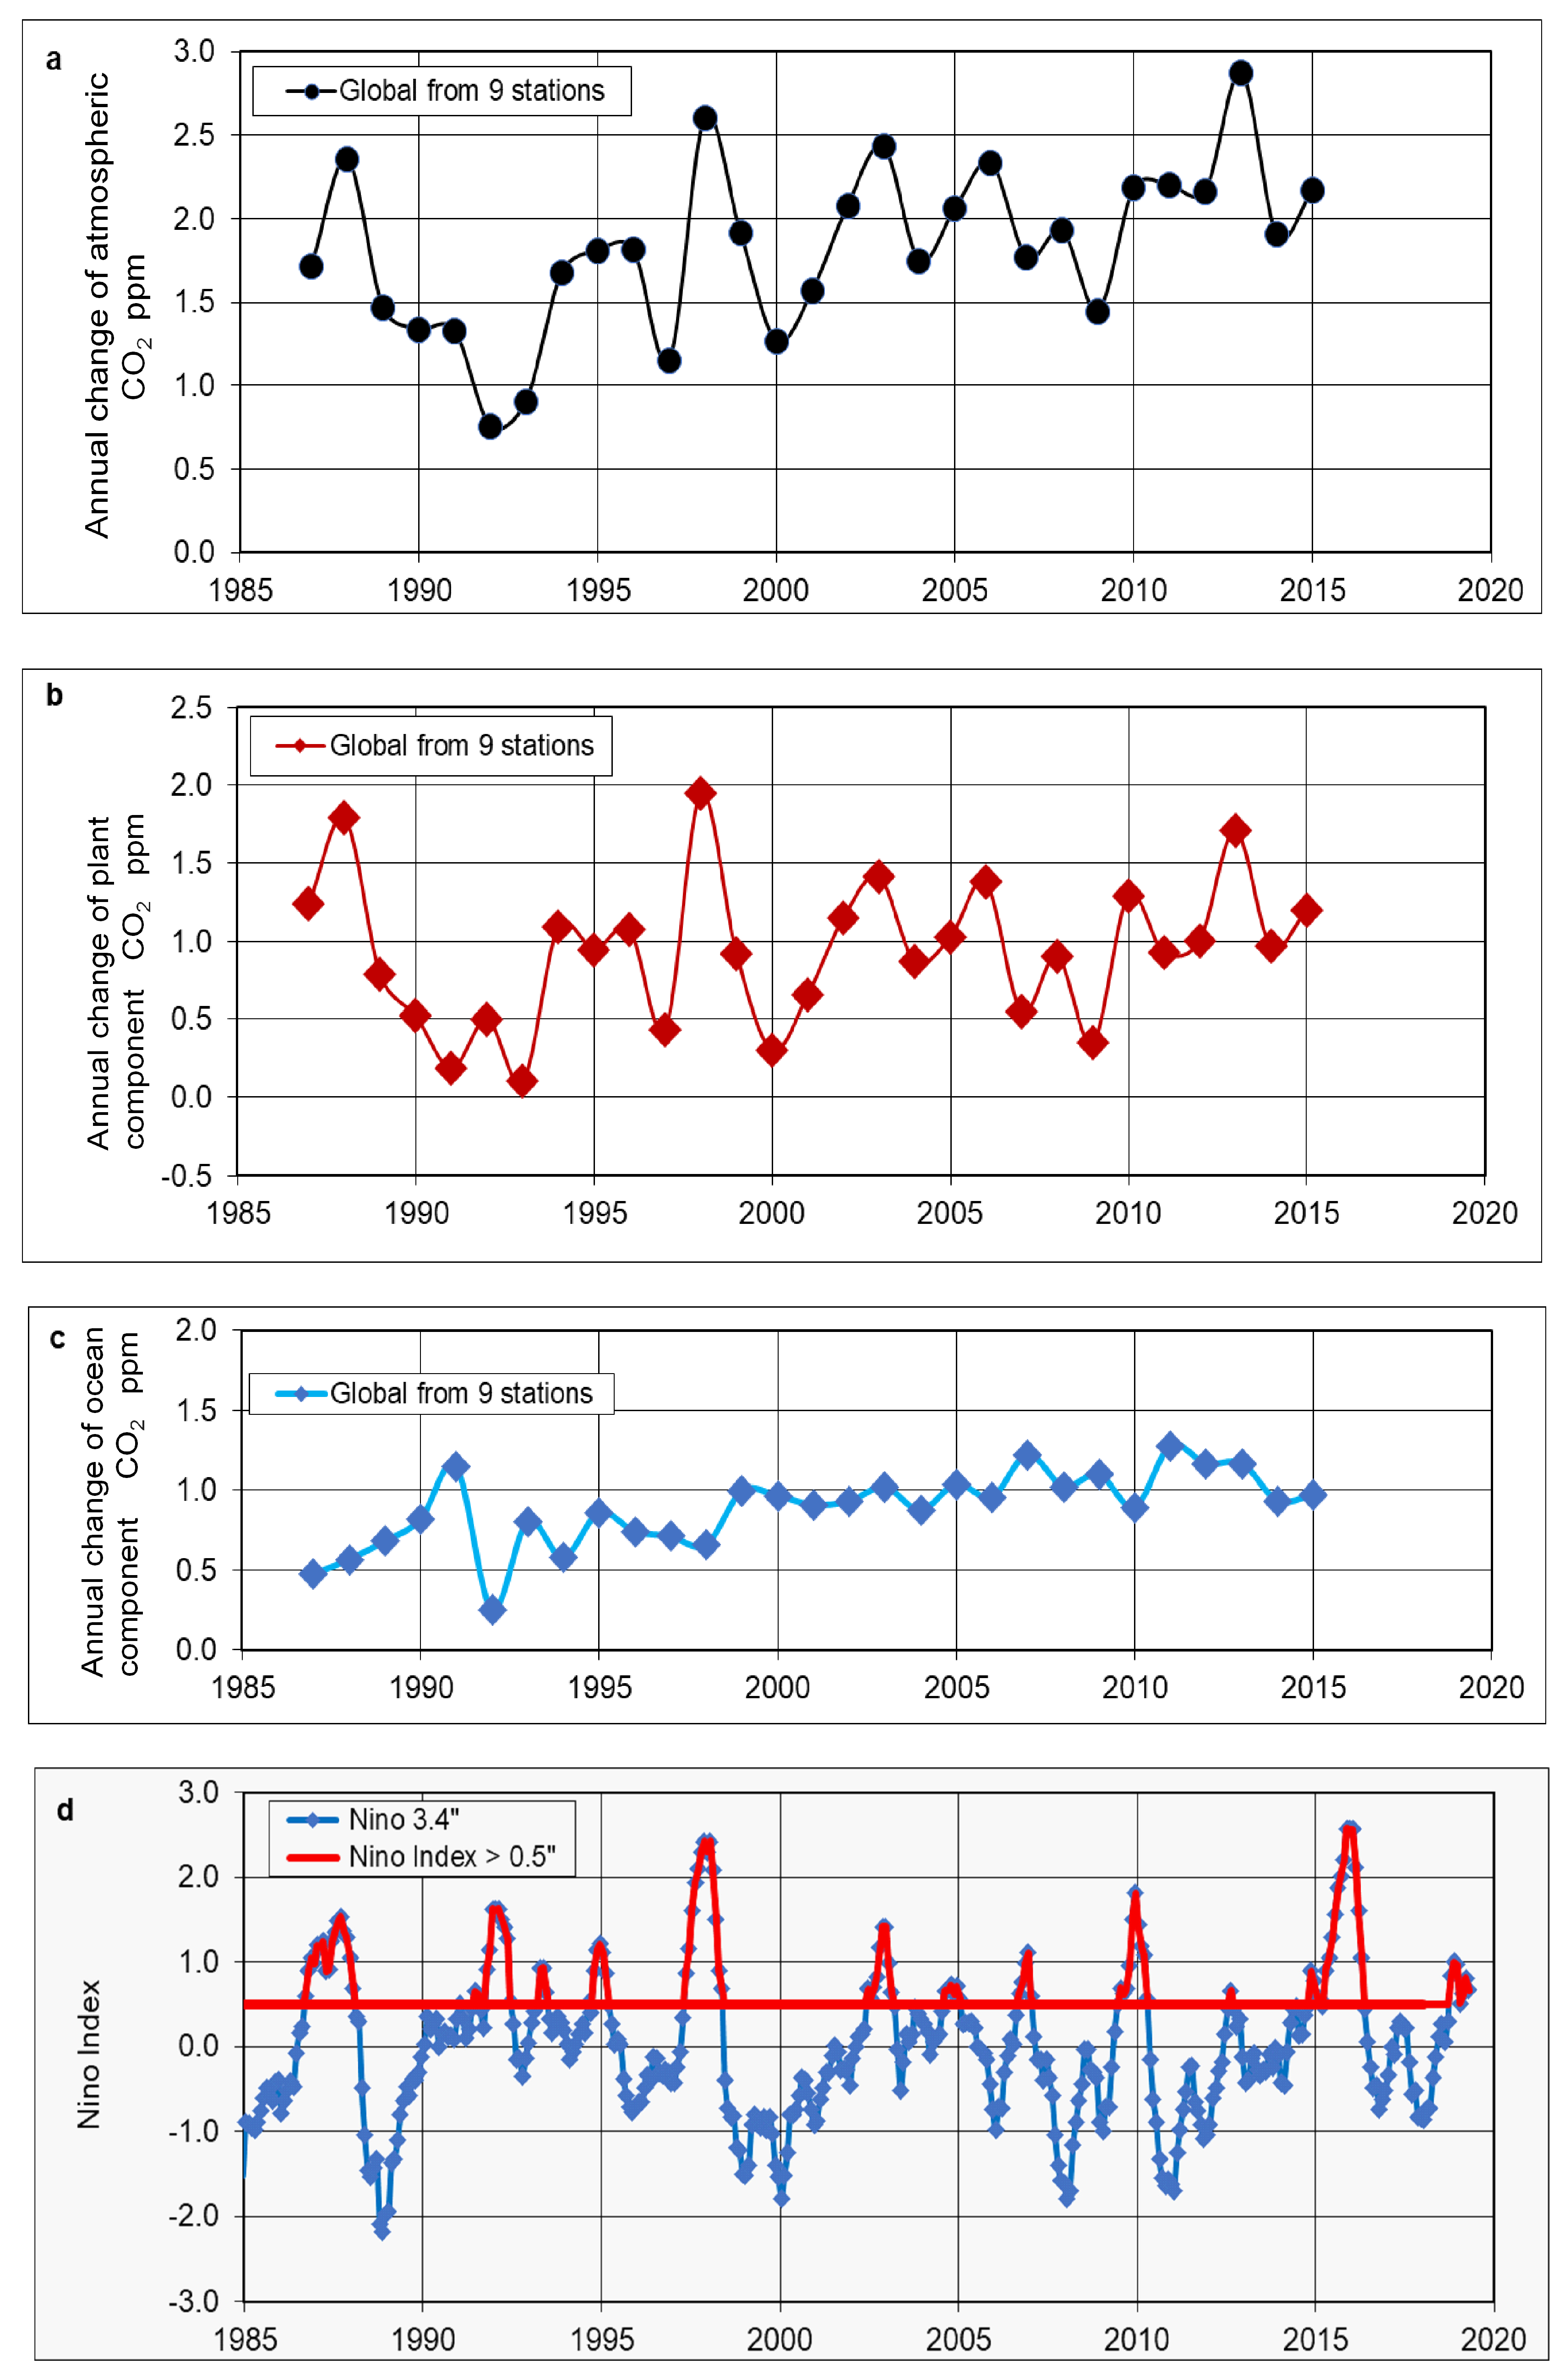
- A subtle increase above the trend in the measured CO2 concentrations is visible in Figure 1a for times around 1988–1991. This feature is clear in the plot of isotopic composition shown in Figure 1b (referred to as the “bubble” in later paragraphs) and overlaps in time the 1989 Regime Shift described by [15]. That 1989 event was clearly evident in biological records although only weakly shown in indices of the Pacific climate. Consistent with that prior finding of an event in biological records, we see that the “bubble” is present in the plant component of atmospheric CO2 as deduced from the isotopic analysis (Figure 2). However, the “bubble” is not evident in Figure 3, which shows the equivalent plot of the ocean component of atmospheric CO2. This feature is discussed in additional detail below in Section 4.
- (b)
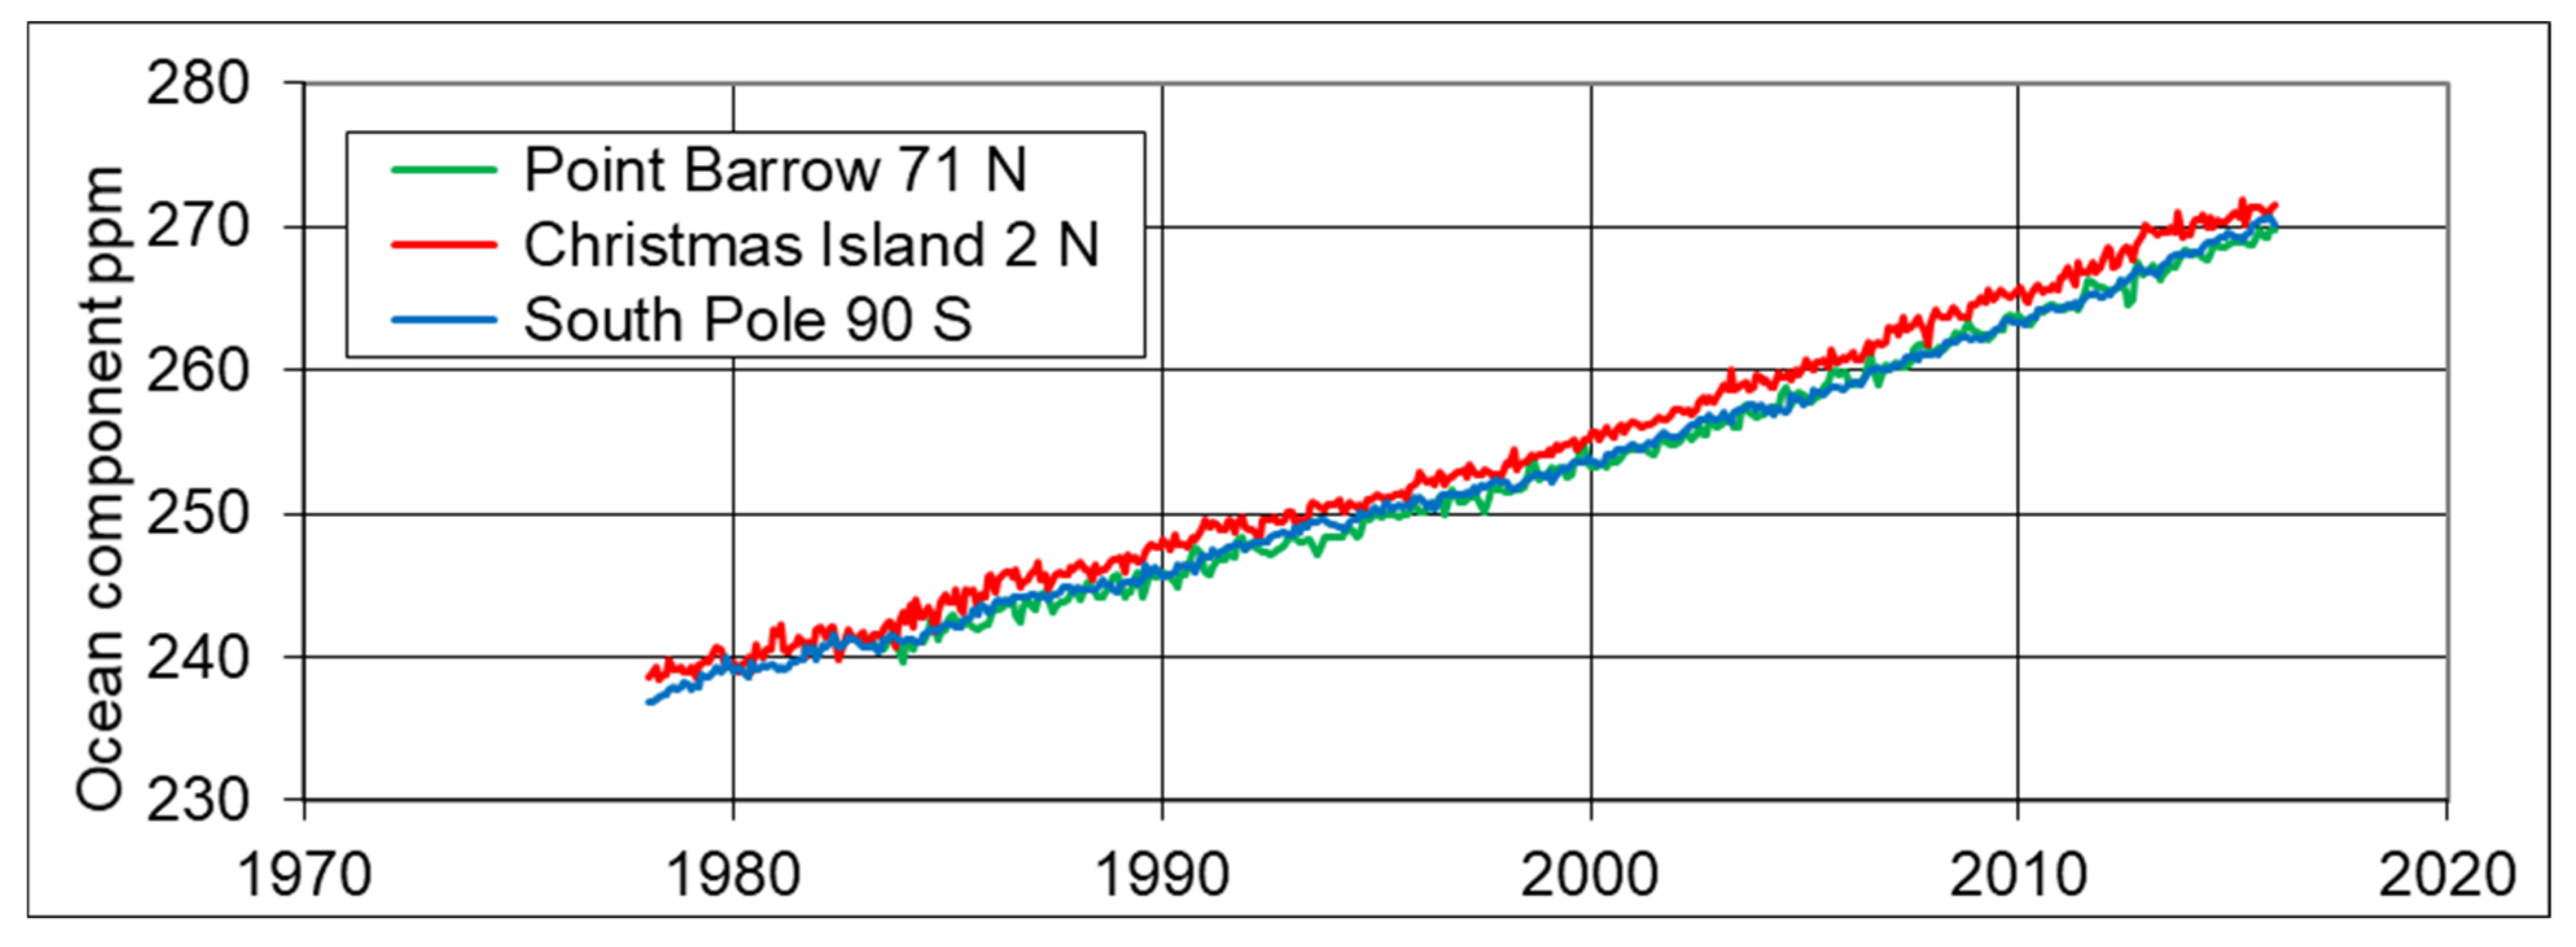
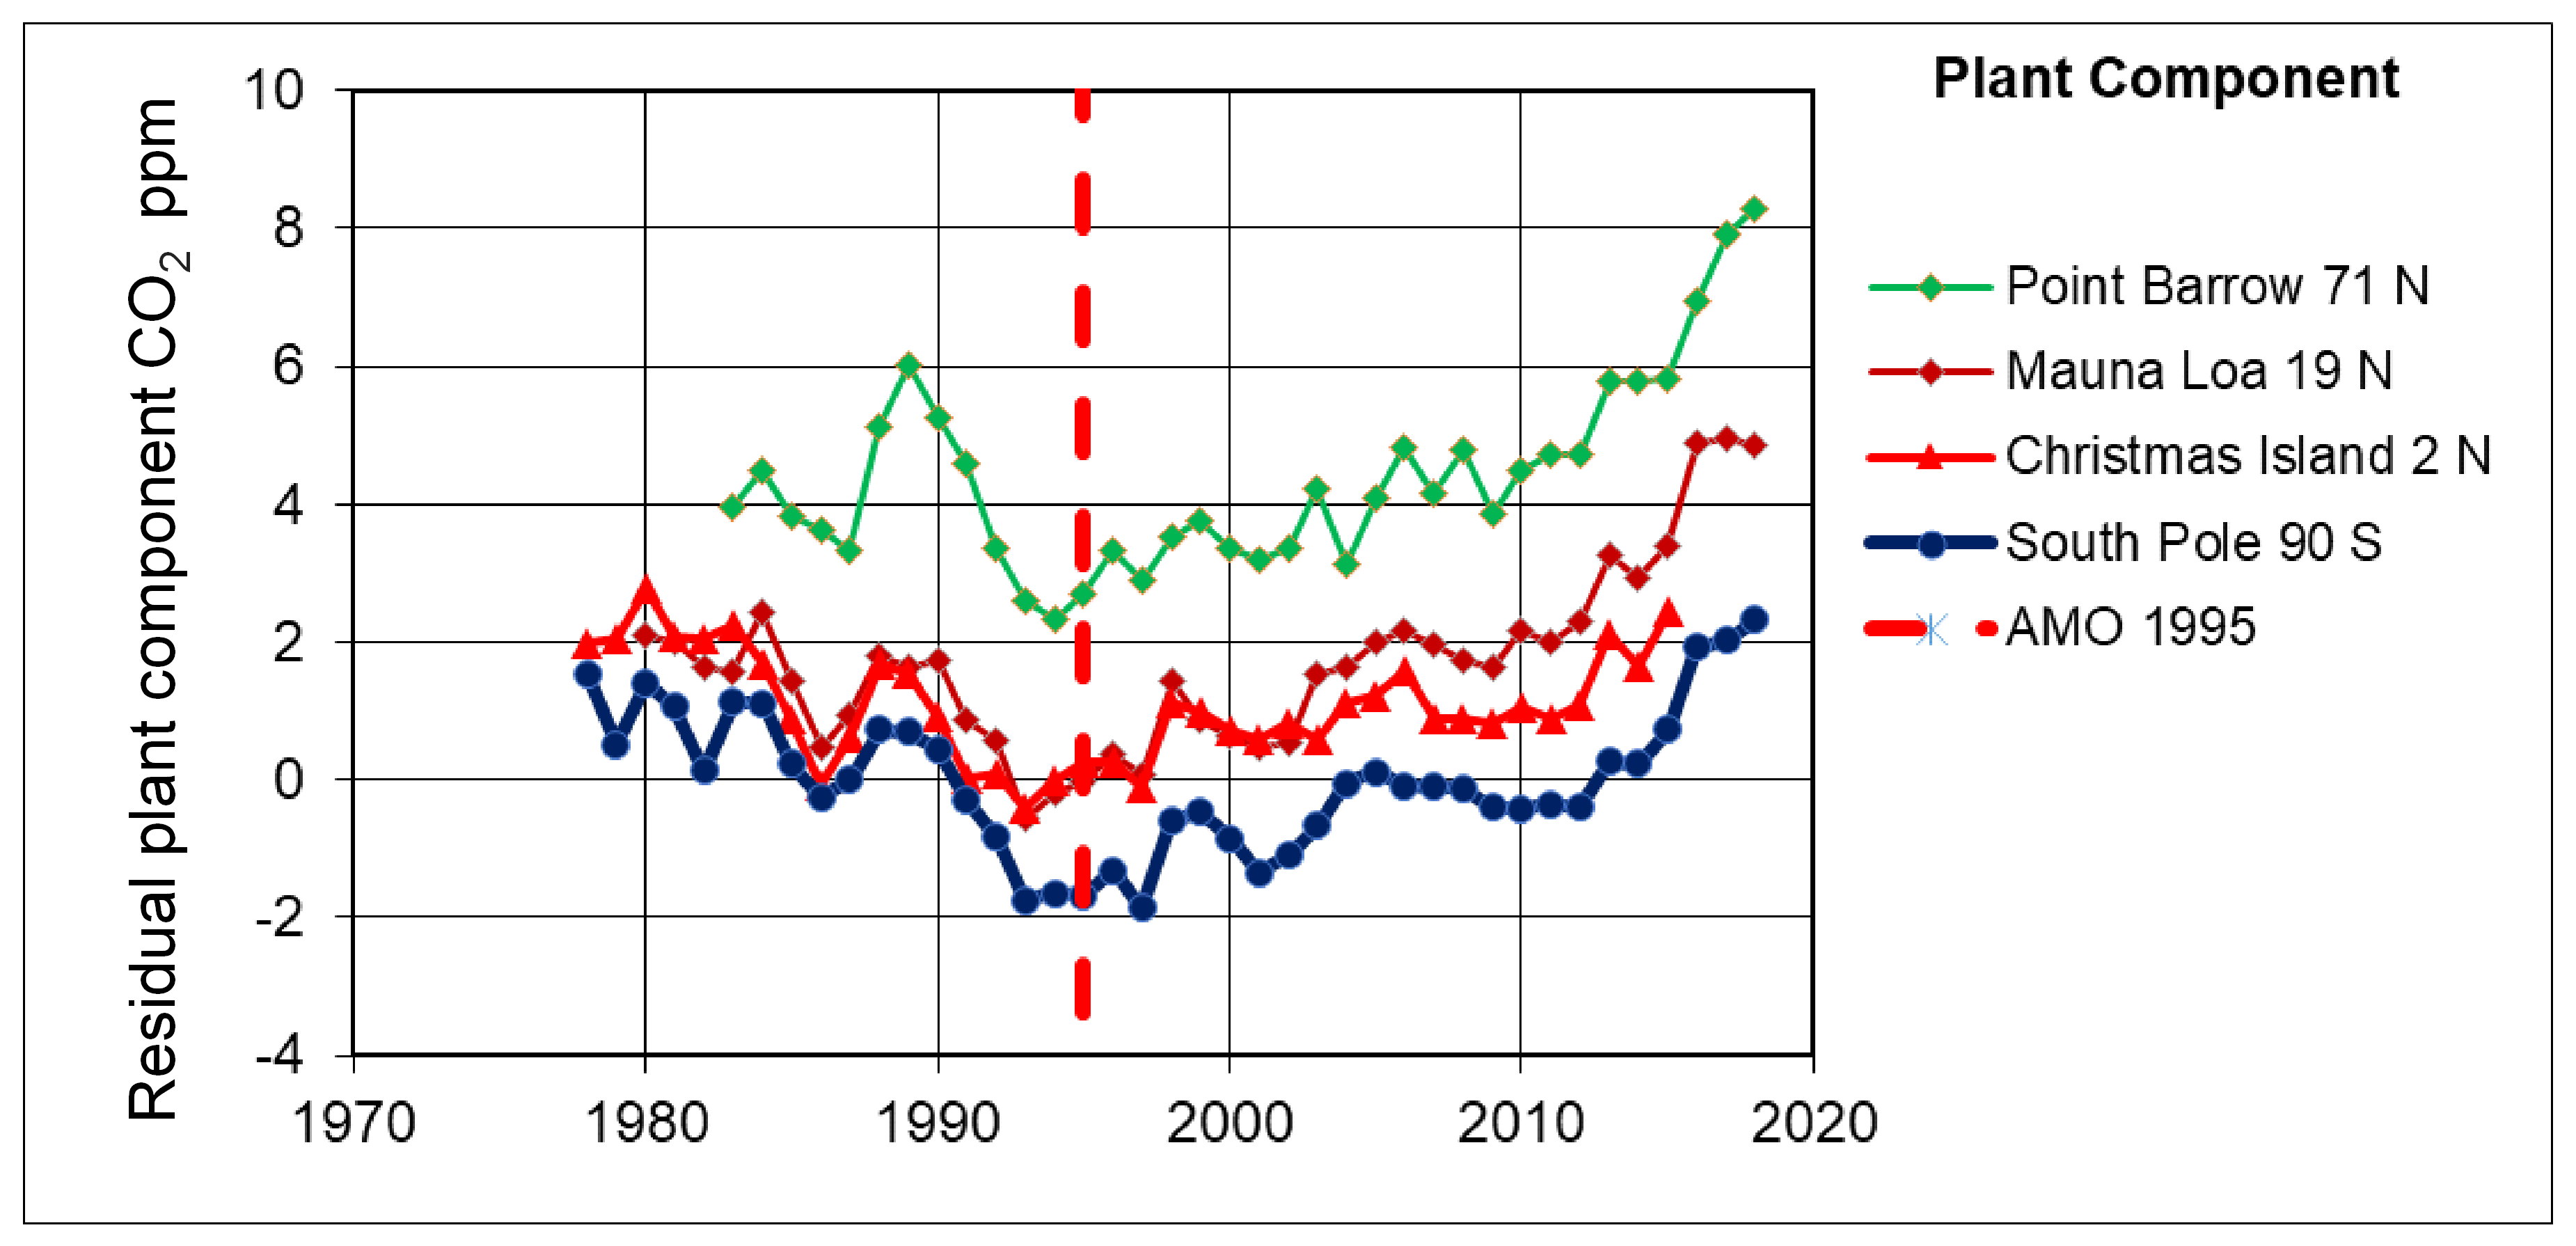
- For the ocean components shown in Figure 2, Christmas Island (2° N) near the equator shows higher values for the entire time span of 1978–2015, while Point Barrow (71° N) in the Arctic shows the lowest values. We discuss the significance of these observations in the context of ocean currents, in Section 3.2.
3. Ocean and Plant Source Component Latitude Analysis
3.1. Annual Values
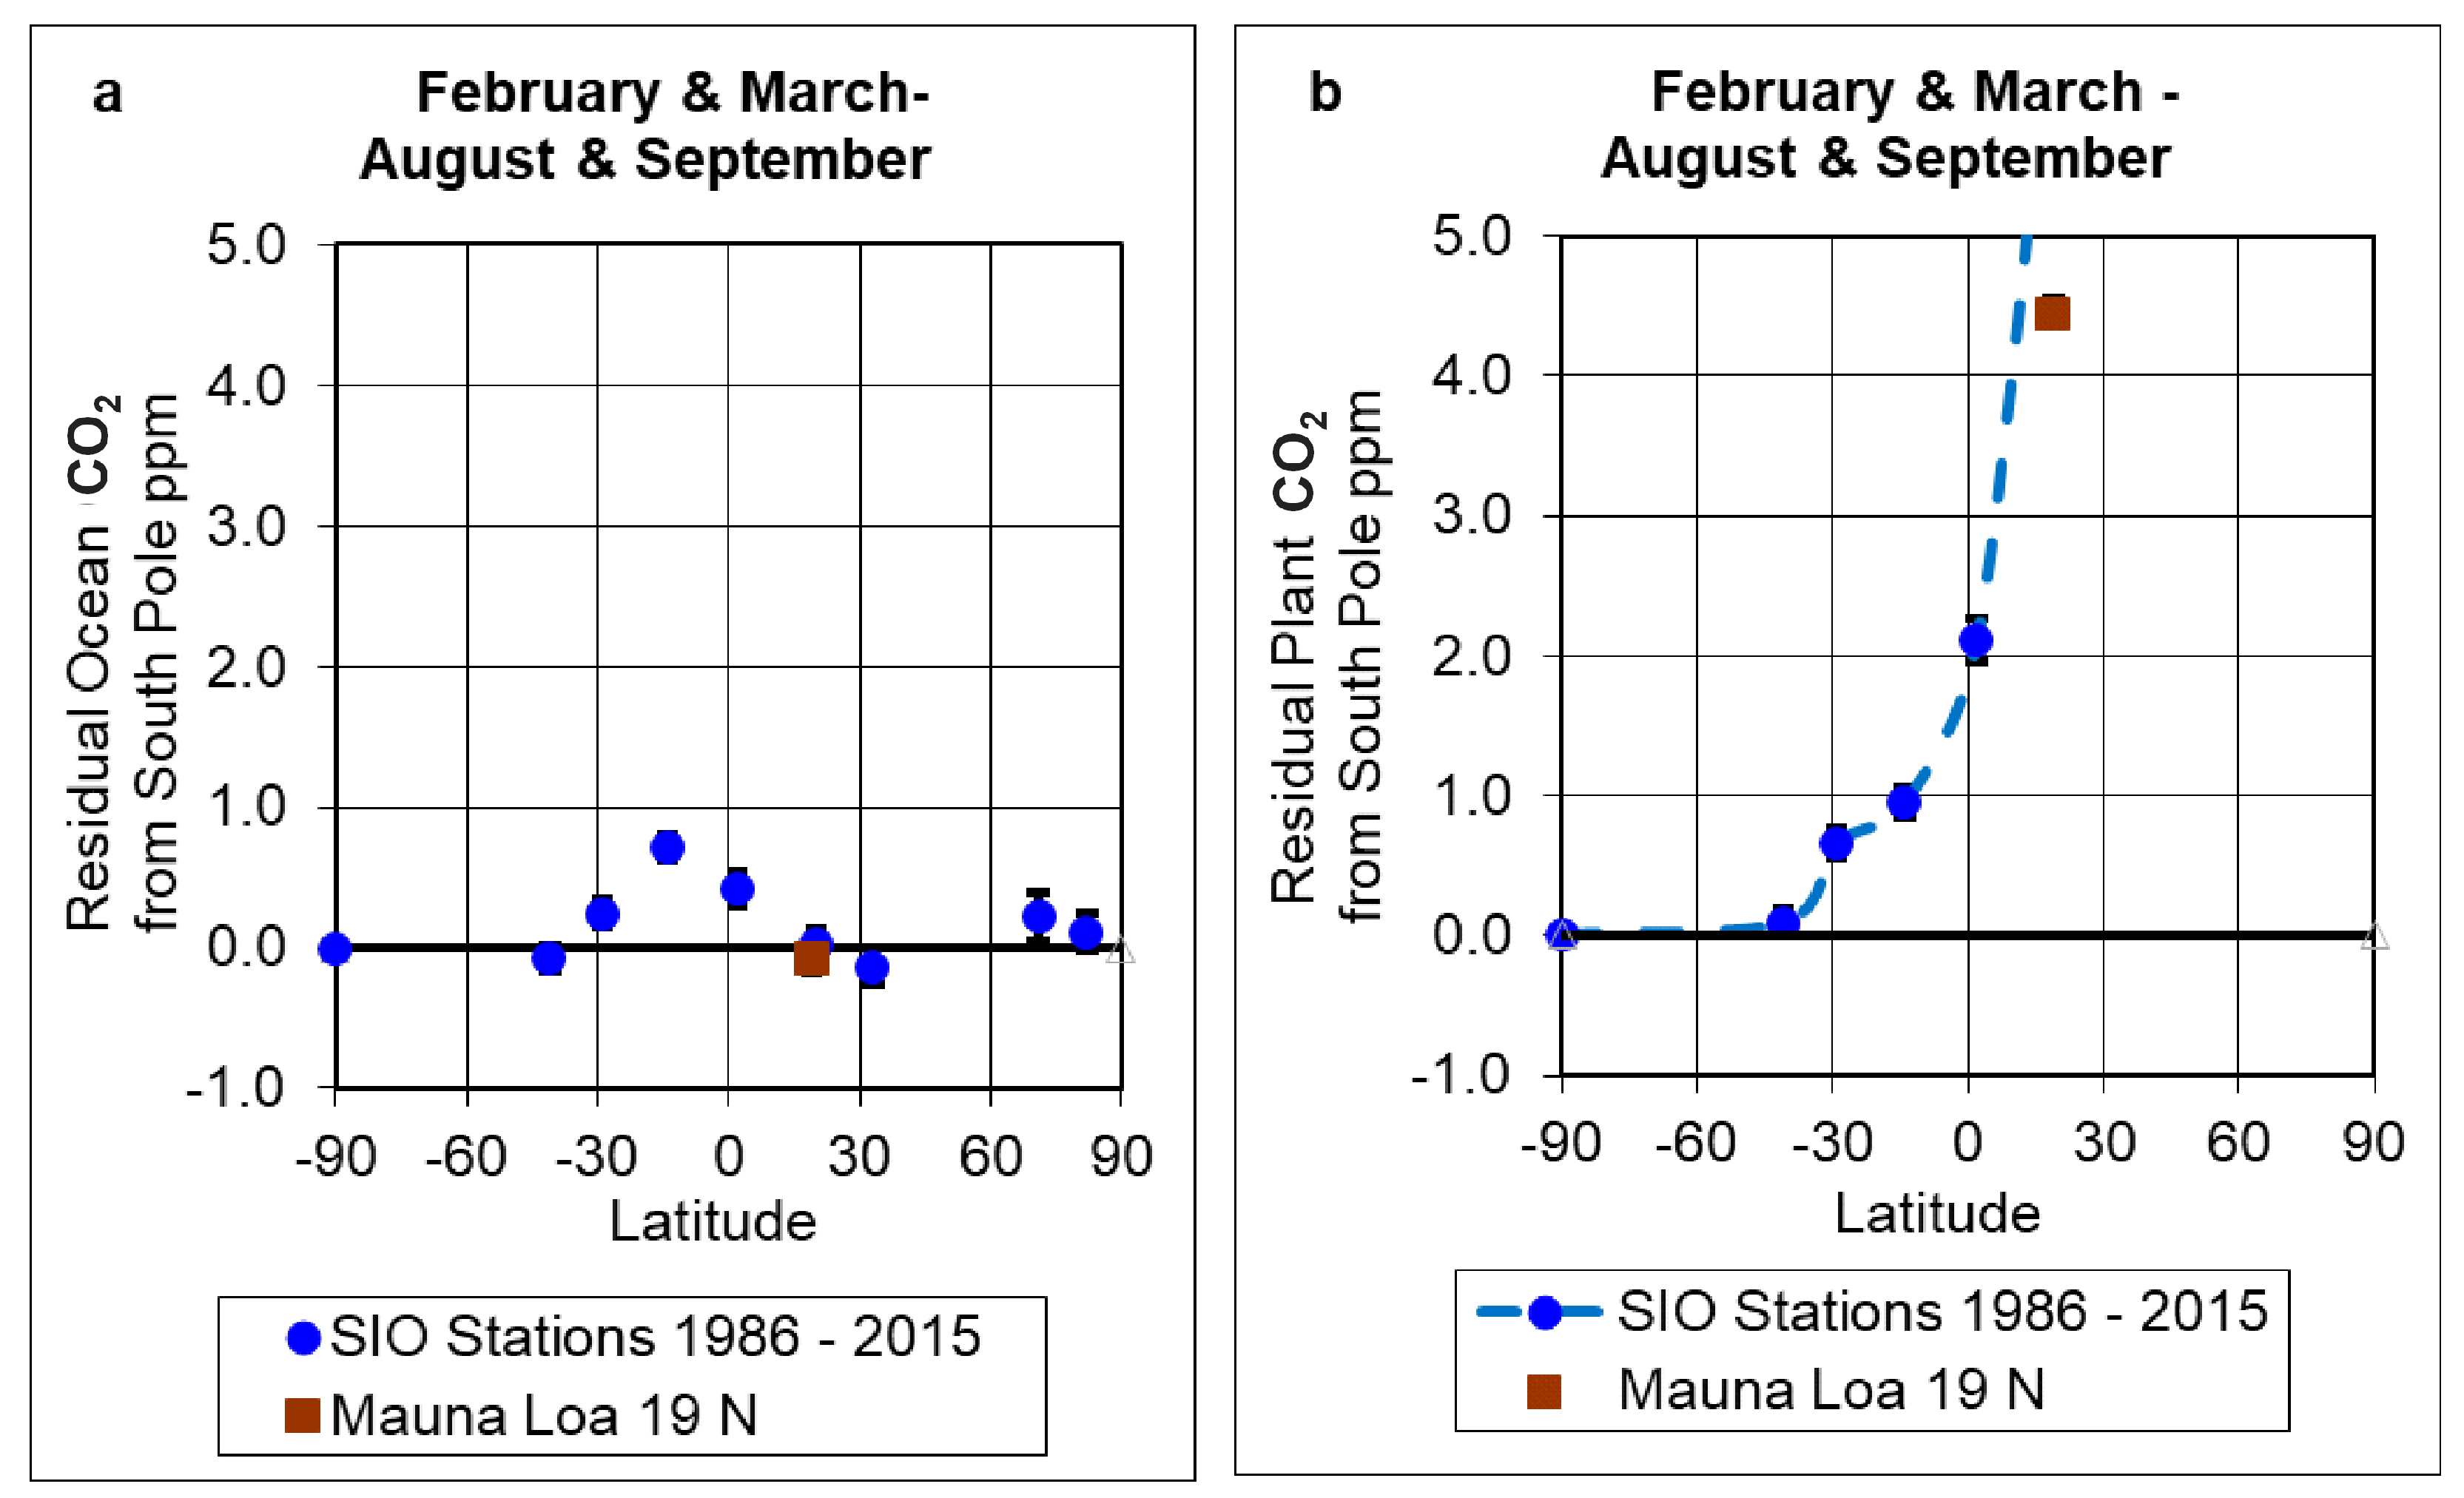
3.2. Latitude Analysis for Seasonal Values
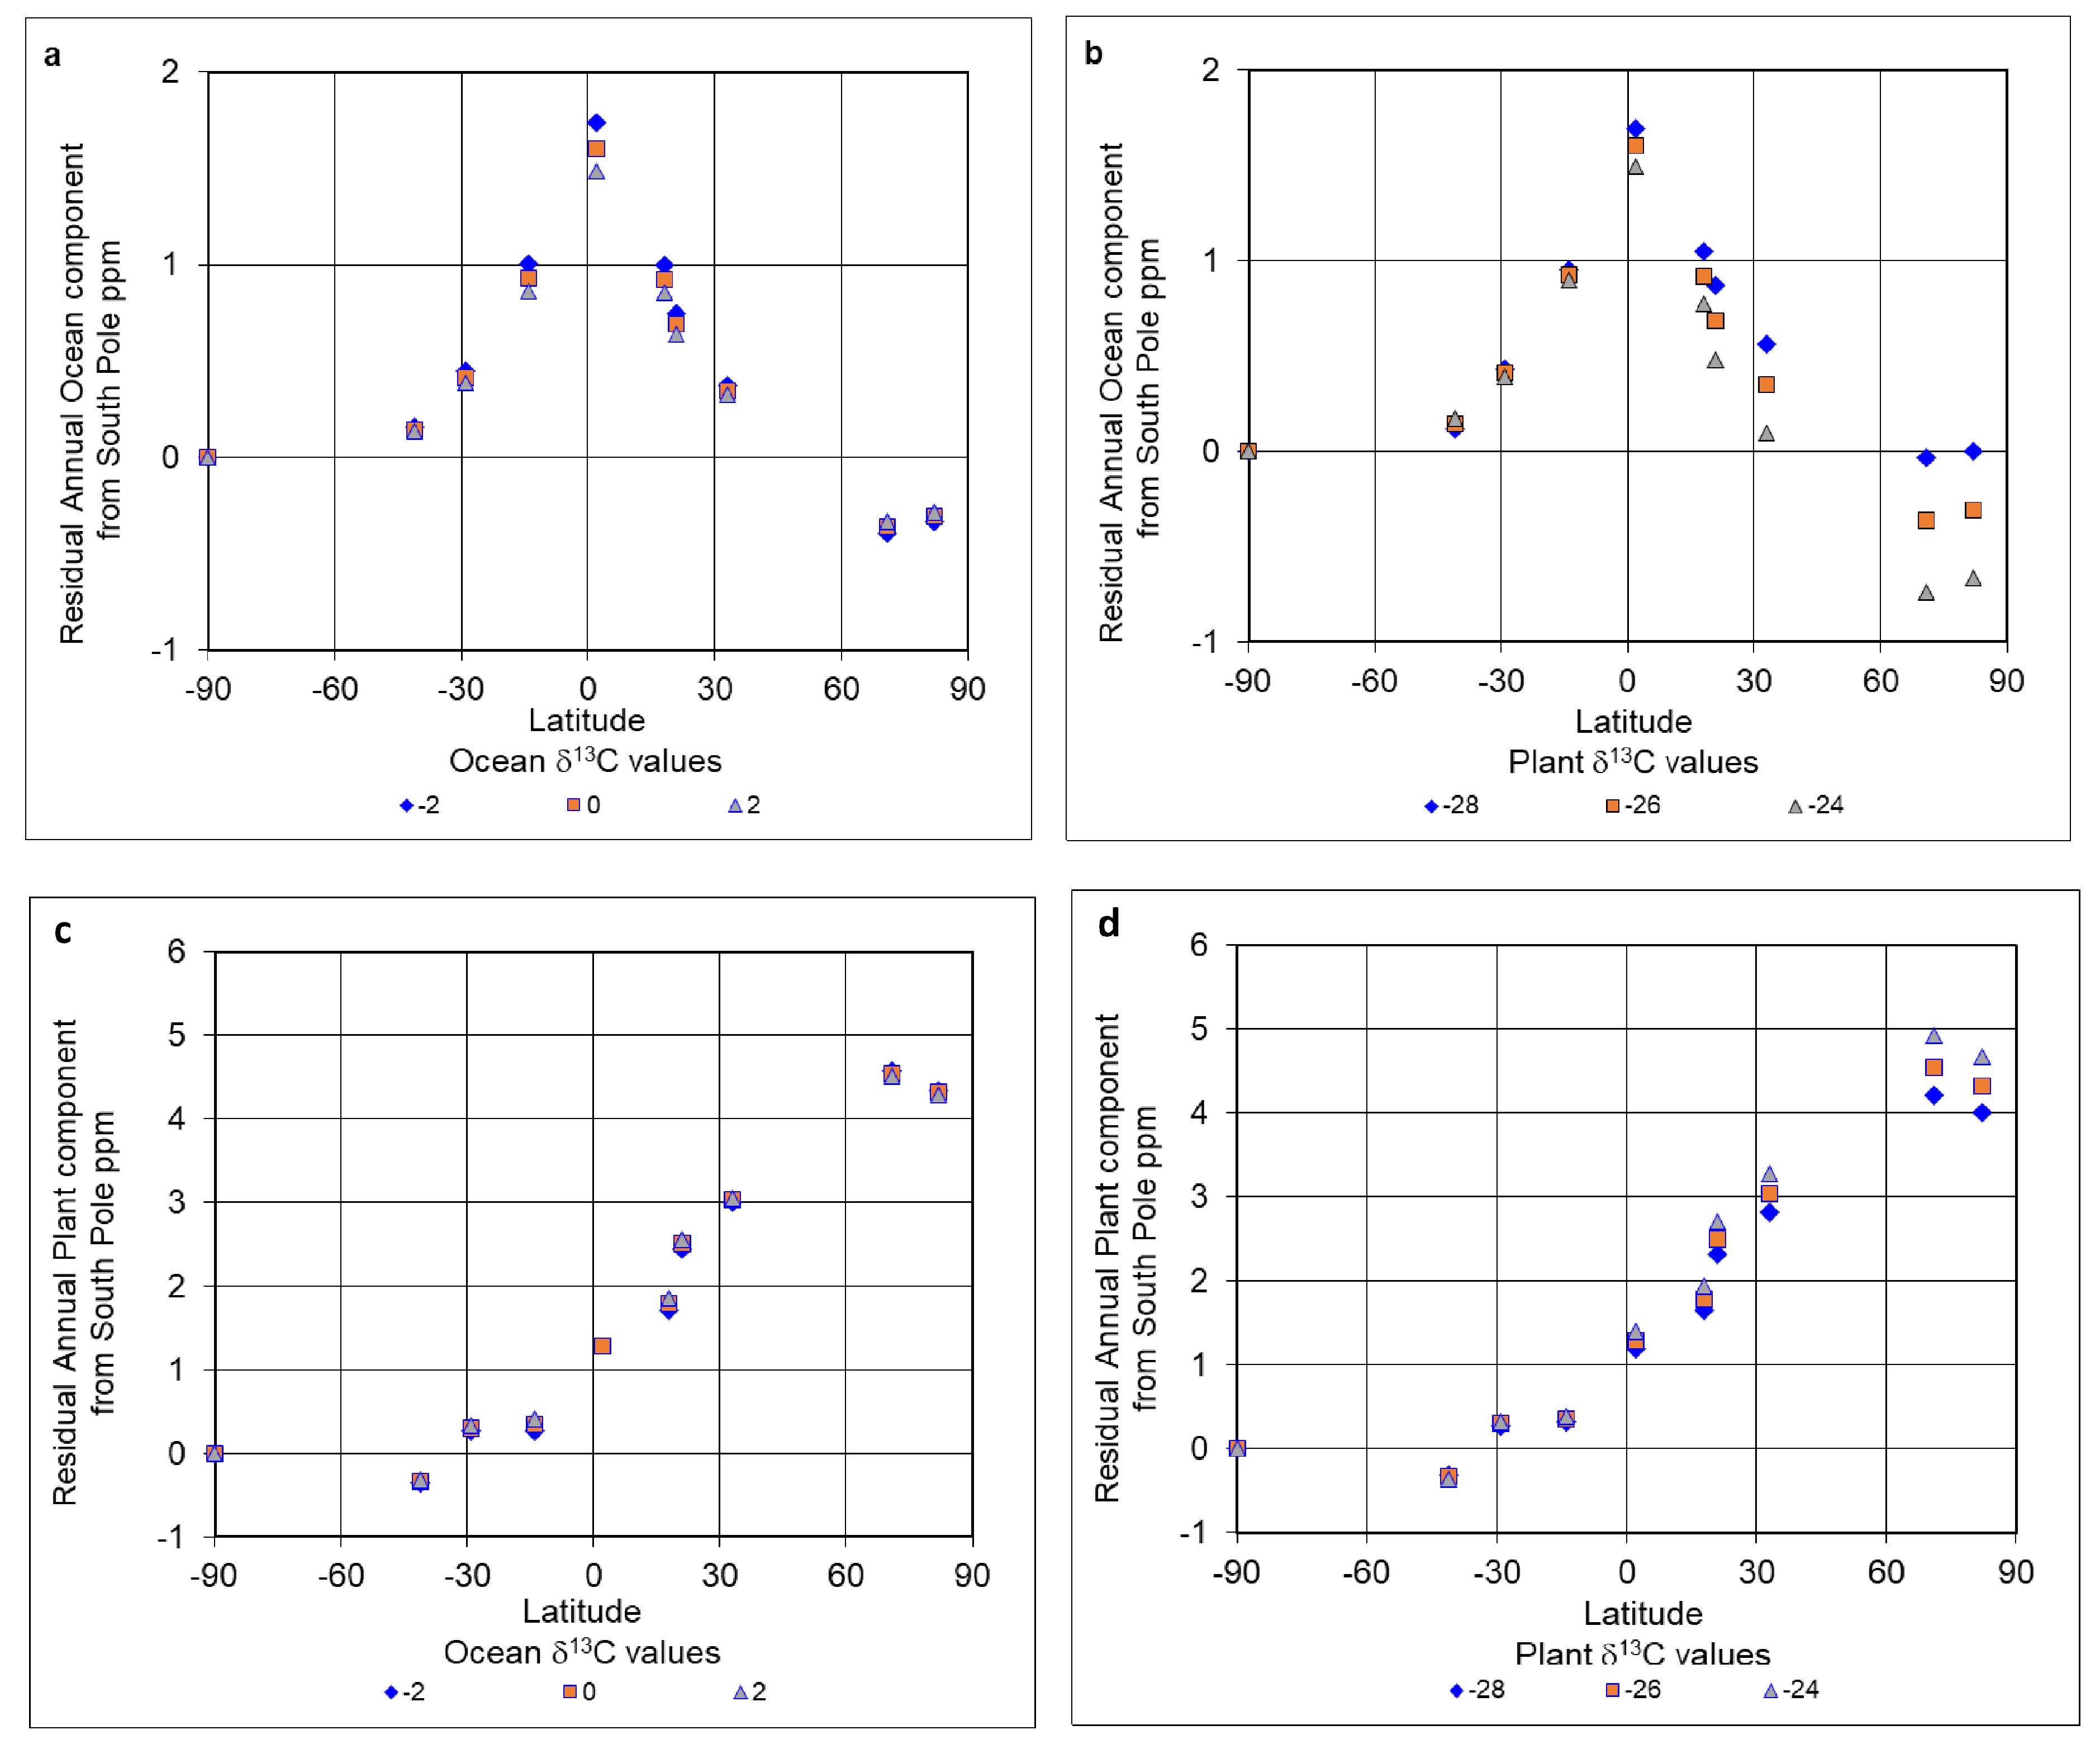
3.3. Sensitivity of Latitude Analysis to Assumptions of Isotopic Composition
4. Annual Differences of Ocean and Plant CO2 Components
4.1. Annual Differences for Individual Stations
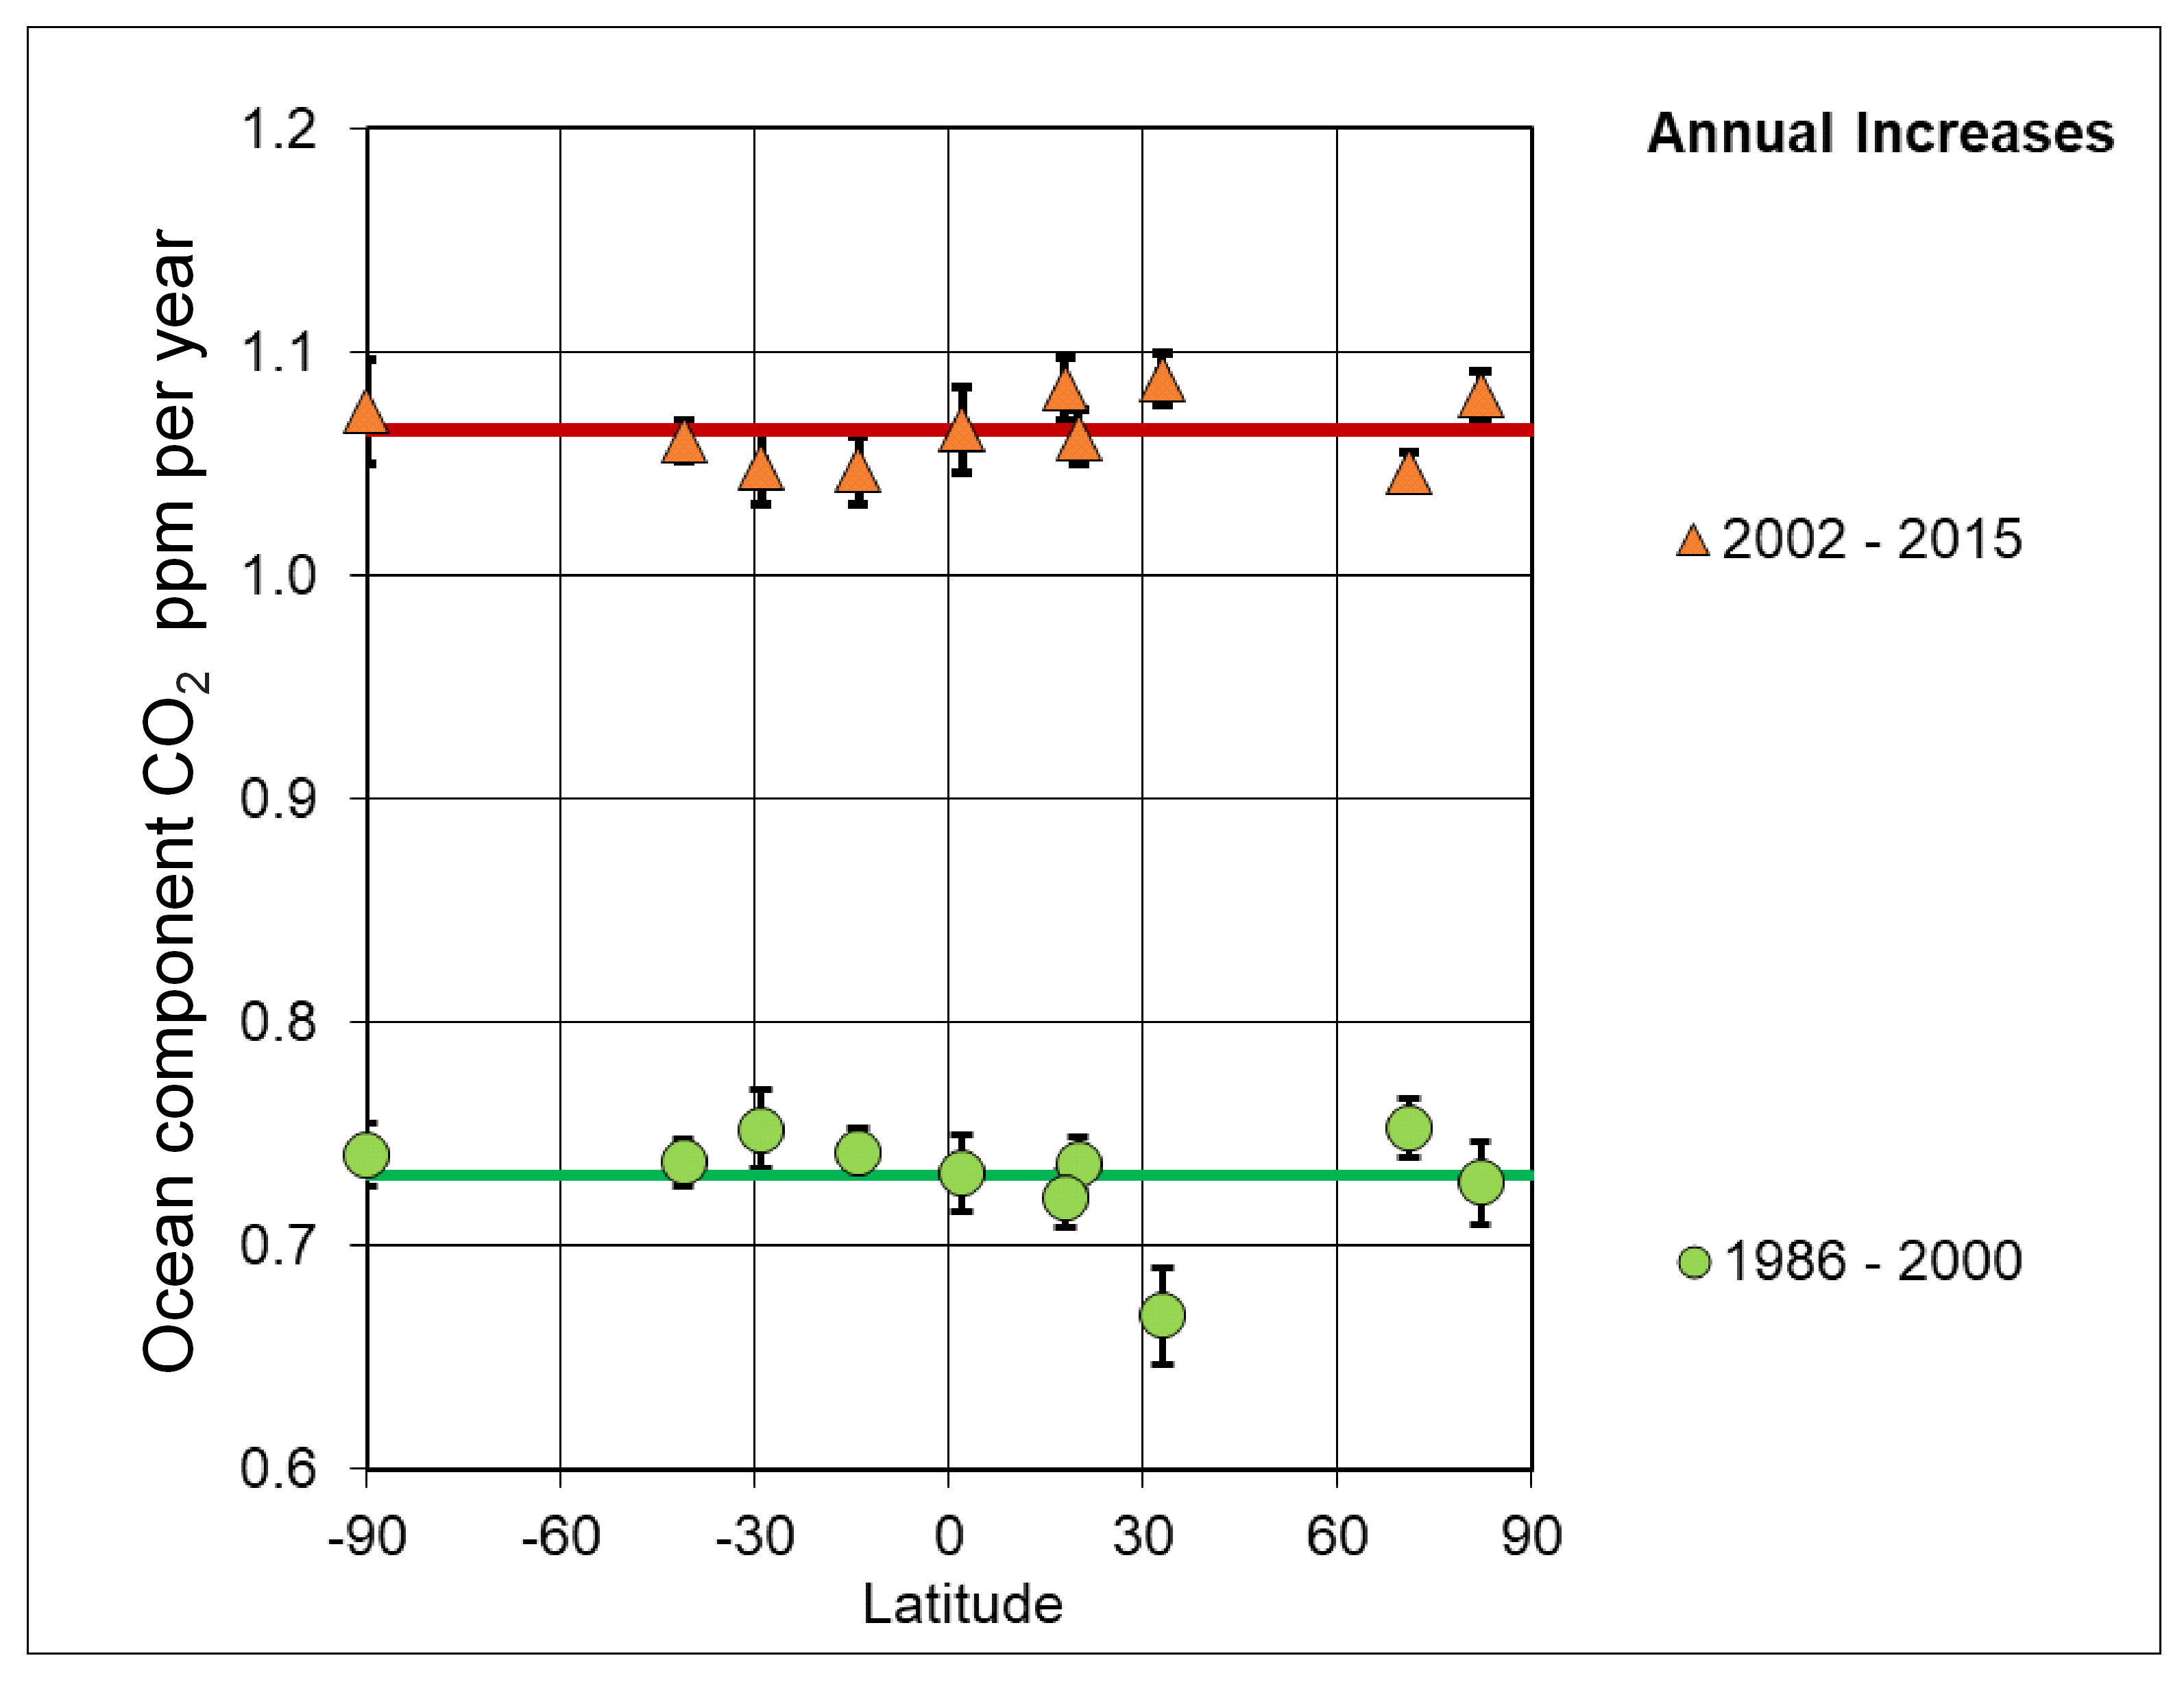
4.2. Trend Breaks in Annual Differences for the Ocean Component
4.3. Annual Differences in the Plant Component CO2; Correlation with a Phase Change in the AMO
4.4. Correlation of Global Plant Component CO2 Variations with the ENSO
5. Discussion and Conclusions
- Annual increases in atmospheric CO2 concentrations over 1978–2015 when split into plant and deep ocean sources via the isotopic signatures show approximately equal parts when averaged over all latitudes.
- The deep ocean component of CO2 has its maximum value at the equator and we conclude that it is an independent source of atmospheric CO2. This is further demonstrated by its limited year-on-year variability. We hypothesize that the observations of changes in ocean source CO2 are attributable to the upwelling of CO2-rich water transported across the sea floor via the global thermohaline circulation of the oceans.
- The plant source CO2 in the atmosphere shows strong seasonal variability in northern latitudes up to the Arctic circle. It also shows more temporal year-by-year variability than that of the ocean source CO2 and shows maximum variations coincident with the timing of El Nino events. It also shows a change in trend associated with the 1995 AMO phase change. These spatial and temporal variations are consistent with the plant source CO2 being associated with multiple variations in fossil fuel CO2 emissions, together with natural variations in the net primary productivity of oceanic phytoplankton, and forest and peat fires.
- The differing variations by year and by latitude of plant source and deep ocean source CO2 as measured from the analysis of carbon isotopes in atmospheric CO2 samples, suggest that inclusion of such isotopic data in full carbon cycle models for the Earth may provide additional constraints on the modeling of bidirectional atmosphere–ocean transfers of CO2.
Author Contributions
Funding
Institutional Review Board Statement
Informed Consent Statement
Data Availability Statement
Conflicts of Interest
References
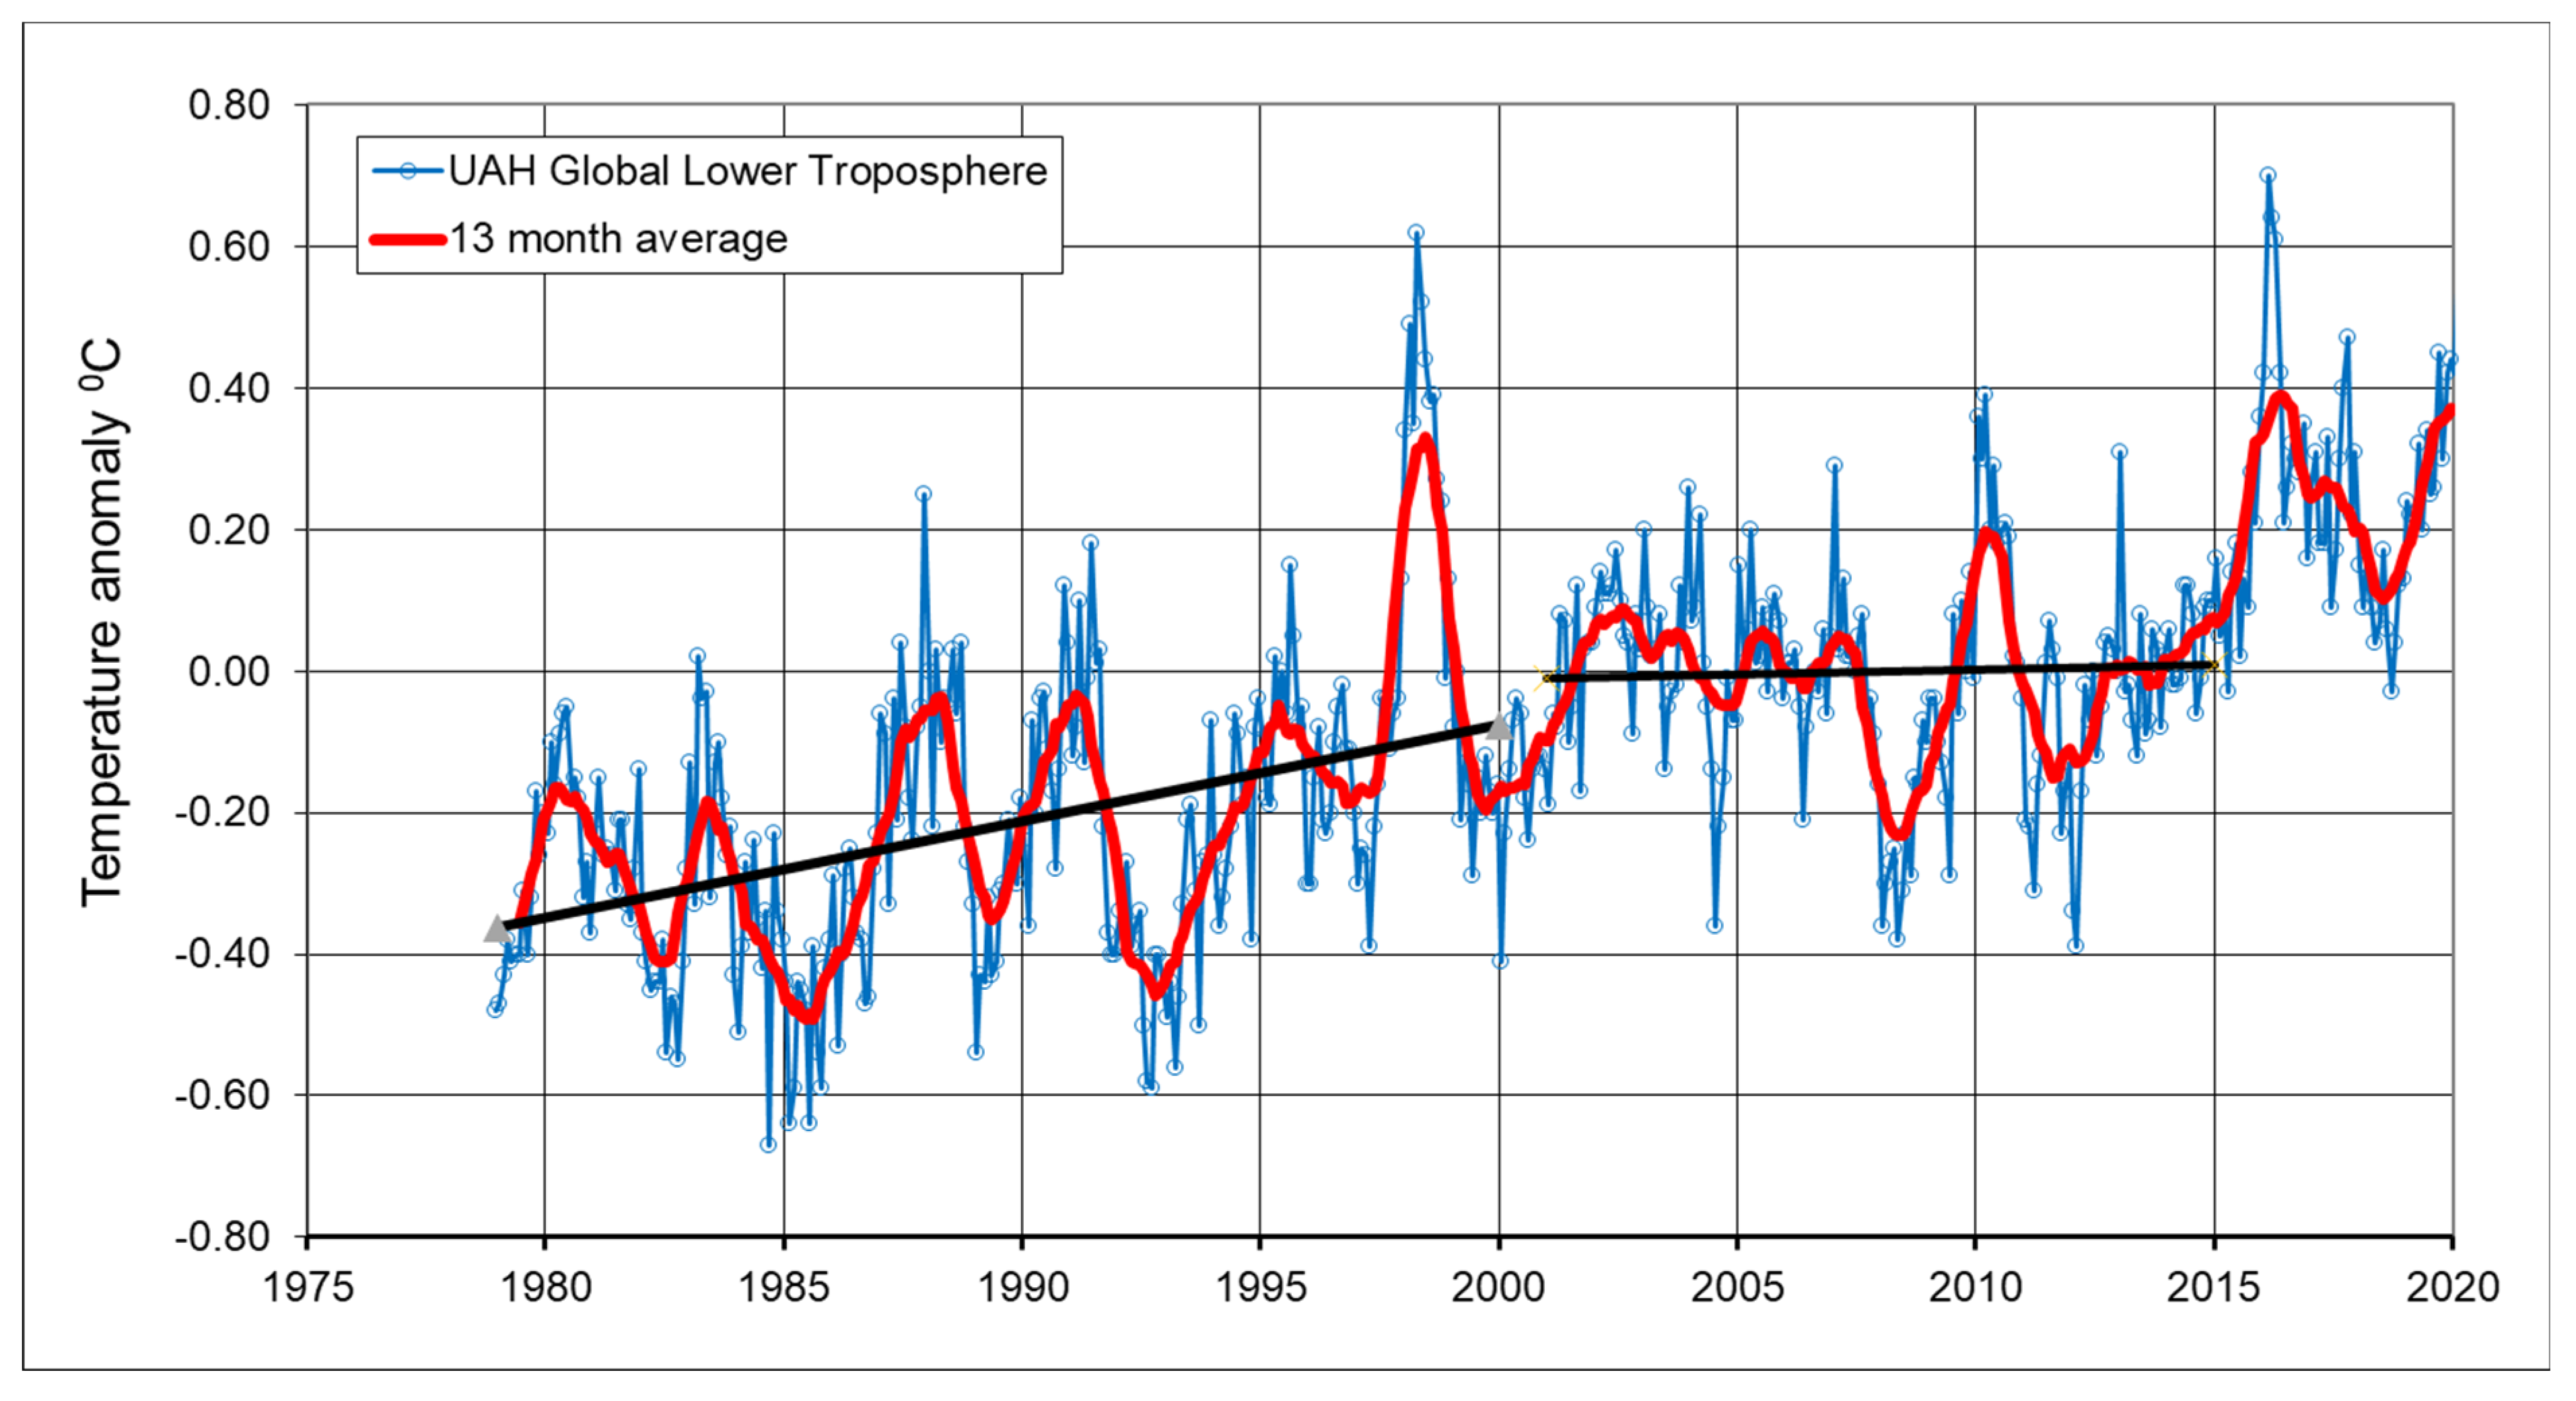
- Quirk, T. Did the global temperature trend change at the end of the 1990s? Asia-Pac. J. Atmos. Sci. 2012, 48, 339–344. [Google Scholar] [CrossRef]
- NOAA. Nino 3.4 SST Index. Available online: https://psl.noaa.gov/gcos_wgsp/Timeseries/Data/nino34.long.data (accessed on 15 April 2023).
- Crisp, D.; Dolman, H.; Tanhua, T.; McKinley, G.A.; Hauck, J.; Bastos, A.; Sitch, S.; Eggleston, S.; Aich, V. How well do we understand the land-ocean-atmosphere carbon cycle? Rev. Geophys. 2022, 60, e2021RG000736. [Google Scholar] [CrossRef]
- Gruber, N.; Bakker, D.C.E.; DeVries, T.; Gregor, L.; Hauck, J.; Landschützer, P.; McKinley, G.A.; Muller, J.D. Trends and variability in the ocean carbon sink. Nat. Rev. Earth Environ. 2023, 4, 119–134. [Google Scholar] [CrossRef]
- Machado, K.S.; Froehner, S. Changes in atmospheric CO2 levels recorded by the isotopic signature of n-alkanes from plants. Glob. Planet. Chang. 2017, 148, 72–78. [Google Scholar] [CrossRef]
- Keeling, C.D.; Piper, S.C.; Bacastow, R.B.; Wahlen, M.; Whorf, T.P.; Heimann, M.; Meijer, H.A. Exchanges of Atmospheric CO2 and 13CO2 with the Terrestrial Biosphere and Oceans from 1978 to 2000. In Global Aspects; SIO Reference Series; No. 01-06; Scripps Institution of Oceanography: San Diego, CA, USA, 2001; 88p, Available online: https://scrippsco2.ucsd.edu/data/atmospheric_co2/sampling_stations.html (accessed on 21 June 2023).
- Hoffman, D.W.; Rasmussen, C. Absolute carbon stable isotope ratio in the Vienna Peedee Belemnite isotope reference determined by 1H NMR spectroscopy. Anal. Chem. 2022, 94, 5240–5247. [Google Scholar] [CrossRef] [PubMed]
- Kroopnick, P.M. The distribution of 13C of ΣCO2 in the world oceans. Deep-Sea Res. 1985, 32, 57–84. [Google Scholar] [CrossRef]
- Ohmoto, H. Stable isotope geochemistry of ore deposits. Rev. Mineral. 1986, 16, 491–559. [Google Scholar]
- Kozyr, A. Carbon Dioxide, Hydrographic, and Chemical Data Obtained during the R/V Knorr Repeat Hydrography Cruise in the Atlantic Ocean: CLIVAR CO2 Sections A20_2003 (22 September–20 October 2003) and A22_2003 (23 October–13 November, 2003); ORNL/CDIAC-154; NDP-089; Carbon Dioxide Information Analysis Center, Oak Ridge National Laboratory, U.S. Department of Energy: Oak Ridge, TN, USA, 2008.
- NOAA. The Global Conveyor Belt. Available online: https://oceanservice.noaa.gov/education/tutorial_currents/05conveyor2.html (accessed on 21 June 2023).
- O’Leary, M. Carbon isotopes in photosynthesis fractionation techniques may reveal new aspects of carbon dynamics in plants. BioScience 1988, 38, 328–336. [Google Scholar]
- Goericke, R.; Fry, B. Variations of marine plankton fi13C with latitude, temperature, and dissolved CO2 in the world ocean. Glob. Biogeochem. Cycles 1994, 8, 85–90. [Google Scholar] [CrossRef]
- Warwick, P.D.; Ruppert, L.F. Carbon and oxygen isotopic composition of coal and carbon dioxide derived from laboratory coal combustion: A preliminary study. Int. J. Coal Geol. 2016, 166, 128–135. [Google Scholar] [CrossRef]
- Hare, S.R.; Mantua, N.J. Empirical evidence for North Pacific regime shifts in 1977 and 1989. Prog. Ocean. 2000, 47, 103–145. [Google Scholar] [CrossRef]
- Chow, G. Tests of equality between sets of coefficients in two linear regressions. Econometrica 1960, 28, 591–605. [Google Scholar] [CrossRef]
- Earth System Science Center. Global Temperature Report, Monthly Average Data. 2022. Available online: https://www.nsstc.uah.edu/data/msu/v6.0/tlt/uahncdc_lt_6.0.txt (accessed on 21 June 2023).
- Alexander, M.A.; Halimeda, K.; Nye, J.A. Climate variability during warm and cold phases of the Atlantic Multidecadal Oscillation (AMO) 1871–2008. J. Mar. Syst. 2014, 133, 14–26. [Google Scholar] [CrossRef]
- Alheit, J.; Licandro, P.; Coombs, S.; Garcia, A.; Giráldez, A.; Santamaría, M.T.G.; Slotte, A.; Tsikliras, A.C. Atlantic Multi-decadal Oscillation (AMO) modulates dynamics of small pelagic fishes and ecosystem regime shifts in the eastern North and Central Atlantic. J. Mar. Syst. 2014, 131, 21–35. [Google Scholar] [CrossRef]
- Rayner N., A.; Parker, D.E.; Horton, E.B.; Folland, C.K.; Alexander, L.V.; Rowell, D.P.; Kent, E.C.; Kaplan, A. Global analyses of sea surface temperature, sea ice, and night marine air temperature since the late nineteenth century. J. Geophys. Res. 2003, 108, 4407. [Google Scholar] [CrossRef]
- Holzer, M.; DeVries, T. Source-labeled anthropogenic carbon reveals a large shift of preindustrial carbon from the ocean to the atmosphere. Glob. Biogeochem. Cycles 2022, 36, e2022GB007405. [Google Scholar] [CrossRef]


| Latitude | Longitude | Elevation | Years with | % Months with no Data | ||
|---|---|---|---|---|---|---|
| (meters) | CO2 and d13C | All | 1986–2015 | |||
| Alert | 82° N | 63° W | 210 | 1986–2018 | 4.55% | 4.72% |
| Point Barrow | 71° N | 157° W | 11 | 1983–2018 | 4.17% | 4.72% |
| La Jolla | 33° N | 117° W | 10 | 1979–2018 | 14.38% | 10.28% |
| Kumukahi | 19° N | 155° W | 3 | 1981–2018 | 1.10% | 0.28% |
| Mauna Loa | 19° N | 156° W | 3397 | 1981–2018 | 2.19% | 0.00% |
| Christmas Island * | 2° N | 157° W | 2 | 1978–2018 | 32.11% | 26.67% |
| American Samoa | 14° S | 171° W | 30 | 1985–2018 | 3.92% | 3.33% |
| Kermadec | 29° S | 178° W | 2 | 1985–2018 | 53.43% | 51.94% |
| Baring Head | 41° S | 175° E | 85 | 1986–2018 | 40.91% | 39.17% |
| South Pole | 90° S | 2810 | 1978–2018 | 7.52% | 3.06% | |
| Annual Increases in ppm | |||
|---|---|---|---|
| Stations | CO2 Concentration | Ocean Component | Plant Component |
| South Pole 90° S | 1.769 +/− 0.008 | 0.886 +/− 0.005 | 0.883 +/− 0.005 |
| Christmas Island 2° N | 1.819 +/− 0.009 | 0.910 +/− 0.005 | 0.909 +/− 0.007 |
| Point Barrow 71° N | 1.800 +/− 0.038 | 0.902 +/− 0.005 | 0.898 +/− 0.038 |
| SIO Stations | Latitude | Longitude | Elevation (Meters) | Residual Values from South Pole Value in ppm | ||
|---|---|---|---|---|---|---|
| Mean | Standard Deviation | Error of Mean | ||||
| Alert | 82° N | 63° W | 210 | −0.29 | 0.33 | 0.06 |
| Point Barrow | 71° N | 157° W | 11 | −0.30 | 0.39 | 0.06 |
| La Jolla | 33° N | 117° W | 10 | 0.36 | 0.40 | 0.07 |
| Kumukahi | 19° N | 155° W | 3 | 0.70 | 0.39 | 0.07 |
| Mauna Loa | 19° N | 156° W | 3397 | 0.99 | 0.24 | 0.04 |
| Christmas Island | 2° N | 157° W | 2 | 1.62 | 0.42 | 0.08 |
| American Samoa | 14° S | 171° W | 30 | 0.94 | 0.26 | 0.05 |
| Kermadec | 29° S | 178° W | 2 | 0.43 | 0.34 | 0.06 |
| Baring Head | 41° S | 175° E | 85 | 0.16 | 0.27 | 0.05 |
| South Pole | 90° S | 2810 | 0.00 | |||
| SIO Stations | Latitude | Longitude | Elevation (Meters) | Residual Values from South Pole Value in ppm | ||
|---|---|---|---|---|---|---|
| Mean | Standard Deviation | Error of Mean | ||||
| Alert | 82° N | 63° W | 210 | 4.33 | 0.57 | 0.10 |
| Point Barrow | 71° N | 157° W | 11 | 4.54 | 0.58 | 0.11 |
| La Jolla | 33° N | 117° W | 10 | 3.04 | 0.74 | 0.14 |
| Kumukahi | 19° N | 155° W | 3 | 2.52 | 0.52 | 0.09 |
| Mauna Loa | 19° N | 156° W | 3397 | 1.83 | 0.59 | 0.11 |
| Christmas Island | 2° N | 157° W | 2 | 1.31 | 0.48 | 0.09 |
| American Samoa | 14° S | 171° W | 30 | 0.37 | 0.30 | 0.05 |
| Kermadec | 29° S | 178° W | 2 | 0.31 | 0.33 | 0.06 |
| Baring Head | 41° S | 175° E | 85 | −0.32 | 0.24 | 0.04 |
| South Pole | 90° S | 2810 | 0.00 | |||
| Year-on-Year Changes: Standard Deviations in ppm | |||
|---|---|---|---|
| Stations | CO2 Concentration | Ocean Component | Plant Component |
| South Pole 90° S | 0.46 +/− 0.08 | 0.31 +/− 0.06 | 0.48 +/− 0.09 |
| Christmas Island 2° N | 0.57 +/− 0.10 | 0.38 +/− 0.07 | 0.53 +/− 0.10 |
| Mauna Loa 19° N | 0.54 +/− 0.10 | 0.32 +/− 0.06 | 0.59 +/− 0.10 |
| Point Barrow 71° N | 0.86 +/− 0.14 | 0.28 +/− 0.05 | 0.74 +/− 0.14 |
| Annual Increases in ppm | |||
|---|---|---|---|
| Stations | CO2 Concentration | Ocean Component | Plant Component |
| South Pole 90° S | 1.77 +/− 0.03 | 0.89 +/− 0.02 | 0.88 +/− 0.02 |
| Christmas Island 2° N | 1.82 +/− 0.03 | 0.91 +/− 0.02 | 0.91 +/− 0.02 |
| Mauna Loa 19° N | 1.82 +/− 0.03 | 0.88 +/− 0.02 | 0.94 +/− 0.02 |
| Point Barrow 71° N | 1.81 +/− 0.03 | 0.90 +/− 0.02 | 0.91 +/− 0.02 |
| Station | Latitude | Latitude Band | Band width Degrees | Fraction of Global Surface |
|---|---|---|---|---|
| Alert | 82° N | 90° N to 76.5° N | 13.5 | 1.38% |
| Point Barrow | 71° N | 76.5° N to 52° N | 24.5 | 9.22% |
| La Jolla | 33° N | 52° N to 26° N | 26.0 | 17.48% |
| Kumukahi | 19° N | 26° N to 10.5° N | 15.5 | 12.81% |
| Christmas Island | 2° N | 10.5° N to 6° S | 16.5 | 14.34% |
| American Samoa | 14° S | 6° S to 21.5° S | 15.5 | 13.10% |
| Kermadec Island | 29° S | 21.5° S to 35° S | 13.5 | 10.35% |
| Baring Head | 41° S | 35° S to 65.5° S | 30.5 | 16.82% |
| South Pole | 90° S | 65.5° S to 90° S | 24.5 | 4.50% |
| Total | 180.0 | 100.00% |
Disclaimer/Publisher’s Note: The statements, opinions and data contained in all publications are solely those of the individual author(s) and contributor(s) and not of MDPI and/or the editor(s). MDPI and/or the editor(s) disclaim responsibility for any injury to people or property resulting from any ideas, methods, instructions or products referred to in the content. |
© 2023 by the authors. Licensee MDPI, Basel, Switzerland. This article is an open access article distributed under the terms and conditions of the Creative Commons Attribution (CC BY) license (https://creativecommons.org/licenses/by/4.0/).
Share and Cite
Quirk, T.; Asten, M. Atmospheric CO2 Isotopic Variations, with Estimation of Ocean and Plant Source Contributions. Atmosphere 2023, 14, 1623. https://doi.org/10.3390/atmos14111623
Quirk T, Asten M. Atmospheric CO2 Isotopic Variations, with Estimation of Ocean and Plant Source Contributions. Atmosphere. 2023; 14(11):1623. https://doi.org/10.3390/atmos14111623
Chicago/Turabian StyleQuirk, Tom, and Michael Asten. 2023. "Atmospheric CO2 Isotopic Variations, with Estimation of Ocean and Plant Source Contributions" Atmosphere 14, no. 11: 1623. https://doi.org/10.3390/atmos14111623
APA StyleQuirk, T., & Asten, M. (2023). Atmospheric CO2 Isotopic Variations, with Estimation of Ocean and Plant Source Contributions. Atmosphere, 14(11), 1623. https://doi.org/10.3390/atmos14111623