Article

The Development of METAL-WRF Regional Model for the Description of Dust Mineralogy in the Atmosphere

by
Stavros Solomos
1,*,
Christos Spyrou
1,
Africa Barreto
2,
Sergio Rodríguez
2,3,
Yenny González
2,
Marina K. A. Neophytou
4,
Petros Mouzourides
4,
Nikolaos S. Bartsotas
1,5,
Christina Kalogeri
1,
Slobodan Nickovic
6,
Ana Vukovic Vimic
7,
Mirjam Vujadinovic Mandic
7,
Goran Pejanovic
6,
Bojan Cvetkovic
6,
Vassilis Amiridis
5,
Olga Sykioti
5,
Antonis Gkikas
1 and
Christos Zerefos
1
1
Research Centre for Atmospheric Physics and Climatology, Academy of Athens, 10679 Athens, Greece
2
Izaña Atmospheric Research Center (IARC), Agencia Estatal de Meteorología (AEMET), 38001 Santa Cruz de Tenerife, Spain
3
Instituto de Productos Naturales y Agrobiología, IPNA CSIC, 38206 La Laguna, Spain
4
Environmental Fluid Mechanics Laboratory, Department of Civil and Environmental Engineering, School of Engineering, University of Cyprus, 2109 Nicosia, Cyprus
5
IAASARS, National Observatory of Athens, 15236 Athens, Greece
6
Republic Hydrometeorological Service of Serbia, 11000 Belgrade, Serbia
7
Faculty of Agriculture, University of Belgrade, 11080 Belgrade, Serbia
*
Author to whom correspondence should be addressed.
Atmosphere 2023, 14(11), 1615; https://doi.org/10.3390/atmos14111615
Submission received: 4 October 2023 / Revised: 23 October 2023 / Accepted: 26 October 2023 / Published: 27 October 2023

Abstract

:
The mineralogical composition of airborne dust particles is an important but often neglected parameter for several physiochemical processes, such as atmospheric radiative transfer and ocean biochemistry. We present the development of the METAL-WRF module for the simulation of the composition of desert dust minerals in atmospheric aerosols. The new development is based on the GOCART-AFWA dust module of WRF-Chem. A new wet deposition scheme has been implemented in the dust module alongside the existing dry deposition scheme. The new model includes separate prognostic fields for nine (9) minerals: illite, kaolinite, smectite, calcite, quartz, feldspar, hematite, gypsum, and phosphorus, derived from the GMINER30 database and also iron derived from the FERRUM30 database. Two regional model sensitivity studies are presented for dust events that occurred in August and December 2017, which include a comparison of the model versus elemental dust composition measurements performed in the North Atlantic (at Izaña Observatory, Tenerife Island) and in the eastern Mediterranean (at Agia Marina Xyliatos station, Cyprus Island). The results indicate the important role of dust minerals, as dominant aerosols, for the greater region of North Africa, South Europe, the North Atlantic, and the Middle East, including the dry and wet depositions away from desert sources. Overall, METAL-WRF was found to be capable of reproducing the relative abundances of the different dust minerals in the atmosphere. In particular, the concentration of iron (Fe), which is an important element for ocean biochemistry and solar absorption, was modeled in good agreement with the corresponding measurements at Izaña Observatory (22% overestimation) and at Agia Marina Xyliatos site (4% overestimation). Further model developments, including the implementation of newer surface mineralogical datasets, e.g., from the NASA-EMIT satellite mission, can be implemented in the model to improve its accuracy.

1. Introduction

Mineral dust aerosols are one of the most important and abundant aerosol types in the Earth System (Tegen et al., 1997 [1]; Prospero et al., 2002 [2]; Gassó et al., 2010 [3]). Their presence in the atmospheric column affects the radiative balance (Spyrou et al., 2013 [4]; Mahowald et al., 2014 [5]; Spyrou, 2018 [6]; Kok et al., 2023 [7]) and alters liquid and ice cloud properties (Kumar et al., 2011 [8]), as well as precipitation processes and formation, through changes in the cloud condensation nuclei abundance in the air (Levin et al., 2007 [9]; Solomos et al., 2011 [10]; Creamean et al., 2013 [11]). Furthermore, once dust particles are deposited on the surface, they can provide valuable micronutrients to the ocean and land ecosystems (Mahowald et al., 2005 [12]; Jickells et al., 2005 [13]; Ito et al., 2016 [14]), affecting fisheries and agriculture activities. For example, the migrations and fisheries of the Atlantic skipjack tropical tuna off western North Africa are influenced by the seasonal shift in dust deposition under the Saharan Air Layer (Rodríguez et al., 2023 [15]). Under favorable weather conditions, such as the Khamsin winds in Libya and Egypt, very high concentrations of dust are transported from the Sahara Desert towards Europe, as occurred, for example, during the record-breaking event of 2018, when more than 6.000 μg m−3 were measured in Crete (Solomos et al., 2018 [16]). Under such conditions, the smaller dust particles can be easily inhaled and deposited in the lungs, and they are related to human health disorders (Mitsakou et al., 2008 [17]; Goudie, 2013 [18]; Esmaeil et al., 2014 [19]). The inhalation of such dust particles blowing in the ambient air causes inflammation of the respiratory airways (Dominguez-Rodriguez et al., 2020 [20]) and increases the cardiovascular mortality risk at the rate of 2% for every 10 mg/m3 (Dominguez-Rodriguez et al., 2021 [21]). Therefore, the influence of mineral dust particles on the climate, ecosystems, and air quality is a key component in climate projections.
Although the composition of desert dust aerosols undergoes significant variations (Rodríguez et al., 2020 [22]), there is a rather low number of models able to simulate the mineral and chemical composition of dust even though these are key properties that modulate the influence of dust on ecosystems and the climate. For example, iron and phosphorus deposition influences ocean biogeochemistry, contributes to the fertility of terrestrial ecosystems (Scheuvens et al., 2013 [23]), and can be just as important as changes in the climate in modifying ocean productivity (Meskhidze et al., 2003 [24]; Mahowald et al., 2011 [25]). Iron effectively absorbs shortwave radiation (Di Biagio et al., 2019 [26]; Ageitos et al., 2023 [27]), while minerals like calcite, quartz, or phyllosilicates impact thermal radiation transfer (Di Biagio et al., 2017 [28]).
The extent to which iron alters dust absorption properties affects these direct radiative interactions in the atmosphere and dust’s climate impact (Scanza et al., 2015 [29]). Saharan dust is mostly composed of tectosilicates, like quartz and feldspar (Claquin et al. 1999 [30]; Nickovic et al., 2012 [31]). Quartz and feldspar minerals in dust particles have the potential to alter ice nucleation processes (Chatziparaschos et al., 2023 [32]). Additionally, the group of clay phyllosilicates which contain illite, kaolinite, and smectite minerals represent the most abundant chemical-weathering minerals in sedimentary rocks (Nickovic et al., 2012 [31]). For instance, aerosol deposition samples collected in the Saharan Air Layer at Izaña Observatory (Tenerife Island) are dominated by mineral dust with an average composition of 64% silicates, 6% quartz, 5% calcium-rich particles, 14% sulfates, 1% hematite, 1% soot, and 9% other carbonaceous material (Kandler et al., 2007 [33]).
The current incomplete global knowledge of the mineral dust composition in soil dust sources limits the ability of Earth System models to provide dust projections and impacts biochemistry around the globe since the physicochemical features of desert dust particles are, in general, poorly constrained in them (Titos et al., 2017 [34]; Rodriguez-Navarro et al., 2018 [35]). A few earlier modeling studies that have explicitly incorporated the concentration of minerals in desert dust particles and their associated elemental composition have mostly concerned global climate models (GCMs). Scanza et al., 2015 [29], used a slightly modified global soil mineralogy atlas based on Claquin et al., 1999 [30], to simulate minerals in the Community Atmosphere Model, version 4 (CAM4). Li et al., 2021 [36], performed a detailed study of the sensitivity of dust’s direct radiative effect that results from current uncertainties in soil mineral composition by updating the Community Atmosphere Model, version 5 (CAM5). Bergas-Massó et al., 2022 [37], estimated the pre-industrial present and future atmospheric delivery of soluble iron to the ocean using the Earth System Model (ESM) EC-Earth3-Iron (Myriokefalitakis et al., 2022 [38]) at a global scale. Ageitos et al., 2023 [27] applied the Multiscale Online Nonhydrostatic AtmospheRe Chemistry (MONARCH) model (Klose et al., 2021 [39]) to allow for an explicit representation of the different minerals in dust aerosols in a global simulation setup. Hamilton et al., 2019 [40], used the Community Earth System Model (CESM) to assess the emission and atmospheric processing of iron at a global scale, and Chatziparaschos et al., 2023 [32], used the global soil mineralogy atlas of Claquin et al. 1999 [30], to study the role of airborne mineral dust as a precursor to ice-nucleating particles, accounting for both dust’s quartz and feldspar contents in global-scale simulations. Contemporary modeling studies have been performed for the dispersion of other pollutants, such as O3 and CO2 in China (Dai et al., 2023 a, b) [41,42].
This study presents the development of a regional atmospheric model capable of simulating the mineral composition of dust across all atmospheric scales. This is a new approach to limited-area dust modeling, and it will allow a more detailed description of dust processes in the atmosphere and the oceans. To this end, the WRF-Chem (Grell et al., 2005 [43]; Skamarock et al., 2021 [44]) atmospheric model, version 4.4.1, was used as a basis to develop a regional system capable of simulating the atmospheric lifecycles of different minerals in the atmosphere. The paper is organized as follows: Section 2 describes the methodology for the development of METAL-WRF and the measurements of dust minerals at the two stations. The implementation of mineralogical databases in the model and the development of specific code modules to treat the lifecycle of the different minerals (emission, transport, and dry and wet deposition) are described here, along with the description of the methodologies followed to obtain the station measurements. In Section 3, the results of two specific modeling simulations of Saharan dust-mineral transport are analyzed, including comparisons of the modeled elemental composition of the dust particles with the corresponding measurements at Izaña Observatory in Tenerife Island and at Agia Marina Xyliatos in Cyprus. Section 4 contains the summary and conclusions.

2. Methodology

2.1. Development of METAL-WRF

The simulation of the dust cycle in the atmosphere was performed using the WRF (Weather Research and Forecast) model (Skamarock et al., 2021 [44]) with ARW core (Advanced Research WRF). WRF-ARW is designed to act as an atmospheric simulation system that is flexible, highly portable, and efficient on available parallel computing platforms and suitable for use in a broad range of applications across scales ranging from meters to thousands of kilometers, making it ideal to be used as the basic tool for the current work. WRF is also coupled with the Chem module (Grell et al., 2005 [43]), which allows for the representation of various chemical species and aerosols in the atmosphere, including desert dust. In this study, the GOCART (Ginoux, 2001 [45]) aerosol model and the Air Force Weather Agency (AFWA) dust emission scheme (LeGrand et al., 2019 [46]) were applied to parameterize the desert dust production–transport–deposition cycle.
The dry deposition of dust was computed by calculating the forces acting on a dust particle moving along the vertical direction, which are the gravitational force and the aerodynamic drag force (LeGrand et al., 2019 [46]). Due to the importance of wet scavenging mechanisms, which are often the only removal mechanisms away from sources, a wet deposition module was also implemented in the model to handle the removal of dust due to rain and clouds. The new model accounts for in-cloud and below-cloud scavenging via cloud condensates, following the formulation of Seinfeld and Pandis (1998) [47] and earlier modeling developments by Spyrou et al., 2010 [48], Solomos et al., 2011 [10], and Tsarpalis et al., 2018 [49]. Both grid-scale and convective precipitation were considered. The wet deposition scheme is complementary to the gravitational settling, and their combination provides a more realistic description of overall mineral depositions, including the stochastic effects of cloud and precipitation processes in dust removal. The possible changes in the scavenged mineral fractions due to the differences in mineral solubility were neglected for simplicity.
As a first step in the development of the mineralogy module, we derived the soil composition of dust sources using the GMINER30 dataset developed by Nickovic et al., 2012 [31]. GMINER30 is a high-resolution global database of mineral fractions in potentially erodible soils, and it has been specifically developed to support the parameterization of mineral emissions in atmospheric numerical models. The database contains information on illite, kaolinite, smectite, calcite, quartz, feldspar, hematite, gypsum, and phosphorus fractions distributed over clay and silt aerosol populations on a 30-arc-second grid. GMINER30 is based on the mineral table specified by Claquin et al. (1999) [30], and it also includes several mineral-carrying soil types in dust-productive regions that were not considered in previous studies and also phosphorus (Nickovic et al., 2012 [31]). The mineral content in clay and silt-sized fractions in selected soil types is presented in Table 1.
Additionally, due to the particular importance of iron (Fe), the transport of iron in the atmosphere was also simulated using the FERRUM30 dataset, a high-resolution global database on iron fraction in potentially erodible soils. FERRUM30’s development was based on the knowledge gathered from various papers on iron content in different minerals (Nickovic et al. 2013 [50]), and the spatial distribution of iron content is shown in Figure 1. In general, the Sahara region contains iron ranging from 2–6% or more. For more information on the GMINER30 and FERRUM30 databases, see Nickovic et al., 2012 [31] and 2013 [50], and the references therein.
Both datasets were obtained from the South-East European Climate Change Center (SEEVCCC) of the Republic Hydrometeorological Service of Serbia (RHMSS; http://www.seevccc.rs/—access date: 1 September 2023). The data were provided on a 30-s grid and organized into 27 tiles (4800 × 6000 points each). First, these geographic data were converted into the specific binary geogrid format so that they could be used as inputs to the model’s WPS geogrid processor. The input mineralogical data were stored as a regular 2D array of integers, row by row, beginning at the southernmost row. Every element was stored as a 4-byte integer in big-endian byte order (see Skamarock et al., 2021 [44], for further technical details). Therefore, all mineral-relevant data were first converted to integers as needed and then written in the geogrid binary format, along with a specific metadata index file. Afterwards, the lower boundary conditions table of the model (GEOGRID.TBL.ARW) was accordingly modified to handle the new files, and the new arrays were integrated into the WPS and WRF Registry and framework. This way, the new datasets are handled by the model the same way as any other static dataset (e.g., vegetation or soil texture). Therefore, any changes in the WRF domain or resolution are automatically handled by the model, providing the necessary flexibility to simulate mineral processes at all atmospheric scales, from cloud-resolving scales to meso-γ, meso-β, meso-α, and global scales.
Having defined the mineral content in arid soils, the next step was to design the production and transport of minerals, along with desert dust. To this end, we built upon the earlier works of Perlwitz et al., 2015 [51], and Pérez et al., 2016 [52]. Therefore, we assumed that the soil mass fractions S M F c l a y and S M F s i l t of each mineral m at clay and silt sizes in the 0–20 μm bin range could be defined as:
S M F c l a y m = S F c l a y m S F m c l a y m
S M F s i l t m = S F s i l t m S F m s i l t m
where S F c l a y and S F s i l t represent the soil fraction of clay and silt particles as a function of the soil texture class, respectively, and S F m c l a y and S F m s i l t denote the soil fraction of each mineral provided via the GMINER30 and FERRUM30 datasets. The mineralogical composition of dust aerosol particles was assumed to be the same as at the source, meaning that it remains unmodified during the dust production processes even though the mineral size distributions change during emission in actual events (Perlwitz et al., 2015 [51]).

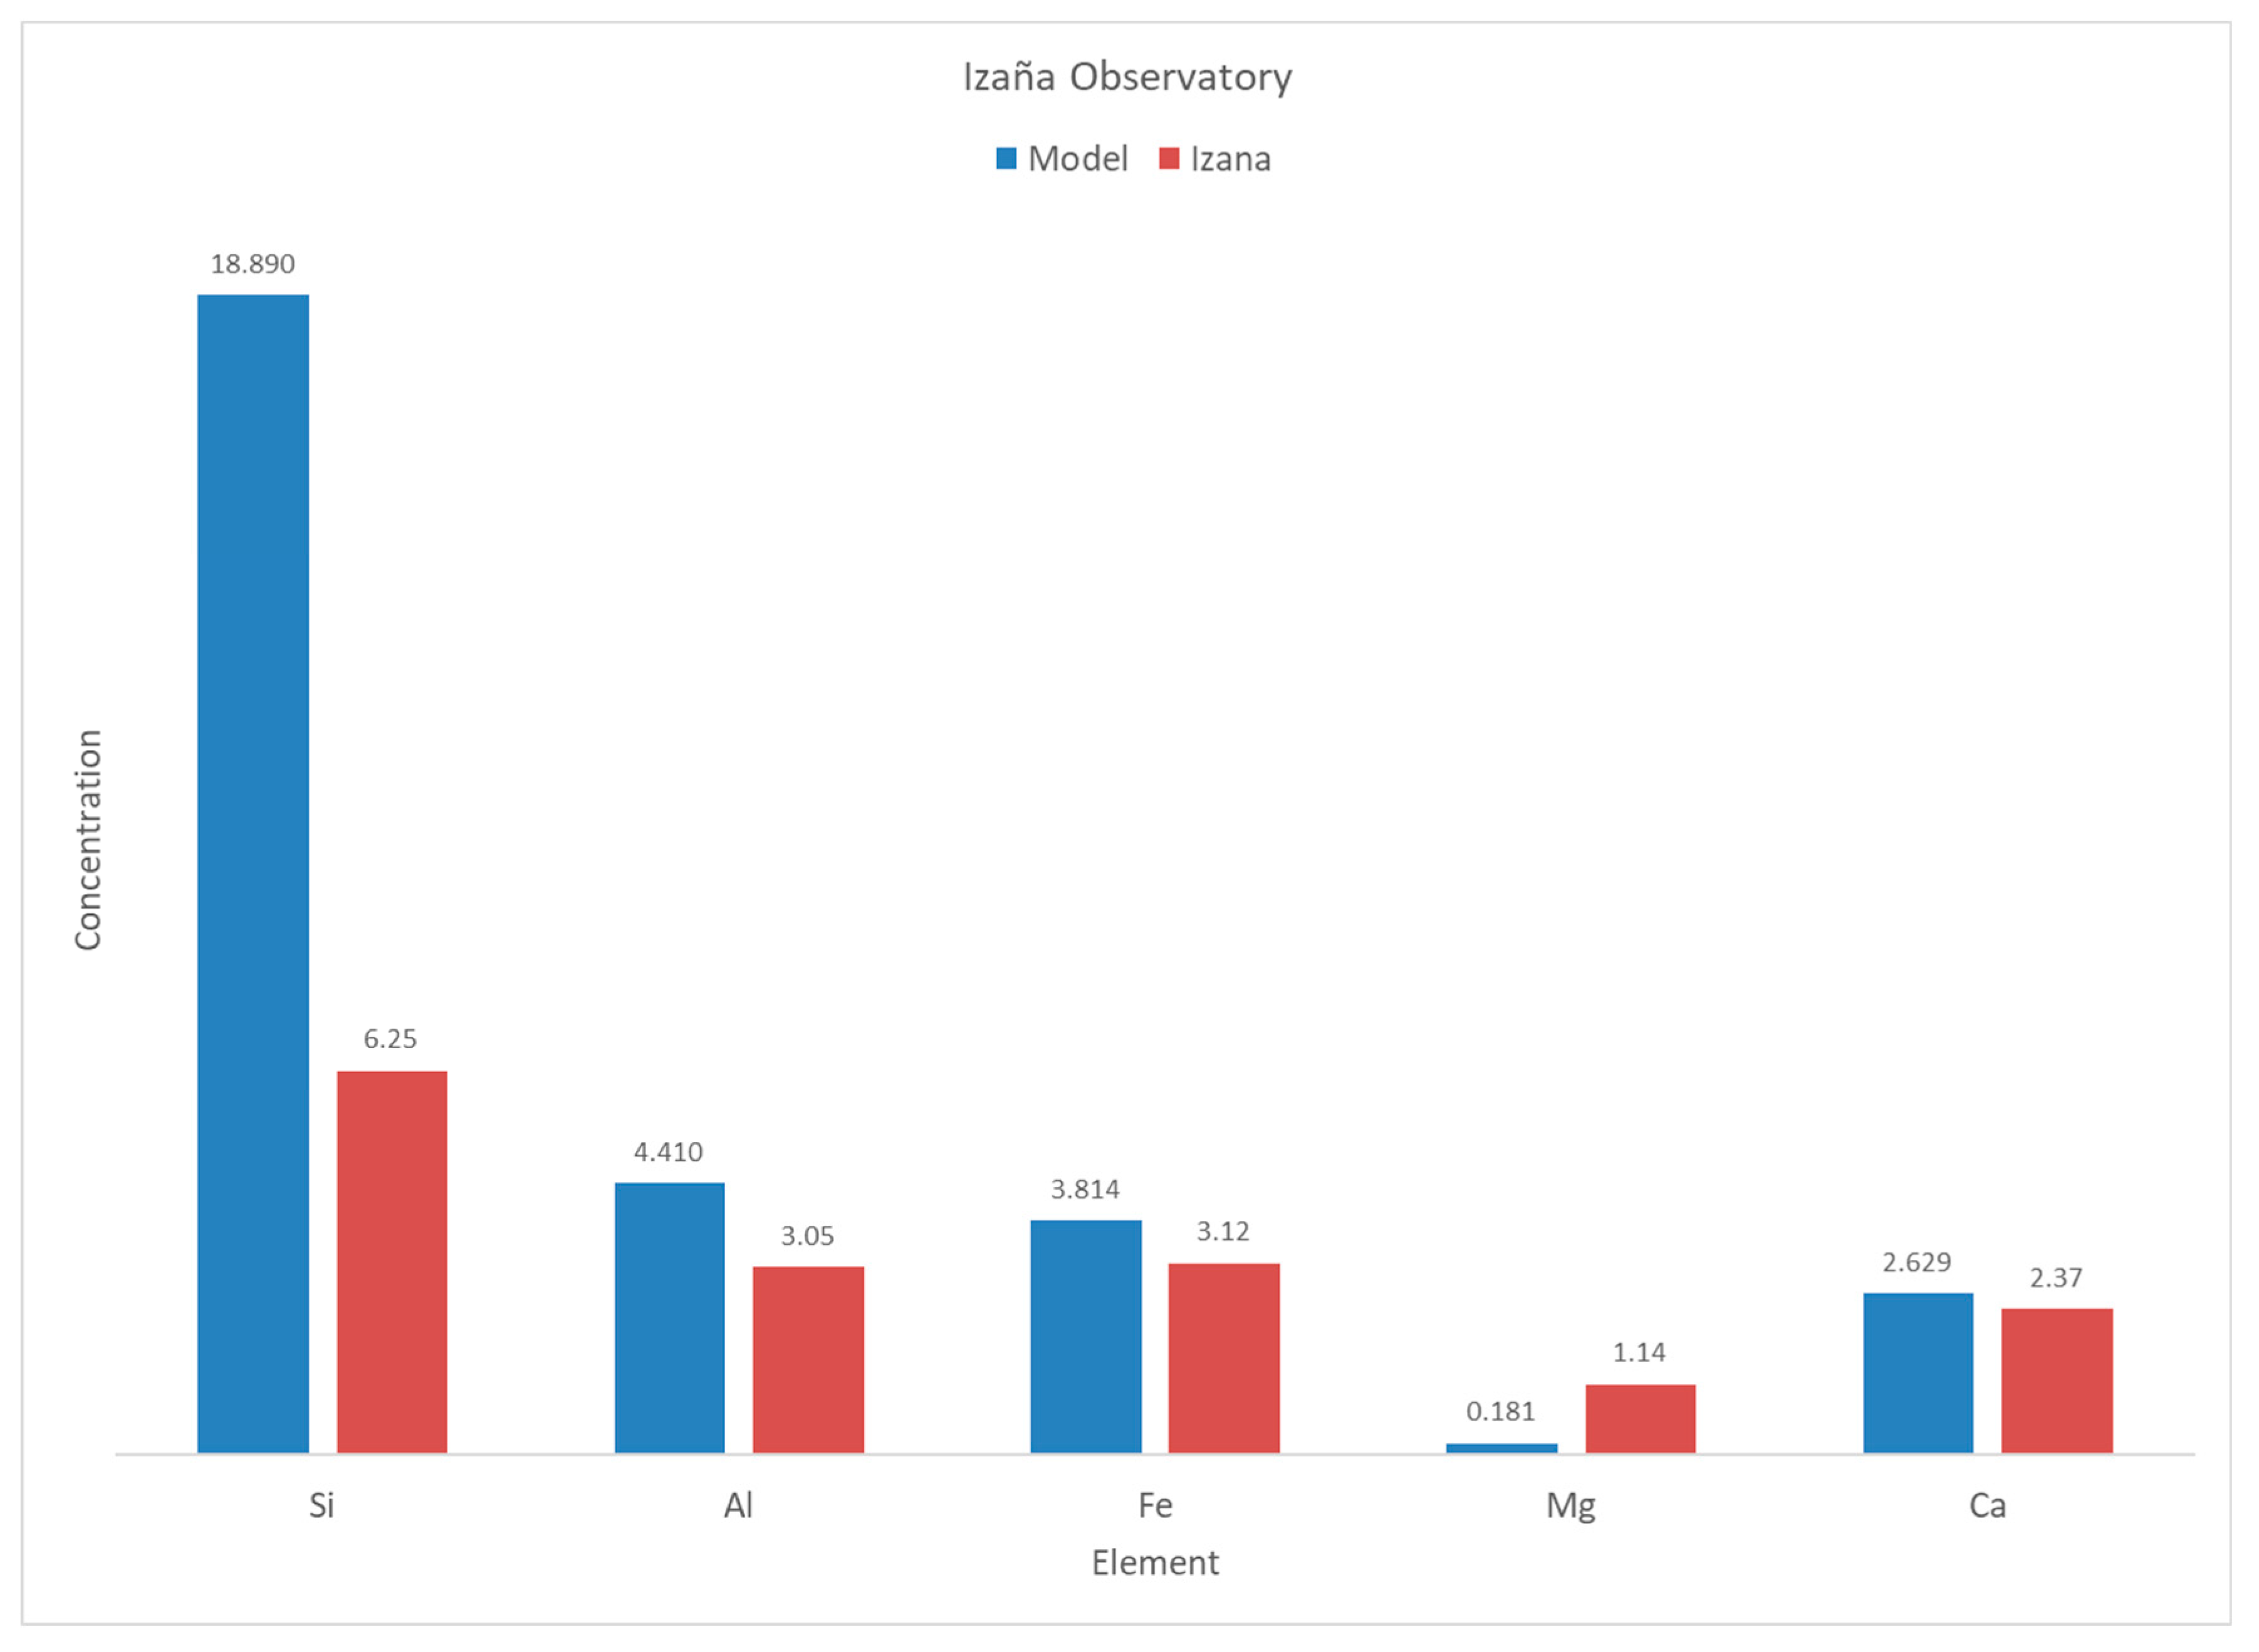
2.2. Measurements of Dust Composition

The chemical composition of atmospheric aerosols measured at Izaña Observatory (subtropical North Atlantic) and Agia Marina Xyliatos station (eastern Mediterranean) was used to compare with the model’s simulations.
Izaña Observatory (28.309° N, 16.5° W) is located in Tenerife (Canary Islands) at 2400 m a.s.l. This site is typically located above the mantle of stratocumulus clouds typical of the subtropics, so it is representative of the free troposphere. In daylight, the free tropospheric air is often alternated with the arrival of trace amounts of gases and aerosols from the boundary layer due to upslope winds, whereas measurements at night are representative of the free troposphere. Izaña Observatory is within the Global Atmospheric Watch Program and ACTRIS Research Infrastructure, so its long-term monitoring program includes aerosols’ chemistry in the PM10 fraction (particles smaller than 10 microns), optical properties, and size distribution via methods described in Rodríguez et al., 2012 [53]. Briefly, aerosol chemical characterization is performed by sampling via quartz filters and subsequent chemical analysis in the laboratory, which includes (1) elemental composition via acid digestion and ICP-AES and ICP-MS analysis, (2) ion determination via extraction in deionized water and ion chromatography analysis, and (3) the determination of organic carbon and elemental carbon using TOR/TOT techniques. The sampling is performed at night (10:00 p.m. to 06:00 a.m. GMT) to avoid the daylight upslope winds and obtain samples representative of the free troposphere.
The Ayia Marina (AM) station is considered a background station in the southeast Mediterranean. The station is situated in the village of Ayia Marina Xyliatos, Cyprus (Ayia Marina Xyliatos Nicosia background station; 35°02′ N, 33°03′ E; 450 m a.s.l.), 40 km southwest of the city of Nicosia, far away from anthropogenic activities. The Air Quality Section of the Department of Labour Inspection operates the AM station, which is part of the Cyprus Air Quality Monitoring Network and the European Monitoring and Evaluation Program (EMEP). Cyprus has an intense Mediterranean climate with hot and dry summers (May–September) and mild winters (November–March). Dust storms typically occur at the end of winter and spring (February–May) (Achilleos et al., 2020 [54]; Pikridas et al., 2018 [55]). Dust transport from both the Saharan and Arabian deserts has a significant impact on the station (Mouzourides et al., 2015 [56]). Gravimetric particulate matter sampling devices with a low-volume sampler (LVS) are used with a sampling duration of 24 h, as recommended by EU-related directives, and tapered element oscillating microbalance (TEOM) analyzers are used to record continuous PM10 and PM2.5 concentrations.

3. Results

3.1. Configuration of METAL-WRF for Dust Transport Simulations

The simulation of dust and mineral transport in METAL-WRF was tested for particles originating from the Saharan desert towards the Mediterranean and Europe (Figure 2). The model was set up with a resolution of 12 km × 12 km, 32 vertical hybrid-sigma levels stretching from the surface to the top of the atmosphere (about 20 km), and a timestep of 60 s. The physical parameterizations used in these runs are presented in Table 2. The mineral fractions in clay and silt soils were defined by the GMINER30 and FERRUM30 datasets, as described in Section 2. The mineral fractions for the minerals used here are presented in Figure 3.
The distribution of mineral fractions in the computational domain of WRF-METAL is displayed in Figure 3 over clay-sized and silt-sized soil populations. For example, as seen in these plots, high illite content (exceeding 50%) was evident both in the northern part of the Sahara (north of 20°N), as well as at subregions of Mauritania, Mali, and Niger. Calcite concentrations are higher at the northernmost Saharan regions of Libya and Egypt with maximum percentages over the Nile delta, while the highest percentages of hematite in clay soil are clustered along a belt spanning across the 10°N and eastern Sudan.
Additionally, the percentage abundances of Si, Al, Mg, and Ca (%) for each mineral (Table 3) were used to extract the elemental composition of dust from the mineral composition. Iron concentrations are calculated directly from the FERRUM30 dataset. The calculation of elemental composition facilitates the direct comparison between modeled particles and station elemental measurements. Two different model runs were performed to describe the elemental composition of mineral dust in the Atlantic Ocean (Izaña Observatory in Tenerife) and the eastern Mediterranean (Ayia Marina Xyliatos Station in Cyprus). The locations of the two stations are shown in Figure 2.

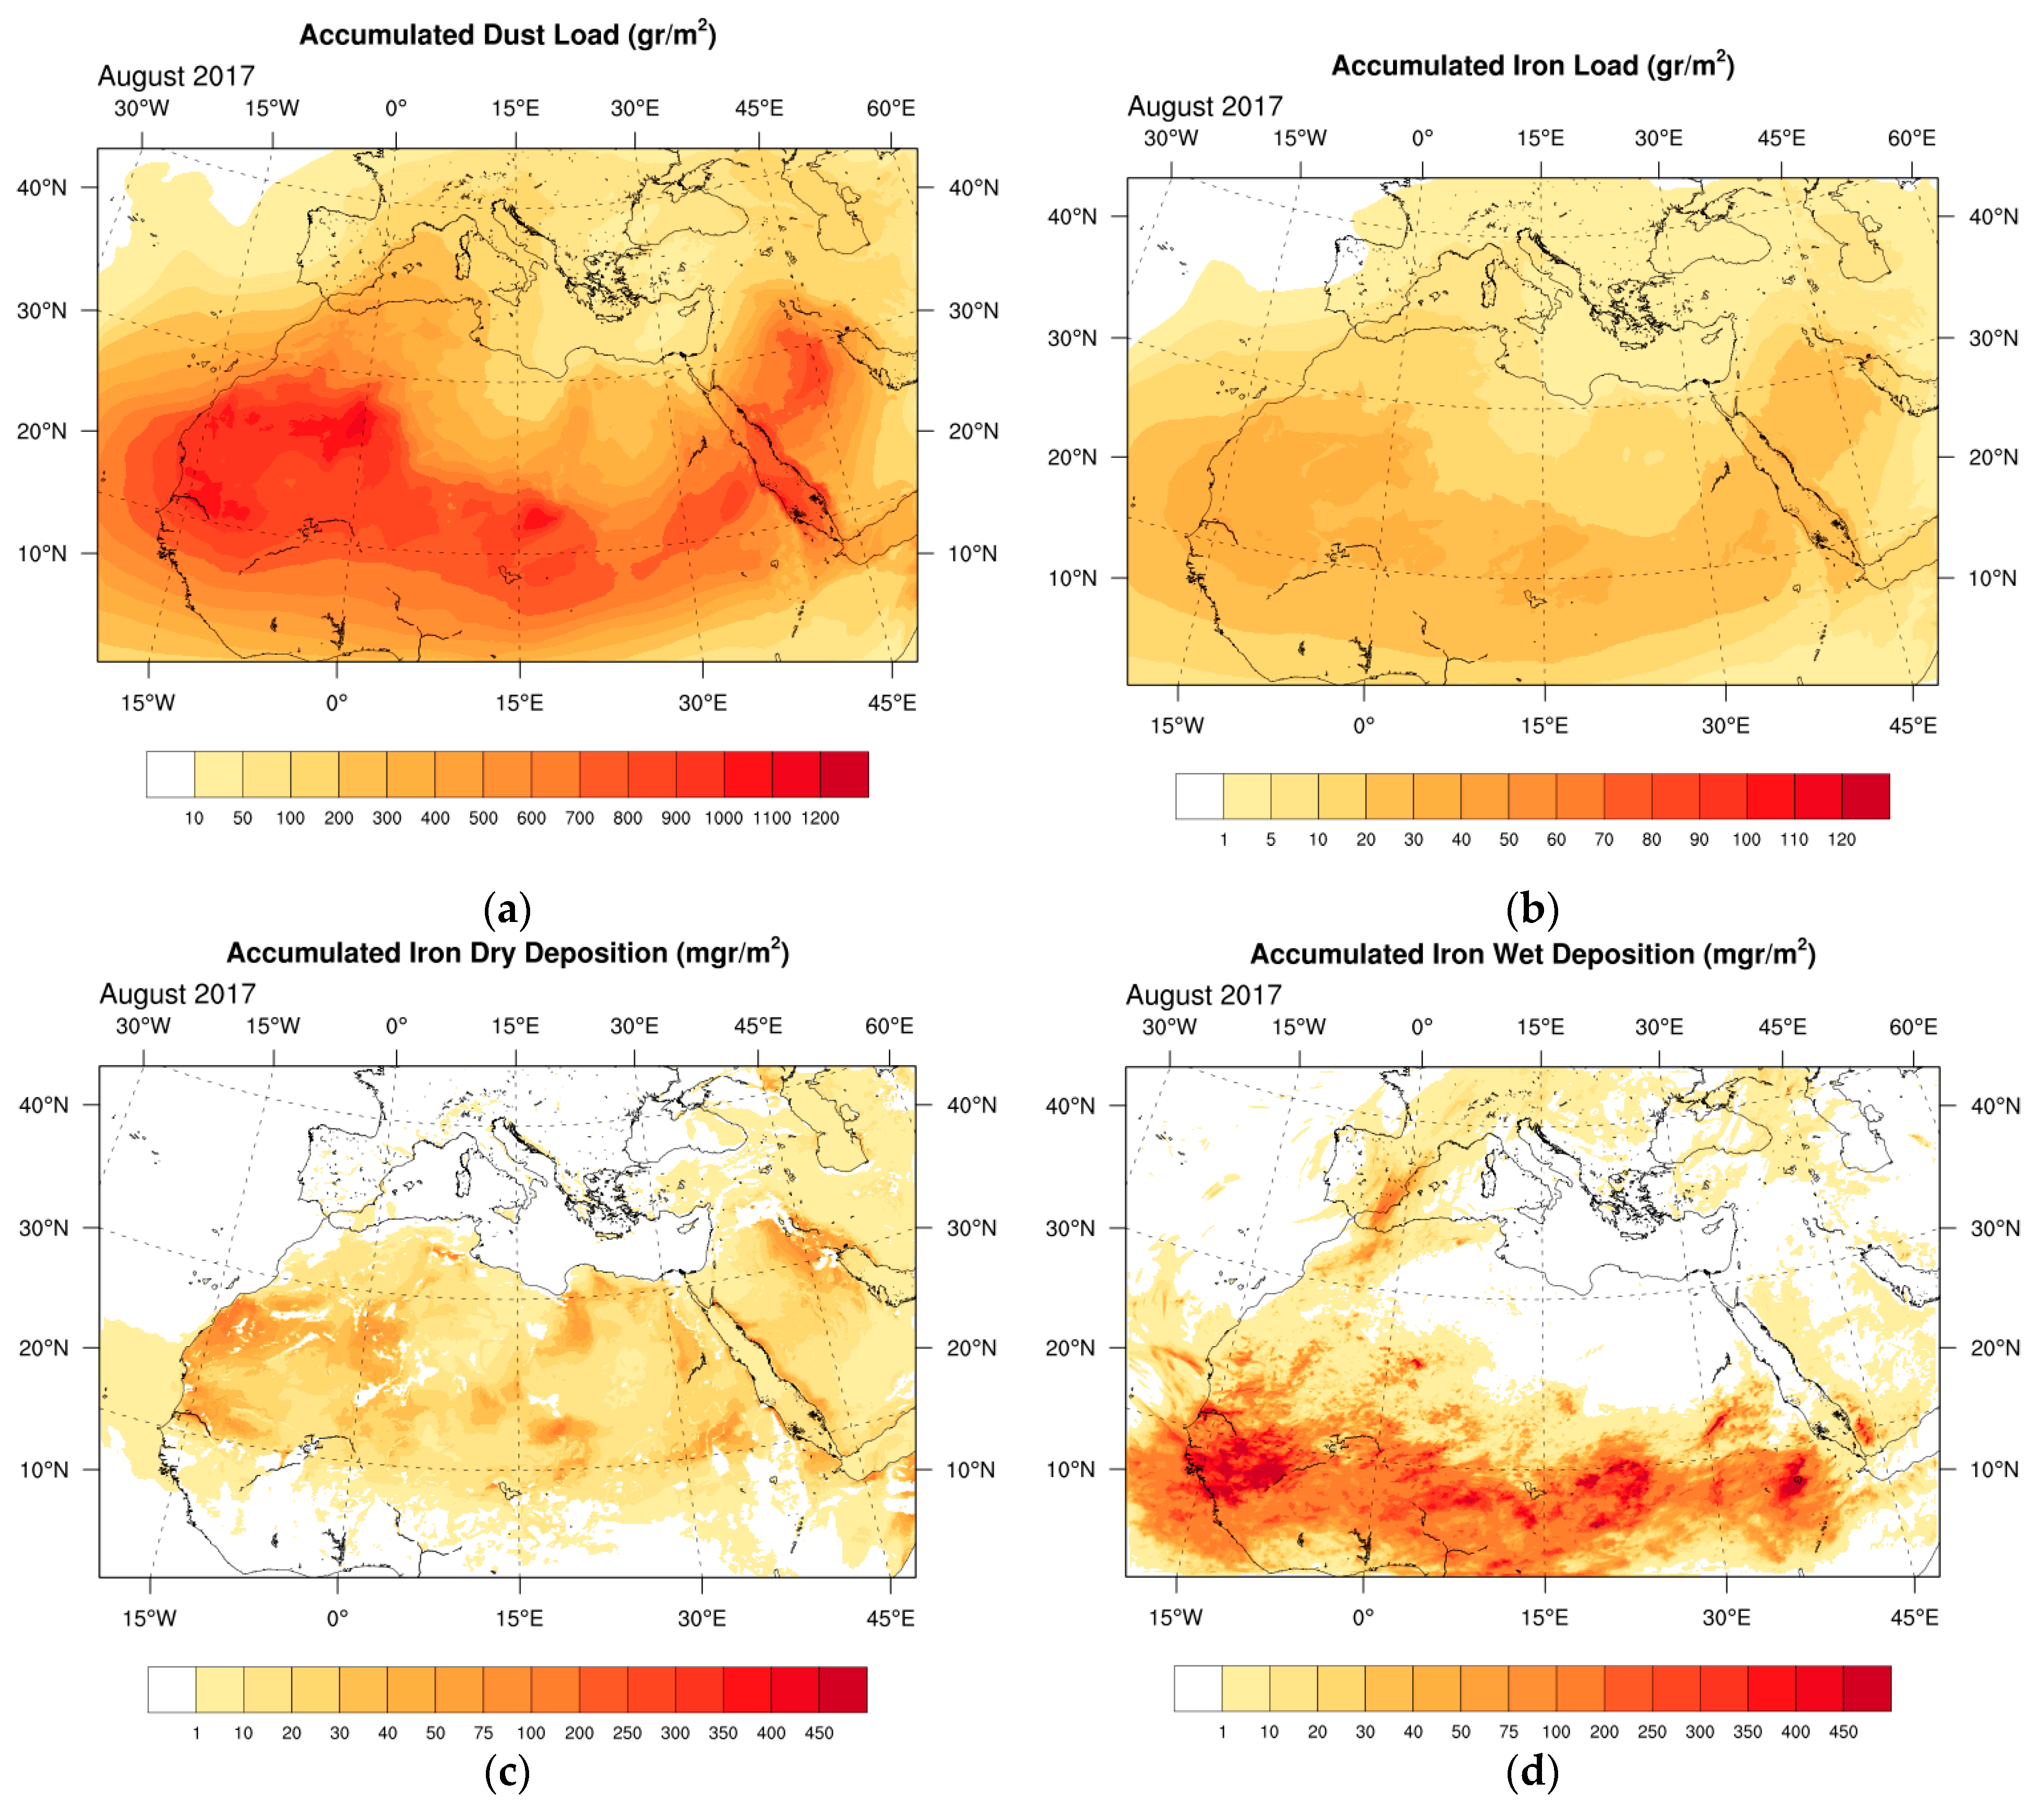
3.2. Dust Transport to the Atlantic in the Saharan Air Layer (SAL)—August 2017

We studied the case of dust transport from North Africa to the Atlantic in the Sahara Air Layer (SAL), the most important transport pathway of Saharan dust (Prospero et al., 2021 [65]). In summer, the SAL expands along the subtropic, affecting the Canary Islands, and occurs at altitudes within the range 1000–1500 m a.s.l. Thus, in this period, the Izaña free-troposphere Observatory, which is located at 2400 m a.s.l., is within the SAL (Rodríguez et al., 2015 [66]). The case of August 2017 was studied as representative of the summer SAL, and the dust simulations were compared with the elemental composition measurements in different size ranges that are regularly performed at Izaña as part of the long-term monitoring program (Rodríguez et al., 2012 [53]). This type of measurement data has also been used in earlier modeling studies (Pérez et al., 2016 [52]).
The transport of Saharan dust towards the Canary Islands is driven by synoptic circulation. In summer, the subtropical highs are shifted to the north, and the monsoon develops, resulting in a northward shift of the intertropical convergence zone (ITCZ). This type of circulation intensifies the easterly Harmattan winds and favors the transport of dust towards the Atlantic (Kallos et al., 2006 [67]). In this period, Saharan dust export is modulated via the NAFDI, i.e., the North African Dipole Intensity, calculated as the difference in the anomalies of the subtropical high pressure over Morocco with respect to the tropical low pressures over Nigeria (Rodríguez et al., 2015 [66], 2020 [22]; Cuevas et al., 2017 [68]). Saharan dust export to the Atlantic is activated via the westward propagating Harmattan wind pulses linked to the change of the phase of the NAFDI (negative to positive), the associated westward shifts of the Saharan Heat Low, and the convective monsoon inflow (Rodríguez et al., 2020 [22]). In contrast, Saharan dust export to the western Mediterranean occurs during the negative phases of the NAFDI (Cuevas et al., 2022 [69]). The change of phase of the NAFDI influences the activation of the different regional dust sources, thus influencing the composition of dust over the North Atlantic, as indicated by the correlation between the NAFDI and the ratios of Fe, Ca, K, Na, Mg, and S to Al (Rodríguez et al., 2020 [22]).
The METAL-WRF simulation was initialized on 15 July to allow a 15-day spin-up period and develop an adequate desert dust background. We performed sequential warm-start simulations ranging from the 1st of August to the 31st of August 2017 at 3-day intervals (a total of 84-h in simulations with a 12-h spin-up time). The initial and boundary conditions were obtained from NCEP FNL’s (National Centers for Environmental Prediction Final Analysis) operational global analysis on a 0.25° × 0.25° grid. This state-of-the-art gridded product originated from the Global Data Assimilation System (GDAS), which continuously collects observational data and creates analyses for numerical simulations and other studies (National Centers for Environmental Prediction/National Weather Service/NOAA/U.S. Department of Commerce, 2015 [70]). For the sea surface temperature (SST), we used the Copernicus Marine Environment Monitoring Service—CMEMS—and specifically the GLORYS12V1 product, which is CMEMS’s global ocean eddy-resolving model at a 1/12° horizontal resolution and 50 vertical levels (GLOBAL_MULTIYEAR_PHY_001_030 2023 [71]).
The modeling results for the mineral dust transport are shown in Figure 4. Figure 4a shows the accumulated dust load (i.e., the vertically integrated dust at all model layers) in the atmospheric column for August 2017. The main dust outflows from the Sahara Desert were observed towards the Atlantic in the SAL (>1000 gm−2) and towards the western Mediterranean (>500 gm−2). Significant dust loads exceeding 700 gm−2 were also present over the Red Sea and Arabian Peninsula. The distribution of the iron column load (Figure 4b), iron dry deposition (Figure 4c), and iron wet deposition (Figure 4d) is also shown. For simplicity, we included only the results for iron due to the high importance of this element in radiation absorption and its role as a limiting micronutrient in the marine ecosystem. The spatial distribution of the other elements in dust was rather similar. In August 2017, high column loads of iron (>30 gm−2) were observed over the Saharan and Sahelian deserts, the Atlantic in the SAL, the Red Sea, and the Arabian Peninsula, tracking the location of the main dust sources and the dust transport routes due to atmospheric circulation (Figure 4b). High dry deposition rates were also observed near the dust sources in the Atlantic Ocean underlying the SAL, in the Red Sea, and in the Persian Gulf. Away from the dust sources, iron dry deposition was observed at high elevations, such as in the Alps (Figure 4c), implying the possible role of these particles in the melting of snow in this area due to the absorption of solar radiation via iron. The highest values of iron wet deposition were observed along the tropical rain band in North Africa, associated with the ITCZ. Hot spots (>450 mgm−2) were evident in the areas of frequent intense precipitation due to mesoscale convective systems (MCS), as well as over southeast Spain and central Europe, associated with the summer cutoff lows (Figure 4d). The ability of the model to provide estimations of both dry and wet iron deposition is extremely important for the marine ecosystem. A recent study showed that, off northwest Africa, fisheries of the Atlantic skipjack are mainly located in tropical waters affected by the massive wet deposition of iron in winter and in subtropical waters affected by the massive dry deposition of iron in summer (Rodríguez et al., 2023 [15]).
The model outputs for the concentrations of each element in dust were compared with the measurements from Izaña Observatory in Figure 5 while making sure to extract the model’s elemental data only during the PM10 sampling period under background-free troposphere conditions, i.e., from 10:00 PM to 06:00 AM GMT. As shown in Figure 5, the results were in good agreement with the corresponding measurements for August 2017. The modeled calcium concentration at Izaña Observatory was 2.63 μg/m3, whereas the measured value was 2.37 μg/m3. The modeled iron concentration was 3.81 μg/m3, which was also in very good agreement with the station measurement of 3.12 μg/m3. This is particularly important due to the crucial role of iron in solar radiative transfer and ocean productivity processes. The modeled concentrations of aluminum (4.40 mg/m3) also agreed very well with the measured aluminum at Izaña (3.05 mg/m3). In contrast, the model overestimated the concentrations of silicon (18.9 mg/m3) compared to the measurements (6.2 mg/m3), probably due to an overestimation of the amount of quartz in the model. Measurements in the North Atlantic typically find Si/Al ratios in Saharan dust within the range of 1.9–2.2 and a value of 2.05 at Izaña (Rodríguez et al., 2020 [22], and references therein). The simulated Si/Al ratio in the model was 4.3, which clearly suggests an overestimation of quartz in the model’s output for Izaña. Also, the concentrations of magnesium were clearly underestimated at Izaña (0.18 mg/m3 modeled vs. 1.14 mg/m3 measured) due to the lack of Mg-bearing minerals such as chlorite, vermiculite, and dolomite in the current mineralogical dataset. Additionally, there was missing detailed information on certain source areas, as well as missing information on the seasonality and regional variation of the composition of arid soils and even agricultural soils (Nickovic et al., 2012 [31]), weaknesses which are encountered in every static global dataset. Overall, the modeling results are very promising and provide a solid base for further developments.

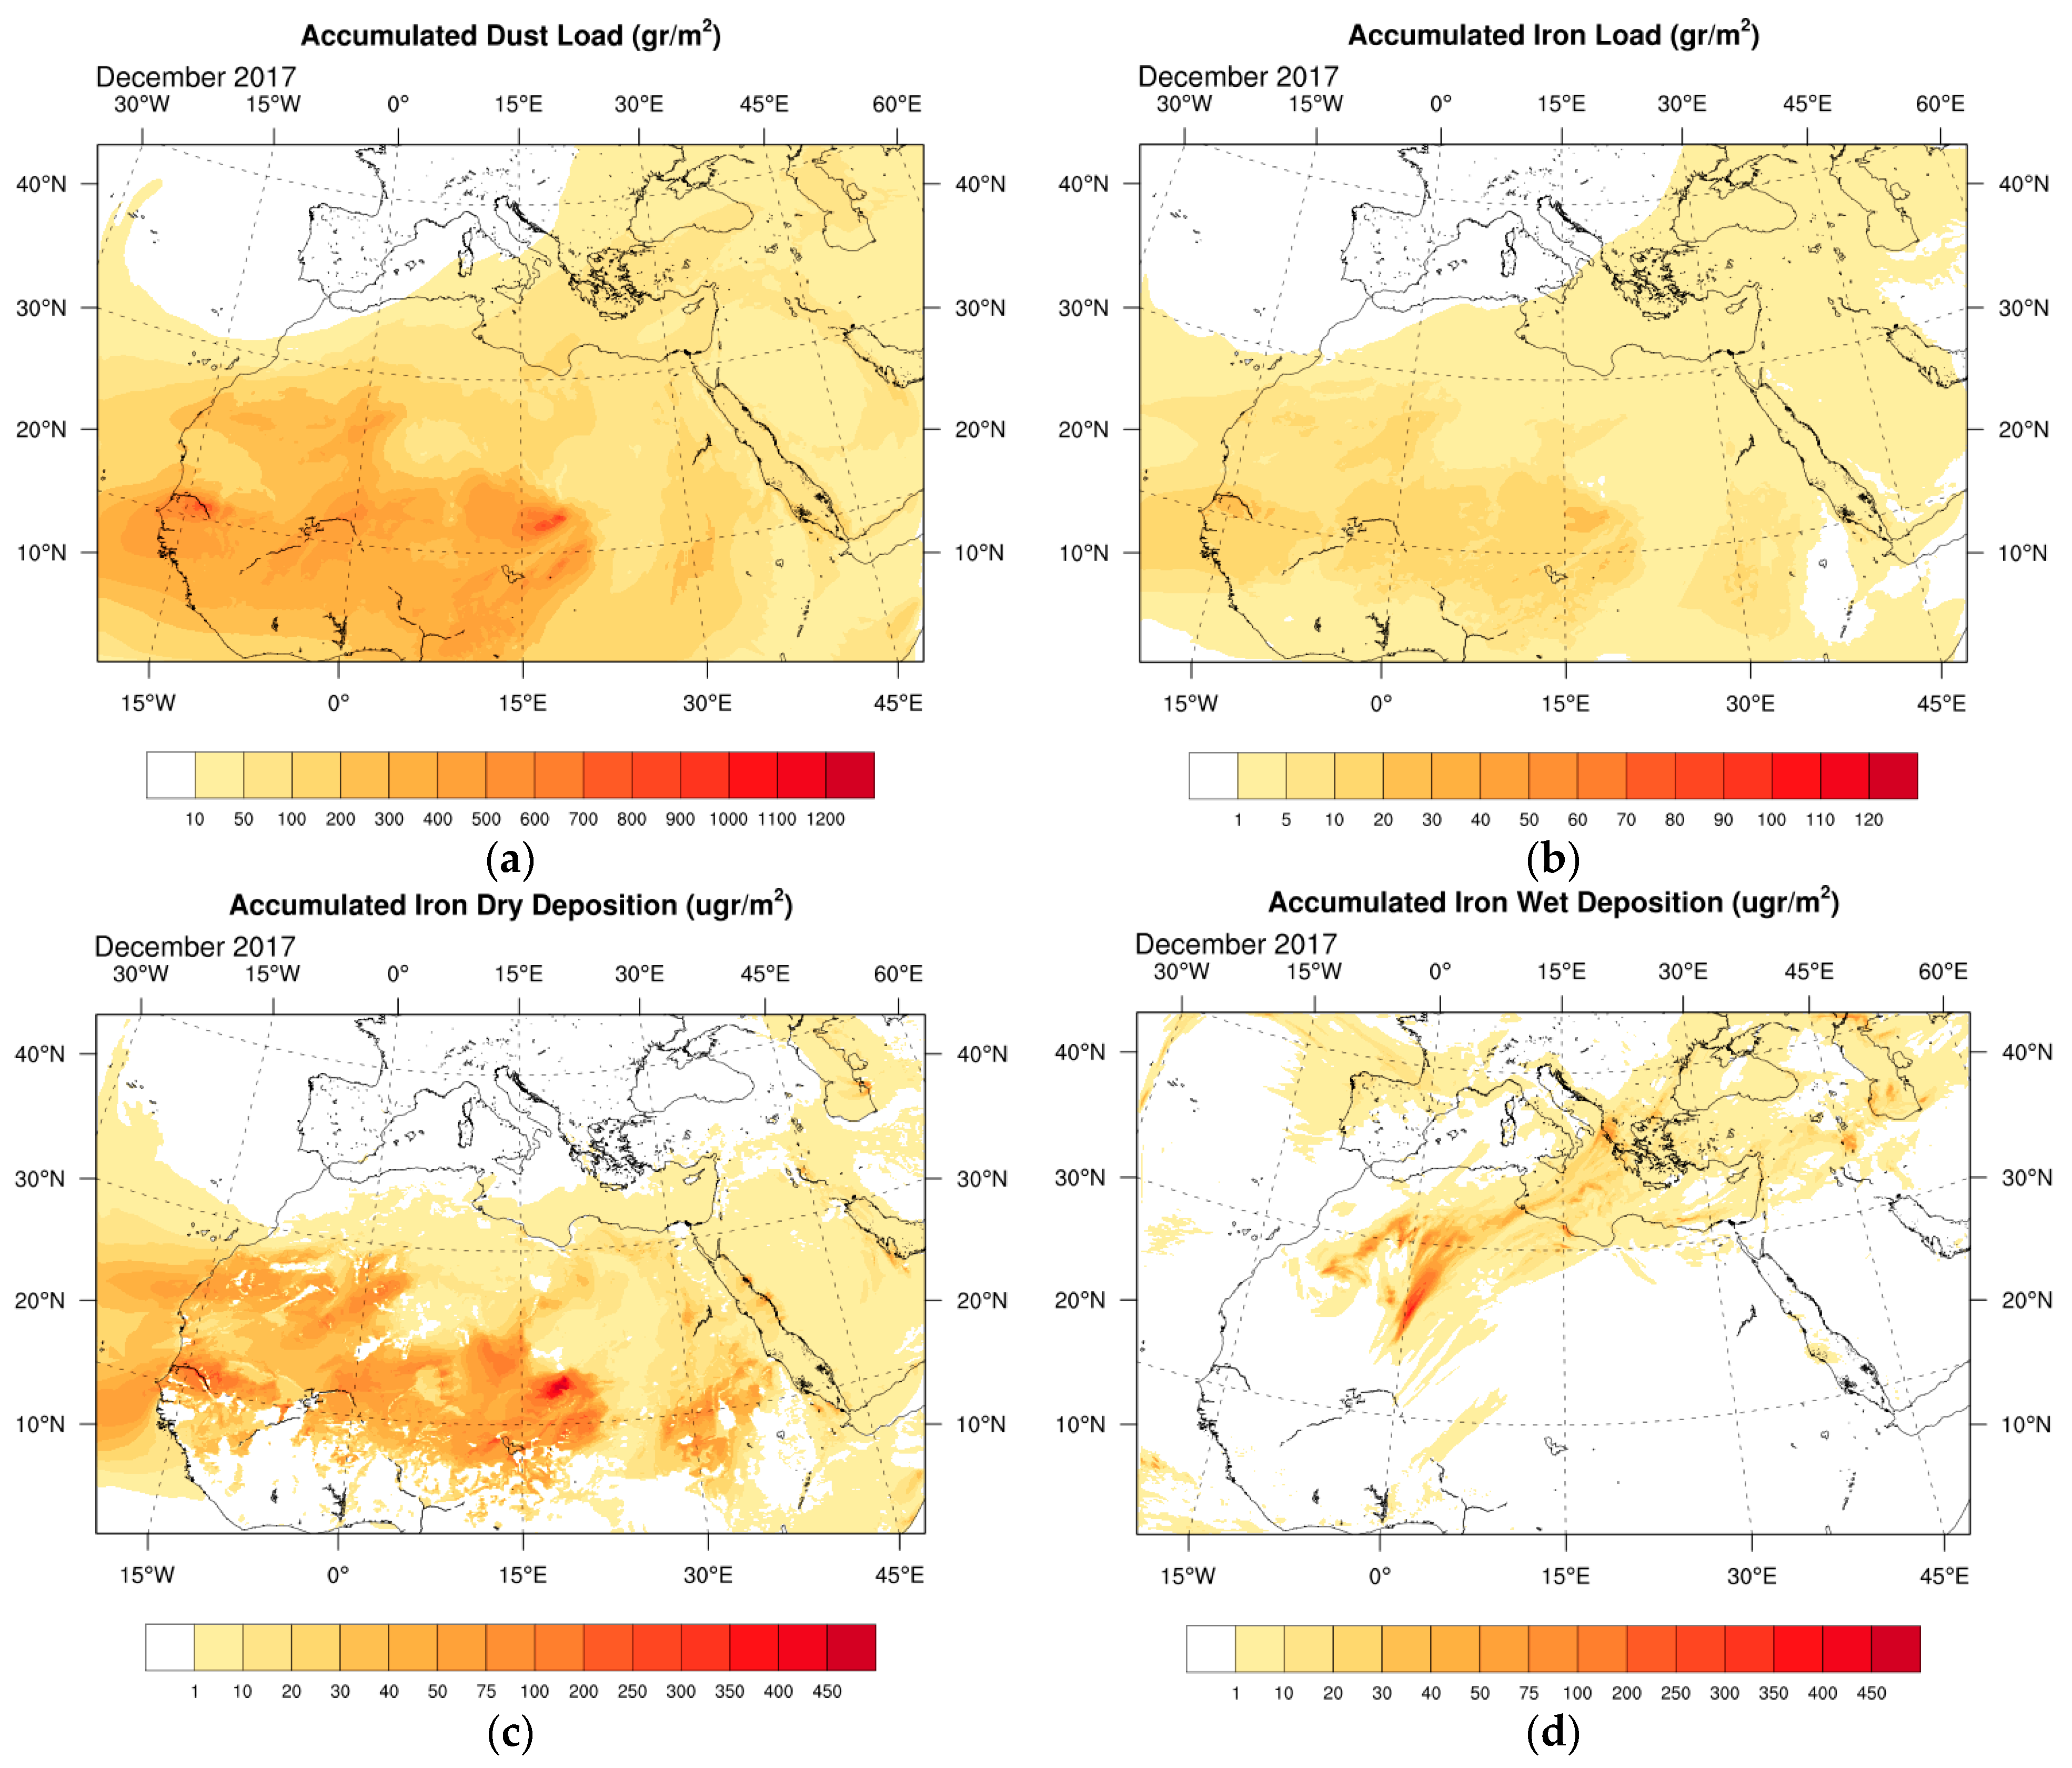
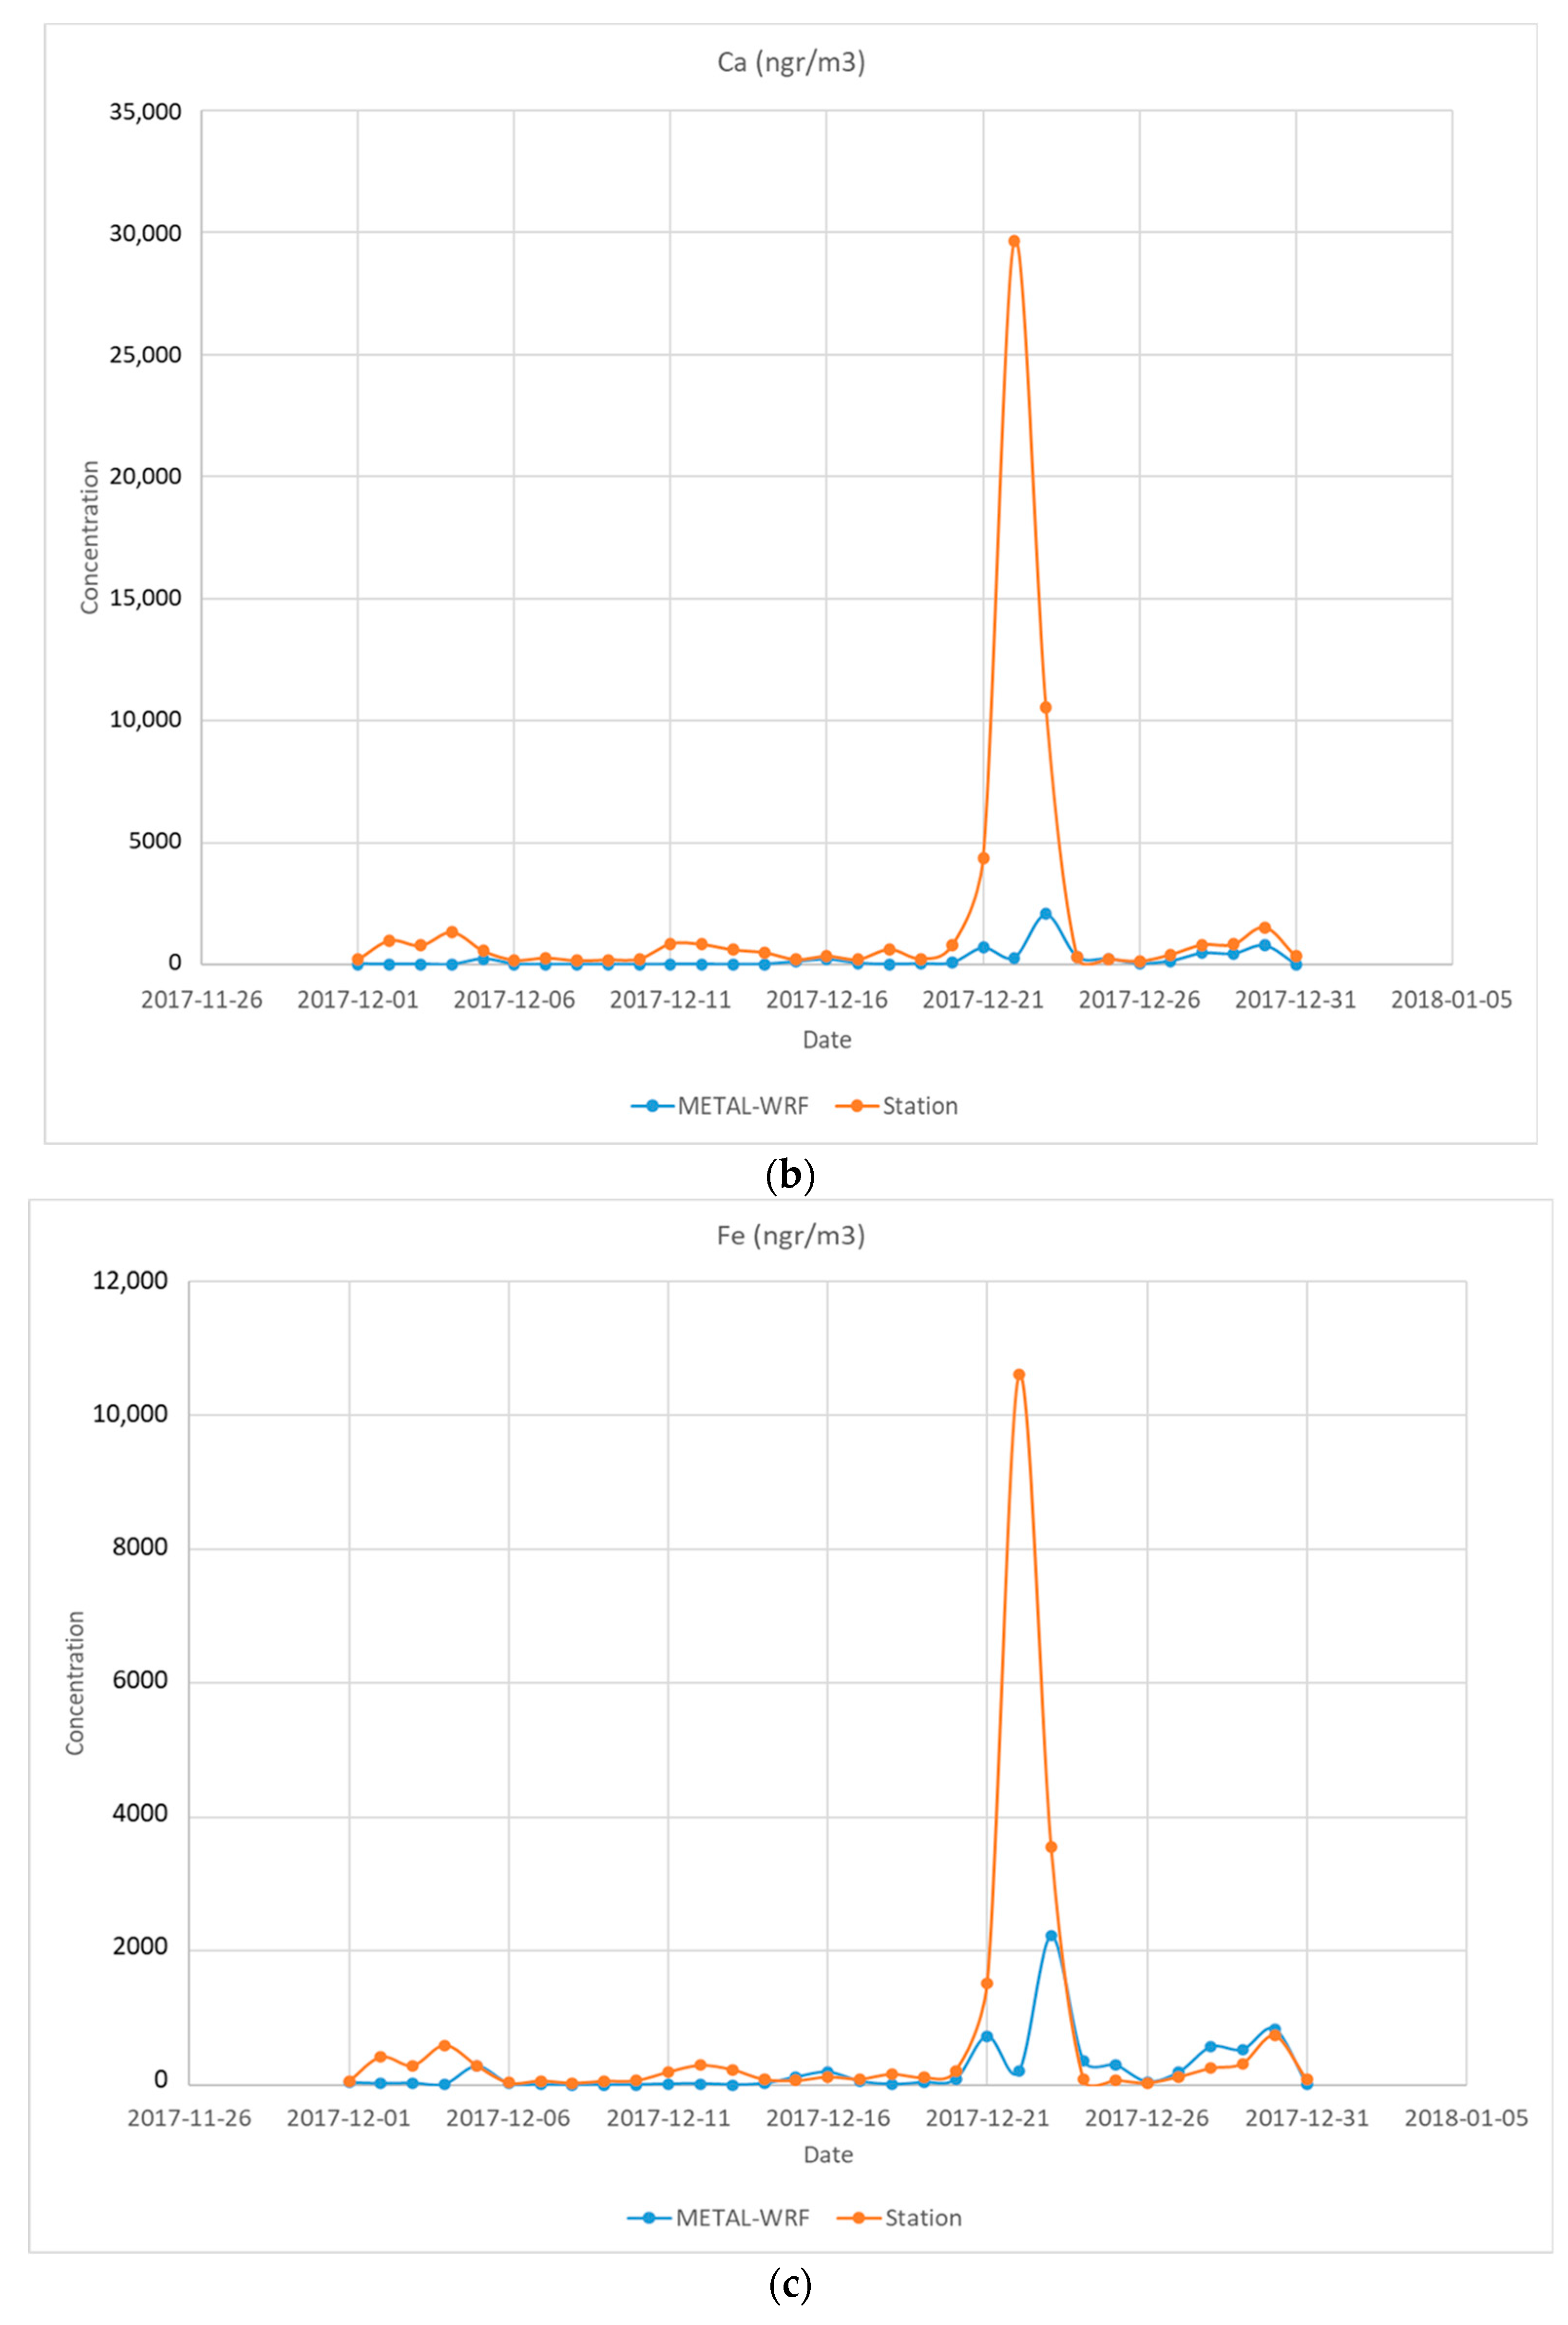
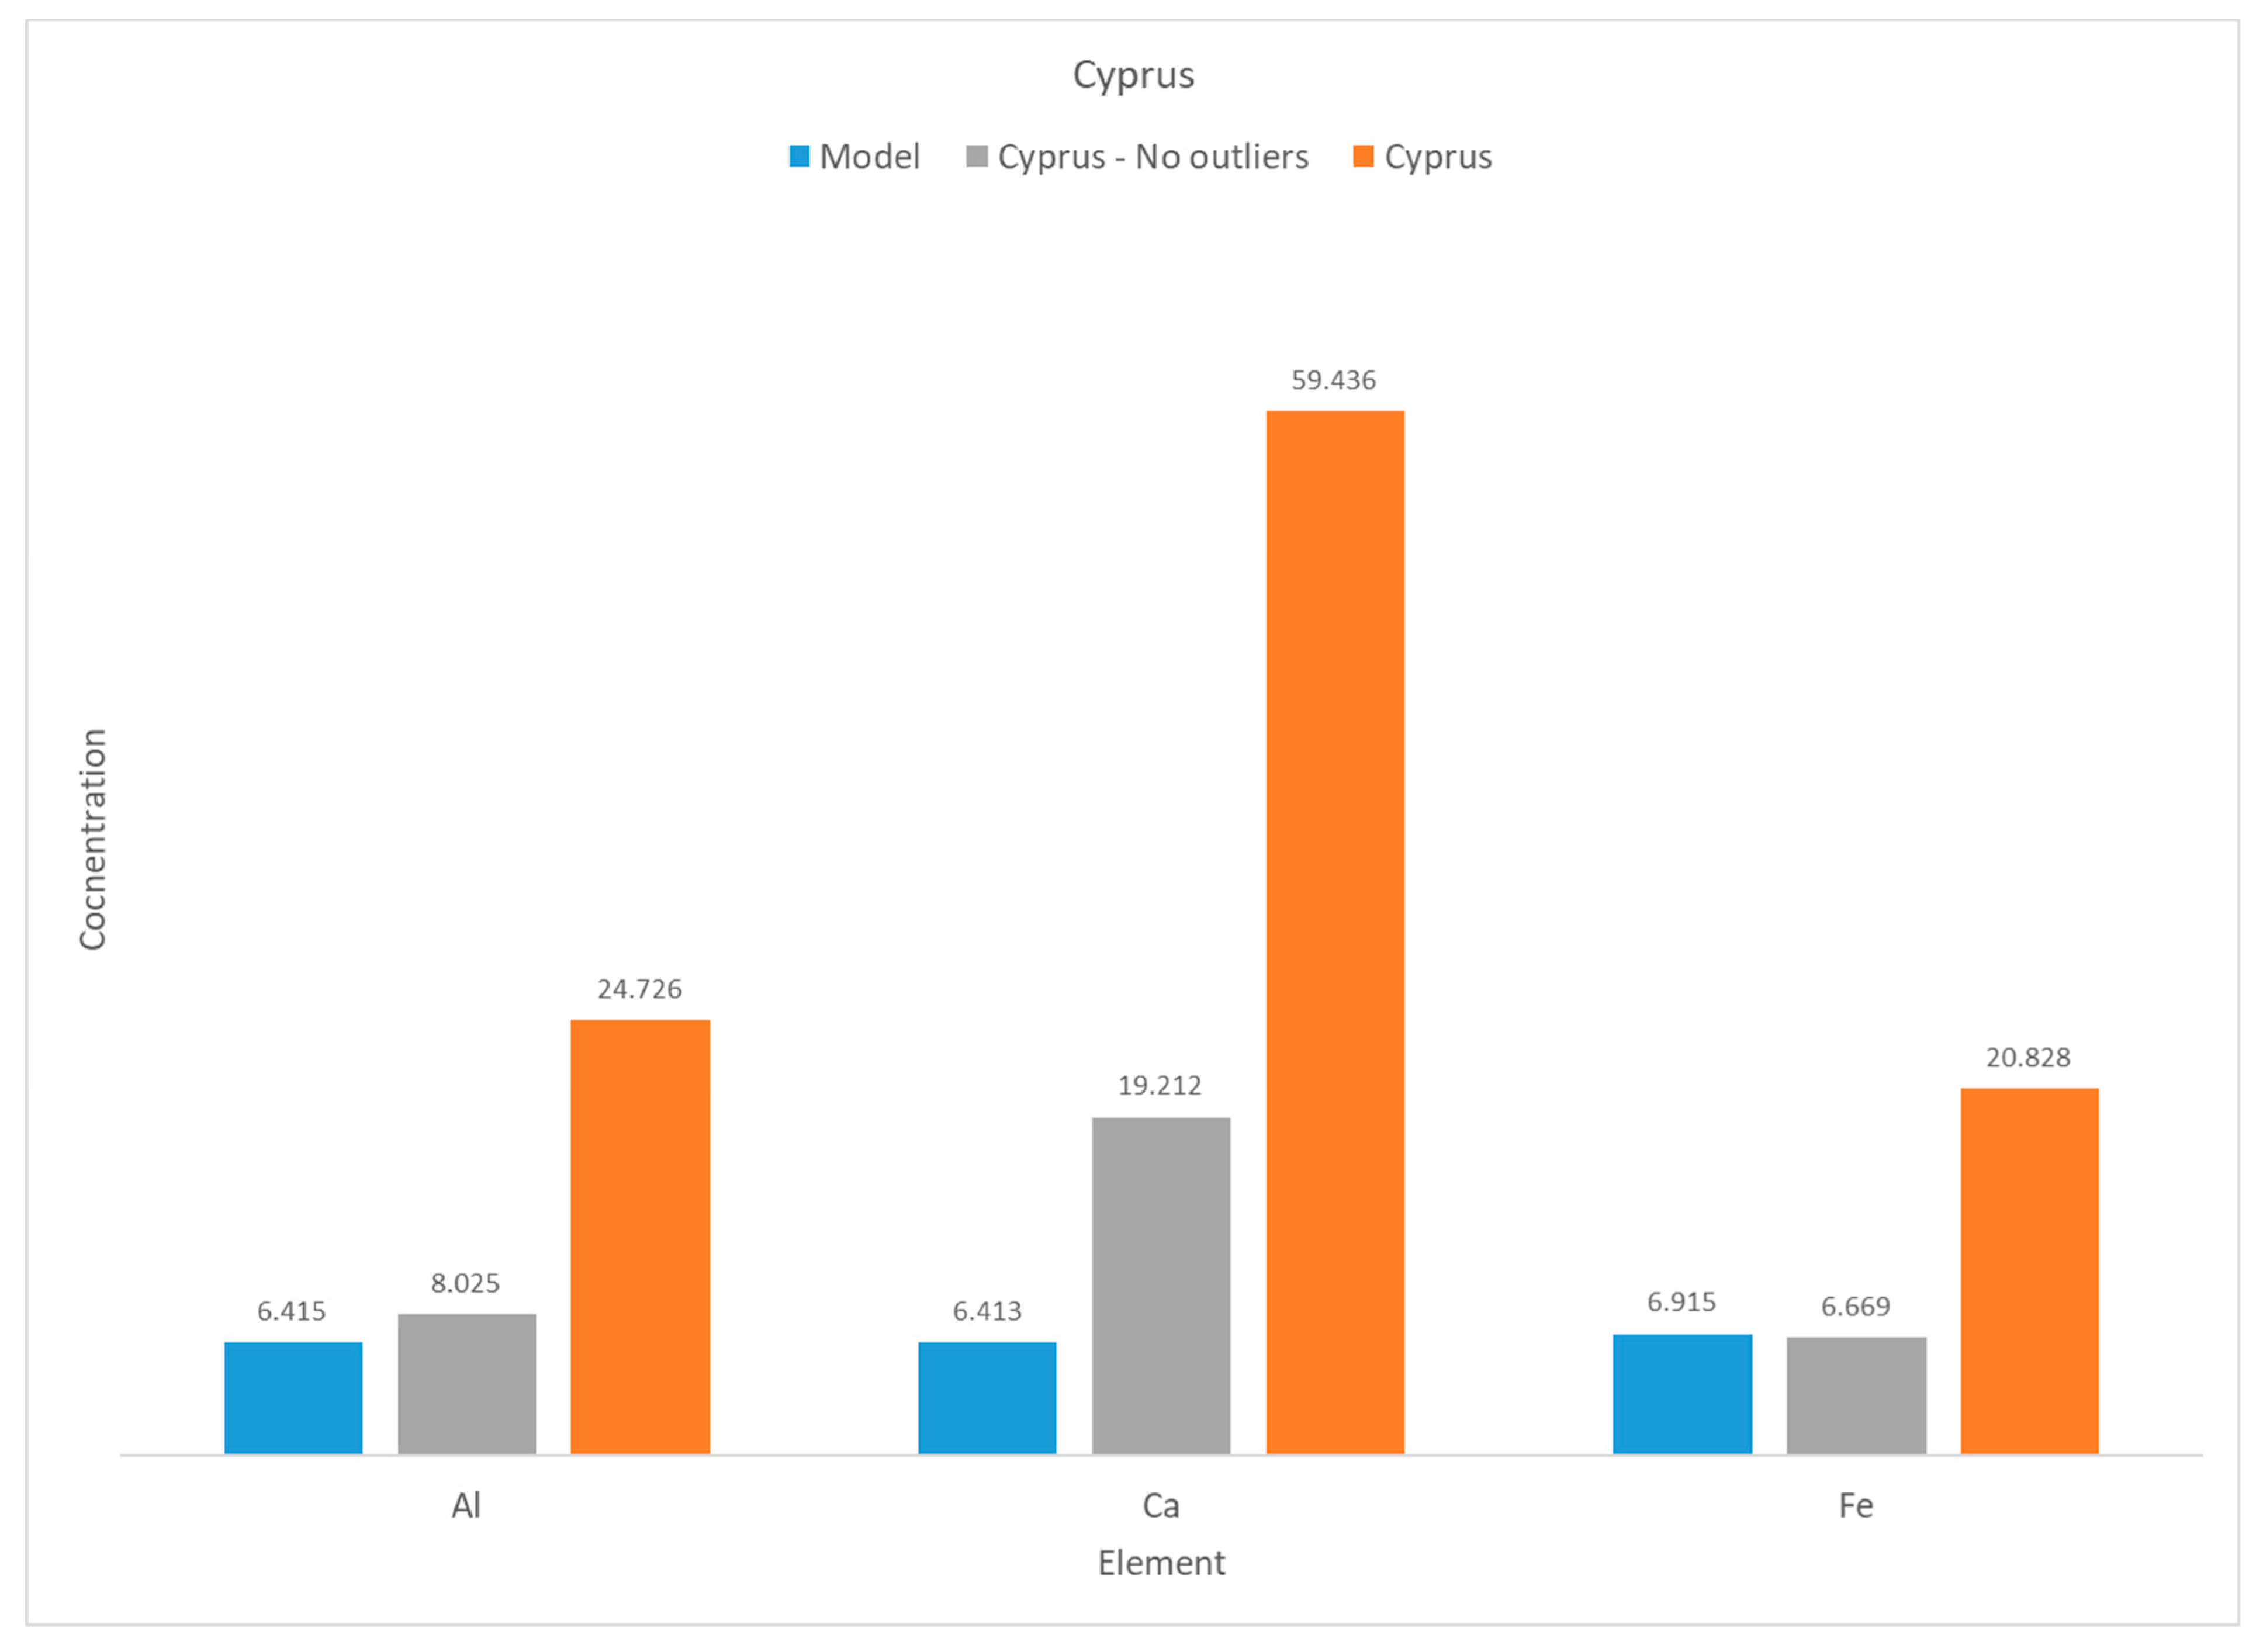
3.3. Dust Transport towards the Eastern Mediterranean—December 2017

For the second sensitivity test, a comparison between model results and measurements for December 2017 is presented for an Eastern Mediterranean monitoring station located in Ayia Marina Xyliatos in Cyprus. This station is located in the Nicosia district and is part of the air quality monitoring network operated by the Air Quality Section of the Cyprus Department of Labor Inspection (Achilleos et al., 2020 [54]). The area is very often affected by dust transport from both the Saharan and Arabian deserts (Pikridas et al., 2018 [55]). Continuous PM10 concentrations were recorded every 2 min using a tapered element oscillating microbalance instrument. The elemental concentration in the measured minerals is provided for Al, Ca, and Fe. METAL-WRF was initialized 15 days before the period of interest to allow a 15-day spin-up period. The sensitivity simulations range from the 1st of December to the 31st of December 2017. Initial and boundary conditions were obtained from the NCEP GDAS data, and SST was obtained from the Copernicus CMEMS analysis datasets, similar to the Atlantic Ocean case study.
The modeled accumulated total dust and iron results for December 2017 are shown in Figure 6. The dust load pattern (Figure 6a) shows dust outflows towards the tropical North Atlantic in the winter SAL and the East Mediterranean, whereas Western Europe was dust-free. The pattern of the modeled iron load and iron dry deposition was similar to that of the dust load tracking the main transport pathways (Figure 6b,c). High wet deposition rates of iron (exceeding 75 mg m−2) were observed across northwest Africa, the central-eastern Mediterranean, and the Balkans (Figure 6d). However, iron depositions through precipitation were also evident in Figure 6d over the central Mediterranean and Western Europe. Such results reveal the importance of the new wet deposition scheme for dust elements in METAL-WRF since the washout via precipitation is the primary removal mechanism of elevated aerosol plumes away from their sources.
The time series of the daily average modeled and measured concentrations of Al, Ca, and Fe at Ayia Marina Xyliatos during December 2017 are presented in Figure 7. As shown in these results, there was a generally good agreement between the daily measurements and the modeled elemental composition of transported dust. The daily modeled concentrations of Al, Ca, and Fe were close to the observations, especially at smaller abundances, i.e., less than 2000 ngr/m3. For instance, on the 29th of December, METAL-WRF simulated 449 ngr/m3 of Al, 453 ngr/m3 of Ca, and 527 ngr/m3 of Fe, while the corresponding measurements were 408 ngr/m3 of Al, 834 ngr/m3 of Ca, and 320 ngr/m3 of Fe, respectively. The abrupt increase in dust elements during 21–23 December was also reproduced by the model—however, not at its full magnitude. This was due to the relatively coarse grid space of the simulation, which cannot accurately resolve the local winds and downflows induced by the complex station topography. These local flows are responsible for abrupt increases in surface dust concentrations when the dust plumes approach the Mediterranean islands. As shown in earlier relevant studies for Crete and Cyprus (Solomos et al., 2017, 2018 [16,72]), Foehn winds are generated at the lee side of the mountains, favoring the downward mixing of dust towards the surface. The monthly accumulated values of modeled and measured elements are shown in Figure 8. As shown in this plot, the model reproduced the relative concentrations of the elements, especially when we excluded the three outlier values of 21–23 December. In this case, the modeled concentrations of Al (6.41 μgm−3) and Fe (6.92 μgm−3) were comparable to the measured ones (8.02 μgm−3 and 6.66 μgm−3, respectively). Calcium (Ca) was still underestimated (6.40 μgm−3 modeled versus 19.20 μgm−3 measured) due to the lack of certain Ca-containing minerals from the current database, as explained also for the Atlantic Ocean simulation.

4. Summary and Conclusions

This work presents the development of METAL-WRF, a regional atmospheric model to reproduce the mineralogical composition of desert dust particles and describe the full cycle of dust minerals in the atmosphere, i.e., their emission, transport, and dry and wet deposition. To this end, the framework of the WRF-Chem model, v. 4.4.1, was used to calculate the mass concentrations of minerals in the atmospheric column based on the GMINER30 and FERRUM30 mineralogical datasets. A comparison of the modeled results for the elemental composition of dust with the corresponding measurements in Izaña—the North Atlantic—and Agia Marina Xyliatos—the eastern Mediterranean—observatories indicates the overall good performance of the model for iron (Fe), calcium (Ca), and aluminum (Al) concentrations, considering the complexity of the involved physical and chemical processes. The relevant abundances of the different minerals and their magnitudes were reproduced by the model. The modeled concentrations of aluminum (Al), iron (Fe), and calcium (Ca) were overestimated by 44%, 22%, and 11%, respectively, in Izaña, while iron (Fe) was overestimated by 4% in Agia Marina Xyliatos. The relatively good results, particularly for iron, are encouraging for further studies since this element is an important limiting micronutrient in the ocean and also modulates the ability of dust to absorb light. At Izaña, silicon was overestimated by 200%, probably due to an overestimation of quartz in the model. On the other hand, magnesium (Mg) was underestimated in Izaña by 84% due to the lack of certain Mg-bearing minerals in the model. In Agia Marina Xyliatos, aluminum (Al) was underestimated by 20% and calcium (Ca) by 67%. Such underestimations were expected for these elements because several minerals, such as chlorite, goethite, and vermiculite, that contain these elements are not yet included in the mineralogical database of METAL-WRF. The current model configuration can support the implementation of any newer datasets of surface mineralogical compositions from recent satellite missions, such as the NASA-EMIT mission. Improving the completeness and the detail in the input mineralogical dataset could provide the missing components for the underestimated elements and improve the model’s performance in future studies.
The overall assessment of the model’s performance suggests the capability of METAL-WRF to reproduce the elemental composition of long-range transported dust particles. These results provide a solid basis for future relevant studies and set the directions for forthcoming research on the role of dust particles in various environmental processes. This is the first step towards further studies on the role of dust composition for a plethora of physical mechanisms that are already resolved in the model, such as radiative transfer and cloud microphysics. Due to the nesting capabilities of the computational core, METAL-WRF can be used for the seamless description of dust-related phenomena and the impact of different minerals at all spatiotemporal scales. For example, cloud-resolving simulations at the order of a 1×1 km grid space can be used to describe the participation of different minerals in ice and liquid nucleation processes for cloud formation. Convection-resolving simulations (e.g., at a 3×3 km grid space) can describe the roles of different minerals during the generation of dust fronts (haboobs) via the convective downdrafts over source areas. Mesoscale simulations at meso-γ scales, such as that in the present study, can describe the long-range transport of dust elements at different regions worldwide, and coarser model setups can be used for long-term global and climatic runs. Finally, an important component of METAL-WRF’s development is the implementation of a wet deposition scheme for the GOCART-AFWA dust module. The description of in-cloud and below-cloud scavenging of dust particles was missing in previous WRF-Chem versions, and such mechanisms are crucial for the deposition of minerals over land and ocean bodies worldwide.

Author Contributions

S.S. contributed to the conceptualization, data curation, formal analysis, funding acquisition, investigation, methodology, project administration, model development, resources, software, supervision, validation, visualization, writing—original draft, and writing—review and editing; C.S. contributed to the conceptualization, model development, data curation, formal analysis, investigation, methodology, software, validation, visualization, writing—original draft, and writing—review and editing.; A.B., S.R., Y.G., M.K.A.N., P.M., S.N., A.V.V., M.V.M., G.P. and B.C. contributed to the data curation, resources, investigation, methodology, software, validation, and writing—review and editing; and N.S.B., C.K., V.A., O.S., A.G. and C.Z. contributed to the validation and writing—review and editing. All authors have read and agreed to the published version of the manuscript.

Funding

This study was supported by the Hellenic Foundation for Research and Innovation project Mineralogy of Dust Emissions and Impacts on Environment and Health (MegDeth - HFRI no. 703). Part of this study was conducted within the framing of the AERO-EXTREME (PID2021-125669NB-I00) project funded by the State Research Agency/Agencia Estatal de Investigación of Spain and the European Regional Development Funds.

Institutional Review Board Statement

Not applicable.

Informed Consent Statement

Not applicable.

Data Availability Statement

The data presented in this study are available on the following link https://doi.org/10.6084/m9.figshare.24517204.v1 (accessed on 3 October 2023).

Acknowledgments

The authors acknowledge support from the Hellenic Foundation for Research and Innovation project MegDeth (HFRI no. 703), the AERO-EXTREME (PID2021-125669NB-I00) project of the State Research Agency/Agencia Estatal de Investigación of Spain, COST Action CA2119 HARMONIA, and the Hellenic Foundation for Research and Innovation project ATLANTAS (HFRI no. 544). We thank the Pl(s) and co-PI(s) and their staff for establishing and maintaining the measuring sites at Izaña and Agia Marina Xyliatos used in this investigation.

Conflicts of Interest

The authors declare that they have no conflict of interest.

References

  1. Tegen, I.; Hollrig, P.; Chin, M.; Fung, I.; Jacob, D.; Penner, J. Contribution of different aerosol species to the global aerosol extinction optical thickness: Estimates from model results. J. Geophys. Res. 1997, 102, 23895–23915. [Google Scholar] [CrossRef]
  2. Prospero, J.M.; Ginoux, P.; Torres, O.; Nicholson, S.E.; Gill, T.E. Environmental Characterization of Global Sources of Atmospheric Soil Dust Identified with the Nimbus 7 Total Ozone Mapping Spectrometer (Toms) Absorbing Aerosol Product. Rev. Geophys. 2002, 40, 1002. [Google Scholar] [CrossRef]
  3. Gassó, S.; Grassian, V.H.; Miller, R.L. Interactions between Mineral Dust, Climate, and Ocean Ecosystems. Elements 2010, 6, 247–252. [Google Scholar] [CrossRef]
  4. Spyrou, C.; Kallos, G.; Mitsakou, C.; Athanasiadis, P.; Kalogeri, C.; Iacono, M.J. Modeling the radiative effects of desert dust on weather and regional climate. Atmos. Chem. Phys. 2013, 13, 5489–5504. [Google Scholar] [CrossRef]
  5. Mahowald, N.; Albani, S.; Kok, J.F.; Engelstaeder, S.; Scanza, R.; Ward, D.S.; Flanner, M.G. The size distribution of desert dust aerosols and its impact on the Earth System. Aeolian Res. 2014, 15, 53–71. [Google Scholar] [CrossRef]
  6. Spyrou, C. Direct radiative impacts of desert dust on atmospheric water content. Aerosol Sci. Technol. 2018, 52, 693–701. [Google Scholar] [CrossRef]
  7. Kok, J.F.; Storelvmo, T.; Karydis, V.A.; Adebiyi, A.A.; Mahowald, N.M.; Evan, A.T.; He, C.; Leung, D.M. Mineral dust aerosol impacts on global climate and climate change. Nat. Rev. Earth Environ. 2023, 4, 71–86. [Google Scholar] [CrossRef]
  8. Kumar, P.; Sokolik, I.N.; Nenes, A. Measurements of cloud condensation nuclei activity and droplet activation kinetics of fresh unprocessed regional dust samples and minerals. Atmos. Chem. Phys. 2011, 11, 3527–3541. [Google Scholar] [CrossRef]
  9. Levin, Z.; Cotton, W.R. WMO/IUGG International Aerosol Precipitation Science Assessment Group (IAPSAG). In Aerosol Pollution Impact on Precipitation: A Scientific Review; World Meteorological Organization: Geneva, Switzerland, 2007; p. 485. [Google Scholar]
  10. Solomos, S.; Kallos, G.; Kushta, J.; Astitha, M.; Tremback, C.; Nenes, A.; Levin, Z. An integrated modeling study on the effects of mineral dust and sea salt particles on clouds and precipitation. Atmos. Chem. Phys. 2011, 11, 873–892. [Google Scholar] [CrossRef]
  11. Creamean, J.M.; Suski, K.J.; Rosenfeld, D.; Cazorla, A.; DeMott, P.J.; Sullivan, R.C.; White, A.B.; Ralph, F.M.; Minnis, P.; Comstock, J.M.; et al. Dust and Biological Aerosols from the Sahara and Asia Influence Precipitation in the Western, U.S. Science 2013, 339, 1572–1578. [Google Scholar] [CrossRef]
  12. Mahowald, N.; Baker, A.; Bergametti, G.; Brooks, N.; Duce, R.; Jickells, T.; Kubilay, N.; Prospero, J.; Tegen, I. The atmospheric global dust cycle and iron inputs to the ocean. Glob. Biogeochem. Cycles 2005, 19, GB4025. [Google Scholar] [CrossRef]
  13. Jickells, T.D.; An, Z.S.; Andersen, K.K.; Baker, A.R.; Bergametti, G.; Brooks, N.; Cao, J.J.; Boyd, P.W.; Duce, R.A.; Hunter, K.A.; et al. Global Iron Connections Between Desert Dust, Ocean Biogeochemistry, and Climate. Science 2005, 308, 67–71. [Google Scholar] [CrossRef] [PubMed]
  14. Ito, T.; Nenes, A.; Johnson, M.S.; Meskhidze, N.; Valett, J.; Deutsch, C. Late 20th century deoxygenation of the tropical Pacific enhanced by aerosol pollutants. Nat. Geosci. 2016, 9, 443–447. [Google Scholar] [CrossRef]
  15. Rodríguez, S.; Riera, R.; Fonteneau, A.; Alonso-Pérez, S.; López-Darias, J. African desert dust influences migrations and fisheries of the Atlantic skipjack-tuna. Atmos. Environ. 2023, 312, 120022. [Google Scholar] [CrossRef]
  16. Solomos, S.; Kalivitis, N.; Mihalopoulos, N.; Amiridis, V.; Kouvarakis, G.; Gkikas, A.; Binietoglou, I.; Tsekeri, A.; Kazadzis, S.; Kottas, M.; et al. From Tropospheric Folding to Khamsin and Foehn Winds: How Atmospheric Dynamics Advanced a Record-Breaking Dust Episode in Crete. Atmosphere 2018, 9, 240. [Google Scholar] [CrossRef]
  17. Mitsakou, C.; Kallos, G.; Papantoniou, N.; Spyrou, C.; Solomos, S.; Astitha, M.; Housiadas, C. Saharan dust levels in Greece and received inhalation doses. Atmos. Chem. Phys. 2008, 8, 7181–7192. [Google Scholar] [CrossRef]
  18. Goudie, S.A. Desert dust and human health disorders. Environ. Int. 2013, 63, 101–113. [Google Scholar] [CrossRef]
  19. Esmaeil, N.; Gharagozloo, M.; Rezaei, A.; Grunig, G. Dust events, pulmonary diseases and immune system. Am. J. Clin. Exp. Immunol. 2014, 3, 20–29. [Google Scholar]
  20. Dominguez-Rodriguez, A.; Rodríguez, S.; Baez-Ferrer, N.; Abreu-Gonzalez, P.; Abreu-Gonzalez, J.; Avanzas, P.; Carnero, M.; Moris, C.; López-Darias, J.; Hernández-Vaquero, D. Impact of Saharan dust exposure on airway inflammation in patients with ischemic heart disease. Transl. Res. 2020, 224, 16–25. [Google Scholar] [CrossRef]
  21. Domínguez-Rodríguez, A.; Báez-Ferrer, N.; Abreu-González, P.; Rodríguez, S.; Díaz, R.; Avanzas, P.; Hernández-Vaquero, D. Impact of Desert Dust Events on the Cardiovascular Disease: A Systematic Review and Meta-Analysis. J. Clin. Med. 2021, 10, 727. [Google Scholar] [CrossRef]
  22. Rodríguez, S.; Calzolai, G.; Chiari, M.; Nava, S.; García, M.I.; López-Solano, J.; Marrero, C.; López-Darias, J.; Cuevas, E.; Alonso-Pérez, S.; et al. Rapid changes of dust geochemistry in the Saharan Air Layer linked to sources and meteorology. Atmos. Environ. 2020, 223, 117186. [Google Scholar] [CrossRef]
  23. Scheuvens, D.; Schütz, L.; Kandler, K.; Ebert, M.; Weinbruch, S. Bulk composition of northern African dust and its source sediments—A compilation. Earth Sci. Rev. 2013, 116, 170–194. [Google Scholar] [CrossRef]
  24. Meskhidze, N.; Chameides, W.L.; Nenes, A.; Chen, G. Iron mobilization in mineral dust: Can anthropogenic SO2 emissions affect ocean productivity? Geophys. Res. Lett. 2003, 30, 2085. [Google Scholar] [CrossRef]
  25. Mahowald, N.; Lindsay, K.; Rothenberg, D.; Doney, S.C.; Moore, J.K.; Thornton, P.; Randerson, J.T.; Jones, C.D. Desert dust and anthropogenic aerosol interactions in the Community Climate System Model coupled-carbon-climate model. Biogeosciences 2011, 8, 387–414. [Google Scholar] [CrossRef]
  26. Di Biagio, C.; Formenti, P.; Balkanski, Y.; Caponi, L.; Cazaunau, M.; Pangui, E.; Journet, E.; Nowak, S.; Andreae, M.O.; Kandler, K.; et al. Complex refractive indices and single-scattering albedo of global dust aerosols in the shortwave spectrum and relationship to size and iron content. Atmos. Chem. Phys. 2019, 19, 15503–15531. [Google Scholar] [CrossRef]
  27. Ageitos, G.M.; Obiso, V.; Miller, R.L.; Jorba, O.; Klose, M.; Dawson, M.; Balkanski, Y.; Perlwitz, J.; Basart, S.; Di Tomaso, E.; et al. Modeling dust mineralogical composition: Sensitivity to soil mineralogy atlases and their expected climate impacts. Atmos. Chem. Phys. 2023, 23, 8623–8657. [Google Scholar] [CrossRef]
  28. Di Biagio, C.; Formenti, P.; Balkanski, Y.; Caponi, L.; Cazaunau, M.; Pangui, E.; Journet, E.; Nowak, S.; Caquineau, S.; Andreae, O.M.; et al. Global scale variability of the mineral dust long-wave refractive index: A new dataset of in situ measurements for climate modeling and remote sensing. Atmos. Chem. Phys. 2017, 92517, 1901–1929. [Google Scholar] [CrossRef]
  29. Scanza, R.A.; Mahowald, N.; Ghan, S.; Zender, C.S.; Kok, J.F.; Liu, X.; Zhang, Y.; Albani, S. Modeling dust as component minerals in the Community Atmosphere Model: Development of framework and impact on radiative forcing. Atmos. Chem. Phys. 2015, 15, 537–561. [Google Scholar] [CrossRef]
  30. Claquin, T.; Schulz, M.; Balkanski, Y. Modeling the mineralogy of atmospheric dust sources. J. Geophys. Res. 1999, 104, 22243–22256. [Google Scholar] [CrossRef]
  31. Nickovic, S.; Vukovic, A.; Vujadinovic, M.; Djurdjevic, V.; Pejanovic, G. Technical Note: High-resolution mineralogical database of dust-productive soils for atmospheric dust modeling. Atmos. Chem. Phys. 2012, 12, 845–855. [Google Scholar] [CrossRef]
  32. Chatziparaschos, M.; Daskalakis, N.; Myriokefalitakis, S.; Kalivitis, N.; Nenes, A.; Ageitos, M.G.; Costa-Surós, M.; García-pando, C.P.; Zanoli, M.; Vrekoussis, M.; et al. Role of K-feldspar and quartz in global ice nucleation by mineral dust in mixed-phase clouds. Atmos. Chem. Phys. 2023, 23, 1785–1801. [Google Scholar] [CrossRef]
  33. Kandler, K.; Benker, N.; Bundke, U.; Cuevas, E.; Ebert, M.; Knippertz, P.; Rodríguez, S.; Schütz, L.; Weinbruch, S. Chemical composition and complex refractive index of Saharan Mineral Dust at Izaña, Tenerife (Spain) derived by electron microscopy. Atmos. Environ. 2007, 41, 8058–8074. [Google Scholar] [CrossRef]
  34. Titos, G.; Ealo, M.; Pandolfi, M.; Pérez, N.; Sola, Y.; Sicard, M.; Comerón, A.; Querol, X.; Alastuey, A. Spatiotemporal evolution of a severe winter dust event in the western Mediterranean: Aerosol optical and physical properties. J. Geophys. Res. Atmos. 2017, 122, 4052–4069. [Google Scholar] [CrossRef]
  35. Rodriguez-Navarro, C.; di Lorenzo, F.; Elert, K. Mineralogy and physicochemical features of Saharan dust wet deposited in the Iberian Peninsula during an extreme red rain event. Atmos. Chem. Phys. 2018, 18, 10089–10122. [Google Scholar] [CrossRef]
  36. Li, L.; Mahowald, N.M.; Miller, R.L.; Pérez García-Pando, C.; Klose, M.; Hamilton, D.S.; Gonçalves Ageitos, M.; Ginoux, P.; Balkanski, Y.; Green, R.O.; et al. Quantifying the range of the dust direct radiative effect due to source mineralogy uncertainty. Atmos. Chem. Phys. 2021, 21, 3973–4005. [Google Scholar] [CrossRef]
  37. Bergas-Massó, E.; Gonçalves Ageitos, M.; Myriokefalitakis, S.; Miller, R.L.; van Noije, T.; Le Sager, P.; Pinto, G.M.; García-Pando, C.P. Pre-industrial, present and future atmospheric soluble iron deposition and the role of aerosol acidity and oxalate under CMIP6 emissions. Earth’s Future 2023, 11, e2022EF003353. [Google Scholar] [CrossRef]
  38. Myriokefalitakis, S.; Bergas-Massó, E.; Gonçalves Ageitos, M.; García-Pando, C.P. Multiphase processes in the EC-Earth model and their relevance to the atmospheric oxalate, sulfate, and iron cycles. Geosci. Model Dev. 2022, 15, 3079–3120. [Google Scholar] [CrossRef]
  39. Klose, M.; Jorba, O.; Gonçalves Ageitos, M.; Escribano, J.; Dawson, M.L.; Obiso, V.; Di Tomaso, E.; Basart, S.; Montané Pinto, G.; MacChia, F.; et al. Mineral dust cycle in the Multiscale Online Nonhydrostatic Atmosphere Chemistry model (MONARCH) version 2.0. Geosci. Model Dev. 2021, 14, 6403–6444. [Google Scholar] [CrossRef]
  40. Hamilton, D.S.; Scanza, R.A.; Feng, Y.; Guinness, J.; Kok, J.F.; Li, L.; Liu, X.; Rathod, S.D.; Wan, J.S.; Wu, M.; et al. Improved methodologies for Earth system modelling of atmospheric soluble iron and observation comparisons using the Mechanism of Intermediate complexity for Modelling Iron (MIMI v1.0). Geosci. Model Dev. 2019, 12, 3835–3862. [Google Scholar] [CrossRef]
  41. Dai, H.; Huang, G.; Wang, J.; Zeng, H. VAR-tree model based spatio-temporal characterization and prediction of O3 concentration in China. Ecotoxicol. Environ. Saf. 2023, 257, 114960. [Google Scholar] [CrossRef]
  42. Dai, H.; Huang, G.; Zeng, H. Multi-objective optimal dispatch strategy for power systems with Spatio-temporal distribution of air pollutants. Sustain. Cities Soc. 2023, 98, 104801. [Google Scholar] [CrossRef]
  43. Grell, G.A.; Peckham, S.E.; Schmitz, R.; McKeen, S.A.; Frost, G.; Skamarock, W.C.; Eder, B. Fully coupled “online” chemistry within the WRF model. Atmos. Environ. 2005, 39, 6957–6975. [Google Scholar] [CrossRef]
  44. Skamarock, W.C.; Klemp, J.B.; Dudhia, J.; Gill, D.O.; Liu, Z.; Berner, J.; Wang, W.; Powers, J.G.; Duda, M.G.; Barker, D.; et al. A Description of the Advanced Research WRF Model Version 4.3; No. NCAR/TN556+STR; Opensky: Minato, Tokyo, 2021. [Google Scholar] [CrossRef]
  45. Ginoux, P.; Chin, M.; Tegen, I.; Goddard, T.; In, G. Sources and distributions of dust aerosols simulated with the GOCART model. J. Geophys. Res. 2001, 106, 20255–20273. [Google Scholar] [CrossRef]
  46. LeGrand, S.L.; Polashenski, C.; Letcher, T.W.; Creighton, G.A.; Peckham, S.E.; Cetola, J.D. The AFWA dust emission scheme for the GOCART aerosol model in WRF-Chem v3.8.1. Geosci. Model Dev. 2019, 12, 131–166. [Google Scholar] [CrossRef]
  47. Seinfeld, J.H.; Pandis, S.N. Atmospheric Chemistry and Physics: From Air Pollution to Climate Change; John Wiley & Sons, Inc.: New York, NY, USA, 1998. [Google Scholar]
  48. Spyrou, C.; Mitsakou, C.; Kallos, G.; Louka, P.; Vlastou, G. An improved limited area model for describing the dust cycle in the atmosphere. J. Geophys. Res. 2010, 115, D17211. [Google Scholar] [CrossRef]
  49. Tsarpalis, K.; Papadopoulos, A.; Mihalopoulos, N.; Spyrou, C.; Michaelides, S.; Katsafados, P. The Implementation of a Mineral Dust Wet Deposition Scheme in the GOCART-AFWA Module of the WRF Model. Remote Sens. 2018, 10, 1595. [Google Scholar] [CrossRef]
  50. Nickovic, S.; Vukovic, A.; Vujadinovic, M. Atmospheric processing of iron carried by mineral dust. Atmos. Chem. Phys. 2013, 13, 9169–9181. [Google Scholar] [CrossRef]
  51. Perlwitz, J.P.; García-Pando, C.P.; Miller, R.L. Predicting the mineral composition of dust aerosols—Part 1: Representing key processes. Atmos. Chem. Phys. 2015, 15, 11593–11627. [Google Scholar] [CrossRef]
  52. Pérez García-Pando, C.; Miller, R.L.; Perlwitz, J.P.; Rodríguez, S.; Prospero, J.M. Predicting the mineral composition of dust aerosols: Insights from elemental composition measured at the Izaña Observatory. Geophys. Res. Lett. 2016, 43, 10520–10529. [Google Scholar] [CrossRef]
  53. Rodríguez, S.; Alastuey, A.; Querol, X. A review of methods for long term in situ characterization of aerosol dust. Aeolian Res. 2012, 6, 55–74. [Google Scholar] [CrossRef]
  54. Achilleos, S.; Mouzourides, P.; Kalivitis, N.; Katra, I.; Kloog, I.; Kouis, P.; Middleton, N.; Mihalopoulos, N.; Neophytou, M.K.A.; Panayiotou, A.; et al. Spatio-temporal variability of desert dust storms in Eastern Mediterranean (Crete, Cyprus, Israel) between 2006 and 2017 using a uniform methodology. Sci. Total Environ. 2020, 714, 136693. [Google Scholar] [CrossRef] [PubMed]
  55. Pikridas, M.; Vrekoussis, M.; Sciare, J.; Kleanthous, S.; Vasiliadou, E.; Kizas, C.; Savvides, C.; Mihalopoulos, N. Spatial and temporal (short and long-term) variability of submicron, fine and sub-10 μm particulate matter (PM1, PM2.5, PM10) in Cyprus. Atmos. Environ. 2018, 191, 79–93. [Google Scholar] [CrossRef]
  56. Mouzourides, P.; Kumar, P.; Neophytou, M.K.A. Assessment of long-term measurements of particulate matter and gaseous pollutants in South-East Mediterranean. Atmos. Environ. 2015, 107, 148–165. [Google Scholar] [CrossRef]
  57. Tao, W.-K.; Wu, D.; Lang, S.; Chern, J.-D.; Peters-Lidard, C.; Fridlind, A.; Matsui, T. High-resolution NU-WRF simulations of a deep convective-precipitation system during MC3E: Further improvements and comparisons between Goddard microphysics schemes and observations. J. Geophys. Res. Atmos. 2016, 121, 1278–1305. [Google Scholar] [CrossRef]
  58. Zhang, C.; Wang, Y.; Hamilton, K. Improved representation of boundary layer clouds over the southeast pacific in ARW–WRF using a modified Tiedtke cumulus parameterization scheme. Mon. Weather Rev. 2011, 139, 3489–3513. [Google Scholar] [CrossRef]
  59. Iacono, M.J.; Delamere, J.S.; Mlawer, E.J.; Shephard, M.W.; Clough, S.A.; Collins, W.D. Radiative forcing by long–lived greenhouse gases: Calculations with the AER radiative transfer models. J. Geophys. Res. 2008, 113, D13103. [Google Scholar] [CrossRef]
  60. Janjic, Z.I. The surface layer in the NCEP Eta Model. In Proceedings of the Eleventh Conference on Numerical Weather Prediction, Norfolk, VA, USA, 19–23 August 1996; American Meteorological Society: Boston, MA, USA, 1996; pp. 354–355. [Google Scholar]
  61. Janjic, Z.I. Nonsingular Implementation of the Mellor-Yamada Level 2.5 Scheme in the NCEP Meso Model; Office Note No. 437; NCEP: College Park, MD, USA, 2002; p. 61. [Google Scholar]
  62. Tewari, M.; Chen, F.; Wang, W.; Dudhia, J.; LeMone, M.A.; Mitchell, K.; Ek, M.; Gayno, G.; Wegiel, J.; Cuenca, R.H. Implementation and verification of the unified NOAH land surface model in the WRF model. In Proceedings of the 20th Conference on Weather Analysis and Forecasting/16th Conference on Numerical Weather Prediction, Seattle, WA, USA, 11–15 January 2004; pp. 11–15. [Google Scholar]
  63. Mesinger, F. Forecasting upper Tropospheric Turbulence within the Framework of the Mellor-Yamada 2.5 Closure. Available online: https://www.researchgate.net/publication/343610849_Forecasting_upper_tropospheric_turbulence_within_the_framework_of_the_Mellor-Yamada_25_closure (accessed on 3 October 2023).
  64. Janjic, Z.I. The Step–Mountain Eta Coordinate Model: Further developments of the convection, viscous sublayer, and turbulence closure schemes. Mon. Weather Rev. 1994, 122, 927–945. [Google Scholar] [CrossRef]
  65. Prospero, J.M.; Delany, A.C.; Delany, A.C.; Carlson, T.N. The Discovery of African Dust Transport to the Western Hemisphere and the Saharan Air Layer: A History. Bull. Am. Meteorol. Soc. 2021, 102, E1239–E1260. [Google Scholar] [CrossRef]
  66. Rodríguez, S.; Cuevas, E.; Prospero, J.M.; Alastuey, A.; Querol, X.; López-Solano, J.; García, M.I.; Alonso-Pérez, S. Modulation of Saharan dust export by the North African dipole. Atmos. Chem. Phys. 2015, 15, 7471–7486. [Google Scholar] [CrossRef]
  67. Kallos, G.; Papadopoulos, A.; Katsafados, P.; Nickovic, S. Transatlantic Saharan dust transport: Model simulation and results. J. Geophys. Res. 2006, 111, D09204. [Google Scholar] [CrossRef]
  68. Cuevas, E.; Gómez-Peláez, A.J.; Rodríguez, S.; Terradellas, E.; Basart, S.; García, R.D.; García, O.E.; Alonso-Pérez, S. The pulsating nature of large-scale Saharan dust transport as a result of interplays between mid-latitude Rossby waves and the North African Dipole Intensity. Atmos. Environ. 2017, 167, 586–602. [Google Scholar] [CrossRef]
  69. Cuevas, E.; Milford, C.; Barreto, A.; Bustos, J.J.; García, O.E.; García, R.D.; Marrero, C.; Prats, N.; Ramos, R.; Redondas, A.; et al. Izaña Atmospheric Research Center Activity Report 2019–2020; NIPO: 666-22-014-0, WMO/GAW Report No. 276; Cuevas, E., Milford, C., Tarasova, O., Eds.; State Meteorological Agency (AEMET): Madrid, Spain; World Meteorological Organization: Geneva, Switzerland, 2022. [Google Scholar] [CrossRef]
  70. National Centers for Environmental Prediction; National Weather Service; NOAA; U.S. Department of Commerce. NCEP GDAS/FNL 0.25 Degree Global Tropospheric Analyses and Forecast Grids; Research Data Archive at the National Center for Atmospheric Research, Computational and Information Systems Laboratory: Boulder, CO, USA, 2015. [Google Scholar] [CrossRef]
  71. GLOBAL_MULTIYEAR_PHY_001_030. E.U. Copernicus Marine Service Information (CMEMS). Marine Data Store (MDS). Available online: https://marine.copernicus.eu/access-data (accessed on 1 September 2023).
  72. Solomos, S.; Ansmann, A.; Mamouri, R.-E.; Binietoglou, I.; Patlakas, P.; Marinou, E.; Amiridis, V. Remote sensing and modelling analysis of the extreme dust storm hitting the Middle East and eastern Mediterranean in September 2015. Atmos. Chem. Phys. 2017, 17, 4063–4079. [Google Scholar] [CrossRef]
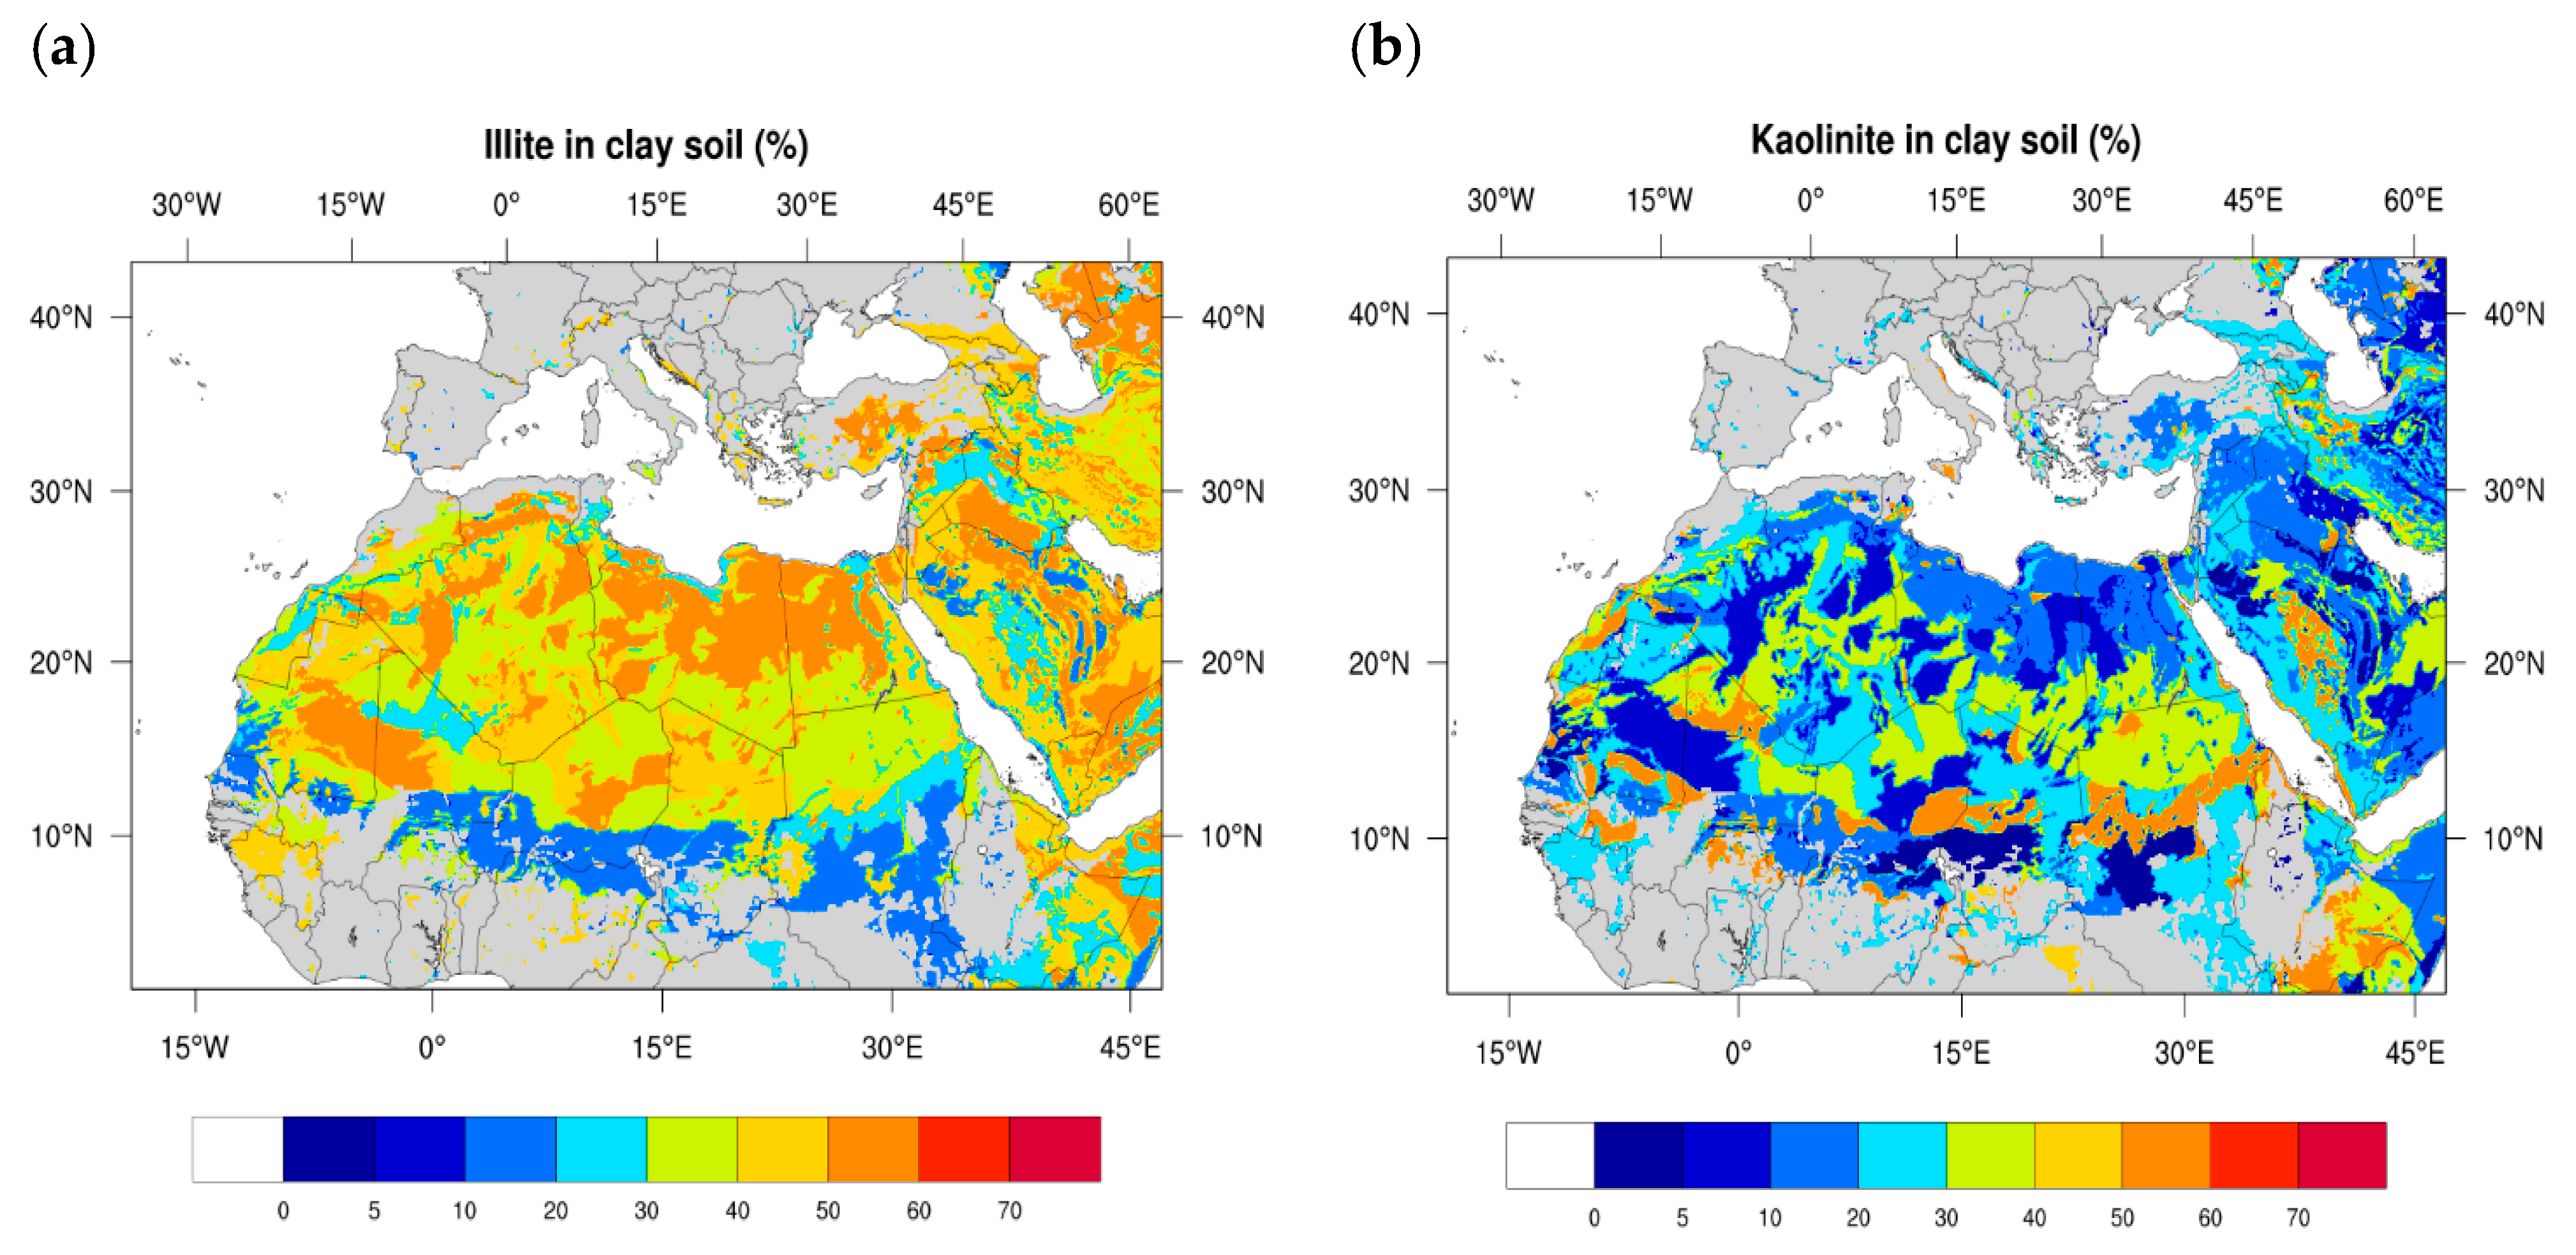
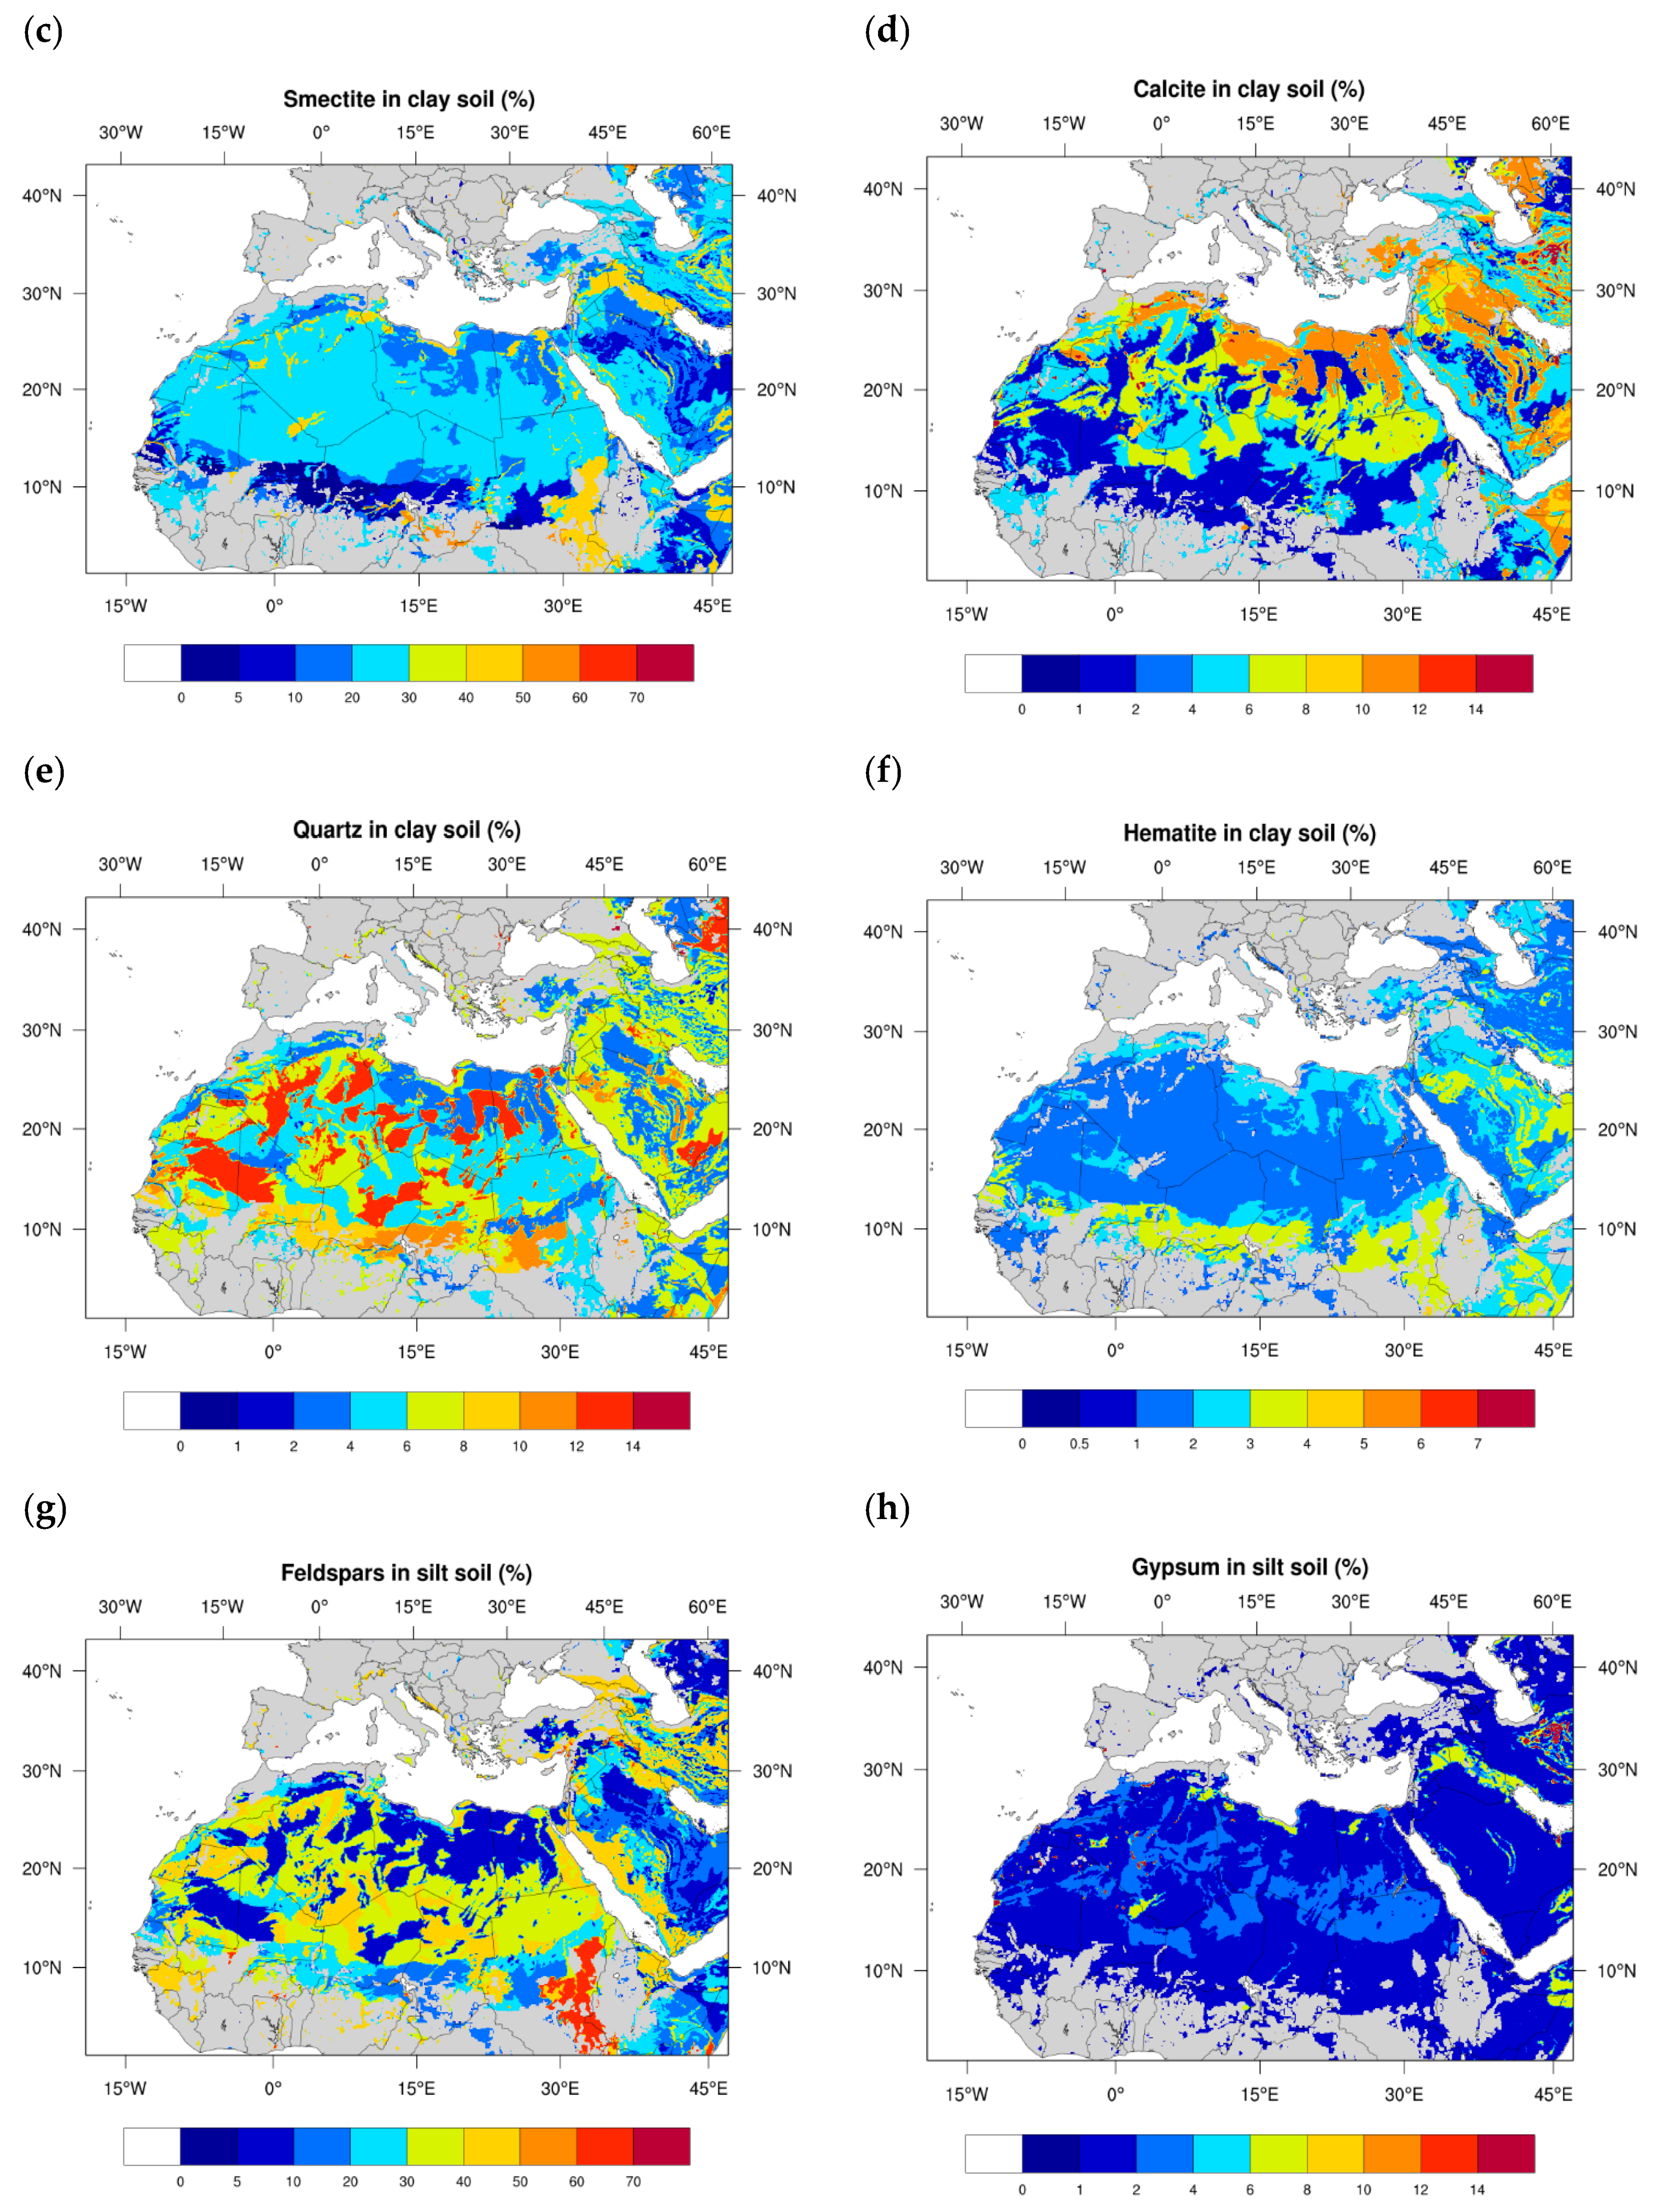
Figure 1. Global distribution of iron content (%) in arid soils.
Atmosphere 14 01615 g001
Figure 2. METAL-WRF domain setup and modeled topography (m). The locations of the two measuring stations used in this study are also indicated on the map.
Atmosphere 14 01615 g002
Figure 3. Mineral fractions in arid soils in the METAL-WRF computational domain. The presented fractions are for illite (a), kaolinite (b), smectite (c), calcite (d), quartz (e), and hematite (f) in clay soils and feldspar (g), gypsum (h), calcite (i), quartz (j), and hematite (k) in silt soils. Additionally, the iron fraction in arid soils is presented in (l).
Atmosphere 14 01615 g003aAtmosphere 14 01615 g003bAtmosphere 14 01615 g003c
Figure 4. Monthly accumulated results for August 2017 from the METAL-WRF simulation: (a) total dust load (g m−2); (b) iron load (g m−2); (c) iron dry deposition (mg m−2); and (d) iron wet deposition (mg m−2).
Atmosphere 14 01615 g004
Figure 5. Monthly elemental concentrations (μg m−3) of Si, Al, Fe, Mg, and Ca in August 2017 measured in PM10 at Izaña Observatory (nocturnal sampling: 10:00 PM–06:00 AM) and the METAL-WRF simulation.
Atmosphere 14 01615 g005
Figure 6. Monthly accumulated results for December 2017 from the METAL-WRF simulation: (a) total dust load (g m−2); (b) iron load (g m−2); (c) iron dry deposition (mg m−2); and (d) iron wet deposition (mg m−2).
Atmosphere 14 01615 g006
Figure 7. Daily accumulated elemental concentrations (ng m−3) for December 2017 at the Ayia Marina Xyliatos station (orange line) and METAL-WRF (blue line): (a) Al; (b) Ca; and (c) Fe.
Atmosphere 14 01615 g007aAtmosphere 14 01615 g007b
Figure 8. Monthly accumulated elemental concentration (μg m−3) for December 2017 at the Ayia Marina Xyliatos station and the METAL-WRF simulation.
Atmosphere 14 01615 g008
Table 1. Mineral content in clay and silt-sized fractions in selected soil types (modified from Nickovic et al., 2012 [31]).
FAO Soil Types in Arid RegionsMineral Content in Clay-Sized Fractions Normalized to 100%Mineral Content in Silt-Sized Fraction Normalized to 100%Clay and Silt
IlliteKaoliniteSmectiteCalciteQuartzHematiteFeldsparGypsumCalciteQuartzHematitePhosphorus
Lithosols40202947140165310.049
Calcic Yermosols571316113271147820.031
Yermosols34312465132285910.031
Dunes/Shifting Sand509261141611921-
Haplic Yermosols20542213224117320.031
Luvic Yermosols45202077223157020.031
Calcic Xerosols571316113271147820.034
Calcaric Regosols4239947319137530.049
Cambic Arenosols16665111414118240.04
Eutric Regosols32531015238115920.049
Othic Solonchaks316461171436223110.034
Gypsic Yermosols271840870266165700.031
Luvic Xerosols45202077223157020.034
Ferralic Arenosols23482315115118410.04
Haplic Xerosols20542213224117320.034
Rock509261141611921-
Calcaric Fluvisols2294611120392303100.03
Luvic Arenosols1078319322117050.04
Chromic Vertisols16274845462133140.079
Eutric Fluvisols18235513110128610.03
Salt3942629111269351-
Takyric Yermosols21512135180141610.031
Orthic Solonetz37321767223147120.022
Gleyic Solonchaks16322421502815205100.034
Xerosols37262475220297020.031
Gypsic Xerosols271840870266165700.034
Takyric Solonchaks2533241060661122200.034
Albic Arenosols21532104115108410.04
Table 2. Physical schemes and parameterizations used in the METAL-WRF setup.
ParameterizationSchemeReference
MicrophysicsGoddard microphysics schemeTao et al., 2016 [57]
CumulusTiedtke schemeZhang et al., 2011 [58]
Shortwave/Longwave radiationRRTMG schemeIacono et al., 2008 [59]
Surface layerEta similarity schemeJanjic, 1996, 2002 [60,61]
Land surfaceNoah Land Surface ModelTewari et al., 2004 [62]
Planetary boundary layerMellor–Yamada–Janjic schemeMesinger 1993 [63]; Janjic 1994 [64]
Dust moduleGOCART simple aerosol schemeGinoux, 2001 [45]
Dust emission scheme AFWALeGrand et al., 2019 [46]
Table 3. Percentage abundance of Si, Al, Mg, and Ca (%) for each mineral simulated in this work (source: Pérez et al., 2016 [52]).
Silicon (Si)Aluminum (Al)Magnesium (Mg)Calcium (Ca)
Illite24.1110.470.851.45
Kaolinite20.2720.420.020.03
Smectite27.448.571.210.91
Calcite 40.04
Quartz46.74
Feldspar25.2410.960.153.84
Gypsum 23.28
Disclaimer/Publisher’s Note: The statements, opinions and data contained in all publications are solely those of the individual author(s) and contributor(s) and not of MDPI and/or the editor(s). MDPI and/or the editor(s) disclaim responsibility for any injury to people or property resulting from any ideas, methods, instructions or products referred to in the content.

