Article

Estimates of Global Forest Fire Carbon Emissions Using FY-3 Active Fires Product

1
State Key Laboratory of Remote Sensing Science, Aerospace Information Research Institute, Chinese Academy of Sciences, Beijing 100101, China
2
College of Resources and Environment, University of Chinese Academy of Sciences, Beijing 101408, China
*
Author to whom correspondence should be addressed.
Atmosphere 2023, 14(10), 1575; https://doi.org/10.3390/atmos14101575
Submission received: 31 August 2023 / Revised: 7 October 2023 / Accepted: 16 October 2023 / Published: 18 October 2023
(This article belongs to the Special Issue Remote Sensing Measurement of Greenhouse Gases Emission)

Abstract

:
Carbon emissions from forest fires release large amounts of carbon and have important implications for the global and regional carbon cycle and atmospheric carbon concentrations. Considering the significant spatial and temporal variations in different forest fires, this study explores the relationship between different forests and carbon emissions from forest fires. This study developed a high-resolution (0.05° × 0.05°) daily global inventory of carbon emissions from biomass burning during 2016–2022. The inventory estimates of carbon emissions from biomass burning are based on the newly released FY-3 data product, satellite and observational data of biomass density, and spatial and temporal variable combustion factors. Forest fire carbon emissions were assessed using active fire data from FY-3 series satellites from 2016 to 2022, and it was linearly compared with GFED, FEER, and GFAS data on time and spatial scales with R2 of 0.7, 0.73, and 0.69, respectively. The results show spatial patterns of forest cover and carbon emissions, with South America, Africa, South-East Asia, and northern Asia as high-emission zones. The analysis shows an overall upward trend in global forest fire carbon emissions over the study period. Different types of forests exhibited specific emission patterns and temporal variations. For example, most needleleaf forest fires occur in areas with low tree cover, while broadleaf forest fires tend to occur in areas with high tree cover. The study showed that there was a relationship between inter-annual trends in forest fire carbon emissions and land cover, with biomass burning occurring mainly in the range of 60–70% tree cover. However, there were also differences between evergreen broadleaf forest, evergreen needleleaf forest, deciduous broadleaf forest, deciduous needleleaf forest, and mixed forest indicating the importance of considering differences in forest types when estimating emissions. This study identifies the main sources of carbon emissions from forest fires globally, which will help policymakers to take more targeted measures to reduce carbon emissions and provide a reliable basis for appropriate measures and directions in future carbon mitigation actions.

1. Introduction

Global carbon emissions are one of the main drivers of climate change and are closely linked to global warming [1]. According to the assessment report of GCB2022 (Global Carbon Budget 2022), the concentration of carbon dioxide in the atmosphere has been increasing at an annual rate of about 2.92 ppm/year in the last decade, and the rate of increase is still high [2]. Global carbon emissions have been increasing over the last decades, with biomass combustion emissions playing an important role. According to statistics from Global Fire Emissions Database v4.1s (GFED4.1s), the global average annual biomass combustion emissions have been around 2142 Tg/year over the past 27 years [3], showing a steady fluctuating trend. This data indicates that biomass combustion plays an important role in global carbon emissions and poses a new challenge to global climate change.
Currently, the total global forest area is 36.92 × 10⁸  hm 2 , which accounts for about 24.78% of the total global land area [4]. Global biomass burning is mainly included forest fire, grassland burning, and crop residue burning in agricultural fields [5], and different types of biomass burning have significant impacts on biomass combustion emissions, while biomass burning caused by forest fires is the largest contributor to the total biomass combustion emissions [6]. Lazaridis et al., estimated that the contribution of forest fire to atmospheric pollution during the period 1997–2003, the average contribution to PM 10 concentration in the burning area and surrounding area (about 500 km) is 50%, and the maximum value is 80%. For CO, the average contribution during combustion is 50% [7]. Based on estimates of forest fires, ZHENG et al., concluded that “forest fire emissions are increasing despite the global decrease in burned area” [8].
In addition, the distribution of forest types and vegetation cover varies significantly among regions around the globe, and this variability is not only manifested in the distribution of tree species [9], but also encompasses a variety of factors, such as soil type, precipitation, and seasonal variations in different regions, which collectively determine the outcome and extent of forest fires carbon emissions [10]. For example, in coniferous forests in cold northern regions, longer winters and cooler conditions can lead to wilting and drying of vegetation, increasing the risk of forest fires [11]. In contrast, broadleaf forests in temperate and tropical regions are more susceptible to human activities such as agricultural burning and forest land clearing, which may increase the frequency and magnitude of biomass burning [12]. Globally, the relationship between tree cover and forest fires carbon emissions also shows significant regional differences [13]. Biomass combustion emission patterns vary from region to region due to geographic location and climatic conditions [14]. For example, tropical rainforest areas are hot and humid all year round and have a lower fire frequency [15], whereas boreal forest in arid regions are more prone to biomass burning [16]. Distinct forest types exhibit diverse patterns when it comes to biomass burning.
The FY-3 series of meteorological satellites is a new generation of polar-orbiting meteorological satellites independently developed and operated by China for Earth observation and meteorological monitoring missions [17]. The FY-3D integrates the MERSI II sensor to provide more detailed characterization, and the GFR product combines methods such as dynamic thresholding and infrared gradients to better identify fires with an overall accuracy of over 85%. Compared to the most widely used MODIS fire products, the FY-3D fire products are 79.43% and 88.50% more accurate overall and without omission errors [18], respectively. Therefore, it is more advantageous in quantifying global fire carbon emissions.
Against this background, this study examines global fire carbon emissions under different types of forests and vegetation cover. Specifically, the study (1) develops a new forest fires carbon emissions inventory for the first time using the FY-3 series of Global Fire Range Monitoring (GFR) data, providing an alternative forest fire emission inventory based on new data; (2) optimized and improved some of the parameters of the emission inventory by combining a variety of data sources and methods. This includes the use of AGB(Above Ground Biomass) data to replace the single assignment of fuel loading in the previous inventory, which solves the discontinuity of fuel loading in some areas, and the optimization and improvement of the previous method of single assignment or simple function definition for the calculation of combustion factor for forests, and the combination of multiple types of data (NDVI, Tree Cove, Land Cover) to provide a new type of forest fire combustion factor; (3) explores the global forest fire carbon emissions over the past seven years (2016–2022) and analyze and discuss the causes of the trend in emissions based on different types of forests. This estimation of global forest fire carbon emissions inventory not only reveals the profound connection between different types of forests and vegetation and emissions from biomass burning but also provides us with new perspectives and a scientific basis for combating climate change and protecting ecosystems. The contribution of this study is that it provides us with strong support for an in-depth discussion of the global carbon cycle and carbon balance. Accurate carbon accounting not only reveals the flow of carbon within the ecosystem but also provides us with in-depth analyses of the impacts on the atmospheric carbon balance, which in turn provides substantive strategies and guidance for addressing climate change. In the context of climate change, it is particularly important to understand the importance of carbon emissions from forest fires, which can provide a quantitative reference for global carbon inventories.

2. Materials and Methods

2.1. Emission of Global Forest Fire Carbon Emissions

This study uses the bottom-up approach as other area-of-burn-based emission inventories [19], which is widely used in biomass burning inventory production processes [20,21], with the overall equation defined as:
E x , i = B A x × F L x × C F x × E F x , i ,
where the emissions of pollutant type i at location x ( E x , i , g / m 2   ) are the product of the burned area at location x ( B A x , m 2 ), the fuel loading ( F L x , g / m 2 ), the combustion factor ( C F x , fraction), and the emission factor ( E F x , i , g / kg ). All biomass terms are on a dry weight basis. This study uses fire detection data available from the FY-3 series of satellites. However, for the default model described here, the location and timing of fires are determined globally by the FY-3 product. For other correlation coefficients and data descriptions, a detailed description is provided in subsequent sections.

2.2. Data

This study employs active fire data (2016–2022) from the FY-3 series of satellites to assess global forest fire carbon emissions. FY-3 GFR Data as the main product of the FY-3 series of satellites [22], GFR data are generated once a day and include detection information for each fire site (http://satellite.nsmc.org.cn/PortalSite/Data/Satellite.aspx, accessed on 18 October 2020). Compared with MODIS products, the overall accuracy of FY-3 and the accuracy without considering omission errors are 79.43% and 88.5% higher, respectively. FY-3 can detect fires with a resolution of about 1000 m 2 , so to increase the information such as small fires and fires’ edges, we added convolution operation and extract information such as latitude, longitude, confidence, and fires detection time. In this study, we resampled 1 km resolution data to 5 km data to calculate carbon emissions from global forest fire carbon emissions and to assess emissions over 7 years (2016–2022).
We also used a NDVI product [23] (MODIS Combined 16-Day NDVI, https://lpdaac.usgs.gov/products/mcd43a4v061/, accessed on 18 October 2020) in this study, and the NDVI product was primarily used for the estimation of relevant parameters to determine global forest fire carbon emissions.
The IGBP (International Geosphere-Biosphere Programme) categorized data from the MODIS Land Cover Type product [24] (MCD12Q1, https://lpdaac.usgs.gov/products/mcd12q1v061/, accessed on 18 October 2020) was used for the main subsequent emission assessment analysis of different types of forests. For Tree Cover data we used the MOD44B product [25] (https://lpdaac.usgs.gov/products/mod44bv061/, accessed on 18 October 2020), and carbon emission analysis based on different feature cover types and Tree Cover is the main component of this study. To maintain consistency with the GFR data structure, we resampled all data to 5 KM to facilitate the estimation of global forest fire carbon emissions and the correlation between emissions and other factors.

2.3. Reclassify

The first step in estimating global forest fire carbon emissions is to categorize the land cover to differentiate different types of global forest fire carbon emissions. We first classified the world into different regions to facilitate the calculation and subsequent analysis (Figure 1). For the Land Cover Type (LCT) product, there are 17 IGBP classification results, and this study focuses on forest biomass combustion emissions [26]. We reclassified the land cover type of forests into tropical forests, temperate forests, and boreal forests by combining the information on latitude and longitude (as shown in Table 1).

2.4. Fuel Loading, Combustion Factor, and Emission Factor

In this study, we used the international geosphere-biosphere program (IGBP) classification product in MODIS LCT MCD12Q1 as the basic data for biomass estimation, and the Figure 2 shows the global land cover distribution in 2022, in which ENF is mainly distributed in North America, northern Europe, and Siberia, EBF as the most important forest type is mainly distributed in South America, South Africa, and Southeast Asia. DNF is less common and is mainly distributed in Siberia and northern China, while DBF is distributed in North America, South America, Europe, and northern China, and MF is mainly distributed in North America and the northern part of the Asian-European continent. In this study, we adopted a dynamic approach to the biomass estimation process for each year, using the previous year’s land use data, which allowed for a better assessment of global forest fire carbon emissions. Biomass was distributed according to global regions and general vegetation types and was update in the different regions (as shown in Table 2). We use this data as a base and combine it with a variety of other data sources for homogenization, including Global Forest Database (GFD, https://iiasa.ac.at/models-tools-data/global-forest-database, accessed on 18 October 2020) and Global Forest Watch (GFW, https://data.globalforestwatch.org, accessed on 18 October 2020).
For combustion factors, which are generally assigned according to vegetation type, in this study, we combined the vegetation index data to dynamically adjust the emission factors, and the combustion factors were calculated as follows [27]:
c f = 1 e m c f ,
where mcf is the moisture category factor [28], and we continue mcf calculation.
m c f = 0.1759 × e 3.5181 × v c i ,
v c i = N D V I t N D V I m i n N D V I m a x N D V I m i n ,
where v c i (Vegetation Condition Index) is mainly used for the quantification of vegetation dryness in the same period. For N D V I t we selected the NDVI data [29] closest in time to the fire event, while N D V I m i n and N D V I m a x represent the minimum and maximum NDVI values, respectively, during the same period of the image element in which the fire event occurred (the previous 3 years).
Emission factors are generally set in relation to land cover, and there have been many measurements of emission factors since the development of global forest fire carbon emissions inventories began. We used updated and reliable emission factors (as shown in Table 3) from recent publications for setting to ensure the scientific accuracy of the inventory [30,31,32,33].

3. Results

3.1. Spatial Patterns of Carbon Emissions

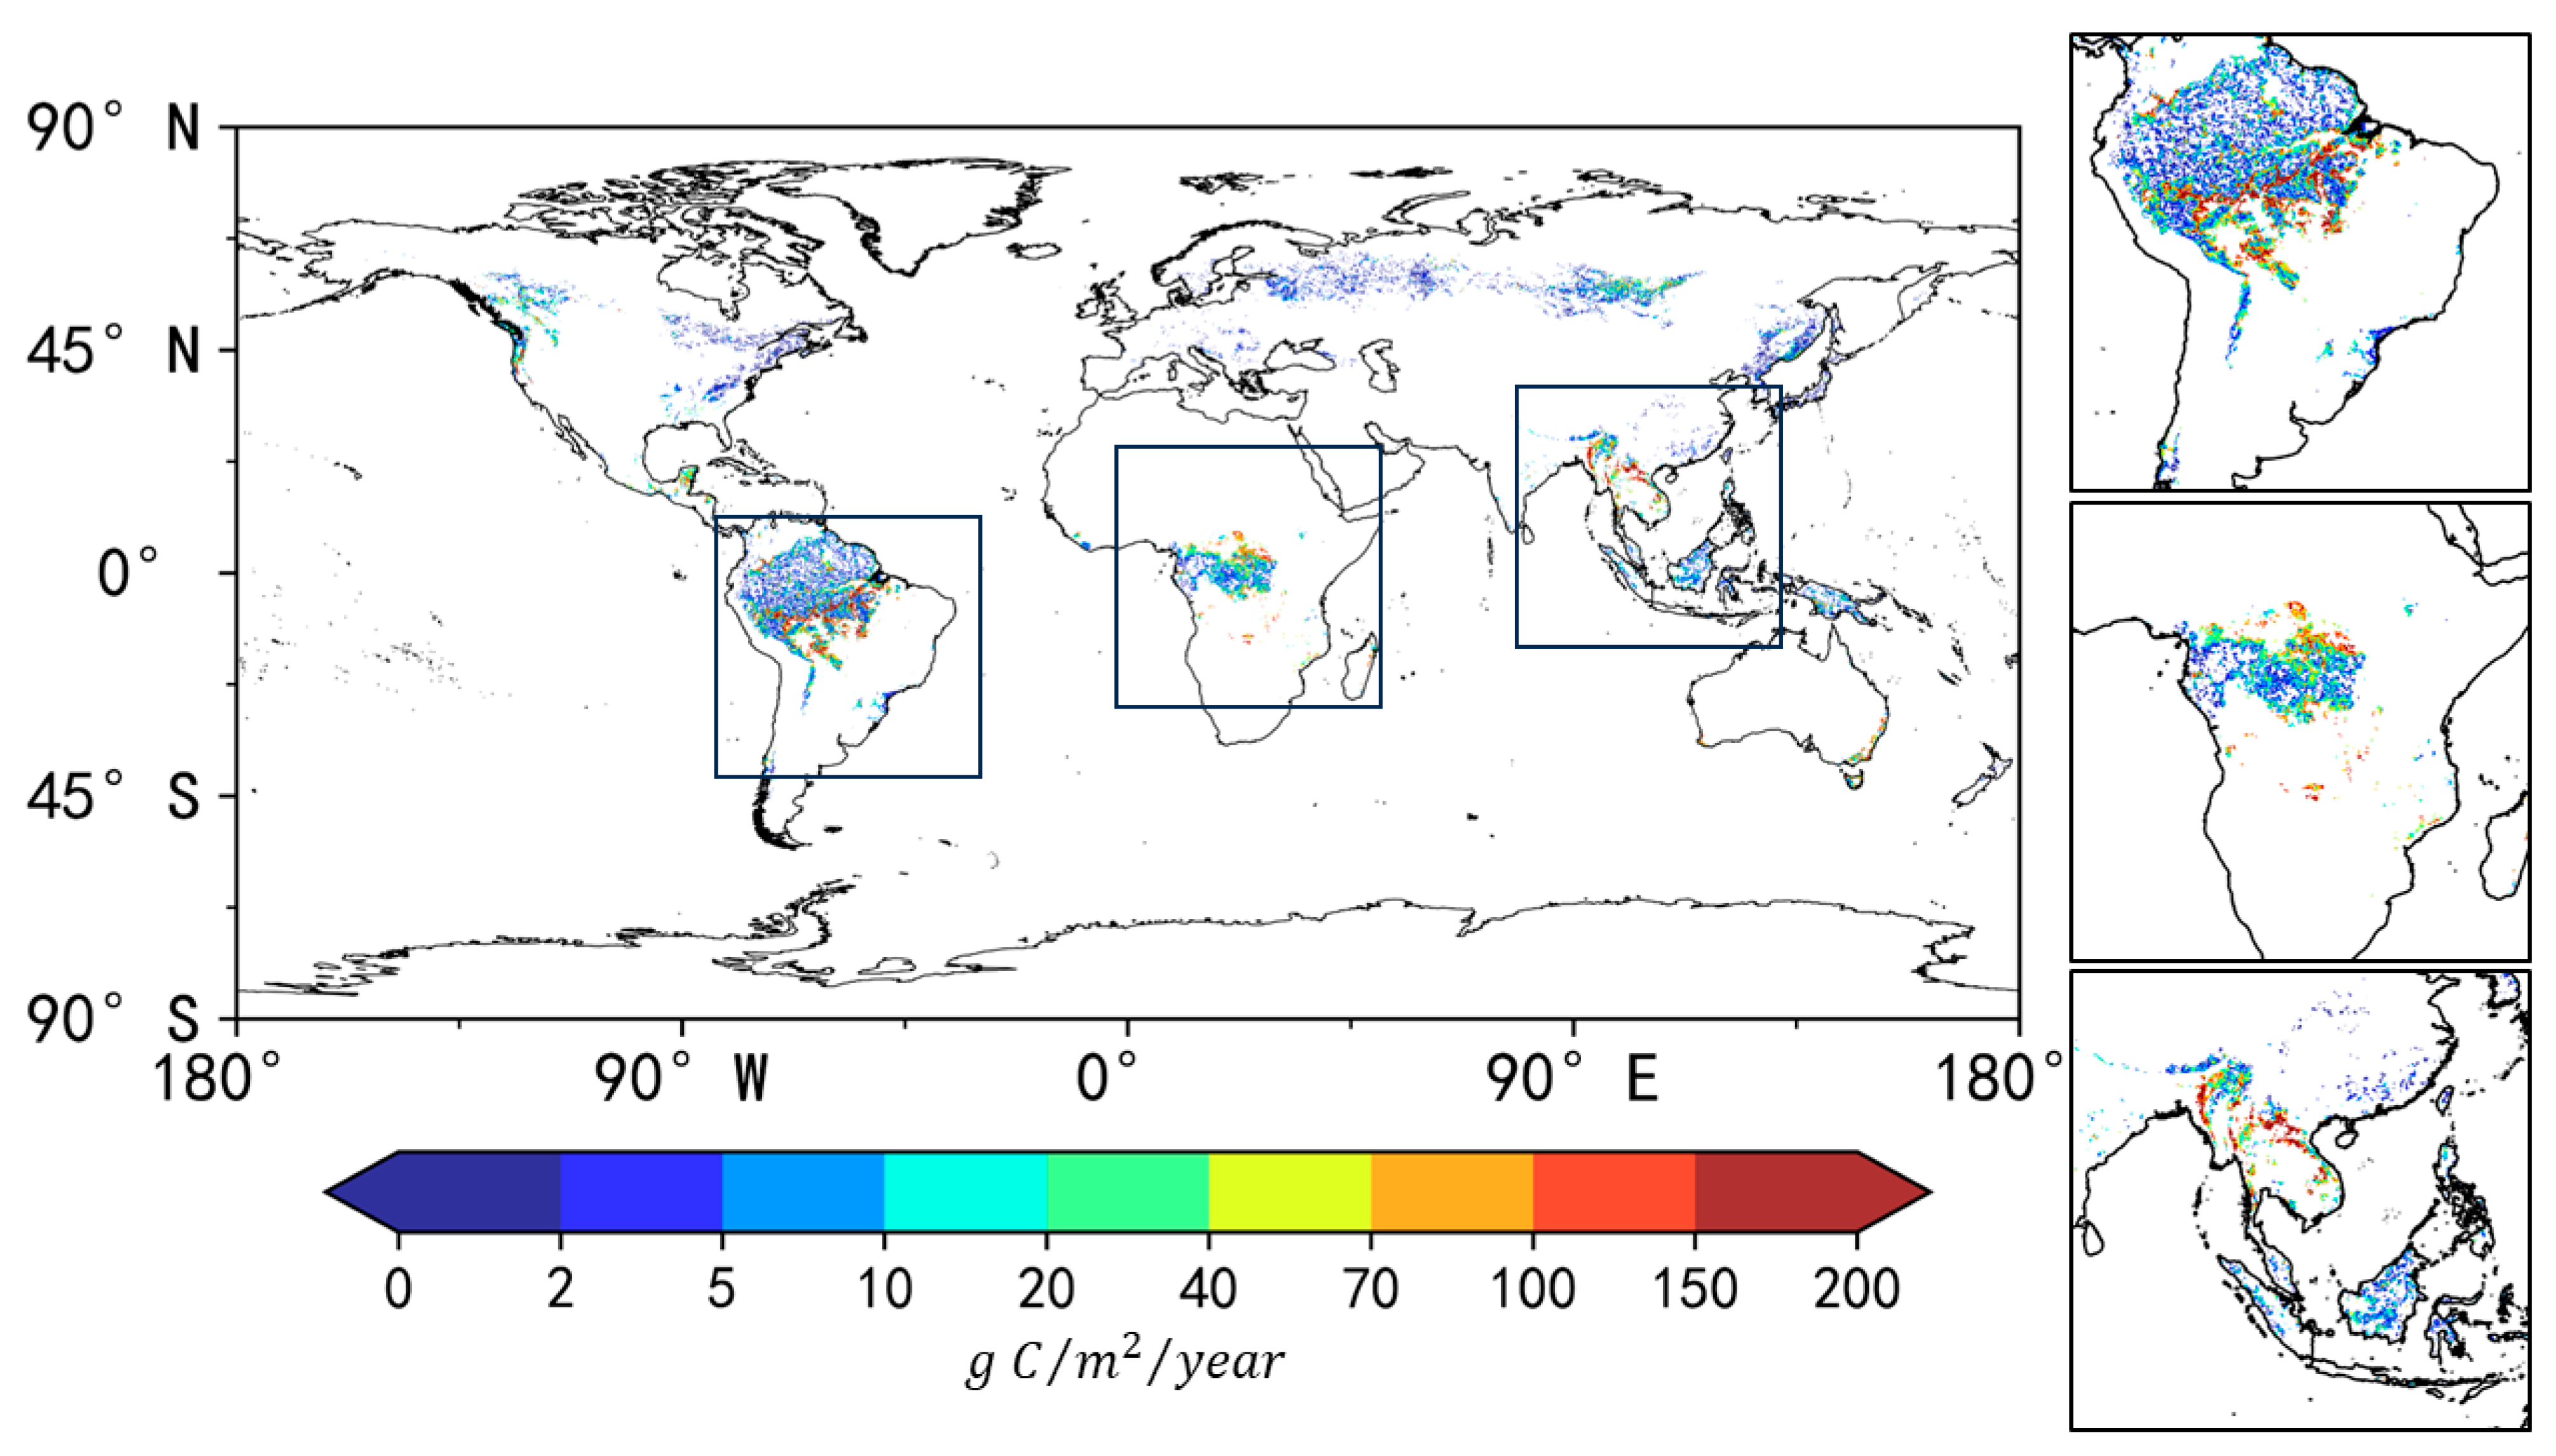
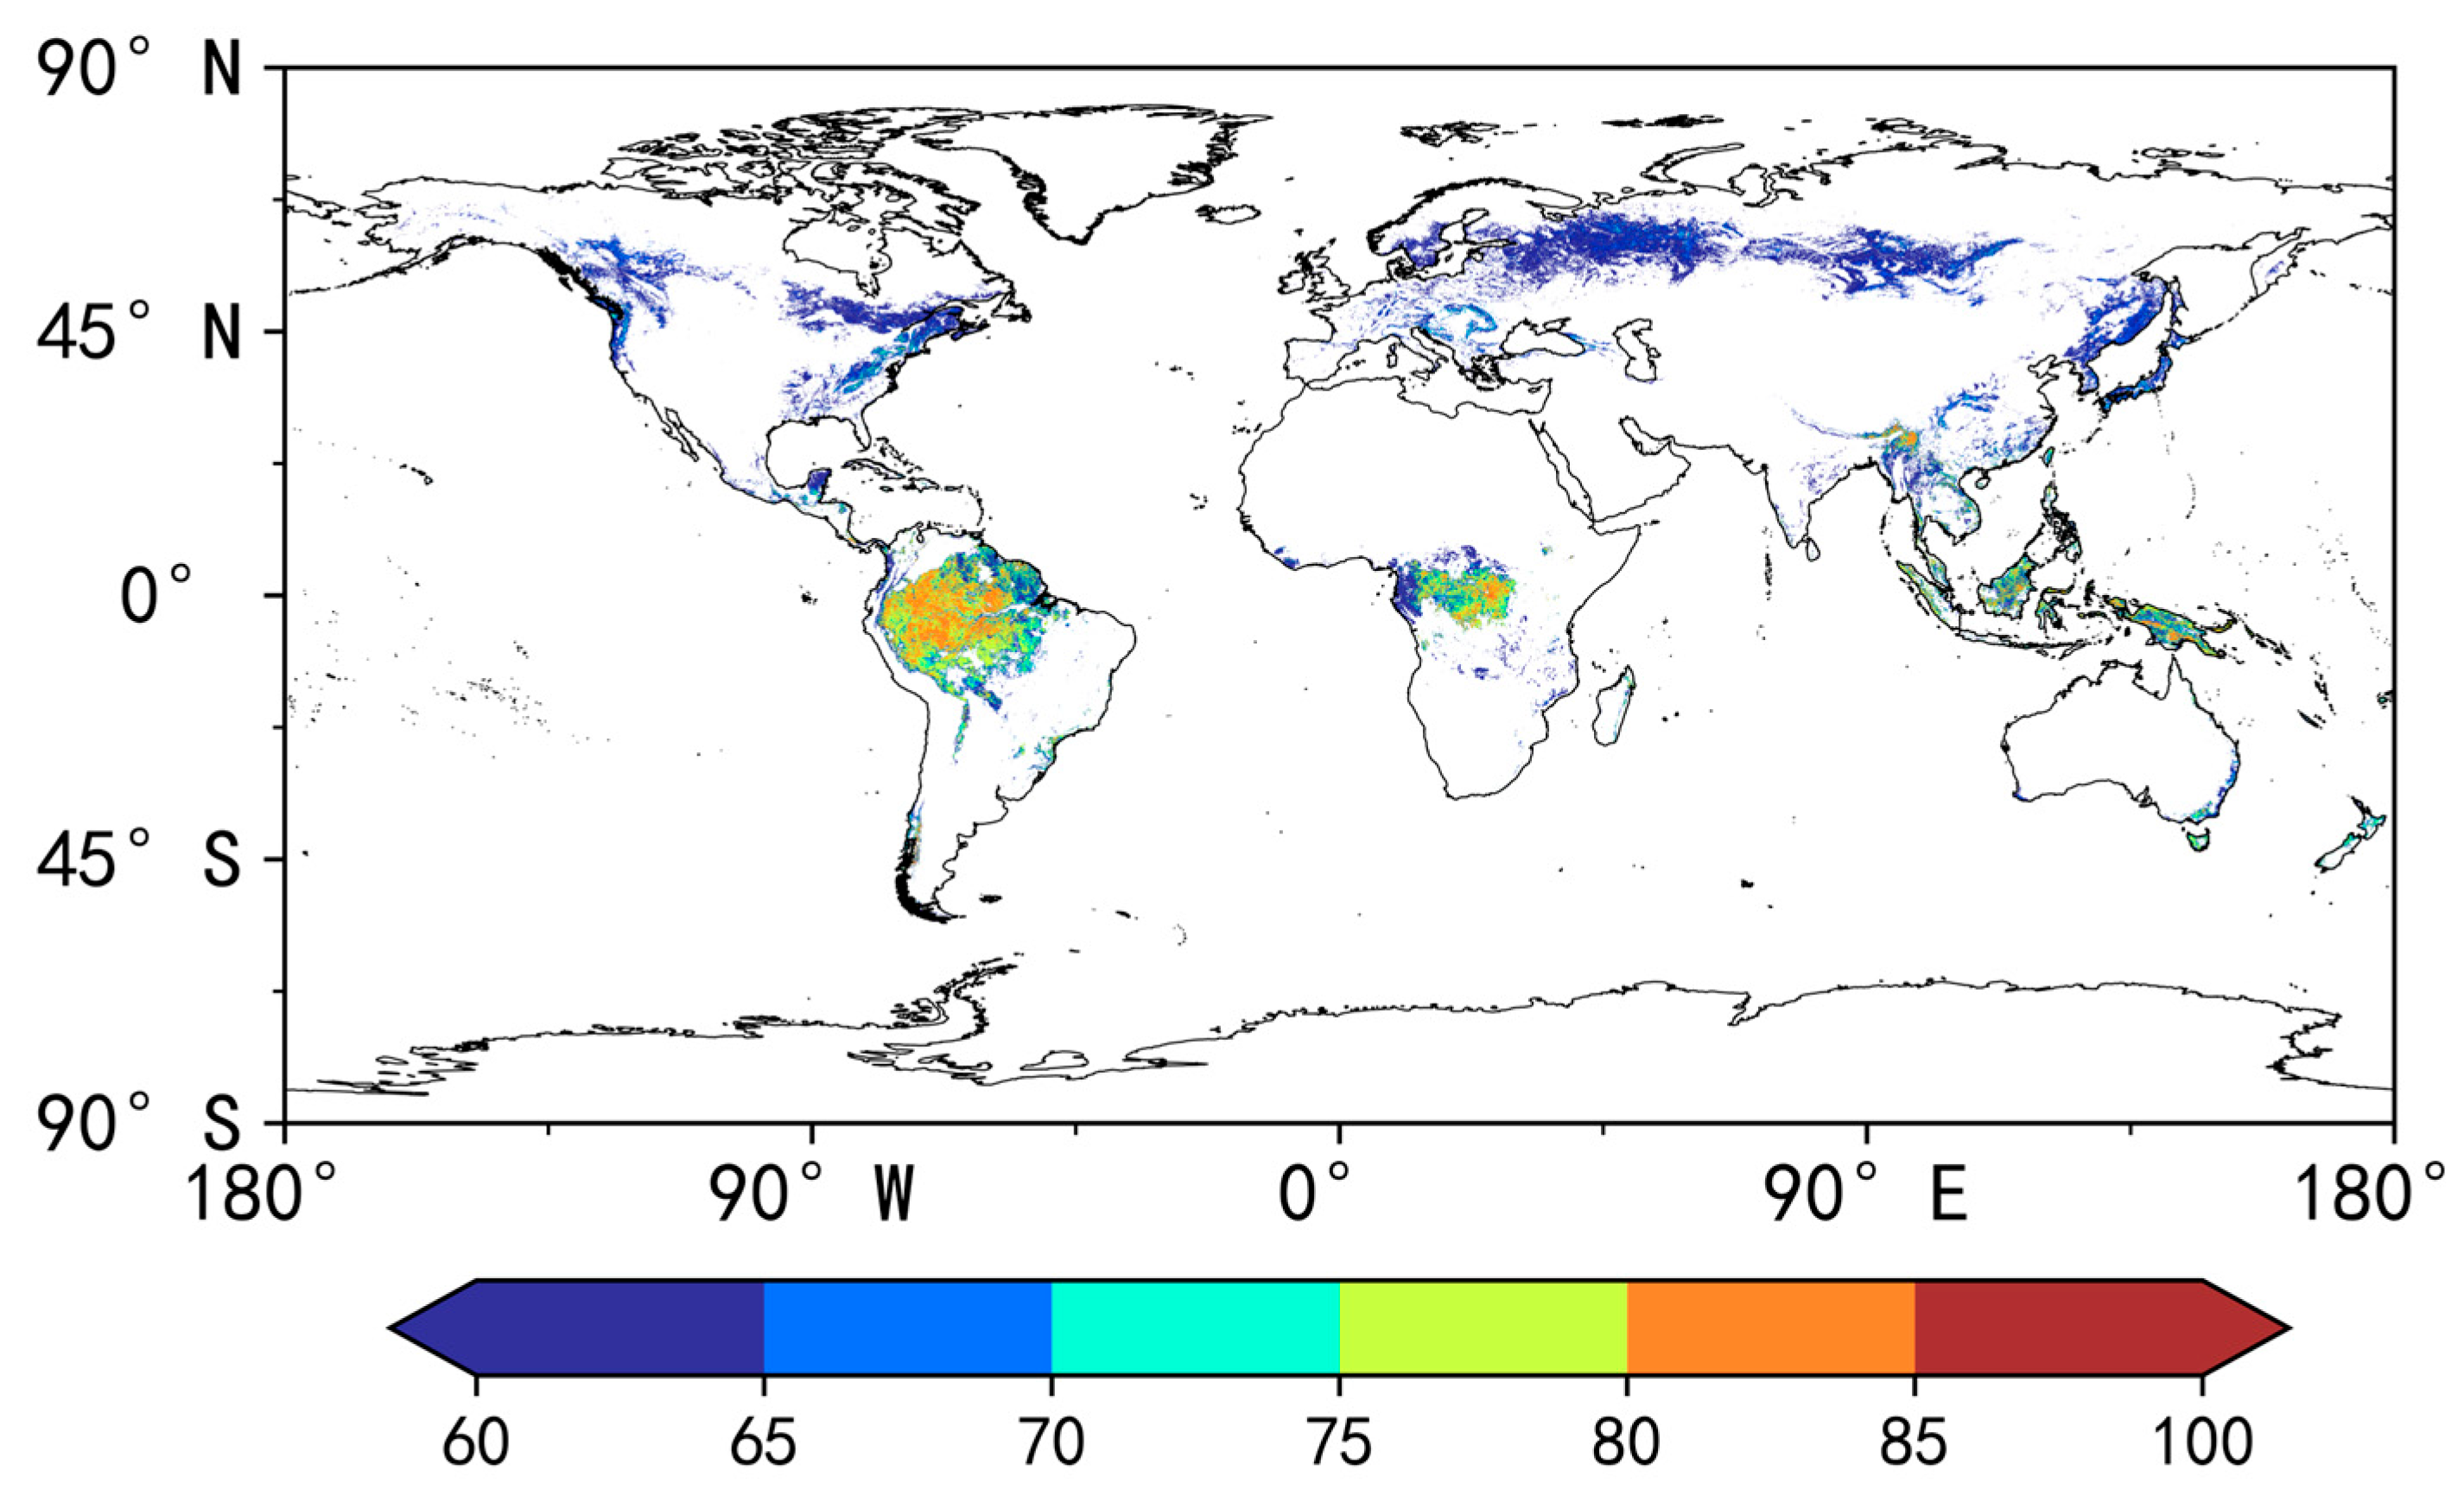
Global forest fire carbon emissions are characterized not only by significant changes in time but also by different spatial distributions. Figure 3 shows the spatial characteristics of the global annual average global forest fire carbon emissions (2016–2022). Our study shows that the forest fire carbon emission globally is about 3439 Tg during the last 7 years. Globally, there are high forest fire carbon emitting regions such as SHSA (Southern Hemisphere South America), SEAS (Southeast Asia), SHAF (Southern Hemisphere Africa), NHAF (Northern Hemisphere Africa), and BOAS (Boreal Asia), of which SHSA has the highest carbon emissions from forest fire of about 1405 Tg (40.84%), followed by SEAS, SHAF, NHAF, and BOAS, which emit 564 Tg (16.40%), 426 Tg (12.38%), 284 Tg (8.26%), and 181 Tg (5.425%), respectively, with the total amount of 1454 Tg (42.28%).While the emissions from CEAS (Central Asia), EURO (Europe), and MIDE (Middle East) are at a lower level in recent years the emissions are about 19 Tg, 7 Tg, and 3 Tg, respectively, which total to about 0.82% of the total global forest fire carbon emissions. This spatial distribution is on the one hand due to arid climate (Africa, Boreal Asia), high annual temperature (South America, Africa, Southeast Asia), and other factors, and overall shows a kind of equatorial/inland high forest fire carbon emissions zone. On the other hand, it is caused by the different distribution of global forests, global forests are mainly dominated by EBF and MF, of which EBF is mainly distributed in the tropical regions of South America (the main range of vegetation cover is 75–85%), Africa (the main range of vegetation cover is 70–80%) and Asia (the main range of vegetation cover is 75–80%) in the tropics, and MF is mainly found in the boreal regions of North America and Asia (with a vegetation cover of about 60–70%) (Figure 4).
Different types of forests burn differently due to their unique moisture content, dryness, growth conditions, and planting density. This variability directly affects the emissions produced when biomass is burned. When fires occur, differences in combustion conditions, such as the adequacy of combustion and rapidity of spread, also lead to different spatial distributions of carbon emissions.

3.2. Temporal Patterns of Global Forest Fire Carbon Emissions

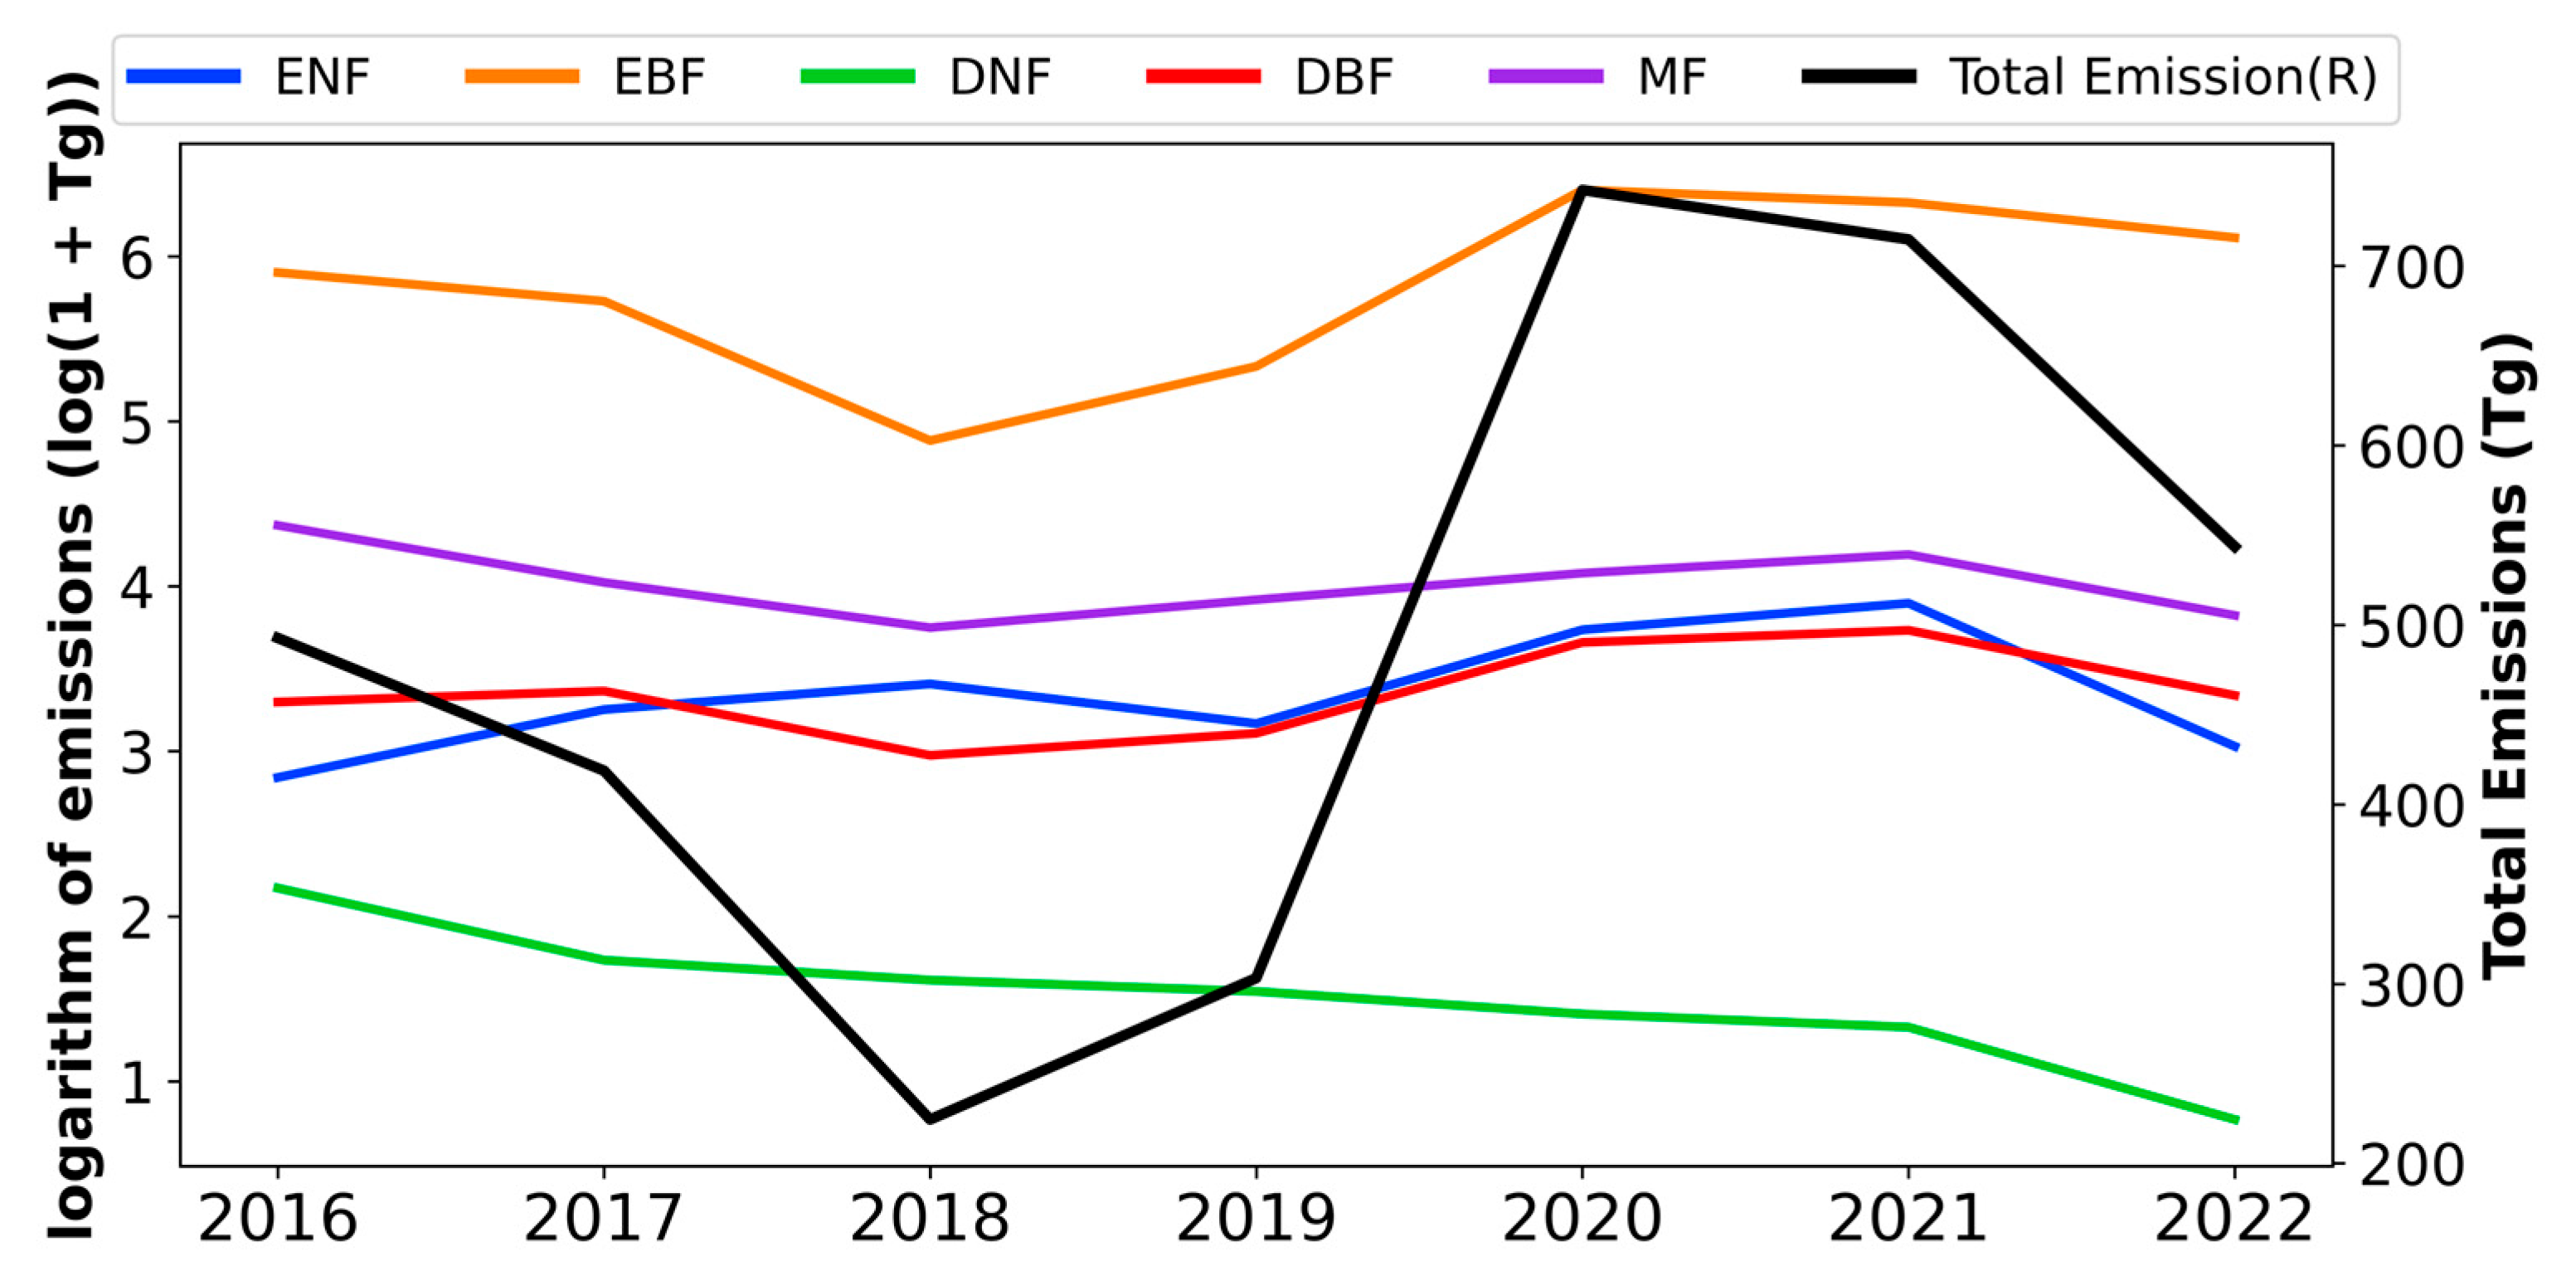
In this study, global forest fire carbon emissions were estimated for the period from 2016 to 2022. It was found that the total global forest fire carbon emissions showed an increasing trend during this period, with an average annual emission of about 491 Tg (Figure 5). The peak was reached in 2020, with a total annual emission of about 742 Tg. Among these emissions, as the most dominant type of forest biomass combustion, the biomass combustion carbon emissions from evergreen broadleaf forest (EBF) were 374 Tg/year, which accounted for about 76.14% of the total emissions, followed by mixed forests (MF), evergreen needleleaf forest (ENF), deciduous broadleaf forests (DBF), and deciduous needleleaf forests (DNF). Their biomass-burning carbon emissions were 56 Tg/year (11.39%), 29 Tg/year (5.81%), 29 Tg/year (5.81%), and 4 Tg/year (0.79%), respectively. However, despite the smallest share of forest fire carbon emissions in DNF, its carbon emissions showed a decreasing trend, which may be related to the reduction of forested areas in the region or effective measures of forest fire management.
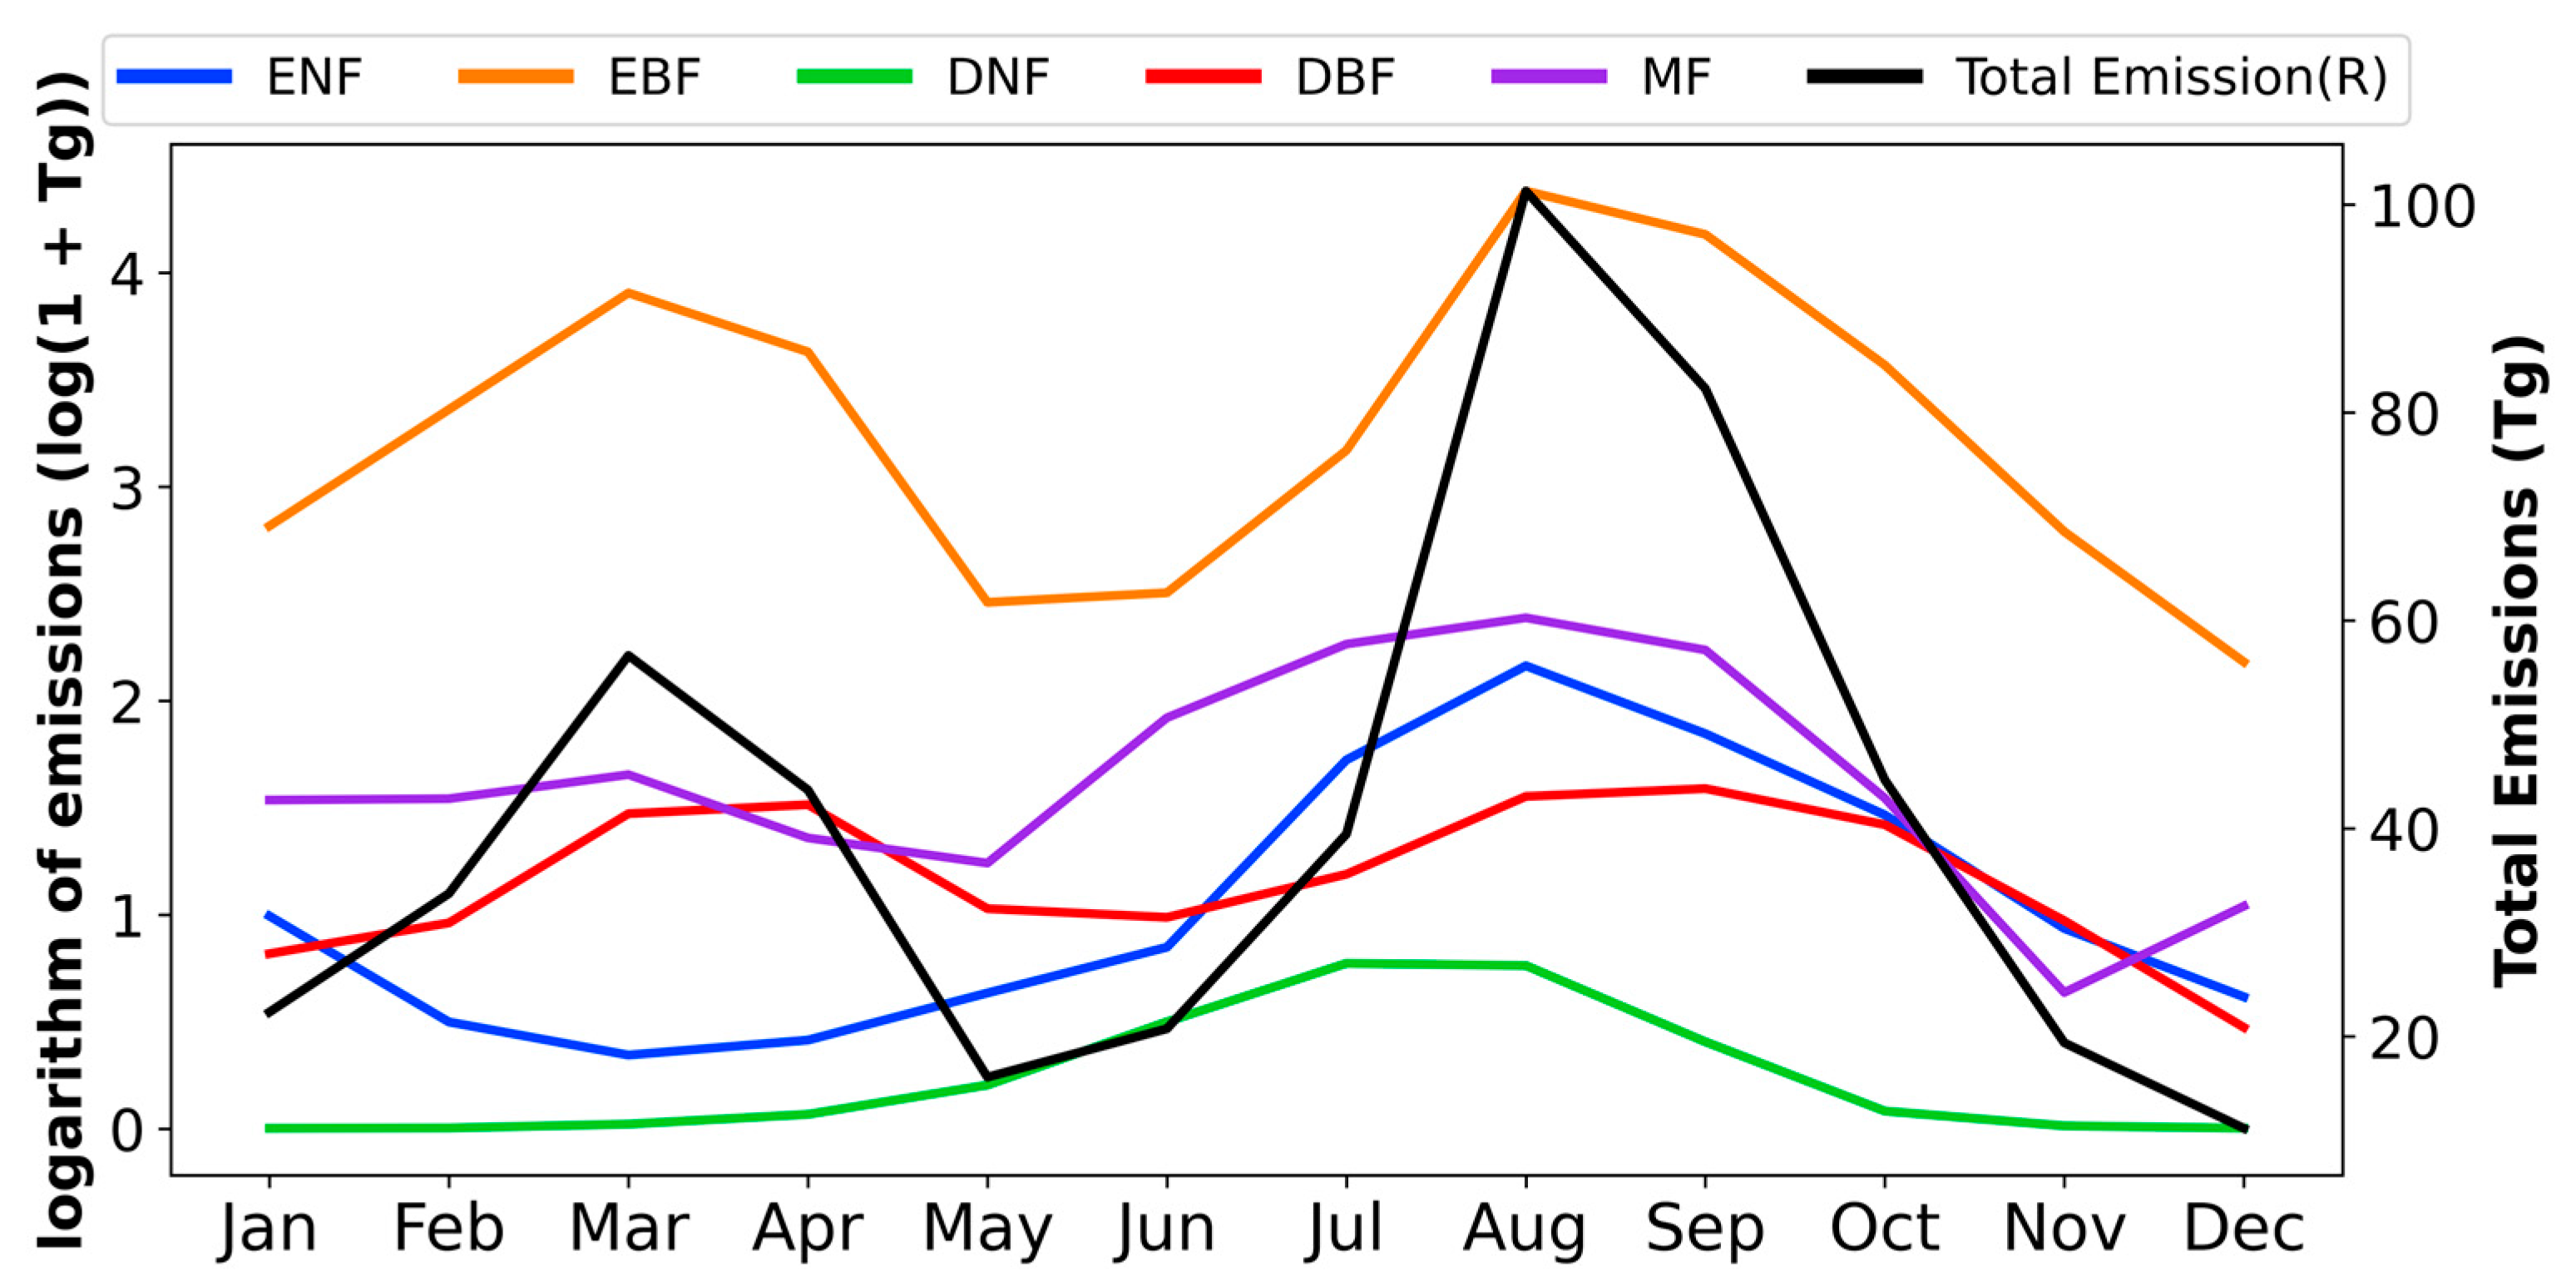
In addition, the study analyzed the emission results on a monthly scale (Figure 6, 2016–2022 average monthly emissions) and found that global forest fire carbon emissions showed two peaks in March and August of each year. The first peak occurred in March with emissions of about 56.62 Tg, which was mainly influenced by EBF (48.61 Tg), MF (4.22 Tg), and DBF (3.35 Tg), contributing 85.84%, 7.46%, and 5.92%, respectively. The second peak appeared in August with an emission of about 101.31 Tg, which was mainly influenced by EBF (78.87 Tg), MF (9.87 Tg), and ENF (7.69 Tg), contributing 77.85%, 9.75%, and 7.59%, respectively. For different types of global forest fire carbon emissions, the trend on the monthly scale is also different, as the main emitting forest types EBF and DBF, show the same two peaks as the overall emission trend, while the other types have only a single peak in August.
There are a number of potential sources of error in the study that could have an impact on the results. On the one hand, the accuracy and resolution of satellite data may affect the estimation of carbon emissions [34]. Although the FY-3 series of satellites provide valuable information (check Supplementary Material), their accuracy is affected by the performance of satellite sensors, cloud cover, and uncertainties in data processing [35]. In addition, there may be errors in the detection and identification of fires, especially for small-scale fires, which may result in unaccounted-for emissions in the inventory [36]. Another potential source of error is uncertainty in the modelling assumptions. In the study, forest cover and land use types were correlated with carbon emissions, based on the assumption that different types of forests produce different amounts of carbon emissions when burned. However, these assumptions may not be entirely accurate because carbon emissions from forest fires are affected by a variety of factors, including the intensity of the fire source, the timing of the fire, and the rate at which the fire spreads.
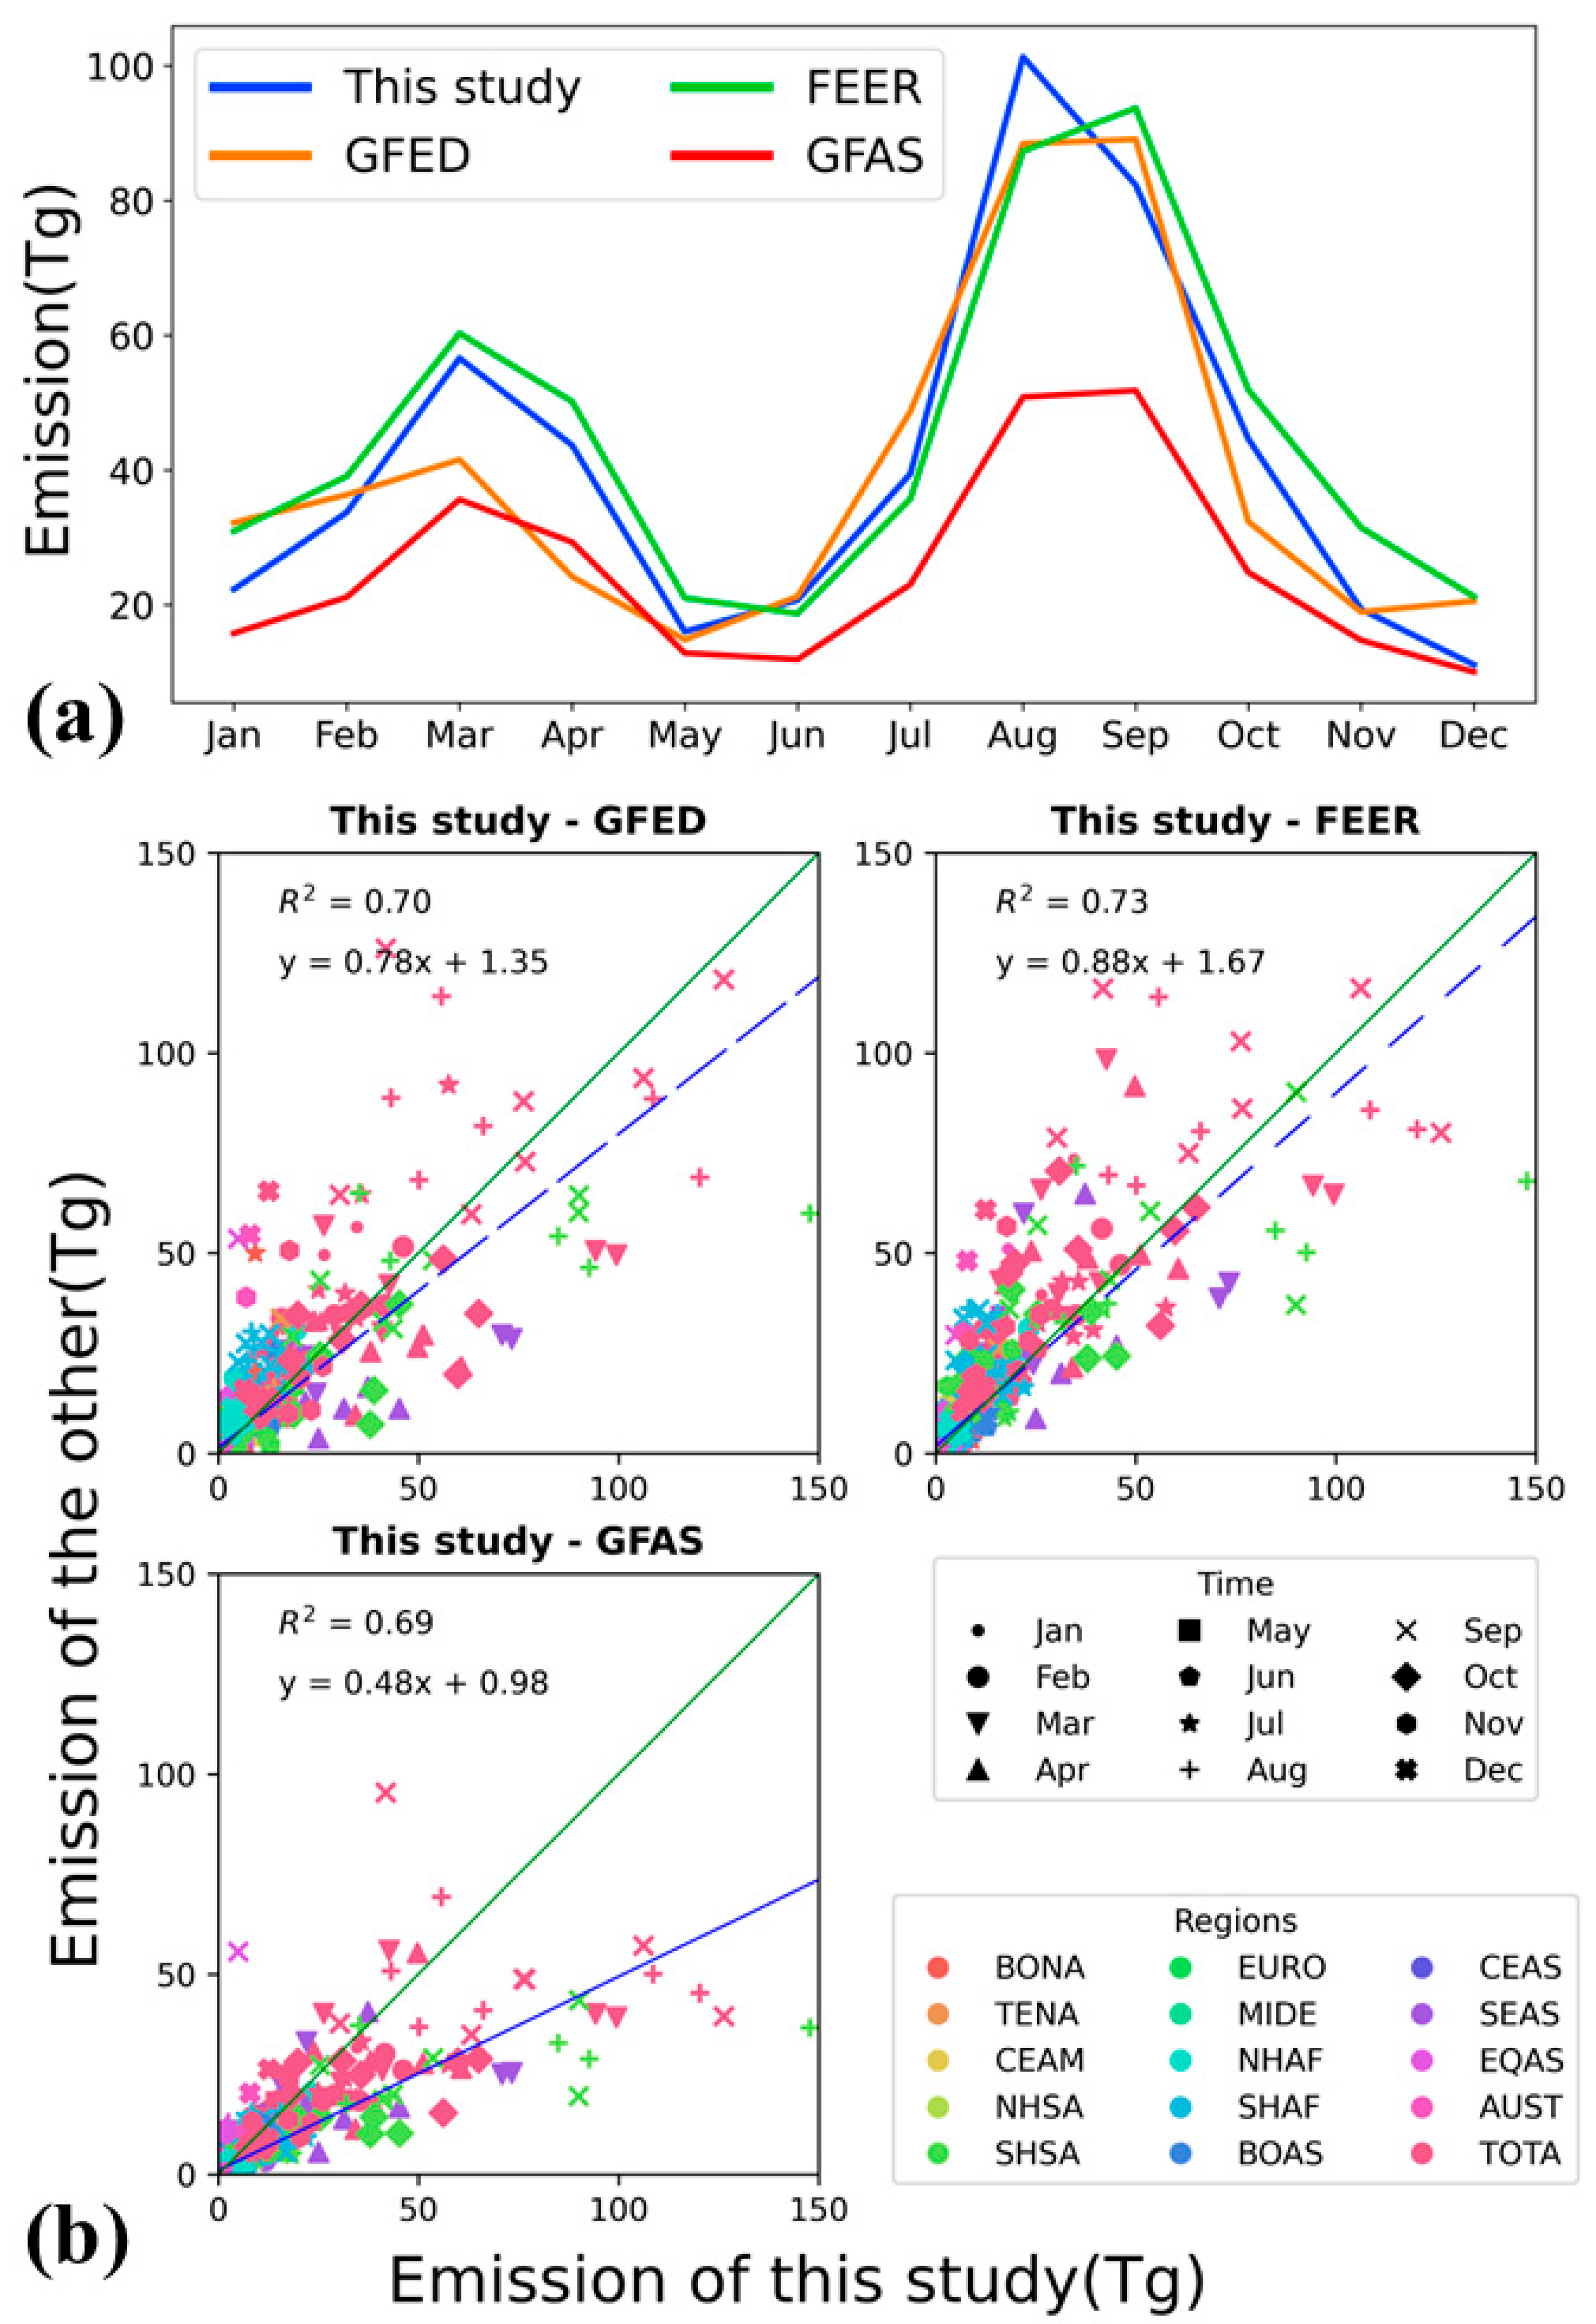
On a global monthly scale, this study provides a detailed comparison of global forest fire emissions results with the most widely used datasets currently available, including GFED (Global Fire Emissions Database), GFAS (Global Fire Assimilation System), and FEER (Fire Energetics and Emissions Research). As shown in Figure 7, on the time scale, this study exhibits significant consistency with the other datasets. Overall, GFAS records were low in terms of quantification in March and August, whereas GFED existed with low values in terms of quantification in March. However, the quantification of GFED showed significant consistency at the peak in August. In addition, this study is more consistent with the results of the full-year comparisons of FEER and is also in line with all data products in terms of trends. It can be shown that the results of this study can have good credibility.

4. Discussion

4.1. Relationship between Interannual Variation Trend of Carbon Emissions and Land Cover

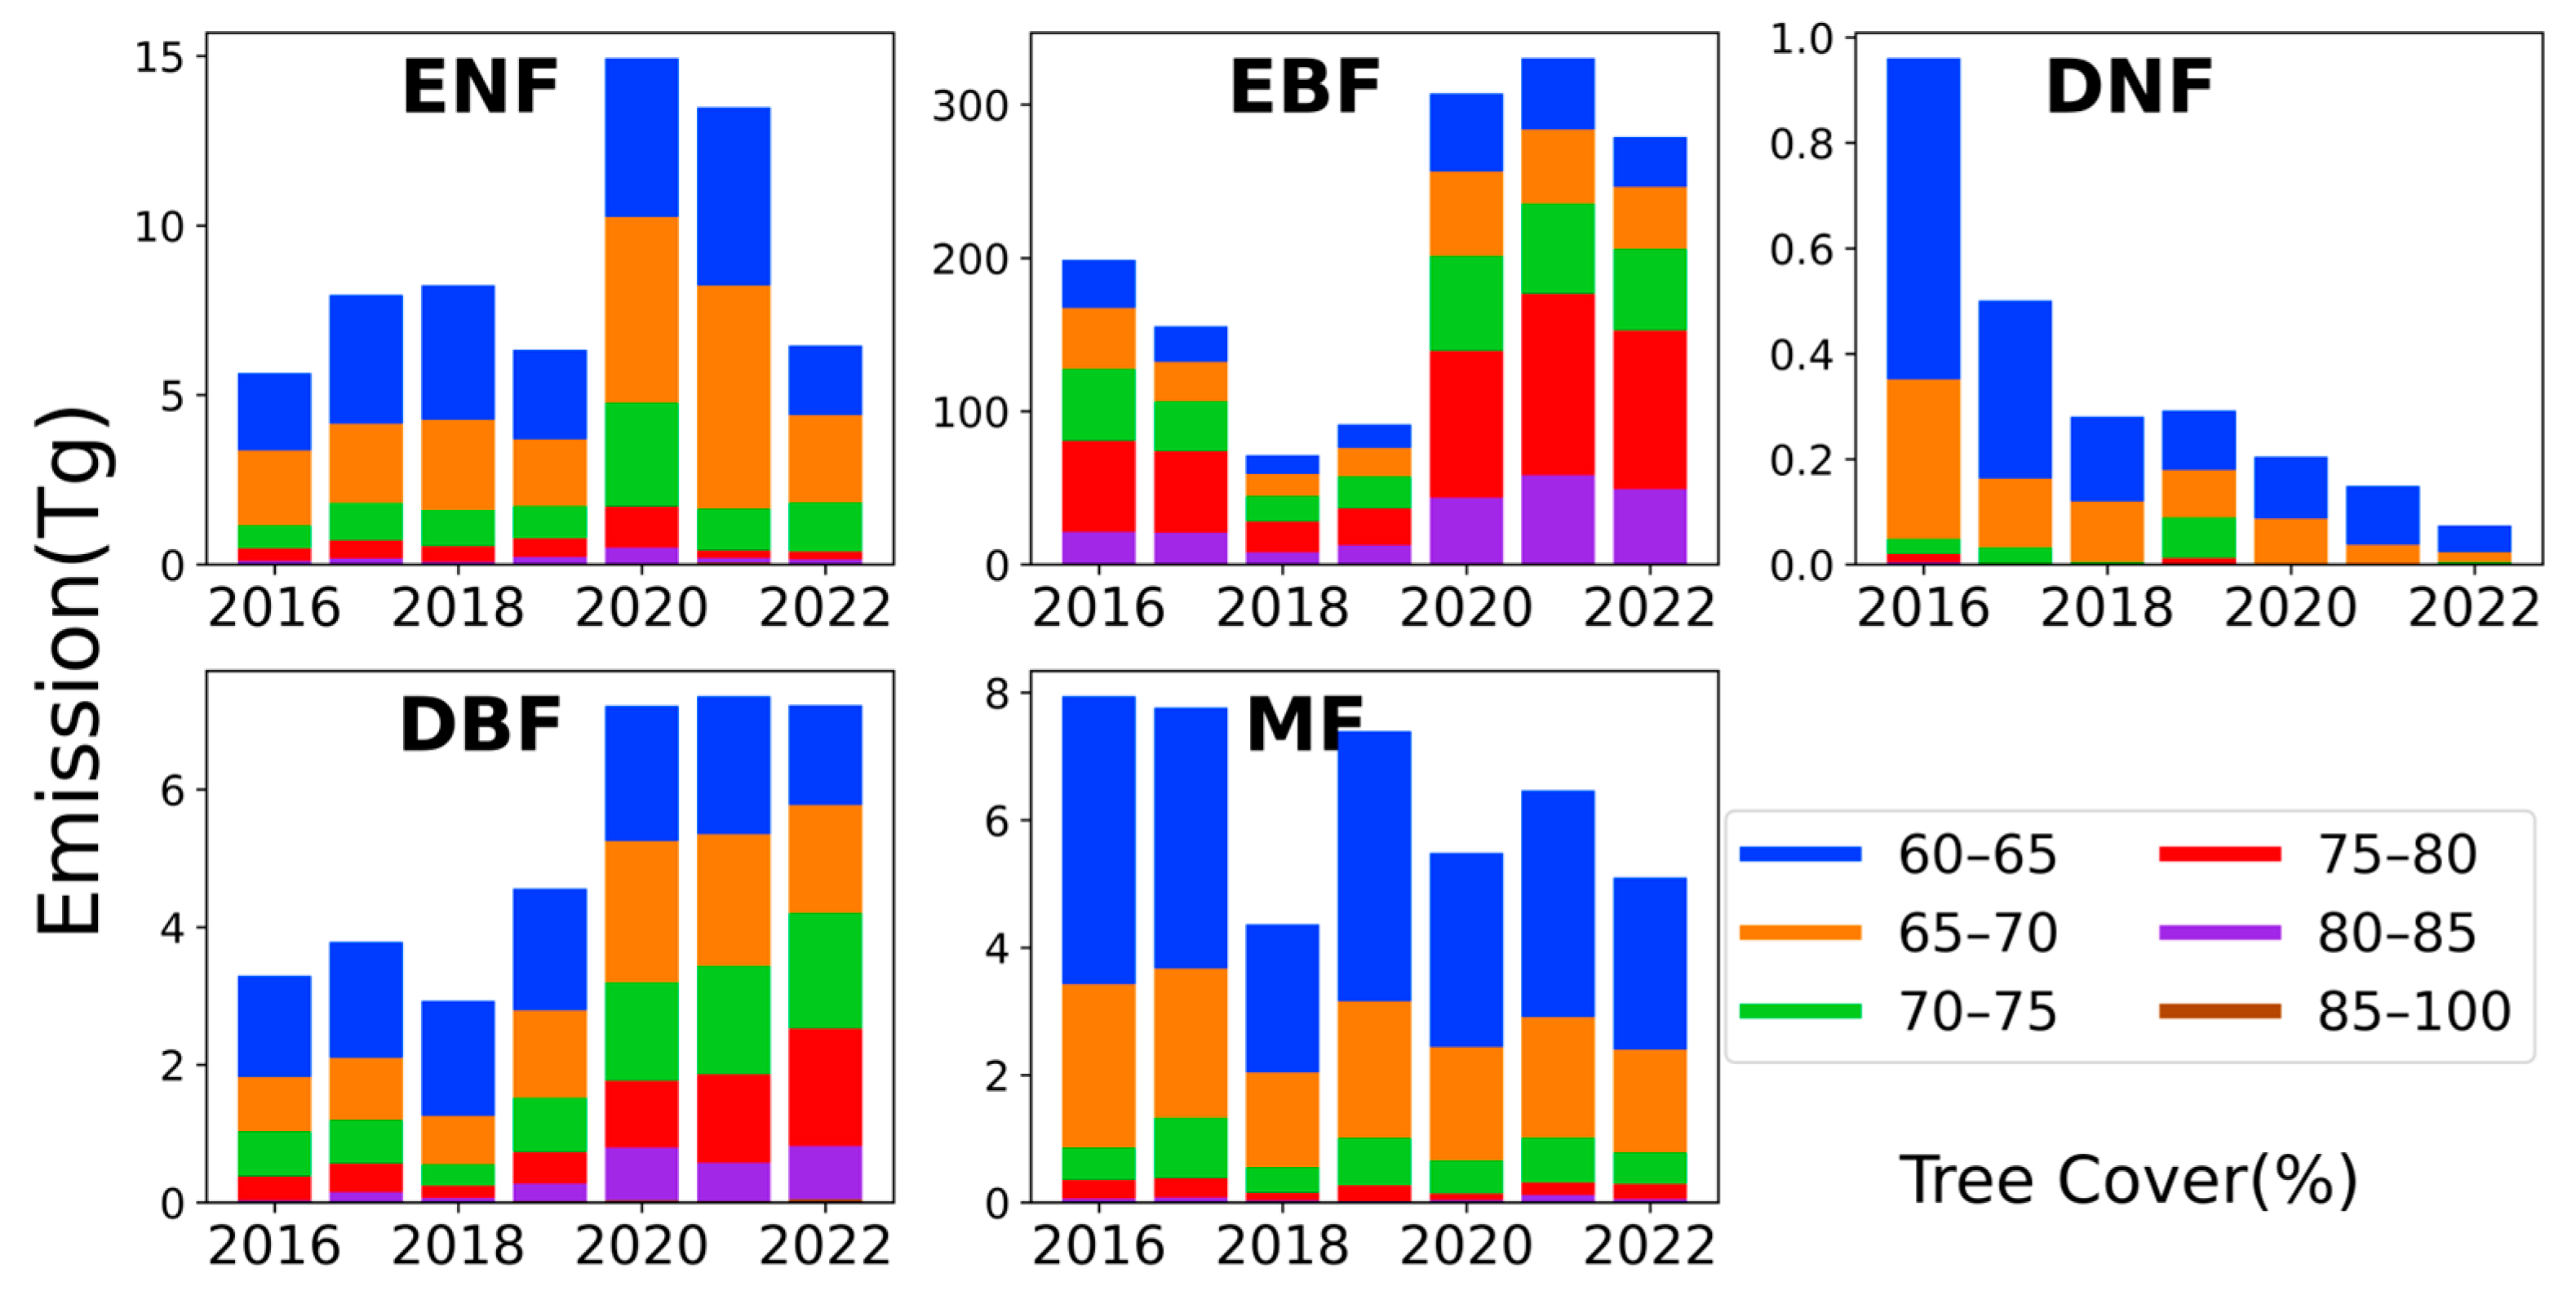
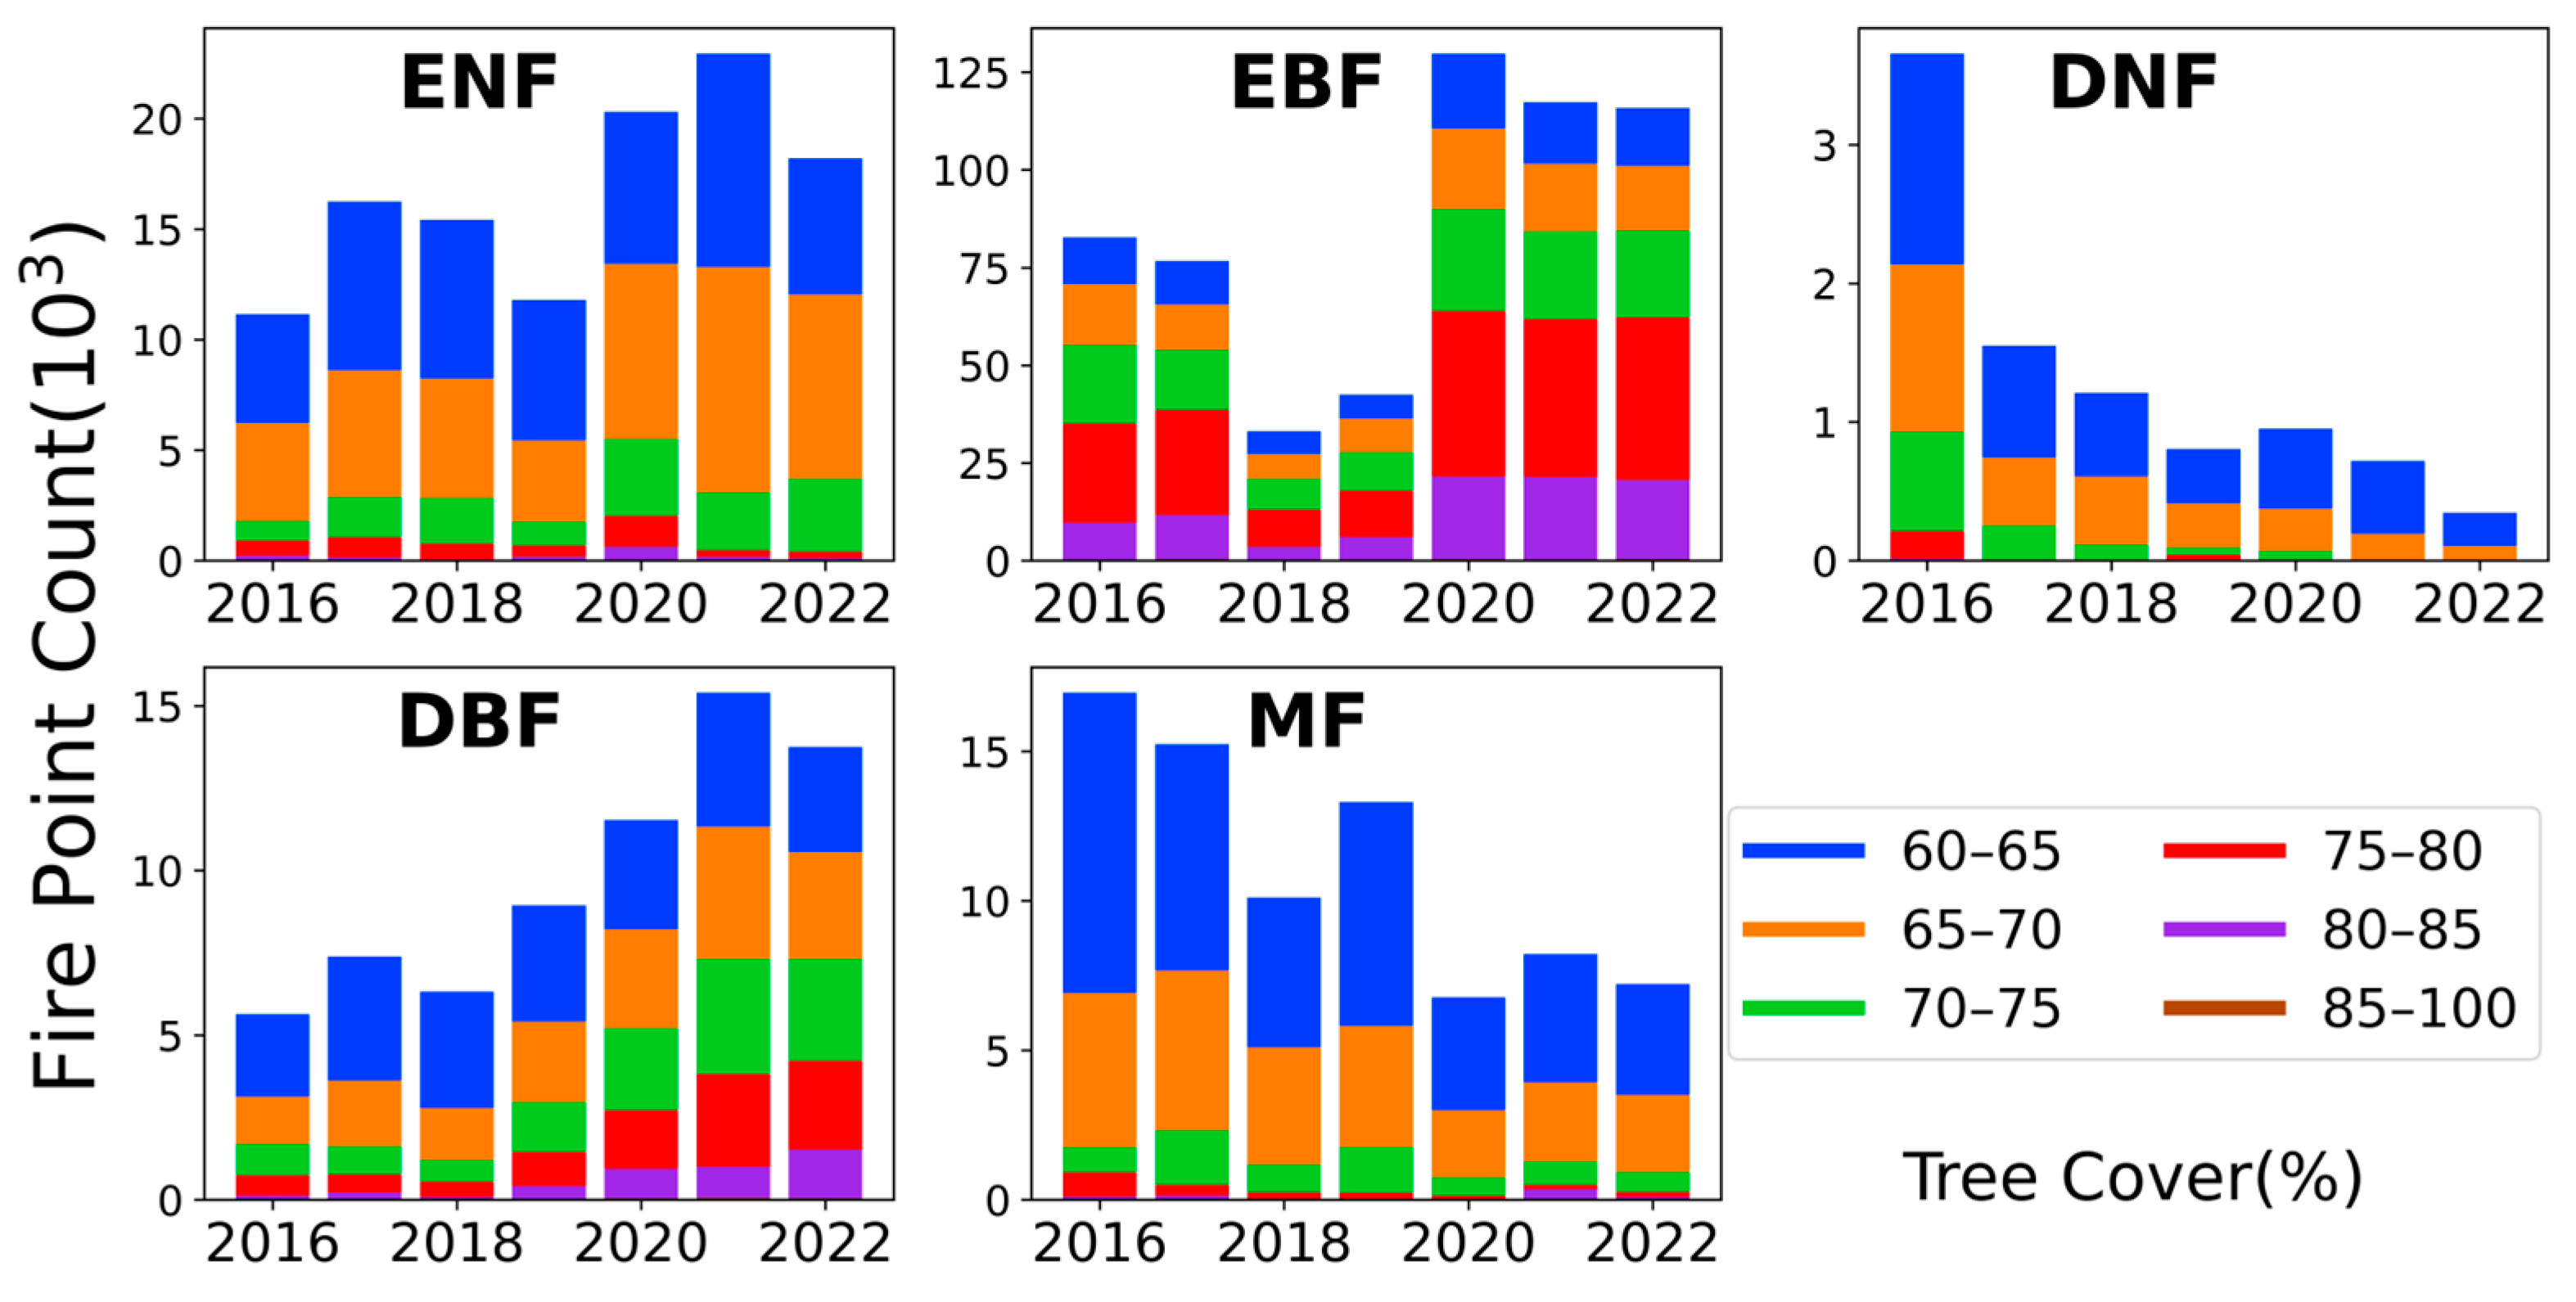
We discussed global forest fire carbon emissions for different types of forests (Figure 8), and we can see that for all types of forests, forest fire occurs mainly in the interval of 60–70% tree cover, but there is some heterogeneity among different types of forest types. For ENF, forest fire gradually shifted to the interval of 65–70% tree cover; for EBF, most of the forest fire occurred in the interval of 75–80% high vegetation cover; for DNF, the overall trend showed a decreasing trend year by year, and mainly occurred in the interval of 60–70% vegetation cover; the forest fire carbon emissions of DBF showed an increasing trend, and its main forest fire carbon emissions was in the interval of 60–70% tree cover; the forest fire carbon emissions in DBF showed an increasing trend, and its main biomass burning was in the interval of 60–70% tree cover. For DBF, forest fire shows a rising trend, and its main forest fire carbon emissions increase factor is the burning behavior in the high vegetation cover interval of 70–80%, and MF also shows a decreasing trend in recent years, and its burning behavior mainly occurs in the low tree cover interval of 60–70% vegetation cover. Overall, forest fire in the needleleaf forest region mainly occurs in low tree cover areas, while biomass forest fire in the broadleaf forest region has gradually shifted to high tree cover areas. Comparison with the statistics of the fire point (Figure 9) also shows a more pronounced agreement.

4.2. Relationship between Interannual Variation Trend of Carbon Emissions and Tree Cover

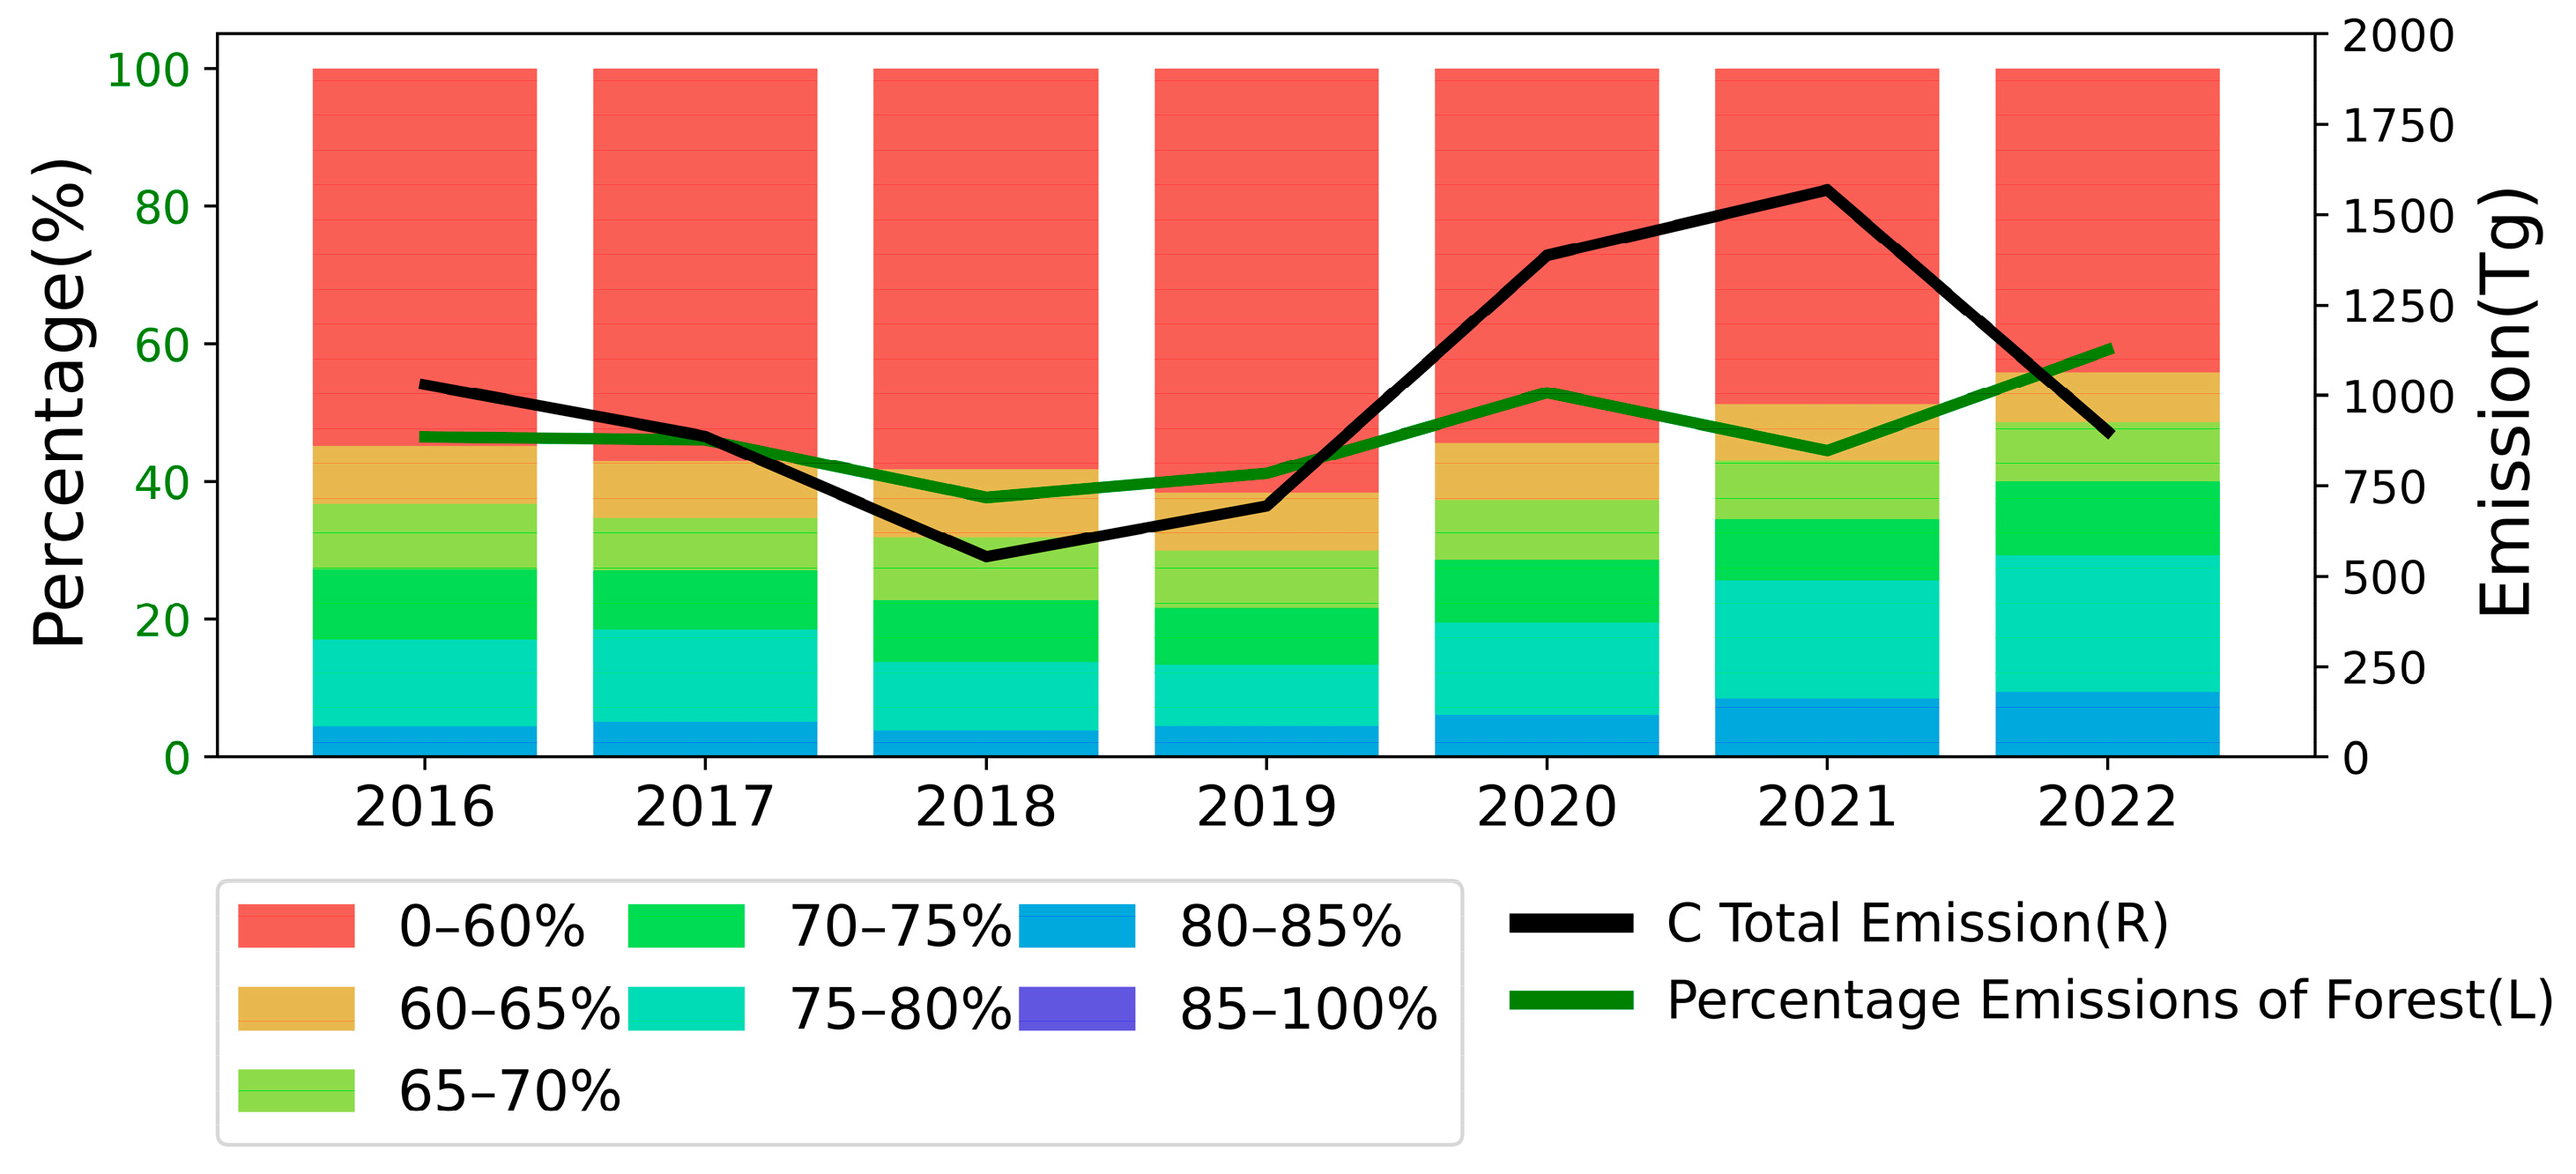
Overall forest fire carbon emissions showed a steady increase during the 2016–2022 period (black line in Figure 10; left axis; unit: 10 1 Tg), and the proportion of forest fire carbon emissions was also on an upward trend during the study period, increasing from about 1015.49697 Tg (23%) in 2016 to about 1310.34669 (35%) in 2022. The existence of two years of low values for forest fire carbon emissions in 2018 and 2019, only 486.50 Tg/year and 606.37 Tg/year This is related to the fact that the overall decline in carbon emissions in these two years is related to the decline in the proportion of forest fire carbon emissions. For the forest system as a whole, forest fire continues to occur mainly in the 60–80% tree cover range, and the proportion of forest fire shows an increase towards the 75–80% tree cover range.
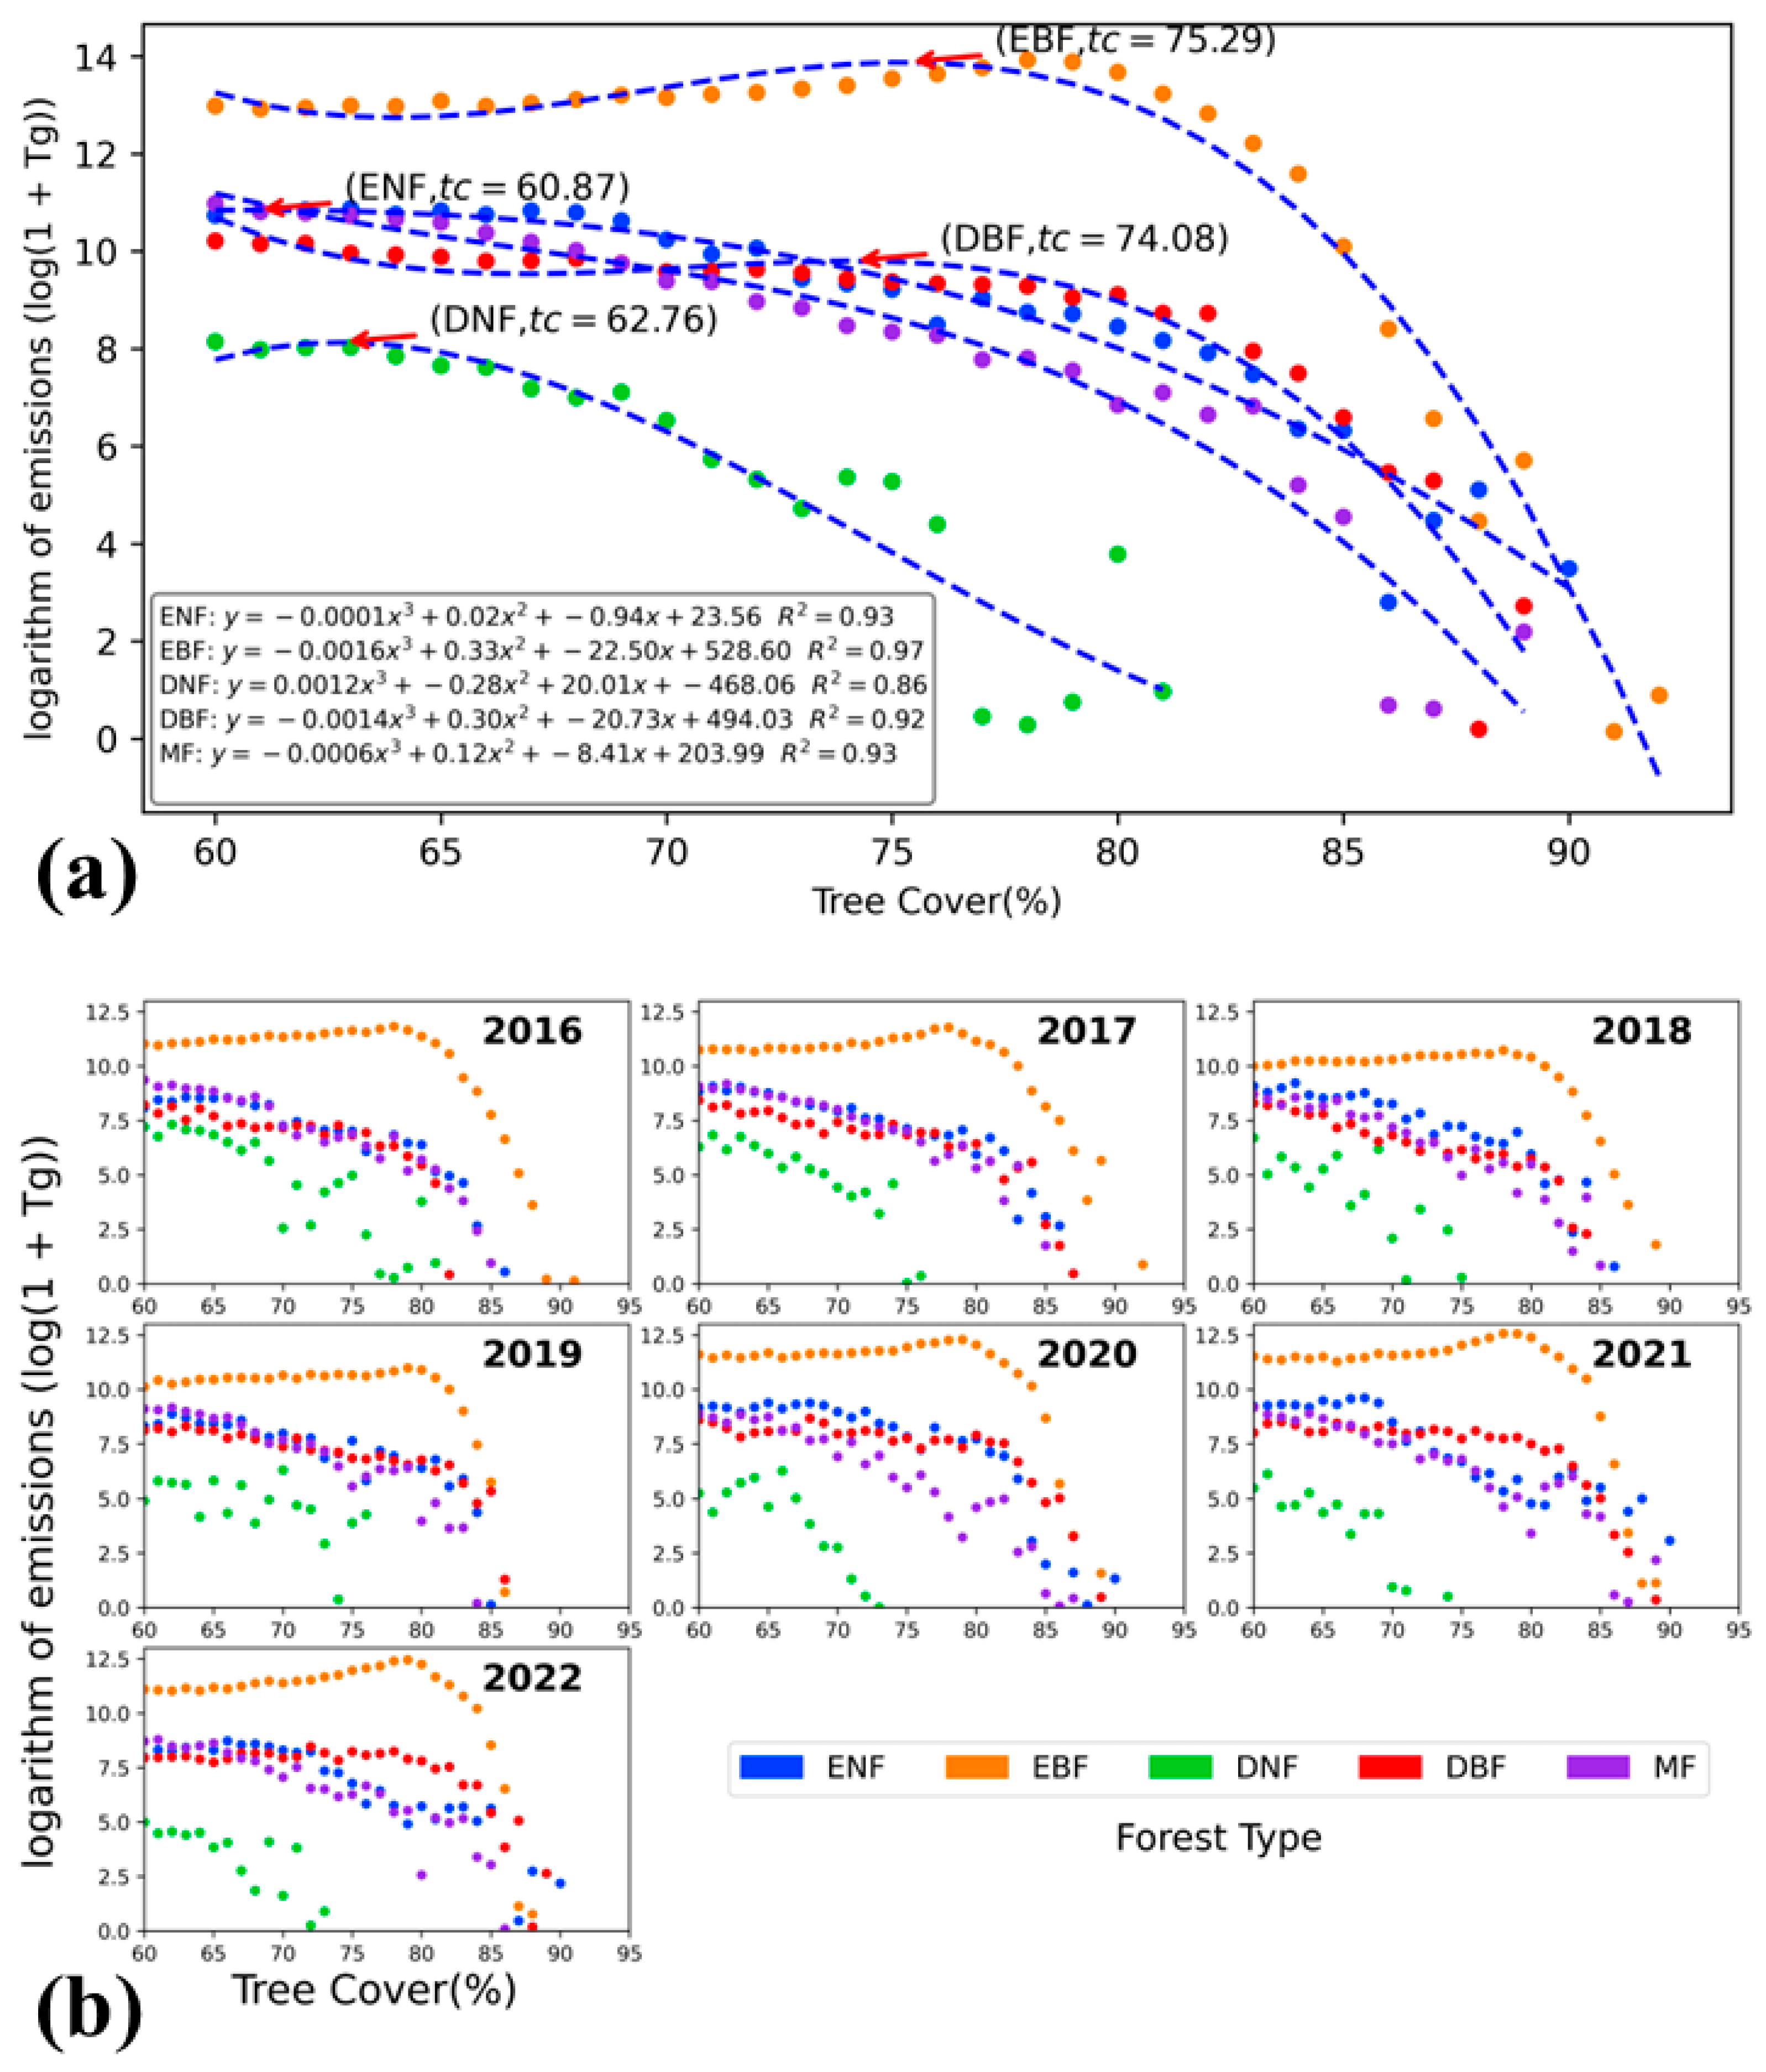
Exploring the relationship between carbon emissions from forest fires and the tree cover rate across various forest types over the years (Figure 11), a cubic function fitting has been applied to the data on forest fire carbon emissions and tree cover rates. While carbon emissions from forest fires generally decrease as TC increases across different forest types, unique trends are observable in specific categories of forests. For instance, evergreen broadleaf forests (EBF) display a trend where carbon emissions first increase and then decrease, with a significant, cliff-like drop observed when the tree cover rate is greater than 75.29%. For broadleaf forests (BF), the trend is characterized by an initial increase followed by a decrease, with the declining trend manifesting somewhat later compared to other forest types. Deciduous broadleaf forests (DBF) have a turning point at 74.08%. In the case of needleleaf forests (NF), the turning point appears earlier, and the ensuing downward trend in fire incidents is more gradual. The trends for evergreen needleleaf forests (ENF) and deciduous needleleaf forests (DNF) show a decline in forest fires when the TC is greater than 60.87% and 62.76% respectively. Mixed forests (MX) do not follow an increasing trend; instead, they consistently and gradually decline in terms of fire incidents. Furthermore, in recent years, there has been a noticeable upward shift in the peak values of the turning points. Across all forest types, a low incidence of fire events is observed when the tree cover rate exceeds 85%

5. Conclusions

In this study, we estimated global forest fire carbon emissions using data from the FY-3 series of satellites. We generated a gridded inventory of carbon emissions at a spatial resolution of 0.05° on a daily scale. This inventory allowed us to comprehensively analyze the changing patterns of carbon emissions resulting from biomass burning over the annual period from 2016 to 2022, taking into account both tree cover and land use types. Our statistical analysis reveals that the average annual global forest fire carbon emissions during the study period amounted to 1002.4 Tg. These emissions were further categorized by forest types, with average annual emissions from ENF, EBF, DNF, DBF, and MF estimated at 69.65 Tg, 740.93 Tg, 10.76 Tg, 58.07 Tg, and 122.99 Tg, respectively. Notably, the primary contributor to forest fire carbon emissions was EBF, accounting for approximately 73.92% of the total emissions, followed by MF, contributing approximately 12.27%.
The top four areas with the highest carbon emissions from forest fires globally are MIDE (85.68 Tg/year), CEAS (129.82 Tg/year), NHAF (130.86 Tg/year), and NHSA (415.15 Tg/year). These areas also exhibit two characteristics that align with those commonly associated with forest fires, namely high temperatures and drought conditions (resulting in low plant water content). Our assessment of global forest fire carbon emissions distribution is in line with the distribution of fire point monitoring, indicating a strong correlation between fire points and carbon emissions within forest ecosystems. However, our comprehensive analysis, which combines land cover and tree cover data, has revealed some heterogeneity. Different types of forests exhibit varying patterns in terms of combustion timing peaks. For instance, ENF and DBF exhibit an additional emissions peak in March, setting them apart from other forest types. Moreover, the predominant tree cover range for forest fires varies across different forest types. NF forests primarily burn within the low tree cover range (60–70%), while BF forests tend to show a preference for burning within the high tree cover range (70–80%). Nevertheless, there is a consistent trend of decreasing forest fires as tree cover continues to increase.
The study identifies the main sources of carbon emissions from forest fires globally, which can help policymakers to better target measures to reduce carbon emissions. Secondly, the study highlights areas of high fire incidence under high temperatures and drought conditions, which provides direction for appropriate preventive and management measures. In addition, the different characteristics of different types of forests and the variability in the peak burning time of fires provide a basis for customizing targeted policies.

Supplementary Materials

The following are available online at https://www.mdpi.com/article/10.3390/atmos14101575/s1, Table S1: FY-3 series satellite data presentation.

Author Contributions

Conceptualization, Y.L. and Y.S.; methodology, Y.L.; software, Y.L.; validation, Y.L. and Y.S.; formal analysis, Y.L.; investigation, Y.L.; resources, Y.L.; data curation, Y.L.; writing—original draft preparation, Y.L.; writing—review and editing, Y.L.; visualization, Y.L.; supervision, Y.L.; project administration, Y.L.; funding acquisition, Y.S. All authors have read and agreed to the published version of the manuscript.

Funding

This research was supported by FY-3 Lot 03 Meteorological Satellite Engineering Ground Application System Ecological Monitoring and Assessment Application Project (Phase I) (ZQC-R22227), National Key Research and Development Program of China (2021YFB3901000) and National Natural Science Foundation of China (12071389).

Institutional Review Board Statement

Not applicable.

Informed Consent Statement

Not applicable.

Data Availability Statement

Not applicable.

Conflicts of Interest

The authors declare no conflict of interest.

References

  1. Zhang, Z.; Hu, G.; Mu, X.; Kong, L. From Low Carbon to Carbon Neutrality: A Bibliometric Analysis of the Status, Evolution and Development Trend. J. Environ. Manag. 2022, 322, 116087. [Google Scholar] [CrossRef] [PubMed]
  2. Friedlingstein, P.; O’Sullivan, M.; Jones, M.W.; Andrew, R.M.; Gregor, L.; Hauck, J.; Le Quéré, C.; Luijkx, I.T.; Olsen, A.; Peters, G.P.; et al. Global Carbon Budget 2022. Earth Syst. Sci. Data 2022, 14, 4811–4900. [Google Scholar] [CrossRef]
  3. Giglio, L.; Randerson, J.T.; van der Werf, G.R. Analysis of Daily, Monthly, and Annual Burned Area Using the Fourth-Generation Global Fire Emissions Database (GFED4). J. Geophys. Res. Biogeosci. 2013, 118, 317–328. [Google Scholar] [CrossRef]
  4. Sayer, J.; Sheil, D.; Galloway, G.; Riggs, R.A.; Mewett, G.; MacDicken, K.G.; Arts, B.J.M.; Boedhihartono, A.K.; Langston, J.; Edwards, D.P. SDG 15 Life on Land—The Central Role of Forests in Sustainable Development. In Sustainable Development Goals: Their Impacts on Forest and People; Cambridge University Press: Cambridge, UK, 2019; pp. 482–509. [Google Scholar]
  5. Streets, D.G.; Yarber, K.F.; Woo, J.-H.; Carmichael, G.R. Biomass Burning in Asia: Annual and Seasonal Estimates and Atmospheric Emissions. Glob. Biogeochem. Cycles 2003, 17, 1099. [Google Scholar] [CrossRef]
  6. Shi, Y.; Yamaguchi, Y. A High-Resolution and Multi-Year Emissions Inventory for Biomass Burning in Southeast Asia during 2001–2010. Atmos. Environ. 2014, 98, 8–16. [Google Scholar] [CrossRef]
  7. Lazaridis, M.; Latos, M.; Aleksandropoulou, V.; Hov, Ø.; Papayannis, A.; Tørseth, K. Contribution of Forest Fire Emissions to Atmospheric Pollution in Greece. Air Qual. Atmos. Health 2008, 1, 143–158. [Google Scholar] [CrossRef]
  8. Zheng, B.; Ciais, P.; Chevallier, F.; Chuvieco, E.; Chen, Y.; Yang, H. Increasing Forest Fire Emissions despite the Decline in Global Burned Area. Sci. Adv. 2021, 7, eabh2646. [Google Scholar] [CrossRef]
  9. Buras, A.; Menzel, A. Projecting Tree Species Composition Changes of European Forests for 2061–2090 Under RCP 4.5 and RCP 8.5 Scenarios. Front. Plant Sci. 2019, 9, 1986. [Google Scholar] [CrossRef]
  10. Corona-Núñez, R.O.; Campo, J.E. Climate and Socioeconomic Drivers of Biomass Burning and Carbon Emissions from Fires in Tropical Dry Forests: A Pantropical Analysis. Glob. Chang. Biol. 2023, 29, 1062–1079. [Google Scholar] [CrossRef]
  11. Dakhil, M.A.; Xiong, Q.; Farahat, E.A.; Zhang, L.; Pan, K.; Pandey, B.; Olatunji, O.A.; Tariq, A.; Wu, X.; Zhang, A.; et al. Past and Future Climatic Indicators for Distribution Patterns and Conservation Planning of Temperate Coniferous Forests in Southwestern China. Ecol. Indic. 2019, 107, 105559. [Google Scholar] [CrossRef]
  12. Fu, Y.H.; Zhang, X.; Piao, S.; Hao, F.; Geng, X.; Vitasse, Y.; Zohner, C.; Peñuelas, J.; Janssens, I.A. Daylength Helps Temperate Deciduous Trees to Leaf-out at the Optimal Time. Glob. Chang. Biol. 2019, 25, 2410–2418. [Google Scholar] [CrossRef] [PubMed]
  13. Rosenfield, M.F.; Jakovac, C.C.; Vieira, D.L.M.; Poorter, L.; Brancalion, P.H.S.; Vieira, I.C.G.; de Almeida, D.R.A.; Massoca, P.; Schietti, J.; Albernaz, A.L.M.; et al. Ecological Integrity of Tropical Secondary Forests: Concepts and Indicators. Biol. Rev. 2023, 98, 662–676. [Google Scholar] [CrossRef] [PubMed]
  14. Sahu, S.K.; Mangaraj, P.; Beig, G.; Samal, A.; Pradhan, C.; Dash, S.; Tyagi, B. Quantifying the High Resolution Seasonal Emission of Air Pollutants from Crop Residue Burning in India. Environ. Pollut. 2021, 286, 117165. [Google Scholar] [CrossRef] [PubMed]
  15. Xu, X.; Jia, G.; Zhang, X.; Riley, W.J.; Xue, Y. Climate Regime Shift and Forest Loss Amplify Fire in Amazonian Forests. Glob. Chang. Biol. 2020, 26, 5874–5885. [Google Scholar] [CrossRef]
  16. Shikwambana, L.; Kganyago, M.; Xulu, S. Analysis of Wildfires and Associated Emissions during the Recent Strong ENSO Phases in Southern Africa Using Multi-Source Remotely-Derived Products. Geocarto Int. 2022, 37, 16654–16670. [Google Scholar] [CrossRef]
  17. Yang, Z.; Lu, N.; Shi, J.; Zhang, P.; Dong, C.; Yang, J. Overview of FY-3 Payload and Ground Application System. IEEE Trans. Geosci. Remote Sens. 2012, 50, 4846–4853. [Google Scholar] [CrossRef]
  18. Aveni, S.; Laiolo, M.; Campus, A.; Massimetti, F.; Coppola, D. The Capabilities of FY-3D/MERSI-II Sensor to Detect and Quantify Thermal Volcanic Activity: The 2020–2023 Mount Etna Case Study. Remote Sens. 2023, 15, 2528. Available online: https://www.mdpi.com/2072-4292/15/10/2528 (accessed on 9 August 2023). [CrossRef]
  19. Seiler, W.; Crutzen, P.J. Estimates of Gross and Net Fluxes of Carbon between the Biosphere and the Atmosphere from Biomass Burning. Clim. Chang. 1980, 2, 207–247. [Google Scholar] [CrossRef]
  20. Wu, J.; Kong, S.; Wu, F.; Cheng, Y.; Zheng, S.; Yan, Q.; Zheng, H.; Yang, G.; Zheng, M.; Liu, D.; et al. Estimating the Open Biomass Burning Emissions in Central and Eastern China from 2003 to 2015 Based on Satellite Observation. Atmos. Chem. Phys. 2018, 18, 11623–11646. [Google Scholar] [CrossRef]
  21. Shi, Y.; Gong, S.; Zang, S.; Zhao, Y.; Wang, W.; Lv, Z.; Matsunaga, T.; Yamaguchi, Y.; Bai, Y. High-Resolution and Multi-Year Estimation of Emissions from Open Biomass Burning in Northeast China during 2001–2017. J. Clean. Prod. 2021, 310, 127496. [Google Scholar] [CrossRef]
  22. Chen, J.; Yao, Q.; Chen, Z.; Li, M.; Hao, Z.; Liu, C.; Zheng, W.; Xu, M.; Chen, X.; Yang, J.; et al. The Fengyun-3D (FY-3D) Global Active Fire Product: Principle, Methodology and Validation. Earth Syst. Sci. Data 2022, 14, 3489–3508. [Google Scholar] [CrossRef]
  23. Schaaf, C.; Wang, Z. MODIS/Terra+Aqua BRDF/Albedo Nadir BRDF Adjusted Ref Daily L3 Global—500m V061 2021. Available online: https://catalog.data.gov/dataset/modis-terraaqua-brdf-albedo-nadir-brdf-adjusted-ref-daily-l3-global-500m-v006 (accessed on 18 October 2020).
  24. Friedl, M.; Sulla-Menashe, D. MODIS/Terra+Aqua Land Cover Type Yearly L3 Global 500m SIN Grid V061 2022. Available online: https://ladsweb.modaps.eosdis.nasa.gov/missions-and-measurements/products/MCD12Q1/ (accessed on 18 October 2020).
  25. DiMiceli, C.; Sohlberg, R.; Townshend, J. MODIS/Terra Vegetation Continuous Fields Yearly L3 Global 250m SIN Grid V061 2022. Available online: https://ladsweb.modaps.eosdis.nasa.gov/missions-and-measurements/products/MOD44B (accessed on 18 October 2020).
  26. Wiedinmyer, C.; Kimura, Y.; McDonald-Buller, E.C.; Emmons, L.K.; Buchholz, R.R.; Tang, W.; Seto, K.; Joseph, M.B.; Barsanti, K.C.; Carlton, A.G.; et al. The Fire Inventory from NCAR Version 2.5: An Updated Global Fire Emissions Model for Climate and Chemistry Applications. EGUsphere 2023, 2023, 1–45. [Google Scholar] [CrossRef]
  27. Ito, A.; Penner, J.E. Global Estimates of Biomass Burning Emissions Based on Satellite Imagery for the Year 2000. J. Geophys. Res. Atmos. 2004, 109, D14S05. [Google Scholar] [CrossRef]
  28. Quiring, S.M.; Ganesh, S. Evaluating the Utility of the Vegetation Condition Index (VCI) for Monitoring Meteorological Drought in Texas. Agric. For. Meteorol. 2010, 150, 330–339. [Google Scholar] [CrossRef]
  29. Huang, S.; Tang, L.; Hupy, J.P.; Wang, Y.; Shao, G. A Commentary Review on the Use of Normalized Difference Vegetation Index (NDVI) in the Era of Popular Remote Sensing. J. For. Res. 2021, 32, 1–6. [Google Scholar] [CrossRef]
  30. Liu, X.; Huey, L.G.; Yokelson, R.J.; Selimovic, V.; Simpson, I.J.; Müller, M.; Jimenez, J.L.; Campuzano-Jost, P.; Beyersdorf, A.J.; Blake, D.R.; et al. Airborne Measurements of Western U.S. Wildfire Emissions: Comparison with Prescribed Burning and Air Quality Implications. J. Geophys. Res. Atmos. 2017, 122, 6108–6129. [Google Scholar] [CrossRef]
  31. Akagi, S.K.; Yokelson, R.J.; Wiedinmyer, C.; Alvarado, M.J.; Reid, J.S.; Karl, T.; Crounse, J.D.; Wennberg, P.O. Emission Factors for Open and Domestic Biomass Burning for Use in Atmospheric Models. Atmos. Chem. Phys. 2011, 11, 4039–4072. [Google Scholar] [CrossRef]
  32. Paton-Walsh, C.; Smith, T.E.L.; Young, E.L.; Griffith, D.W.T.; Guérette, É.-A. New Emission Factors for Australian Vegetation Fires Measured Using Open-Path Fourier Transform Infrared Spectroscopy—Part 1: Methods and Australian Temperate Forest Fires. Atmos. Chem. Phys. 2014, 14, 11313–11333. [Google Scholar] [CrossRef]
  33. Urbanski, S. Wildland Fire Emissions, Carbon, and Climate: Emission Factors. For. Ecol. Manag. 2014, 317, 51–60. [Google Scholar] [CrossRef]
  34. Houghton, R.A.; House, J.I.; Pongratz, J.; van der Werf, G.R.; DeFries, R.S.; Hansen, M.C.; Le Quéré, C.; Ramankutty, N. Carbon Emissions from Land Use and Land-Cover Change. Biogeosciences 2012, 9, 5125–5142. [Google Scholar] [CrossRef]
  35. Yang, Z.; Zhang, P.; Gu, S.; Hu, X.; Tang, S.; Yang, L.; Xu, N.; Zhen, Z.; Wang, L.; Wu, Q.; et al. Capability of Fengyun-3D Satellite in Earth System Observation. J. Meteorol. Res. 2019, 33, 1113–1130. [Google Scholar] [CrossRef]
  36. Deshpande, M.V.; Pillai, D.; Jain, M. Detecting and Quantifying Residue Burning in Smallholder Systems: An Integrated Approach Using Sentinel-2 Data. Int. J. Appl. Earth Obs. Geoinf. 2022, 108, 102761. [Google Scholar] [CrossRef]
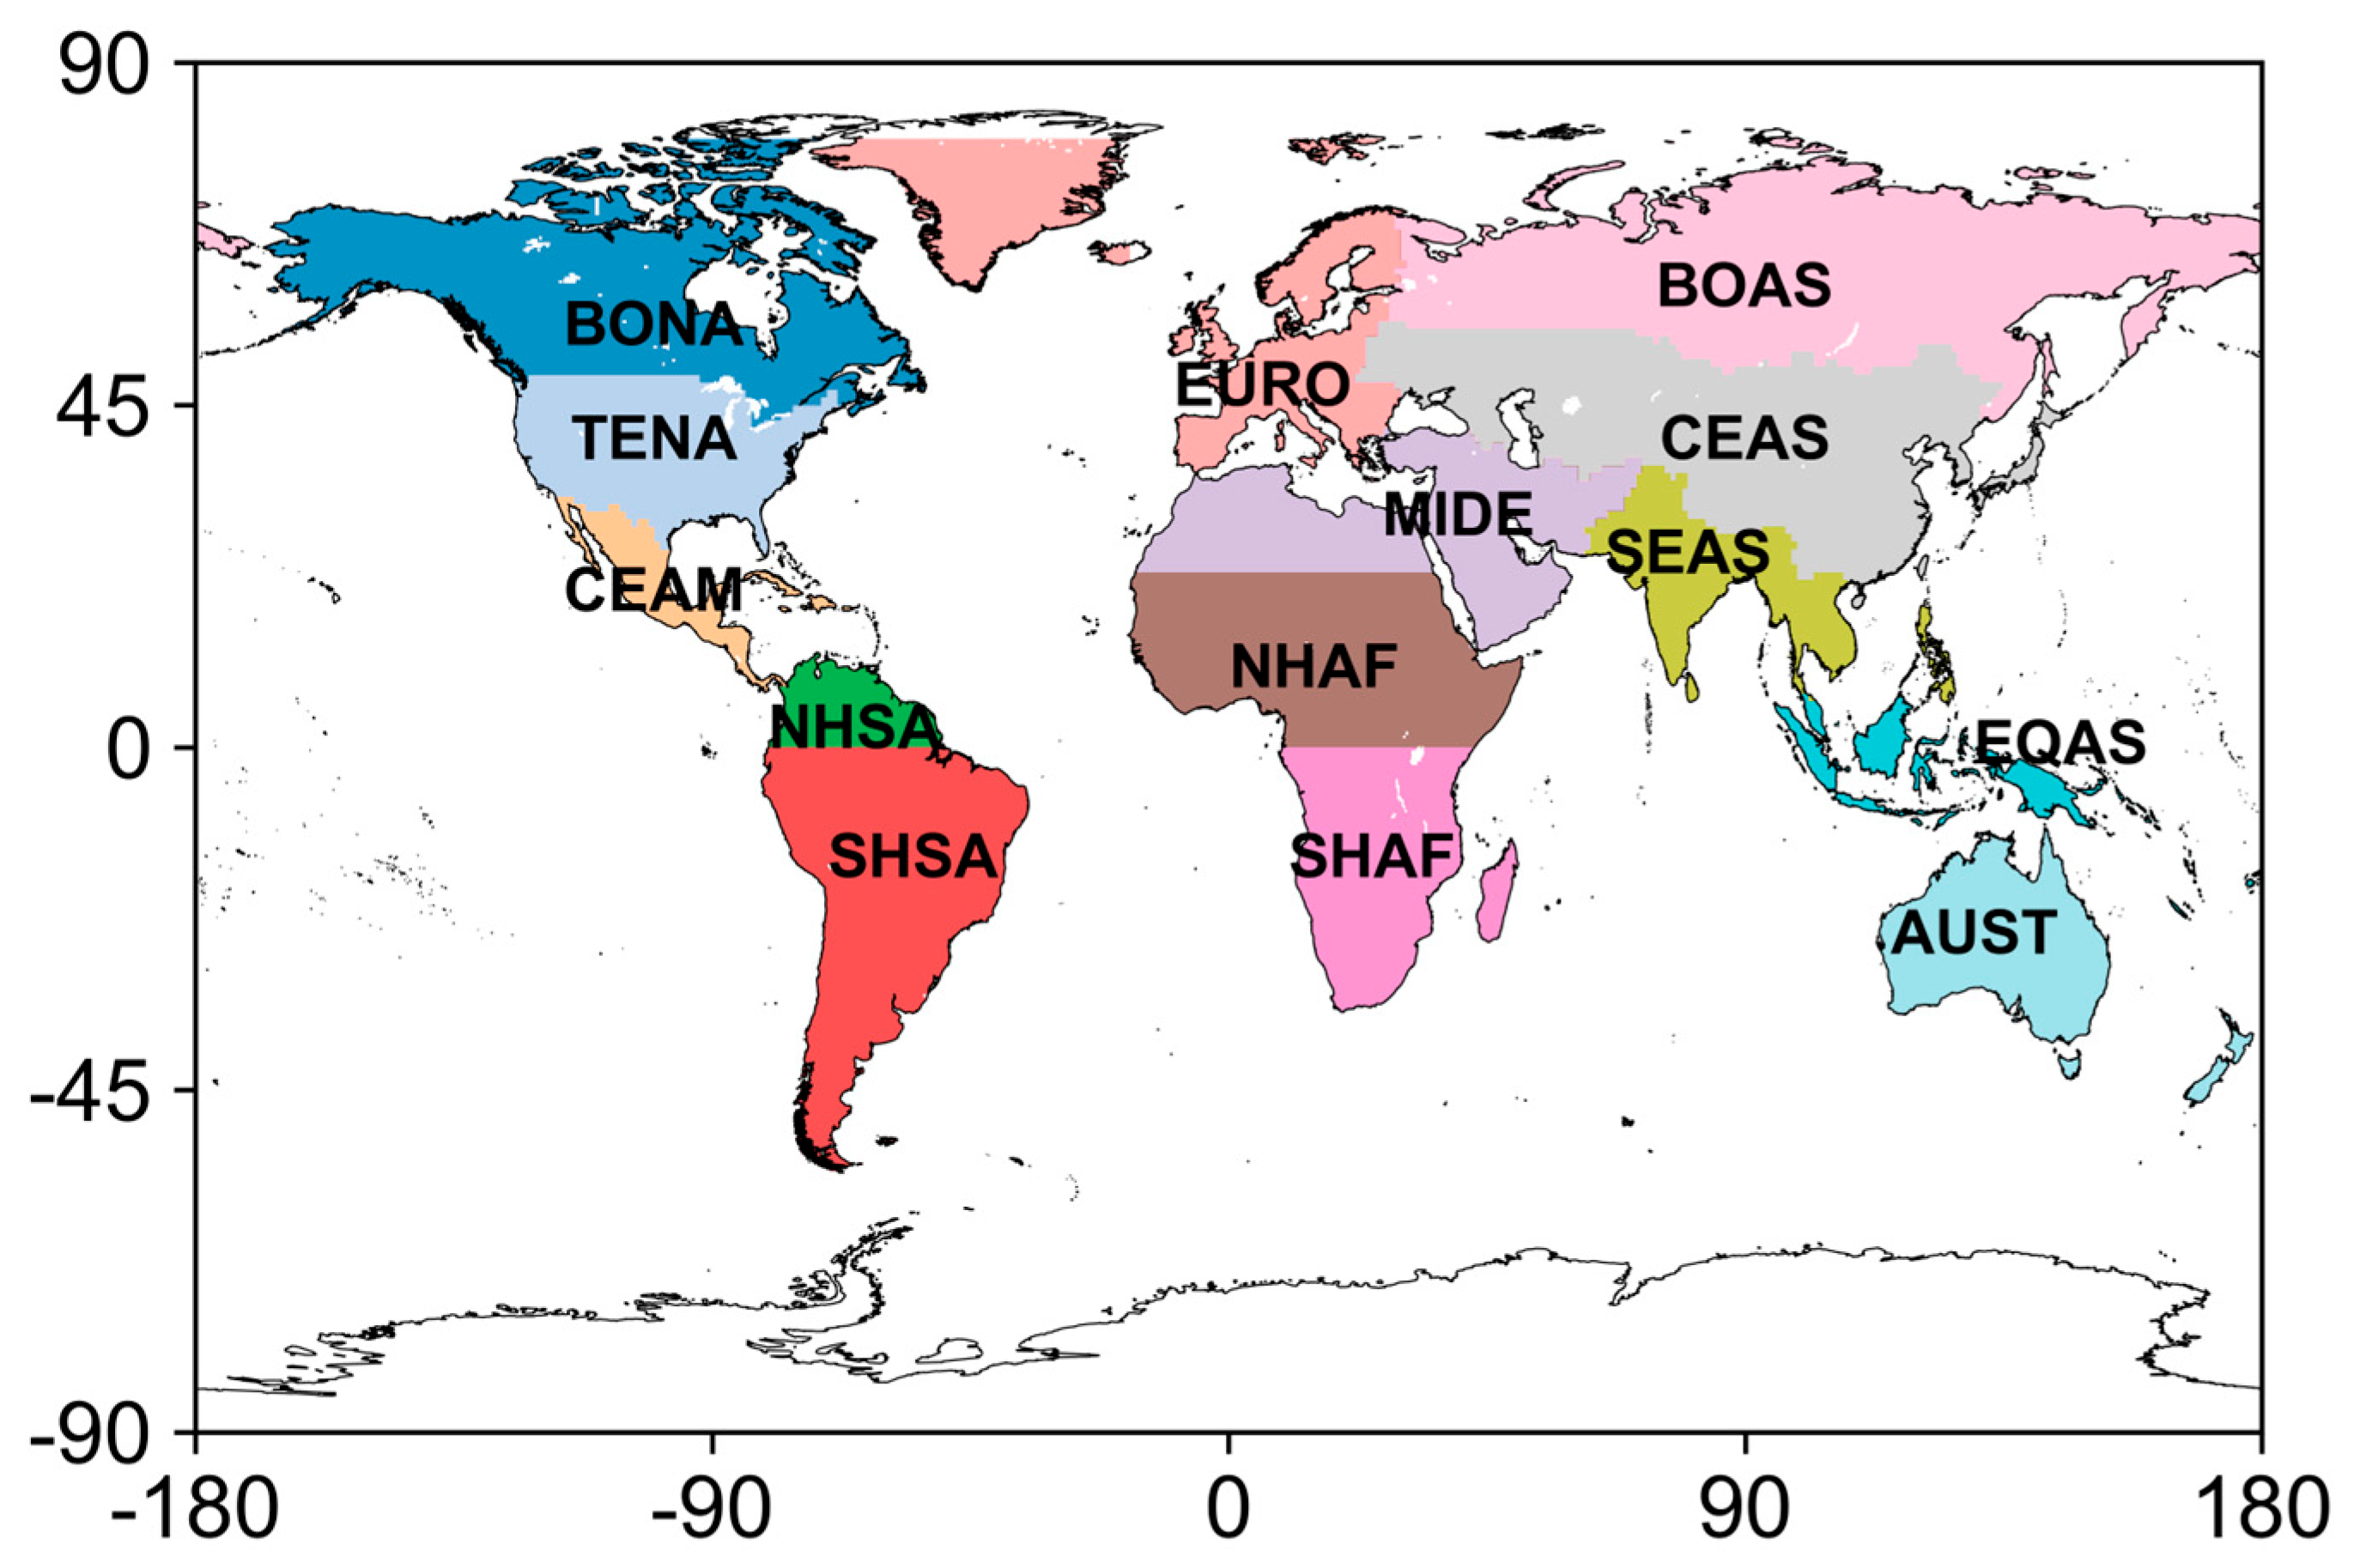
Figure 1. Global geographic regions. The acronyms on the figure represent the following: BONA: Boreal North America; TENA: Temperate North America; CEAM: Central America; NHSA: Northern Hemisphere South America; SHSA: Southern Hemisphere South America; EURO: Europe; MIDE: Middle East; NHAF: Northern Hemisphere Africa; SHAF: Southern Hemisphere Africa; BOAS: Boreal Asia; CEAS: Central Asia; SEAS: Southeast Asia; EQAS: Equatorial Asia; AUST: Australia and New Zealand.
Atmosphere 14 01575 g001
Figure 2. Global distribution of reclassified forest types in 2022.
Atmosphere 14 01575 g002
Figure 3. Average annual global forest fire carbon emissions and major area (2016–2022).
Atmosphere 14 01575 g003
Figure 4. Global tree cover distribution in 2022 (%).
Atmosphere 14 01575 g004
Figure 5. Inter-annual variation in carbon emissions from different types of forests in different forest types (left axis) compared to the total carbon emissions from total forest fires (right axis).
Atmosphere 14 01575 g005
Figure 6. Monthly average variations from 2016 to 2022 in carbon emissions from forest fires in different forest types (left axis), compared to the total carbon emissions from all forest fires (right axis).
Atmosphere 14 01575 g006
Figure 7. (a) Comparison of monthly average global forest fire emissions. (b) Comparison of different global forest fire emissions database.
Atmosphere 14 01575 g007
Figure 8. Globel forest fire carbon emissions in different types of forests.
Atmosphere 14 01575 g008
Figure 9. Globel forest fire point in different types of forests.
Atmosphere 14 01575 g009
Figure 10. Interannual variations in global forest fire carbon emissions (depicted as a bar graph on the left axis) and their respective proportions of total biomass burning carbon emissions (left axis), compared to the interannual variations in total carbon emissions from global biomass burning (right axis).
Atmosphere 14 01575 g010
Figure 11. (a) Scatter Plot and Fitting Curve of logarithm of multi-year average emissions vs. tree cover for different land cover with Turning Points; (b) Relationship between carbon emissions from forest fire and tree cover in different years.
Atmosphere 14 01575 g011
Table 1. Reclassification method.
IGBP LCT DescriptionLCT ValueMethod and Value
Evergreen needleleaf forests
(ENF)
2If latitude ≥ 50, then 3; else 4.
Evergreen broadleaf forests
(EBF)
3If latitude ≥ −23.5 and < 23.5, then 1; else 2.
Deciduous needleleaf forests
(DNF)
4If latitude ≥ 50, then 5; else 2.
Deciduous broadleaf forests
(DBF)
52
Mixed forests
(MF)
6If latitude ≥ 50, then 3; if latitude ≥ −23.5 and ≤ 23.5, then 1; else 2.
where 3 is tropical forest, 4 is temperate forest, 5 is boreal forest, and 6 is temperate evergreen forest.
Table 2. Fuel loading (g/ m 2 ) of different regions and reclassify types.
RegionTropical
Forest 1
Temperate
Forest 2,4
Boreal
Forest 3
North
America
28,07610,66117,875
Central
America
26,50011,000-
South
America
26,7557400-
Northern
Africa
25,3663497-
Southern
Africa
25,2956100-
Western
Europe
28,07671206228
Eastern
Europe
28,07611,3868146
North Central
Asia
618120,80714,925
Near
East
618110,316-
East
Asia
14,9417865-
Southern
Asia
26,54614,629-
Oceania16,37613,535-
where tropical forest includes 1, temperate forest includes 2 and 4, boreal forest includes 3.
Table 3. Emission factor (g/kg) of different species.
SpeciesTropical
Forest
Temperate
Forest
Boreal
Forest
Temperate
Evergreen
Forest
CO21643151015651623
CO93122111112
CH45.15.6163.4
SO20.41.111.1
NO0.90.950.830.95
NO23.62.340.632.34
PM259.91518.417.9
PM1018.516.9718.418.4
Disclaimer/Publisher’s Note: The statements, opinions and data contained in all publications are solely those of the individual author(s) and contributor(s) and not of MDPI and/or the editor(s). MDPI and/or the editor(s) disclaim responsibility for any injury to people or property resulting from any ideas, methods, instructions or products referred to in the content.