Article

Validation and Spatiotemporal Analysis of Surface Net Radiation from CRA/Land and ERA5-Land over the Tibetan Plateau

1
School of Cyber Security, Gansu University of Political Science and Law, Lanzhou 730070, China
2
Northwest Institute of Eco-Environment and Resources, Chinese Academy of Sciences, Lanzhou 730000, China
3
National Cryosphere Desert Data Center, Lanzhou 730000, China
4
College of Geography Science, Qinghai Normal University, Xining 810008, China
*
Author to whom correspondence should be addressed.
Atmosphere 2023, 14(10), 1542; https://doi.org/10.3390/atmos14101542
Submission received: 29 August 2023 / Revised: 28 September 2023 / Accepted: 3 October 2023 / Published: 9 October 2023
(This article belongs to the Section Atmospheric Techniques, Instruments, and Modeling)

Abstract

:
High spatial–temporal resolution surface net radiation (RN) data are of great significance to the study of climate, ecology, hydrology and cryosphere changes on the Tibetan Plateau (TP), but the verification of the surface net radiation products on the plateau is not sufficient. In this study, the China Meteorological Administration Global Land Surface Reanalysis Products (CRA/Land) and ECMWF Land Surface Reanalysis version 5 (ERA5-Land) RN data were validated using ground measurements at daily and monthly time scales, and the spatiotemporal patterns were also analyzed. The results indicate the following: (1) CRA/Land overestimated while ERA5-Land underestimated RN, but CRA/Land RN outperformed ERA5-Land in observations at the daily and monthly scale. (2) The CRA/Land RN data had a larger error in the central part and a smaller error in the northeast of the TP, while ERA5-Land showed the opposite. (3) The spatial patterns of RN revealed by CRA/Land and ERA5-Land data showed differences in most regions. The CRA/Land data showed that the RN of the TP had a downward trend during 2000 and 2020 with a slope of −0.112 W·m−2/a, while the ERA5-Land data indicated an upward trend with a change rate of 0.016 W·m−2/a. (4) Downwelling shortwave radiation (DSR), upwelling shortwave radiation (USR), downwelling longwave radiation (DLR) and upwelling longwave radiation (ULR) are the four components of RN, and the evaluation results indicate that the DSR, DLR and ULR recorded via CRA/Land and ERA5-Land are consistent with the observed data, but the consistency between the USR recorded via CRA/Land and ERA5-Land and the observed data is poor. (5) The inconsistency of the USR data is the main reason for the large differences in the spatiotemporal distribution of CRA/Land and ERA5-Land RN data across the TP.

1. Introduction

Surface net radiation (RN) is the balance between downwelling shortwave radiation (DSR), upwelling shortwave radiation (USR), downwelling longwave radiation (DLR) and upwelling longwave radiation (ULR), and is an essential parameter in the Earth’s surface energy budget [1,2,3]. Meanwhile, RN is the driving force of soil and atmospheric heat, evapotranspiration and plant photosynthetic processes, and it is also an indispensable parameter in land surface, hydrological and ecosystem models [4,5,6,7,8]. Therefore, accurate RN data are of great significance in the study of climate change, water cycle processes and cryosphere degradation.
The methods for measuring RN include ground observations, model simulations, remote sensing retrieval and reanalysis datasets [9,10,11,12,13,14]. Ground observations have the highest accuracy, but there are few RN observation stations, which makes it difficult to satisfy many research demands on the regional or global scale [2,10]. Some simple models can obtain RN through routine meteorological observations [15,16], but the RN obtained via this method is still at site-scale. Sophisticated global climate models can produce RN products on a global scale, but these products usually have low spatial resolution [12]. Remote sensing retrieval can provide high-spatial-resolution RN data. Previous studies have proposed many algorithms for retrieving RN based on Moderate Resolution Imaging Spectroradiometer (MODIS), Spinning Enhanced Visible and Infrared Imager (SEVIRI) and Landsat [17,18,19,20,21]. However, due to the influence of satellite transit time, cloud cover and other factors, the time resolution of remote sensing data cannot easily meet the research needs of some meteorological and hydrological fields. Among these methods, reanalysis data are derived by merging available observations with atmospheric models [22], which can provide high spatial–temporal resolution RN data on a global scale. However, the reanalysis data also need to be evaluated. Several RN products from reanalysis have been evaluated using ground observations on the regional and global scales. Decker et al. [22] evaluated the performance of the Climate Forecast System Reanalysis (CFSR), the 40-year European Centre for Medium-Range Weather Forecasts (ECMWF) Re-Analysis (ERA-40), ECMWF Interim Re-Analysis (ERA-Interim), MERRA and Global Land Data Assimilation System (GLDAS) using flux tower observations of RN, and proposed that all of the datasets had a positive bias in RN. Jia et al. [10] validated the ERA-Interim, Modern-Era Retrospective analysis for Research and Applications version 2 (MERRA2) and the Japanese 55-year Reanalysis (JRA-55) on a global scale and found that these products have similar accuracies.
The Tibetan Plateau (TP) is the highest plateau in the world, with an average elevation of over 4000 m. Strong radiation causes the TP to be a heat source in summer, directly affecting the East Asian monsoon, which then affects the surrounding climate [23,24]. Because several major rivers in East and South Asia, including the Yellow River, Yangtze River and Lancang River, all originate from the TP, it is also known as the “Water Tower of Asia” [25,26]. In addition, the TP is also an important distribution area for mid-latitude permafrost and glaciers [27,28]. Therefore, accurate net radiation data are of great significance to the study of energy and moisture changes and the degradation of the cryosphere in the TP. Although many studies have verified several reanalysis datasets on the TP, they mainly focus on routine meteorological parameters, such as temperature, wind speed and precipitation [23,29], or only on a single component [30], and rarely on the accuracy of RN. RN, as an important parameter in the surface energy budget, has been widely recognized for its importance in the degradation of the cryosphere and the stability of the roadbed in cold regions on the TP [31,32,33]. Therefore, it is necessary to strengthen the evaluation of different RN products to provide more reliable data for this type of research.
With the background mentioned above, RN data from China Meteorological Administration Global Land Surface Reanalysis Products (CRA/Land) and ECMWF Land Surface Re-Analysis version 5 (ERA5-Land) were evaluated at daily and monthly time scales using available in situ observations over the TP. The main purpose of this study is to obtain more accurate net radiation data for the TP. The remaining parts of this paper are organized as follows. Section 2 introduces the RN datasets, as well as the evaluation methods used in this study. Section 3 evaluates the accuracy of the RN products from ERA5-Land and CRA/land at the daily and monthly time scales. Finally, the discussion and conclusions are provided in Section 4 and Section 5, respectively.

2. Materials and Methods

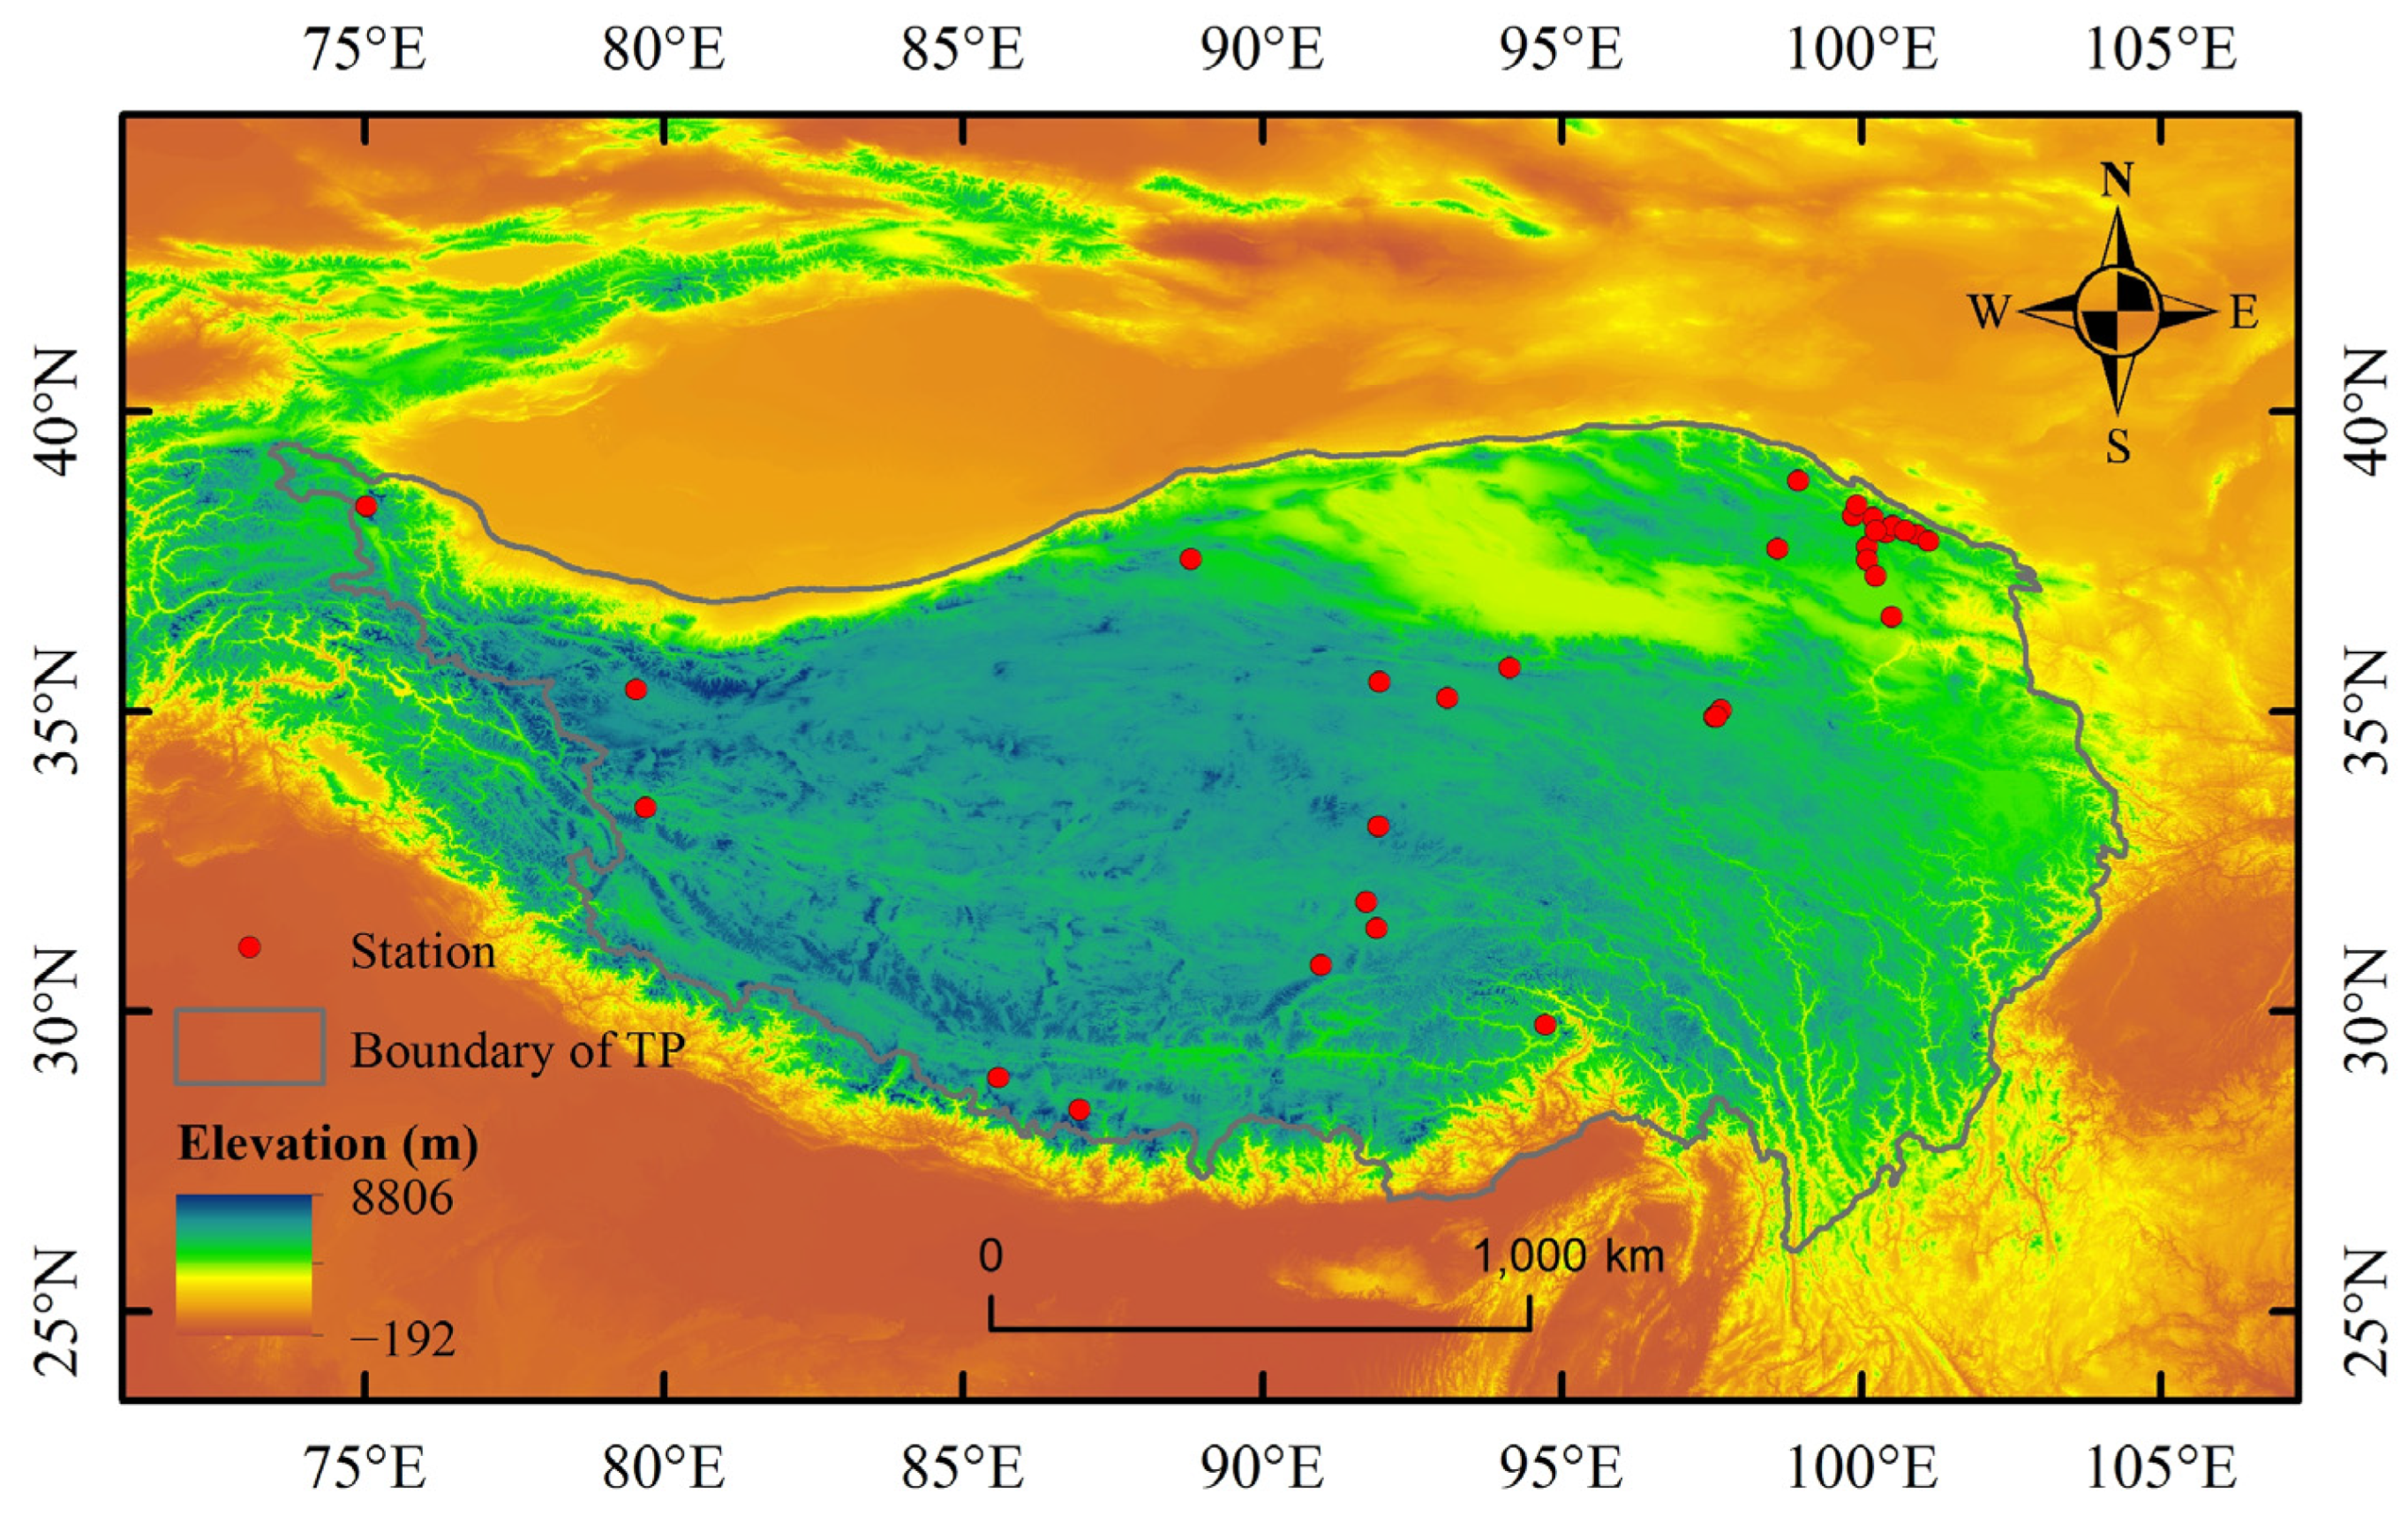
2.1. In Situ Observation Data

A total of 33 RN observation stations were selected in this study, namely Wayanshan (WYS), Wudaoliang (WDL), Xidatan (XDT), Tanggula (TGL), Liangdaohe (LDH), Zhuonaihu (ZNH), Ayakehu (AYK), Tianshuihai (TSH), BJ site of Nagqu Station of Plateau Climate and Environment (BJ), Qomolangma Atmospheric and Environmental Observation and Research Station (QOMS), Southeast Tibet Observation and Research Station for the Alpine Environment (SETORS), Ngari Desert Observation and Research Station (NADORS), Muztagh Ata Westerly Observation and Research Station (MAWORS), Nam Co Monitoring and Research Station for Multisphere Interactions (NAMORS), Qinghai Lake subalpine shrub station (QHH1), Qinghai Lake warm grassland station (QHH2), Qinghai Lake alpine meadow grassland hybrid superstation (QHH3), Qinghai Lake Station (QHH4), A’rou freeze–thaw station (AR1), A’rou north-facing station (AR2), A’rou south-facing station (AR3), Dashalong (DSL), E’bao (EB), Huangcaogou (HCG), Huangzangsi (HZS), Jingyangling (JYL), Yakou snow station (YK), Hulugou (HLG), Grassland Observation Site in the Eling Lake Basin (ELH1), Eling Lake Observation Site (ELH2), Eling Lake Observation Site (ELH3), Sidalong (SDL) and Peicuokuhu (PCKH). The geographic locations of these sites are shown in Figure 1. The observed RN data at XDT, TGL, LDH, ZNH, AYK, TSH, BJ, QOMS, SETORS, NADORS, MAWORS, NAMORS, QHH1, QHH2, QHH3, QHH4, AR1, AR2, AR3, DSL, EB, HLG, SDL and PCKH are available for free download from the National Tibetan Plateau Data Center (http://www.tpdc.ac.cn (accessed on 26 April 2023)). The observed data at ELH1, ELH2 and ELH3 are available for free download from the National Cryosphere Desert Data Center (http://www.ncdc.ac.cn (accessed on 20 April 2023)). The data selected in this study are summarized in Table 1, and the details of these data can be found in the listed references [34,35,36,37,38,39,40].

2.2. Reanalysis Data

ERA5-Land is the land component of the fifth generation of the European Reanalysis (ERA5) from the European Centre for Medium-Range Weather Forecasts [15]. The ERA5-Land data span from 1950 to the present, and are available through the C3S CDS (https://cds.climate.copernicus.eu (accessed on 30 March 2023)). The spatial resolution of ERA5-Land is 0.1° and the temporal resolution is 1 h. CRA/Land is a global reanalysis dataset developed by the China Meteorological Administration, which adopts the latest international assimilation scheme [29]. The CRA/Land data cover the period of 1979 to the present, and can be downloaded from the National Meteorological Science Data Center (http://data.cma.cn (accessed on 30 March 2023)). The spatial resolution of CRA/Land is 34 km and the temporal resolution is 3 h. The ground radiation observations in ERA5-land and CRA/Land are net downward shortwave radiation (SRN), net downward longwave radiation (LRN), DSR and DLR. RN can be obtained by adding SRN and LRN.

2.3. Methods for Validation

The observation data are recorded according to Beijing time, while the reanalysis data are in world time. Before the evaluation, we first converted the observation data from Beijing time to world time. Since XDT, TGL, LDH, ZNH, AYK, TSH, HLG and PKCH can only obtain daily data and cannot convert Beijing time into world time, these eight sites were not used in evaluating the accuracy of the reanalysis data at the daily scale. The nearest grid in the reanalysis data based on the longitude and latitude of the observation stations is found, and the same time series is extracted as the observation data. Daily RN is obtained by averaging hourly data, and monthly RN is obtained by averaging daily data. The accuracy of RN data from ERA5-land and CRA/Land was evaluated using the correlation coefficient (CC), relative bias (RB) and root mean squared error (RMSE) [41]:
C C = i = 1 n ( S i S ¯ ) ( G i G ¯ ) i = 1 n ( S i S ¯ ) 2 i = 1 n ( G i G ¯ ) 2
R B = i = 1 n ( S i G i ) i = 1 n G i × 100 %
R M S E = 1 n i = 1 n ( S i G i ) 2
The range of CC is from −1 to 1, the ranges of RB and RMSE are from −∞ to +∞ and from 0 to +∞, respectively. A positive RB value means that the reanalysis data overestimates RN, and a negative RB means that it underestimates RN. The closer the CC is to 1, the closer the RB is to 0% and the closer the RMSE is to 0, the more accurate the RN obtained by the reanalysis data will be, compared to that from the in situ observations.

3. Results

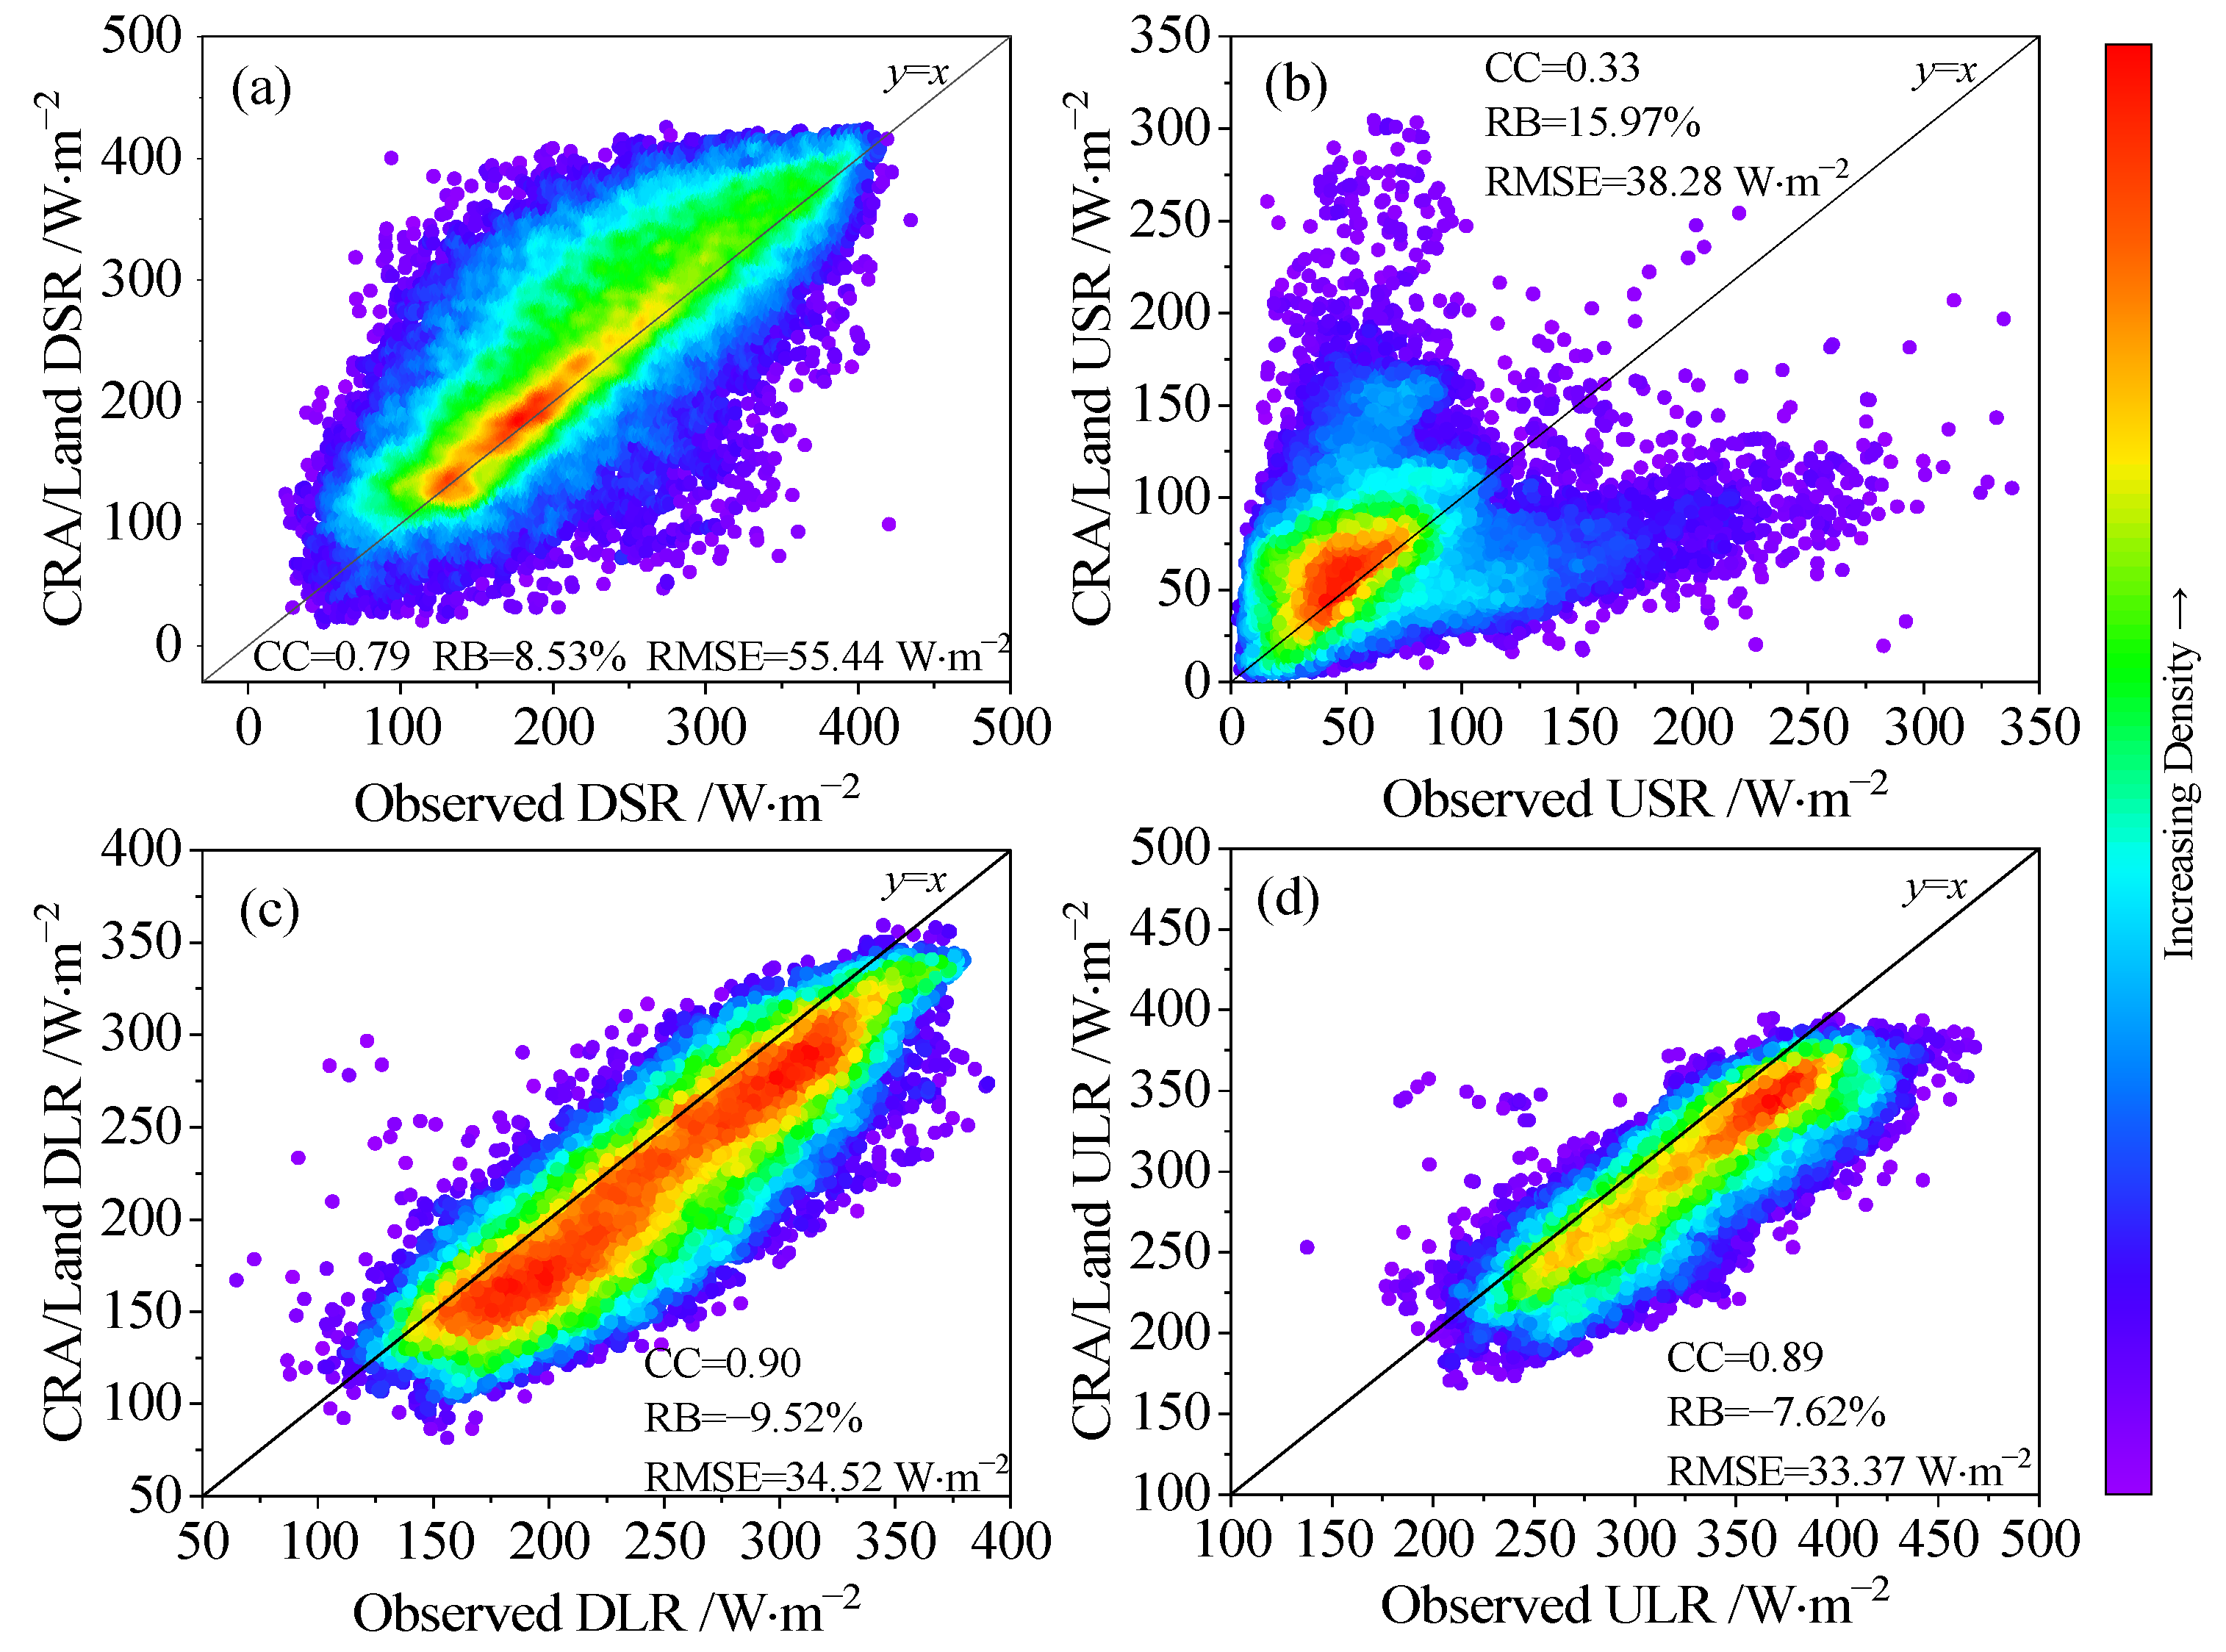
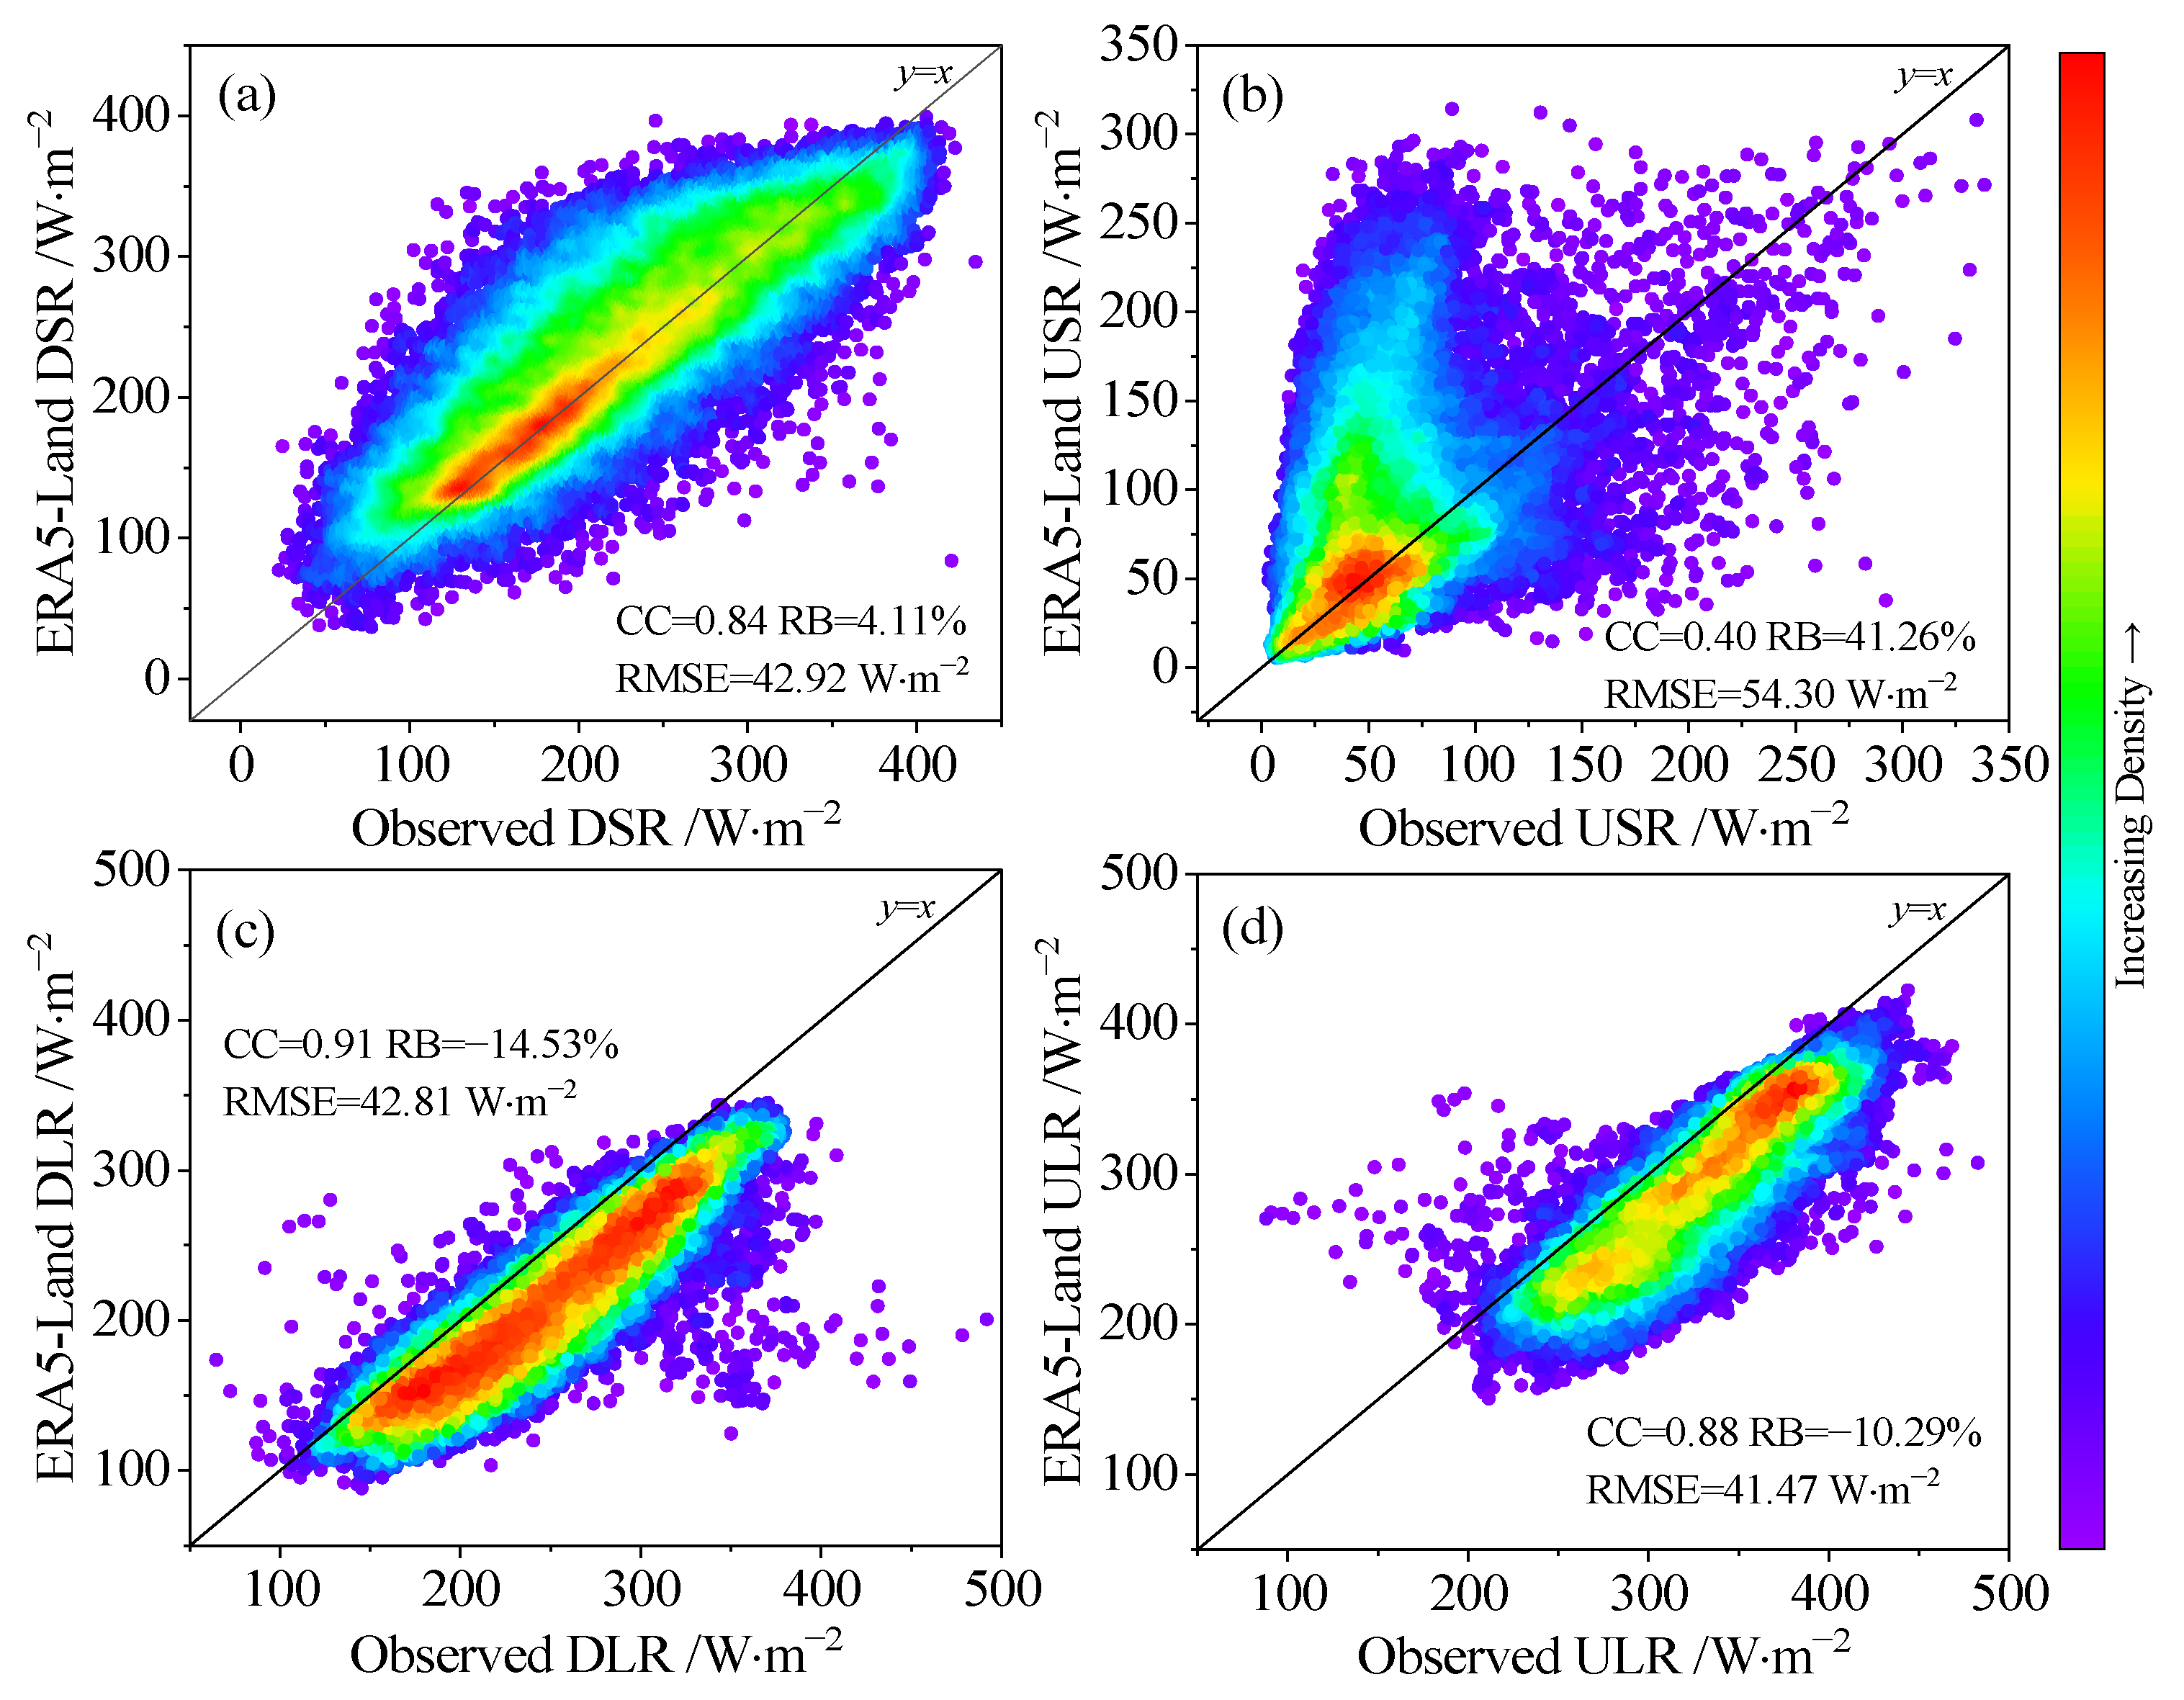
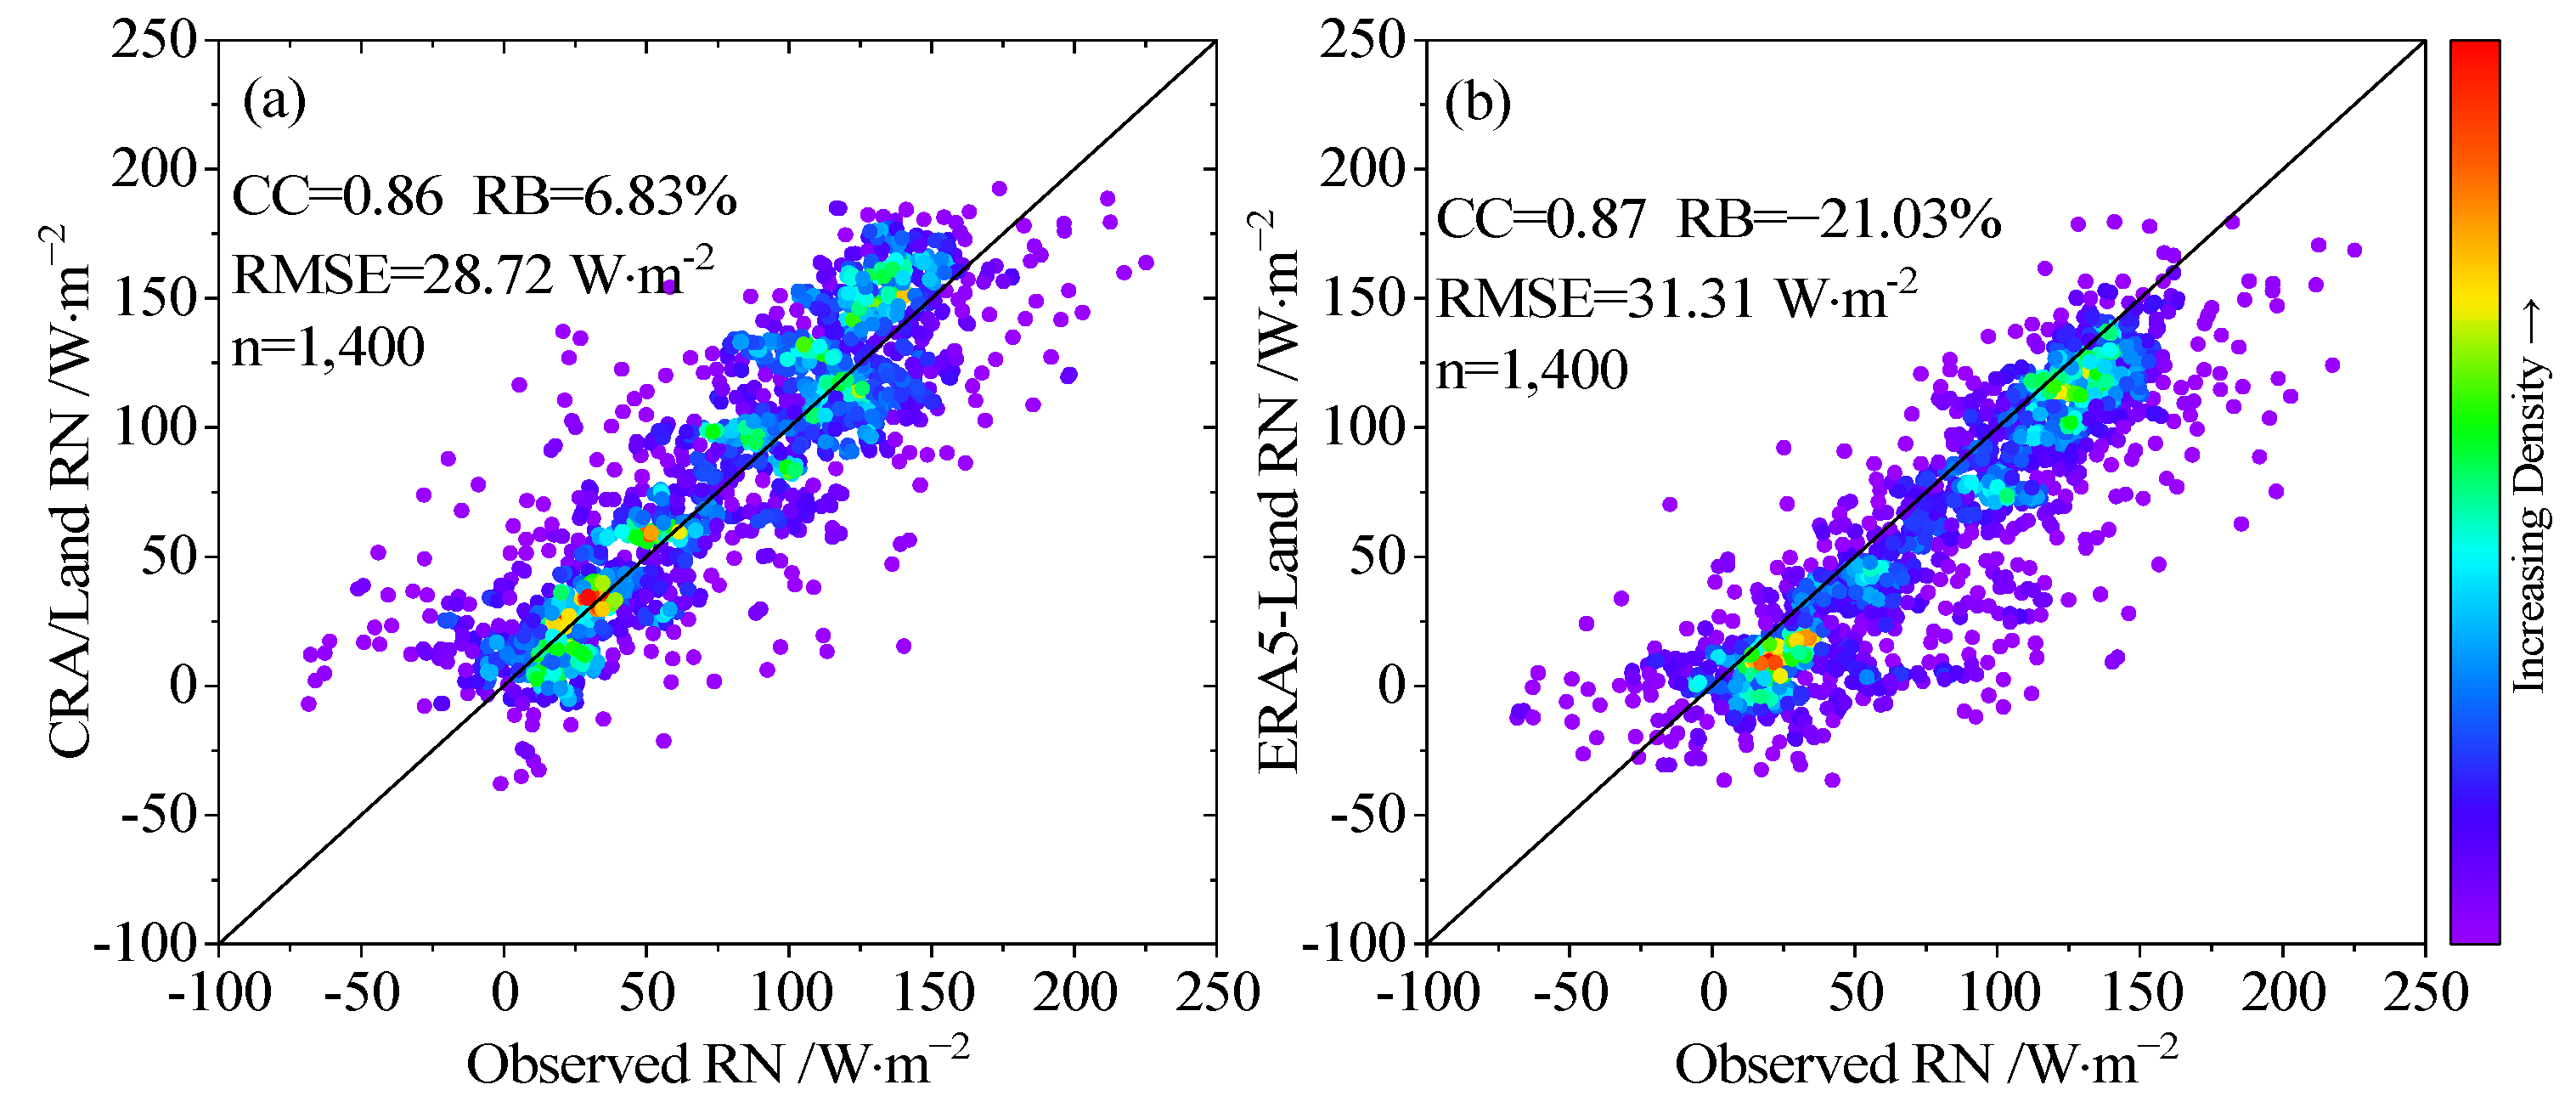
3.1. Validation of the CRA/Land and ERA5-Land RN Data

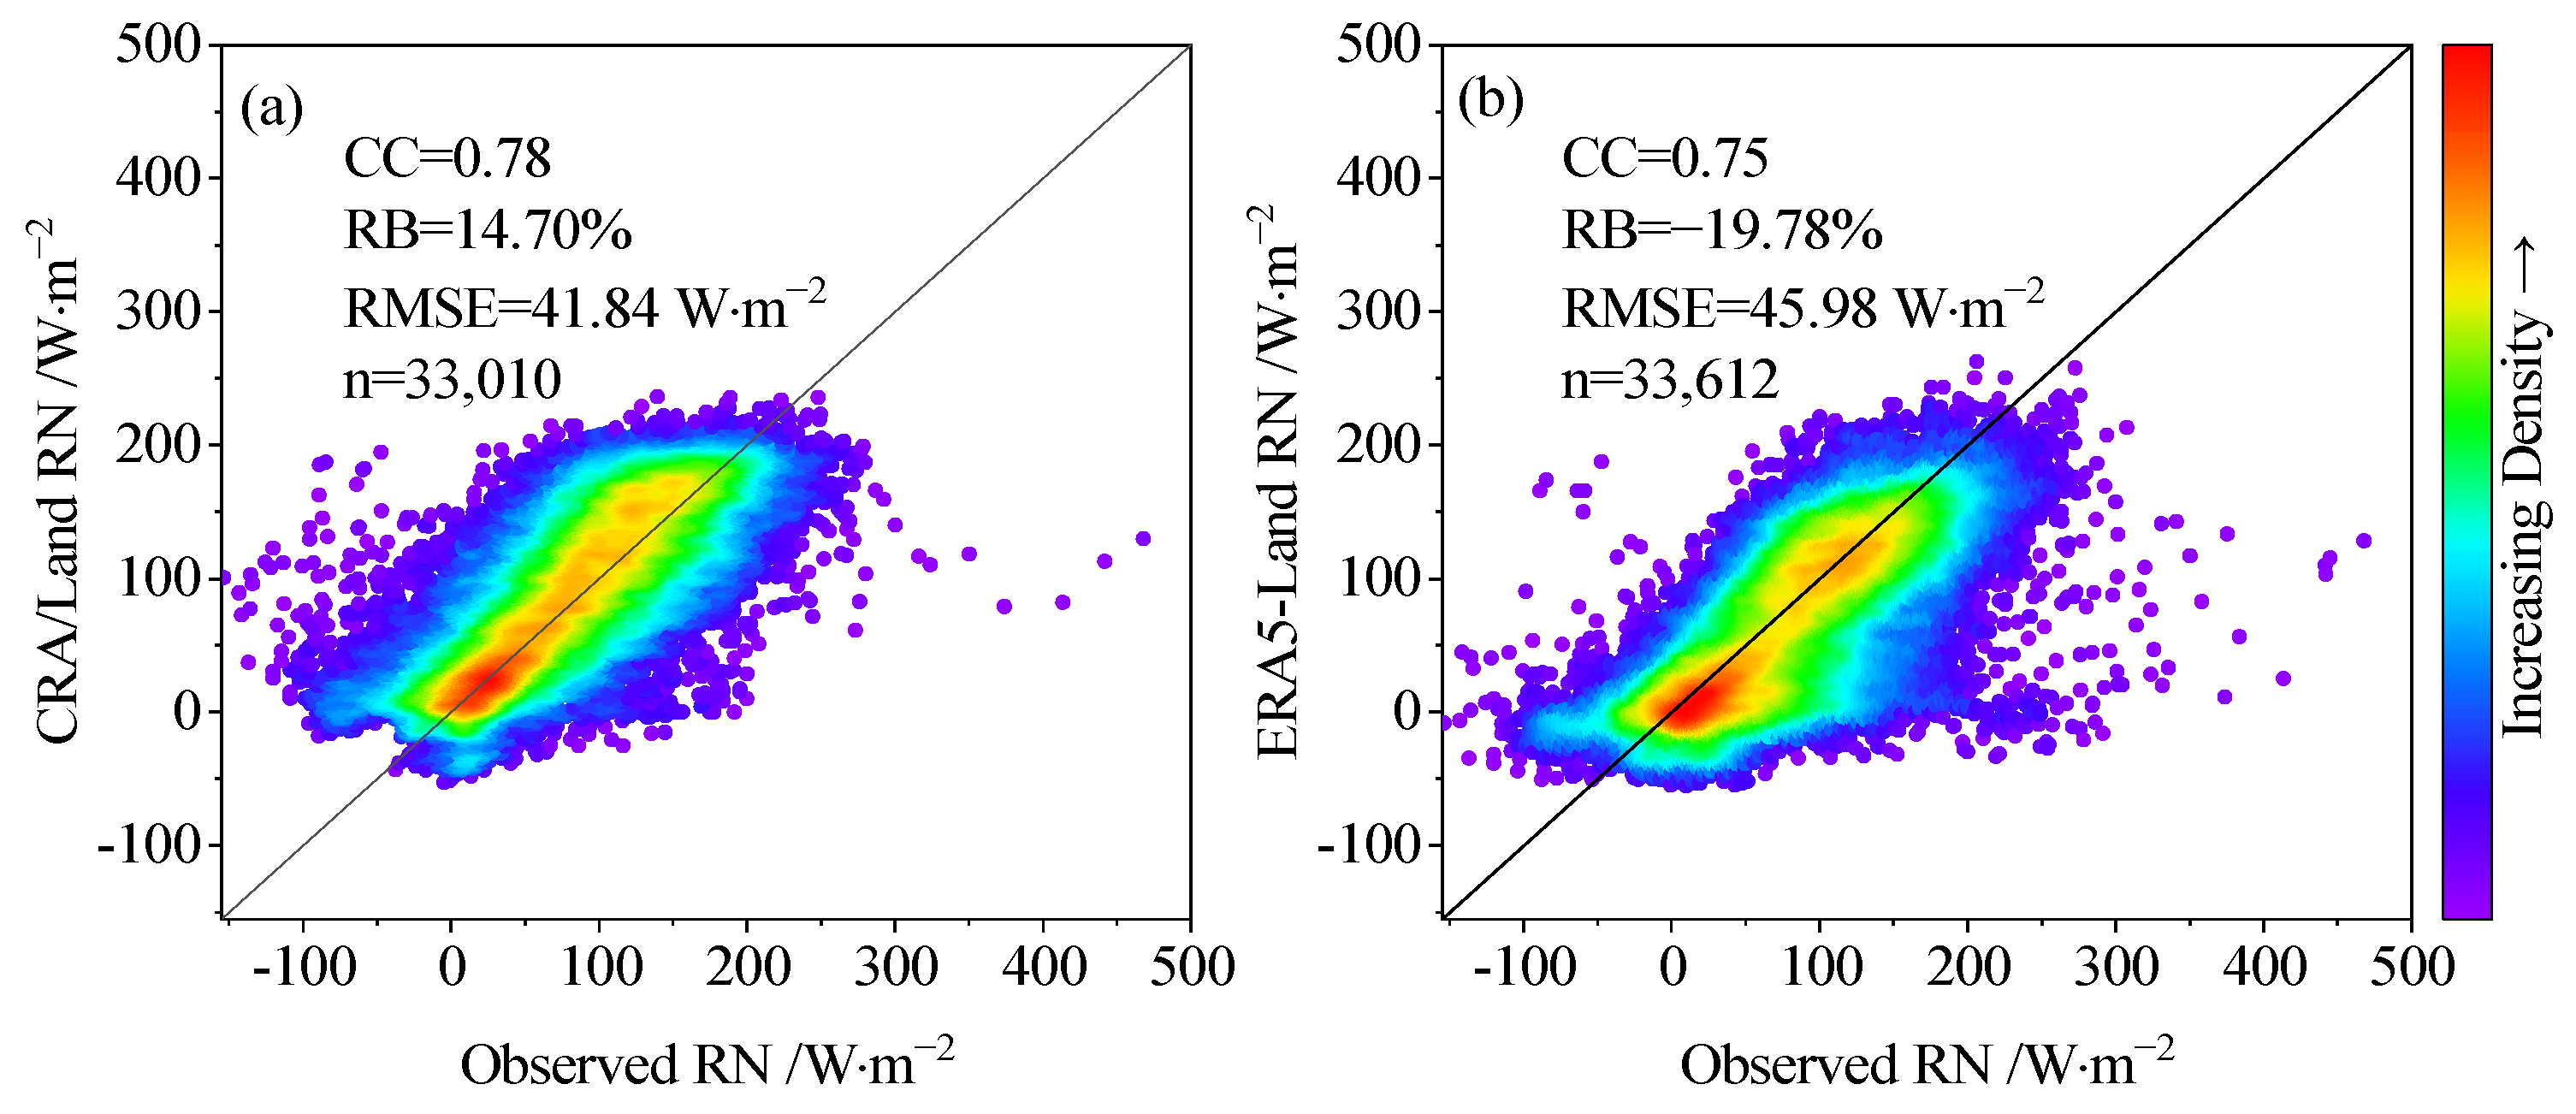
3.1.1. Validation Results at the Daily Scale

The daily RN samples from CRA/Land and ERA5-Land were compared with in situ observations, and the resulting density scatter plots is shown in Figure 2. Since CRA/Land has no RN data when the underlying surface is a lake, there are slightly fewer CRA/Land samples than ERA5-Land samples. Figure 2 shows that the CC, RB and RMSE of the CRA/Land samples were 0.78, 14.70% and 41.84 W·m−2, respectively, while the CC, RB and RMSE of the ERA5-Land samples were 0.75, −19.78% and 45.98 W·m−2, respectively. Previously, Jia et al. [2] evaluated the Clouds and the Earth’s Radiant Energy System (CERES) RN data at a global scale, and indicated that the R2 (square of CC) of CERES RN data at a daily scale was 0.79 and the RMSE was 33.56 W·m−2. Considering the high altitude and complex terrain of the TP, it is believed that the CRA/Land and ERA5-Land RN data have high credibility in the TP region. The RB values indicate that the CRA/Land RN data are larger while the ERA5-Land RN data are smaller than the in situ observations. The CC, RB and RMSE values also indicate that the CRA/Land RN data outperformed ERA5-Land in a comparison of the in situ observations at the daily scale.
The validation results of the CRA/Land and ERA5-Land RN at each site are shown in Figure 3. The results show that the CRA/Land and ERA5-Land samples have higher consistency with the in situ observations in the northeast of the TP, and the CC values of most sites are above 0.7 (Figure 3a,b). The RB value of each site indicates that CRA/Land overestimated while ERA5-Land underestimated the RN at most sites (Figure 3c,d). The RMSE value of each station reveals that the CRA/Land RN data have a larger error in the central part and a smaller error in the northeast of the TP, while ERA5-Land showed the opposite (Figure 3e,f). From the average of CC, RB and RMSE at each site, the CRA/Land RN data at the daily scale are generally better than ERA5-Land in the TP.
DSR, USR, DLR and ULR are four components of net radiation, and their accuracy directly affects the applicability of the net radiation data from the Tibetan Plateau. Therefore, the accuracy of these four components was also evaluated. From Figure 4 and Figure 5, it can be seen that the DSR, DLR and ULR recorded via CRA/Land and ERA5-Land are consistent with the observed data, with CC values above 0.79. The consistency between the USR recorded via CRA/Land and ERA5-Land and the observed data is relatively poor, with CC values of 0.33 and 0.40, respectively. The RB values indicate that both CRA/Land and ERA5-Land overestimate DSR and USR, and underestimate DLR and ULR. The RMSE values indicate that the accuracy of the DSR recorded via ERA5-Land is higher than that of CRA/Land, but the accuracy of the USR, DLR and ULR is lower than that of CRA/Land.

3.1.2. Validation Results at the Monthly Scale

The monthly CRA/Land and ERA5-Land RN data were also compared to the in situ observations. The evaluation method of the monthly scale data is consistent with that of the daily scale data. However, more observation sites were available at the monthly scale relative to the daily scale. The resulting density scatter plots are shown in Figure 6. From the evaluation results of the overall data, the CRA/Land and ERA5-Land samples have better consistency and smaller deviation from the observed data on the monthly scale than on the daily scale. Although the CC value of the ERA5-Land data is slightly higher than that of CRA/Land, both the RB and RMSE values of CRA/Land are better than those of ERA5-Land. Therefore, the CRA/Land RN data are generally better than the ERA5-Land’s at the monthly scale, which is consistent with the results obtained at the daily scale. Figure 7 shows the evaluation results for each site, and it can be seen that the CC values at most sites are above 0.9, and the mean values of CC based on ERA5-Land at the monthly scale are close to those of CRA/Land. CRA/Land overestimated while ERA5-Land underestimated RN at the monthly scale, but the absolute values of RB obtained based on CRA/Land and ERA5-Land are very close. The average RMSE obtained based on CRA/Land is slightly lower than that of ERA5-Land, indicating that the accuracy of CRA/Land net radiation data at the monthly scale is slightly higher than that of ERA5-Land.

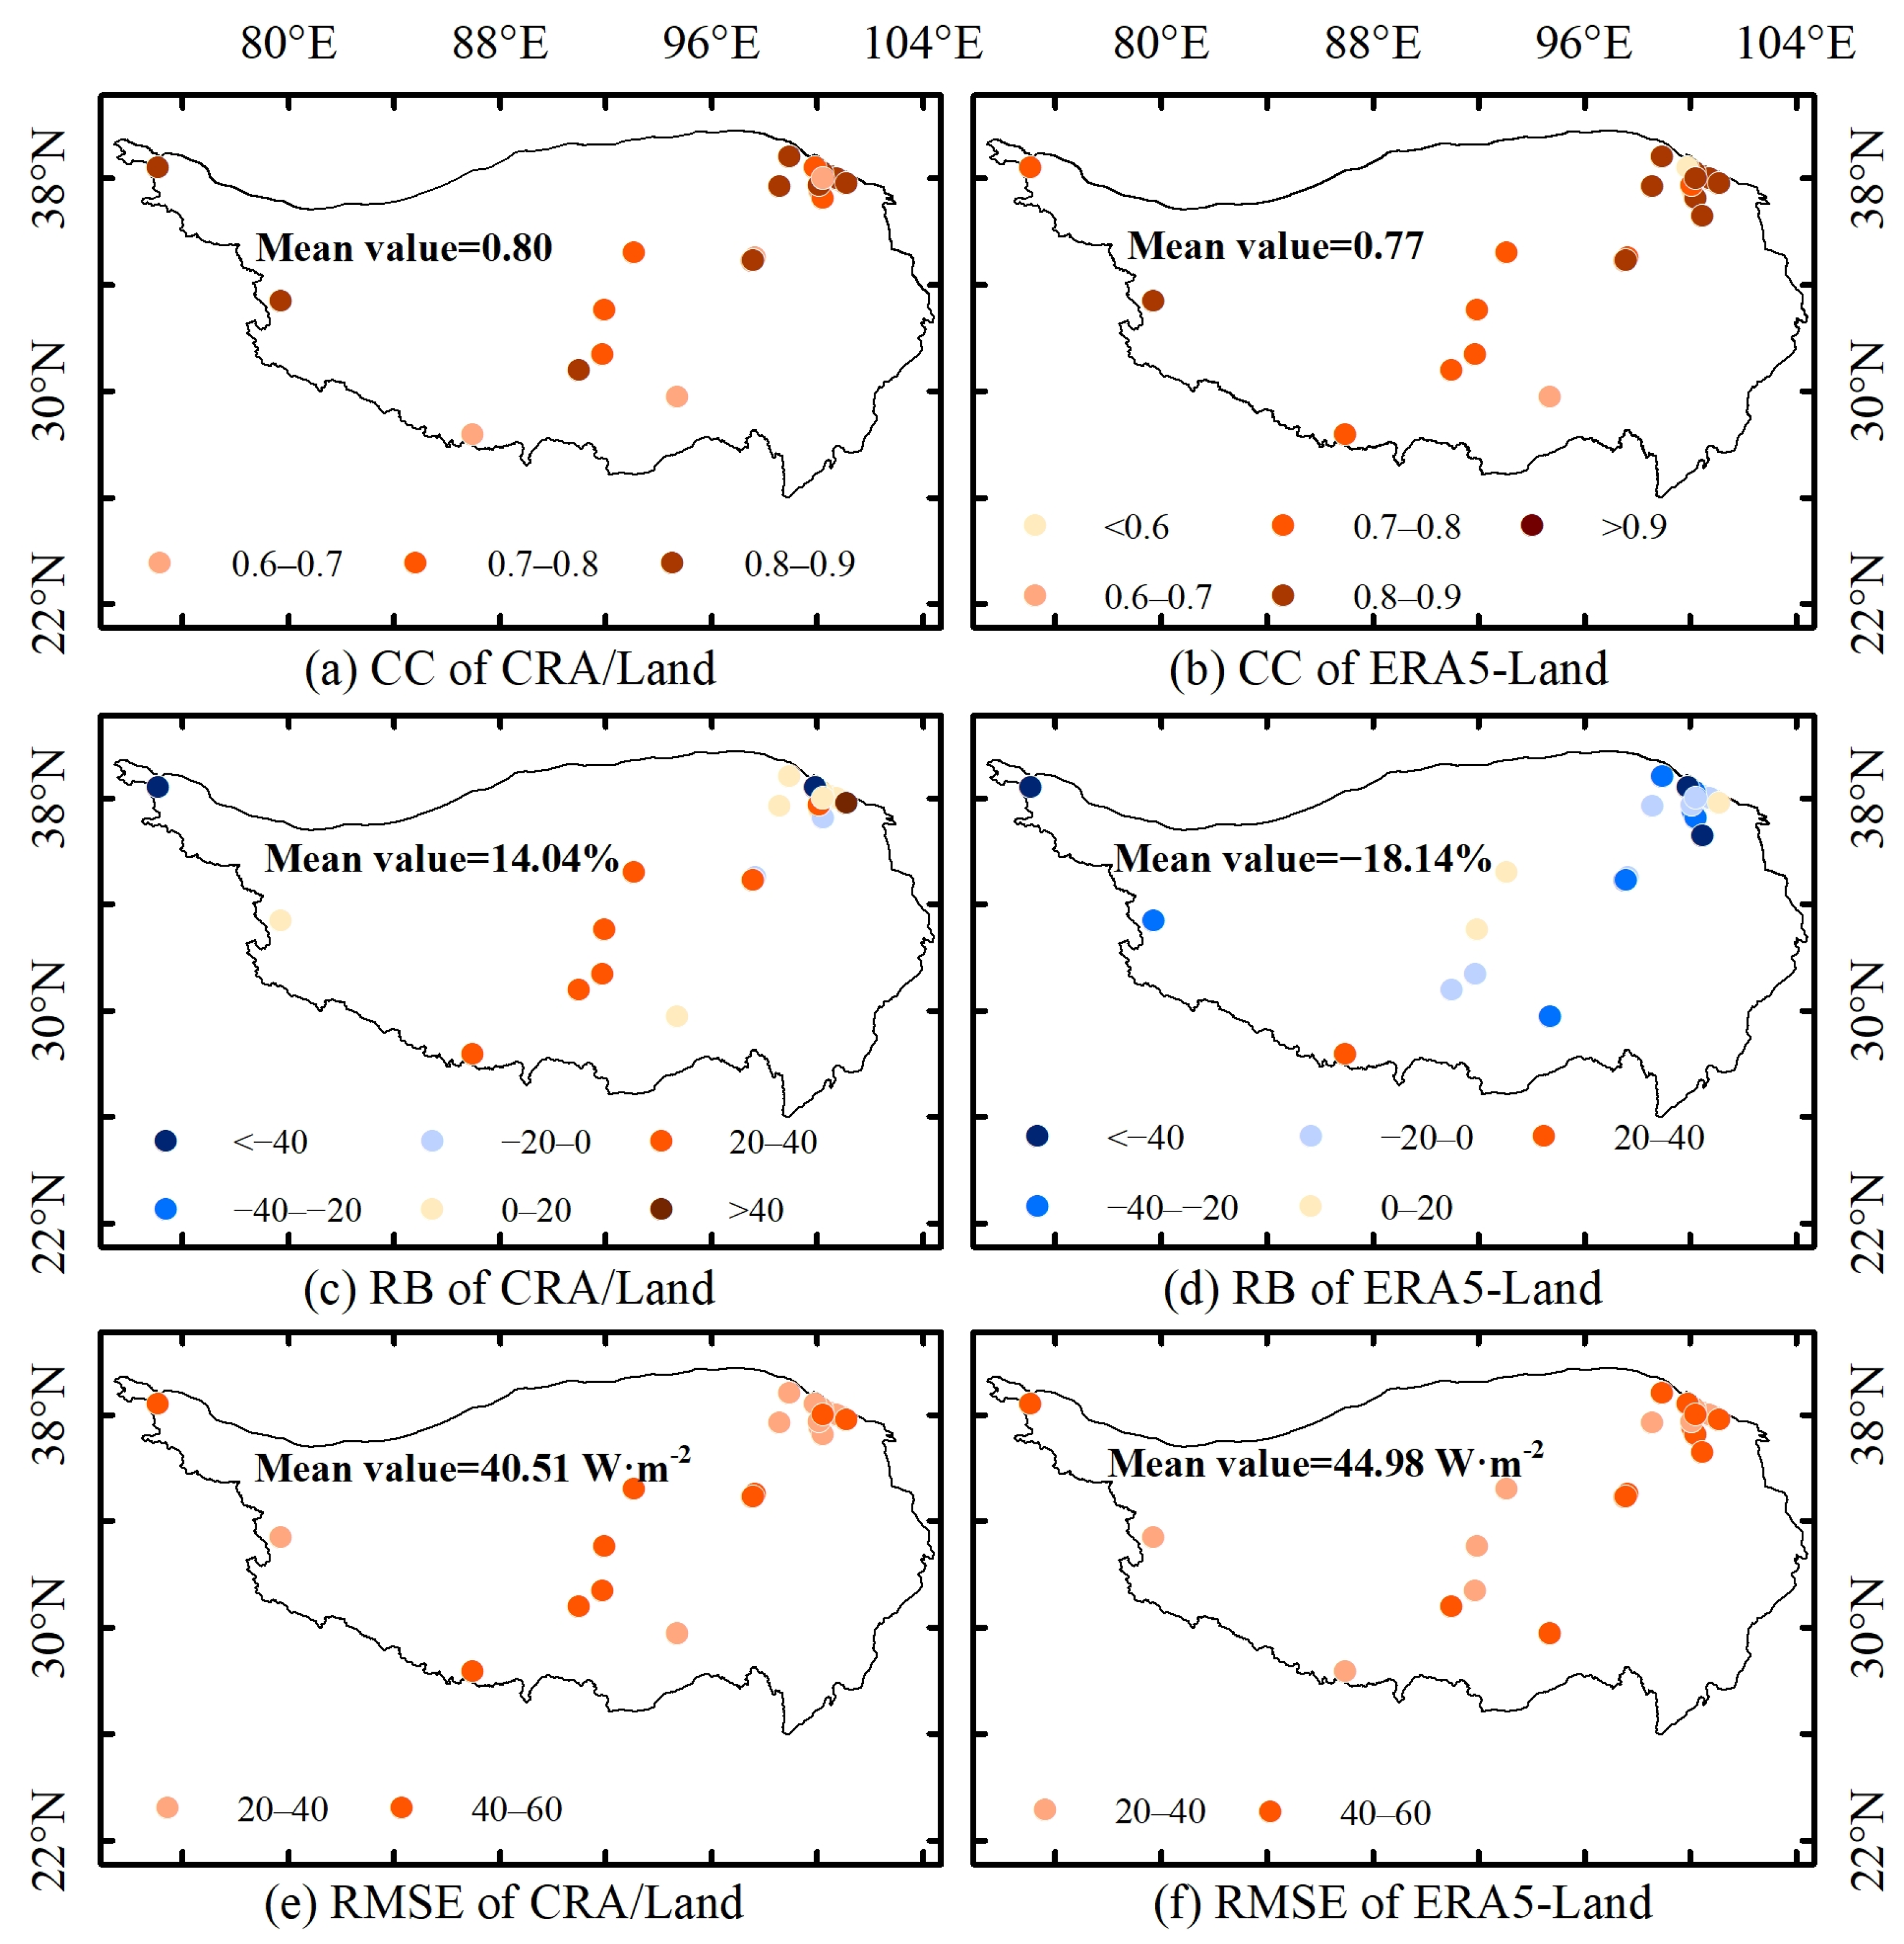
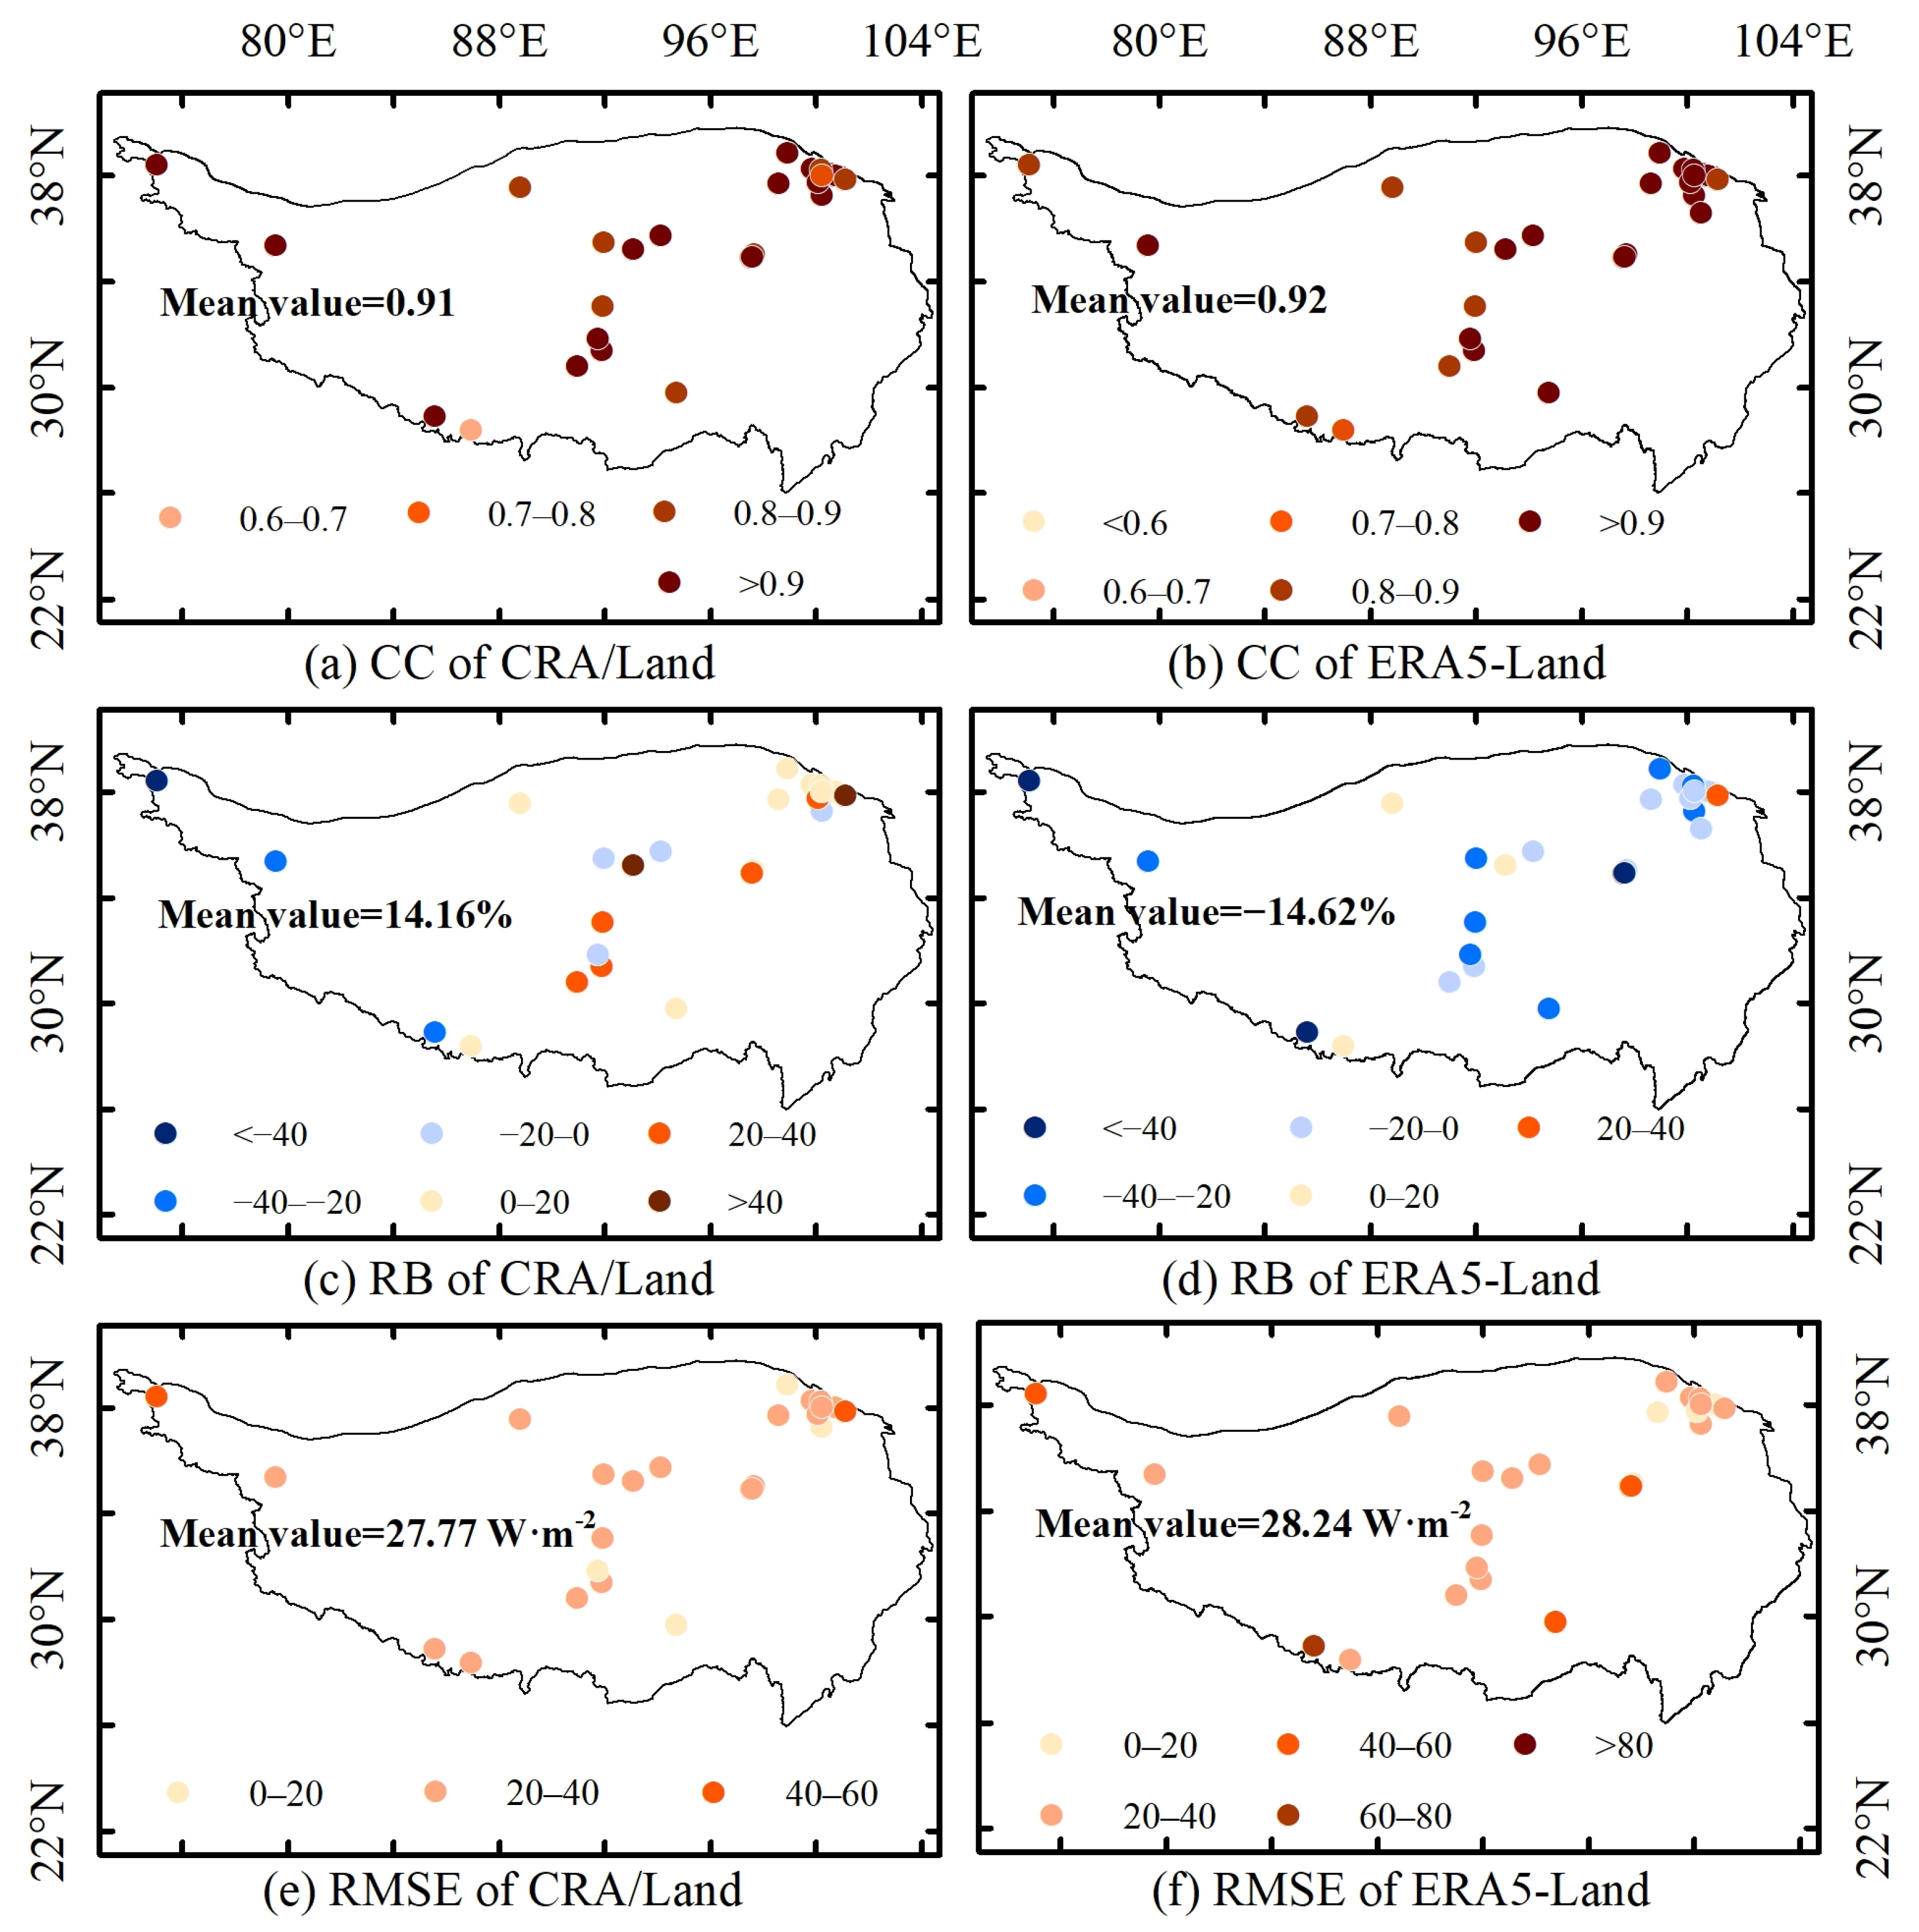
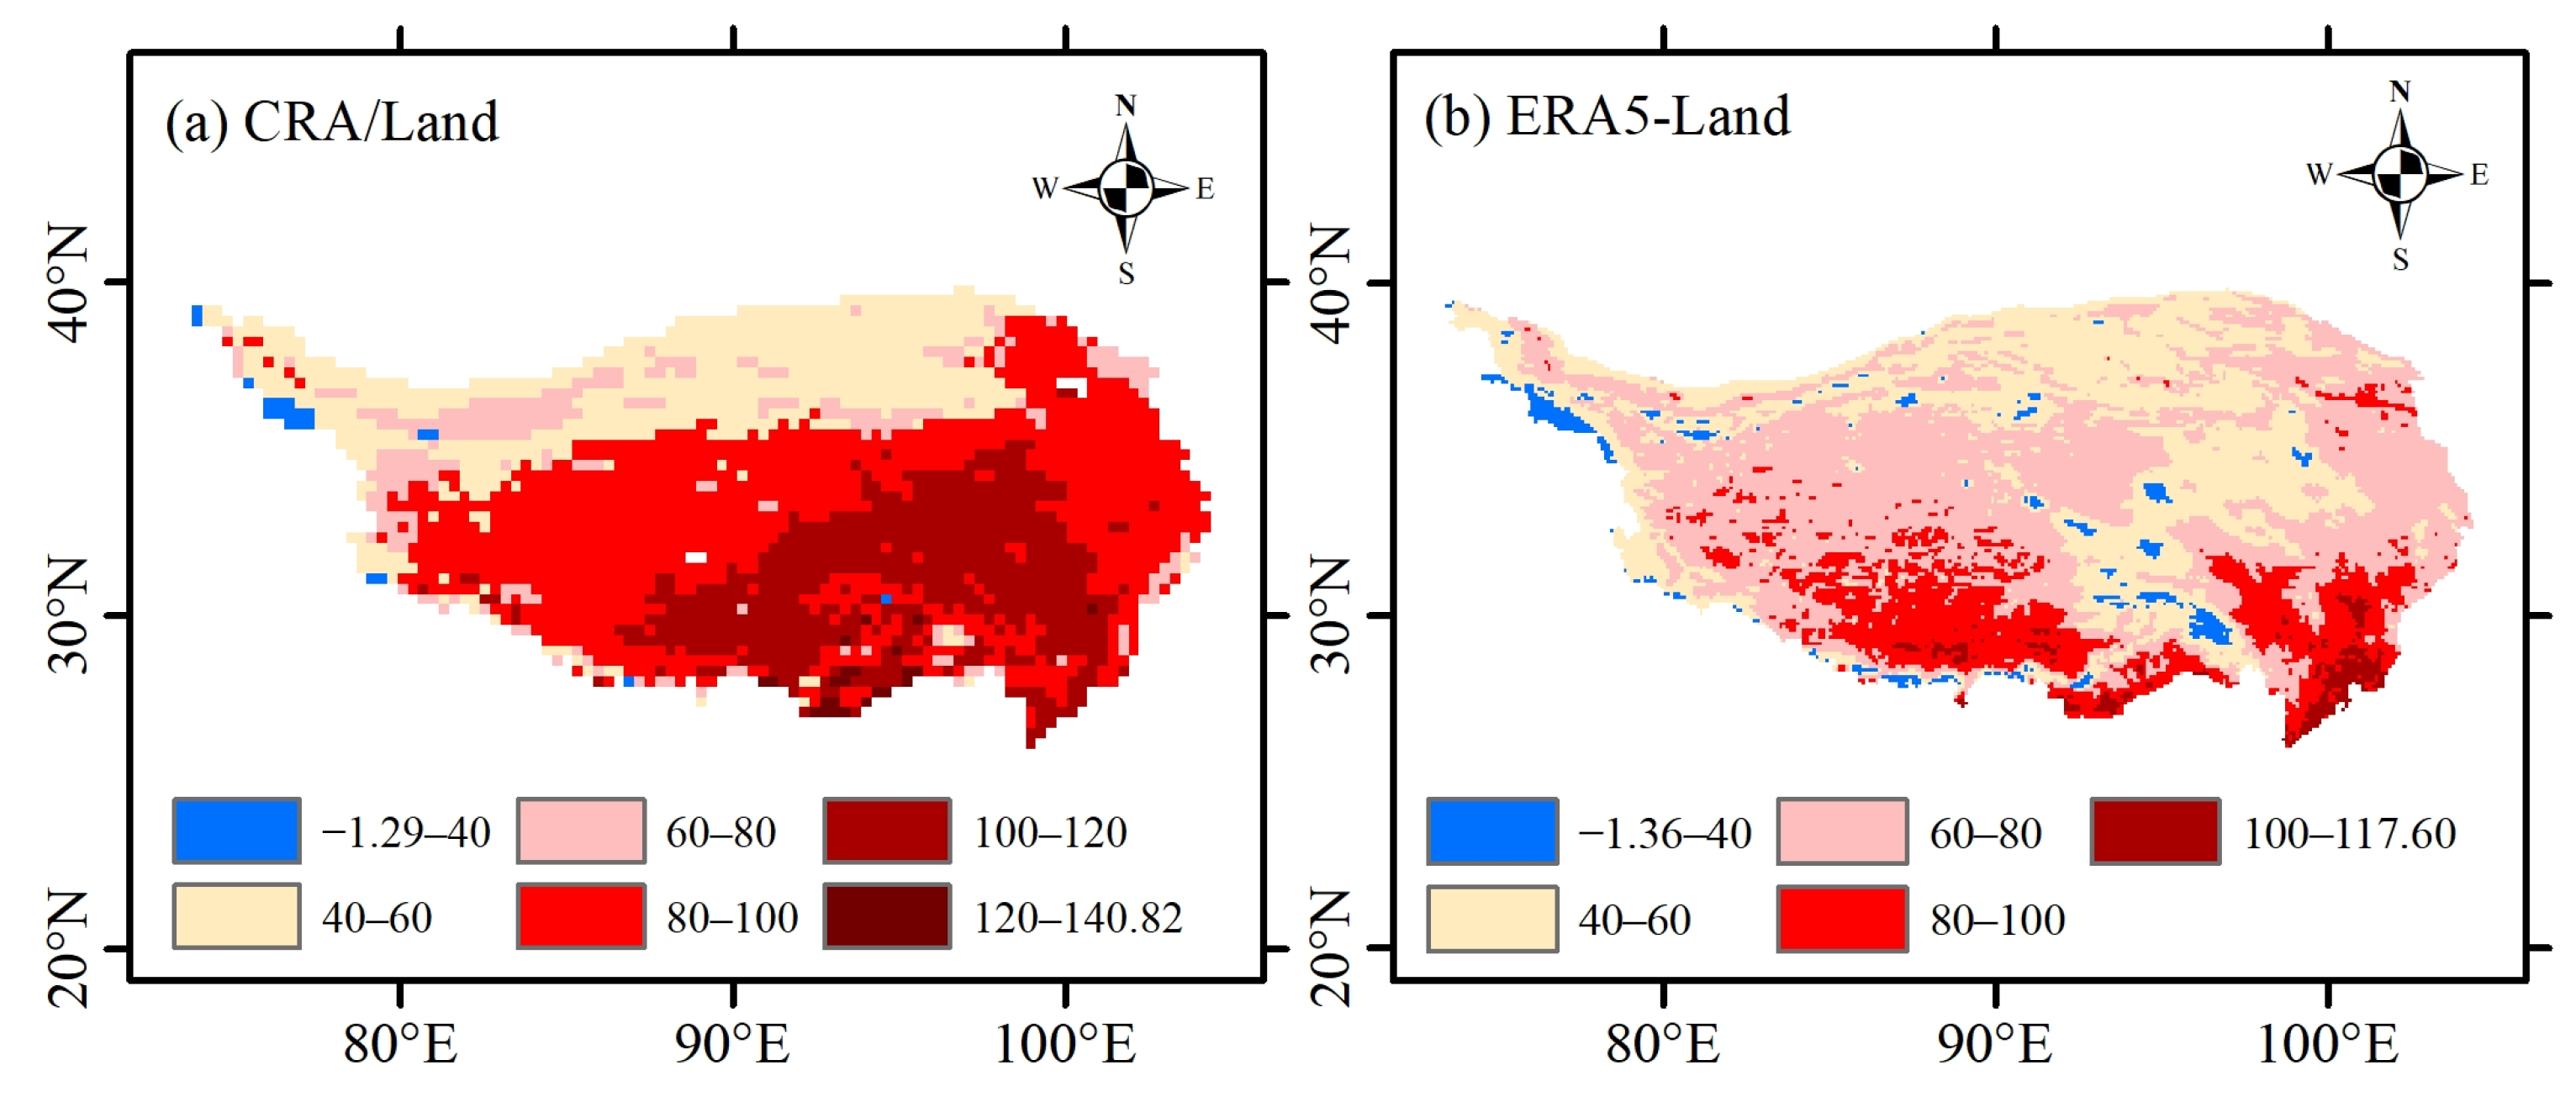
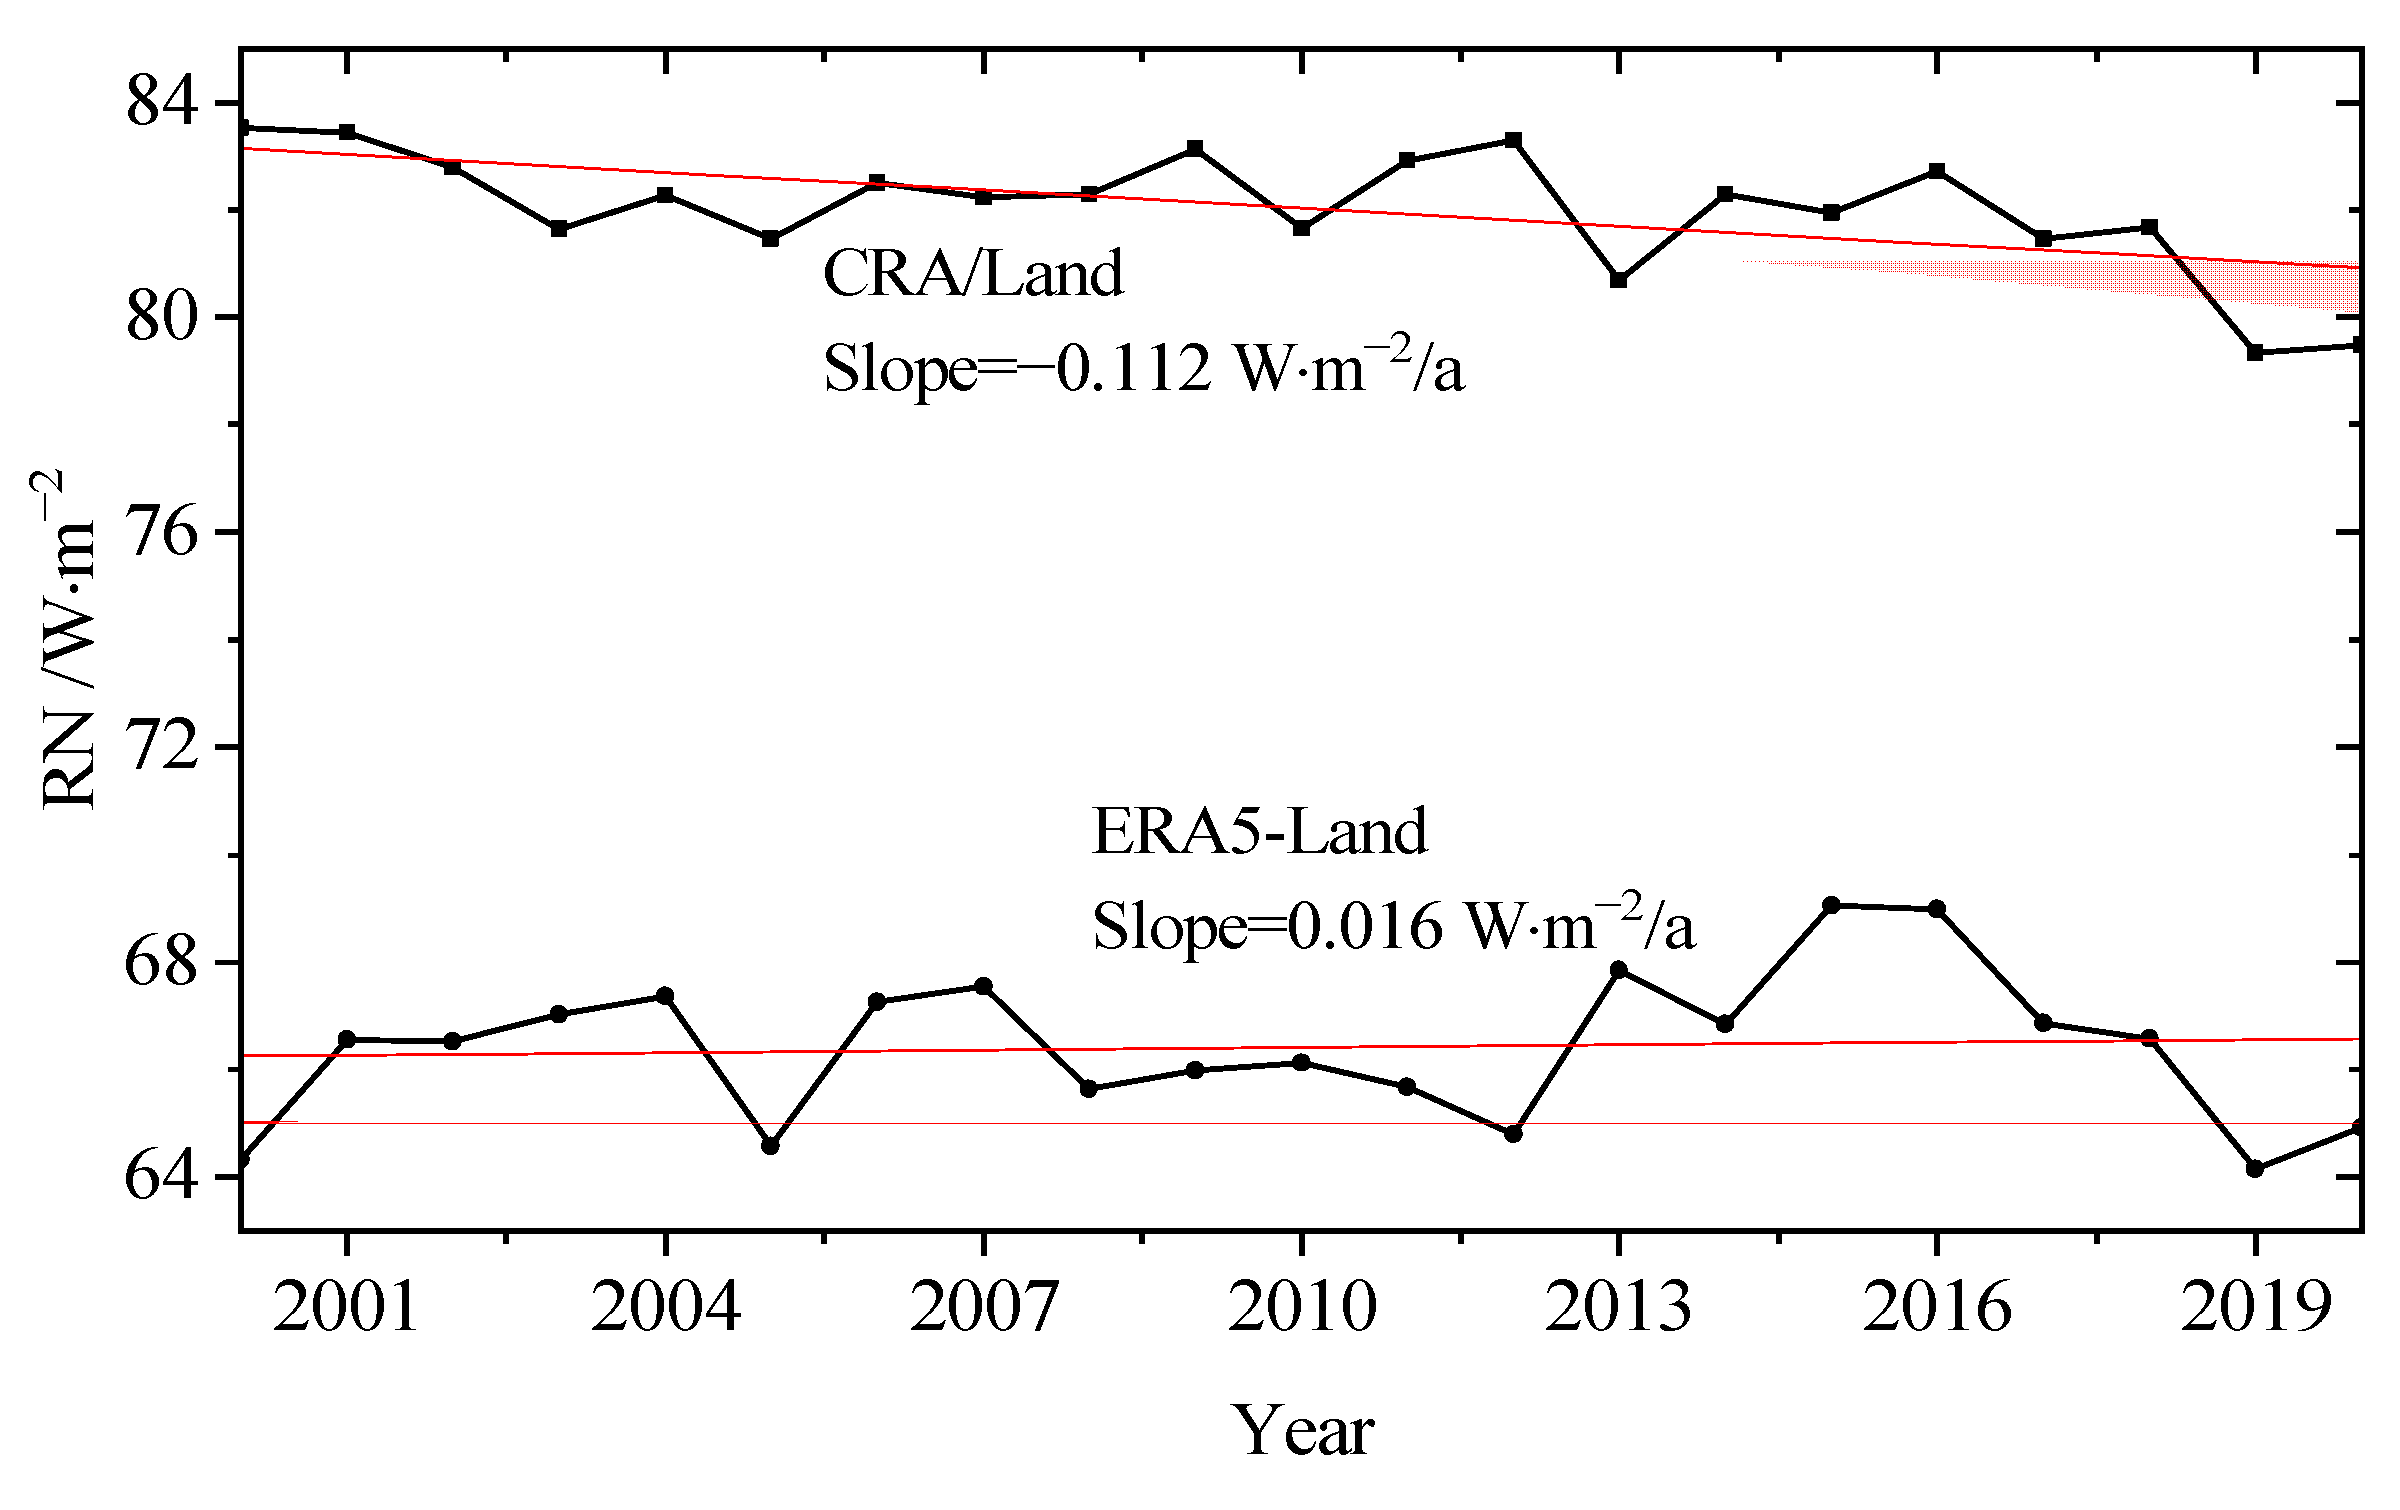
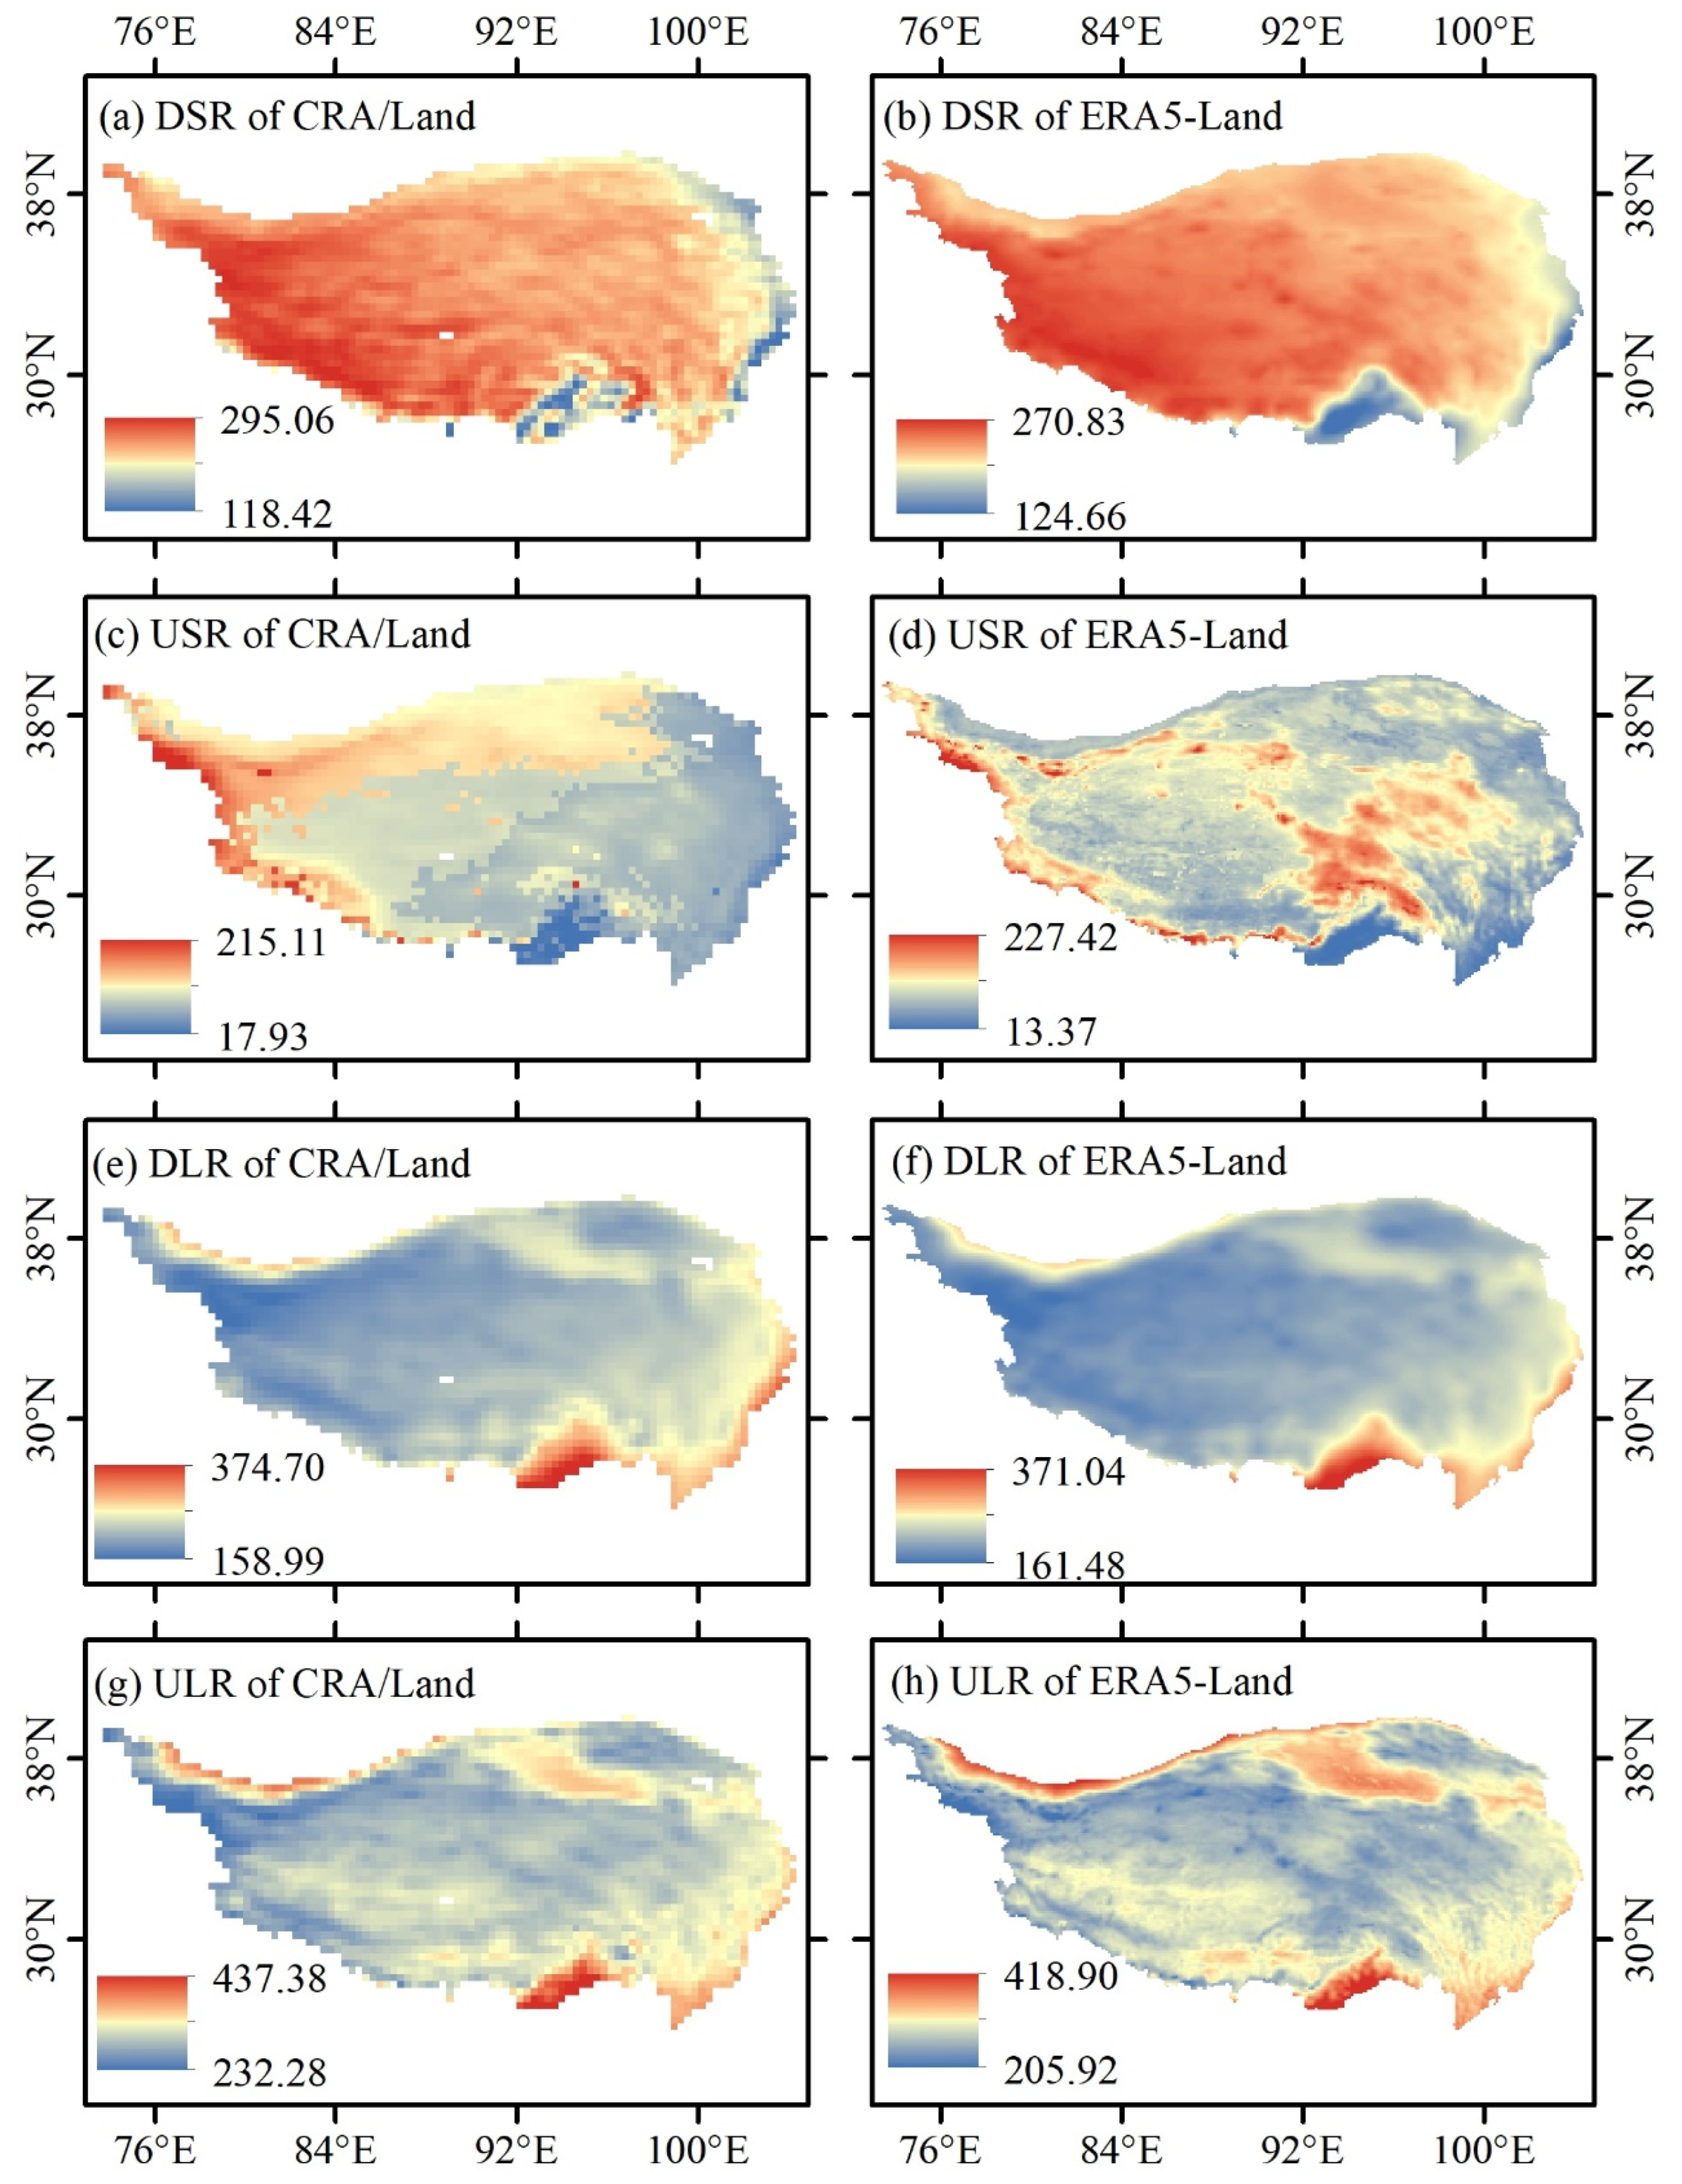
3.2. Spatiotemporal Analysis

The annual RN was obtained by averaging the CRA/Land and ERA5-Land daily values, and then the spatiotemporal patterns of the mean annual RN over the TP were obtained based on data from 2000 to 2020 (Figure 8 and Figure 9). Spatially, both CRA/Land and ERA5-Land reveal that the annual average RN of the TP is mainly concentrated between 40 W·m−2 and 120 W·m−2, and the RN is low in the north and high in the south. However, there are significant differences in the RN patterns in the TP that were revealed by the two datasets. For example, the CRA/Land data indicate that the RN value in the central TP is relatively high (100~120 W·m−2), while the ERA5 Land data indicate that the RN value in this area is relatively low (40~60 W·m−2). In terms of time, the annual average RN of the TP from 2000 to 2020 based on CRA/Land and ERA5-Land showed opposite trends. The CRA/Land data showed that the RN of the TP showed a downward trend with a slope of −0.112 W·m−2/a, while the ERA5-Land data showed an upward trend with a change rate of 0.016 W·m−2/a.

4. Discussion

Spatially, there are large differences in RN between the CRA/Land and ERA5-Land data in the TP. In order to analyze the main reasons for this difference, we compared the spatiotemporal distribution of the four components of RN (Figure 10 and Figure 11). It can be seen from Figure 10 and Figure 11 that the spatial distribution and trend of DSR, DLR and ULR in the TP based on CRA/Land and ERA5-Land have good consistency. However, there are large differences in the spatial distribution and trend of USR between CRA/Land and ERA5-Land. The CRA/Land data indicate that the USR values are high in the western and northwestern parts of the TP, but the ERA5-Land data indicate that the USR values are high in the central and western parts of the TP. Figure 11 also shows that the CRA/Land USR in the TP showed an increasing trend from 2001 to 2020, while ERA5 Land indicated a decreasing trend. This result indicates that the inconsistency in USR data is the main reason for the large differences in the spatiotemporal distribution of CRA/Land and ERA5-Land RN in the TP.
The evaluation results based on in situ observations also indicate that the accuracies of the CRA/Land and ERA5-Land USR data are the worst compared to the other RN components. The spatial resolutions of CRA/Land and ERA5-Land are 0.1° and 34 km, respectively. The USR is mainly affected by surface conditions, and the surface conditions represented by this coarse resolution grid may have large differences between the observation stations. This may be an important reason for the inconsistency between the CRA/Land and ERA5-Land USR and the observed data. In addition, the USR data of CRA/Land were obtained through the Noah land surface model (LSM), while the USR data of ERA5-Land were obtained through the ECMWF LSM. From the physical processes of the two models, albedo is a key parameter for calculating USR, and albedo is obtained based on a static monthly climatology [15,42]. However, cold season snow cover and warm season soil moisture are the main factors affecting albedo [43,44,45], and Noah and ECMWF’s schemes make it difficult to accurately describe the changes in albedo caused by snow cover and soil moisture. In particular, in terms of snow albedo, there is a large error in the cold season precipitation data [46]. Coupled with the complex snow blowing process by the wind, it is currently difficult for existing LSMs to accurately simulate the snow cover process in the TP. This is also another important reason why the consistency between the CRA/Land and ERA5-Land USR and observation data is the worst.

5. Conclusions

In this study, we compared the accuracy of CRA/Land and ERA5-Land RN datasets over the TP by comparing them with in situ observations, and analyzed the spatiotemporal pattern of RN. The conclusions can be summarized as follows:
(1) The daily validations for CRA/Land had a CC of 0.78, RB of 14.70% and RMSE of 41.48 W·m−2, and the monthly validations had a CC of 0.86, RB of 6.83% and RMSE of 28.72 W·m−2; the daily validations for ERA5-Land had a CC of 0.75, RB of −19.78% and RMSE of 45.98 W·m−2, and the monthly validations had a CC of 0.87, RB of −21.03% and RMSE of 31.31 W·m−2. This means that CRA/Land RN outperformed ERA5-Land when comparing observations at the daily and monthly scale. Spatially, the CRA/Land RN data have a larger error in the central part and a smaller error in the northeast of the TP, while ERA5-Land showed the opposite.
(2) DSR, USR, DLR and ULR are the four components of RN, and the evaluation results indicate that the DSR, DLR and ULR recorded by CRA/Land and ERA5-Land are consistent with the observed data with CC values above 0.79; however, the consistency between the USR values recorded by CRA/Land and ERA5-Land and the observed data is relatively poor. CRA/Land and ERA5-Land overestimate DSR and USR, and underestimate DLR and ULR. The accuracy of the DSR values recorded by ERA5-Land is higher than that of CRA/Land, but the accuracies of its USR, DLR and ULR values are lower than those of CRA/Land.
(3) During 2000 and 2020, both CRA/Land and ERA5-Land reveal that the annual average RN is low in the north and high in the south of the TP, but the spatial pattern of RN revealed by the two datasets shows significant differences in most regions. Trend analysis indicates that the CRA/Land RN of the TP showed a downward trend with a slope of −0.112 W·m−2/a, while ERA5-Land data showed an upward trend with a change rate of 0.016 W·m−2/a. The uncertainty of the USR data is the main reason for the significant differences in the spatiotemporal distribution of CRA/Land and ERA5-Land RN data in the TP.

Author Contributions

Conceptualization, L.G. and L.Z.; methodology, L.G.; validation, L.G., Y.Z. and L.Z.; formal analysis, L.G.; investigation, L.G.; data curation, L.G.; writing—original draft preparation, L.G.; writing—review and editing, Y.Z.; visualization, L.G.; supervision, L.Z.; project administration, L.G.; funding acquisition, L.G. All authors have read and agreed to the published version of the manuscript.

Funding

This research was funded by the National Natural Sciences Foundation of China (grant number 42001060), the Natural Science Foundation of Qinghai Province (grant number 2022-ZJ-711), the National cryosphere desert data center (grant number E01Z7902) and the Capability improvement project for cryosphere desert data center of the Chinese Academy of Sciences (grant number Y9298302).

Institutional Review Board Statement

Not applicable.

Informed Consent Statement

Not applicable.

Data Availability Statement

Publicly available datasets were analyzed in this study. The CRA/Land data can be downloaded from the website http://data.cma.cn/data/cdcdetail/dataCode/NAFP_CRA40_FTM_DAY_NC.html (accessed on 30 March 2023). The ERA5-Land data can be downloaded from the website https://cds.climate.copernicus.eu/cdsapp#!/dataset/reanalysis-era5-land?tab=overview (accessed on 30 March 2023). The observed data can be downloaded from the website https://www.tpdc.ac.cn/home (accessed on 26 April 2023) and http://www.ncdc.ac.cn (accessed on 20 April 2023).

Acknowledgments

We are grateful to the China Meteorological Administration (CMA), European Centre for Medium-Range Weather Forecasts (ECMWF), National Tibetan Plateau Data Center of China (TPDC) and National Cryosphere Desert Data Center of China (NCDC) for providing the reanalysis and observed data for this study.

Conflicts of Interest

The authors declare no conflict of interest.

Abbreviations

RNSurface Net Radiation
TPTibetan Plateau
CRA/LandChina Meteorological Administration Global Land Surface Reanalysis Products
ECMWFEuropean Centre for Medium-Range Weather Forecasts
ERA5-LandECMWF Land Surface Reanalysis version 5
DSRDownwelling Shortwave Radiation
USRUpwelling Shortwave Radiation
DLRDownwelling Longwave Radiation
ULRUpwelling Longwave Radiation
SRNNet Downward Shortwave Radiation
LRNNet Downward Longwave Radiation
CCCorrelation Coefficient
RBRelative Bias
RMSERoot Mean Squared Error
LSMLand Surface Model

References

  1. Liang, S.; Wang, D.; He, T.; Yu, Y. Remote sensing of earth’s energy budget: Synthesis and review. Int. J. Digit. Earth 2019, 12, 737–780. [Google Scholar] [CrossRef]
  2. Jia, A.; Jiang, B.; Liang, S.; Zhang, X.; Ma, H. Validation and spatiotemporal analysis of CERES surface net radiation product. Remote Sens. 2016, 8, 90. [Google Scholar] [CrossRef]
  3. Wu, B.; Liu, S.; Zhu, W.; Yan, N.; Xing, Q.; Tan, S. An improved approach for estimating daily net radiation over the Heihe River Basin. Sensors 2017, 17, 86. [Google Scholar] [CrossRef]
  4. Mendes, K.R.; Campos, S.; Mutti, P.R.; Ferreira, R.R.; Ramos, T.M.; Marques, T.V.; dos Reis, J.S.; de Lima Vieira, M.M.; Silva, A.C.N.; Oliveira, C.P.; et al. Assessment of SITE for CO2 and Energy Fluxes Simulations in a Seasonally Dry Tropical Forest (Caatinga Ecosystem). Forests 2021, 12, 86. [Google Scholar] [CrossRef]
  5. Munkhjargal, M.; Menzel, L. Estimating daily average net radiation in Northern Mongolia. Geogr. Ann. A 2019, 101, 177–194. [Google Scholar] [CrossRef]
  6. Zhang, F.; Li, H.; Wang, W.; Li, Y.; Lin, L.; Guo, X.; Du, Y.; Li, Q.; Yang, Y.; Cao, G.; et al. Net radiation rather than surface moisture limits evapotranspiration over a humid alpine meadow on the northeastern Qinghai-Tibetan Plateau. Ecohydrology 2018, 11, e1925. [Google Scholar] [CrossRef]
  7. Yan, Y.; Tang, J.; Wang, S.; Niu, X.; Wang, L. Uncertainty of land surface model and land use data on WRF model simulations over China. Clim. Dynam. 2021, 57, 1833–1851. [Google Scholar] [CrossRef]
  8. Yang, K.; Chen, Y.Y.; Qin, J. Some practical notes on the land surface modeling in the Tibetan Plateau. Hydrol. Earth Syst. Sci. 2009, 13, 687–701. [Google Scholar] [CrossRef]
  9. Bisht, G.; Bras, R.L. Estimation of net radiation from the MODIS data under all sky conditions: Southern Great Plains case study. Remote Sens. Environ. 2010, 114, 1522–1534. [Google Scholar] [CrossRef]
  10. Jia, A.; Liang, S.; Jiang, B.; Zhang, X.; Wang, G. Comprehensive assessment of global surface net radiation products and uncertainty analysis. J. Geophys. Res.-Atmos. 2018, 123, 1970–1989. [Google Scholar] [CrossRef]
  11. Kim, H.Y.; Liang, S. Development of a hybrid method for estimating land surface shortwave net radiation from MODIS data. Remote Sens. Environ. 2010, 114, 2393–2402. [Google Scholar] [CrossRef]
  12. Liang, S.; Wang, K.; Zhang, X.; Wild, M. Review on estimation of land surface radiation and energy budgets from ground measurement, remote sensing and model simulations. IEEE. J-STARS 2010, 3, 225–240. [Google Scholar] [CrossRef]
  13. Liang, S.; Cheng, J.; Jia, K.; Jiang, B.; Liu, Q.; Xiao, Z.; Yao, J.; Yuan, W.; Zhang, X.; Zhao, X.; et al. The global land surface satellite (GLASS) product suite. Bull. Am. Meteorol. Soc. 2021, 102, E323–E337. [Google Scholar] [CrossRef]
  14. Myeni, L.; Moeletsi, M.E.; Clulow, A.D. Assessment of three models for estimating daily net radiation in southern Africa. Agric. Water. Manag. 2020, 229, 105951. [Google Scholar] [CrossRef]
  15. Muñoz-Sabater, J.; Dutra, E.; Agustí-Panareda, A.; Albergel, C.; Arduini, G.; Balsamo, G.; Boussetta, S.; Choulga, M.; Harrigan, S.; Hersbach, H.; et al. ERA5-Land: A state-of-the-art global reanalysis dataset for land applications. Earth. Syst. Sci. Data 2021, 13, 4349–4383. [Google Scholar] [CrossRef]
  16. Popov, Z.; Nagy, Z.; Baranka, G.; Weidinger, T. Assessments of Solar, Thermal and Net Irradiance from Simple Solar Geometry and Routine Meteorological Measurements in the Pannonian Basin. Atmosphere 2021, 12, 935. [Google Scholar] [CrossRef]
  17. Chen, J.; He, T.; Jiang, B.; Liang, S. Estimation of all-sky all-wave daily net radiation at high latitudes from MODIS data. Remote Sens. Environ. 2020, 245, 111842. [Google Scholar] [CrossRef]
  18. Mira, M.; Olioso, A.; Gallego-Elvira, B.; Courault, D.; Garrigues, S.; Marloie, O.; Hagolle, O.; Guillevic, P.; Boulet, G. Uncertainty assessment of surface net radiation derived from Landsat images. Remote Sens. Environ. 2016, 175, 251–270. [Google Scholar] [CrossRef]
  19. Marques, H.O.; Biudes, M.S.; Pavão, V.M.; Machado, N.G.; Querino, C.A.S.; Danelichen, V.H.M. Estimated net radiation in an Amazon–Cerrado transition forest by Landsat 5 TM. J. Appl. Remote Sens. 2017, 11, 046020. [Google Scholar] [CrossRef]
  20. Ramírez-Cuesta, J.M.; Vanella, D.; Consoli, S.; Motisi, A.; Minacapilli, M. A satellite stand-alone procedure for deriving net radiation by using SEVIRI and MODIS products. Int. J. Appl. Earth Obs. Geoinf. 2018, 73, 786–799. [Google Scholar] [CrossRef]
  21. Verma, M.; Fisher, J.B.; Mallick, K.; Ryu, Y.; Kobayashi, H.; Guillaume, A.; Moore, G.; Ramakrishnan, L.; Hemdrix, V.; Wolf, S.; et al. Global surface net-radiation at 5 km from MODIS Terra. Remote Sens. 2016, 8, 739. [Google Scholar] [CrossRef]
  22. Decker, M.; Brunke, M.A.; Wang, Z.; Sakaguchi, K.; Zeng, X.; Bosilovich, M.G. Evaluation of the reanalysis products from GSFC, NCEP, and ECMWF using flux tower observations. J. Clim. 2012, 25, 1916–1944. [Google Scholar] [CrossRef]
  23. Wang, A.; Zeng, X. Evaluation of multireanalysis products with in situ observations over the Tibetan Plateau. J. Geophys. Res-Atmos. 2012, 117, D05102. [Google Scholar] [CrossRef]
  24. Zhang, L.; Gao, L. Drought and Wetness Variability and the Respective Contribution of Temperature and Precipitation in the Qinghai-Tibetan Plateau. Adv. Meteorol. 2021, 2021, 7378196. [Google Scholar] [CrossRef]
  25. Immerzeel, W.W.; Van Beek, L.P.H.; Bierkens, M.F.P. Climate change will affect the Asian water towers. Science 2010, 328, 1382–1385. [Google Scholar] [CrossRef] [PubMed]
  26. Qu, B.; Zhang, Y.; Kang, S.; Sillanpää, M. Water quality in the Tibetan Plateau: Major ions and trace elements in rivers of the “Water Tower of Asia”. Sci. Total Environ. 2019, 649, 571–581. [Google Scholar] [CrossRef]
  27. Yang, M.; Nelson, F.E.; Shiklomanov, N.I.; Guo, D.; Wan, G. Permafrost degradation and its environmental effects on the Tibetan Plateau: A review of recent research. Earth-Sci. Rev. 2010, 103, 31–44. [Google Scholar] [CrossRef]
  28. Yao, T.; Thompson, L.; Yang, W.; Yu, W.; Gao, Y.; Guo, X.; Yang, X.; Duan, K.; Zhao, H.; Xu, B.; et al. Different glacier status with atmospheric circulations in Tibetan Plateau and surroundings. Nat. Clim. Chang. 2012, 2, 663–667. [Google Scholar] [CrossRef]
  29. Yang, J.; Huang, M.; Zhai, P. Performance of the CRA-40/Land, CMFD, and ERA-Interim datasets in reflecting changes in surface air temperature over the Tibetan Plateau. J. Meteorol. Res. 2021, 35, 663–672. [Google Scholar] [CrossRef]
  30. Yang, K.; Pinker, R.T.; Ma, Y.; Koike, T.; Wonsick, M.M.; Cox, S.J.; Zhang, Y.; Stackhouse, P. Evaluation of satellite estimates of downward shortwave radiation over the Tibetan Plateau. J. Geophys. Res-Atmos. 2008, 113, D17204. [Google Scholar] [CrossRef]
  31. Ma, J.; Li, R.; Liu, H.; Huang, Z.; Wu, T.; Hu, G.; Xiao, Y.; Zhao, L.; Du, Y.; Yang, S. The Surface Energy Budget and Its Impact on the Freeze-thaw Processes of Active Layer in Permafrost Regions of the Qinghai-Tibetan Plateau. Adv. Atmos. Sci. 2022, 39, 189–200. [Google Scholar] [CrossRef]
  32. Wang, S.; Niu, F.; Zhao, L.; Li, S. The thermal stability of roadbed in permafrost regions along Qinghai–Tibet Highway. Cold Reg. Sci. Technol. 2003, 37, 25–34. [Google Scholar] [CrossRef]
  33. Zhang, G.; Kang, S.; Fujita, K.; Huintjes, E.; Xu, J.; Yamazaki, T.; Haginoya, S.; Wei, Y.; Scherer, D.; Schneider, C.; et al. Energy and mass balance of Zhadang glacier surface, central Tibetan Plateau. J. Glaciol. 2013, 59, 137–148. [Google Scholar] [CrossRef]
  34. Che, T.; Hao, X.; Dai, L.; Li, H.; Huang, X.; Lin, X. Snow cover variation and its impacts over the Qinghai-Tibet Plateau. Bull. Chin. Acad. Sci. 2019, 34, 1247–1253. [Google Scholar]
  35. Chen, R.S.; Song, Y.X.; Kang, E.S.; Han, C.T.; Liu, J.F.; Yang, Y.; Qing, W.W.; Liu, Z.W. A cryosphere-hydrology observation system in a small alpine watershed in the Qilian Mountains of China and its meteorological gradient. Arct. Antarct. Alp. Res. 2014, 46, 505–523. [Google Scholar] [CrossRef]
  36. Han, C.; Chen, R.; Liu, Z.; Yang, Y.; Liu, J.; Song, Y.; Wang, L.; Liu, G.; Guo, S.; Wang, X. Cryospheric hydrometeorology observation in the Hulu catchment (CHOICE), Qilian Mountains, China. Vadose Zone J. 2018, 17, 1–18. [Google Scholar] [CrossRef]
  37. Li, X.; Yang, X.; Ma, Y.; Hu, G.; Hu, X.; Wu, X.; Wang, P.; Huang, Y.; Cui, B.; Wei, J. Qinghai lake basin critical zone observatory on the Qinghai-Tibet Plateau. Vadose Zone J. 2018, 17, 1–11. [Google Scholar] [CrossRef]
  38. Ma, Y.; Hu, Z.; Xie, Z.; Ma, W.; Wang, B.; Chen, X.; Li, M.; Zhong, L.; Sun, F.; Gu, L.; et al. A long-term (2005–2016) dataset of hourly integrated land–atmosphere interaction observations on the Tibetan Plateau. Earth Syst. Sci. Data 2020, 12, 2937–2957. [Google Scholar] [CrossRef]
  39. Zhao, L.; Zou, D.; Hu, G.; Du, E.; Pang, Q.; Xiao, Y.; Li, R.; Sheng, Y.; Wu, X.; Sun, Z.; et al. Changing climate and the permafrost environment on the Qinghai–Tibet (Xizang) plateau. Permafr. Periglac. Process. 2020, 31, 396–405. [Google Scholar] [CrossRef]
  40. Zhao, L.; Zou, D.; Hu, G.; Wu, T.; Du, E.; Liu, G.; Xiao, Y.; Li, R.; Pang, Q.; Qiao, Y.; et al. A synthesis dataset of permafrost thermal state for the Qinghai–Tibet (Xizang) Plateau, China. Earth Syst. Sci. Data 2021, 13, 4207–4218. [Google Scholar] [CrossRef]
  41. Chai, T.; Draxler, R.R. Root mean square error (RMSE) or mean absolute error (MAE)?—Arguments against avoiding RMSE in the literature. Geosci. Model. Dev. 2014, 7, 1247–1250. [Google Scholar] [CrossRef]
  42. Mitchell, K. The community Noah land-surface model (LSM). User’s Guide Public Release Version. 2005. Available online: https://ftp.emc.ncep.noaa.gov/mmb/gcp/ldas/noahlsm/ver_2.7.1/ (accessed on 30 September 2023).
  43. Wang, W.; Yang, K.; Zhao, L.; Zheng, Z.; Lu, H.; Mamtimin, A.; Ding, B.; Li, X.; Zhao, L.; Li, H.; et al. Characterizing surface albedo of shallow fresh snow and its importance for snow ablation on the interior of the Tibetan Plateau. J. Hydrometeorol. 2020, 21, 815–827. [Google Scholar] [CrossRef]
  44. Pang, G.; Chen, D.; Wang, X.; Lai, H. Spatiotemporal variations of land surface albedo and associated influencing factors on the Tibetan Plateau. Sci. Total Environ. 2022, 804, 150100. [Google Scholar] [CrossRef] [PubMed]
  45. Zhang, L.; Zhao, L.; Li, R.; Gao, L.; Xiao, Y.; Qiao, Y.; Shi, J. Investigating the influence of soil moisture on albedo and soil thermodynamic parameters during the warm season in Tanggula Range, Tibetan Plateau. J. Glaciol. Geocryol. 2016, 38, 351–358. [Google Scholar]
  46. Zhang, L.; Gao, L.; Chen, J.; Zhao, L.; Zhao, J.; Qiao, Y.; Shi, J. Comprehensive evaluation of mainstream gridded precipitation datasets in the cold season across the Tibetan Plateau. J. Hydrol. Reg. Stud. 2022, 43, 101186. [Google Scholar] [CrossRef]
Figure 1. Surface net radiation observation stations on the Tibetan Plateau.
Atmosphere 14 01542 g001
Figure 2. Density scatter plots for the CRA/Land (a), ERA5-Land (b) and observed surface net radiation (RN) at the daily scale.
Atmosphere 14 01542 g002
Figure 3. Spatial distribution of the daily validation results of the CRA/Land ((a): CC; (c): RB; (e): RMSE) and ERA5-Land ((b): CC; (d): RB; (f): RMSE) RN data at each site.
Atmosphere 14 01542 g003
Figure 4. Density scatter plots for the CRA/Land and observed (a) downwelling shortwave radiation (DSR), (b) upwelling shortwave radiation (USR), (c) downwelling longwave radiation (DLR) and (d) upwelling longwave radiation (ULR) at the daily scale.
Atmosphere 14 01542 g004
Figure 5. Density scatter plots for the ERA5-Land and observed (a) downwelling shortwave radiation (DSR), (b) upwelling shortwave radiation (USR), (c) downwelling longwave radiation (DLR) and (d) upwelling longwave radiation (ULR) at the daily scale.
Atmosphere 14 01542 g005
Figure 6. Density scatter plots for the CR/Land (a), ERA5-Land (b) and observed surface net radiation (RN) at the monthly scale.
Atmosphere 14 01542 g006
Figure 7. Spatial distribution of the monthly validation results of the CRA/Land ((a): CC; (c): RB; (e): RMSE) and ERA5-Land ((b): CC; (d): RB; (f): RMSE) RN data at each site.
Atmosphere 14 01542 g007
Figure 8. Spatial patterns of the mean annual RN from the CRA/Land (a) and ERA5-Land (b) during the period from 2000 to 2020 in the TP.
Atmosphere 14 01542 g008
Figure 9. Temporal patterns of the areal mean annual RN from the CRA/Land and ERA5-Land during the period from 2000 to 2020 in the TP. The red band is the 95% confidence level for the curves.
Atmosphere 14 01542 g009
Figure 10. Spatial patterns of the mean annual downwelling shortwave radiation (DSR), upwelling shortwave radiation (USR), downwelling longwave radiation (DLR) and upwelling longwave radiation (ULR) from CRA/Land ((a): DSR; (c): USR; (e) DLR; (g) ULR) and ERA5-Land ((b): DSR; (d): USR; (f) DLR; (h) ULR) during the period from 2000 to 2020 in the TP.
Atmosphere 14 01542 g010
Figure 11. Temporal patterns of the areal mean annual (a) downwelling shortwave radiation (DSR), (b) upwelling shortwave radiation (USR), (c) downwelling longwave radiation (DLR) and (d) upwelling longwave radiation (ULR) from CRA/Land and ERA5-Land during the period from 2000 to 2020 in the TP.
Atmosphere 14 01542 g011
Table 1. Information from the RN observation stations over the TP.
StationLongitude (°E)Latitude (°N)Elevation (m)Land CoverTime IntervalPeriods
Wayanshan100.0937.743700Alpine wet meadow 30 min2017–2019
Wudaoliang93.0835.224783Alpine desert30 min2009–2014
Xidatan94.1335.724538Alpine meadowdaily2004–2018
Tanggula91.9433.075100Alpine meadowdaily2004–2018
Liangdaohe91.7431.824808Alpine wet meadow daily2014–2018
Zhuonaihu91.9635.494784Alpine desertdaily2013–2018
Ayakehu88.837.544300Alpine desertdaily2013–2018
Tianshuihai79.5535.364844Alpine desert daily2013–2018
BJ site of Nagqu Station of Plateau Climate and Environment91.931.374509Alpine meadow10 min2006–2016
Qomolangma Atmospheric and Environmental Observation and Research Station86.9528.364298Alpine desert1 h2006–2016
Southeast Tibet Observation and Research Station for the Alpine Environment94.7329.773327Alpine meadow1 h2008–2016
Ngari Desert Observation and Research Station79.733.394270Alpine desert1 h2009–2016
Muztagh Ata Westerly Observation and Research Station75.0538.413668Alpine desert1 h2010–2016
Nam Co Monitoring and Research Station for Multisphere Interactions90.9830.774730Alpine steppe1 h2005–2016
Qinghai Lake subalpine shrub station100.137.523495Shrub10 min2019–2020
Qinghai Lake warm grassland station100.2437.253210Alpine steppe10 min2019–2020
Qinghai Lake alpine meadow grassland hybrid super station98.637.73718Alpine meadow and steppe10 min2018–2020
Qinghai Lake Station100.536.583209Lake10 min2018–2019
A’rou freeze-thaw station100.4638.053033Alpine steppe30 min2007–2017
A’rou north-facing station100.4137.983536Alpine steppe30 min2013–2014
A’rou south-facing station100.5238.093529Alpine steppe30 min2013–2014
Dashalong98.9438.843739Alpine meadow30 min2013–2017
E’bao100.9237.953294Alpine steppe30 min2013–2016
Huangcaogou100.73383137Alpine steppe30 min2013–2015
Huangzangsi100.1938.232612Farmland30 min2013–2015
Jingyangling101.1237.843750Alpine meadow30 min2013–2017
Yakou snow station100.2438.014148Tundra30 min2014–2017
Hulugou99.8738.253232Shrubdaily2012–2013
Grassland Observation Site in the Eling Lake Basin97.5534.914280Alpine steppe30 min2012–2019
Eling Lake Observation Site97.6535.024274Lake30 min2012–2013
Eling Lake Observation Site97.5734.914275Lake30 min2013–2019
Sidalong99.9338.433146Forest10 min2018
Peicuokuhu85.5928.894590Lakedaily2015–2018
Disclaimer/Publisher’s Note: The statements, opinions and data contained in all publications are solely those of the individual author(s) and contributor(s) and not of MDPI and/or the editor(s). MDPI and/or the editor(s) disclaim responsibility for any injury to people or property resulting from any ideas, methods, instructions or products referred to in the content.

