Article

Market Segmentation and Haze Pollution in Yangtze River Delta Urban Agglomeration of China

1
School of Public Administration, Xi’an University of Architecture and Technology, Xi’an 710055, China
2
School of Public Administration, Central China Normal University, Wuhan 430079, China
*
Author to whom correspondence should be addressed.
Atmosphere 2023, 14(10), 1539; https://doi.org/10.3390/atmos14101539
Submission received: 15 August 2023 / Revised: 27 September 2023 / Accepted: 5 October 2023 / Published: 8 October 2023
(This article belongs to the Section Air Quality)

Abstract

:
Haze pollution not only has negative impact on public health and air quality, but also has restricted China’s industrial upgrading and high-quality development, and Chinese urban agglomerations are one of the areas hardest hit of haze pollution. In the process of China’s economic transformation, local governments will adopt local protectionism, leading to market segmentation. This is a phenomenon that refers to the distortion of resource allocation by local governments for the sake of vested interests and the existence of segmentation in commodity markets. This behavior is considered to be one of the important factors causing haze pollution. As Yangtze River Delta urban agglomerations are considered to be one of the earliest, fastest growing, and most mature for market integration in China, there is a lack of empirical testing on the impact of market segmentation on haze pollution in this urban agglomeration. Based on urban panel data from the period of 1998–2018 and the market segmentation index calculated by the relative price method, we use the dynamic spatial Durbin model and generalized space two-stage least squares method to explore the effect of market segmentation in urban agglomeration on haze pollution; the results are as follows: (1) Market segmentation significantly exacerbates haze pollution, in other words, haze pollution will increase by 2.14% when market segmentation increases by 1%. (2) Cities with a high degree of market segmentation and high levels of haze pollution have the potential to reduce pollution through market integration in the future. (3) Market segmentation in surrounding regions also has a significant worsening effect on haze pollution in the region. The indirect effect of market segmentation is 3.67 times that direct effect, indicating that the spatial spillover effect of market segmentation on haze pollution is greater than its own impact. (4) Mechanism analysis finds that it will aggravate haze pollution by hindering economic scale, industrial structure, and technological progress when the degree of market segmentation is high.

1. Introduction

The haze problem has always been the key issue in the transformation of China’s high-quality economic development. It has become an environmental focus since its widespread outbreak in 2013. It not only caused loss of about 3.8% of GDP [1], but also caused an average loss of about 1.3 years of lifespan [2]. It should be noted that all abbreviations are listed in Appendix A Table A4. Haze pollution is characterized by its high frequency of occurrence, wide impact range, long duration, and normalization; thus, its governance is more complex and difficult [3]. It is promulgated with the Air Pollution Prevention and Control Action Plan by the State Council, and since 2013, haze pollution has improved. According to data published by the Ministry of Environmental Protection, the average concentration of PM2.5 in Chinese cities dropped from 50.2 μg/m3 in 2017 to 30 μg/m3 by the end of 2021. However, this new level is still 3.5 times higher than 10 μg/m3, which is the air quality guideline recommended by the World Health Organization (WHO) [4]. According to satellite cloud maps of NASA, it is found that China’s high-frequency haze occurrence areas are concentrated in urban agglomerations such as the Yangtze River Delta, Beijing-Tianjin-Hebei, and other industrial-intensive urban agglomerations. It is imperative to achieve effective control of haze pollution within urban agglomerations.
In fact, the continuous deterioration of haze pollution has its deep institutional causes for countries in transition such as China. The current environmental problems are attributed to the extensive economic growth mode in China, which in turn stems from the protective behavior of local governments under the fiscal decentralization system [5]. The fact that most of the enterprises protected by local governments are traditional manufacturing industries with weaker competitiveness, which often have the characteristics of high energy consumption and pollution, local protection behavior and market segmentation may further exacerbate haze pollution in the region [6]. China needs to eliminate market segmentation through market integration development to achieve reduction in pollution levels [7]. Compared to the integration between national and provincial regions, the administrative division within urban agglomerations is relatively small and the degree of integration is relatively higher, which making it easier to capture the impact of regional integration on the environment. Unfortunately, previous studies have not focused on the impact of market segmentation behavior among local governments within urban agglomerations under the fiscal decentralization system on haze pollution. As the earliest, fastest developing and most mature market integration region since the reform and opening up in 1978, a series of problems exposed in the practice process still need to be solved although the ecological environment quality of the Yangtze River Delta urban agglomeration has significantly improved in recent years. Firstly, the platform for sharing information on environmental quality across provincial boundaries has not yet been established, which hinders the deepening of joint prevention and control work. Secondly, the cooperation goal of cross provincial environmental protection integration needs to be broadened. The main focus is on joint emergency prevention and control of pollution, and it has not yet reached a state where the goal of emergency response and long-term improvement of environmental quality is necessary. In addition, the integrated guaranteed system for cross provincial environmental protection needs to be strengthened. The horizontal ecological compensation mechanism has yet to be fully implemented. Areas with limited development due to regional ecological maintenance cannot receive reasonable economic compensation, which is not conducive to the long-term implementation of regional ecosystem and important ecological space protection. Consequently, is it possible to reduce haze pollution by suppressing market segmentation in the most developed and highly integrated regions of China’s economy? What is its internal transmission mechanism? The background highlights the importance of scientifically and comprehensively assessing the impact of the Yangtze River Delta urban agglomeration on haze pollution and proposing targeted governance paths.
The relationship between market segmentation and air pollution has always been a hot topic in the academic community. Firstly, regarding the relationship between market segmentation and pollution emissions, some research has found that provincial market segmentation significantly exacerbates local environmental pollution [8,9]. Market segmentation also significantly inhibits provincial energy efficiency, which results in direct energy losses and reach an average of 12 million tons of standard coal per year [10]. Corruption, especially environmental corruption, not only directly exacerbates haze pollution, but also exacerbates haze pollution through market segmentation [11]. Meanwhile, local market segmentation has positive direct effect on carbon emissions, while neighboring market segmentation has a negative spillover effect on carbon emissions [12]. For regions with high environmental regulations, market segmentation is more conducive to improving industrial transformation performance, indicating that local governments will abandon some market efficiency while carrying out environmental protection [13]. Secondly, most research focuses on market integration, which is the opposite of market segmentation and its relationship with environmental pollution. The Yangtze River Delta urban agglomeration shows an inverted U-shaped relationship between market integration and the total emissions of three pollutants: sulfur dioxide, industrial wastewater, and industrial soot [14]. Provincial market integration can promote the improvement of regional green total factor productivity (GTFP), which is not only directly reflected in the local area, but also indirectly promotes the growth of GTFP in surrounding areas [15]. Urban market integration has a significant contribution to regional green growth [16]. The integration of the European energy market has increased the consumption and generation of renewable energy, which proves that the integration of the energy market has a significant positive impact on the development of renewable energy [17]. There is a negative correlation between provincial market integration and carbon emissions [18]. The improvement of market integration in the Yangtze River Delta urban agglomeration has significantly reduced the intensity of air pollution emissions, and has a greater pollution reduction effect on in-situ cities [19]. As the export tax rebate for pollution-intensive products has been significantly reduced, PM2.5 concentration has also been significantly reduced [20]. And opportunities for further research still exist. Firstly, one of the issues is that existing research mostly focuses on the significant spatial negative externalities of market segmentation [21]. Currently, more attention is paid to the direct effect of market segmentation on haze pollution, while there is a lack of investigation on the indirect impact of market segmentation on haze pollution. Moreover, existing research examines the impact mechanism of market segmentation on haze pollution, and the selection of key variables is relatively arbitrary. Based on the research ideas of Grossman and Krueger (1991), Brock and Taylor (2005), we select the effects of economic scale change, industrial structure transformation, and technological progress to examine the transmission mechanism of market segmentation on haze pollution [22,23], which has a clearer paradigm of theoretical framework. Finally, most research focuses on carbon emissions and conventional pollutants such as SO2, nitrogen oxides, industrial smoke, and wastewater. On the contrary, haze pollution is more common and has a greater negative impact on residents’ health and economic activities, considering the air pollution in Chinese urban agglomerations [24,25]. It highlights the theoretical and practical significance of studying haze pollution from the perspective of market segmentation in urban agglomerations.
Based on the above analysis, this article explored the impact of market segmentation on haze pollution through theoretical analysis and empirical testing using panel data of the Yangtze River Delta urban agglomeration from 1998 to 2018. Specifically, the paper has made three key contributions compared to previous studies: (1) We chose market segmentation as the research object because it is the main manifestation of local government protection behavior under China’s fiscal decentralization system, and haze pollution is the most common form of pollution in urban agglomerations of China. (2) This is the first study to explore the impact of market segmentation on urban haze pollution in the Yangtze River Delta urban agglomeration from both direct and indirect perspectives, and conduct mechanism analysis based on the research ideas of Grossman and Krueger (1991), Brock and Taylor (2005) [22,23], which enriches the theoretical paradigm and empirical depth of this research. (3) In terms of research methods, the dynamic spatial Durbin model (SDM) and generalized spatial two-stage least squares method (GS2SLS) are used to identify the impact of market segmentation behavior on local and surrounding urban haze pollution, to control for endogenous estimation bias, and to establish a series of robust and convincing conclusions.

2. Theory and Hypothesis

2.1. The Impact of Market Segmentation on Haze Pollution in Urban Agglomeration

Economic and social activities with a high-density population will inevitably emit large amounts of fine particulate matter. Once the emissions exceed the atmospheric circulation and carrying capacity, the concentration of fine particulate matter will continue to accumulate and making it easy for large-scale haze pollution. And markets segmentation is phenomenon that refers to the distortion of resource allocation by local governments for the sake of vested interests, the tendency for retail prices of commodities to expand gradually over time, and the existence of segmentation in commodity markets. To summarize, local governments will adopt local protectionism and lead to market segmentation. In particular, while the trend towards integration of economies within other economies of the world is intensifying, there is a serious market segmentation within China [26].
Markets segmentation in urban agglomeration is often inseparable from local protectionism, poor resource flow and regional technological cooperation hampered—all of which are root causes of severe air pollution. First of all, market segmentation is closely related to local protectionism, and local governments tend to protect heavy industries characterized by high profits and taxes [26].Therefore, local governments have implemented some protectionist policies, including restricting local sales of imported goods and imposing industry monopoly, market fragmentation and local protectionism create opportunities for local heavy industry development and they are the primary contributors to local environmental pollution because of their high energy and pollutant consumption [27]. Consequently, the market cannot efficiently allocate resources when the urban agglomeration market is in a state of fragmentation, and the production capacity of backward industries cannot be eliminated by the market, resulting in serious pollution in the region.
In addition, market segmentation prevents the development of technology innovation. Green technology also cannot provide spillover effects through market competition since enterprises cannot reduce pollution emissions through the R&D of green technologies in the state of market segmentation, new haze reduction technology also cannot be promoted and applied across regions. They have been worked behind closed doors for a long time with the protection and support of local governments reducing their innovative vitality [28].
Considering that both market segmentation and haze pollution have spatial spillover effects, market segmentation in surrounding areas will also have impact on local pollution [20]. As a result of local governments “racing to the bottom” to increase fiscal revenue, market segmentation limits the free flow of factors and resources within the region [29]. It is challenging to allocate factor resources optimally and industrial structure cannot be optimized or upgraded. At the same time, the inflow and outflow of green technology and environmental regulations are also restricted [30]. The anti-haze reduction factors aren’t available locally, which results in local haze pollution can’t be alleviated. We propose the following hypothesis:
Hypothesis 1: 
Market segmentation in urban agglomerations exacerbates haze pollution.

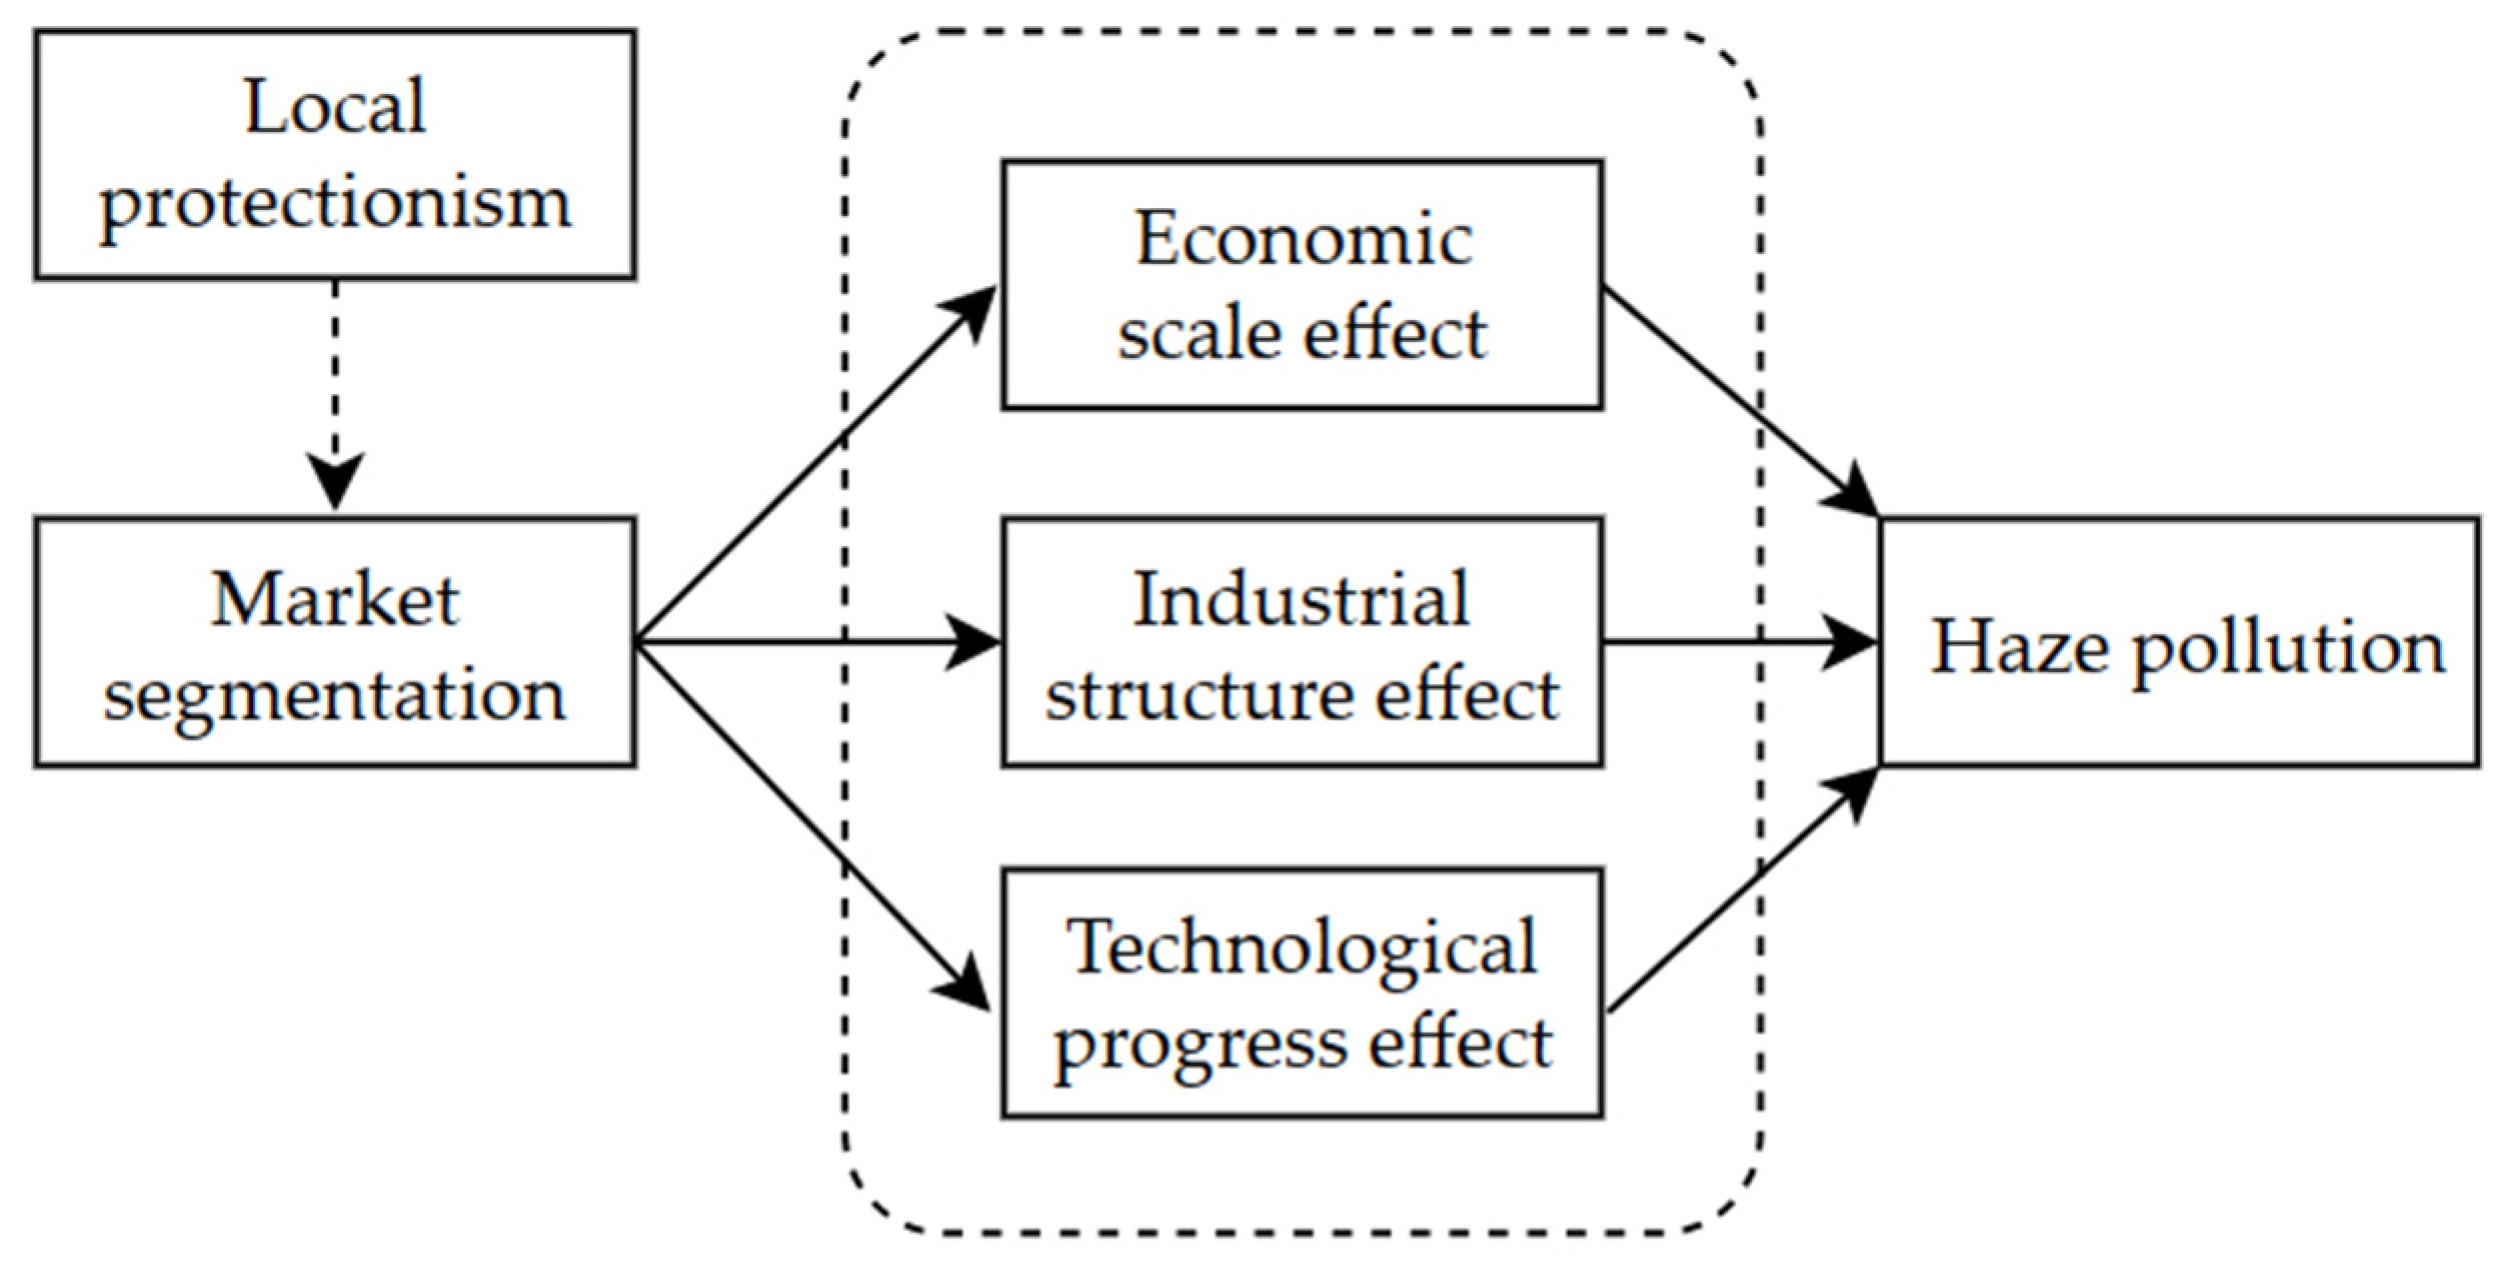
2.2. Mechanism of Market Segmentation Affecting Haze Pollution in Urban Agglomeration

Based on the research ideas of Grossman and Krueger (1991), Brock and Taylor (2005) [22,23], it found that market segmentation mainly affects haze pollution from economic scale, industrial structure, and technological progress standpoints.
Firstly, market segmentation has an impact on haze pollution by hindering economic scale expansion. The economic scale effect is that there will be an increased output of pollutants with the increase in economic output [23]. The exertion of the economic scale depends on the free flow of goods and production factors between regions and the resulting in integrated development of regional economies. At the same time, the economic scale will also bring about positive environmental externalities, which will promote the development of regional economies and improvement of environmental pollution [31]. However, local governments will restrict the free flow of labor, capital, and other production factors between regions in order to protect local enterprises, and maintain local finance and employment, which prevents the achievement of centralized distribution of economic activities within the region and the exercise of economies of scale. In short, market segmentation among local governments prevents the spatial agglomeration of economic activities, which impedes the growth of regional economic scale and undermines the fairness in the market with perfect competition. Additionally, it makes it more challenging for firms to share and exchanging green technologies, and it boosts the courage of local firms to emit pollution.
Secondly, market segmentation has impact on haze pollution by hindering the upgrading of the industrial structure. Industrial structure effect is that market liberalization will be damaging to the environment. On the one hand, the unfair market competition is primarily caused by an imbalance of resource factors, such as lack of talent resources and vitality and motivation for upgrading the industrial structure [32]. On the other hand, local governments have hampered the modernization of local industrial structures by limiting capital imports, factor supply and technology introduction, leaving behind some outdated industries with high energy consumption and pollution [33]. Market segmentation creates obstacles to factors flow, thus hindering industrial structure upgrading [34], and it causes the industrial structure which is dominated by heavy industry and increases haze pollution. In addition, market segmentation created by local gaming is more likely to impede the growth of high-end industries, diminish local enterprises’ capacity for innovation and easily lock in the low-end industries of regional markets [28].
Finally, market segmentation has impact on haze pollution by inhibiting technological progress. Technological progress effect is that more modern and clear technologies demand a cleaner environment. The impact of technological progress on pollution is not only the improvement of production efficiency, but also the improvement of green technology, Advanced green technology can improve resource utilization efficiency, control exhaust emissions, and achieve haze reduction effects. However, local protectionism induces local monopoly to replace innovation, enterprises are more inclined to no longer focus on technology R&D to improve product quality and rely on regional monopoly to earn excess profits. Local governments interfere with unified market competition, thereby reducing financial support for technological innovation. The source is that local governments protect some local state-owned enterprises. The “protective” segmentation of the scope leads to low production efficiency and increased energy consumption, which will inevitably lead to high pollution emission output. To clarify the logic of the mechanism, we construct a theoretical framework and, as shown in Figure 1, we also propose the following hypothesis:
Hypothesis 2: 
Market segmentation leads to increasing haze pollution by inhibiting the economic scale effect, industrial structure effect, and technological progress effect.

3. Methodology and Data

3.1. Sample and Data

Firstly, production method, specialization index method, trade flow method and relative price method are common methods for calculating market segmentation, the estimated market segmentation index cannot accurately indicate the level of market segmentation between two neighboring regions because the above three approaches have tendency to ignore factor endowment, economies of scale and the substitutability elasticity of goods [35]. The relative price method examines the index of commodity prices between regions, price difference is clear indicator of local protectionism and better reflects market segmentation between neighboring regions. The existing literature proposes calculating the degree of market segmentation between regions mainly based on the price method under the glacier cost model, and Young (2000) discovered that higher regional segmentation results in more frequent adjustments in changing of product prices [26]. Gui et al. (2006) used the relative price method for the first time to assess the level of market integration, and their work served as the theoretical foundation for subsequent researchers looking into the issue of market segmentation [36]. Based on the law of commodity prices, the relative price method can better reflect the concentration and dynamic trend of the commodity market, we finally chose this method to calculate the market segmentation.
Firstly, the relative price method uses three-dimensional data (i × t × z), where i denotes the city, t denotes the time, and z denotes the product type. The samples are 23 cities in the Yangtze River Delta region (n = 23). Secondly, cities are paired and the retail price index (P) of various commodities is compared with the first order difference of the relative price to obtain Q i j t z , as follows:
Q i j t z = l n P i t z P i , t 1 z l n P i t z P i , j 1 z = l n P i t z P j t z l n P i , t 1 z P i , j 1 z
Q i j t z is logarithmic processed to mitigate heteroscedasticity and skew of the data. Based on the retail price index data of 8 categories of goods in 23 cities from 1998 to 2018, 85,008 different forms relative price can be obtained (23 × 506 × 21, the paired cities are 23 2 = 506 ). R i j t z can be obtained by removing the average price deviation Q i j t z from Q i j t z ¯ :
R i j t z = Q i j t z Q i j t z ¯
Based on the value of R i j t z , market price fluctuations of different cities can be judged basically. The higher the value of R i j t z V a r R i j t z   , the more serious the market segmentation and the lower the degree of regional integration. Finally, a city-level market segmentation index m i i j t = z = 1 8 R i j t z can be obtained by combining the price difference of the above eight commodities.
Next, haze pollution is more complicated than other forms of air pollution and the real culprit of haze pollution is PM2.5, which has a smaller diameter than other larger particle indicators like PM10 and dust, this is consistent with people’s intuitive perception and can more precisely describe the level of haze pollution [37]. The data on PM2.5 concentration in China are currently only available from 2012 in a select few cities. In order to analyze the annual mean PM2.5 concentration of the Yangtze River Delta urban agglomeration from 1998 to 2018, we used ArcGIS software and grid data of global PM2.5 concentration based on satellite monitoring published by the Socioeconomic Data and Applications Center of Columbia University (SEDAC) and which refers to the method of Van et al. (2019) [38]. Satellite monitoring data are a type of surface source data that can more fully reflect the concentration of PM2.5 in a region when compared to actual ground monitoring point source data.

3.2. Measures of Variables

Taking into account of factors affecting market segmentation and haze pollution, a set of relevant control variables are introduced based on the focus of the recent literature; they are as follows.
(1)
Economic development (gdp) is measured as per capita GDP of each city by deflating with the CPI index with 1997 as the base period. Today, it still has not completely removed the extensive economic development model [39], which to some extent will result in haze emissions and its expected positive direction.
(2)
Technological progress (tec) is measured by the number of patent applications in cities as a share of 10,000 persons. Technological advancements can improve resource and energy utilization efficiency, thereby reducing resource consumption and the generation and emission of waste gas from industrial enterprises, and it has a negative expected direction.
(3)
Population density (pop) is measured as the ratio of total urban population to built-up area. The impact of population density on environmental quality has three effects of conversion, congestion and concentration. On the one hand, high density can shorten commuting distance through job–housing balance, switch from motor vehicle to non-motorized travel mode, and reduce traffic pollution emissions. On the other hand, it is a positive sign to expect that rising population density will cause traffic congestion and increase vehicle emissions, which will exacerbate haze pollution.
(4)
Environmental regulation (enr) is measured by the comprehensive index of environmental regulation, which are industrial SO2 removal rate, industrial COD removal rate, comprehensive utilization rate of industrial solid waste, domestic sewage treatment rate, and harmless treatment rate of domestic waste with entropy method, and it expected as negative sign.
(5)
Industrial structure (ind) is measured as the proportion of the output value of the secondary industry to city’s GDP. Industrial manufacturing generates exhaust emissions and then increases haze pollution; hence, the expected direction is positive.
(6)
Opening degree (open) is measured as the proportion of actual foreign investment in cities to GDP. The Pollution Heaven Hypothesis states that foreign investment will drive pollution-intensive industries to developing nations, increasing local pollution, with a positive expected direction.
Data for the above control variables were obtained from the China Urban Statistical Yearbook. In addition, the non-ratio variables are taken to be logarithmic so that the data satisfies normal distribution and eliminates the problem of heteroskedasticity. All specific variables in the regression model are provided in Table A1 in Appendix A [40].

3.3. Models and Data Analysis Procedure

Considering the spatial spillover effects of haze pollution and market segmentation, it can result in missing variables, estimate bias and endogeneity problems with ignoring the spatial correlation of variables [41,42]. In comparison to the spatial lag model (SLM) and the spatial error model (SEM), the dynamic spatial Durbin model (SDM) can efficiently prevent variable loss and address endogeneity problems in econometric models that take spatial correlation into account. Therefore, we establish a specific model with SDM settings as follows:
R i t = α 0 + α 1 R i , t 1 + ρ 1 w R i t + α 2 m i i t + ρ 2 w m i i t + γ X i t + ρ 3 w X i t + μ i + ϵ i t
Rit is the urban haze pollution, mi is the market segmentation index, and i and t denote the city and year. wRit denotes the spatial lag term of haze pollution; wmiit denotes the spatial lag term of market segmentation. Xit represents a set of control variables that may affect haze pollution, and wXit is the spatial lag term of the control variables. The spatial spillover effects of haze pollution, market segmentation, and other control variables can be captured by the parameters   ρ 1 , ρ 2 , and ρ 3 , respectively. According to LeSage et al. (2009) [43], the adjacent spatial weight matrix is more useful for testing the spatial spillover effects of variables, and the 0–1 matrix is employed as the general spatial weight matrix.
The primary sources of the research samples come from the China Economic Network Statistical Database (https://db.cei.cn/jsps/Home, accessed on 14 August 2023), which compiles data from the Urban Statistics Bureau and statistical yearbooks of various cities in the Yangtze River Delta urban agglomeration and China Statistical Yearbooks. In terms of the Development Plan for the Yangtze River Delta Urban Agglomeration, the Yangtze River Delta urban agglomeration includes 41 cities in Shanghai, Jiangsu, Zhejiang and Anhui provinces, we finally selected 23 cities as sample data, which including Shanghai, Nanjing, Wuxi, Changzhou, Suzhou, Nantong, Zhenjiang, Hangzhou, Ningbo, Wenzhou, Jiaxing, Huzhou, Shaoxing, Jinhua, Zhoushan, Taizhou, Hefei, Wuhu, Ma’an shan, Tongling, Anqing, Chuzhou and Xuancheng. The three reasons exist as follows: (1) These 23 cities are the core cities in the development plan. (2) Some cities, including Xuzhou, Taizhou, Quzhou and others are not chosen because to the restricted availability of the significant shortage of retail pricing indices for major commodities. (3) The chosen cities have similar geographic and cultural characteristics, and a high degree of economic integration and regions with more serious environmental problems, which are more likely to transmit the environmental effects of market segmentation.
Taking uniformity, integrity and availability of the data into account, we chose 1998–2018 as the sample period due to the fact that most of the data prior to 1998 were missing. The retail price index of various commodities in 23 cities is covered by this sample of data: food, beverages, cigarettes and alcohol, textiles, home appliances and audio equipment, daily essentials and cosmetics, Chinese and Western medications, healthcare products and fuels were selected to carry out the calculation of the market segmentation indicator after screening, and the data come from the China Urban Statistical Yearbook and the statistical yearbooks of various cities in the Yangtze River Delta urban agglomeration.

4. Research Results

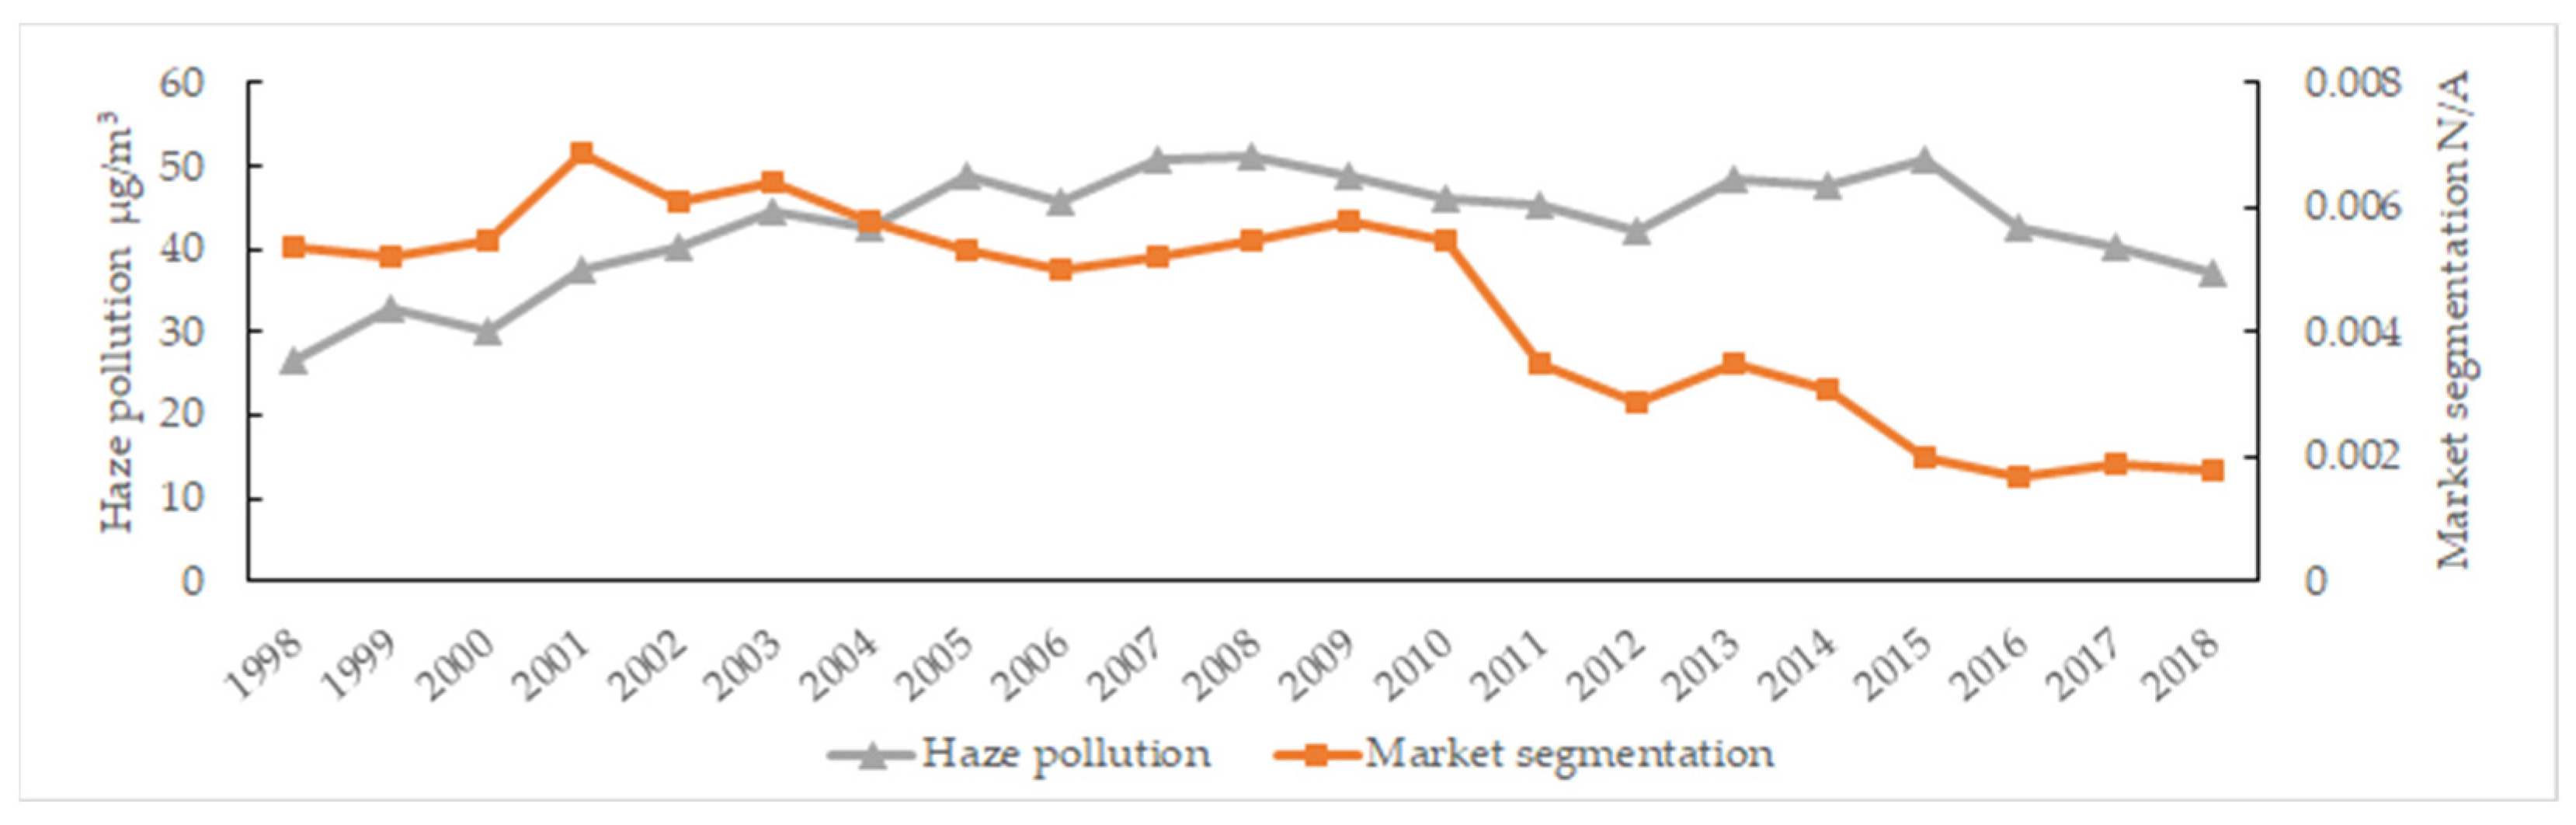
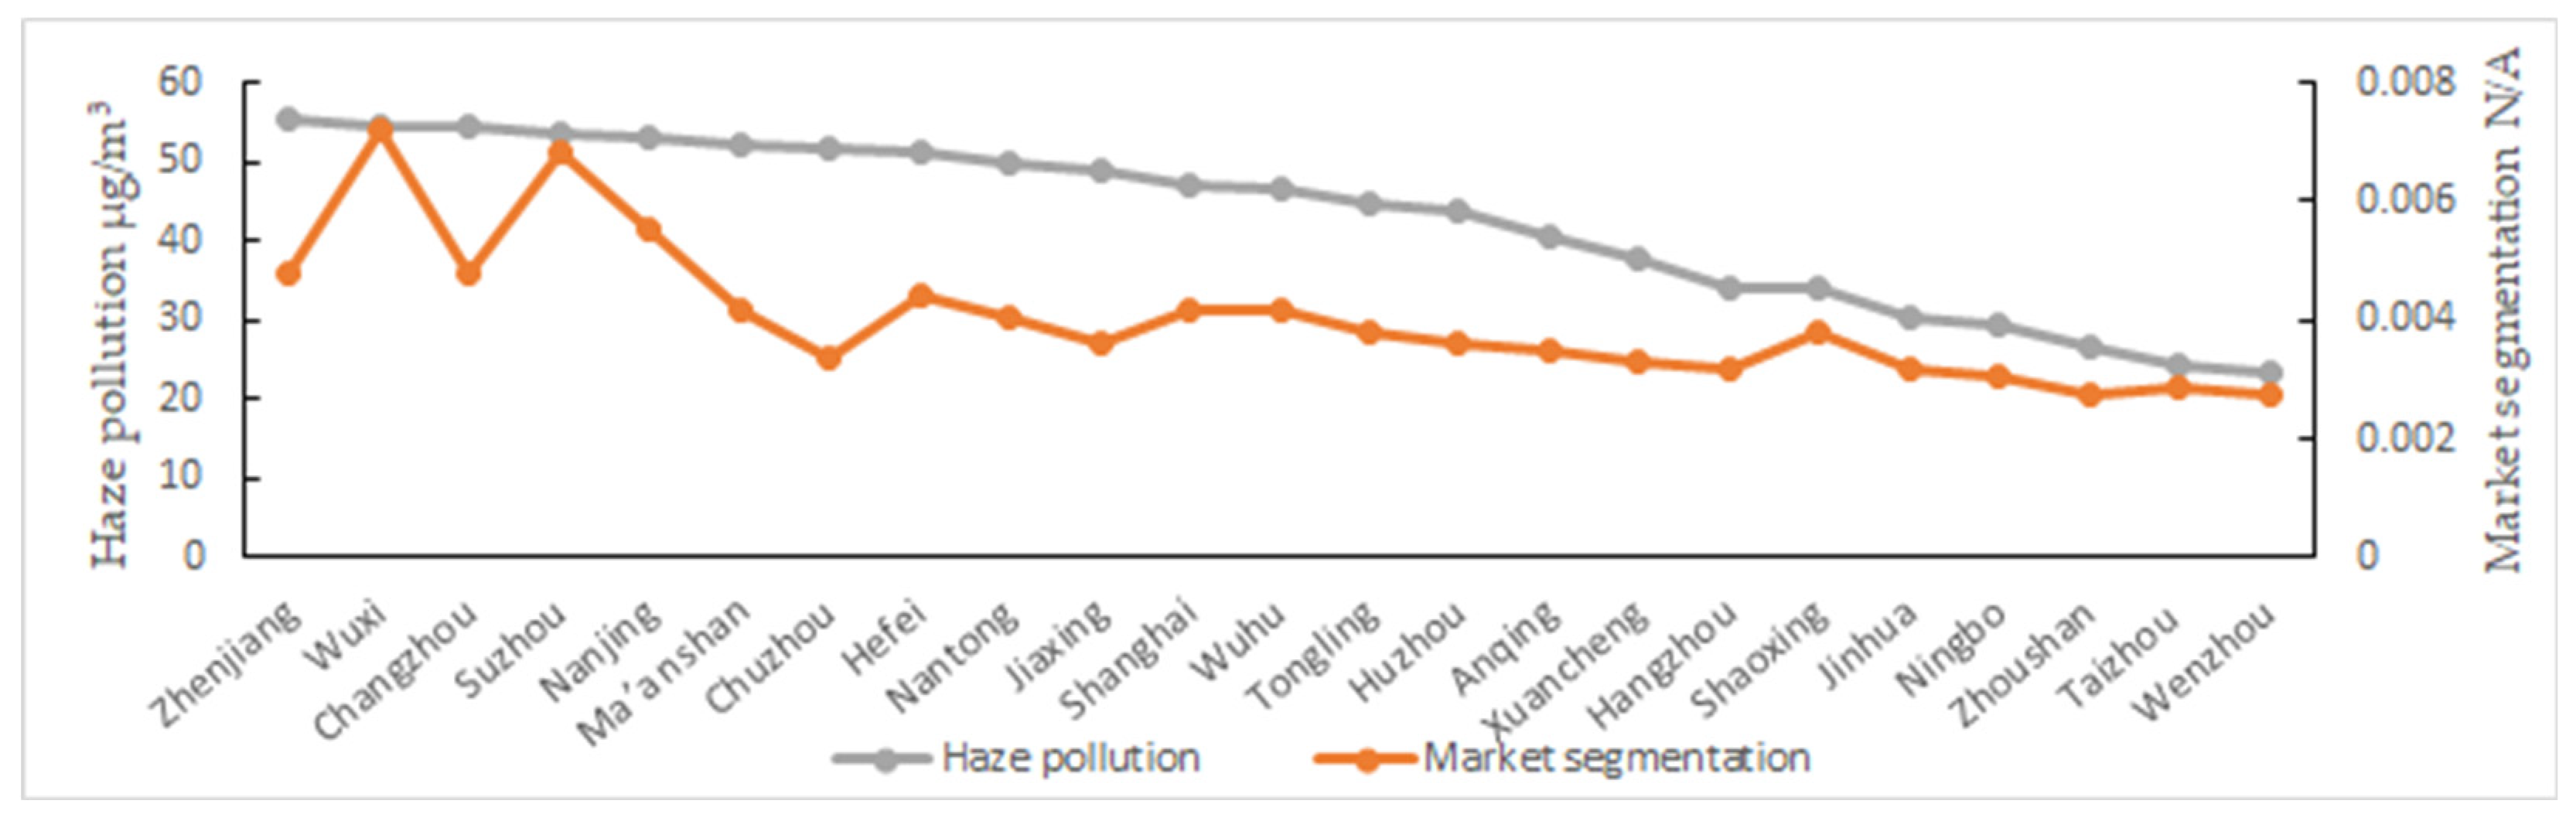
4.1. Statistical Observation

In order to initially explore the relationship, we conducted statistical observations on the trend of annual market segmentation index and the average PM2.5 concentration. As shown in Figure 2, market segmentation shows gradual decrease trend from 1998 to 2018, which overall indicates that the level of market integration is on the rise, and the average PM2.5 concentration also shows gradual downward trend at the same time. According to preliminary judgment, we find the market segmentation has positive correlation with the trend of haze pollution, and it is consistent with our expectations. In other words, the level of market integration has continuously improved, and the environmental quality has also improved to some extent within the sample period.
Figure 3 shows the average market segmentation index and haze pollution ranking of the urban agglomeration. Overall, most cities are in a state of market integration and pollution reduction. Cities such as Zhenjiang, Wuxi, Changzhou and Suzhou still have serious market segmentation and high levels of haze pollution, they also have the great potential to reduce haze pollution through market integration in the future. Although the level of market segmentation is not high, some cities such as Ma’anshan, Chuzhou and Nantong still have high levels of pollution, and these cities are surrounded by cities with high market segmentation; thus, they need the market integration process of surrounding cities to assist in reducing emissions.

4.2. Test of Hypothesis 1

The spatial econometric model is based on the existence of spatial correlation between variables, and the fundamental test of spatial autocorrelation of the explanatory variables is the significance of the coefficient of Moran’s I index. The relevant test results are provided in Table A2 in the Appendix A. Firstly, the Moran’s I index of haze pollution displays positive values and is statistically significant at the 1% level, which indicates that the regional haze pollution shows a positive spatial correlation and is ready for the subsequent spatial econometric test. The LM test, Wald test and LR test are prerequisites for conducting dynamic spatial Durbin models, the LM test is used to determine the use of spatial econometric models, the Wald test and LR test are important tests to test whether SDM can degenerate into spatial lag models (SLM) or spatial error models (SEM). The LM-error and LM-lag tests for the sample data are both significant at least at the 1% statistical level, it indicates that the choice of the SDM not only optimizes the spatial heterogeneity of the spatial lag model (SLM) and the spatial autocorrelation of the spatial error model (SEM), but also the model has some robustness. The Wald test and LR test are also significant at least 1%, indicating that the SDM will not degenerate into the spatial lag model or spatial error model again. Finally, the correlation coefficient between explanatory variables is less than 0.4, and the variance expansion factor is less than 10; the multicollinearity problem can be ignored.
We also use the GS2SLS method for robustness and comparative analysis, the main advantage is that the same consistent estimator can be obtained even if there are heteroscedasticity and non-normal distribution. According to Shao et al. (2019) [44], it selects each explanatory variable and its geographical lag term as instrumental variables, which can partially solve the endogeneity problem of haze pollution.
The regression results in Table 1 show that the signs of the estimated coefficients of the core variable (mi) in SDM are consistent with those of the GS2SLS, with only a slight difference in the significance level. It can be seen that the coefficient of the market segmentation index (mi) is positive and significant at least at the 1% level. Since market segmentation is the opposite of market integration, the degree of market integration within a certain range will be conducive to emission reduction. That is to say, pollution emissions show a decreasing trend with the continuous improvement of market integration. Thus, hypothesis 1 is verified.
Market segmentation may reflect the strategies chosen by local governments. High levels of market segmentation bring excessive competition between neighboring cities. Regions tend to lower environmental regulation standards to increase competitiveness and attract investment as a result of fiscal decentralization and local government promotion, which is a practice known as “racing to the bottom”. The level of local haze pollution reflects the interacting behavior of local governments’ competing strategies, which present strange phenomenon of “you pollute and I also pollute” within urban agglomerations.
The spatial lag coefficients of haze emissions (w.R) are all positive and statistically significant at the 1% level. This finding shows that there is a significant spatial correlation of haze pollution emissions between cities. It can be seen that the existence of location factors and the influence of spatial effects cannot be ignored when studying haze pollution in urban agglomerations.
The sources of the spatial spillover of haze pollution include the following aspects. Firstly, haze can affect the air quality of neighboring cities through the atmosphere, wind force and other natural climate characteristics. Secondly, haze has a symbiotic relationship with industrial production and traffic emission. In order to obtain the local market potential and convenient transportation, the concentration of industrial enterprises in the central cities also makes the haze pollution also concentrated in the central cities; thus, it is easy to form the correlation of regional haze emissions. Thirdly, inter-regional economic growth competition is also important reason for the formation of haze pollution, which also causes the spatial correlation of haze emissions between regions. Finally, under the combined effect of centrifugal force from environmental regulation and centripetal force from market demand potential, the polluting firms will eventually agglomerate around the central city to set up factories [45].
The spatial lag coefficient of market segmentation (w.mi) is positive and significant at least at the 5% level, which indicates that market segmentation in surrounding areas promotes local haze emissions to a certain extent; in other words, market integration is conducive to promoting a reduction in local emissions. This also shows that local commodities and elements can enter the surrounding area relatively freely to achieve higher allocation efficiency when the degree of market integration in the surrounding area is high, which is conducive to optimizing the combination of elements and resources for reducing haze in the area. Second, there is a positive correlation between the integration of surrounding markets and local markets. In other words, market integration in surrounding areas is conducive to improving the level of local market integration, which is conducive to reducing haze emissions.
In terms of control variables, the estimated results of technological innovation and environmental regulation coefficients are all significantly negative and there is a negative space spillover effect, it shows that the improvement of production technology and the increase in environmental regulation intensity not only improve energy efficiency, but also the current environmental regulation policy has played expected role in reducing emissions. Knowledge spillover also enables the diffusion of advanced technology and policy effects, which in turn helps to reduce the level of haze pollution. However, the “green paradox” effect of environmental regulation has a positive spatial spillover, that is, the increase in the intensity of environmental regulation in neighboring cities will lead to an increase in local haze pollution. However, economic development, population density, industrial structure and opening degree all have significantly positive effects. It shows that the Yangtze River Delta region is still dominated by extensive economic development model, At the same time, the compact spatial development model has not yet played its due role in reducing haze pollution. Moreover, these variables have positive spatial spillover effects, which means accelerating economic growth, increasing population density, adjusting of industrial structure and accelerating opening up of cities have increased energy consumption, and the competitive pressure among cities has lowered the pollution threshold and increasing haze emissions.
The Spatial Durbin Model (SDM) model includes the spatial lag items of both the explanatory variables and explained variables. Changes in the explanatory variables will not only affect the explained variables in this region, but also the explanatory variables in other regions. Therefore, the regression coefficient cannot simply reflect the influence of the explanatory variable on the explained variable. LeSage and Pace (2009) divide the total effect into direct effect and indirect effect with the partial differential method [43], where the direct effect represents the average impact of the explained variable on the local area, and the indirect effect represents the average impact of the explained variable on other regions. In addition, we tested the decomposition effect of market segmentation on haze pollution, and the regression results are provided in Table A3 in the Appendix A.
As shown in Table A3, the direct and indirect effects of market segmentation are 0.405 and 1.489, respectively, which means the indirect effect is 3.67 times larger than the direct effect. The finding shows that market segmentation’ spatial spillover effect on haze pollution is greater than its own impact, in other words market segmentation in nearby areas has stronger impact on local haze pollution. The direct effects of the other control variables are consistent with the base regression, with the indirect effects of economic growth, population density and industrial structure being larger than the direct effects, while the indirect effects of technological progress are smaller than the direct effects, suggesting that the economic growth, population density and industrial structure of neighboring regions have a greater impact on the local haze pollution, while the spatial spillover effect of technological progress is larger.
There could be two potential reasons. Firstly, the behavior of market segmentation prompts the surrounding local governments to adopt similar competitive strategies, which exacerbating the mismatch of elements and resources within the urban agglomeration and weakening the role of the market in allocating resources, this has strengthened the development of polluting industries that can bring in tax revenues in surrounding areas, which leading to increased haze pollution. Secondly, the haze emission and transmission of surrounding areas will also aggravate local haze pollution. Due to the relatively short geographical distance between cities, the surrounding cities have weakened the role of environmental regulation in the race to the bottom, which makes it easy for haze pollution with obvious spillover effects, and the transfer to the local area also aggravates the haze pollution.
To examine the robustness of the baseline estimated results, we performed two robustness tests. One was to replace the weight matrix, and the other was to remove the singular values. For the first test, we selected three different types of spatial weight matrices to test the robustness of the baseline regression, considering that the economy of cities in the urban agglomeration is spatially related and the geographical distance between cities is an important factor in the cross-border degree of haze pollution. The first is the economic distance weight matrix, which is set based on the inverse of the difference in GDP per capita between the two cities. In other words, smaller income gaps are assigned larger weights, and vice versa. The second is the economic–geographic nested matrix, which organically combines the geographical distance weight and the economic characteristics weight matrix to accurately describe the comprehensiveness and complexity of spatial effects. The third is geographical threshold matrix, and it assigns weights based on the geographical distance between cities, also sets geographical threshold d and observes the coefficient size and significance of the Moran’s I index for haze pollution. Due to the close distance between cities, the Moran’s I index size and significance are measured every 10 km starting from 100 km. Then 170 km are calculated as the geographical threshold because the size and significance of the Moran’s I index is the highest. Therefore, geographic threshold matrix of 170 km is used to regress the original equation.
It can be seen from column (1) of Table 2 that the w.mi is still significantly positive, indicating that the result is still robust under consideration of economic factors. It can be seen from columns (2) and (3) that w.mi is no longer significant under the economic-geographical nested matrix and geographic threshold matrix, and its sign and coefficient are basically consistent with the baseline regression. In addition, market segmentation under the economic distance weight matrix has the greatest impact on haze pollution, followed by the geographic threshold matrix, and the economic–geographic nested matrix is the smallest. For the geographic threshold matrix, this further indicates that 170 km is the critical value for market segmentation to exhibit positive spatial spillover effects on haze pollution. Once the geographical distance exceeds 170 km, the impact of market segmentation in surrounding areas on local haze pollution is no longer significant.
For the second test, Shanghai, Hangzhou, Nanjing, and Hefei are directly under the central government or provincial capitals, with administrative levels and city sizes larger than other cities within the urban agglomeration, and market segmentation level of these four cities is far lower than that of other cities from the results. Considering that such singular values may affect the empirical results, we excluded these four cities and re-estimate the regression model. As shown in column (4), the effect of market segmentation on haze pollution is still significantly positive and w.mi is still significantly positive, indicating that the conclusions of basic regression still valid and robust.

4.3. Test of Hypothesis 2

Based on the above regression analysis, we concluded that the market segmentation in the Yangtze River Delta urban agglomeration exacerbates haze pollution. However, market segmentation within the urban agglomeration does not directly affect haze pollution. Based on the previous analysis, we find that market segmentation mainly affects pollution through economic scale effect, industrial structure effect and technological progress effect. In order to further determine the transmission mechanism involved, we add the interaction terms of market segmentation with economic scale, industrial structure and technological progress (mi * gdp, mi * up, and mi * tec), respectively, on the basis of the baseline model; the transmission mechanism above can be verified via these interacting coefficients, and the original model is still used to conduct the transmission mechanism to conduct empirical tests. For the selection of indicators, (1) economic scale effect: the per capita GDP of the city by deflating with the CPI index with 1997 as the base period; (2) industrial structure effect: the tertiary industry output value of the city as a proportion of the regional GDP is selected; (3) technological progress effect: the number of patents applications authorized per 10,000 people in the city is selected. We used the SDM and GS2SLS method to conduct the empirical tests of the transmission mechanism. The specific econometric model is as follows:
R i t = β 0 + α 0 R i , t 1 ρ 1 w R i t + β 2 m i i t + ρ 2 w m i i t + α 1 m i g d p + α 2 m i u p + α 3 m i t e c + γ X i t + ρ 3 w X i t + μ i + ϵ i t
We can see if the coefficients of α 1 ,   α 2 and α 3 are significant, this indicates that three transmission mechanisms of market segmentation exist. From the regression results in Table 3, it can be seen that the coefficients of mi * gdp, mi * up and mi * tec are all significantly positive. This finding shows that the role of economic scale, industrial structure and technological progress in increasing haze pollution is greater when the degree of market segmentation is higher (or the degree of market integration is lower). That is to say, the higher the degree of market integration, the greater the effect of economic scale, industrial structure and technological progress on the reduction in haze pollution. Therefore, hypothesis 2 is verified. With the continuous improvement of market integration, the economic scale expansion and spillover effects in the Yangtze River Delta urban agglomeration are becoming more and more obvious, and the emission reduction effect it brings is also growing. At the same time, it will drive and lead regional high-quality development and industrial structure upgrading, and guide the accumulation of various emission reduction resources and factors to gradually curb pollution under the background of market integration. Each city should implement its own strengths, break down the cognitive barriers between industries, and work together to realize the greening of industries. Technological innovation cooperation and technological spillover effects are becoming more and more obvious, effectively promoting breakthroughs in cutting-edge technological innovation and green and low-carbon development and transformation of high-emission industries. The coefficients of the spatial lag term of the haze pollution emission index and market segmentation are both significantly positive, which indicates that there are significant spatial spillover effects in pollution emissions and market segmentation in surrounding areas, which significantly promote local pollution emissions.

5. Discussion

Table 4 summarizes the conclusions of other related studies. From the perspective of the Yangtze River Delta urban agglomeration region, our conclusions are basically consistent with those of Zhang et al. (2020) and Zhou J (2023) [14,19]. At the same time, we not only use SDM and GS2SLS methods to investigate spatial spillover effects, but also control endogeneity issues. For example, Zhang Ke (2020) found that the integration of the Yangtze River Delta region will reduce pollution [14], but it mainly targets the intensity of industrial wastewater discharge, sulfur dioxide discharge and industrial dust discharge. The research conclusion cannot be directly applied to haze pollution due to different emission sources and pollution control standards. The pollutants in the Zhou et al. (2023) mainly focus on the intensity of sulfur dioxide emissions, industrial smoke and dust emissions and industrial wastewater emissions [19], but neither spillover effects nor direct and indirect effects have been investigated. Firstly, we conducted descriptive analysis of the relationship between market segmentation and haze pollution in 23 cities, and found that cities with high market segmentation and severe haze pollution have the potential to reduce pollution through market integration in the future. Secondly, both direct and indirect effects of haze pollution were analyzed, and it was also found that market segmentation had a greater spatial spillover effect on haze pollution than its own impact.
Finally, economic scale, industrial structure and technological progress were selected as the influencing mechanisms for analysis following the perspectives of Grossman and Krueger (1991), Brock and Taylor (2005) [22,23]. The results showed that when the degree of market segmentation was high, the impact of economic scale, industrial structure, and technological progress on the increase in haze pollution was greater. In terms of pollutant selection, the current research on haze pollution mainly focuses on provincial regions, such as Bian et al. (2020) and Zhao et al. (2023) [8,11], and the research conclusions are basically consistent. However, we focus more on urban agglomerations with more mature market integration, and the relationship at the city level is more conducive to detailed characterization of the relationship between market segmentation and haze pollution. Other dependent variable choices include carbon emissions, energy efficiency, and GTFP, and their conclusions also support the results.
We can find that market segmentation has significant impact on changes in haze pollution and will further discuss it from two aspects: market research and development investment, market productivity. In terms of market research and development investment. In areas with increasingly severe market segmentation within the Yangtze River Delta urban agglomeration, enterprises can seek refuge and consolidate their monopoly position by establishing certain connections with the government, lacking the motivation for research and innovation. Therefore, enterprises with higher investment returns will have “siphon effect” on the factors within the region in an integrated market due to the profit seeking nature of factors. Enterprises in fiercely competitive markets engage in research and development innovation to reduce costs and gain a competitive advantage, thereby promoting the generation of pollution reduction and emission reduction technologies. With the gradual application of pollution reduction and emission reduction technologies to enterprise production activities, the energy utilization efficiency and productivity of enterprises have been further improved. An integrated market system helps to promote the free flow of goods within the region, and new products usually contain higher technological content. With the free flow of these new products in the region, they also achieve the dissemination and diffusion of new knowledge and technology, which has positive spillover effect on the region.

6. Conclusions and Policy Implications

The Yangtze River Delta urban agglomeration is one of the regions with the highest level of integration and environmental pollution in China since the reform and opening up. It not only greatly promotes economic development but also brings about the urgent need to solve the problem of haze pollution. In order to examine the impact of market segmentation on haze pollution scientifically and comprehensively, this article used the spatial Durbin model (SDM) to analyze the effect and mechanism of market segmentation on urban haze pollution in the Yangtze River Delta urban agglomeration from 1998 to 2018. The main conclusions are as follows: (1) Market segmentation significantly exacerbates haze pollution, in other words, haze pollution will increase by 2.14% when market segmentation increases by 1%. (2) Cities with high degree of market segmentation and high levels of haze pollution have the potential to reduce pollution through market integration in the future. (3) Market segmentation in surrounding regions also has significant worsening effect on haze pollution in the region. The indirect effect of market segmentation is 3.67 times that direct effect, indicating that the spatial spillover effect of market segmentation on haze pollution is greater than its own impact. (4) Mechanism analysis finds it will aggravate haze pollution by hindering economic scale, industrial structure and technological progress when the degree of market segmentation is high. That is to say the higher the degree of market integration, the greater the effect of economic scale, industrial structure and technological progress on the reduction in haze pollution. The above conclusions answer the questions we posed in the introduction section, and the hypotheses have been validated. It not only indicates that even the most developed market integration regions in China still face serious market segmentation problems, but also brings serious haze pollution problems. Moreover, our conclusions can provide important reference for other urban agglomerations around the world to promote haze reduction through market integration.
We confirm that the market segmentation of the Yangtze River Delta urban agglomeration has different stages of impact on urban haze pollution. It emphasizes the importance of considering how to maximize the positive impact of market segmentation in the Yangtze River Delta urban agglomeration on urban haze governance and minimize its negative externalities to the environment. We propose the following policy recommendations.
Firstly, policy makers should give full play to the haze emission reduction effect of market integration. With the inclusion of the cities in the Yangtze River Delta into the national urban agglomeration, it will become China’s regional integrated development demonstration areas and national high-quality development model areas in the future. With the help of national policy advantages, the process of market integration should be further promoted, it can break local protection and market segmentation, promote the smooth flow of commodity factor resources on a larger scale, and play the role of market integration in optimizing the spatial allocation of factor resources, and develop environmental policies for the harmonized development of the economy and the environment [46]. With ecological environmental protection and synergistic industrial development as the core, collaborate to promote green supply chain innovation and exploration, and jointly build a regional green supply chain technology system, evaluation system and institutional system. Guide and assist enterprises and their suppliers to follow the concept of green and low-carbon development, and promote enterprises to become the main body in response to green and low-carbon actions. Then it can guide local government competition, and change the current situation of “racing to the bottom” of relax the haze pollution governance in order to take advantage of the promotion championship.
Moreover, regional environmental pollution control cannot be realized “independently” at all; it is particularly important to coordinate the control of haze pollution in the region. The necessary cross-regional pollution accounting work should be carried out as soon as possible, environmental regulations and joint pollution controls must gradually be harmonized across regions. Regional planning and industrial planning between regions should be linked, and market integration in neighboring regions should also be supported in the process of promoting local market integration. Taking advantage of the comprehensive innovation system of the Yangtze River Delta Science and Technology Innovation Community, we will take the lead in conducting research on the Yangtze River Delta regional integration and collaborative governance mechanism under the green development goal, clarify the overall goal of reducing haze pollution and increasing sinks in the region, and design a complementary and coordinated development mechanism to form integrated solution. The implementation of ecological civilization and other ideas requires everyone to participate, and it is necessary to undergo major transformation in everyone’s ideological concepts, establish correct values, lifestyles and consumption concepts, promote the fine tradition of diligence, thrift, curb unreasonable waste and consumption activities such as comparability, ostentatiousness, extravagance and advocate the concept of green and low-carbon circulation from various perspectives such as clothing, food, housing and transportation. It is necessary to create an atmosphere where everyone participates and takes action, making green and low-carbon cycling both a lifestyle trend and a social responsibility.
At last, market segmentation of urban agglomerations affects haze pollution through mechanisms that inhibits economic scale expansion, industrial structure upgrading and technological progress. According to the carrying capacity of resources and environment and the comparative advantages of the region, it should coordinate the economic scale, break the administrative boundaries, and exploit the positive environmental externalities. It increases investment in technological innovation, improve the market-oriented innovation and transformation mechanism, guide the accumulation of various innovation resources and elements, and drive the high-quality development of the region and the upgrading of industrial structure, which can jointly improve the service function of the ecosystem, and establish and improve the green integration of the Yangtze River Delta high-quality economic development system. With the green industry as the core, it is horizontally linked to many related high-quality industries. Green technology is usually a combination of different technologies in several fields, and green technologies such as wind energy, photovoltaic, hydrogen energy and electric vehicles can lead to win-win cooperation among a series of leading manufacturing enterprises in the region. Shanghai, Suzhou, Nanjing, Hangzhou, Hefei, and other places should each take advantage of their own strengths, break down cognitive barriers between industries, and cooperate to realize the greening of industries.
There are still several research shortcomings in the article that can be further developed in the future. Firstly, we can continue to examine whether there is an inverted U-shaped relationship between market segmentation and haze pollution in urban agglomerations. Secondly, it should be focused on smaller spatial scales such as counties for further research in the future, although the study is based on data from prefecture-level cities. Finally, it is more realistic to analyze cross regional segmentation and corporate pollution emission behavior from the perspective of corporate behavior as a micro entity of market integration.

Author Contributions

Conceptualization, Z.L. and Z.Z.; Methodology, Z.L. and J.Z.; Visualization, J.Z.; Validation, Z.L. and Z.Z.; Writing—original draft, Z.L. and J.Z.; Resources, Z.Z.; Data curation, J.Z.; Formal analysis, Z.L. and J.Z.; Supervision, Z.Z.; Writing—review and editing, Z.Z. and J.Z. All authors have read and agreed to the published version of the manuscript.

Funding

This work was financially supported by National Natural Science Foundation of China (Grant numbers 72074175, 72174071 and 71774066).

Institutional Review Board Statement

Not applicable.

Informed Consent Statement

Not applicable.

Data Availability Statement

Data will be made available on request.

Acknowledgments

We are grateful thank to the NASA and the National Bureau of Statistics of China for providing public data support. We also thank reviewers for their valuable comments and thank the editors for assisting in the linguistic refinement of the manuscript.

Conflicts of Interest

The authors declare that the research was conducted in the absence of any commercial or financial relationships that could be construed as potential conflicts of interest.

Appendix A

Table A1. Description of variables.
VariablesUnitObsMeanStd. dev.MinMaxSkewnessKurtosis
Rµg/m348342.92612.95914.92167.974−0.5672.44
miN/A4830.00010.00020.00020.0007−0.6974.043
gdpten thousand yuan/person4836.05417.910.4721.12−0.3932.331
popperson/km2483695.9372.9220.82295.20.3354.529
tecnumber of patents/10,000 persons48313.220.360.014118.1−0.3062.414
enr%4830.7340.3780.0388.19−0.1952.801
ind%48351.5788.90527.6476−0.4093.402
open%4835.8434.6460.05744.235−0.5213.561
Table A2. Spatial autocorrelation test.
TestValuep-Value
Moran’s I0.76320.001
LM-error421.1540.001
LM-lag532.2790.001
Wald32.130.001
LR-error42.120.001
LR-lag27.930.001
Table A3. Direct, indirect, and total effects of market segmentation on haze pollution.
VariablesDirect EffectIndirect EffectTotal Effect
mi0.405 ***
(0.117)
1.489 **
(0.652)
1.893 **
(0.737)
gdp0.0822 *
(0.046)
0.504 *
(0.277)
0.586 *
(0.320)
tec−0.172 ***
(0.061)
−0.784 *
(0.401)
−0.956 **
(0.457)
pop0.346 ***
(0.121)
1.134 *
(0.675)
1.480 *
(0.764)
enr−0.227
(0.484)
−6.331 **
(3.131)
−6.558 *
(3.571)
ind0.0975 **
(0.046)
0.590 **
(0.275)
0.688 **
(0.317)
open0.178
(0.368)
0.726
(2.244)
0.904
(2.537)
Note: standard errors of coefficients are reported in parentheses; ***, ** and * represent 0.001, 0.01, and 0.05 significance levels, respectively.
Table A4. Abbreviated details.
AbbreviationsFull Names
GDPGross Domestic Product
PM2.5Particulate Matter less than 2.5 μm in Diameter
WHOThe World Health Organization
NASAThe National Aeronautics and Space Administration
GTFP
SDM
GS2SLS
Green Total factor productivity
The dynamic spatial Durbin model
The generalized space two-stage least squares method
R&DResearch and Development
SEDACThe Socioeconomic Data and Applications Center of Columbia University
CPIThe Consumer Price Index
SO2Sulphur Dioxide
CODChemical Oxygen Demand
SLMThe Spatial Lag Model
SEMThe Spatial Error Model

References

  1. Zhang, Q.; Robert, C. Toward an Environmentally Sustainable Future: Country Environmental Analysis of the People’s Republic of China, 1st ed.; Asian Development Bank: Manila, Philippines, 2012; pp. 61–63. [Google Scholar]
  2. Apte, J.S.; Brauer, M.; Cohen, A.J.; Ezzati, M.; Pope, C.A., III. Ambient PM2.5 Reduces Global and Regional Life Expectancy. Environ. Sci. Technol. Lett. 2018, 5, 546–551. [Google Scholar] [CrossRef]
  3. Zheng, S.; Kahn, M.E. A New Era of Pollution Progress in Urban China? J. Econ. Perspect. 2017, 31, 71–92. [Google Scholar] [CrossRef]
  4. Kan, H. World Health Organization air quality guidelines 2021: Implication for air pollution control and climate goal in China. Chin. Med. J. 2022, 135, 3. [Google Scholar] [CrossRef] [PubMed]
  5. Cai, F.; Du, Y.; Wang, M. Transformation of Economic Development Model and Internal Motivation for Energy Saving and Emission Reduction. Econ. Res. J. 2008, 6, 4–11+36. [Google Scholar]
  6. Huang, S. A Study of Impacts of Fiscal Decentralization on Smog Pollution. J. World Econ. 2017, 40, 127–152. [Google Scholar] [CrossRef]
  7. Zhang, K. Regional Integration, Environmental Pollution and Social Welfare. J. Financ. Res. 2020, 12, 114–131. [Google Scholar]
  8. Bian, Y.; Wu, L.; Zhou, M.; Bai, J. Domestic market segmentation and haze pollution: An empirical research based on Slx. Ind. Econ. Res. 2020, 2, 45–57. [Google Scholar] [CrossRef]
  9. Lv, Y.; Zhang, H. Does Breaking Market Segmentation Promote Chinese Enterprises to Reduce Pollution Emissions? J. Financ. Econ. 2021, 47, 4–18. [Google Scholar] [CrossRef]
  10. Yang, Y.; Xue, R.; Yang, D. Does market segmentation necessarily discourage energy efficiency? PLoS ONE 2020, 15, e0233061. [Google Scholar] [CrossRef]
  11. Zhao, J.; Shen, J.; Yan, J.; Hao, Y.; Ran, Q. Corruption, market segmentation and haze pollution: Empirical evidence from China. J. Environ. Plan. Manag. 2023, 66, 642–664. [Google Scholar] [CrossRef]
  12. Pan, X.; Yuan, S.; Li, J. The impact of Market Segmentation on Carbon Emissions from a Spatial Spillover Perspective-Empirical Evidence from 30 Provinces in China, Manage. Rev. 2023, 35, 14–27. [Google Scholar] [CrossRef]
  13. Lai, A.; Yang, Z.; Cui, L. Market segmentation impact on industrial transformation: Evidence for environmental protection in China. J. Clean. Prod. 2021, 297, 126607. [Google Scholar] [CrossRef]
  14. Zhang, K.; Shao, S.; Fan, S. Market integration and environmental quality: Evidence from the Yangtze River Delta region of China. J. Environ. Manag. 2020, 261, 110208. [Google Scholar] [CrossRef] [PubMed]
  15. Zhou, H.; Jiang, M.; Huang, Y.; Wang, Q. Directional spatial spillover effects and driving factors of haze pollution in North China Plain. Resour. Conserv. Recy. 2021, 169, 105475. [Google Scholar] [CrossRef]
  16. Chen, J.; Hu, X.; Huang, J.; Lin, R. Market integration and green economic growth–Recent evidence of China’s city-level data from 2004–2018. Environ. Sci. Pollut. Res. 2022, 29, 44461–44478. [Google Scholar] [CrossRef]
  17. Song, M.; Xu, H.; Shen, Z.; Pan, X. Energy market integration and renewable energy development: Evidence from the European Union countries. J. Environ. Manag. 2022, 317, 115464. [Google Scholar] [CrossRef]
  18. Zheng, K.; Deng, H.; Lyu, K.; Yang, S.; Cao, Y. Market Integration, Industrial Structure, and Carbon Emissions: Evidence from China. Energies 2022, 15, 9371. [Google Scholar] [CrossRef]
  19. Zhou, J.; Jiang, N.; Zhao, Z. On the Impact and Mechanism of Market Integration in Yangtze River Delta on Industrial Air Pollution Reduction and Its Mechanism. J. Nantong Univ. Soc. Sci. Ed. 2022, 38, 44–55. [Google Scholar]
  20. Xu, Z.; Wen, Q.; Zhang, T. Trade policy and air pollution: Evidence from the adjustment of the export tax rebate in China. Econ. Model. 2023, 128, 106497. [Google Scholar]
  21. Zhang, Y. Local Protection and the Prisoner’s Dilemma of Economic Growth. J. World Econ. 2018, 41, 147–169. [Google Scholar] [CrossRef]
  22. Grossman, G.M.; Krueger, A.B. Environmental Impacts of a North American Free Trade Agreement; National Bureau of Economic Research: Cambridge, MA, USA, 1991. [Google Scholar]
  23. Brock, W.A.; Taylor, M.S. Economic Growth and the Environment: A Review of Theory and Empirics. In Handbook of Economic Growth; Aghion, P., Durlauf, S.N., Eds.; Elsevier: Amsterdam, The Netherlands, 2005; Volume 1, pp. 1749–1821. [Google Scholar] [CrossRef]
  24. Chen, W.; Sun, W.; Liu, C.G.; Liu, W. Regional integration and high-quality development in the Yangtze River Delta region. Econ. Geogr. 2021, 41, 127–134. [Google Scholar] [CrossRef]
  25. Gao, L.; Jiang, F. Higher quality integration in the Yangtze River Delta: Stage features, dilemmas, and action frameworks. Economist 2020, 3, 66–74. [Google Scholar]
  26. Young, A. The Razor’s Edge: Distortions and incremental reform in the People’s Republic of China. Quart. J. Econ. 2000, 115, 1091–1135. [Google Scholar] [CrossRef]
  27. Boisot, M.; Meyer, M.W. Which way through the Open Door? Reflections on the internationalization of Chinese firms. Manag. Organ. Rev. 2008, 4, 349–365. [Google Scholar] [CrossRef]
  28. Ren, S.; Hao, Y.; Wu, H. Government corruption, Market segmentation and renewable energy technology innovation: Evidence from China. J. Environ. Manag. 2021, 300, 113686. [Google Scholar] [CrossRef]
  29. Wu, H.; Li, Y.; Hao, Y.; Ren, S.; Zhang, P. Environmental decentralization, local government competition, and regional green development: Evidence from China. Sci. Total Environ. 2020, 708, 135085. [Google Scholar] [CrossRef] [PubMed]
  30. Feng, T.; Du, H.; Lin, Z.; Zuo, J. Spatial spillover effects of environmental regulations on air pollution: Evidence from urban agglomerations in China. J. Environ. Manag. 2020, 272, 110998. [Google Scholar] [CrossRef]
  31. An, T.; Xu, C.; Liao, X. The Impact of FDI on environmental pollution in China: Evidence from spatial panel data. Environ. Sci. Pollut. Res. 2021, 28, 44085–44097. [Google Scholar] [CrossRef] [PubMed]
  32. Tong, H.; Wang, Y.; Xu, J. Green transformation in China: Structures of endowment, investment, and employment. Struct. Change Econ. Dyn. 2020, 54, 173–185. [Google Scholar] [CrossRef]
  33. Lei, Y.; Zheng, M.; Sun, J. The impact of industrial agglomeration on haze pollution of key urban agglomerations in China. Soft Sci. 2020, 34, 64–69. [Google Scholar] [CrossRef]
  34. Pan, X.; Wang, M.; Li, M. Low-carbon policy and industrial structure upgrading: Based on the perspective of strategic interaction among local governments. Energy Policy 2023, 183, 113794. [Google Scholar] [CrossRef]
  35. Tang, W. Factor Market integration and the development of China’s urban clusters–An Analysis Based on Micro-Firm Dataset. China Econ. Quart. 2021, 21, 1–22. [Google Scholar]
  36. Gui, Q.; Chen, M.; Lu, M.; Chen, Z. China’s domestic commodity market tends to be segmented or integrated: An analysis based on the relative price method. J. World Econ. 2006, 2, 20–30. [Google Scholar]
  37. Qin, C.; Fu, X.; Wang, T.; Gao, J.; Wang, J. Control of fine particulate nitrate during severe winter haze in “2+26” cities. J. Environ. Sci. 2024, 136, 261–269. [Google Scholar] [CrossRef]
  38. Van Donkelaar, A.; Martin, R.V.; Li, C.; Burnett, R.T. Regional estimates of chemical composition of fine particulate matter using a combined geoscience-statistical method with information from satellites, models, and monitors. Environ. Sci. Technol. 2019, 53, 2595–2611. [Google Scholar] [CrossRef] [PubMed]
  39. Chen, W.; Sun, W. The spatial division of regional integration in the Yangtze River Delta. Urban Plan. Forum 2020, 1, 37–40. [Google Scholar]
  40. Coccia, M. Political economy of R&D to support the modern competitiveness of nations and determinants of economic optimization and inertia. Technovation 2012, 32, 370–379. [Google Scholar] [CrossRef]
  41. Liu, Z.; Miao, Z.; Zhan, X.; Wang, J.; Gong, B.; Yu, S.X. Large-Scale Long-Tailed Recognition in an Open World. In Proceedings of the 2019 IEEE/CVF Conference on Computer Vision and Pattern Recognition (CVPR), Long Beach, CA, USA, 15–20 June 2019; pp. 2532–2541. [Google Scholar] [CrossRef]
  42. Xu, X.; Xu, Y.; Xu, H.; Wang, C.; Jia, R. Does the expansion of highways contribute to urban haze pollution?–Evidence from Chinese cities. J. Clean. Prod. 2021, 314, 128018. [Google Scholar] [CrossRef]
  43. LeSage, J.; Pace, R.K. Introduction to Spatial Econometrics; Chapman and Hall/CRC: New York, NY, USA, 2009. [Google Scholar] [CrossRef]
  44. Shao, S.; Li, X.; Cao, J. Urbanization promotion and haze pollution governance in China. Econ. Res. J. 2019, 54, 148–165. [Google Scholar]
  45. Xu, Z.; Liu, C. The “gray edge” effect of environmental regulation. Financ. Trade Econ. 2020, 41, 145–160. [Google Scholar]
  46. Coccia, M. Comparative Institutional Changes. In Global Encyclopedia of Public Administration, Public Policy, and Governance; Farazmand, A., Ed.; Springer Nature: Berlin/Heidelberg, Germany, 2019. [Google Scholar] [CrossRef]
Figure 1. The theoretical framework of mechanisms by which market segmentation affects haze pollution. Note: all figures were created by the authors, same as the figures below.
Atmosphere 14 01539 g001
Figure 2. The trend of market segmentation and haze pollution in the Yangtze River Delta urban agglomeration in 1998–2018.
Atmosphere 14 01539 g002
Figure 3. The relationship between market segmentation and haze pollution in each city of the Yangtze River Delta urban agglomeration.
Atmosphere 14 01539 g003
Table 1. Baseline estimated results.
VariablesSDMGS2SLS
L.R0.142 ***
(0.021)
mi0.214 ***
(0.0831)
1.596 **
(0.706)
gdp4.263 ***
(0.590)
4.862 ***
(0.660)
tec−0.0801 ***
(0.0258)
−2.134 ***
(0.388)
pop0.488 **
(0.238)
0.008 ***
(0.001)
enr−1.586 ***
(0.483)
−0.168 **
(0.074)
ind0.0184
(0.021)
0.326 ***
(0.049)
open0.265 ***
(0.071)
0.392 ***
(0.093)
w.R0.0704 ***
(0.023)
0.0694 ***
(0.005)
w.mi0.613 **
(0.248)
w.gdp0.149 ***
(0.026)
w.tec−0.0458 ***
(0.0097)
w.pop0.132 ***
(0.024)
w.enr0.121 ***
(0.029)
w.ind0.0063 ***
(0.001)
w.open0.0017 *
(0.001)
Constant−29.39 ***
(6.36)
−69.67 ***
(8.149)
Observations483483
F test35.273
(0.001)
45.866
(0.001)
Adj. R20.7570.839
Note: standard errors of coefficients are reported in parentheses; ***, ** and * represent 0.001, 0.01 and 0.05 significance levels, respectively. p values are in parentheses below the F test. All tables were created by the authors, same as the tables below.
Table 2. Robustness test.
Variables(1)(2)(3)(4)
SDMGS2SLSSDMGS2SLSSDMGS2SLSSDMGS2SLS
L.R0.126 ***
(0.035)
0.138 ***
(0.035)
0.197 ***
(0.049)
0.130 ***
(0.035)
mi0.395 ***
(0.141)
0.129 ***
(0.037)
0.226 ***
(0.087)
0.196 ***
(0.049)
0.0159 *
(0.009)
0.138 ***
(0.035)
0.153 **
(0.072)
0.250 ***
(0.069)
w.R0.0238 *
(0.013)
0.148 ***
(0.035)
0.0616 *
(0.032)
0.134 ***
(0.037)
0.0223 ***
(0.003)
0.217 ***
(0.048)
0.0195 ***
(0.0031)
0.171 ***
(0.039)
w.mi0.770 **
(0.328)
0.226
(0.212)
0.249
(0.497)
0.371 *
(0.202)
Control variablesYesYesYesYesYesYesYesYes
Constant9.354 ***
(0.302)
1.296 ***
(0.345)
0.755
(2.136)
1.264 ***
(0.342)
−3.446 *
(1.942)
1.853 ***
(0.357)
5.315 ***
(1.716)
2.061 ***
(0.394)
Observations483483483483483483483399
Adj. R20.70770.67480.87250.77510.78670.80160.78260.7943
Note: standard errors of coefficients are reported in parentheses; ***, ** and * represent 0.001, 0.01 and 0.05 significance levels, respectively.
Table 3. Mechanism analysis.
VariablesSDMGS2SLS
L.R0.120 ***
(0.038)
mi * gdp0.303 ***
(0.042)
0.223 ***
(0.035)
mi * up0.338 ***
(0.069)
0.190 ***
(0.067)
mi * tec0.194 ***
(0.049)
0.221 **
(0.099)
w.R0.0190 ***
(0.003)
0.0764 ***
(0.006)
w.mi0.853 ***
(0.252)
Control VariablesYesYes
Constant−4.579
(6.907)
−33.96 ***
(8.475)
Observations483483
Adj. R20.83670.7954
Note: standard errors of coefficients are reported in parentheses; *** and ** represent 0.001 and 0.01 significance levels, respectively.
Table 4. Summary of Related Research.
AuthorsStudy AreaPollutant SelectionThe Expression of Market SegmentationConclusions
Bian et al., (2020) [8]ProvincesHaze pollutionMarket segmentationExacerbate pollution with spillover effect
Lv et al., (2021) [9]ProvincesPollution intensity of industrial enterprisesMarket segmentationExacerbate pollution
Yang et al., (2020) [10]ProvincesEnergy efficiencyMarket segmentationAn inverted U-shaped relationship
Zhao et al., (2023) [11]ProvincesHaze pollutionMarket segmentationExacerbate pollution with spillover effect
Pan et al., (2023) [12]ProvincesCarbon emissionMarket segmentationExacerbate carbon emission and with spillover effect
Zhang et al., (2020) [14]The Yangtze River Delta urban agglomerationEmissions of sulfur dioxide, industrial wastewater, and industrial sootMarket integrationAn inverted U-shaped relationship
Zhou et al., (2021) [15]ProvincesGreen total factor productivityMarket integrationIncrease green total factor productivity
Chen et al., (2022) [16]CitiesGreen total factor productivityMarket integrationIncrease green total factor productivity
Zheng et al., (2022) [18]ProvincesCarbon emissionMarket integrationReduce carbon emission
Zhou et al., (2023) [19]The Yangtze River Delta urban agglomerationEmission intensity of sulfur dioxide, industrial soot, and industrial wastewaterMarket integrationReduce pollution
Note: Market integration is the opposite of market segmentation.
Disclaimer/Publisher’s Note: The statements, opinions and data contained in all publications are solely those of the individual author(s) and contributor(s) and not of MDPI and/or the editor(s). MDPI and/or the editor(s) disclaim responsibility for any injury to people or property resulting from any ideas, methods, instructions or products referred to in the content.

