Article

Analysis of the Causes and Wind Field Structure of a Dry Microburst in a Weak Weather Background

1
Meteorological Observatory, Ningxia Air Traffic Management Sub-Bureau, Civil Aviation Administration of China, Yinchuan 750009, China
2
School of Atmosphere Science, Chengdu University of Information Technology, Chengdu 610225, China
3
Institute of Atmospheric Physics, Chinese Academy of Sciences, Beijing 100029, China
*
Authors to whom correspondence should be addressed.
Atmosphere 2023, 14(10), 1540; https://doi.org/10.3390/atmos14101540
Submission received: 15 September 2023 / Revised: 3 October 2023 / Accepted: 4 October 2023 / Published: 8 October 2023
(This article belongs to the Section Meteorology)

Abstract

:
Dry microbursts in weak weather backgrounds, due to their small scale and general lack of precipitation, are often difficult to observe using weather radar. On the night of 26 April 2023, a dry microburst occurred at the Yinchuan Airport. Based on conventional meteorological observations, Automated Weather Observing System (AWOS) data, and the Doppler Wind Lidar data, an analysis was conducted on the causes and wind field structure of this microburst. It was found that (1) the sounding data indicated a DCAPE value of 880 J·kg−1, which is important for forecasting the potential for dry microburst events; (2) the foehn from the Helan Mountains contributed to the occurrence of microburst weather at the Yinchuan Airport; (3) the Doppler Wind Lidar wind data showed distinct characteristics of the wind field during this microburst event, including a symmetric horizontal wind field structure, significant vertical downdraft velocities (reaching −5.76 m·s−1), and low-level wind shear over the airport runway and its vicinity; and (4) effective monitoring of such microburst weather events with the Doppler Wind Lidar wind measurements is crucial for ensuring aviation safety.

1. Introduction

The phenomenon of a downburst is an extremely destructive weather event, with a conceptual model first proposed by Fujita during an investigation of aircraft accidents at New York’s Kennedy International Airport [1,2]. It is used to describe a strong downward and outward burst of air. Downbursts are associated with multiple aviation accidents and are referred to as an aviation weather hazard [3,4,5]. In 1978, during the Northern Illinois Meteorological Research in Downbursts (NIMRODs) project led by Fujita, it was discovered that downbursts come in different temporal and spatial scales, leading to the classification of microbursts and macrobursts. Microbursts have horizontal scales less than 4 km, with maximum wind durations generally ranging from 2 to 5 min. On the other hand, macrobursts have horizontal scales between 4 and 40 km and can produce strong winds lasting 5–20 min or even longer, sometimes causing damage equivalent to tornadoes with intensities reaching F3 (70–92 m·s−1) [6,7]. In 1982, during the Joint Airport Weather Studies (JAWSs) project [8] led by Fujita, McCarthy, and Wilson in Colorado, it was found that downbursts could be classified into dry and wet categories. Fujita referred to downbursts occurring with precipitation less than 0.25 mm or no precipitation as dry downbursts and those with precipitation equal to or greater than 0.25 mm as wet downbursts [9,10]. Dry downbursts are more common in the central plains of the United States, typically generated by high-based cumulonimbus or high clouds [7,11]. Wet downbursts often occur in the southeastern United States, East Asia, and the southwestern parts of Europe, typically generated by deep convective storms, like squall line systems [12,13,14,15,16]. Research on dry downbursts, especially dry microbursts, is limited in East Asia, making this study a valuable addition to the database.
Field experiments have shown that in 60–80% of thunderstorm weather downbursts can be detected [17,18]. Thunderstorms require specific conditions: abundant moisture in the air, an unstable atmosphere, and lifting mechanisms [19,20,21]. These atmospheric conditions are also favorable for downburst occurrence [22,23,24,25,26,27,28]. Therefore, the weather conditions of convective thunderstorms can serve as potential forecasting conditions for downbursts. Additionally, downbursts have unique characteristics related to thermal conditions. The environmental conditions recognized for downburst generation include a significant decrease in temperature with height in the lower levels of the troposphere (below 500 hPa) [18,29] and the presence of relatively dry air near the melting layer (700–300 hPa) along with moist air in the lower levels [18,29,30,31]. However, due to the complexity of downburst prediction, not every favorable environment leads to downburst occurrence [28]. Recent research has even contradicted earlier findings, with James and Marlkowsti (2010) suggesting that dry upper-level air is not conducive to microburst development [32]. Fujita (1981) pointed out that bow echoes are prone to downburst occurrence [7], while Wakimoto (2001) speculated that downbursts triggered by bow echoes and MCSs are primarily generated by embedded strong downdraft divergence [17]. In recent years, it has been gradually established that the “downbursts” at the apex of bow echoes are primarily induced by mid-scale vortices, which is fundamentally different from the initial definition of downbursts as primarily caused by strong descending airflow [33]. Despite being difficult to predict and posing significant aviation hazards, due to limited observational data, research on downbursts, especially microbursts, has been limited in the past 20 years [34].
Downburst regions experience strong vertical air movement [35], along with horizontal and vertical wind shears, which pose a threat to aviation safety. Generally, macrobursts are of longer duration and higher intensity, capable of causing tornado-level damage [4,7]. However, they are easier to detect, and aircraft typically avoid them. In contrast, microbursts exhibit rapid spatial and temporal variations, occurring closer to the ground and posing the greatest danger to aircraft. During takeoff or landing, encountering microbursts can result in a loss of airspeed, which is especially perilous near the ground [36]. Similarly, wet downbursts are more observable due to their association with deep convective storms [12,13,14,15,16], whereas dry downbursts, lacking distinct weather phenomena [7,9,10], are less easily observed and more detrimental to aviation safety. Understanding the characteristics and distribution of downbursts benefits pilots and air traffic controllers when responding to and avoiding this hazardous phenomenon, thus enhancing aviation safety [37]. Additionally, airlines can optimize flight paths to circumvent danger zones, improving flight efficiency [38]. Research on downbursts also contributes to the refinement of meteorological forecasting models, enhancing the accuracy of predictions for this unique and hazardous weather phenomenon [39] and providing more reliable weather information to airlines and pilots.
Currently, methods for detecting downbursts include aircraft equipped with meteorological sensing devices conducting real-time observations while flying through downburst regions [40], weather radar detecting precipitation and wind field information in downburst areas [36,41,42,43,44,45,46] (currently the primary method), and satellite remote sensing technologies, such as infrared and microwave monitoring cloud cover, precipitation, temperature, etc., assisting with assessing the likelihood of downbursts [47,48,49,50,51]. For airports, Doppler Weather Radars (DWRs) and Automated Weather Observing Systems (AWOSs) are commonly used devices for monitoring and warning of downbursts [52]. DWR detects precipitation particles and performs well in detecting downbursts, especially macrobursts and wet downbursts when atmospheric moisture conditions are adequate. However, its detection capability is limited under clear sky conditions, particularly for dry downbursts [53], and it cannot provide near-surface monitoring around airports due to a minimum elevation angle of 0.5°. AWOS only detects wind direction and speeds up to approximately 10 m above the ground, lacking information on upper-level wind conditions and having monitoring blind spots [54]. Detecting downbursts presents a challenging task, due to the rapid temporal and spatial variability of their wind field structure and characteristics. It requires high spatial resolution to capture subtle changes in wind fields, placing stringent demands on wind measurement equipment. Especially for dry downbursts occurring in clear sky conditions, traditional weather radar is not effective for detection [53]. With advancements in radar technology, particularly the use of Lidar, the ability to detect and track dry downbursts has improved significantly.
Doppler Wind Lidar is a high-precision instrument that uses laser technology to measure wind speed and direction in the atmosphere [55,56]. It plays a crucial role in aviation meteorology [57]. Doppler Wind Lidar offers high spatial resolution [58,59], capturing subtle changes in atmospheric wind speed and direction. It has been instrumental in detecting, locating, and determining the intensity of wake vortices [60,61,62,63,64], particularly excelling for near-surface measurements [65,66]. Compared to traditional meteorological wind measurement methods, Doppler Wind Lidar allows wind field measurements anytime and anywhere. It offers advantages such as high detection resolution, accurate wind speed measurements, and real-time data collection [57,67]. In recent years, the Doppler Wind Lidar has been increasingly used for low-level wind shear and wind field detection [52,59,68,69,70,71,72].
Despite the extensive potential applications of Doppler Wind Lidar in aviation meteorology, there have been limited reports on using it to detect and study the wind field structure and characteristics of downbursts, especially dry microbursts in clear sky conditions. On the night of 26 April 2023, a dry microburst phenomenon was observed at the Yinchuan Airport, where significant wind shear near the ground was present, despite the absence of noticeable weather conditions. This paper utilizes Doppler Wind Lidar, airport meteorological automated observation systems, and conventional meteorological observation data. From a meteorological perspective, it analyzes the causes of this dry microburst. Additionally, different Doppler Wind Lidar modes are employed to study the wind field structures and characteristics of this dry microburst. The aim of this paper is to provide insights that can contribute to the monitoring, warning, and forecasting of low-level wind shear and microbursts at civil aviation airports.

2. Study Area, Equipment, and Data

The Yinchuan Airport is located within the jurisdiction of the Linhe Township, Lingwu City, Yinchuan, as shown in Figure 1. The terrain around the airport is particularly complex, with the eastern border adjacent to the edge of the Maowusu Desert, the western side bordered by the continuously flowing Yellow River that traverses the Ningxia Plain, and the main peak of the Helan Mountains situated 53.4 km to the northwest (magnetic bearing 306°). The backside of the Helan Mountains features extensive Gobi Desert terrain. The region exhibits a typical continental climate characterized by cold and dry winters, hot and dry summers, windy springs, and relatively short autumns. The airport is situated at coordinates 38°19′ N, 106°23′ E and at an elevation of 1140.9 m. It has a single runway designated with magnetic headings of 029°–209°. The two ends of the runway are referred to as Runway 21 (south) and Runway 03 (north), with a total runway length of 3200 m.
The data used in this study primarily include observations from the airport’s AWOS and a 3D laser wind profiler. The AWOS, manufactured by Vaisala, Finland, is installed at three locations: the southern end, the midpoint, and the eastern side of the northern end of the runway, 300 m from each end. The observed data comprise temperature, humidity, atmospheric pressure, wind direction, and wind speed, with a time resolution of 30 s for wind direction and wind speed and 1 min for other parameters.
The Doppler Wind Lidar used was developed by the Second Institute of China Ordnance Industry Group and employs an FC-III-type Doppler coherent system with an all-fiber structure. It operates at a wavelength of 1550 nm and offers a range resolution of 30–100 m (adjustable). The detected data include radial velocity, horizontal wind direction and wind speed, vertical wind direction and wind speed, and signal-to-noise ratio, among others. Specific parameters can be found in Table 1. This radar features four detection modes: Wind Profile Mode (DBS), Range Height Indicator Mode (RHI), Plan Position Indicator Mode (PPI), and Takeoff and Landing Path Mode (GP). These four modes are preset to allow the radar to operate continuously throughout the day, with each cycle including one DBS scan, one PPI scan at four elevation angles, one PPI scan at six elevation angles, one RHI scan along the direction of 180° from the ends of the runway, one GP scan for Runway 03, and one GP scan for Runway 21. In addition to the above-mentioned equipment and data, this study also utilizes data from the China Meteorological Administration’s operational observation network, including surface, upper-air, and radiosonde data.

3. Weather and Terrain Factors Analysis for Dry Microburst

3.1. Weather Factors Analysis

On 26 April 2023, at 08:00 Beijing time (GMT+8), the weather chart at 500 hPa indicated the presence of a Mongolian cyclone located in the northern part of East Asia. Cold air was flowing southward along the northwest periphery of this cyclone, resulting in strong cold advection over Mongolia, western Inner Mongolia, and the Hexi Corridor. The Yinchuan Airport was situated at the leading edge of this cold advection. Above 700 hPa, the region was under the influence of a cold advection regime, while at 850 hPa, there was a weak cold advection zone behind a warm ridge. The upper-level winds were predominantly from the northwest, indicating a generally stable atmospheric condition throughout the vertical profile. At the same time, on the surface weather chart, the center of the Mongolian cyclone was positioned in the eastern part of Mongolia, moving northeastwards into northeastern China. The areas from eastern Mongolia through central Inner Mongolia to the Hexi Corridor were influenced by the cold front of this cyclone. By 20:00 on April 26th, the cold front had already passed the Yinchuan Airport, and the weather conditions were gradually stabilizing.
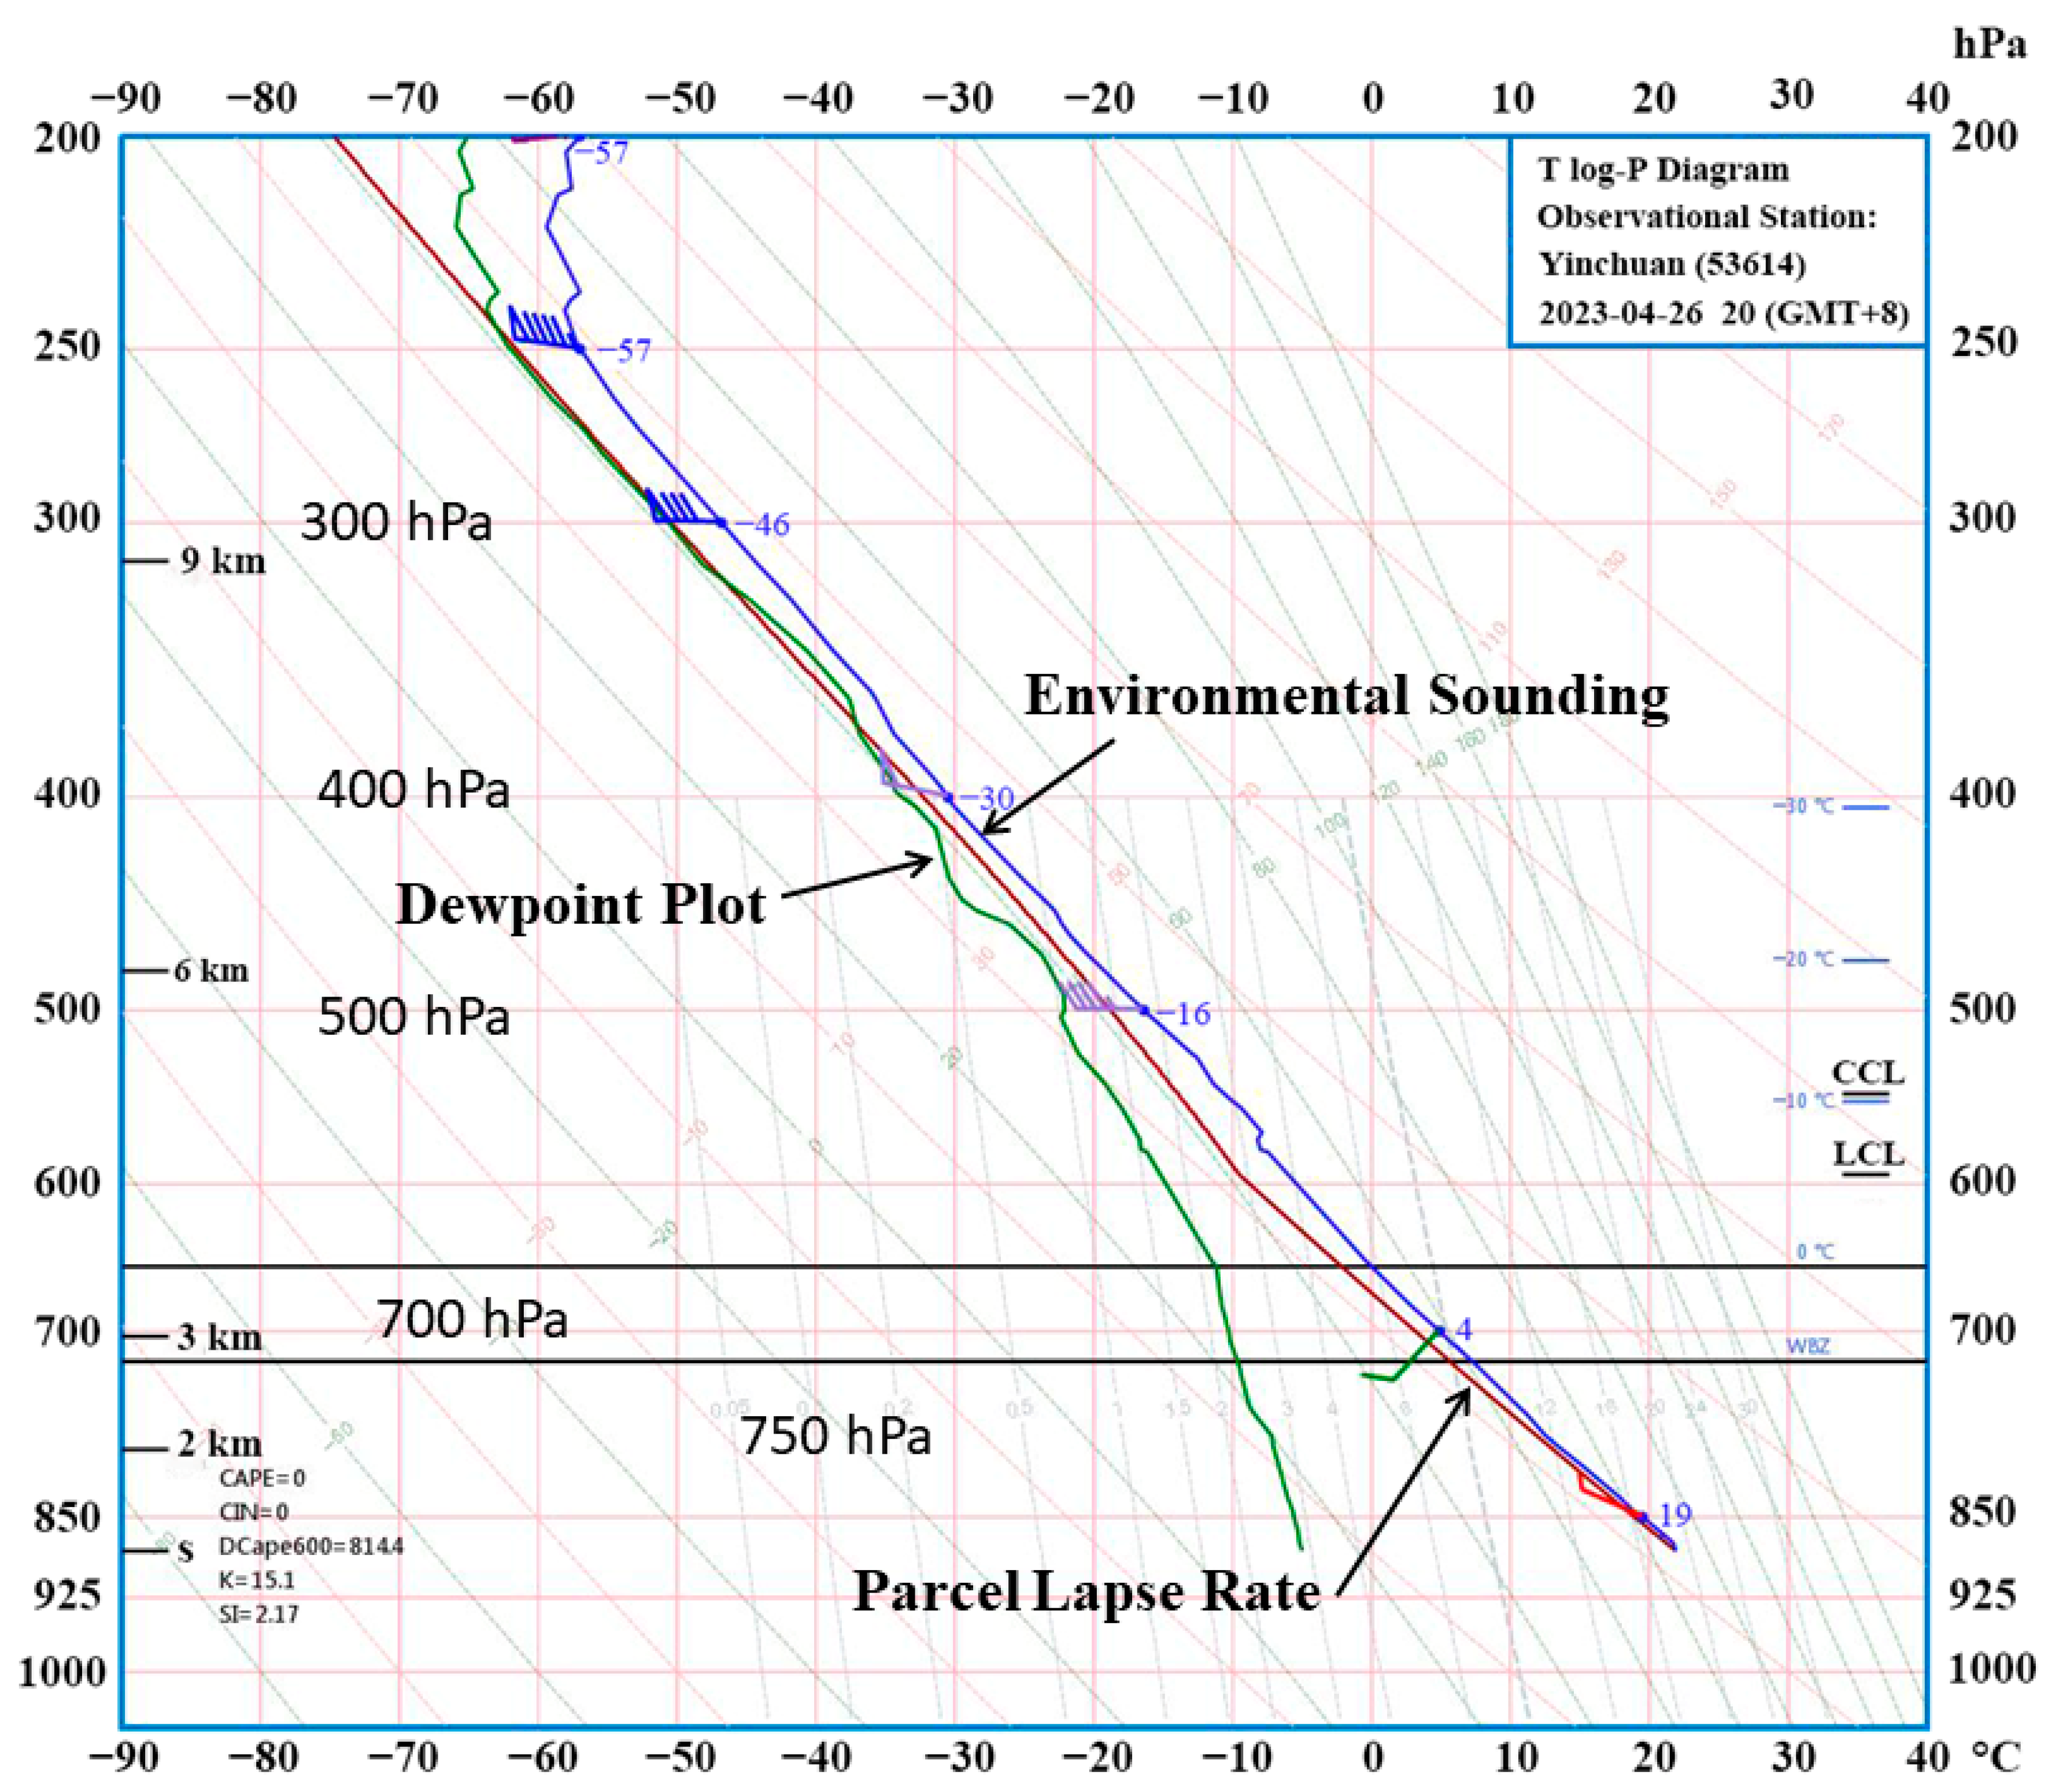
As shown in Figure 2, the 20:00 (GMT+8) soundings chart for the Yinchuan area on the 26th reveals certain atmospheric conditions. Examining the wind field, below 500 hPa, there is a relatively consistent northwestward wind, while above 500 hPa, there is a prevailing westerly wind, with no significant vertical wind shear evident. However, there is a substantial vertical lapse rate of temperature in the environment, especially below 400 hPa, where the temperature lapse rate approaches the dry adiabatic lapse rate. Particularly noteworthy is the fact that below 750 hPa, the environmental temperature follows closely along the dry adiabatic lapse rate line. The boundary layer is well-mixed, a temperature structure that is conducive to downward momentum transport and the generation of strong descending airflow [18,29]. Simultaneously, the temperature and humidity profiles exhibit an inverted “V” shape. This inverted “V” structure in the temperature and humidity profiles is favorable for the development of microbursts [31]. In terms of humidity, a clear high-humidity region is observed in the middle layer (300–500 hPa), while the lower layer is dry. This differs from Atkins’ conclusion [31] but is similar to the findings of James and Marlkowsti (2010) [32].
At 20:00 (GMT+8) in the Yinchuan region, the sounding data indicated the calculated values as follows: Downdraft Convective Available Potential Energy: DCAPE = 888.2 J·kg−1, Convective Available Potential Energy: CAPE= 0 J·kg−1, and Convective Inhibition: CIN = 0 J·kg−1. Downdraft Convective Available Potential Energy (DCAPE) theoretically represents the maximum kinetic energy that may be generated when downdrafts in convective clouds reach the surface, reflecting the strength of downdrafts or microbursts. DCAPE has been widely used in the analysis and study of severe storms since its introduction by Emanuel in 1994 [73]. Research has shown that DCAPE is conducive to the generation of dry microbursts [74,75,76]. When DCAPE is higher, the downdrafts in the lower atmosphere are stronger. Assuming no other factors, if the vertical velocity at the start of the descent is zero, then the theoretical maximum descent velocity due to negative buoyancy causing downdrafts is given by
W min = 2 D C A P E
Based on the calculated DCAPE value at 20:00 (GMT+8), the theoretical maximum descent velocity that could be generated is 42 m·s−1. The atmospheric environment is favorable for the occurrence of microbursts. However, when combined with a CAPE of 0 J·kg−1, it is evident that the atmosphere is stable, which makes the occurrence of microbursts less likely. So, how was this dry microburst triggered on 26 April in the Yinchuan region? Further analysis of terrain factors is needed to understand this.

3.2. Terrain Factors Analysis

The Helan Mountains stretch across the northwestern part of Ningxia, with a length of approximately 200 km from north to south and a width of 15–60 km from east to west. The elevations in the mountainous region range from 1600 to 3000 m, with the main peak reaching 3556 m. When airflows pass over the Helan Mountains, they create a phenomenon known as the foehn [77]. During its forward movement, the foehn leads to significant warming of the ground in the leeward slope areas [78,79]. The Yinchuan Airport is located on the leeward slope of the Helan Mountains and falls within the influence zone of the foehn.
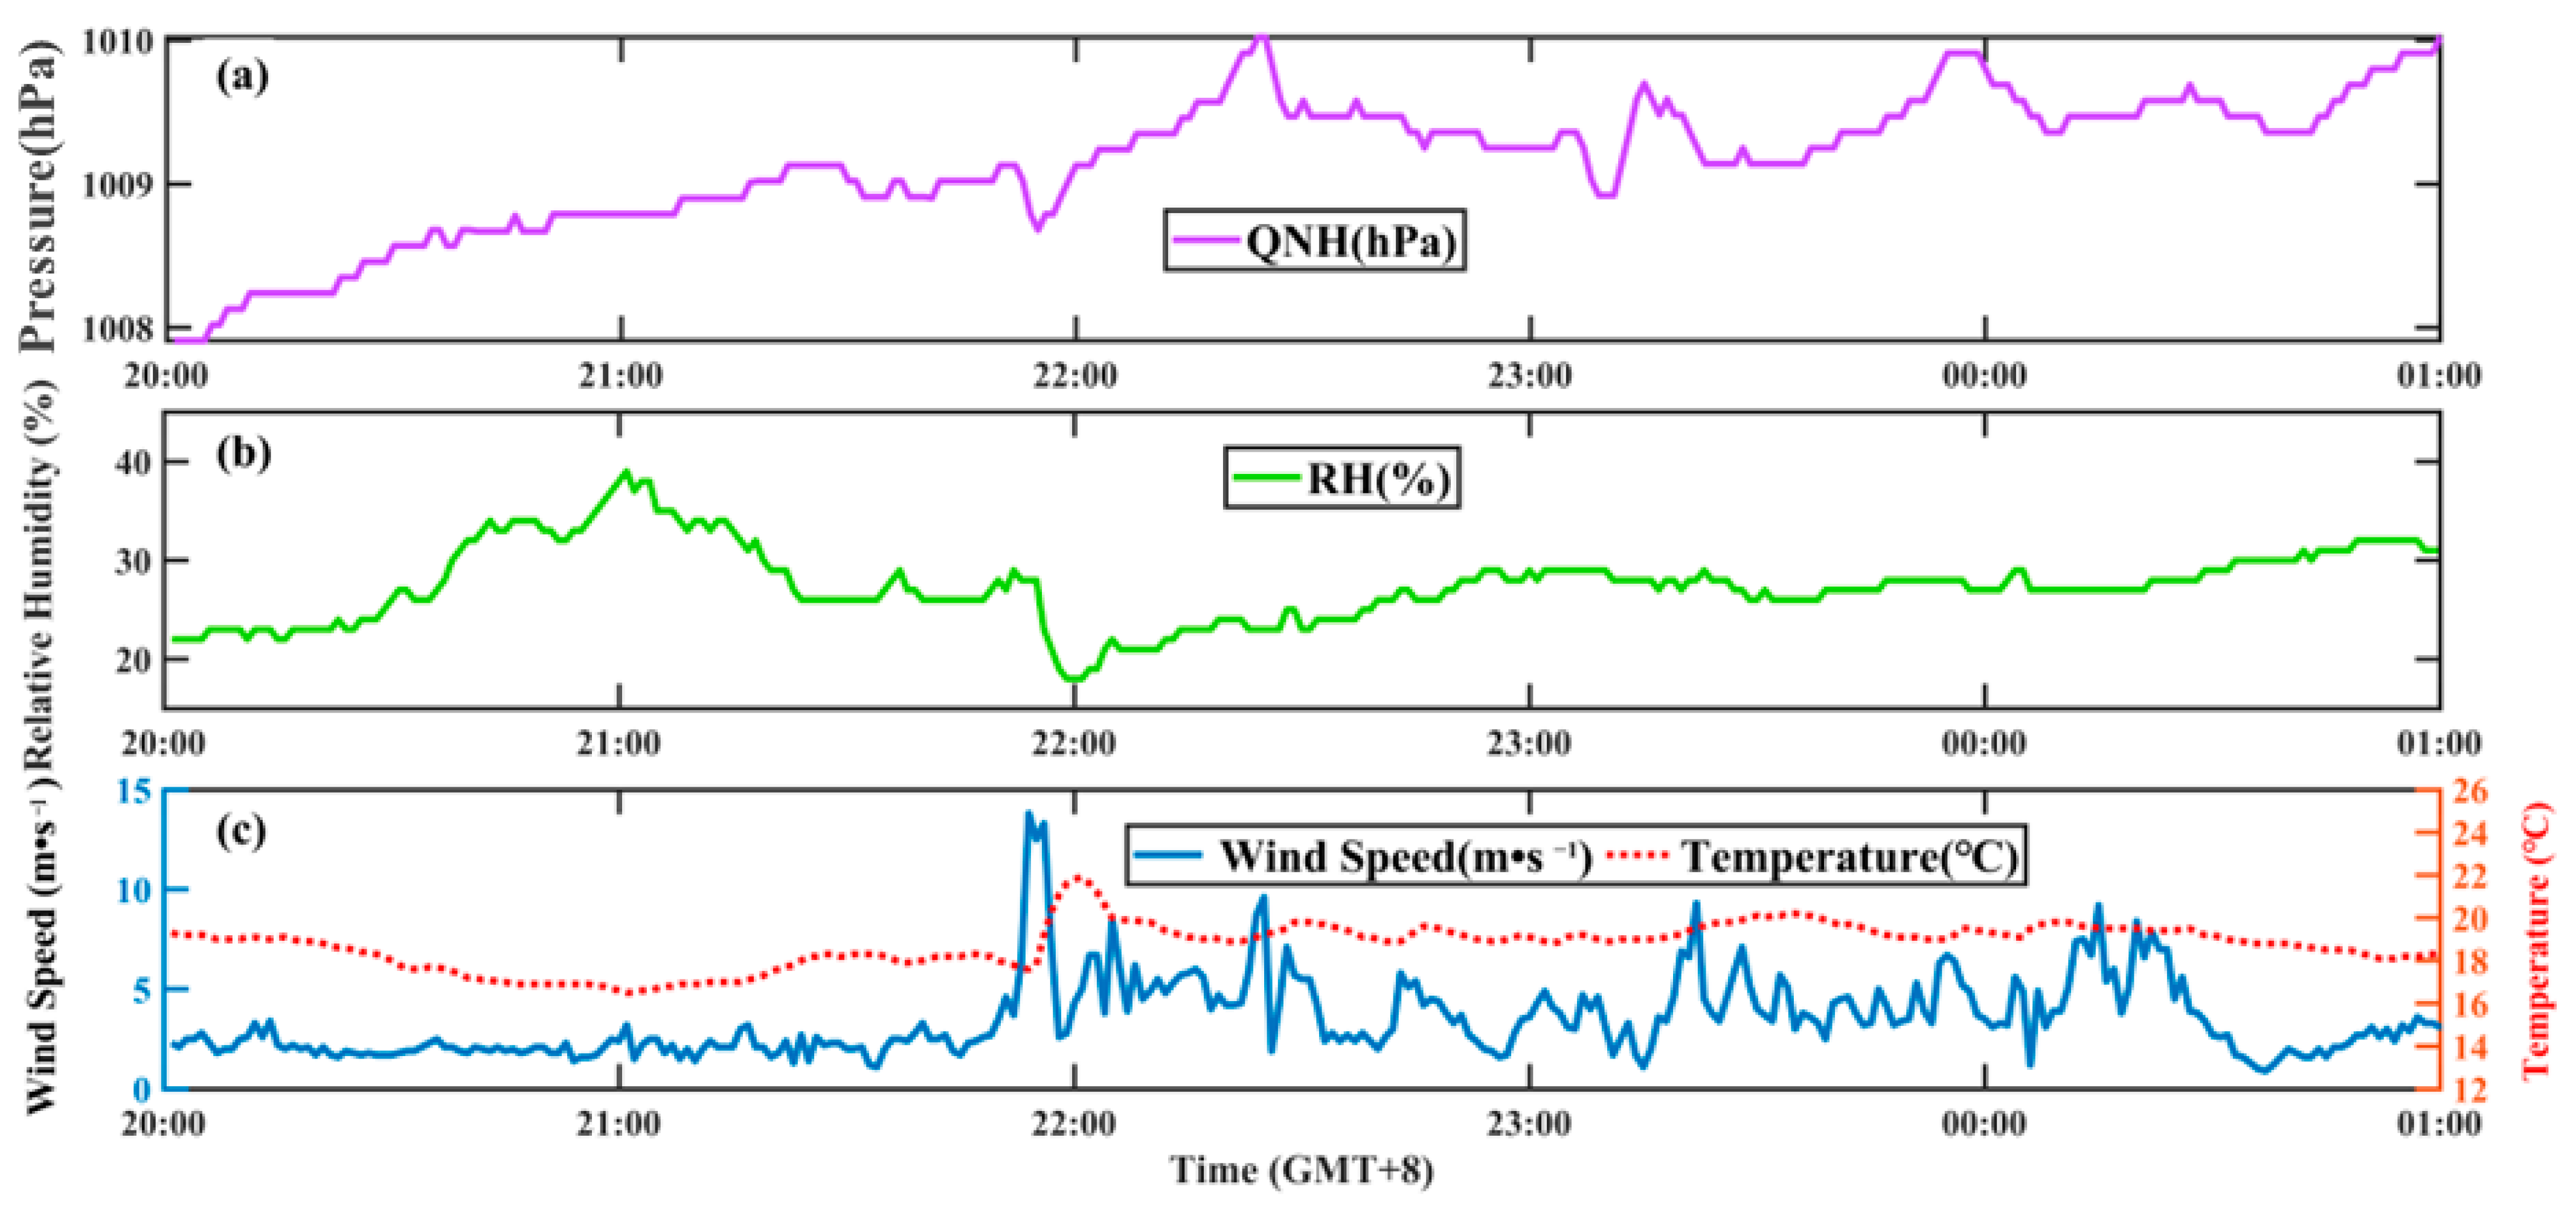
Figure 3 shows the time variation in ground meteorological elements detected by the airport’s AWOS at the Runway 03 end. The results reveal that after 21:00 (GMT+8), the temperature notably increased. After 21:52 (GMT+8), with a sharp rise in temperature, the wind speed increased from approximately 4 m·s−1 to approximately 14 m·s−1. Subsequently, the temperature dropped sharply. Following the temperature fluctuations, the wind speed also fluctuated, with a sudden increase in wind speed from 2 m·s−1 to 10 m·s−1 at 22:12 (GMT+8). Accompanying the temperature changes, the relative humidity decreased significantly after 21:00, dropping from 38% to approximately 17%. This indicates that at approximately 21:00 (GMT+8), a dry and hot air mass arrived at the Yinchuan Airport at the surface.
The trend of the increase in sea level pressure at the Yinchuan Airport slowed down after 21:00 (GMT+8), followed by a period of stability from 21:00 to 01:00 (GMT+8). During this period, the temperature fluctuated, and there was a clear negative correlation between temperature changes and pressure changes. In other words, as the temperature increased, the negative pressure change became evident, while as the temperature decreased, the positive pressure change became noticeable.
The changes in the meteorological elements mentioned above reflect that the airflow crossing the Helan Mountains on the night of April 26th generated the foehn, which moved eastward and affected the Yinchuan Airport. This resulted in an increase in ground temperature at the airport and the development of negative pressure.
Further analysis of the impact of the terrain-induced foehn effect on dry microbursts can be performed from a theoretical perspective using the vertical momentum equation [29]:
dw dt = 1 r p z + g θ v θ v 0 c v c p p p 0 r
In this equation:
  • w is the vertical velocity.
  • θ is the potential temperature.
  • p is the pressure.
  • c is the specific heat.
  • r is the mixing ratio, defined as the sum of the mixing ratios of cloud water ( r c ), rainwater ( r r ), and ice water ( r i ).
In Equation (2), the terms can be explained as follows:
  • The first four terms represent the vertical gradients of perturbation pressure.
  • The term involving thermal buoyancy ( θ v ) plays a crucial role.
  • The term involving perturbation pressure buoyancy (p′) is important.
  • The last term represents the contribution of condensates (cloud water, rainwater, and ice water).
In many microburst situations, the first term (vertical gradient of perturbation pressure) is relatively small, and for dry microbursts like this one, the impact of the fourth term (condensates) is also minimal. Instead, the second term, representing thermal buoyancy, often dominates. In this case, the airflow crossing the Helan Mountains generates the foehn, which heats the surface near the ground, providing thermal forcing. This thermal forcing is a triggering factor for the occurrence of this dry microburst. The foehn heating effect has two key impacts:
5.
It raises the temperature near the ground, leading to lower pressure and positive buoyancy in the heated air, resulting in an upward motion.
6.
The vertical temperature structure in the atmosphere exhibits a condition where it is warmer aloft and cooler near the surface, creating negative buoyancy in the upper air and causing downdrafts.
Additionally, the third term (perturbation pressure buoyancy) also contributes to accelerating the upward motion of air parcels. These two effects, thermal and pressure buoyancy, interact and reinforce each other, leading to convective activity in the vertical direction in a short time. This ultimately results in the formation of this dry microburst. The dominant triggering factor for this event stems from the heating effect caused by the foehn near the surface.
Typically, there are three main reasons for the strong winds associated with microbursts, including direct wind from the downdraft, horizontal momentum transport by the downdraft, and the creation of a cold pool by the downdraft. From the sounding data in Figure 2, it can be observed that the wind speed at 700 hPa is relatively low (approximately 4 m·s−1). This suggests that the strong winds associated with this microburst were primarily a result of the direct wind from the downdraft. Considering that this dry microburst originated upstream and weakened as it moved toward the observation site, it indicates that the microburst was more intense at its inception.

4. Wind Field Structure and Characteristics of Downdrafts

The Doppler Wind Lidar targets atmospheric aerosols and other particles, allowing precise wind field detection under clear-sky conditions. This capability provides opportunities for studying the wind field structure and characteristics of small-scale dry downdrafts. In this paper, we analyze the wind field structure and characteristics of downdrafts before and after their impact from four perspectives: wind field time-height distribution, near-surface conditions, vertical profiles in the atmosphere, and key areas along the glide path.

4.1. Wind Field Time-Height Distribution and Characteristics

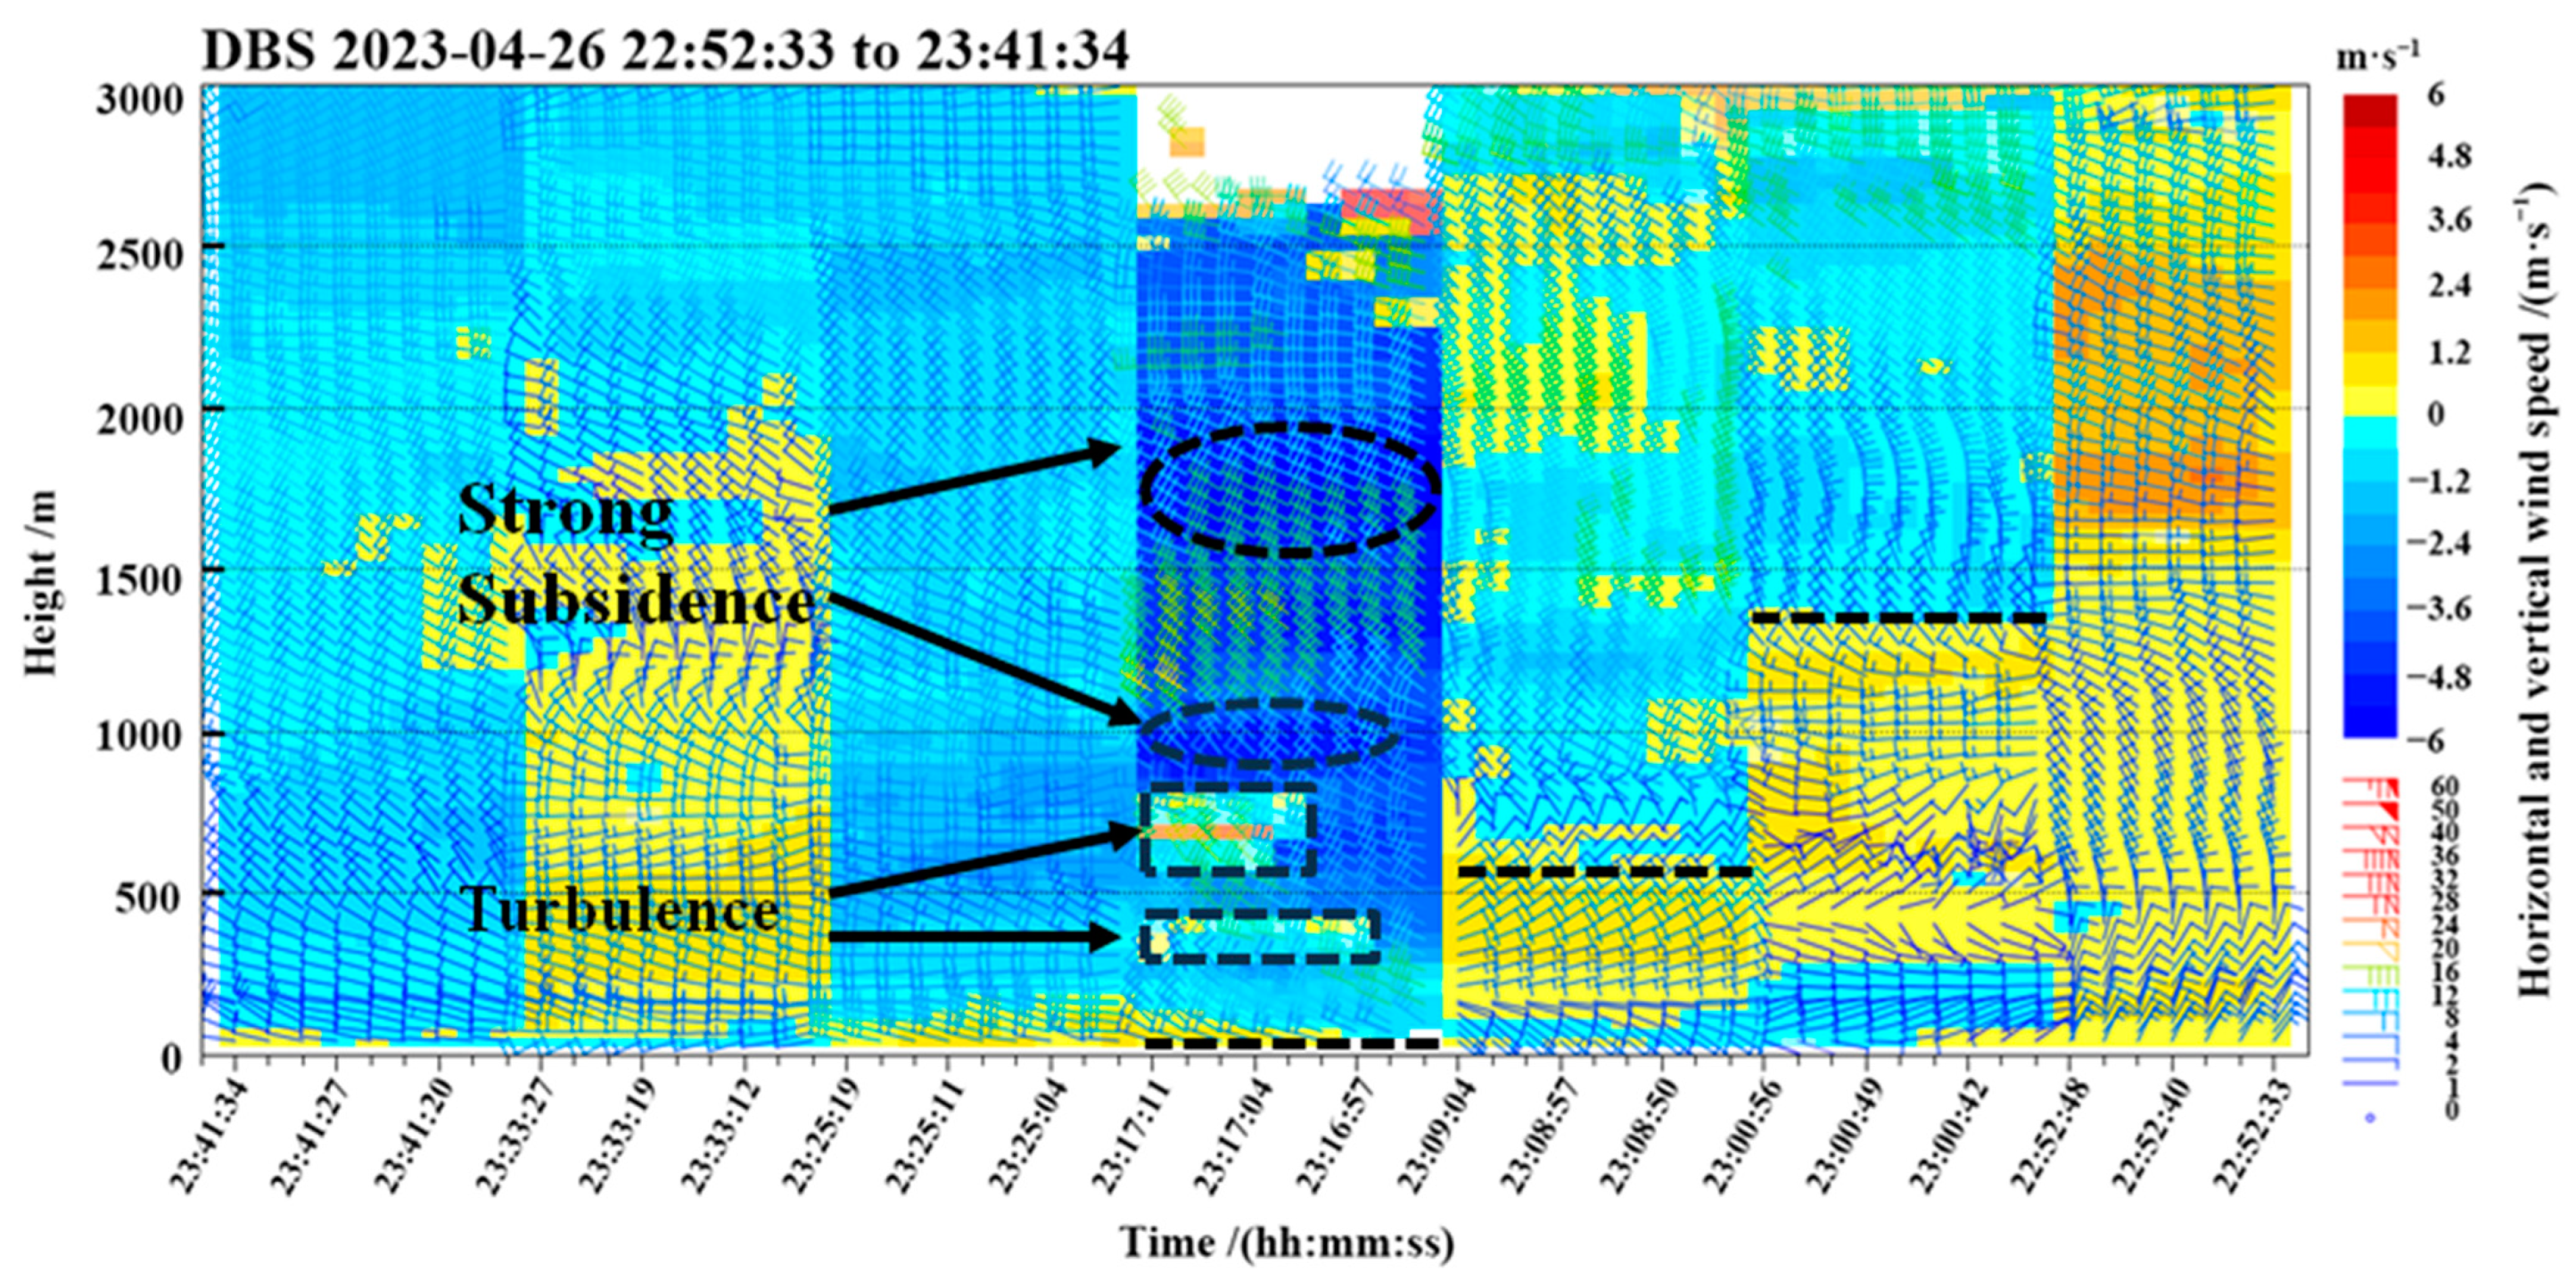
Figure 4 shows the vertical velocity and horizontal wind profiles in the wind profiler mode from 22:52 to 23:41 (GMT+8). It is evident that at 23:00 (GMT+8), there was a strong downdraft at altitudes ranging from 1400 to 2900 m. By 23:08 (GMT+8), the downdraft continued to develop and reached altitudes of approximately 600 m. By 23:16 (GMT+8), the downdraft had descended to near the surface (indicated by the vertical dashed line in Figure 4), with the most intense negative vertical velocity occurring at approximately 2000 m. The minimum negative velocity appeared at 23:16 (GMT+8), at an altitude of 1746 m, with a value of −5.76 m·s−1. Notably, this event did not result in precipitation, but a micro-scale dry downdraft phenomenon was observed over the vicinity of the Yinchuan Airport at approximately 23:16 (GMT+8). In terms of time progression, the top height of the downdraft, as well as its lower boundary, gradually decreased from 23:00 to 23:16 (GMT+8). This suggests that the micro-scale dry downdraft began at an altitude of 3000 m and gradually intensified. The downdraft, accompanied by divergent strong winds, moved toward the Yinchuan Airport. The intensity of the downdraft gradually increased from 23:00 to 23:16 (GMT+8), and it can be inferred that this event lasted for approximately 20 min from its onset to its peak. Examination of the horizontal wind field in conjunction with the vertical velocity reveals that the region of the strongest downdraft corresponds to high values in the horizontal wind field. Between 23:00 and 23:17 (GMT+8), the maximum wind speed over the Yinchuan Airport reached 18 m·s−1, primarily from a northwesterly direction. As the downdraft reached near the surface, the near-surface wind direction changed abruptly from southeasterly to northwesterly, indicating a significant low-level wind shear. At approximately 23:17 (GMT+8), turbulence was observed at altitudes of 300–400 m and 600–800 m (indicated by the rectangular dashed lines in Figure 4). Simultaneously, there were disturbances in the horizontal wind field, and the downdraft began to weaken. By 23:25 (GMT+8), the wind field at 3000 m stabilized, with a consistent northwesterly flow throughout the atmospheric column.

4.2. Near-Surface Wind Field Structure and Characteristics

Figure 5 displays the scan wind fields and environmental wind profiles from the Laser Doppler Wind Lidar Radar at a 6° elevation angle between 22:40 and 23:21 (GMT+8). From the figures, it can be observed that at 22:40 (GMT+8) (indicated by the dashed line in Figure 5a), divergent airflow appeared at a distance of 6000 m in the northwest direction at the 6° elevation angle and moved toward the observation site. At this time, the divergence in wind speeds ranged from approximately 4 to 8 m·s−1. By 22:48 (GMT+8) (Figure 5b, dashed line), divergent downdraft regions were evident at elevations of 4000–6000 m in the northwest-north direction and 2000–6000 m in the northwest-south direction. The divergent area in the northwest-south direction was larger, extending up to 2000 m from the observation site. In contrast, the divergent area in the northwest-north direction was smaller but associated with stronger divergent winds, reaching speeds of 22 m·s−1 in the southwest direction. At 22:56 (GMT+8) (Figure 5c, dashed line), the two divergent regions merged, resulting in a significant increase in their extent and strength. The primary area of divergence was located at altitudes of 6000–8000 m, with the peripheral divergent winds reaching 32 m·s−1. The divergent airflow exhibited a clear axisymmetric structure, generating divergent wind patterns on either side of the axis, characterized by southwest winds and northwest winds. Simultaneously, the descending airflow toward the observation site accelerated. By 23:05 (GMT+8) (Figure 5d, dashed line), the divergent wind field began to weaken, with the maximum peripheral wind speed remaining at 22 m·s−1 while continuing to move toward the observation site. At 23:13 (GMT+8) (Figure 5e, dashed line), the divergent downdraft region continued to move eastward, with its leading edge reaching the observation site. The intensity of the divergence slightly increased, with maximum peripheral wind speeds of 26 m·s−1. Wind direction over the observation site transitioned from southeast to northwest. By 23:21 (GMT+8) (Figure 5f, dashed line), the event had largely moved away from the observation site, with reduced intensity. The wind fields over the observation site and its vicinity exhibited a more consistent northwest wind pattern.

4.3. Profile Wind Field Structure and Characteristics

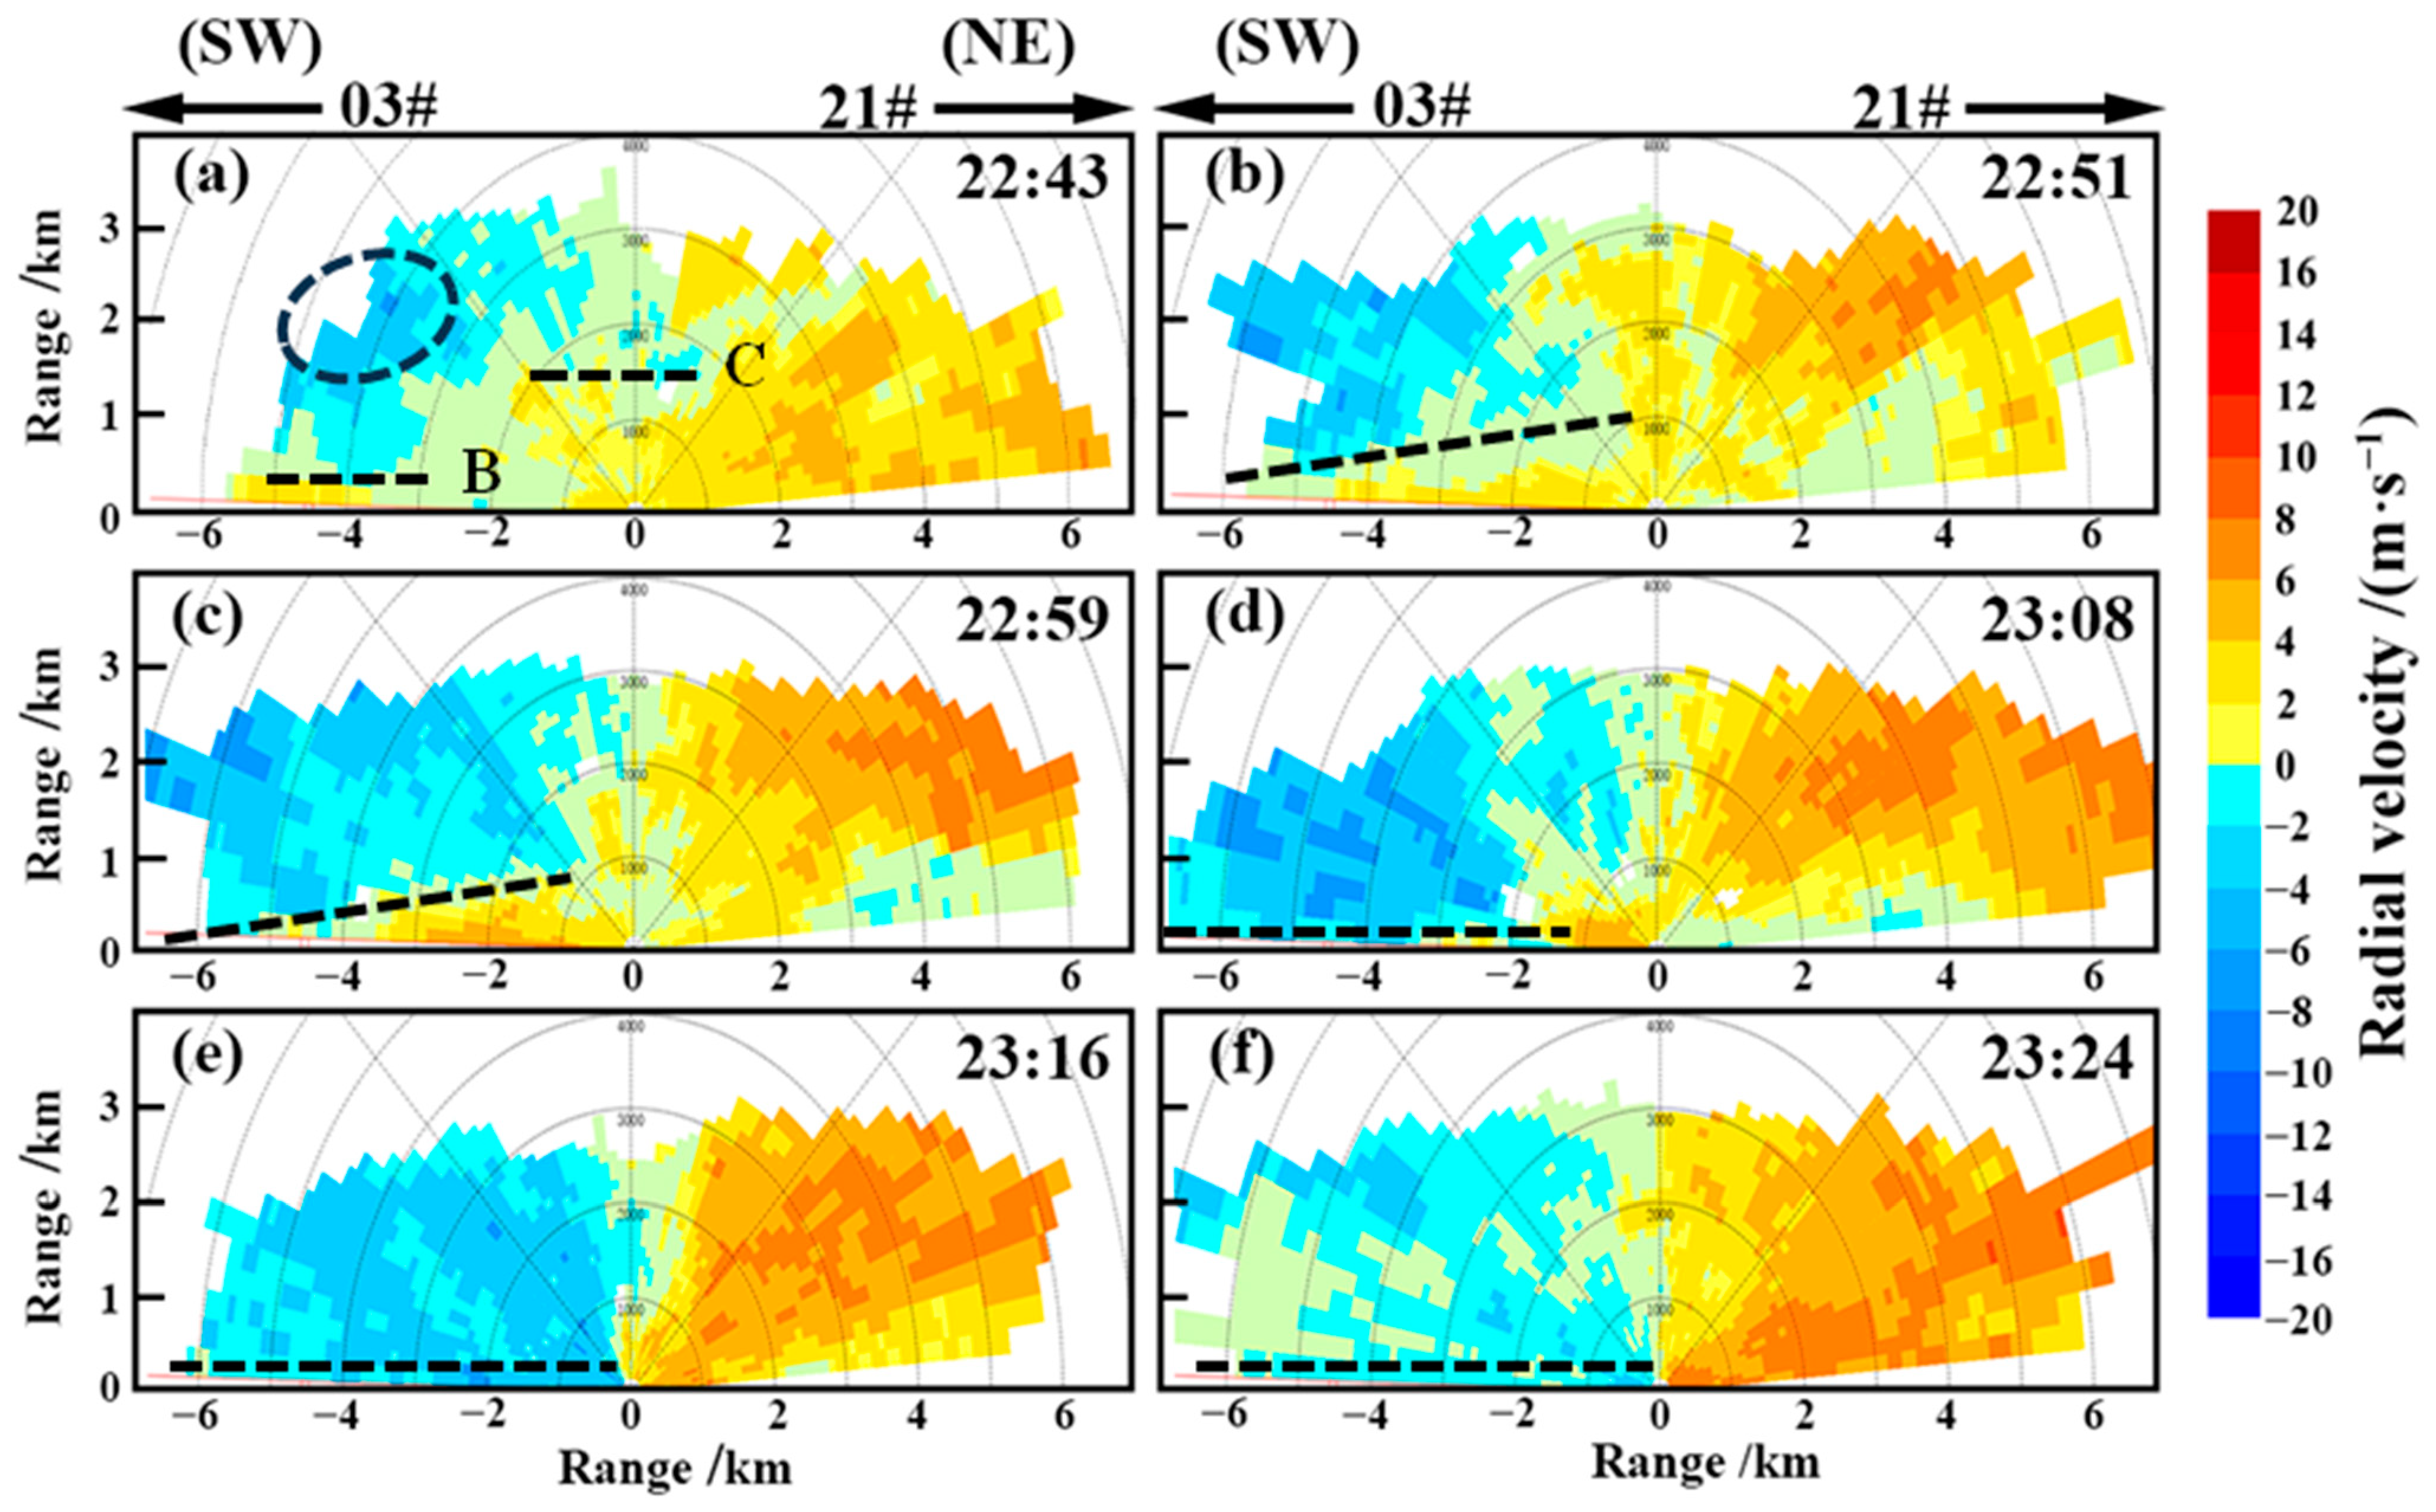
Figure 6 presents the results of the RHI mode scans conducted between 22:43 and 23:24 (GMT+8). Given that the microburst was approaching the observation site from the northwest direction, data from the 112° azimuth scan were chosen for analysis. As the microburst moved from the northwest direction toward the observation site, it can be observed in Figure 6a that at 22:43 (GMT+8), the divergent airflow associated with the microburst was approaching the site. The maximum speed of this movement was found in the range of 1400–3000 m in altitude, spanning distances of 3000–5000 m from the observation site. Simultaneously, distinct layering in the descending airflow was evident. The leading edge of the lower portion was at approximately 1400 m (marked as the dashed line C in Figure 6a), while the rear portion reached as low as 500 m (marked as the dashed line B in Figure 6a). By 22:51 (GMT+8), the main body of the microburst descended to approximately 500 m and continued its approach toward the observation site (Figure 6b). At 23:08 (GMT+8), the main body of the microburst was close to the near-surface level (Figure 6d). By 23:16 (GMT+8), it had reached the observation site (Figure 6e), and its intensity began to diminish. By 23:24 (GMT+8), the intensity had further decreased (Figure 6f), and environmental winds began to infiltrate the area, leading to noticeable turbulence.

4.4. Wind Field Changes in the Approach Path Area

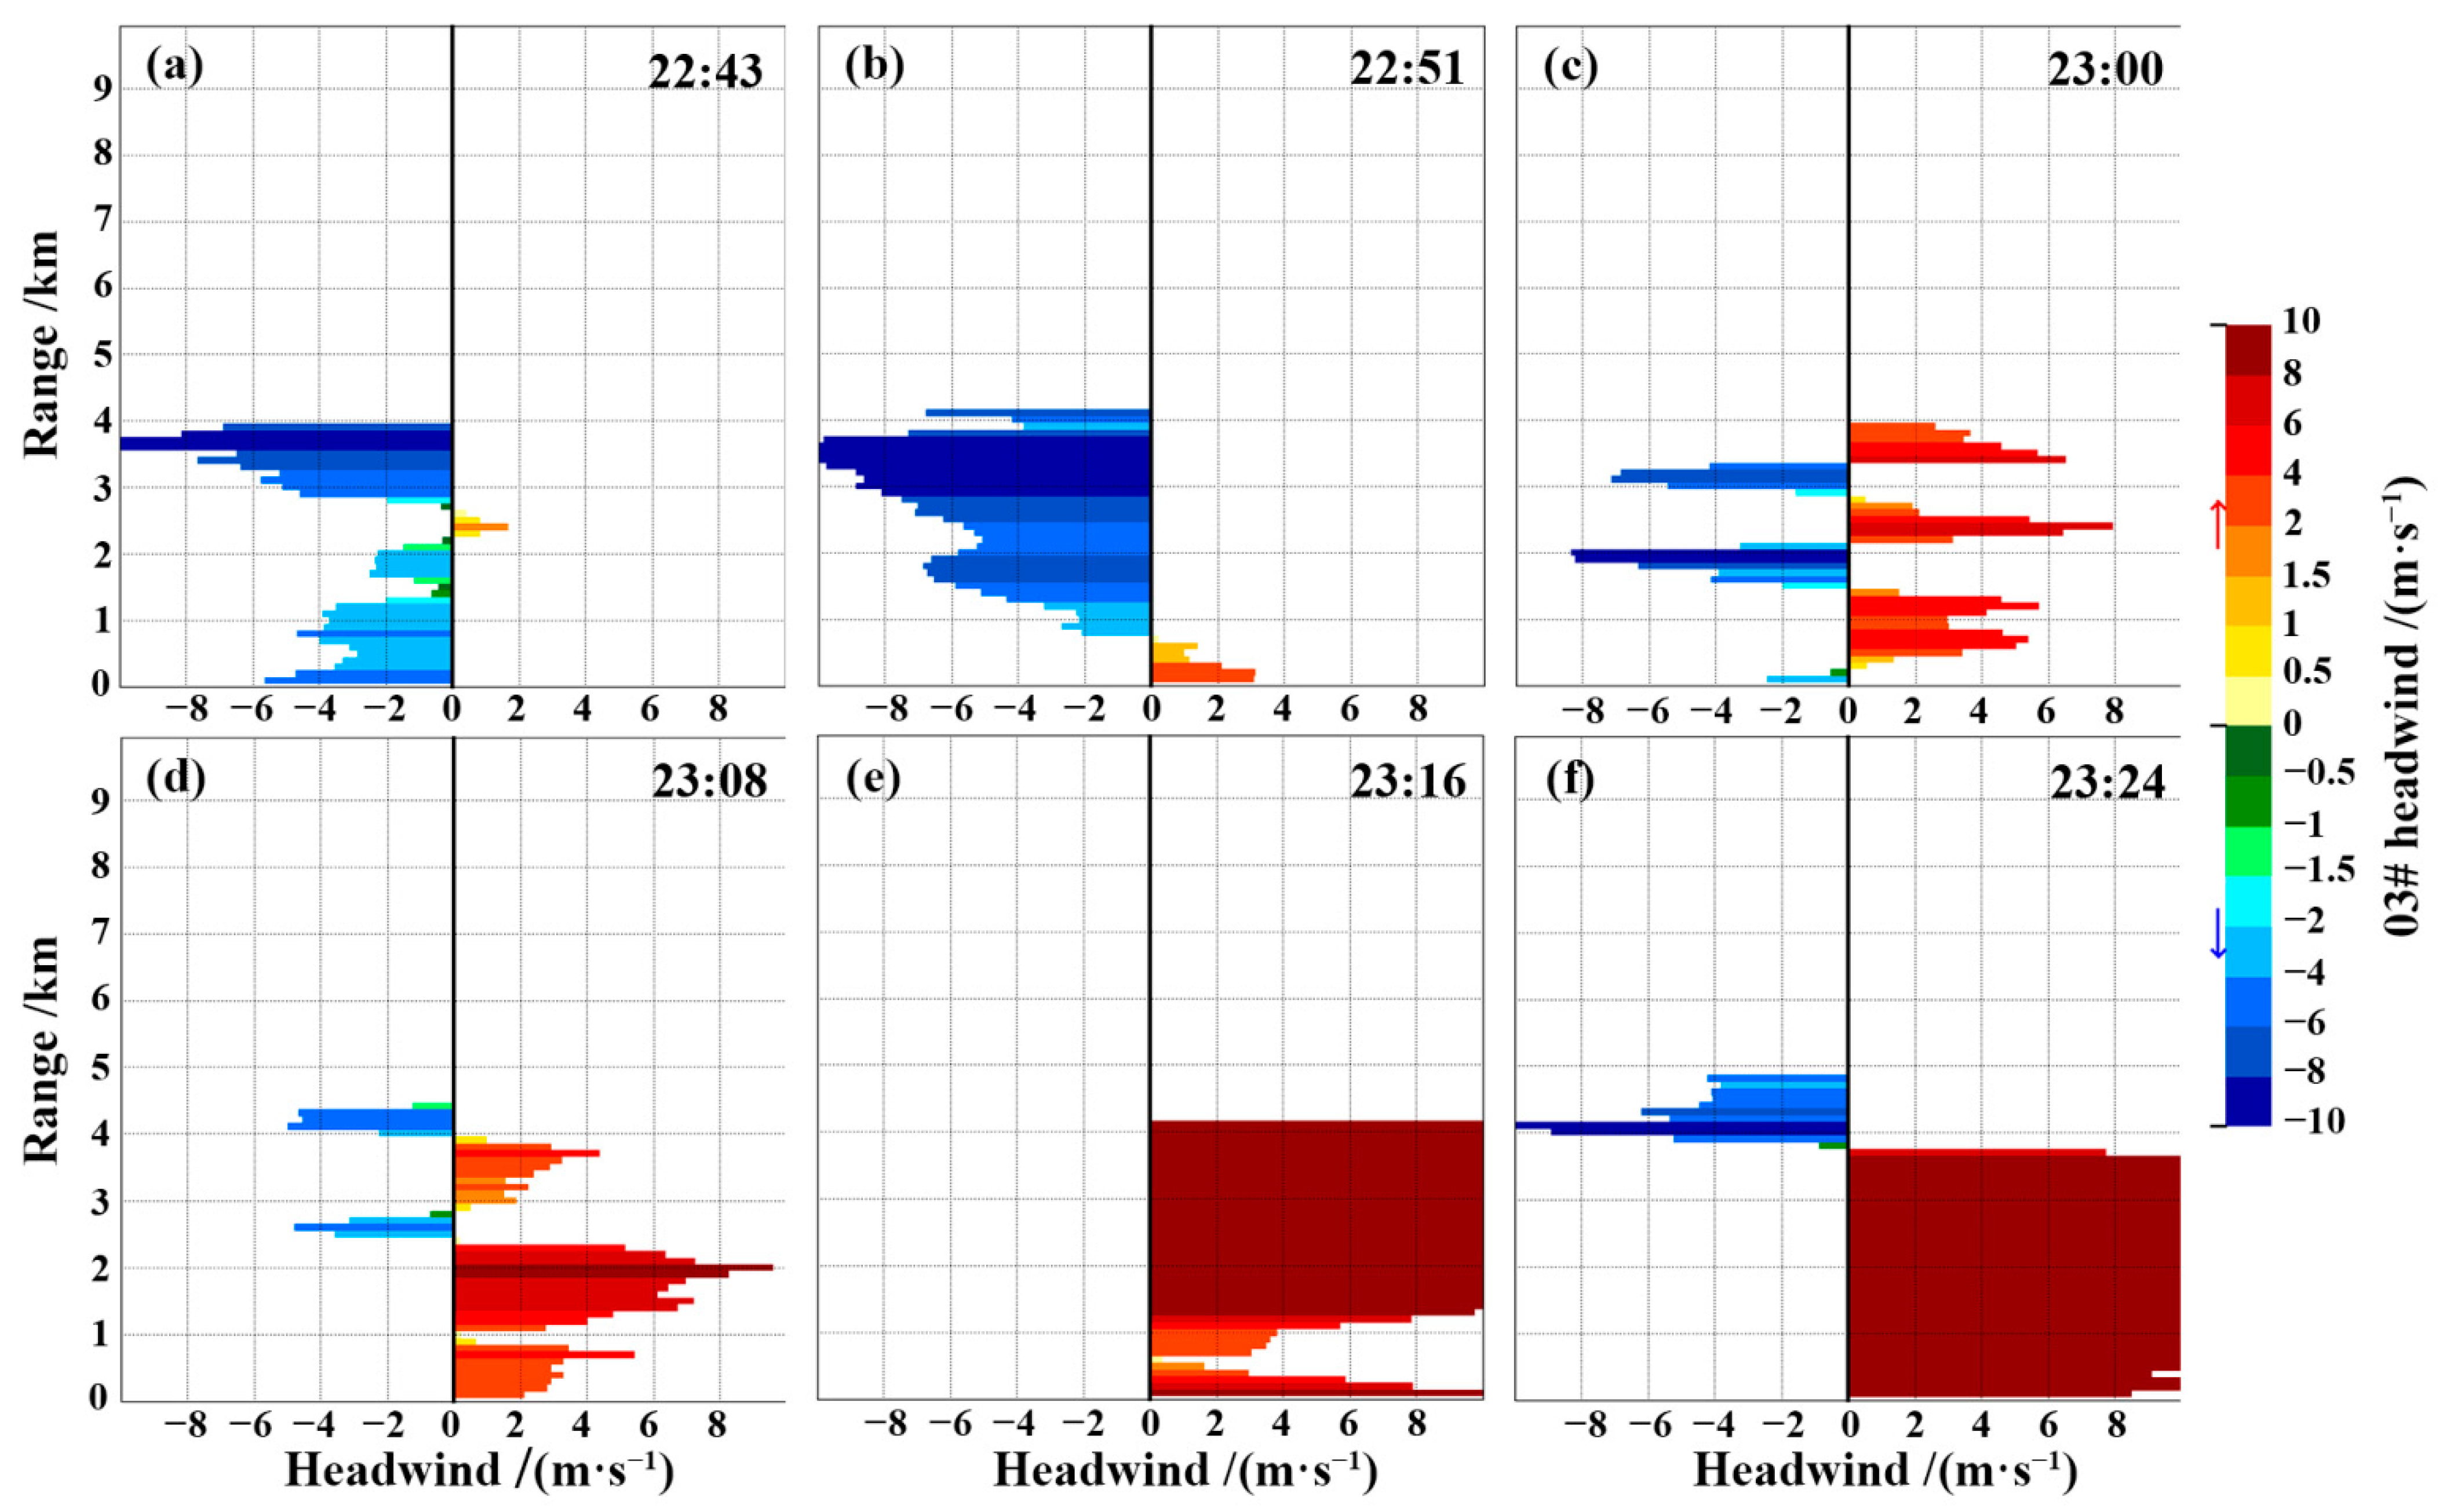
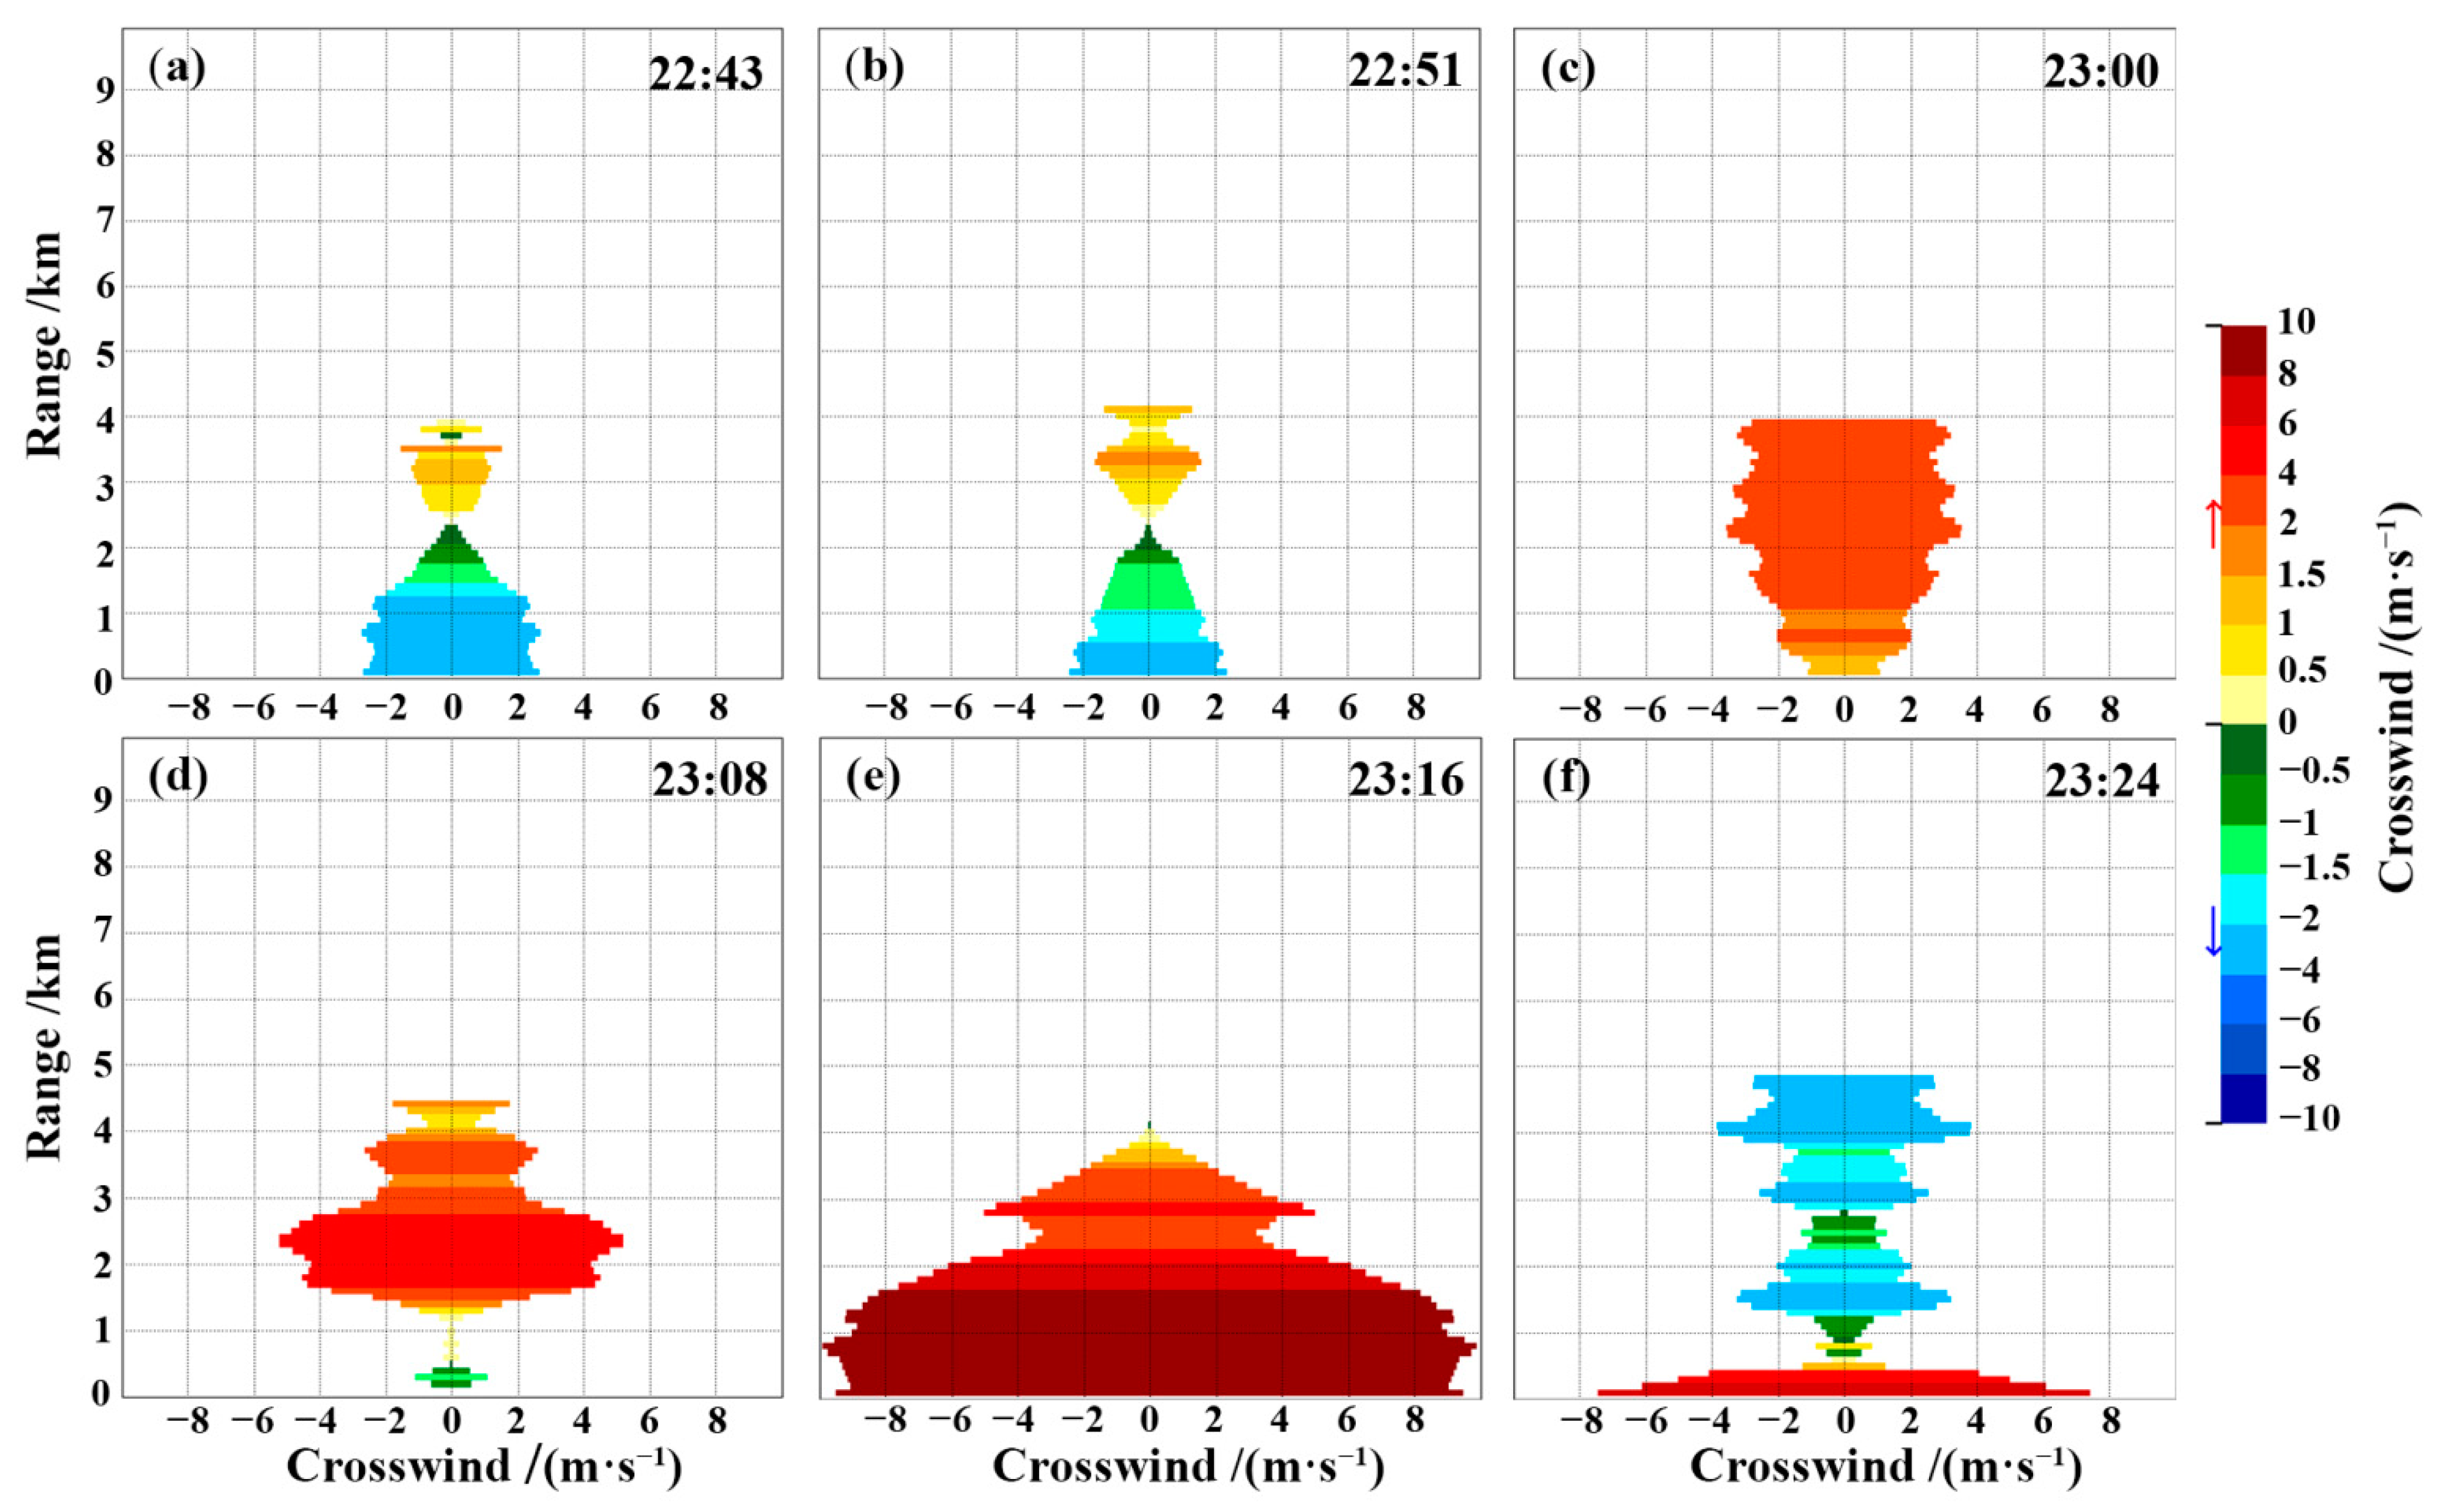
The approach path is the trajectory of an aircraft relative to the ground during landing, representing the descent path of the aircraft. Typically, aircraft descend along the approach path centerline, which is inclined at approximately three degrees to the horizontal plane. During the landing process and along the approach path, crosswinds, especially headwinds, can significantly impact the aircraft. Different airlines have varying standards for headwinds and crosswinds, but generally, when headwinds reach 5 m·s−1 and crosswinds reach 10 m·s−1, the aircraft’s heading stability and controllability degrade, increasing the likelihood of a go-around or aborted landing. Therefore, monitoring wind field changes along the approach path is crucial for ensuring the safe landing of aircraft. In this study, laser radar in the approach path mode was used to scan the approach path at a 3-degree elevation angle to observe changes in crosswinds and headwinds.
Figure 7 and Figure 8 display the distribution of crosswinds and headwinds along the approach path, respectively. Between 22:43 and 22:51 (GMT+8), the environmental winds over the runway at the Yinchuan Airport were relatively consistent and predominantly from the west (Figure 7a,b), with an upward extension to approximately 4000 m. Above 2500 m, there were headwinds, while below 2500 m, there were tailwinds (Figure 8a,b). Additionally, crosswinds gradually intensified at altitudes above 1 km between 22:43 and 22:51 (GMT+8) (Figure 7a,b). At 23:00 (GMT+8), easterly crosswinds began to appear at various altitudes (3500–4000 m, 2200–2800 m, and 300–1500 m) (Figure 7c), with the maximum easterly crosswind occurring at 2500 m. Below 4000 m, the winds shifted to predominantly headwinds (Figure 8c), and a notable reversal from headwinds to tailwinds occurred below 2000 m, with increasing wind shear from low to high altitudes. By 23:06 (GMT+8), easterly crosswinds persisted below 2500 m (Figure 7d). At this point, the lower-level divergent wind field associated with the microburst had reached the Yinchuan Airport, with crosswind values reaching approximately 10 m·s−1 and extending down to 2000 m, nearly coinciding with the maximum headwind region (5 m·s−1) (Figure 8d). At 23:16 (GMT+8), easterly crosswinds prevailed throughout the altitude range (Figure 7e), with crosswind values exceeding 10 m·s−1 above 1300 m and near the surface. Simultaneously, the maximum headwind area continued to descend and increase in magnitude, reaching its maximum near 10 m·s−1 (Figure 8e). By 23:24 (GMT+8), easterly winds were prevalent below 3800 m (Figure 7f), headwinds weakened below 400 m, and winds above 400 m shifted to headwinds (Figure 8f). At 400 m, the microburst process had essentially concluded.
In summary, it is evident that this microburst originated to the west of the Yinchuan Airport, and then moved toward the airport and passed over its airspace. This microburst exhibited a distinct symmetric structure, with the most intense descending airflow not reaching the ground. During its movement, the intensity of the microburst weakened.

5. Conclusions

Consequently, as a result of the above analyses, we have come to the following conclusions.
  • This dry microburst event occurred within a stable atmospheric background, with a relatively strong intensity that weakened as it moved toward the Yinchuan Airport. It passed over the airport with reduced intensity. During this event, the CAPE value was 0 J·kg−1, indicating atmospheric stability. However, the DCAPE value was 880 J·kg−1, signifying a substantial potential for descending airflow. This highlights the important role of DCAPE in forecasting dry microbursts.
  • In most microburst events, thermodynamic forcing plays a decisive role. In this case, the dry microburst was triggered by the phenomenon of the foehn (burning wind) caused by the foehn effect as air flows crossed the Helan Mountains. This effect heated the surface near the airport, providing the necessary thermodynamic forcing for the microburst. The Yinchuan Airport is located on the leeward side of the Helan Mountains, where the foehn is common and can lead to thermal convection, strong surface winds, and wind shear, which can impact aviation safety. Further quantitative research on the impact of the foehn is needed in the future.
  • The Doppler Wind Lidar effectively observed the wind field structure of this microburst event. Combining data from its DBS, PPI, RHI, and GP modes allowed for a clear representation of the spatial and temporal evolution of the microburst. The minimum vertical velocity reached −5.76 m·s−1, with the descending wind not reaching the ground, staying about 50 m above the surface. The wind field displayed a distinct symmetric structure, and, as the microburst’s core moved over the Yinchuan Airport, it generated low-level wind shear over the runway and airspace, posing a hazard to flight safety.
  • This dry microburst event occurred in a relatively stable atmospheric environment, making it exceptionally rare and difficult to detect on conventional weather radar. Additionally, it occurred at night, making it more likely to go unnoticed. The use of the Doppler Wind Lidar provided clear observations of the event, emphasizing the Lidar’s effectiveness in monitoring such weather phenomena under weak weather conditions.
In history, there has been several aviation accidents related to microbursts, such as the 1975 Eastern Airlines, 1982 Pan Am Airlines accidents, and the 2000 Wuhan Airlines accident [80,81,82]. In recent years, thanks to advancements in monitoring technology and forecasting capabilities, aviation accidents caused by weather-related factors have seen a significant reduction [37]. However, incidents involving aircraft unable to perform normal takeoffs and landings due to wind shear remain alarmingly common [83,84,85,86,87,88], and one significant cause of wind shear is a microburst. Dry microbursts, in particular, are challenging to detect and pose greater dangers. According to the latest research by Pilguj et al. (2022) [89], over the past 40 years, factors like DCAPE, CIN, and relative humidity at 0–3 km have become more favorable for microburst development [89,90]. And it can be predicted that there will be an increasing trend of complex weather including dry microbursts, and an increase in the threat to aviation safety. Therefore, enhancing research and monitoring of dry microbursts is highly meaningful.

Author Contributions

Conceptualization, L.F., J.P. and J.Z. (Jiafeng Zheng); methodology, L.F. and J.P.; software, L.F. and H.B.; validation, L.F., J.Z. (Jiafeng Zheng) and J.P.; formal analysis, L.F.; investigation, L.F. and J.Z. (Jiafeng Zheng); resources, L.F.; data curation, L.F.; writing—original draft preparation, L.F.; writing—review and editing, L.F. and J.Z. (Jiafeng Zheng); visualization, H.B. and L.F.; supervision, J.Z. (Jiafeng Zheng); project administration, L.F.; funding acquisition, J.Z. (Jun Zhang). All authors have read and agreed to the published version of the manuscript.

Funding

National Natural Science Foundation of China (Grant No. U22A20577) and Young Scientist Fund Project (Grant No. 42305163).

Institutional Review Board Statement

Not applicable.

Informed Consent Statement

Not applicable.

Data Availability Statement

Not applicable.

Acknowledgments

The authors would like to thank the reviewers for their insightful feedback and constructive suggestions, which have greatly enhanced the clarity and impact of this work. And the authors would like to express our sincere gratitude to the editor for their invaluable contributions in refining and improving this manuscript. Their expertise and dedication have played a crucial role in shaping the quality of this research paper.

Conflicts of Interest

The authors declare no conflict of interest.

References

  1. Fujita, T.T. Spearhead Echo and Downburst near the Approach End of a John F. Kennedy Airport Runway, New York City; No. SMRP-RP-137; NASA: Washingotn, DC, USA, 1976.
  2. Fujita, T.T.; Byers, H.R. Spearhead echo and downburst in the crash of an airliner. Mon. Weather Rev. 1977, 105, 129–146. [Google Scholar] [CrossRef]
  3. Fujita, T.T. Downbursts and microbursts—An aviation hazard. In Proceedings of the Conference on Radar Meteorology, Miami Beach, FL, USA, 15–18 April 1980. [Google Scholar]
  4. Fujita, T. Microbursts as an aviation wind shear hazard. In Proceedings of the 19th Aerospace Sciences Meeting, St. Louis, MO, USA, 12–15 January 1981; p. 386. [Google Scholar]
  5. Wolfson, M.M.; Delanoy, R.L.; Forman, B.E.; Hallowell, R.G.; Pawlak, M.L.; Smith, P.D. Automated microburst wind-shear prediction. Linc. Lab. J. 1994, 7, 399–426. [Google Scholar]
  6. Fujita, T.T. Tornadoes and downbursts in the context of generalized planetary scales. J. Atmos. Sci. 1981, 38, 1511–1534. [Google Scholar] [CrossRef]
  7. Wakimoto, R.M. Forecasting dry microburst activity over the high plains. Mon. Weather Rev. 1985, 113, 1131–1143. [Google Scholar] [CrossRef]
  8. McCarthy, J.; Norviel, V. Numerical and Flight Simulator Test of the Flight Deterioration Concept; Interim Report; NASA: Washington, DC, USA, 1982.
  9. Fujita, T. The Downburst, Microburst and Macroburst; SMRPResearch Paper 210; University of Chicago: Chicago, IL, USA, 1985; 122p. [Google Scholar]
  10. Proctor, F.H. Numerical simulations of an isolated microburst. Part I: Dynamics and structure. J. Atmos. Sci. 1988, 45, 3137–3160. [Google Scholar] [CrossRef]
  11. Brown, J.M.; Knupp, K.R.; Caracena, F. Destructive winds from shallow, high-based cumulonimbi. In Proceedings of the 12th Conference on Severe Local Storms, San Antonio, TX, USA, 11–15 January 1982; Volume 272275. [Google Scholar]
  12. Adachi, T.; Kusunoki, K.; Yoshida, S.; Arai, K.I.; Ushio, T. High-speed volumetric observation of a wet microburst using X-band phased array weather radar in Japan. Mon. Weather Rev. 2016, 144, 3749–3765. [Google Scholar] [CrossRef]
  13. Atlas, D.; Ulbrich, C.W.; Williams, C.R. Physical origin of a wet microburst: Observations and theory. J. Atmos. Sci. 2004, 61, 1186–1195. [Google Scholar] [CrossRef]
  14. De Meutter, P.; Gerard, L.; Smet, G.; Hamid, K.; Hamdi, R.; Degrauwe, D.; Termonia, P. Predicting small-scale, short-lived downbursts: Case study with the NWP limited-area ALARO model for the Pukkelpop thunderstorm. Mon. Weather Rev. 2015, 143, 742–756. [Google Scholar] [CrossRef]
  15. Ohno, H.; Suzuki, O.; Nirasawa, H.; Yoshizaki, M.; Hasegawa, N.; Tanaka, Y.; Muramatsu, Y.; Ogura, Y. Okayama Downbursts on 27 June 1991 Downburst Identifications and Environmental Conditions. J. Meteorol. Soc. Jpn. Ser. II 1994, 72, 197–222. [Google Scholar] [CrossRef]
  16. Straka, J.M.; Anderson, J.R. Numerical simulations of microburst-producing storms: Some results from storms observed during COHMEX. J. Atmos. Sci. 1993, 50, 1329–1348. [Google Scholar] [CrossRef]
  17. Wakimoto, R.M. Convectively Driven High Wind Events. In Severe Convective Storms; American Meteorological Society: Boston, MA, USA, 2001; pp. 255–298. [Google Scholar]
  18. Srivastava, R.C. A simple model of evaporatively driven dowadraft: Application to microburst downdraft. J. Atmos. Sci. 1985, 42, 1004–1023. [Google Scholar] [CrossRef]
  19. Ozdemir, E.T.; Deniz, A.; Sezen, I.; Aslan, Z.; Yavuz, V. Investigation of thunderstorms over Ataturk International Airport (LTBA), Istanbul. Mausam 2017, 68, 175–180. [Google Scholar] [CrossRef]
  20. Tuncay, E.; Ali, D. Nowcasting of a thunderstorm: The case study of 2 February, 2015 at Istanbul Ataturk International Airport. Mausam 2020, 71, 21–32. [Google Scholar]
  21. Yavuz, V.; Deniz, A.; Özdemir, E.T.; Karan, H.; Temiz, C. Long-term thunderstorm analysis at airports in the Marmara Region: Types and favourable atmospheric conditions. Int. J. Glob. Warm. 2022, 28, 81–95. [Google Scholar] [CrossRef]
  22. Gensini, V.A.; Ashley, W.S. Climatology of potentially severe convective environments from the North American Regional Reanalysis. E-J. Sev. Storms Meteorol. 2011, 6, 1–40. [Google Scholar] [CrossRef]
  23. Smith, B.T.; Thompson, R.L.; Grams, J.S.; Broyles, C.; Brooks, H.E. Convective modes for significant severe thunderstorms in the contiguous United States. Part I: Storm classification and climatology. Weather Forecast. 2012, 27, 1114–1135. [Google Scholar] [CrossRef]
  24. Gensini, V.A.; Haberlie, A.M.; Marsh, P.T. Practically perfect hindcasts of severe convective storms. Bull. Am. Meteorol. Soc. 2020, 101, E1259–E1278. [Google Scholar]
  25. Li, F.; Chavas, D.R.; Reed, K.A.; Dawson, D.T., II. Climatology of severe local storm environments and synoptic-scale features over North America in ERA5 reanalysis and CAM6 simulation. J. Clim. 2020, 33, 8339–8365. [Google Scholar]
  26. Taszarek, M.; Allen, J.T.; Groenemeijer, P.; Edwards, R.; Brooks, H.E.; Chmielewski, V.; Enno, S.E. Severe convective storms across Europe and the United States. Part I: Climatology of lightning, large hail, severe wind, and tornadoes. J. Clim. 2020, 33, 10239–10261. [Google Scholar] [CrossRef]
  27. Taszarek, M.; Allen, J.T.; Púčik, T.; Hoogewind, K.A.; Brooks, H.E. Severe convective storms across Europe and the United States. Part II: ERA5 environments associated with lightning, large hail, severe wind, and tornadoes. J. Clim. 2020, 33, 10263–10286. [Google Scholar]
  28. Romanic, D.; Taszarek, M.; Brooks, H. Convective environments leading to microburst, macroburst and downburst events across the United States. Weather Clim. Extrem. 2022, 37, 100474. [Google Scholar] [CrossRef]
  29. Wang, X.M.; Yu, X.D.; Fei, H.Y.; Liu, X.L.; Zhu, H. A Review of Downburst Genesis Mechanism and Warning. Meteorol. Mon. 2023, 49, 129–145. [Google Scholar]
  30. Fei, H.Y.; Wang, X.M.; Zhou, X.G.; Yu, X.D. Climatic characteristics and environmental parameters of severe thunderstorm gales in China. Meteorol. Mon. 2016, 42, 1513–1521. [Google Scholar]
  31. Atkins, N.T.; Wakimoto, R.M. Wet microburst activity over the southeastern United States: Implications for forecasting. Weather Forecast. 1991, 6, 470–482. [Google Scholar] [CrossRef]
  32. James, R.P.; Markowski, P.M. A numerical investigation of the effects of dry air aloft on deep convection. Mon. Weather Rev. 2010, 138, 140–161. [Google Scholar] [CrossRef]
  33. Schenkman, A.D.; Xue, M. Bow-echo mesovortices: A review. Atmos. Res. 2016, 170, 1–13. [Google Scholar] [CrossRef]
  34. Gultepe, I.; Sharman, R.; Williams, P.D.; Zhou, B.; Ellrod, G.; Minnis, P.; Trier, S.; Griffin, S.; Yum, S.S.; Gharabaghi, B.; et al. A review of high impact weather for aviation meteorology. Pure Appl. Geophys. 2019, 176, 1869–1921. [Google Scholar]
  35. Fujita, T.T.; Wakimoto, R.M. Five scales of airflow associated with a series of downbursts on 16 July 1980. Mon. Weather Rev. 1981, 109, 1438–1456. [Google Scholar] [CrossRef]
  36. Wilson, J.W.; Roberts, R.D.; Kessinger, C.; McCarthy, J. Microburst wind structure and evaluation of Doppler radar for airport wind shear detection. J. Appl. Meteorol. Climatol. 1984, 23, 898–915. [Google Scholar] [CrossRef]
  37. McCarthy, J.; Serafin, R.; Wilson, J.; Evans, J.; Kessinger, C.; Mahoney, W.P., III. Addressing the microburst threat to aviation: Research-to-operations success story. Bull. Am. Meteorol. Soc. 2022, 103, E2845–E2861. [Google Scholar] [CrossRef]
  38. Pourtakdoust, S.H.; Kiani, M.; Hassanpour, A. Optimal trajectory planning for flight through microburst wind shears. Aerosp. Sci. Technol. 2011, 15, 567–576. [Google Scholar] [CrossRef]
  39. Bolgiani, P.; Santos-Muñoz, D.; Fernández-González, S.; Sastre, M.; Valero, F.; Martín, M.L. Microburst detection with the WRF model: Effective resolution and forecasting indices. J. Geophys. Res. Atmos. 2020, 125, e2020JD032883. [Google Scholar] [CrossRef]
  40. Wilson, J.W.; Moore, J.A.; Foote, G.B.; Martner, B.; Rodi, A.R.; Uttal, T.; Wilczak, J.M. Convection initiation and downburst experiment (CINDE). Bull. Am. Meteorol. Soc. 1988, 69, 1328–1347. [Google Scholar] [CrossRef]
  41. Merritt, M.W. Automated detection of microburst windshear for Terminal Doppler Weather Radar. In Proceedings of the Digital Image Processing and Visual Communications Technologies in Meteorology, San Diego, CA, USA, 25 January 1987; SPIE: Cergy, France, 1987; Volume 846, pp. 61–69. [Google Scholar]
  42. Yu, X.D.; Zhang, A.M.; Zheng, Y.Y.; Fang, C.; Zhu, H.F.; Wu, L.L. Doppler Radar Analysis on a Series of Downburst Events. Q. J. Appl. Meteorol. 2006, 17, 385–393. [Google Scholar]
  43. Wu, F.F.; Wang, H.; Wei, Y.Y.; Wang, Q. Analysis of a Strong Gust Front and Downburst with Doppler Weather Radar Data. Meteorol. Mon. 2009, 35, 55–64. [Google Scholar]
  44. Luo, H.; Zhang, J.; Zhu, K.Y.; Zhen, J.F.; Fan, Y.; Gao, X.Q. Study of the radar quantitative index of forewarning downburst. Acta Meteorol. Sin. 2015, 5, 853–867. [Google Scholar]
  45. Guo, Z.L.; Xie, W.F.; Zheng, J.J. Analysis on a low-level wind shear event under a microburst in Guangzhou Baiyun Airport. Bimon. Xinjiang Meteorol. 2019, 13, 71–78. [Google Scholar]
  46. Pearson, C.; Yu, T.Y.; Bodine, D.; Torres, S.; Reinhart, A. A Framework for Comparisons of Downburst Precursor Observations using an All-Digital Phased Array Weather Radar. J. Atmos. Ocean. Technol. 2023, 40, 919–938. [Google Scholar]
  47. Pryor, K.L. Downburst prediction applications of meteorological geostationary satellites. In Proceedings of the Remote Sensing of the Atmosphere, Clouds, and Precipitation V, Beijing, China, 8 November 2014; SPIE: Cergy, France, 2014; Volume 9259, pp. 60–73. [Google Scholar]
  48. Pryor, K.L. Progress and developments of downburst prediction applications of GOES. Weather Forecast. 2015, 30, 1182–1200. [Google Scholar]
  49. Pryor, K.L. Advances in downburst monitoring and prediction with GOES-16. In Proceedings of the 17th Conference on Mesoscale Processes, San Diego, CA, USA, 24–27 July 2017. [Google Scholar]
  50. Pryor, K.L. Downburst monitoring and prediction studies. In Field Measurements for Passive Environmental Remote Sensing; Elsevier: Amsterdam, The Netherlands, 2023; pp. 411–429. [Google Scholar]
  51. Pryor, K.; Demoz, B. A retrospective satellite analysis of the June 2012 North American Derecho. Remote Sens. 2022, 14, 3479. [Google Scholar] [CrossRef]
  52. Huang, X.; Zheng, J.; Che, Y.; Wang, G.; Ren, T.; Hua, Z.; Tian, W.; Su, Z.; Su, L. Evolution and Structure of a Dry Microburst Line Observed by Multiple Remote Sensors in a Plateau Airport. Remote Sens. 2022, 14, 3841. [Google Scholar] [CrossRef]
  53. Peng, Z.; Wang, F.; Wang, X.; Hao, Y. Review on the Development of Low-Level Windshear Detection Technology. In Proceedings of the 2022 4th International Conference on Advances in Computer Technology, Information Science and Communications (CTISC), Suzhou, China, 22–24 April 2022; IEEE: Piscataway, NJ, USA, 2022; pp. 1–5. [Google Scholar]
  54. Zhao, W.K.; Zhao, S.J.; Shan, Y.L.; Sun, X.J. Numerical Simulation for Wind Shear Detection with a Glide Path Scanning Algorithm Based on Wind LiDAR. IEEE Sens. J. 2021, 21, 20248–20257. [Google Scholar] [CrossRef]
  55. Frehlich, R. Effects of wind turbulence on coherent Doppler lidar performance. J. Atmos. Ocean. Technol. 1997, 14, 54–75. [Google Scholar] [CrossRef]
  56. Krishnamurthy, R.; Choukulkar, A.; Calhoun, R.; Fine, J.; Oliver, A.; Barr, K.S. Coherent Doppler lidar for wind farm characterization. Wind Energy 2013, 16, 189–206. [Google Scholar] [CrossRef]
  57. Thobois, L.; Cariou, J.P.; Gultepe, I. Review of lidar-based applications for aviation weather. Pure Appl. Geophys. 2019, 176, 1959–1976. [Google Scholar] [CrossRef]
  58. O’Connor, E.; Hirsikko, A.; Halios, C.; Gryning, S.E.; Leinweber, R.; Manninen, A.; Marke, T.; Petersen, N.; Preissler, J.; Päschke, E.; et al. An emerging European Doppler lidar network for meteorological applications. In Proceedings of the EMS Annual Meeting: European Conference for Applied Meteorology and Climatology, Dublin, Ireland, 4–8 September 2017; p. 745. [Google Scholar]
  59. Vorobyeva, O.; Nechaj, P.; Gaál, L. Lidar-based detection of dangerous meteorological phenomena at the Bratislava Airport. Transp. Res. Procedia 2019, 43, 199–208. [Google Scholar] [CrossRef]
  60. Fuertes, F.C.; Iungo, G.V. Analysis of a Strong Gust Front and Downburst with Doppler Weather Radar Data & Porté-Agel, F. 3D turbulence measurements using three synchronous wind lidars: Validation against sonic anemometry. J. Atmos. Ocean. Technol. 2014, 31, 1549–1556. [Google Scholar]
  61. Nijhuis, A.O.; Thobois, L.P.; Barbaresco, F.; De Haan, S.; Dolfi-Bouteyre, A.; Kovalev, D.; Krasnov, O.A.; Vanhoenacker-Janvier, D.; Wilson, R.; Yarovoy, A.G. Wind hazard and turbulence monitoring at airports with Lidar, Radar, and Mode-S downlinks: The UFO Project. Bull. Am. Meteorol. Soc. 2018, 99, 2275–2293. [Google Scholar] [CrossRef]
  62. Thobois, L.; Cariou, J.P.; Cappellazzo, V.; Musson, C.; Treve, V. Comparison and validation of wake vortex characteristics collected at different airports by different scanning lidar sensors. EPJ Web Conf. 2018, 176, 06002. [Google Scholar] [CrossRef]
  63. Hon, K.K.; Chan, P.W.; Chim, K.C.; De Visscher, I.; Thobois, L.; Rooseleer, F.; Troiville, A. Wake vortex measurements at the Hong Kong International Airport. In Proceedings of the AIAA SciTech 2022 Forum, San Diego, CA, USA, 3–7 January 2022; p. 2011. [Google Scholar]
  64. Gao, H.; Li, J.; Chan, P.W.; Hon, K.K.; Wang, X. Parameter-retrieval of dry-air wake vortices with a scanning Doppler Lidar. Opt. Express 2018, 26, 16377–16392. [Google Scholar] [CrossRef]
  65. Winckelmans, G. LES investigation of aircraft wake two-vortex system in low level atmospheric turbulence. In APS Division of Fluid Dynamics Meeting Abstracts; APS: Phoenix, AZ, USA, 2005; Volume 58, p. KG–002. [Google Scholar]
  66. Frech, M.; Holzäpfel, F. Skill of an aircraft wake-vortex transport and decay model using short-term weather prediction and observation. In Proceedings of the 12th Conference on Aviation, Range, and Aerospace Meteorology, Atlanta, GA, USA, 29 January–2 February 2006. [Google Scholar]
  67. Wang, Z.; Menenti, M. Challenges and opportunities in Lidar remote sensing. Front. Remote Sens. 2021, 2, 641723. [Google Scholar]
  68. Chan, P.W.; Shun, C.M.; Wu, K.C. Operational LIDAR-based system for automatic windshear alerting at the Hong Kong International Airport. In Proceedings of the 12th Conference on Aviation, Range, and Aerospace Meteorology, Atlanta, GA, USA, 29 January–2 February 2006; Volume 6. [Google Scholar]
  69. Chan, P.W.; Lee, Y.F. Application of short-range lidar in wind shear alerting. J. Atmos. Ocean. Technol. 2012, 29, 207–220. [Google Scholar] [CrossRef]
  70. Hua, Z.Q.; Li, Q.; Huang, X.; Ma, X.L.; Tian, W.D.; Zhao, Q.N. Analysis of the typical application of laser wind measurement radar in aviation support. Laser Technol. 2020, 44, 600–604. [Google Scholar]
  71. Fu, J.; Li, J.; Wu, Q. Application and prospect of Dopplar lidar in the wind field observation. Acta Aerodyn. Sin. 2021, 39, 172–179. [Google Scholar]
  72. Fan, Q.; Zhu, X.L.; Zhou, D.F.; Zhou, D.F.; Zhou, J.; Luo, X.; Chen, C.L.; Tong, W.H.; Yang, Z.H. Analysis of the wind field characteristics using the wind lidar in a typical plateau airport. Laser Technol. 2020, 44, 525–531. [Google Scholar]
  73. Emanue, K.A. Atmospheric Convection; Oxford University Press: New York, NY, USA, 1994. [Google Scholar]
  74. Weisman, M.L.; Gilmore, M.S.; Wicker, L.J. The impact of convective storms on their local environment: What is an appropriate ambient sounding. In Proceedings of the 19th Conference on Severe Local Storms, Minneapolis, MN, USA, 14–18 September 1998; American Meteorological Society: Boston, MA, USA, 1998; Volume 238, p. 241. [Google Scholar]
  75. Li, Y.D.; Gao, S.T.; Liu, J.W. A calculation of convective energy and the method of severe weather forecasting. J. Appl. Meteorol. Sci. 2004, 15, 10–20. [Google Scholar]
  76. Cohen, A.E.; Coniglio, M.C.; Corfidi, S.F.; Corfidi, S.J. Discrimination of mesoscale convective system environments using sounding observations. Weather Forecast. 2007, 22, 1045–1062. [Google Scholar] [CrossRef]
  77. Feng, L.; Wang, H.X. Research on a Phenomenon of Momentum Downlink at Night at Yinchuan Hedong International Airport. J. Civ. Aviat. 2022, 6, 57–60+105. [Google Scholar]
  78. Wang, Z.M.; Ding, Y.H.; Zhang, Y.X.; Wang, C.M.; Li, J.B.; Gu, Y.L. Feature and Mechanism of the Foehn Weather on East Slope Taihang Mountains I: Statistic Feature. Plateau Meteorol. 2012, 31, 547–554. [Google Scholar]
  79. Wang, Z.M.; Ding, Y.H.; Zhang, Y.X.; Wang, C.M.; Li, J.B.; Gu, Y.L. Feature and Mechanism of the Foehn Weather on East Slope Taihang Mountains II: Case Analysis of the Effects of Lee Wave on Foehn Occurring and Moving. Plateau Meteorol. 2012, 31, 555–561. [Google Scholar]
  80. Fujita, T.T.; Caracena, F. An analysis of three weather-related aircraft accidents. Bull. Am. Meteorol. Soc. 1977, 58, 1164–1181. [Google Scholar] [CrossRef]
  81. Caracena, F. Multi-Scale Analyses of Meteorological Conditions Affecting Pan American Airways Flight 759; NOAA: Washington, DC, USA, 1983. [Google Scholar]
  82. Sun, L.F.; Guo, X.L.; Sun, L.T.; Fu, D.H. A Numerical Study of the Airplane Disaster-Producing Microburst on 22 June 2000 in Wuhan. Chin. J. Atmos. Sci. 2003, 27, 1077–1092. [Google Scholar]
  83. Chan, P.W.; Hon, K.K.; Li, Q.S. Low-level windshear associated with atmospheric boundary layer jets-Case studies. Atmósfera 2021, 34, 461–490. [Google Scholar] [CrossRef]
  84. Cho, J.H.; Baik, H.J. A study on the characteristics of low-level wind shear at Jeju International Airport from go-around flight perspective. J. Korean Soc. Aviat. Aeronaut. 2021, 29, 1–8. [Google Scholar] [CrossRef]
  85. Lin, C.; Zhang, K.; Chen, X.; Liang, S.; Wu, J.; Zhang, W. Overview of low-level wind shear characteristics over Chinese mainland. Atmosphere 2021, 12, 628. [Google Scholar] [CrossRef]
  86. Sardjono, W.; Kusnoputranto, H.; Soesilo, T.E.B.; Utama, D.N.; Sudirwan, J. Study of runway crosswind and tailwind potential for airport sustainability: A study of Soekarno Hatta airport, Cengkareng, Indonesia. IOP Conf. Ser. Earth Environ. Sci. 2021, 729, 012012. [Google Scholar] [CrossRef]
  87. Hon, K.K.; Chan, P.W. Historical analysis (2001–2019) of low-level wind shear at the Hong Kong International Airport. Meteorol. Appl. 2022, 29, e2063. [Google Scholar] [CrossRef]
  88. Khattak, A.; Chan, P.W.; Chen, F.; Peng, H. Time-Series Prediction of Intense Wind Shear Using Machine Learning Algorithms: A Case Study of Hong Kong International Airport. Atmosphere 2023, 14, 268. [Google Scholar] [CrossRef]
  89. Pilguj, N.; Taszarek, M.; Allen, J.T.; Hoogewind, K.A. Are trends in convective parameters over the United States and Europe consistent between reanalyses and observations? J. Clim. 2022, 35, 3605–3626. [Google Scholar]
  90. Pacey, G.P.; Schultz, D.M.; Garcia-Carreras, L. Severe convective windstorms in Europe: Climatology, preconvective environments, and convective mode. Weather Forecast. 2021, 36, 237–252. [Google Scholar] [CrossRef]
Figure 1. The geographical environment of Yinchuan Airport and the location of the Doppler Wind Lidar and device location.
Atmosphere 14 01540 g001
Figure 2. Radiosonde Profile at 20:00 (GMT+8) on April 26th in Yinchuan Region.
Atmosphere 14 01540 g002
Figure 3. Displays the observational data from AWOS for runway 03, including wind speed, temperature, relative humidity, and corrected sea-level pressure variations. (In (a) the solid line represents the time variation in corrected sea-level pressure, while (b) illustrates the time variation in relative humidity. (c) shows the variation in wind speed as a solid line and temperature as a dashed line, all within the time span of 20:00 to 01:00 (GMT+8)).
Atmosphere 14 01540 g003
Figure 4. Vertical Velocity and Horizontal Wind Profile during the 22:52 to 23:41 (GMT+8) Wind Profiling Mode.
Atmosphere 14 01540 g004
Figure 5. Scanned Wind Field and Ambient Wind Map at PPI 6° Elevation Angle (Panels (af) correspond to the PPI wind fields and environmental wind profiles at 22:40, 22:48, 22:56, 23:05, 23:13, and 23:21 (GMT+8), respectively).
Atmosphere 14 01540 g005
Figure 6. Range-Height Imaging (RHI) Mode (Panels (af) correspond to the RHI at 22:43, 22:51, 22:59, 23:08, 23:16, and 23:24 (GMT+8), respectively).
Atmosphere 14 01540 g006
Figure 7. Crosswind in Glide Path Mode. (Panels (af) represent the crosswind distribution along the approach path at 22:43, 22:51, 23:00, 23:08, 23:16, and 23:24 (GMT+8), respectively).
Atmosphere 14 01540 g007
Figure 8. Headwind in Glide Path Mode. (Panels (af), display the headwind distribution along the approach path at the same time intervals).
Atmosphere 14 01540 g008
Table 1. Main technical parameters of FC–III wind lidar.
ParametersValue
Average power/W≤200
Wavelength/nm1550
Scan range(azimuth/pitch)/(°)0–360/−10–190
Detection range/km0.05–10
Range resolution/m100 (adjustable)
Scanning modeDBS/PPI/RHI/GP
Minimum time resolution/s≤2
Elevation resolution/(°)≤0.1
Wind speed range/(m·s−1)−60–+60
Radial velocity accuracy/(m·s−1)≤0.1
Wind angle accuracy/(°)≤3
MeasurementsRadial velocity, horizontal and vertical winds, spectrum width, signal-to-noise ratio, etc.
Disclaimer/Publisher’s Note: The statements, opinions and data contained in all publications are solely those of the individual author(s) and contributor(s) and not of MDPI and/or the editor(s). MDPI and/or the editor(s) disclaim responsibility for any injury to people or property resulting from any ideas, methods, instructions or products referred to in the content.