1. Introduction
Mountainous terrain exerts an obstructive and uplifting effect on airflow, leading to significant changes in the dynamics and thermodynamics of transporting airflow, thereby influencing regional cloud and precipitation weather [
1,
2,
3,
4]. There are also notable differences in cloud water resources and precipitation weather between windward and leeward slopes [
5,
6,
7,
8]. For the water-scarce northwest region of China, the high-value zones of atmospheric water resources and cloud cover are primarily distributed along mountainous areas [
9,
10,
11,
12]. This indicates that the topography of the region has a significant influence on the distribution of cloud water resources and precipitation. Compared with other major mountain ranges in the northwest region, the Liupan Mountains (LMs) are characterized by complex terrain located on the eastern Tibetan Plateau and the northwestern edge of the Loess Plateau. It serves as an important water supply conservation area in the eastern northwest. The study of cloud water resources and precipitation in the region has significant implications for regional rain enhancement, drought resistance, and ecological environmental protection.
For the water-scarce and data-sparse northwest region, various reanalysis datasets undoubtedly provide a favorable platform for studying cloud and precipitation resources. Chen et al. [
9] utilized the International Satellite Cloud Climatology Project (ISCCP) D2 monthly mean cloud data to study the spatiotemporal distribution characteristics of aerial cloud water resources in the northwest region. They pointed out that the average distribution of cloud water resources in the northwest region exhibits a characteristic distribution along the terrain, with high-value zones located in mountainous areas. A significant amount of research has been conducted on the Qilian Mountain (QM) area, located on the northwest side of the LMs, by many scholars based on various data [
9,
12,
13,
14,
15,
16,
17]. They have indicated that the uplifting effect of the QM terrain has a significant impact on the intensity and amount of cumulus cloud precipitation, and the annual precipitation is closely related to stratiform clouds and summertime cumulus clouds. The distribution of atmospheric water vapor and precipitation is closely related to the elevation, slope orientation, and circulation patterns. The general trend of distribution is a decrease from southeast to northwest, and the high-value zones are closely associated with terrain distribution.
Compared to the QMs, the LMs are located in the southeastern part of the northwest region and have a relatively smaller scale. Their annual precipitation is similar to that of the QMs [
11]. Zhang et al. [
11] indicated that the annual precipitation in the LM region is comparable to that of the QMs but still significantly lower compared to the southeastern region of China by using the fifth generation reanalysis (ERA5) from the European Centre for Medium-Range Weather Forecasts (ECMWF) data. Gao et al. [
7] conducted research using 30 years of daily precipitation data from six national meteorological stations in the LM region and found that the eastern side of the region receives more precipitation than the western side. Deng et al. [
8] conducted a study using 30 years of reanalysis data from the European Centre for Medium-Range Weather Forecasts (ECMWF) and observed precipitation data from meteorological stations, stating that the atmospheric precipitable water, water vapor flux, specific humidity, and actual precipitation in the eastern side of the LMs are higher than the western side. The studies above pointed out that the coordination of high- and low-level weather systems in the LMs and the blocking effect of the mountain range are the main reasons for higher precipitation and atmospheric water vapor on the eastern slope compared to the western slope. However, due to limitations in research data, there is currently a lack of studies on the diurnal variations of the cloud water resource and precipitation in the region.
The atmospheric total column water vapor (TCWV), total column cloud water (TCCW), and total precipitation (TP) are closely related to factors such as altitude, slope orientation, and circulation. Therefore, high-quality research data are required. The ERA5 hourly data, which provide long-term and high-resolution information, have provided a favorable platform for studying precipitation resources in special terrains. In this study, using 40 years of ERA5 hourly data, we conducted a detailed analysis of the differences in TCWV, TCCW, and TP between the eastern and western sides of the LMs. We also analyzed the potential impact of terrain on the precipitation differences between the eastern and western sides based on the 24-h diurnal distribution characteristics. Additionally, we provided regression equations for estimating precipitation using TCWV and TCCW. The results of this study have important scientific implications for the development and utilization of precipitation resources in the LM and for activities such as human impact assessment.
2. Materials and Methods
2.1. Study Area Introduction
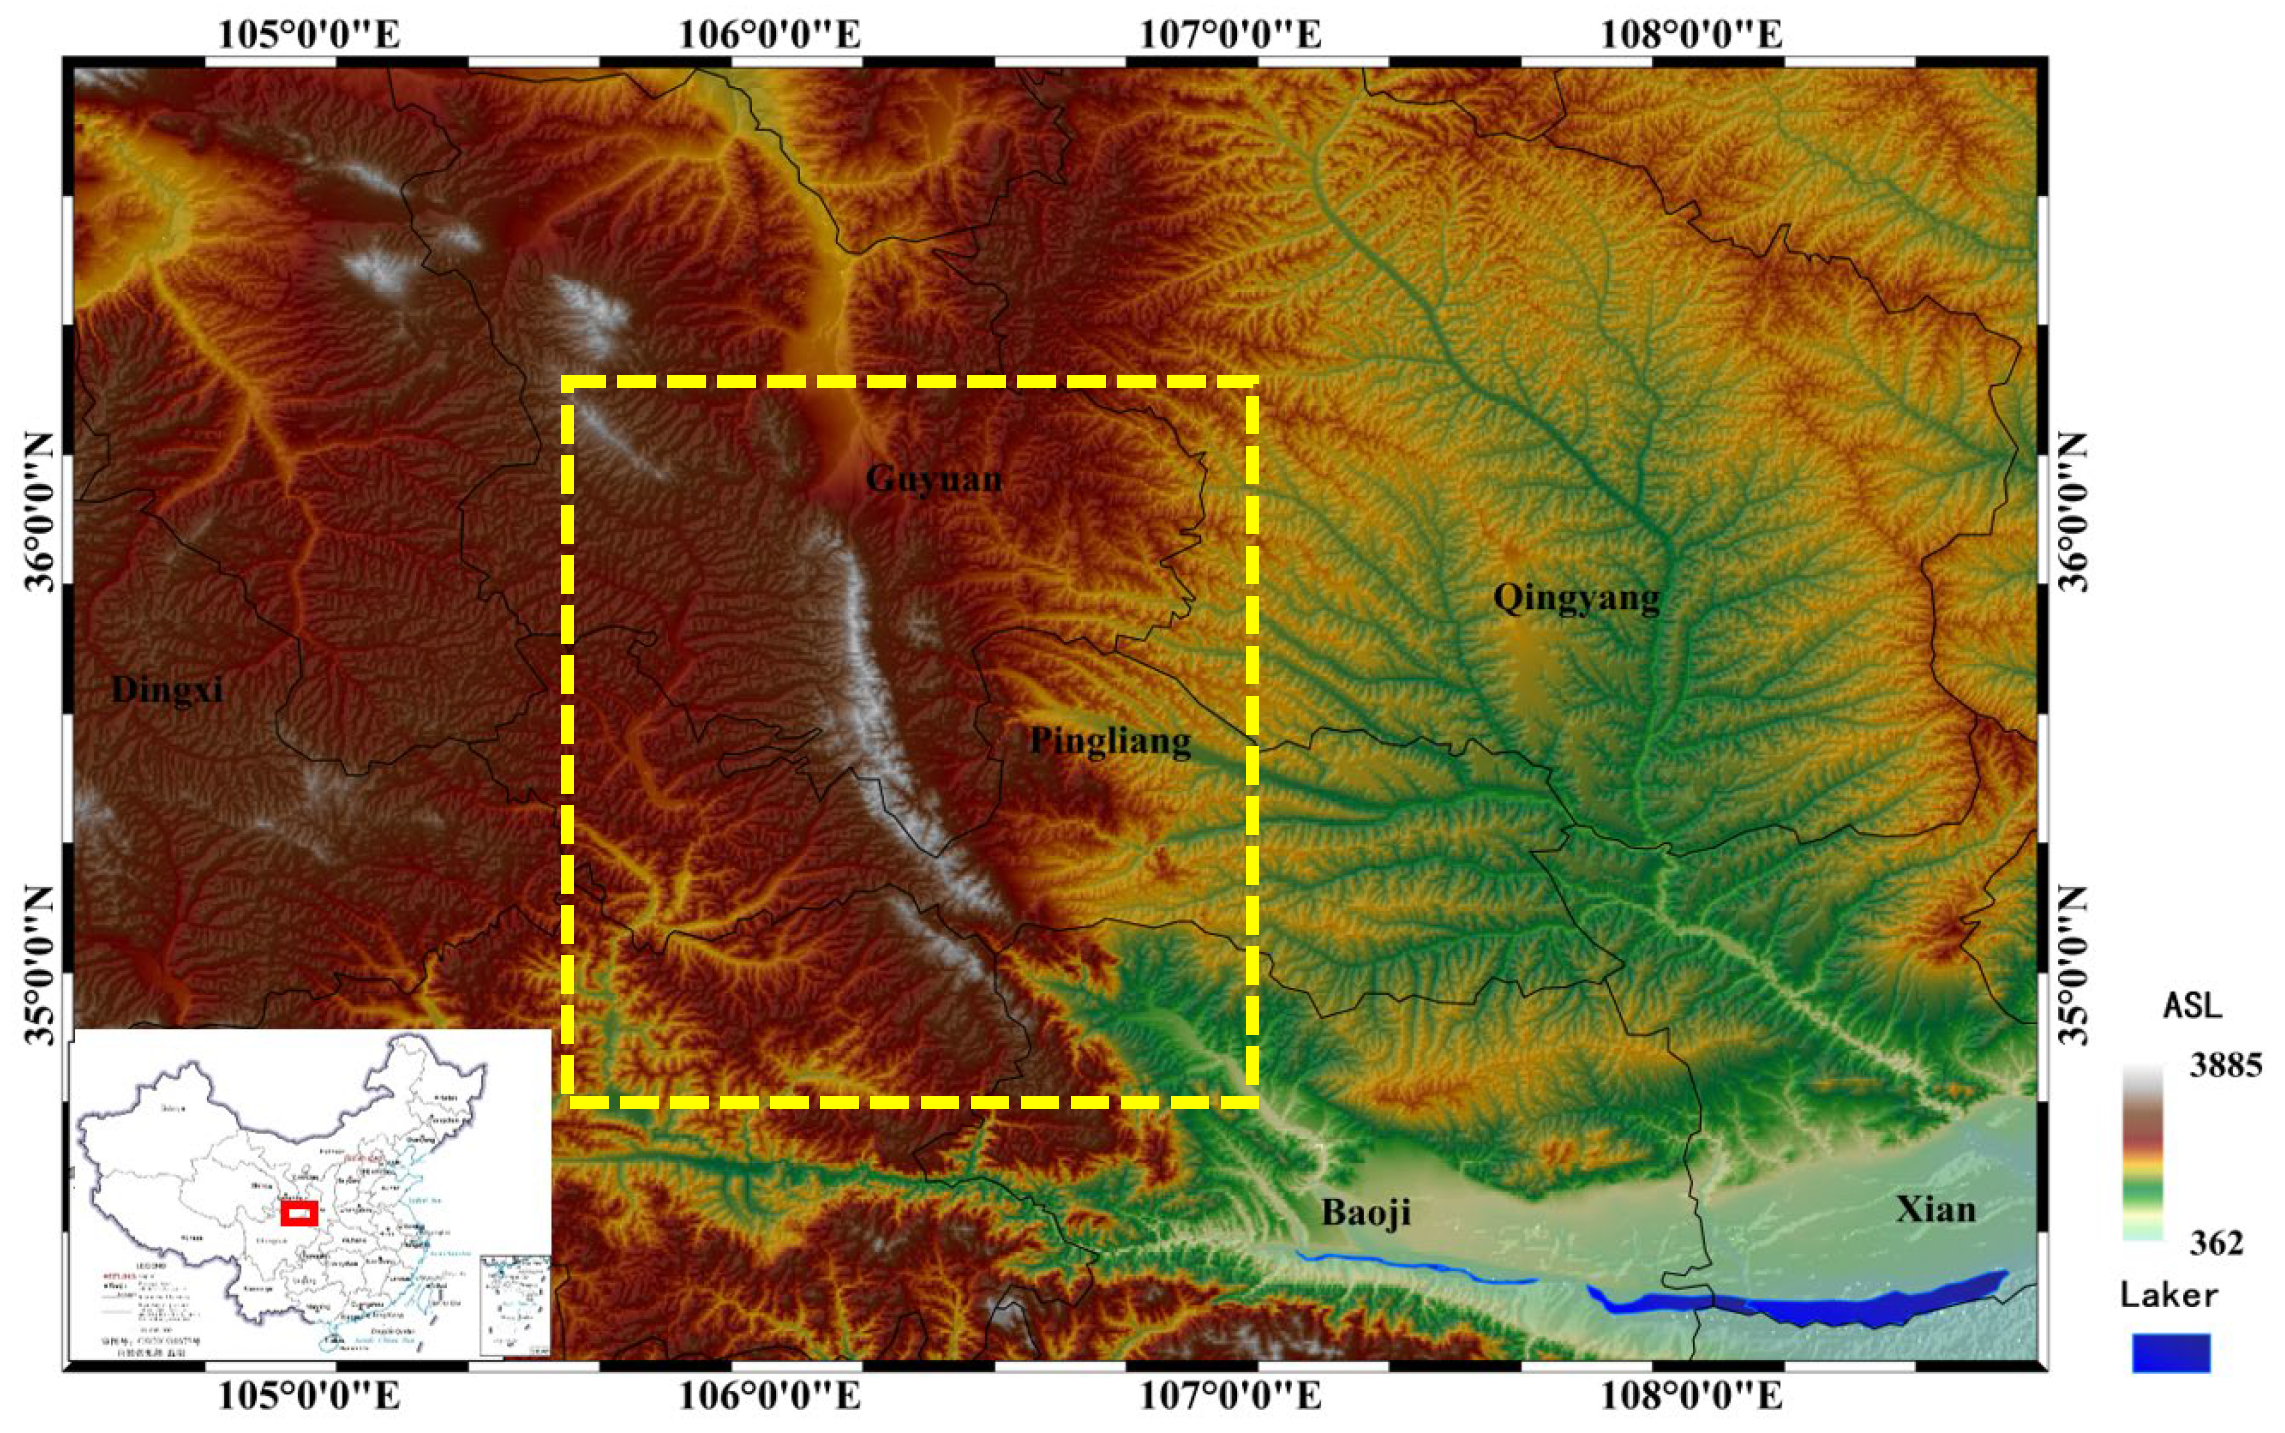
The northwestern region of China is located in the Eurasian continent and is influenced by the Qinghai-Tibet Plateau, QMs, Tianshan Mountains, and other mountain ranges. The airflow from the ocean is blocked, and the dynamic effects of the Qinghai-Tibet Plateau result in scarce precipitation in the northwestern region, making it a dry and semi-arid climate. The LMs are located in the southeastern part of the northwestern region, in the southern part of the Ningxia Autonomous Region. It is situated on the northwestern edge of the southwestern monsoon region and is one of the few continuous mountain ranges in China with an approximate north–south orientation (with an angle of about 30°) (see
Figure 1). The ridge of the mountain has an elevation of over 2500 m, with the highest peak reaching 2942 m and the lowest point at 1599 m. The western slope of the mountain is gentle, while the eastern slope is steep, primarily facing southwest. In this study, the western side of the LMs was defined within the range of 34.5–36° N and 105.25–106° E, while the eastern side was defined within the range of 34.5–36° N and 106.25–107° E.
2.2. Data Description
ERA5 is the fifth generation of global atmospheric reanalysis data released by the European Centre for Medium-Range Weather Forecasts (ECMWF). It provides high spatiotemporal resolution long-term data for research on cloud and precipitation resources. In this study, we utilized ERA5 data from 1 January 1981 to 31 December 2020, spanning a period of 40 years. The data have a regional resolution of 0.25° × 0.25° and a temporal resolution of 1 h.
Many studies [
19,
20,
21] have conducted relevant research by using the data of water vapor, cloud water, and precipitation from ERA5; for example, Zhang et al. [
19] indicate that the spatial distribution of the water vapors derived from the global navigation satellite system (GNSS) and ERA5 data is quite consistent, suggesting a great application prospect of the ERA5 products in China. Wang et al. [
20] indicate ERA5 can reproduce the spatial distribution of annual and seasonal water vapor content in the Tibetan Plateau, being more reliable in reproducing the spatial distribution than MERRA2 and AIRS-only. Tang et al. [
21] indicate that the distributions of the rainwater path over East China from ERA5 are comparable to that of surface precipitation.
The selected variables include total column water (TCW), total column water vapor (TCWV), and total precipitation (TP). TCW is the sum of water vapor, liquid water, cloud ice, rain, and snow in a column extending from the surface of the Earth to the top of the atmosphere. TCWV represents the total amount of water vapor in a column extending from the surface of the Earth to the top of the atmosphere, measured in kg/m2. The total column cloud water (TCCW) used in this study is calculated by subtracting TCWV from TCW and is measured in kg/m2.
2.3. Research Methodology
Daily 24-h data for TCWV, TCCW, and TP were separately averaged to obtain annual, monthly, and daily mean values. The resulting data included 40 years of annual average sequences, 12-month average sequences, and 24-h daily distribution data. A comparative analysis was performed on the physical quantities of TCWV, TCCW, and TP between the eastern and western sides of the LMs.
In addition, this study employed the least absolute deviation method to fit the correlation between TCWV, TCCW, and TP. This method minimizes the sum of absolute errors between the points generated by the function and the corresponding data points, providing an approximate “trend line” function in the Cartesian coordinate system. Suppose there are n observations in the sample dataset (
i = 0, 1, 2, …, n), with
y representing the dependent variable and
X representing the independent variable. The objective of the least absolute deviation is to solve the regression problem of minimizing the value in (1).
where |·| denotes the absolute value, and
represents the function value obtained by minimizing over all possible
β vectors.
The study also utilized the least squares multivariate linear regression method to fit the linear relationship between TP and the other two variables (TCWV and TCCW).
3. Results
3.1. Regional Distribution Characteristics of Cloud Water Content and Recipitation
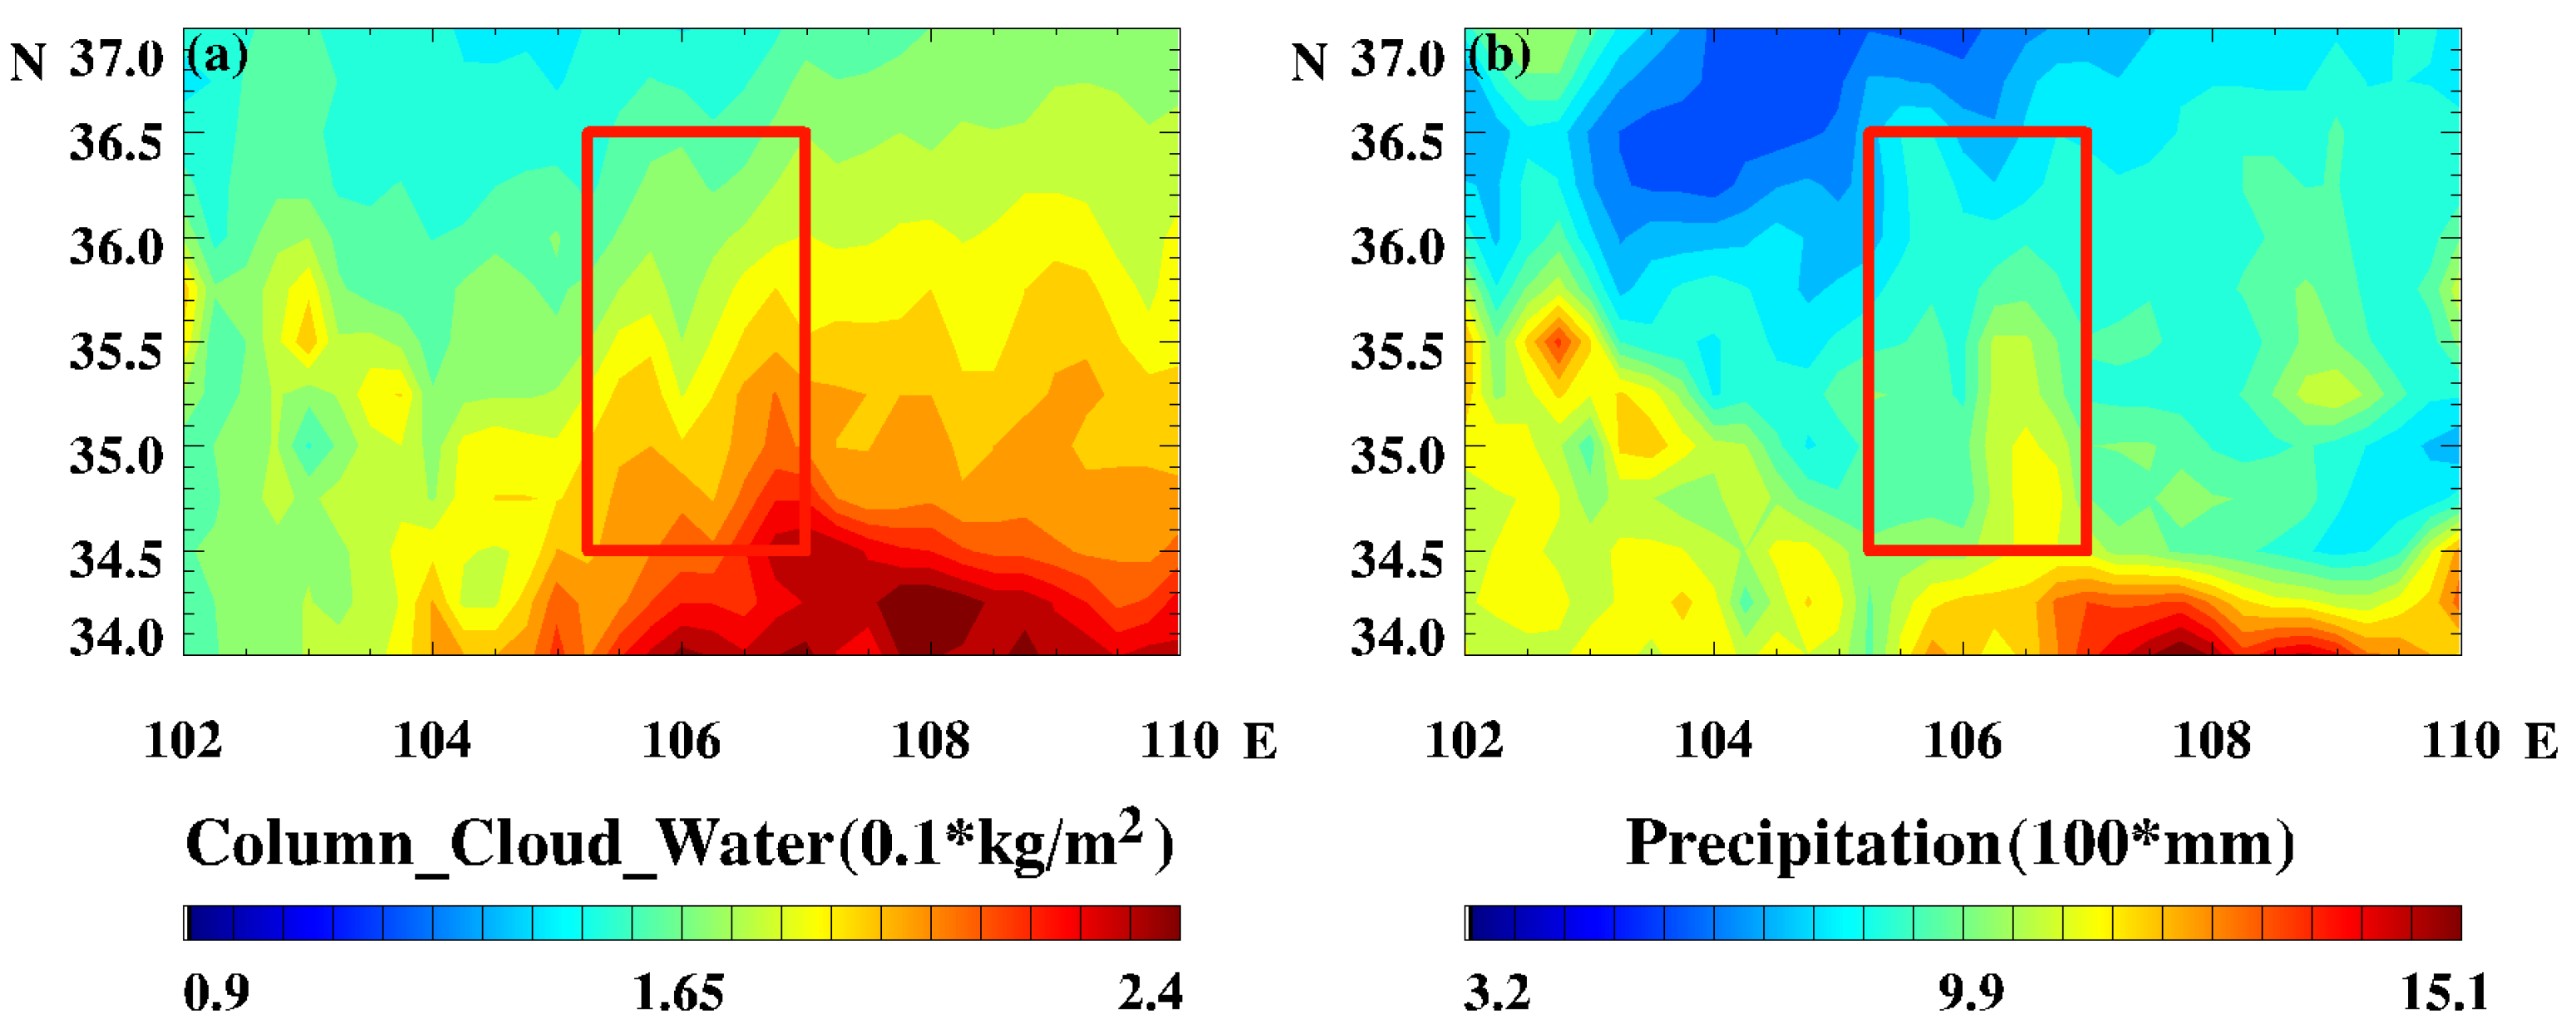
The LMs, located on the edge of the Asian monsoon-influenced region, are characterized as a climatically sensitive and ecologically vulnerable area. As seen in
Figure 2, the TCCW and TP in the neighboring Qinling region to the south are 1.4 times higher than those in the LM region. However, compared to the same latitude regions, the LMs exhibit higher TCCW and precipitation compared to the western side at the same latitude and the eastern side of the QMs. This variation in TCCW and TP follows a trend closely related to the north–south orientation and southwest-facing slopes of the LM range. The high values of TCCW and TP gradually decrease from south to north in a southwestward deviation along the latitude.
Due to the approximate north–south orientation of the LMs, with steeper slopes on the eastern side compared to the western side, there are noticeable differences in TCCW and TP between the eastern and western sides. The 40-year average TCCW on the eastern side is 0.16 kg/m
2, which is approximately 7% higher than that on the western side. The annual TP on the eastern side is 762.3 mm, which is approximately 12% higher than that on the western side. According to the study by Deng et al. [
8], the steep terrain on the eastern side of the LMs contributes to the convergence and uplifting of transported water vapor, coupled with favorable weather systems. The combined effect of these factors leads to the distribution pattern of higher precipitation and atmospheric water vapor conditions in the east and lower in the west in this region.
3.2. Temporal Distribution Characteristics of Precipitation Resources
3.2.1. Water Vapor Content and Cloud Water Content
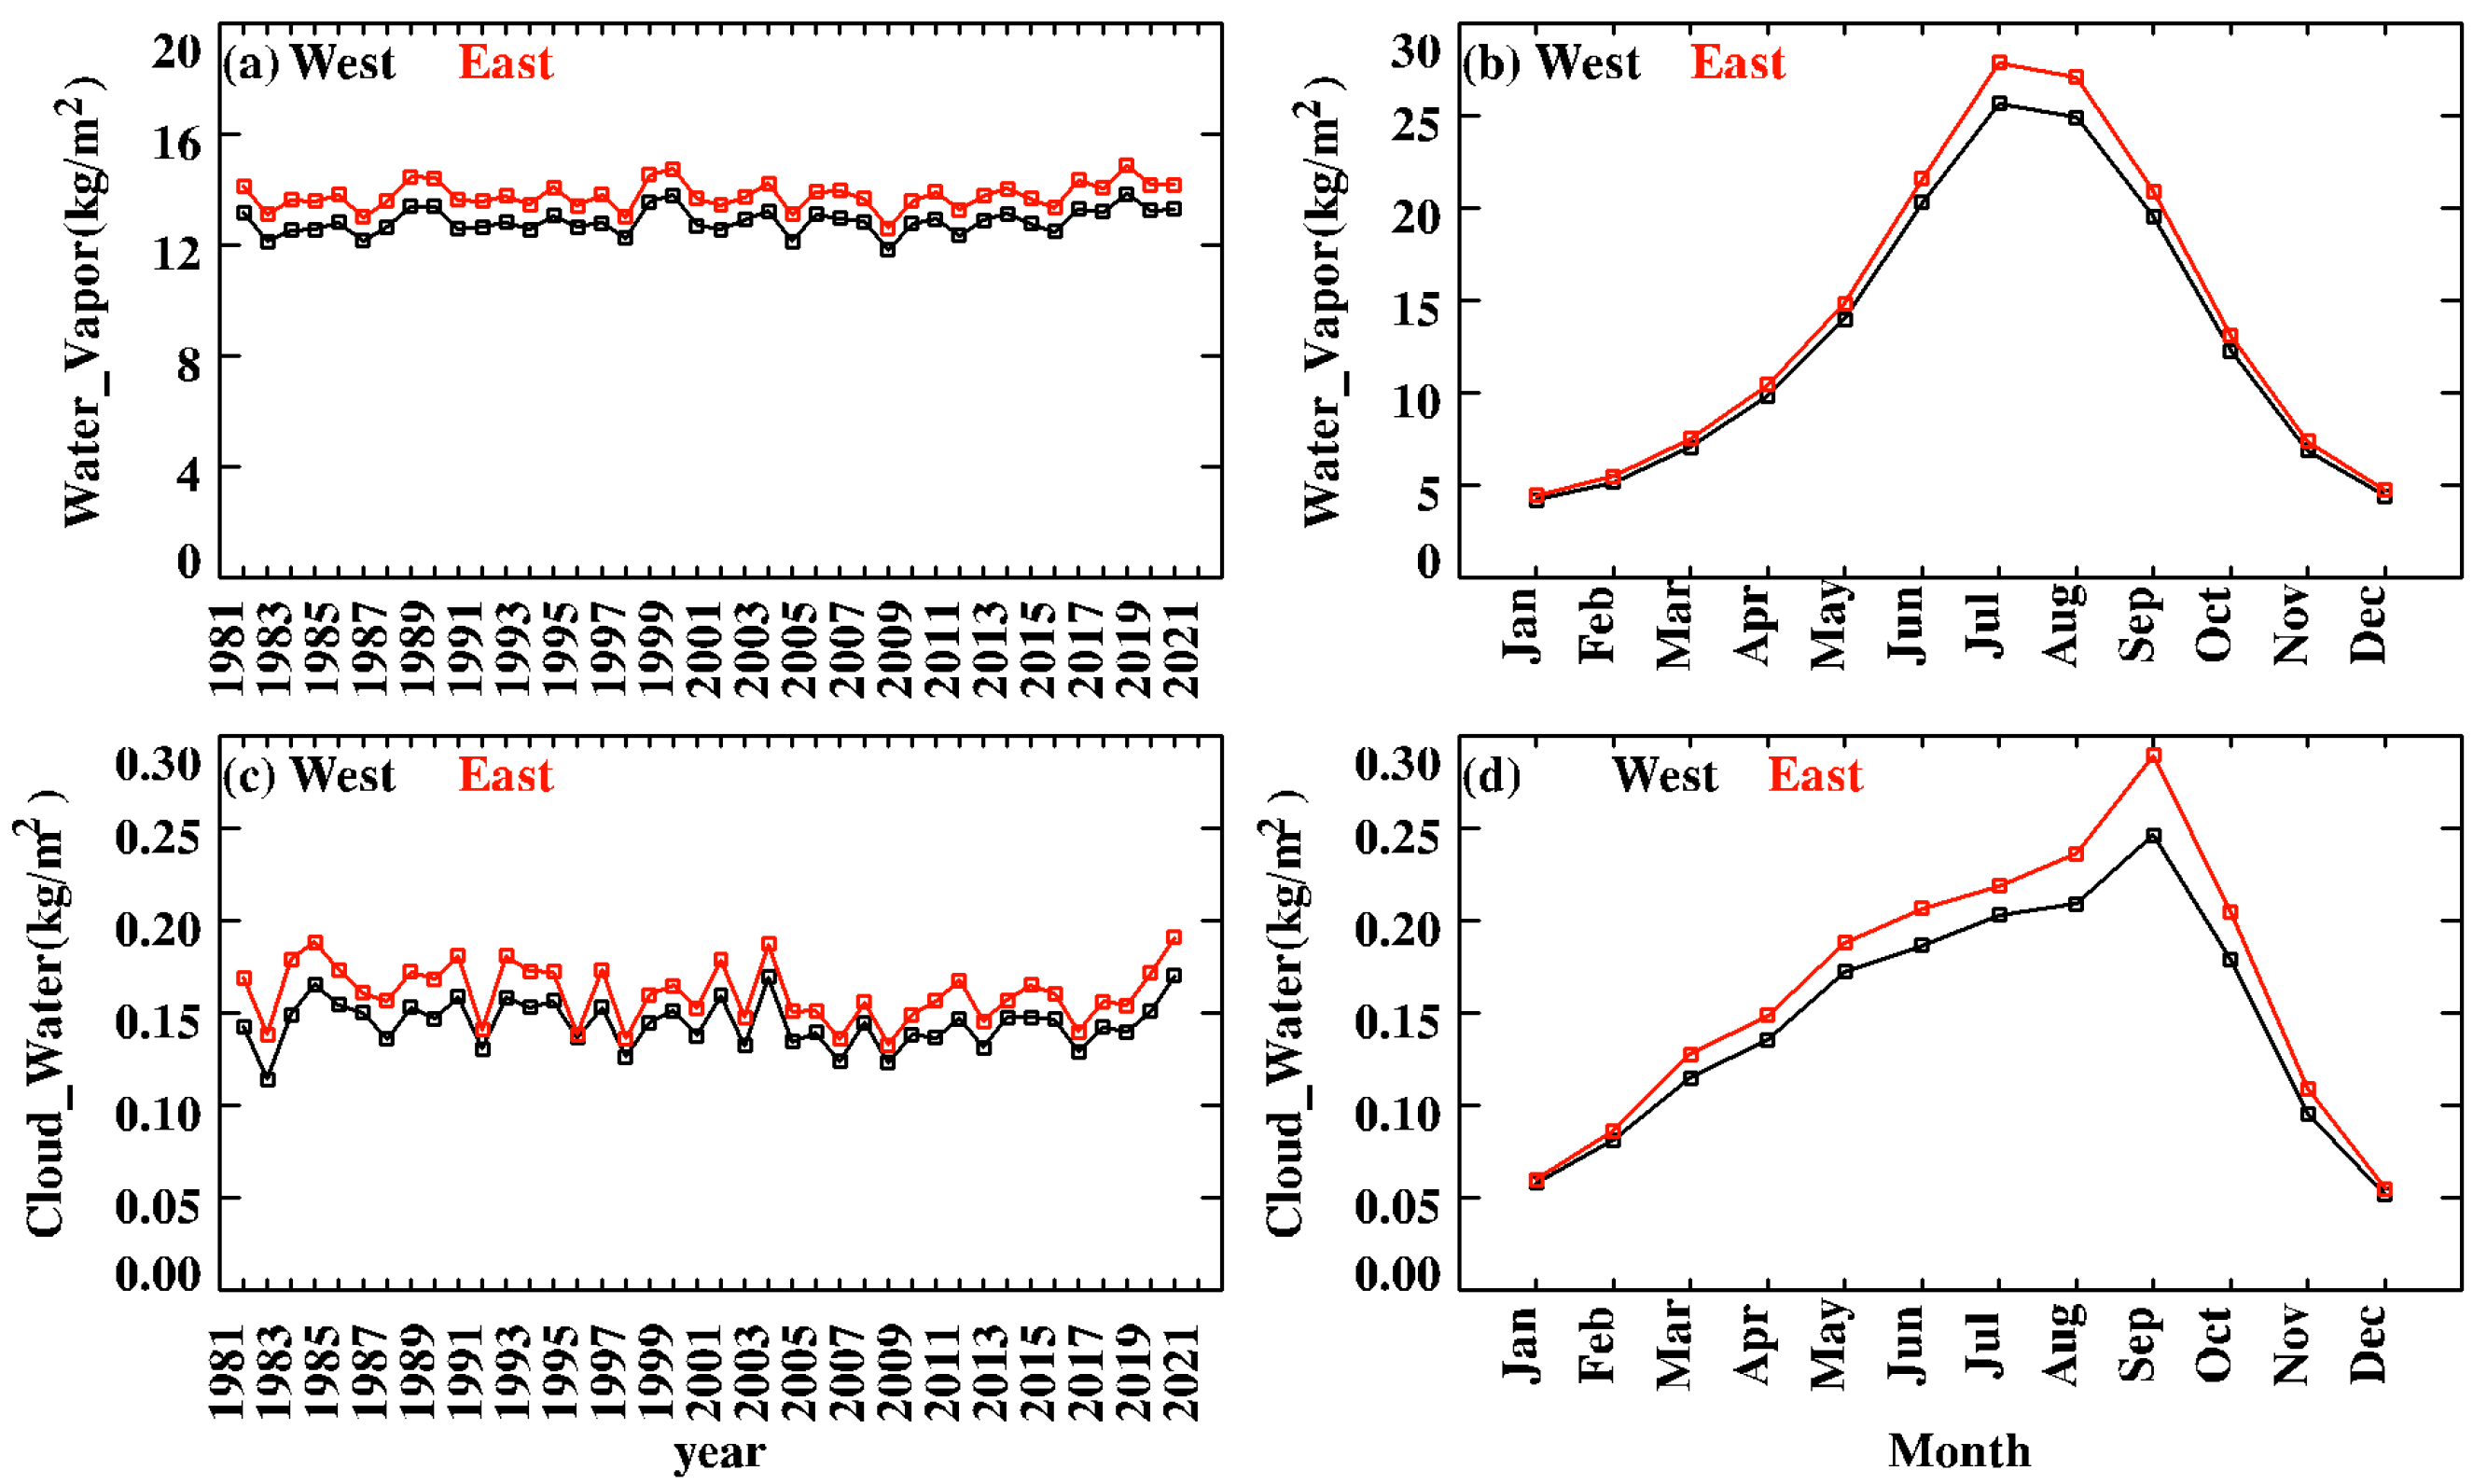
Clouds and water vapor are essential components of the atmospheric water cycle and have a profound impact on regional climate and weather. In
Figure 3, a comparison is made between the annual mean and monthly mean sequences of TCWV and TCCW for the 40-year period from 1981 to 2020. It is observed that the 40-year average TCWV on the eastern side is 13.8 kg/m
2, which is approximately 7% higher than that on the western side. The higher values are mainly concentrated in the months of June to September, with an average of 24.4 kg/m
2 on the eastern side, approximately 8% higher than that on the western side. The maximum TCWV occurs during the dominant summer monsoon in the months of July and August, with the eastern side exhibiting approximately 9% higher values than the western side. Comparing the distribution characteristics of columnar TCCW in
Figure 3c,d, it is evident that the monthly sequence differs significantly from the TCWV. The high values of TCCW mainly occur from May to October, with the maximum value observed in September. The eastern side exhibits approximately 18% higher values in September compared to the western side. Therefore, it can be concluded that during the peak season of the summer monsoon and months with higher TCWV, the difference in TCWV between the eastern and western sides becomes more pronounced. The monthly distribution of TCCW differs significantly from that of TCWV, with the highest values occurring in September. Differences in the monthly average distribution throughout the year between the TCCW and TCWV is closely associated with cloud precipitation processes. Especially, during the summer monsoon season in July and August, the water vapor content reaches its maximum value throughout the year, indicating that clouds are more likely to develop into rainfall during this period. Therefore, the cloud water content in September, when the summer monsoon weakens, is unexpectedly higher than in July and August.
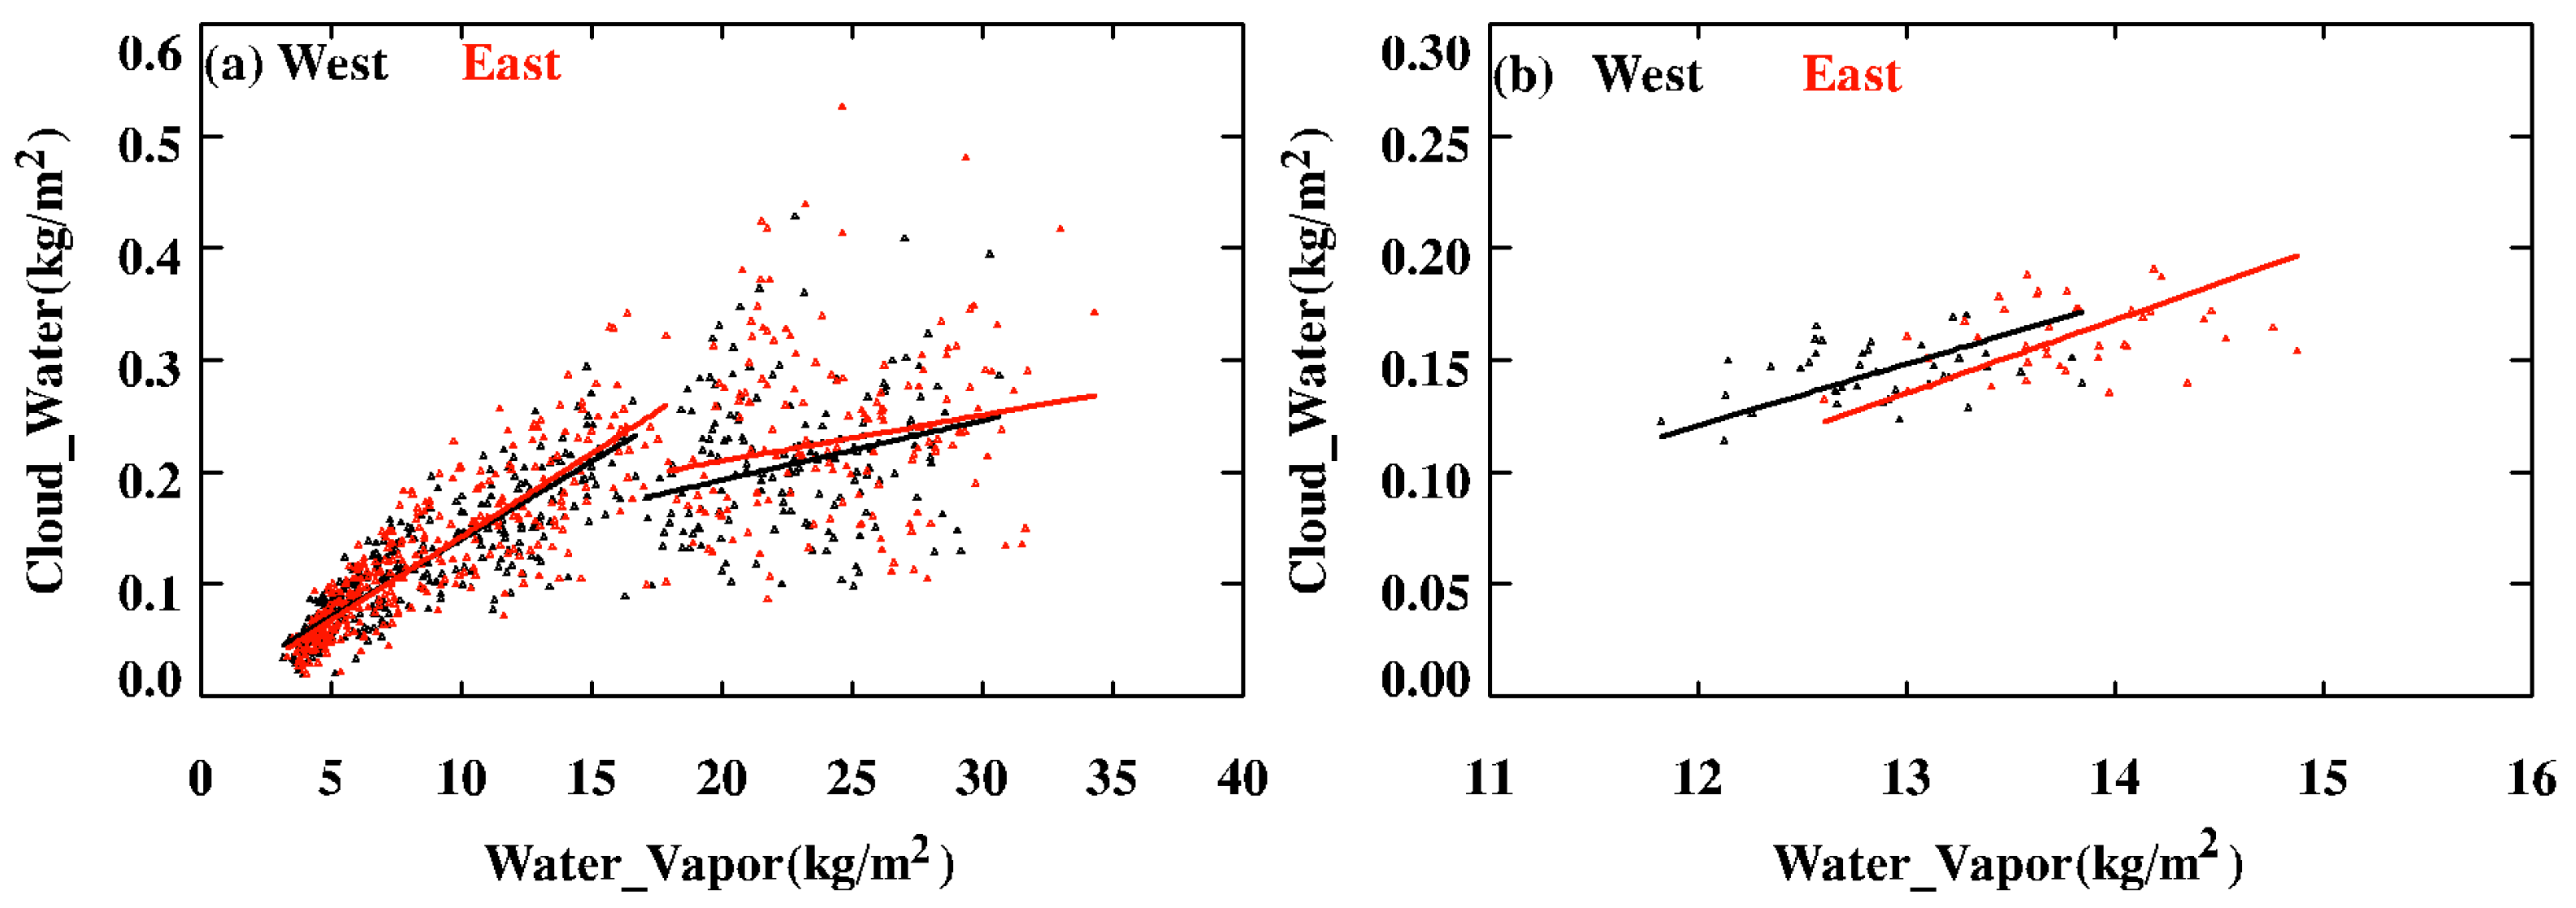
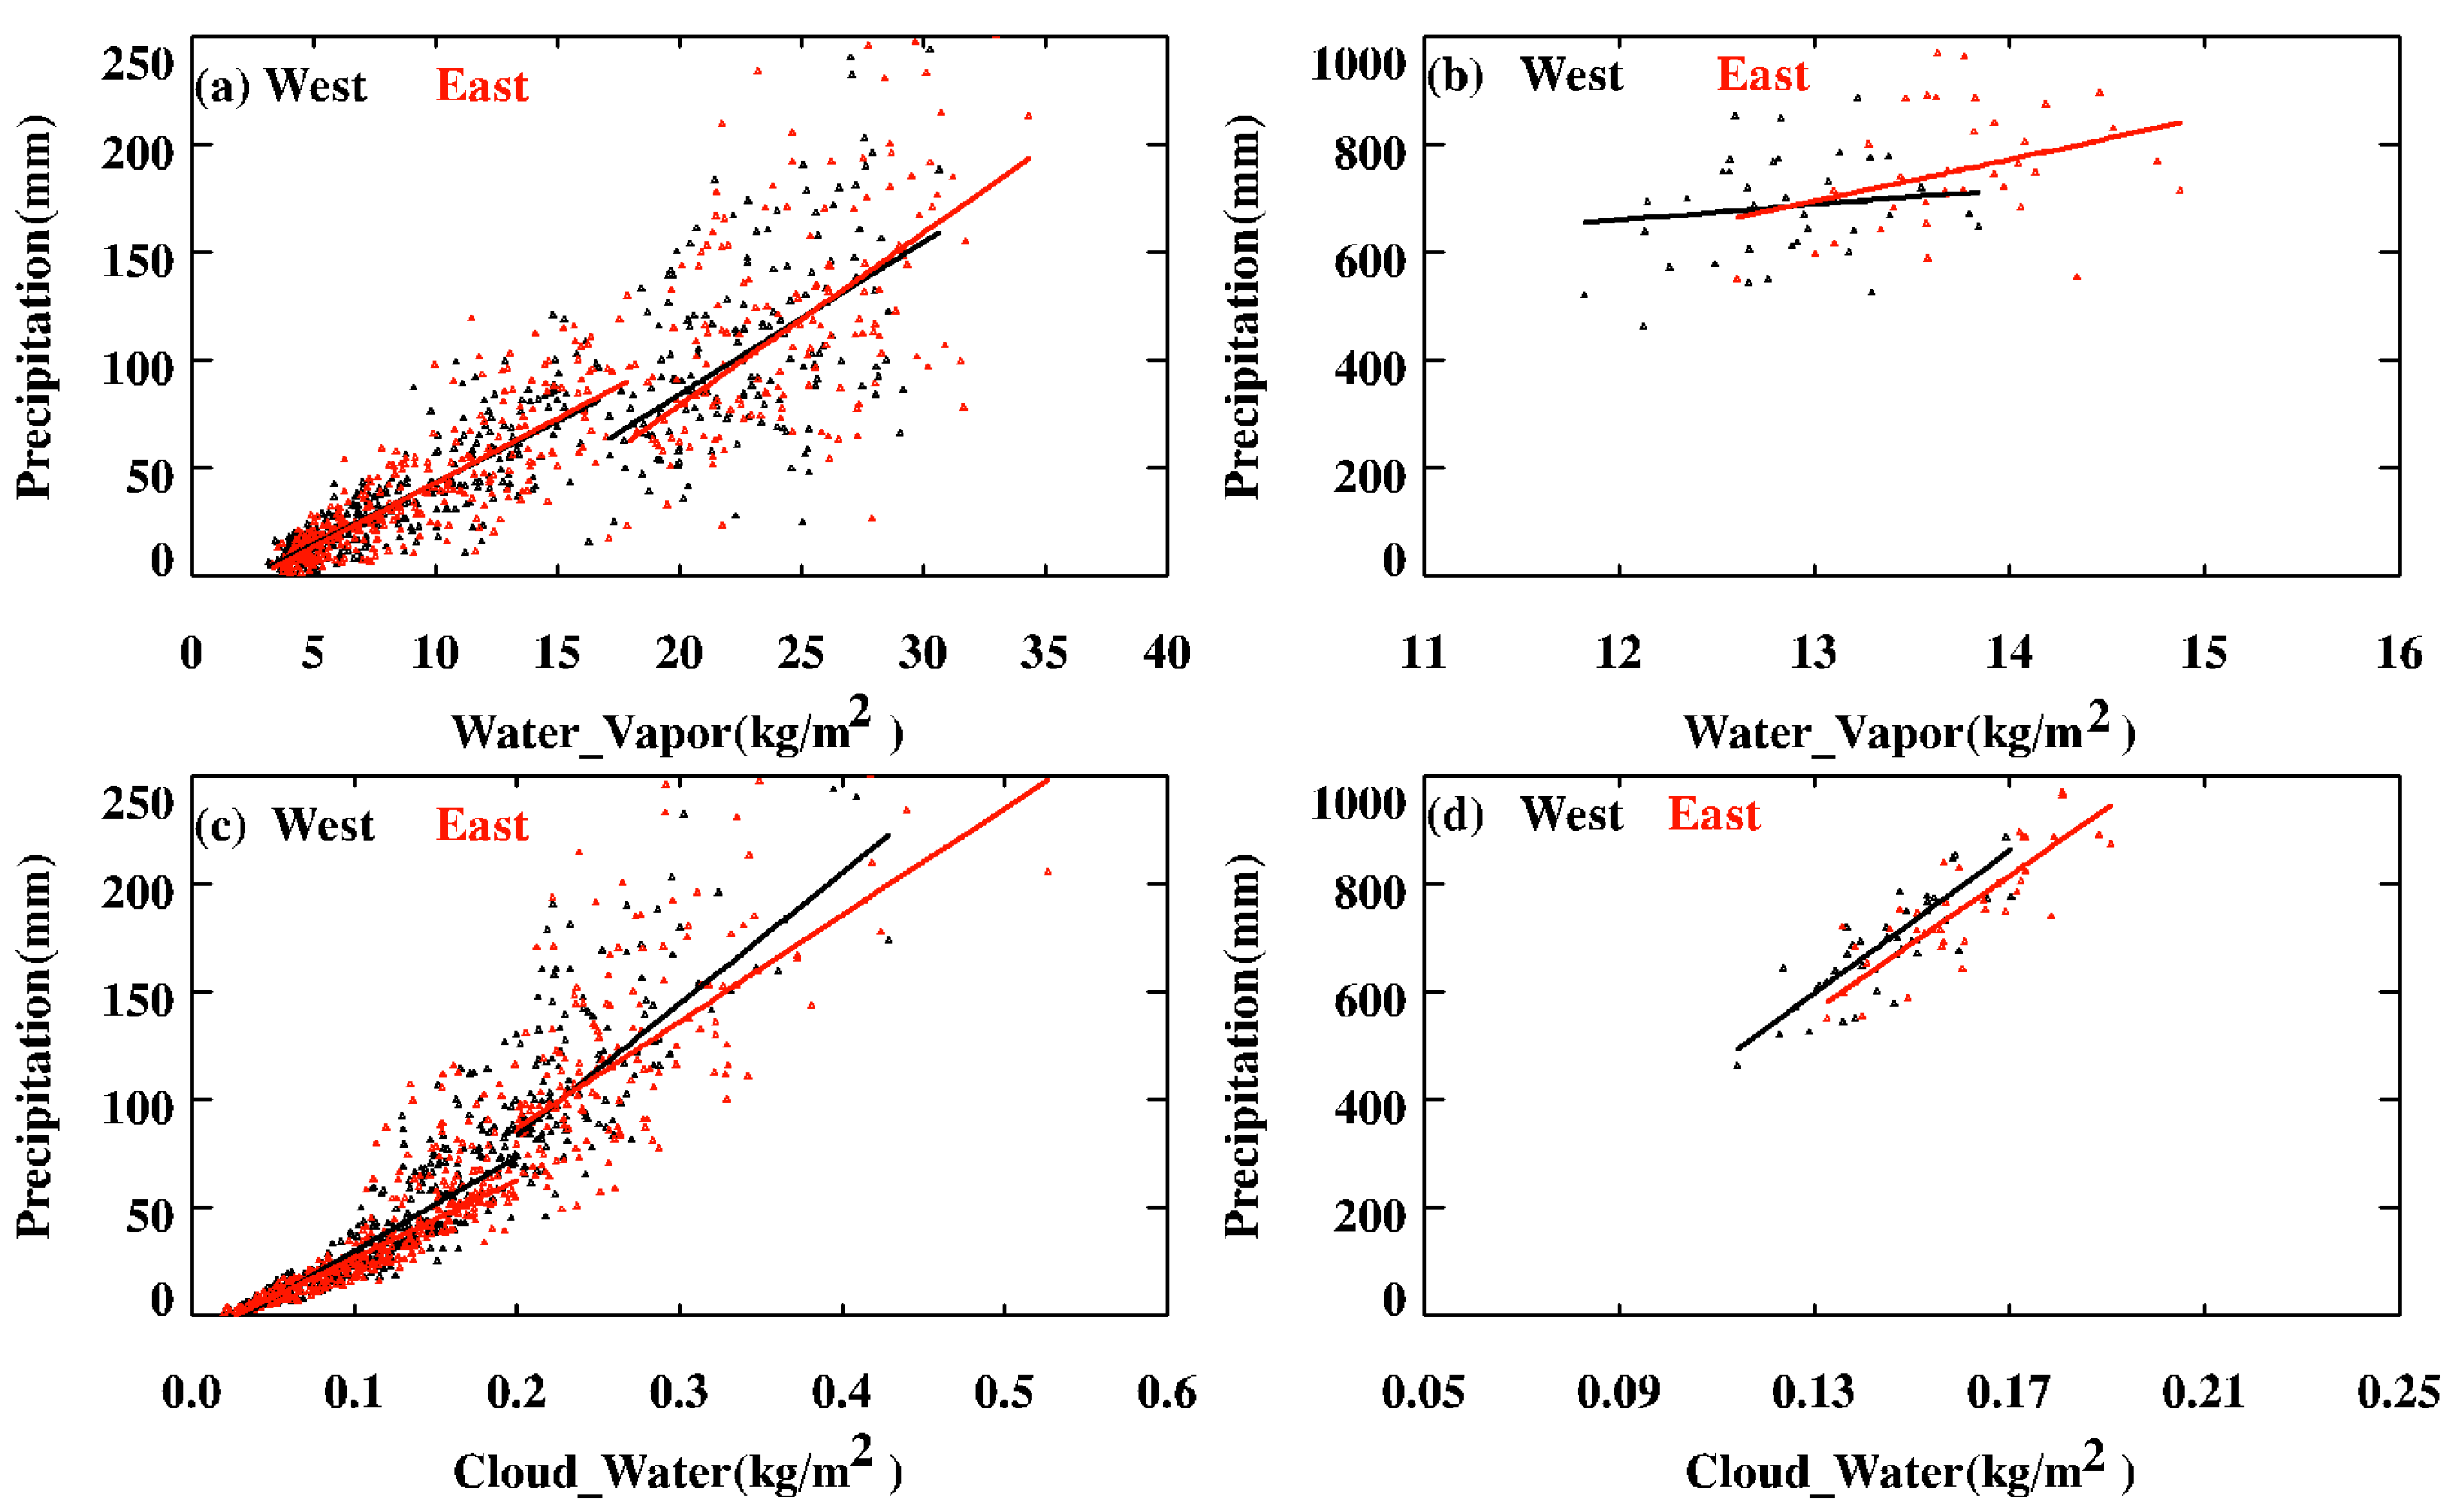
When comparing the TCWV and TCCW of the LM over the 480-month sequence spanning 40 years, it is observed that there is a clear linear relationship between TCCW and the monthly average of TCWV on both the eastern and western sides of the LMs (see
Figure 4). When the TCWV is less than 17 kg/m
2, the linear growth trend of columnar TCCW with increasing TCWV is nearly equal on the eastern and western sides. This may be related to the formation process of non-precipitating clouds, as higher TCWV facilitates cloud formation during the initial stages. When the TCWV exceeds 17 kg/m
2, the linear increase trend of TCCW with TCWV becomes less pronounced, and the linear correlation decreases. This may be associated with the transformation of non-precipitating clouds into precipitating clouds. When the TCCW reaches higher values, cloud droplets have a greater tendency to grow into precipitation particles, resulting in the conversion of some cloud water into precipitation. As a result, the trend of increasing TCCW with increasing TCWV is attenuated.
In
Figure 4b, the linear relationship between the 40-year average TCCW and TCWV shows a relatively stable increasing trend. This is because the annual average smooths out the high values of TCCW and TCWV during the rainy season. The TCCW on the eastern side increases at a linear rate of 0.033 kg/m
2 with respect to TCWV, while on the western side, it increases at a linear rate of 0.028 kg/m
2. The slightly higher linear trend on the eastern side compared to the western side is closely related to the differences in terrain between the two sides. Previous studies (highlighted by Gao [
7]) have conducted numerical simulations of two intense precipitation events in the LMs, indicating that the blocking effect of the mountainous terrain leads to moisture convergence and uplift on the eastern side, resulting in more precipitation resources on the eastern side compared to the western side.
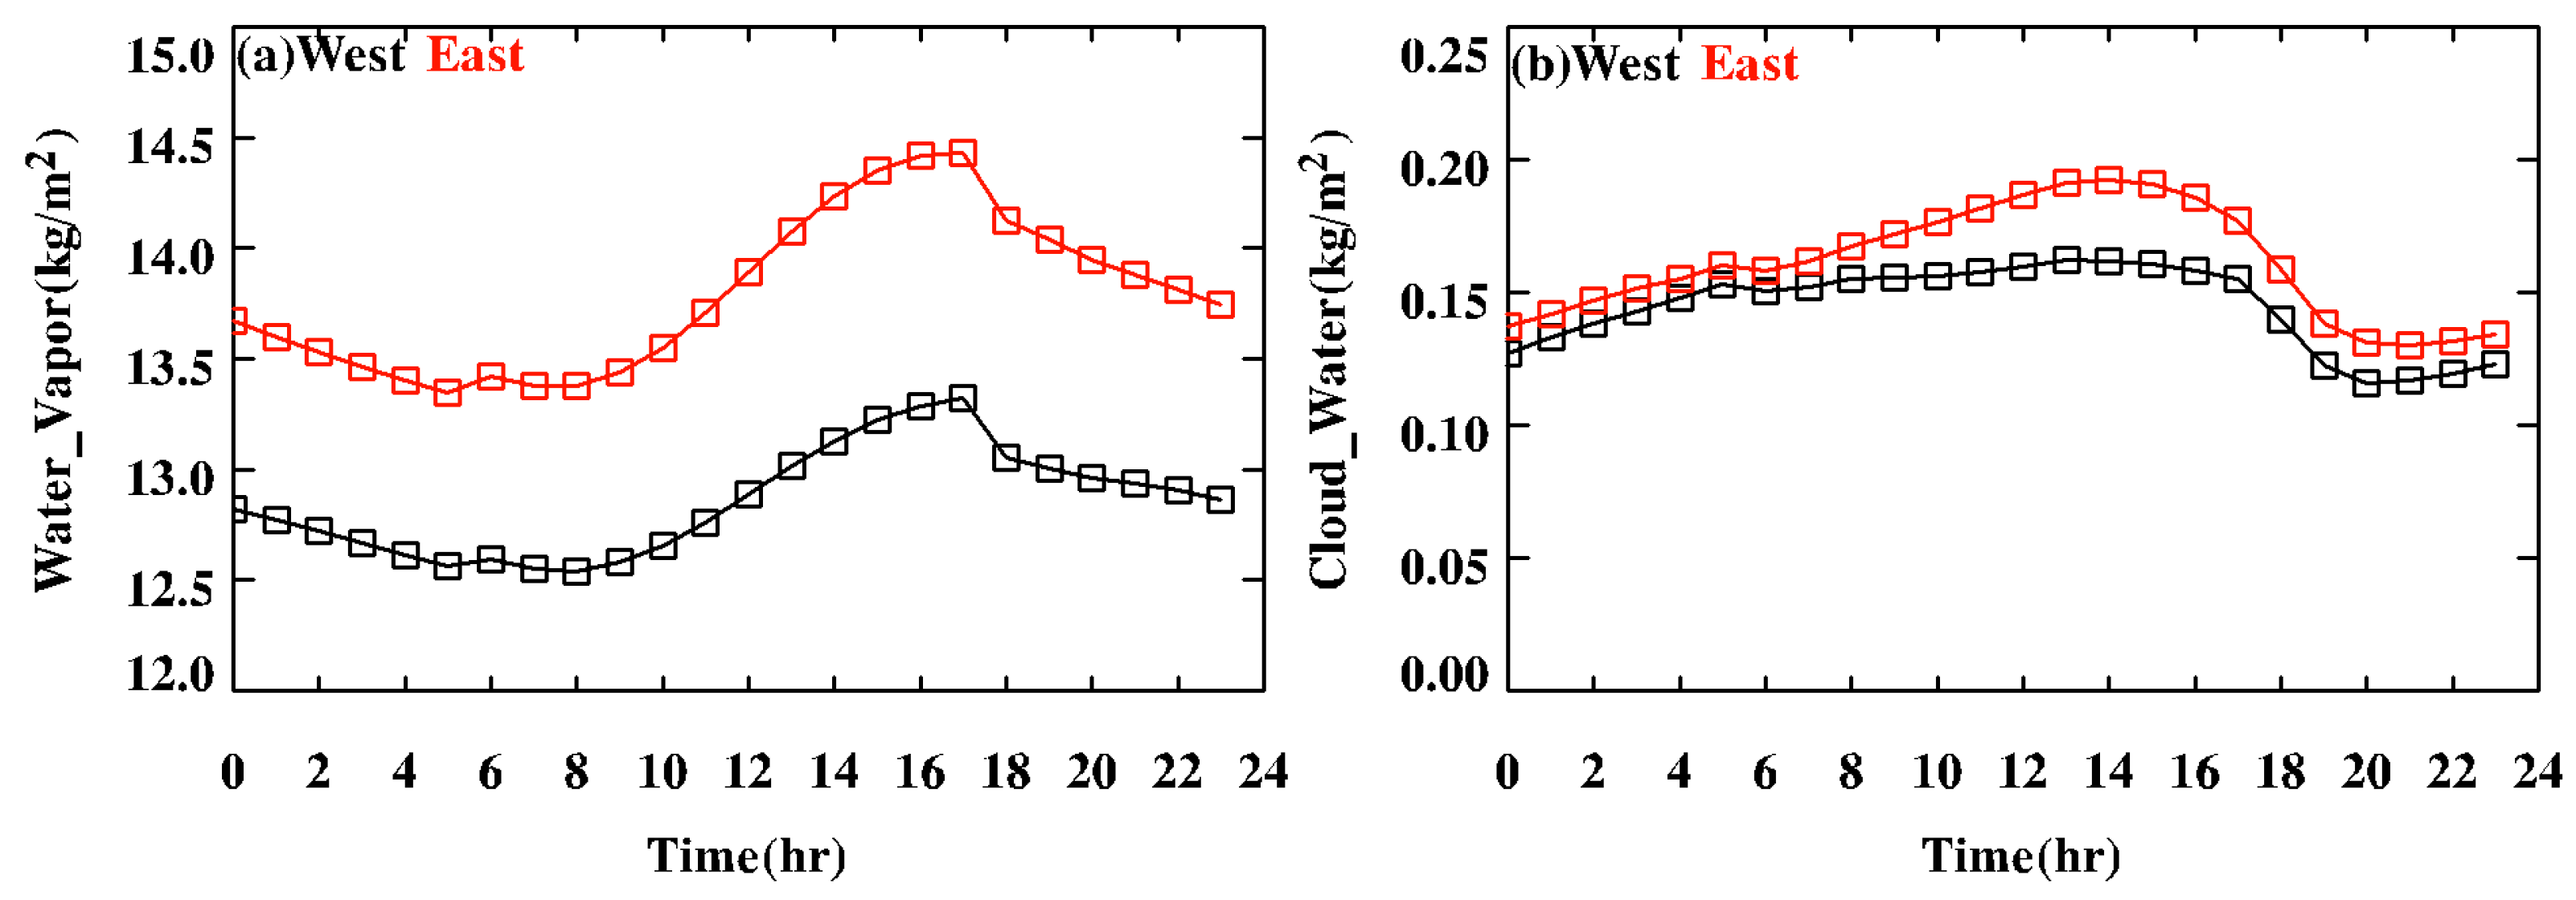
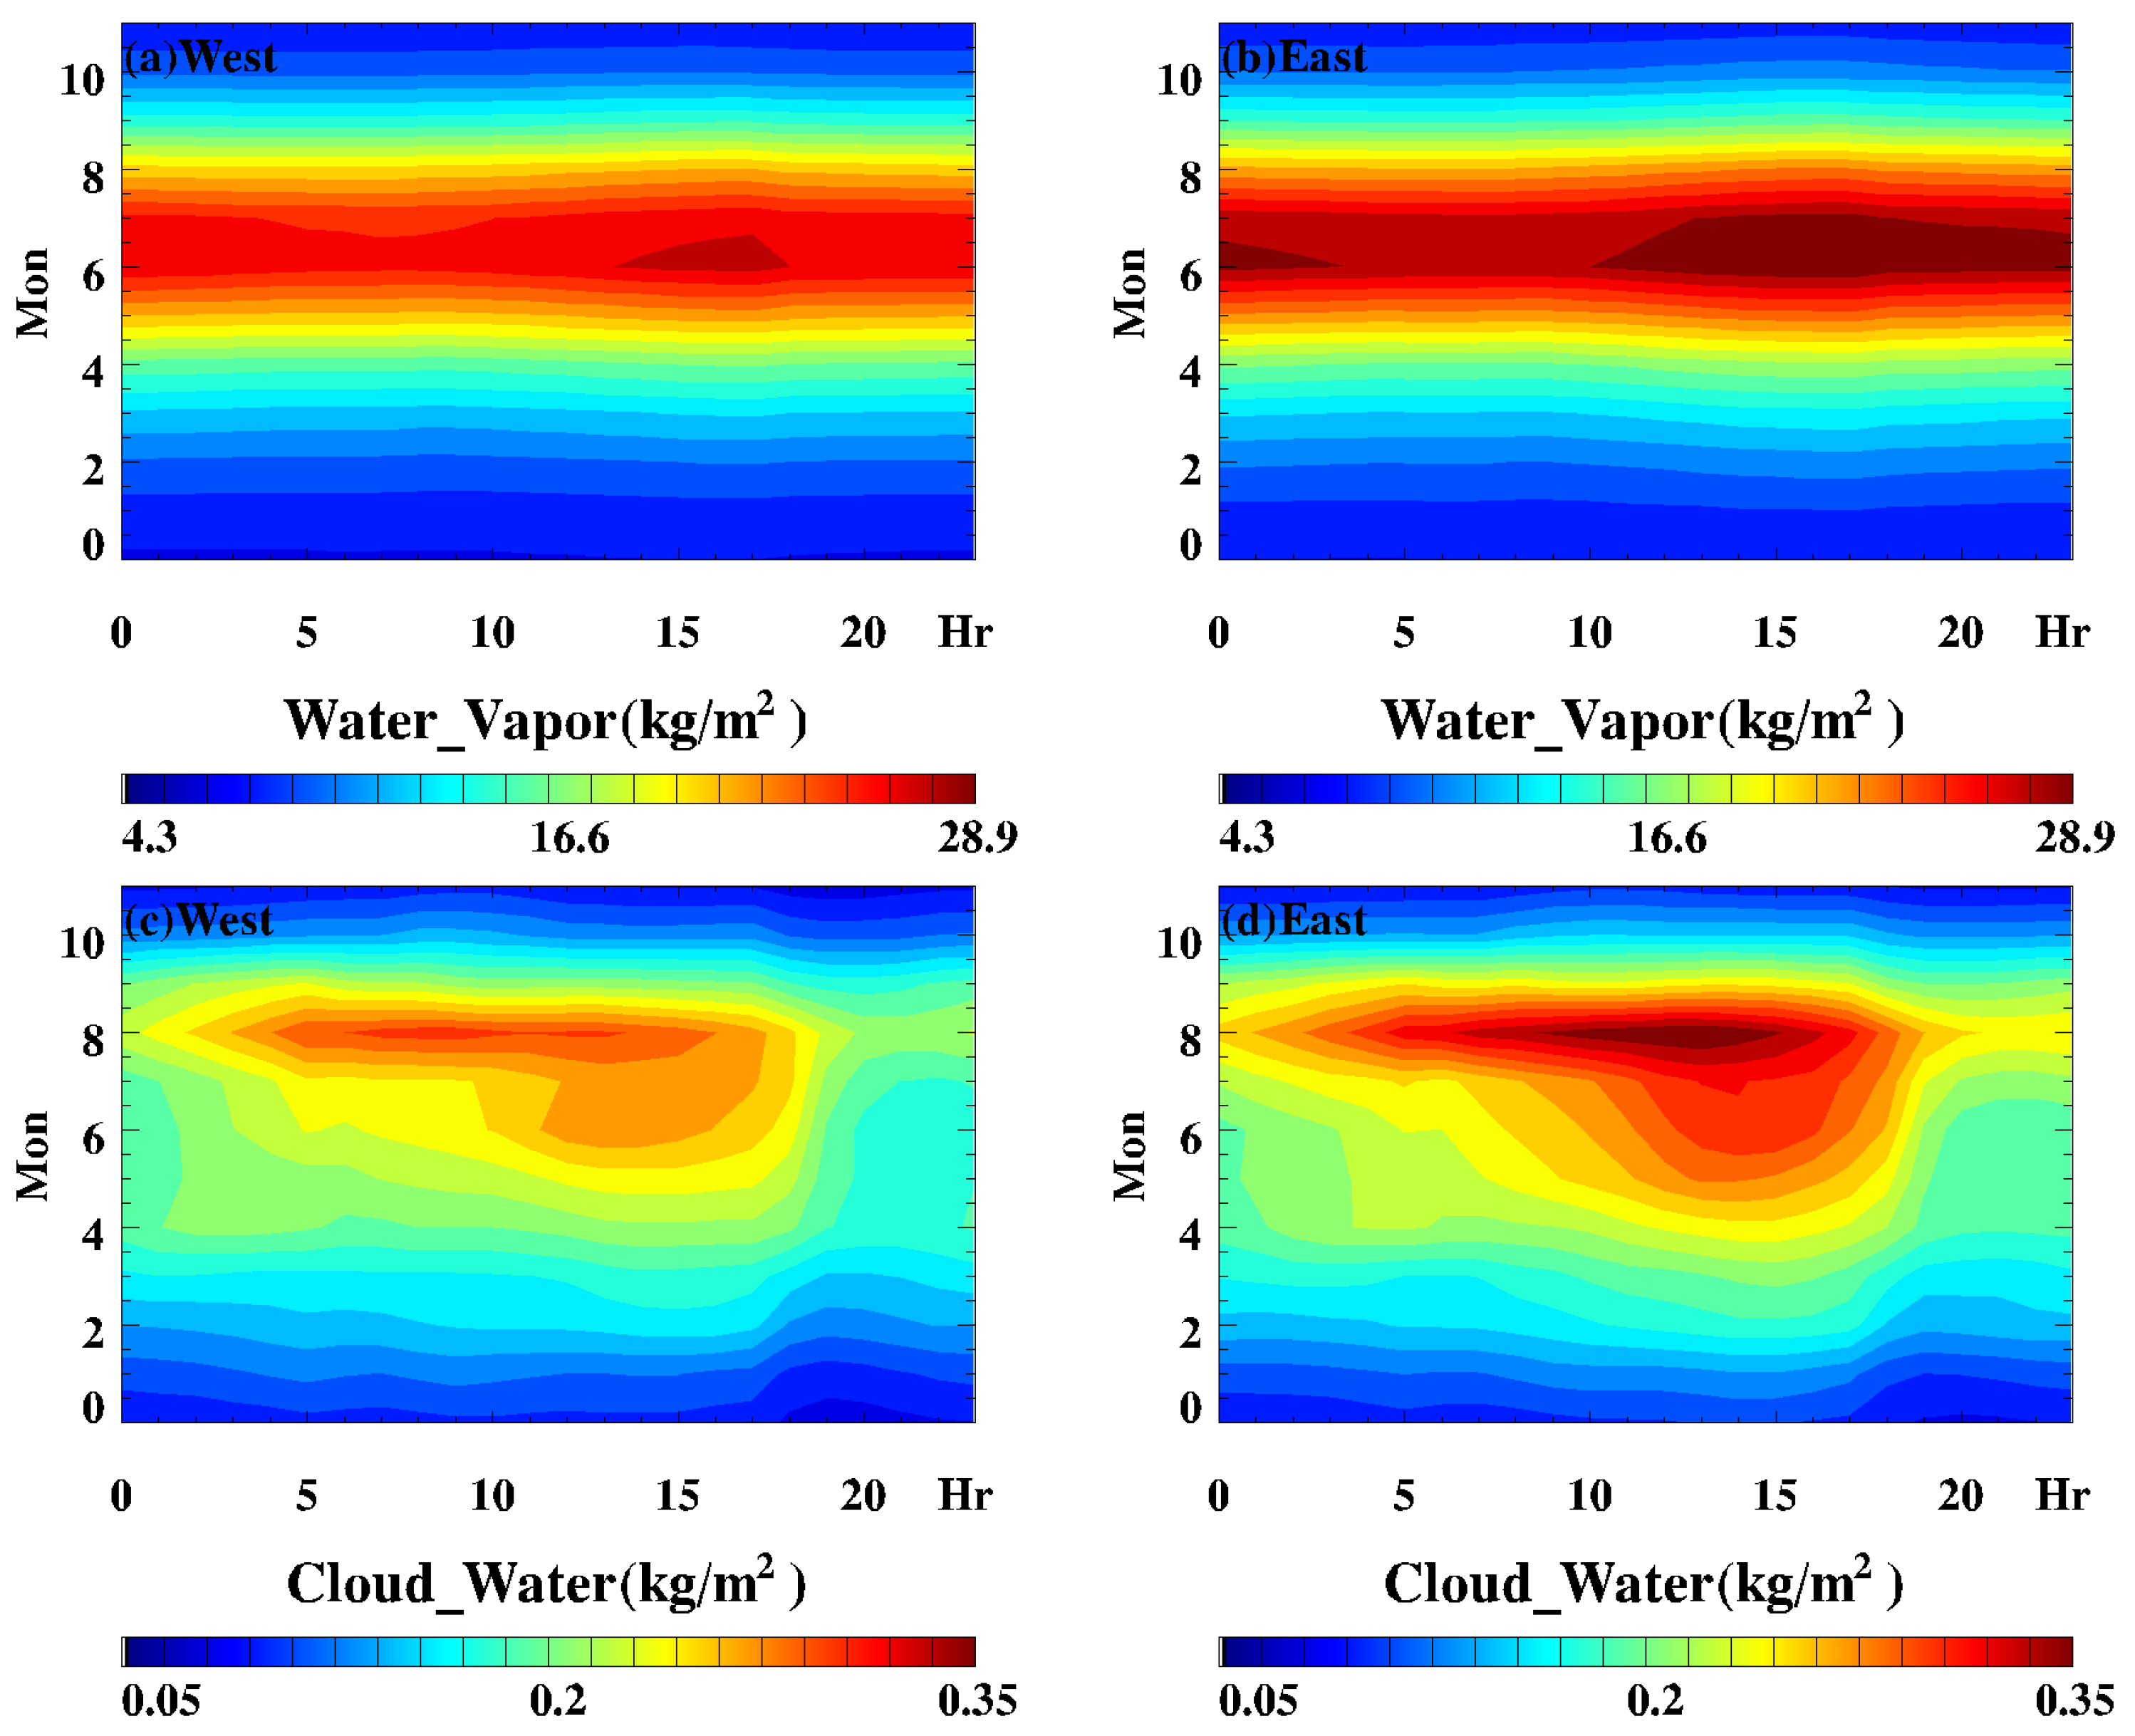
The seasonal variation in cloud water and water vapor is mainly influenced by the air mass transport during the cold and warm seasons. The air coming from the north carries less water vapor, while the air from the southern direction carries more water vapor. In the cold season, there is a higher influx of air from the north, while in the warm season, there is a higher influx of air from the south. Cloud formation not only depends on sufficient water vapor content but also requires suitable dynamic conditions to transport the water vapor to the lifting condensation level for cloud and precipitation formation. Therefore, in
Figure 4, there is a significant difference in the distribution of cloud water between the early morning and afternoon times compared to the distribution of water vapor. From
Figure 5a,b, and
Figure A1 it can be observed that the daily variation of TCWV on the eastern side is more pronounced compared to the western side, with longer durations of high values, especially during the summer. Influenced by water vapor, the high-value area of TCCW on the eastern side is consistently higher than that on the western side during the morning and afternoon (see
Figure 5c,d). Zhang et al. [
11] conducted a study on the cloud parameters in the LMs using ERA5 data and found that the cloud fraction in the mountainous areas during spring, summer, and autumn afternoons exceeded 70%. Tian et al. [
22] utilized microwave radiometer observations from the Longde station in the LMs for the period of June to November 2017 and discovered that the high values of atmospheric TCWV occurred during the midday to evening period, with peak values of liquid water content appearing before sunrise, in the afternoon, and in the evening, with the most prominent peak appearing in the afternoon. These research findings are consistent with the statistical results shown in
Figure 5c,d. Hence, it can be concluded that there are significant differences in the daily distribution of TCWV and TCCW between the eastern and western sides of the LMs. The high values of cloud water resources on the eastern side persist for a longer duration during the day and involve more months compared to the western side.
3.2.2. Precipitation
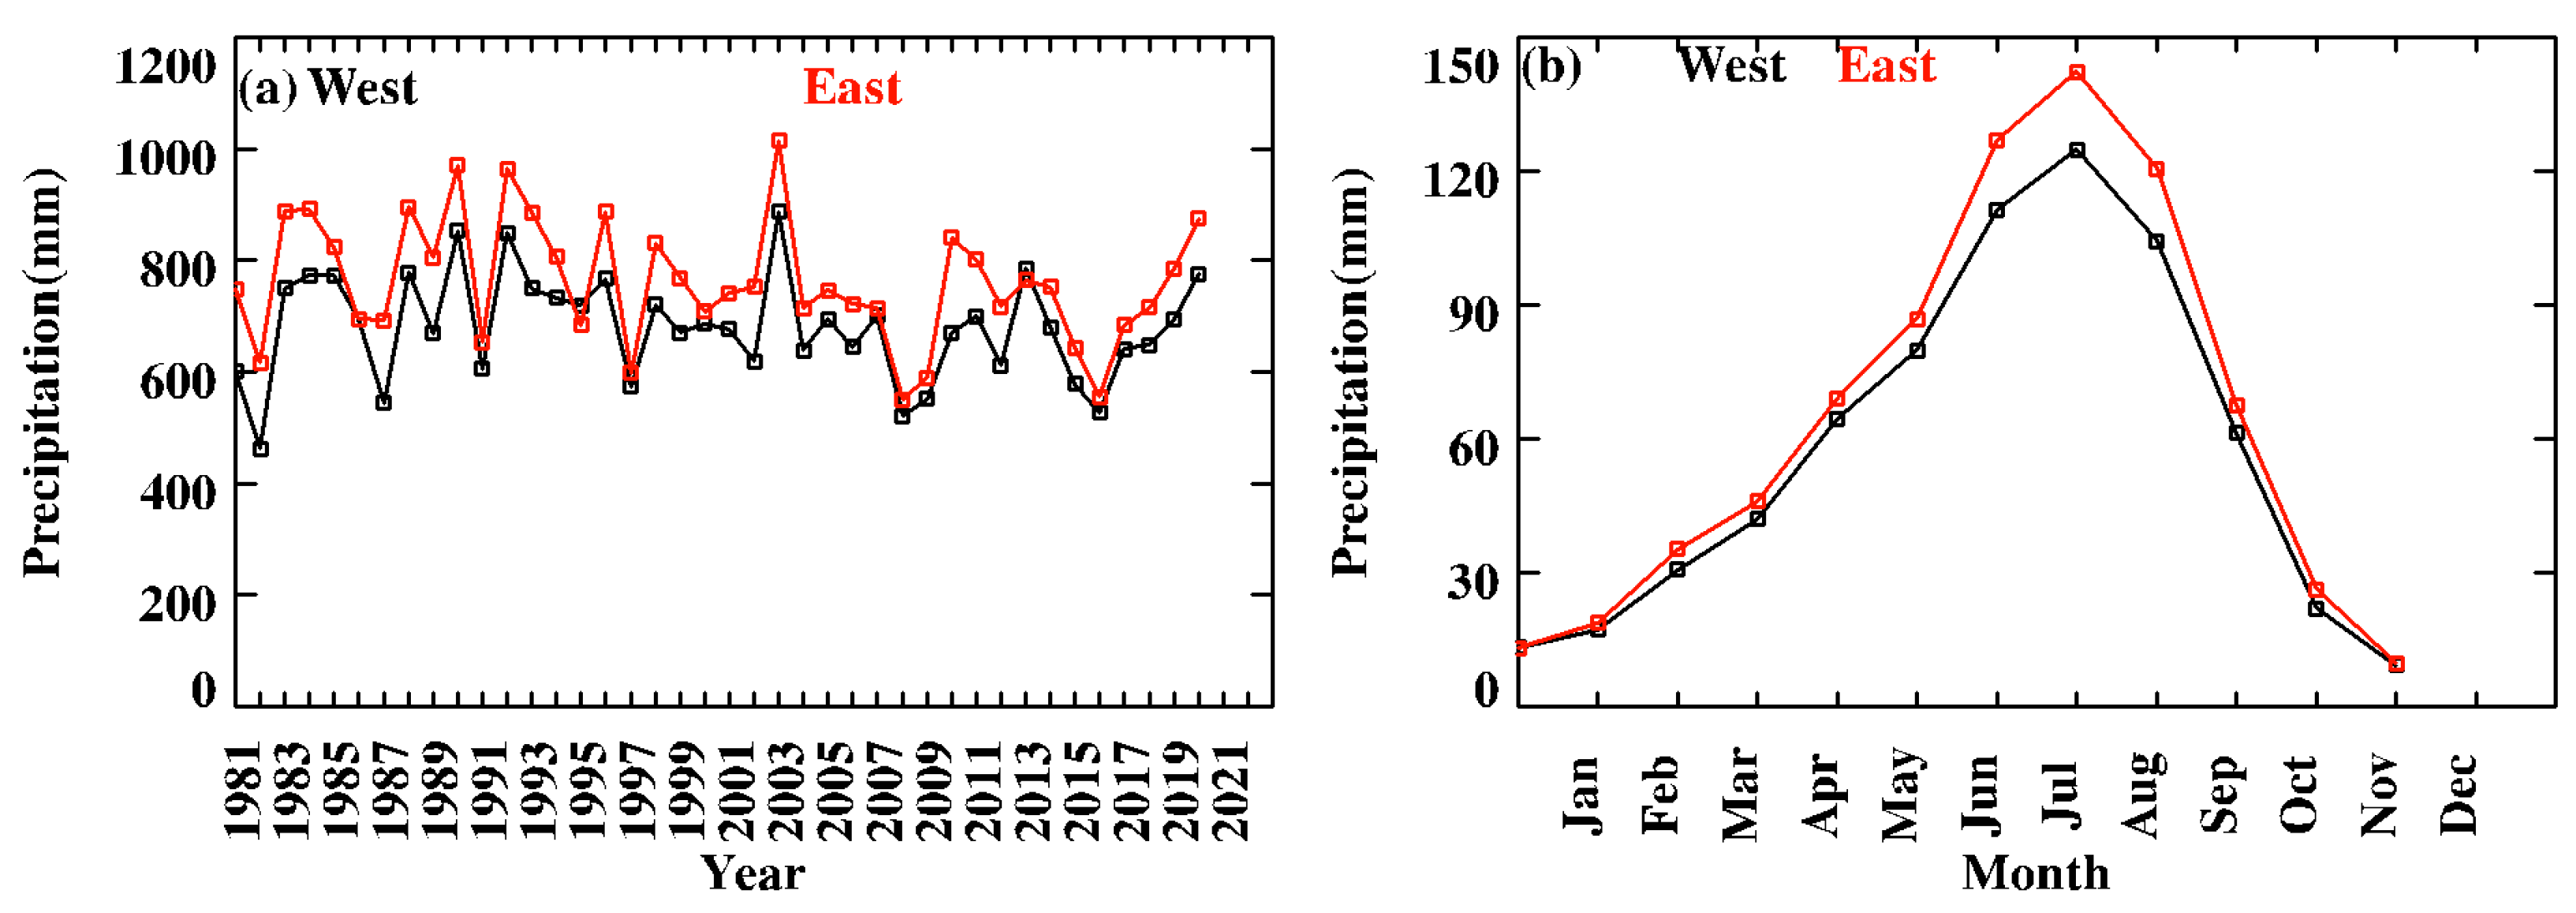
From the comparison of the total annual precipitation over 40 years in
Figure 6, the mean annual precipitation on the eastern side is 686.1 mm, which is approximately 12% higher than the western side. The difference in precipitation is mainly evident during the months of July to September, with these three months accounting for 74% and 72% of the total annual precipitation, respectively. On the eastern side, the average precipitation during these months is 116.9 mm, which is approximately 15% higher than the western side. Gao et al. [
7] studied the spatial and temporal distribution characteristics of precipitation in the LMs using daily precipitation data from six national-level meteorological stations in the region over a period of nearly 30 years and also indicated that precipitation in the LMs is primarily concentrated in the months of July to September.
Clouds and precipitation can only form when the moisture in the air reaches saturation. Therefore, there is a positive correlation between the amount of water vapor and the formation of clouds, as well as between the TCCW and the occurrence of precipitation.
Figure 7 illustrates this linear correlation between TP and TCWV, as well as TCCW, on both the eastern and western sides of the LMs. It should be noted that the linear correlation between the eastern and western sides changes when the TCWV exceeds 17 kg/m
2. The trend of precipitation increasing linearly with TCWV is steeper compared to the trend when the TCWV is less than 17 kg/m
2. In other words, as the TCWV increases, the precipitation also increases more significantly. This may be attributed to the occurrence of moderate to heavy precipitation events, where higher TCWV is more likely to generate intense rainfall processes, resulting in higher precipitation amounts.
From
Figure 7, it can be observed that the increase in precipitation with respect to TCCW is greater than the increase in precipitation with respect to TCWV. Specifically, when the TCCW exceeds 0.2 kg/m
2, the relationship between precipitation and TCCW lies between an exponential and a linear relationship. In other words, higher TCCW corresponds to a greater increase in precipitation. This phenomenon is commonly observed during moderate to heavy precipitation events with high TCWV. In such cases, the mean TCWV and TCCW on the western side are lower than those on the eastern side. Therefore, when the TCWV and TCCW are the same on both the eastern and western sides, the increase in precipitation is larger on the western side. This characteristic is also reflected in the trends of the annual TP over the 40 years on the eastern and western sides, in relation to changes in TCWV and TCCW.
The differences in the linear variation of precipitation with TCWV and TCCW on the eastern and western sides of the LMs are influenced by various factors such as the orientation, slope, and elevation of the mountains. In a study by Zhang et al. [
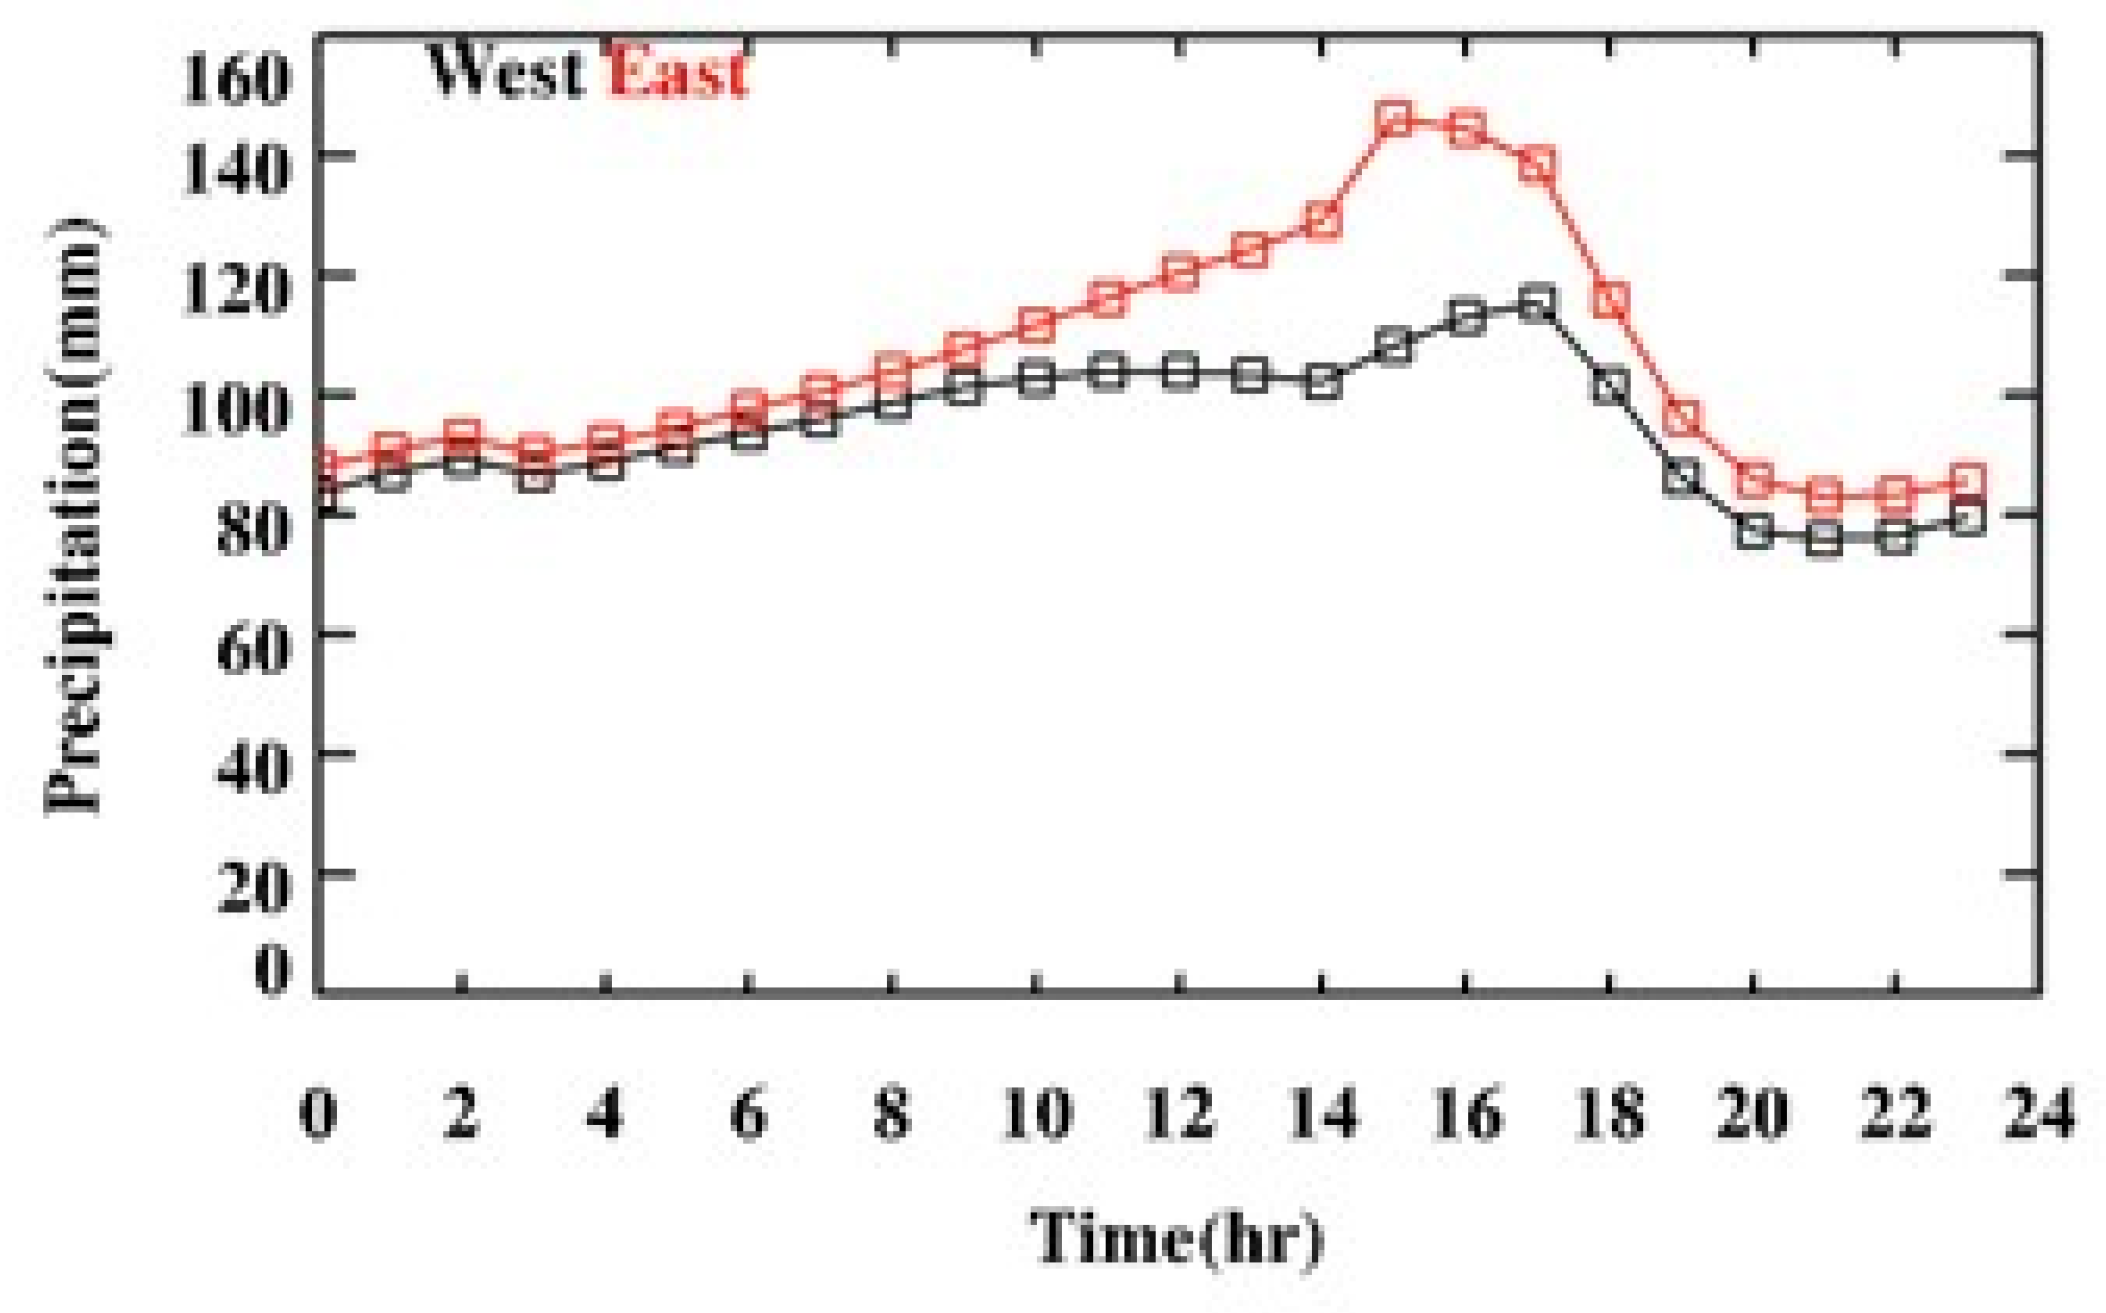
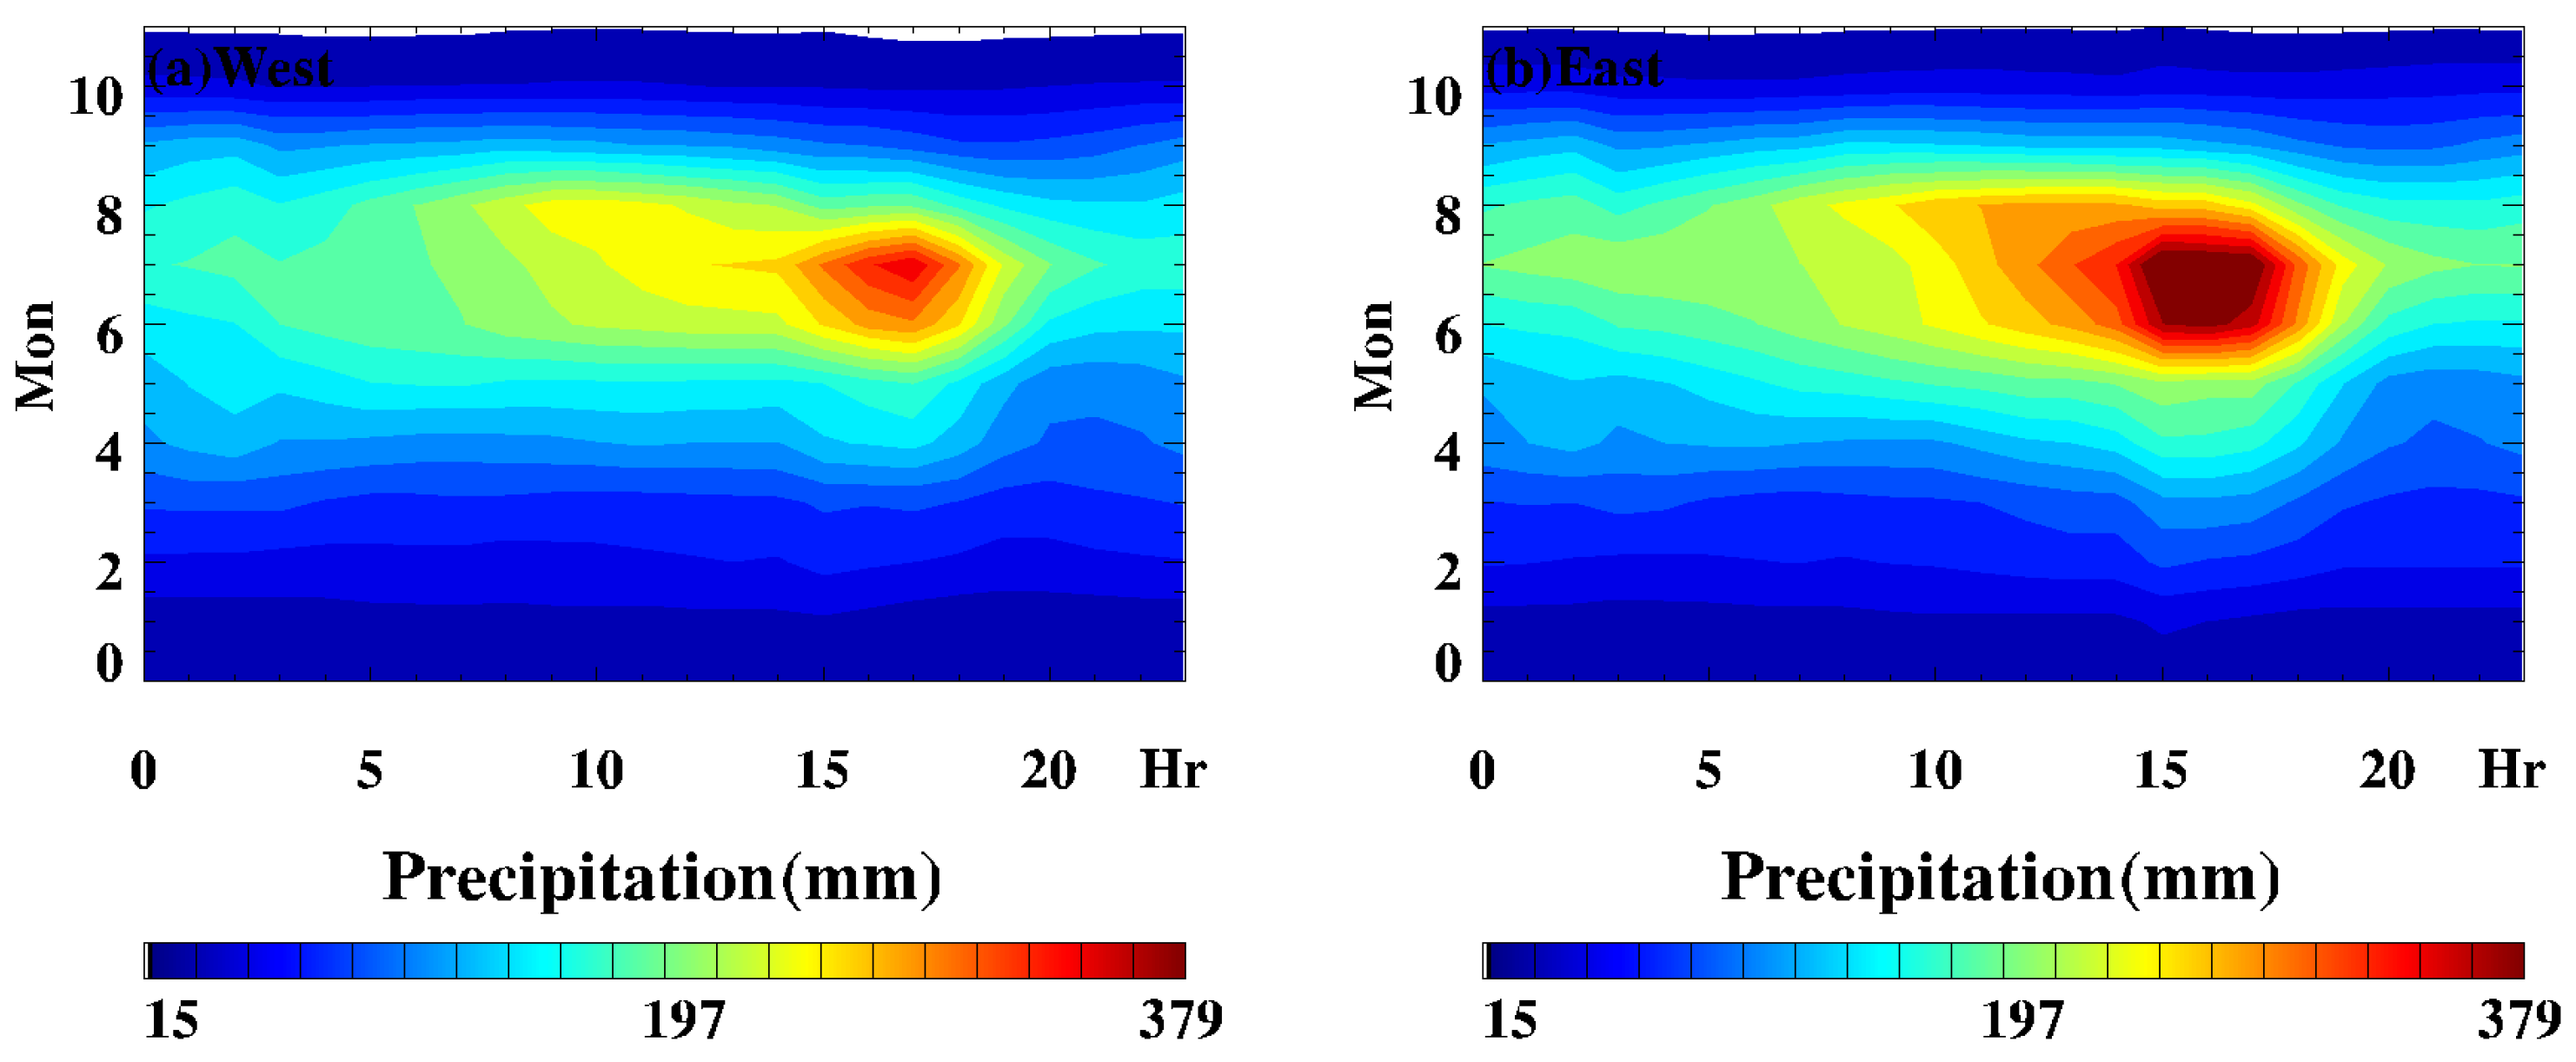
13] on the characteristics of atmospheric water vapor and surface precipitation in the QM, it was pointed out that the conversion of atmospheric water vapor to precipitation is closely related to elevation, slope orientation, and the influence of circulation patterns. From the 24-h daily distribution of precipitation in
Figure 8 and
Figure A2, it can be observed that it is closely related to the daily distribution of TCCW. The high-value center of TCCW persists from around 6 a.m. until around 5 p.m., which coincides with the period of high precipitation values. However, the peak in TCCW occurs around 2 p.m., while the peak in precipitation occurs around 4 p.m. This time difference is related to the process of cloud evolution and transformation into precipitation. In the afternoon, the unstable underlying airflow can easily generate turbulence and mixing. With sufficient water vapor supply during the warm season and the lifting effect of the terrain, non-precipitating clouds are prone to develop into rainfall. After a certain period, the precipitation reaches its maximum value.
Figure 7 shows that it takes approximately 2 h for the maximum TCCW to develop into the maximum precipitation. The western side of the mountains has a gentler topography, and the peak precipitation appears around 4 p.m. On the other hand, the eastern side has steeper terrain, resulting in an earlier onset time and a longer duration of precipitation, lasting from around 3 p.m. to 5 p.m., with higher precipitation amounts compared to the western side. The results indicate that the topography of the LMs has a significant impact on the TCCW and TP on both the eastern and western sides, with a more pronounced effect on the eastern side.
4. Discussion
The TCWV and TCCW have a significant impact on precipitation, with the TCCW being two orders of magnitude smaller than the TCWV. The linear relationship between TCCW and TP is superior to that of TCWV. The precipitation fluctuates greatly in the high-value area of TCCW. This is because when the TCCW reaches a high value, some of the cloud water converts into precipitation, thus affecting the linear relationship between TCCW and TP. Compared to TCCW, the linear relationship between TP and TCWV is relatively stable.
The TCWV and TCCW in the atmosphere are closely correlated with regional precipitation. The TCCW is two orders of magnitude smaller than the TCWV, and its linear relationship with TP is more significant compared to the linear relationship between TP and TCWV. However, the values of TP in the high-value zone of the TCCW exhibit larger fluctuations, which may be due to the conversion of some cloud water into precipitation when the TCCW is high, thereby affecting the linear relationship between the TCCW and TP. Compared to the TCCW, the linear relationship between TP and TCWV is relatively stable.
Considering the above characteristics, it is possible to quantify the relationship between TP and both integrated TCWV and TCCW. By using linear regression, Equations (1) and (2) can be derived to represent the relationships between TP, TCWV, and TCCW in the eastern and western sides, respectively.
In the equations, TP represents total precipitation in mm. TCWV represents the monthly mean integrated column water vapor content in kg/m2. TCCW represents the monthly mean integrated column cloud water content in kg/m2. The subscripts 1 and 2 represent the eastern and western sides, respectively.
The calculated precipitation obtained from Equations (2) and (3), compared to the actual precipitation (as shown in
Figure 9), exhibits a better linear relationship. This relationship is superior to considering only TCWV or TCCW. It is important to note that when the monthly precipitation is below 140 mm, the calculated precipitation from Equations (1) and (2) closely approximates the actual precipitation. However, when the monthly precipitation exceeds 140 mm, it may be influenced by the conversion from TCCW to precipitation, resulting in the calculated precipitation from Equations (1) and (2) being lower than the actual precipitation.
5. Conclusions
In this study, utilizing 40 years of ECMWF ERA5 data, we conducted a comparative analysis of the annual, monthly, and daily distribution patterns of TCWV, TCCW, and TP on the eastern and western sides of the LM region. We also derived regression equations for estimating precipitation using TCWV and TCCW. The main conclusions are as follows.
On both the eastern and western sides of the LM region, the TCCW and TP gradually decrease from south to north along a southwestward direction in latitude, with significant differences in values between the two sides. The average TCWV on the eastern side is 8% higher than that on the western side, with higher values mainly concentrated from June to September. The integrated TCCW on the eastern side is 7% higher than that on the western side, with the maximum value occurring in September. The precipitation on the eastern side is 12% higher than that on the western side, with higher values concentrated from July to September.
The TCWV, TCCW, and TP in the LM region all exhibit distinct diurnal distribution patterns. The high-value regions in the daily distribution on the eastern side persist for a longer duration compared to the western side, and they also occur over a longer period of months. The high-value zones of TCCW and TP on the eastern side appear approximately one hour earlier in the afternoon compared to the western side.
Precipitation shows a significant linear relationship with both TCWV and TCCW, and this linear relationship undergoes noticeable changes when the TCWV exceeds 17 kg/m2 and the TCCW exceeds 0.2 kg/m2. The linear relationship between the low-value zones of TCWV and TCCW and TP is more significant compared to their high-value zones, with the linear increase rates being higher on the western side than the eastern side.
The monthly mean precipitation has a significant linear regression relationship with TCWV and TCCW. When the precipitation is below 140 mm, the regression value is close to the actual precipitation, while when the precipitation exceeds 140 mm, the regression value is slightly lower than the actual precipitation.


