1. Introduction
According to the Intergovernmental Panel on Climate Change, within the broad context of global warming, the frequency and intensity of extreme precipitation events have increased, leading to secondary disasters, such as urban floods, flash floods, and mudslides. These events have resulted in considerable losses of life and property, posing a substantial challenge to sustainable societal development. Extreme precipitation events are sudden and particularly sensitive to climate change, cause abrupt changes, and have a complex formation mechanism [
1]. Observational data from recent decades demonstrate that the frequency of extreme precipitation events has risen considerably worldwide, albeit with notable regional disparities [
2]. In North America, the total amount, frequency, and intensity of extreme precipitation have generally increased, with the enhanced total precipitation in the United States primarily attributable to the augmentation of extreme precipitation [
3]. In Northern Europe, the annual total precipitation is considerably and positively correlated with extreme precipitation events, which displays an evident increasing trend. On the other hand, the total precipitation in Southern Europe decreases in winters and summers, with changes in extreme precipitation in winters not being as noticeable as those in summers; however, an increasing trend has been observed in the other seasons [
4]. In China, the frequency of extreme precipitation events has increased over the past 50 years, with a 3.14 mm/10 a increment in the heavy precipitation total (R95p). However, spatial changes present significant regional disparities [
5,
6]. The regional mean annual total precipitation in China is increasing considerably; the daily precipitation intensity is becoming notably strengthened and exhibiting substantial seasonal variations [
7,
8]. Given the considerable discrepancies in extreme precipitation characteristics across different regions, the trends in extreme precipitation changes at the regional scale should be studied to elucidate the regional characteristics and patterns of extreme precipitation within the context of climate change. This is paramount for deepening our understanding of water resources and global warming [
9,
10].
The study of the future evolution of extreme precipitation events is a key issue in the field of climate change. With the continuous refinement of the parameterization schemes in numerical models and the significant enhancement of spatiotemporal resolutions, the ability of climate models to simulate extreme precipitation has greatly improved [
11,
12,
13,
14,
15,
16]. The latest assessment report of the sixth phase of the Coupled Model Intercomparison Project (CMIP6) states that the capacity of the CMIP6 models to simulate extreme precipitation events in tropical regions is superior to that of the fifth- and third-phase models in terms of spatial modality. The simulated intensity of terrestrial extreme precipitation surpasses that in marine areas; however, a certain degree of frequency error remains [
17,
18].
Furthermore, due to rapid urbanization and the growing population density, issues such as climate risk and population exposure caused by extreme precipitation events have become increasingly pronounced [
19,
20]. The dynamic evolution of population exposure risk is greatly influenced by changes in extreme precipitation events. In the future context of continuous warming, the risk of population exposure to extreme precipitation in high-emission scenarios far exceeds that in low-emission scenarios [
21]. The Scenario Model Intercomparison Project of CMIP6 adopts shared socioeconomic pathway (SSP) emission scenarios, which incorporate future population estimates, anthropogenic emissions, and land use changes. The resolution of the population estimate data in this version is higher than in previous versions, thereby helping improve the estimation accuracy of the risk of population exposure to extreme precipitation [
22]. In densely populated areas in East China, relative to 1.5 °C global warming, the population exposure to extreme precipitation will increase by 2.3% at a 2 °C global warming threshold. This will further exacerbate the impacts on future regional economic development and ecosystems [
23].
Henan, a populous province in East China, lies within a transitional climate zone between the south and north. Against the backdrop of global warming, the intensity and frequency of regional extreme precipitation events have noticeably increased. Different magnitudes of global warming in the future will lead to a significant increase in extreme precipitation events in East Asia [
24,
25,
26]. Large-scale anomalous circulation interactions and extreme precipitation events are intimately linked to climate change issues in Henan. Over the past few decades, Henan has suffered numerous extreme precipitation events, which have caused severe economic losses and casualties. For instance, during an extreme rainfall event that began on 17 July 2021, Henan experienced extreme heavy rainfall; the peak hourly rainfall in Zhengzhou City was 201.9 mm, breaking the record for hourly rainfall in major global cities. This long-duration, high-intensity, extreme rainfall event completely halted ground transportation, caused severe urban flooding and 302 deaths, and incurred direct economic losses exceeding CNY 53 billion.
Hence, the trend of extreme precipitation changes in Henan should be estimated quantitatively, based on the latest CMIP6 models, and the exposure risk of its population should be ascertained to help mitigate the impact of future extreme flood disasters. These measures have significant implications for disaster prevention and reduction efforts and the sustainable development of Henan.
2. Data and Methodology
2.1. Research Data
Climate models are the primary tools for exploring climate change mechanisms and predicting future climate patterns, providing valuable data and reference points for scientific research. Global research institutions have developed various climate models, with different organizations employing different parameterization schemes for physical processes. To evaluate the performance and differences of these models, the World Climate Research Program initiated CMIP6. CMIP6 has made commendable progress in designing standardized climate model experiments, establishing shared data formats, and developing mechanisms to share climate simulation data with the global scientific community.
This study employs precipitation data sets from historical experiments on 20 CMIP6 global climate models and four SSP scenario trials (SSP1-2.6, SSP2-4.5, SSP3-7.0, and SSP5-8.5) (
Table 1). The historical simulations correspond to the period of 1985–2014. For future projections, SSP1-2.6 represents a low radiative forcing scenario, SSP2-4.5 and SSP3-7.0 represent moderate radiative forcing scenarios, and SSP5-8.5 represents a high radiative forcing scenario. This study uses CN05. 1 daily rainfall observation data to evaluate the CMIP6 model’s ability to simulate the extreme rainfall index in the years 1985–2014 [
27,
28]. Given the different resolutions of the observational data sets and the CMIP6 models, the CMIP6 model data are uniformly interpolated to a spatial resolution of 1.0° × 1.0° grid points using bilinear interpolation to facilitate comparison. Nine extreme precipitation indices recommended by the Expert Team on Climate Change Detection and Indices (
Table 2) are used to estimate future changes in extreme precipitation events.
The projected size and spatial distribution of future populations are crucial drivers of global change and key determinants of population exposure to hazards and vulnerability. Spatial population projections are widely used for the spatial forecasting of land use, energy use, and emissions, and for assessing the impacts of extreme events, sea-level rise, and other climate-related outcomes. The National Center for Atmospheric Research and the City University of New York Institute for Demographic Research (NCAR–CIDR) have provided a new global spatial population forecast that is consistent with the SSPs in terms of quantity and quality. The SSPs are designed to reflect various worlds with low-to-high mitigation and adaptation challenges. The primary differences among the SSPs stem from their assumptions about global population growth, educational opportunities, urbanization, economic growth, resource availability, technological development, and demand drivers (such as lifestyle changes). This study uses population data from five SSPs: SSP1 is a sustainable development pathway, SSP2 is a middle-of-the-road pathway, SSP3 is a regional rivalry pathway, SSP4 is an inequality pathway, and SSP5 is a fossil fuel development pathway.
2.2. Research Methodology
The performance of the extreme precipitation indices simulated using the climate models in terms of spatial distribution and interannual variability is evaluated using the following indicators:
(i) The correlation coefficient (
COR) is commonly used to quantify the similarities between different climate models.
X is the climatology of a certain characteristic from the model, and Y is the corresponding observational data over a historical period. A higher
COR value indicates a stronger correlation between the climate model and the observed values.
(ii) The ratio of standard deviation (
RSD) is used to identify variations between the climate model and the observed values.
where
and
represent the dispersion of the model and observed data, respectively. A value closer to unity signifies a better variability match between the model simulation and the observational data set [
29].
(iii) The root-mean-square error (
RMSE) measures the deviation between the climate model and the observed values [
30].
where
X and
Y are the extreme precipitation indices calculated based on the CMIP6 model simulation and CN05.1 data set, respectively. An
RMSE closer to 0 indicates superior model performance.
The relative
RMSE (
RMSE’) is used to quantitatively estimate the empirical reliability and robustness of the climate model.
where
RMSEMedian is the median
RMSE of the existing models. Typically, a negative (positive)
RMSE′ suggests that the simulation performance is superior (inferior) to that of most models [
31,
32,
33].
(iv) The interannual variability skill (
IVS) score is a symmetric variability statistic used to quantify interannual variability, with smaller values indicating better consistency with observed values. Here, it is used to evaluate the interannual variability of the CMIP6 output relative to the observational data set for historical forcings.
where
SDm and
SDo are the interannual standard deviations of the CMIP6 model runs and observed data, respectively [
34,
35].
Estimating future changes in population exposure to extreme precipitation events is key to understanding future vulnerability. It plays a crucial role in future policy-making and the implementation of climate change mitigation measures. The number of extreme-event days is multiplied by the population at each corresponding grid point to calculate the population exposure to extreme precipitation events. This study defines an extreme precipitation event as a day where precipitation exceeds the 95th percentile in the same period in history (1961–1990). These data are combined with population forecasts for the SSPs to estimate the characteristics of population exposure to extreme precipitation events in Henan [
21,
25,
36,
37].
where Δ
E represents the change in population exposure relative to the chosen historical period (1985–2014),
P1 and
C1 denote the population size and number of extreme precipitation event days during the historical period, respectively, and Δ
P and Δ
C are the changes in the population size and number of extreme precipitation event days in different future emission scenarios relative to the historical period.
3. Results
3.1. Historical Evolution Characteristics of Extreme Precipitation in Henan
The ability of the selected CMIP6 climate models to accurately simulate extreme precipitation events in Henan is a prerequisite for predicting future trends. This study evaluates the ability of these models to simulate extreme precipitation indices using the CN05.1 daily precipitation observational data for 1985–2014.
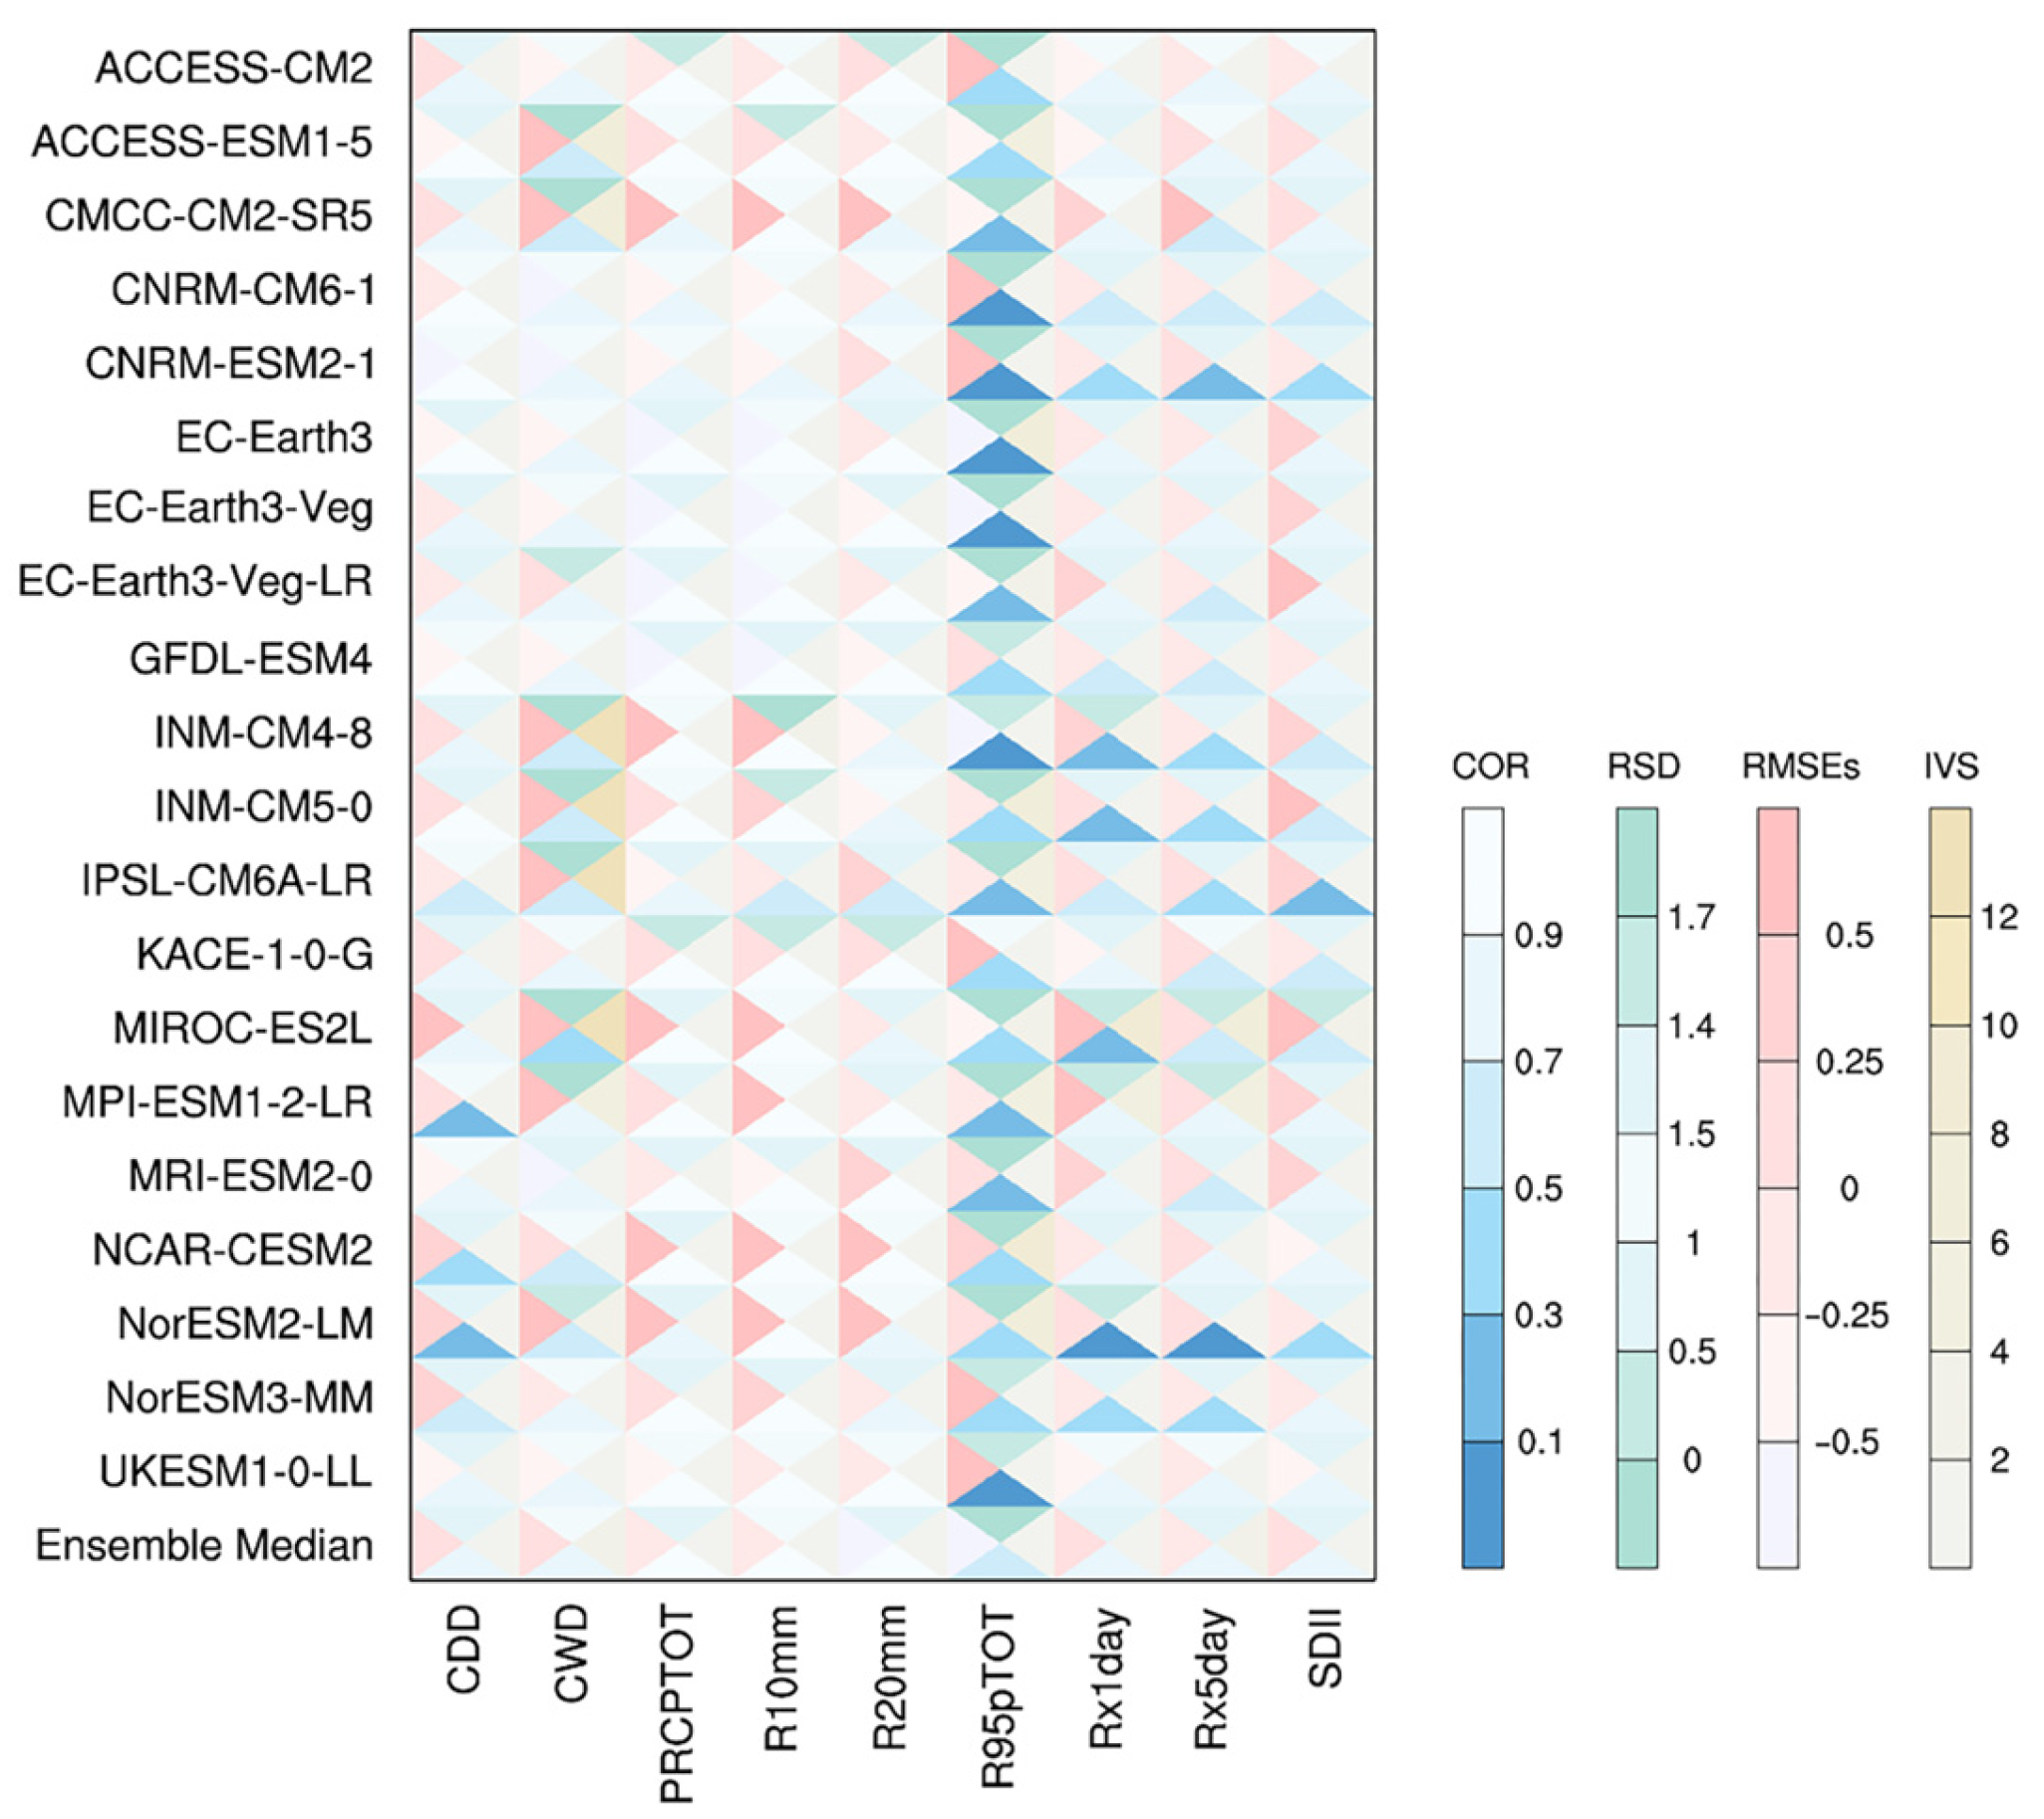
Figure 1 shows the statistical indicators used to assess the ability of the 20 CMIP6 models and their ensemble median to simulate the extreme precipitation indices relative to the 1985–2014 observational data. The results indicate considerable disparities in the ability of the models to simulate the extreme precipitation indices; the same model performs inconsistently across different indices. Most models demonstrate good simulation ability across all indices except R95pTOT. The UKESM1-0-LL model displays superior ability in simulating extreme precipitation; its COR for all indices except P95pTOT ranges between 0.76 and 0.95, its
RMSEs are negative, its IVS scores are less than 1, and its RSD for all indices is ~1. The NorESM2-LM model exhibits relatively poor reproducibility, with a COR for the maximum length of dry spell (CDD) of only 0.25 and the IVS score for the annual total precipitation (PRCPTOT) reaching 7.41. The median of a model ensemble can effectively reduce systematic errors between models and present multi-model estimation results. The final row in
Figure 1 represents the median of the 20 CMIP6 models. The CORs for the simulation of the extreme precipitation indices through the multi-model ensemble median are ~0.8, and the RSD is closer to 1 than those of the single models, indicating superior simulation ability. In the subsequent discussion, the multi-model ensemble median is used to further analyze the characteristics of extreme precipitation changes in Henan in the middle and at the end of this century to reduce inter-model uncertainty.
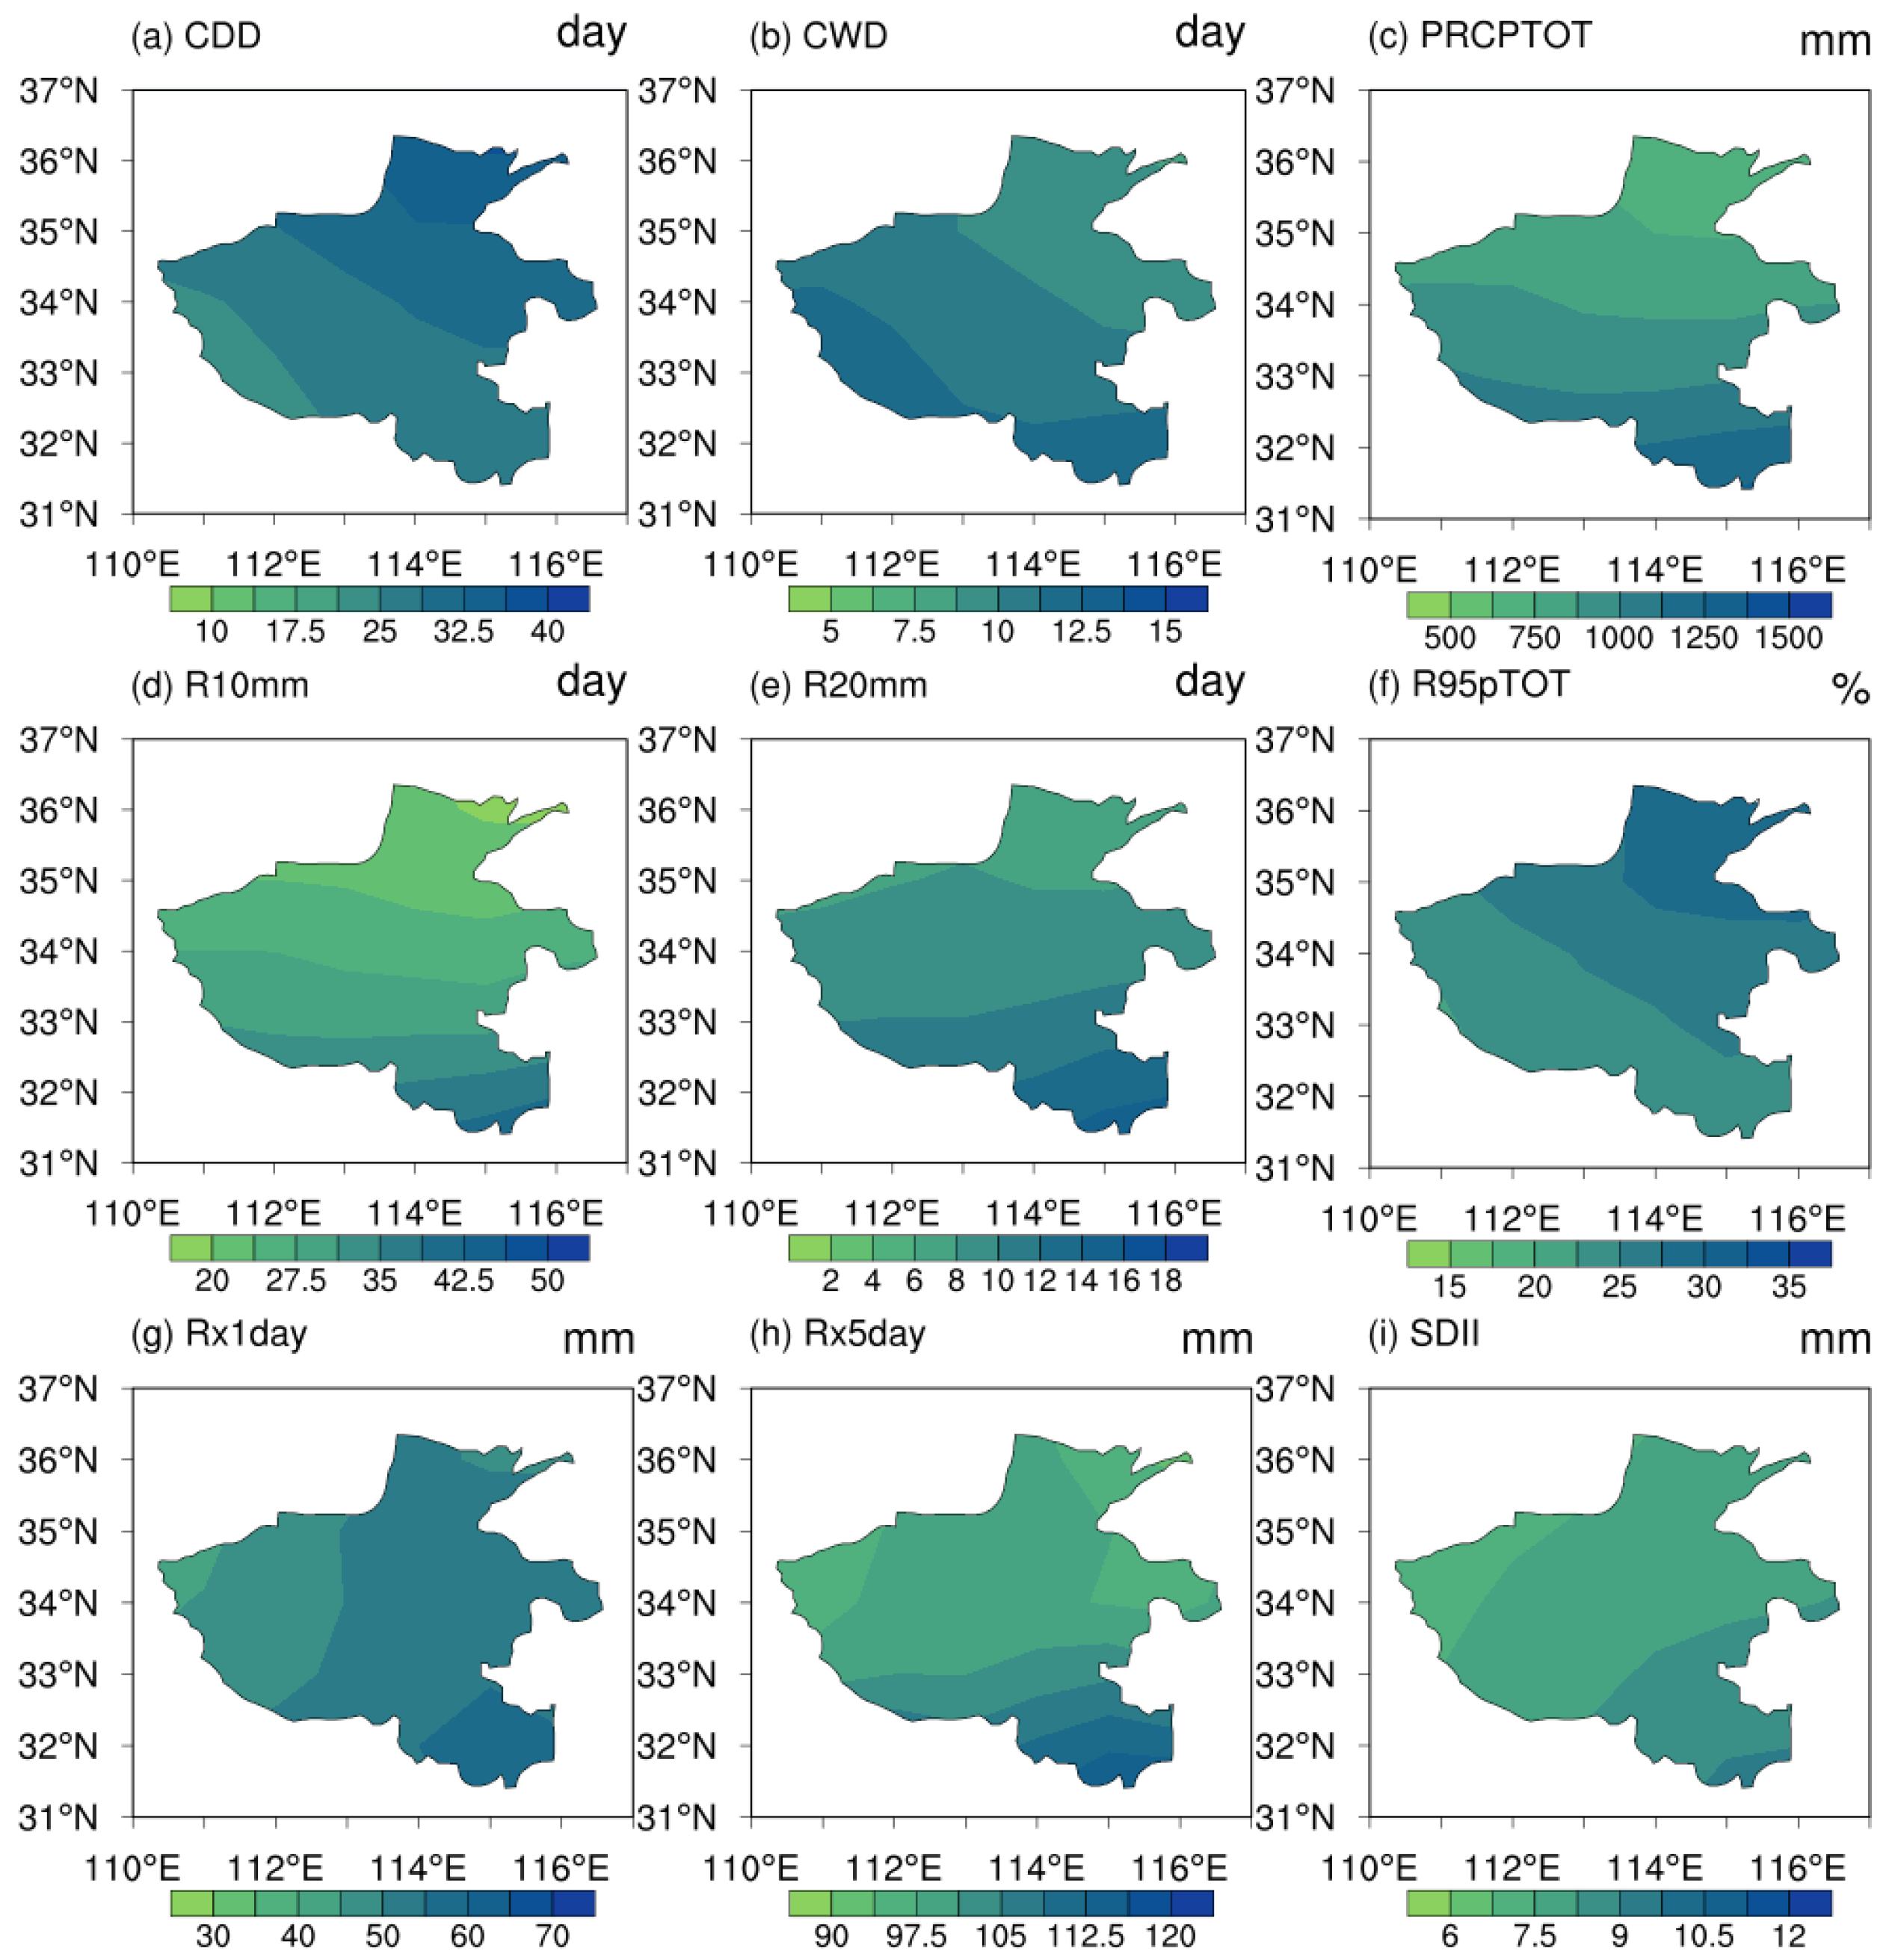
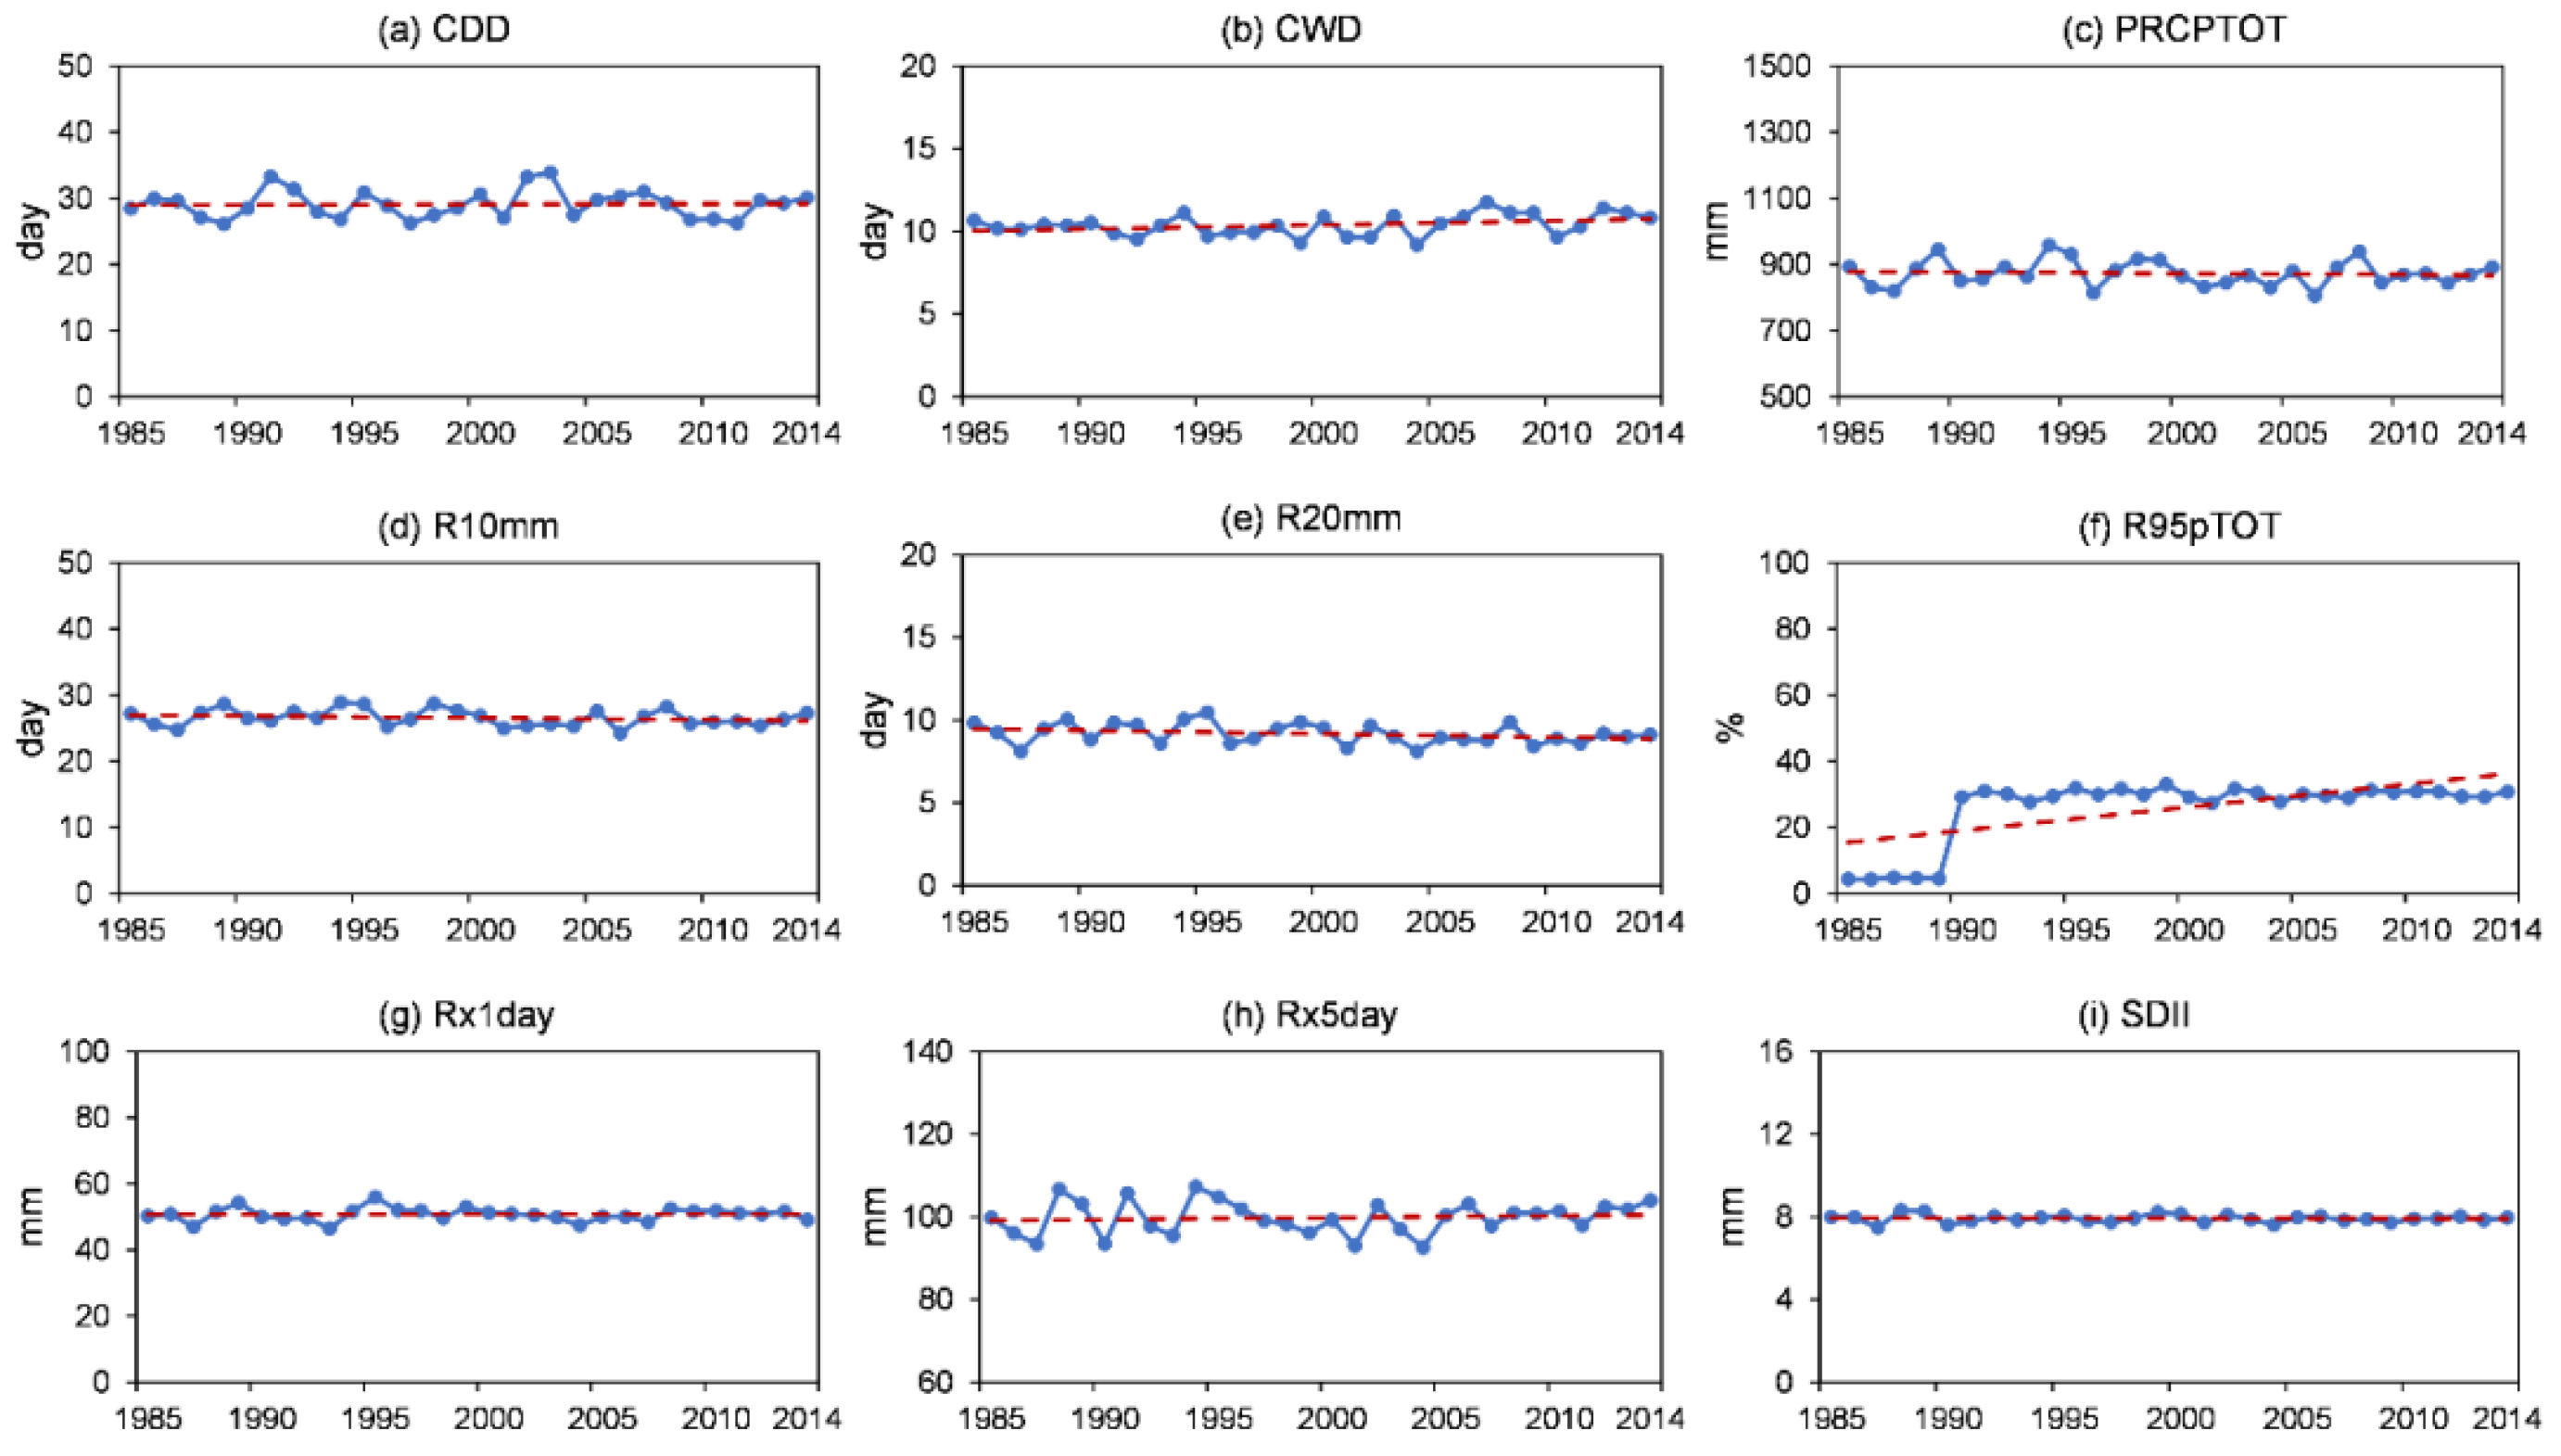
Figure 2 and
Figure 3 delineate the spatiotemporal trends of the extreme precipitation indices in Henan during the historical period (1985–2014). Herein, CDD (CWD) represents the maximum number of consecutive dry (wet) days; PRCPTOT refers to the annual total precipitation; R10mm and R20mm are the extreme precipitation frequencies; and R95pTOT, Rx1day, Rx5day, and SDII are the extreme precipitation intensities. The interannual variations in CDD and CWD are relatively gentle, with an approximate inverse spatial distribution. The northeast is a high-CDD-value, low-CWD-value area, whereas the west is a low-CDD-value, high-CWD-value area. In particular, the longest dry spell in Henan can last 40 days (in the northeast), and the longest wet spell can last 15 days (in the west and south). PRCPTOT exhibits a slightly declining interannual variation during the historical period, with the southern region consistently showing high precipitation. R10mm and R20mm can last for ~30 days and 10 days, respectively, across the entire province, with their maximum values also situated in the south. However, R95pTOT did not reach the 95th percentile until before 1990, when it stabilized, and its high values are concentrated in the north. Overall, these results suggest that the changes in extreme precipitation events from 1985 to 2014 are not substantial, and the spatial distribution of extreme precipitation is heterogeneous.
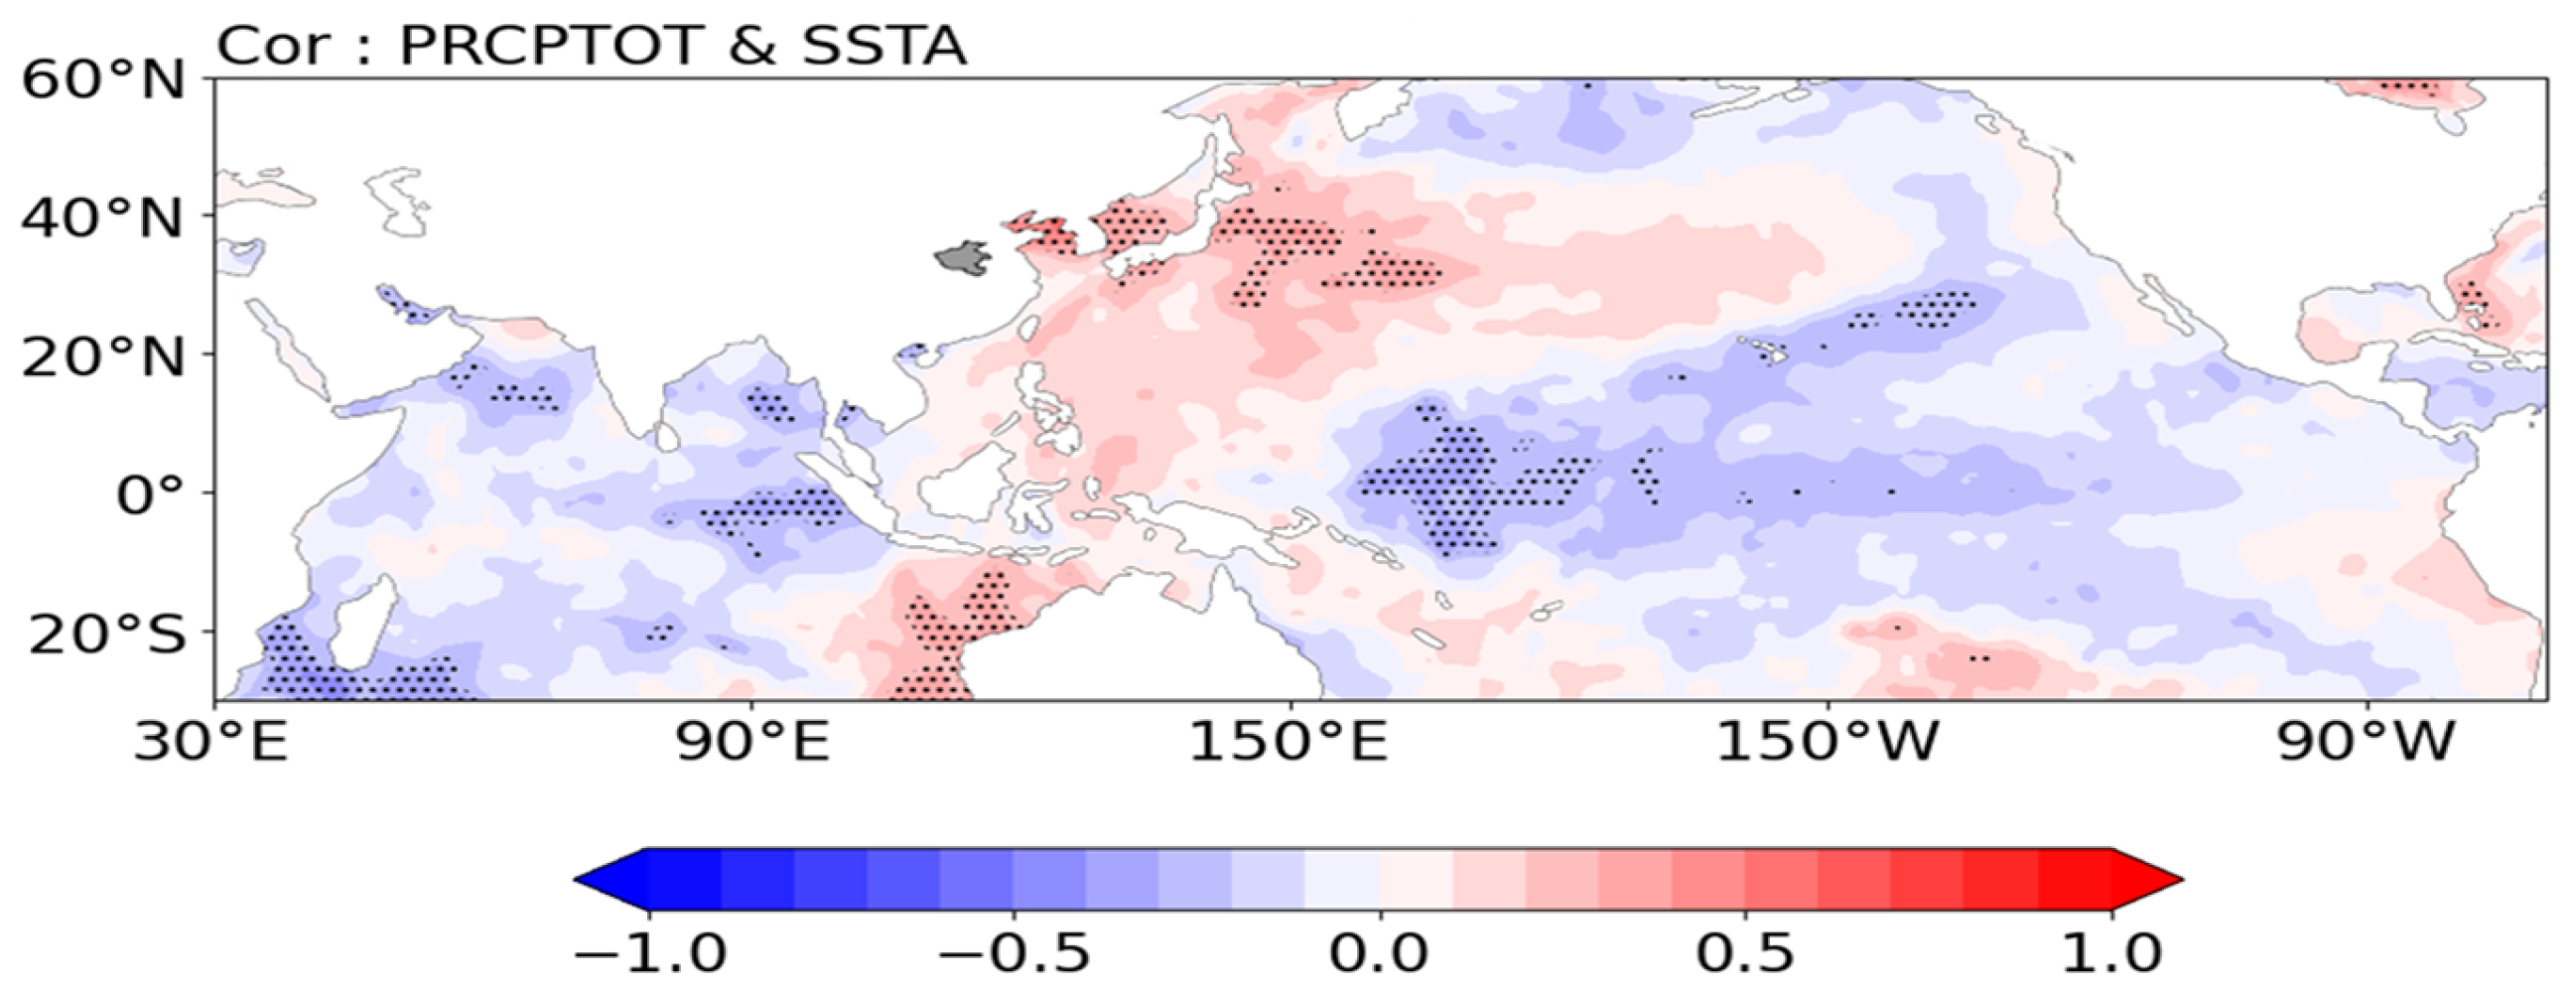
As crucial components of the global climate system, the oceans play an instrumental role, as their temperature variations directly influence atmospheric circulation and meteorological processes, affecting local precipitation. Under the influence of local sea–air anomalies, even Henan, which is situated inland, is susceptible to sea temperature anomalies. The correlation analysis between PRCPTOT and sea surface temperature anomalies (SSTAs) (
Figure 4) reveals a positive correlation between precipitation in Henan and the SSTAs in the Northwest Pacific and Western Australia; a likewise negative correlation is observed between the SSTAs in the central and eastern equatorial Pacific Ocean and the northern Indian Ocean and the annual precipitation in Henan. The modal distribution reflects SSTAs similar to those during La Niña; during such events, the abnormal precipitation in Henan increases; during El Niño events, the abnormal precipitation in Henan decreases. Based on PRCPTOT, six strong precipitation years and six weak precipitation years from 1985 to 2014 are selected (
Table 3). The SSTA synthesis results (
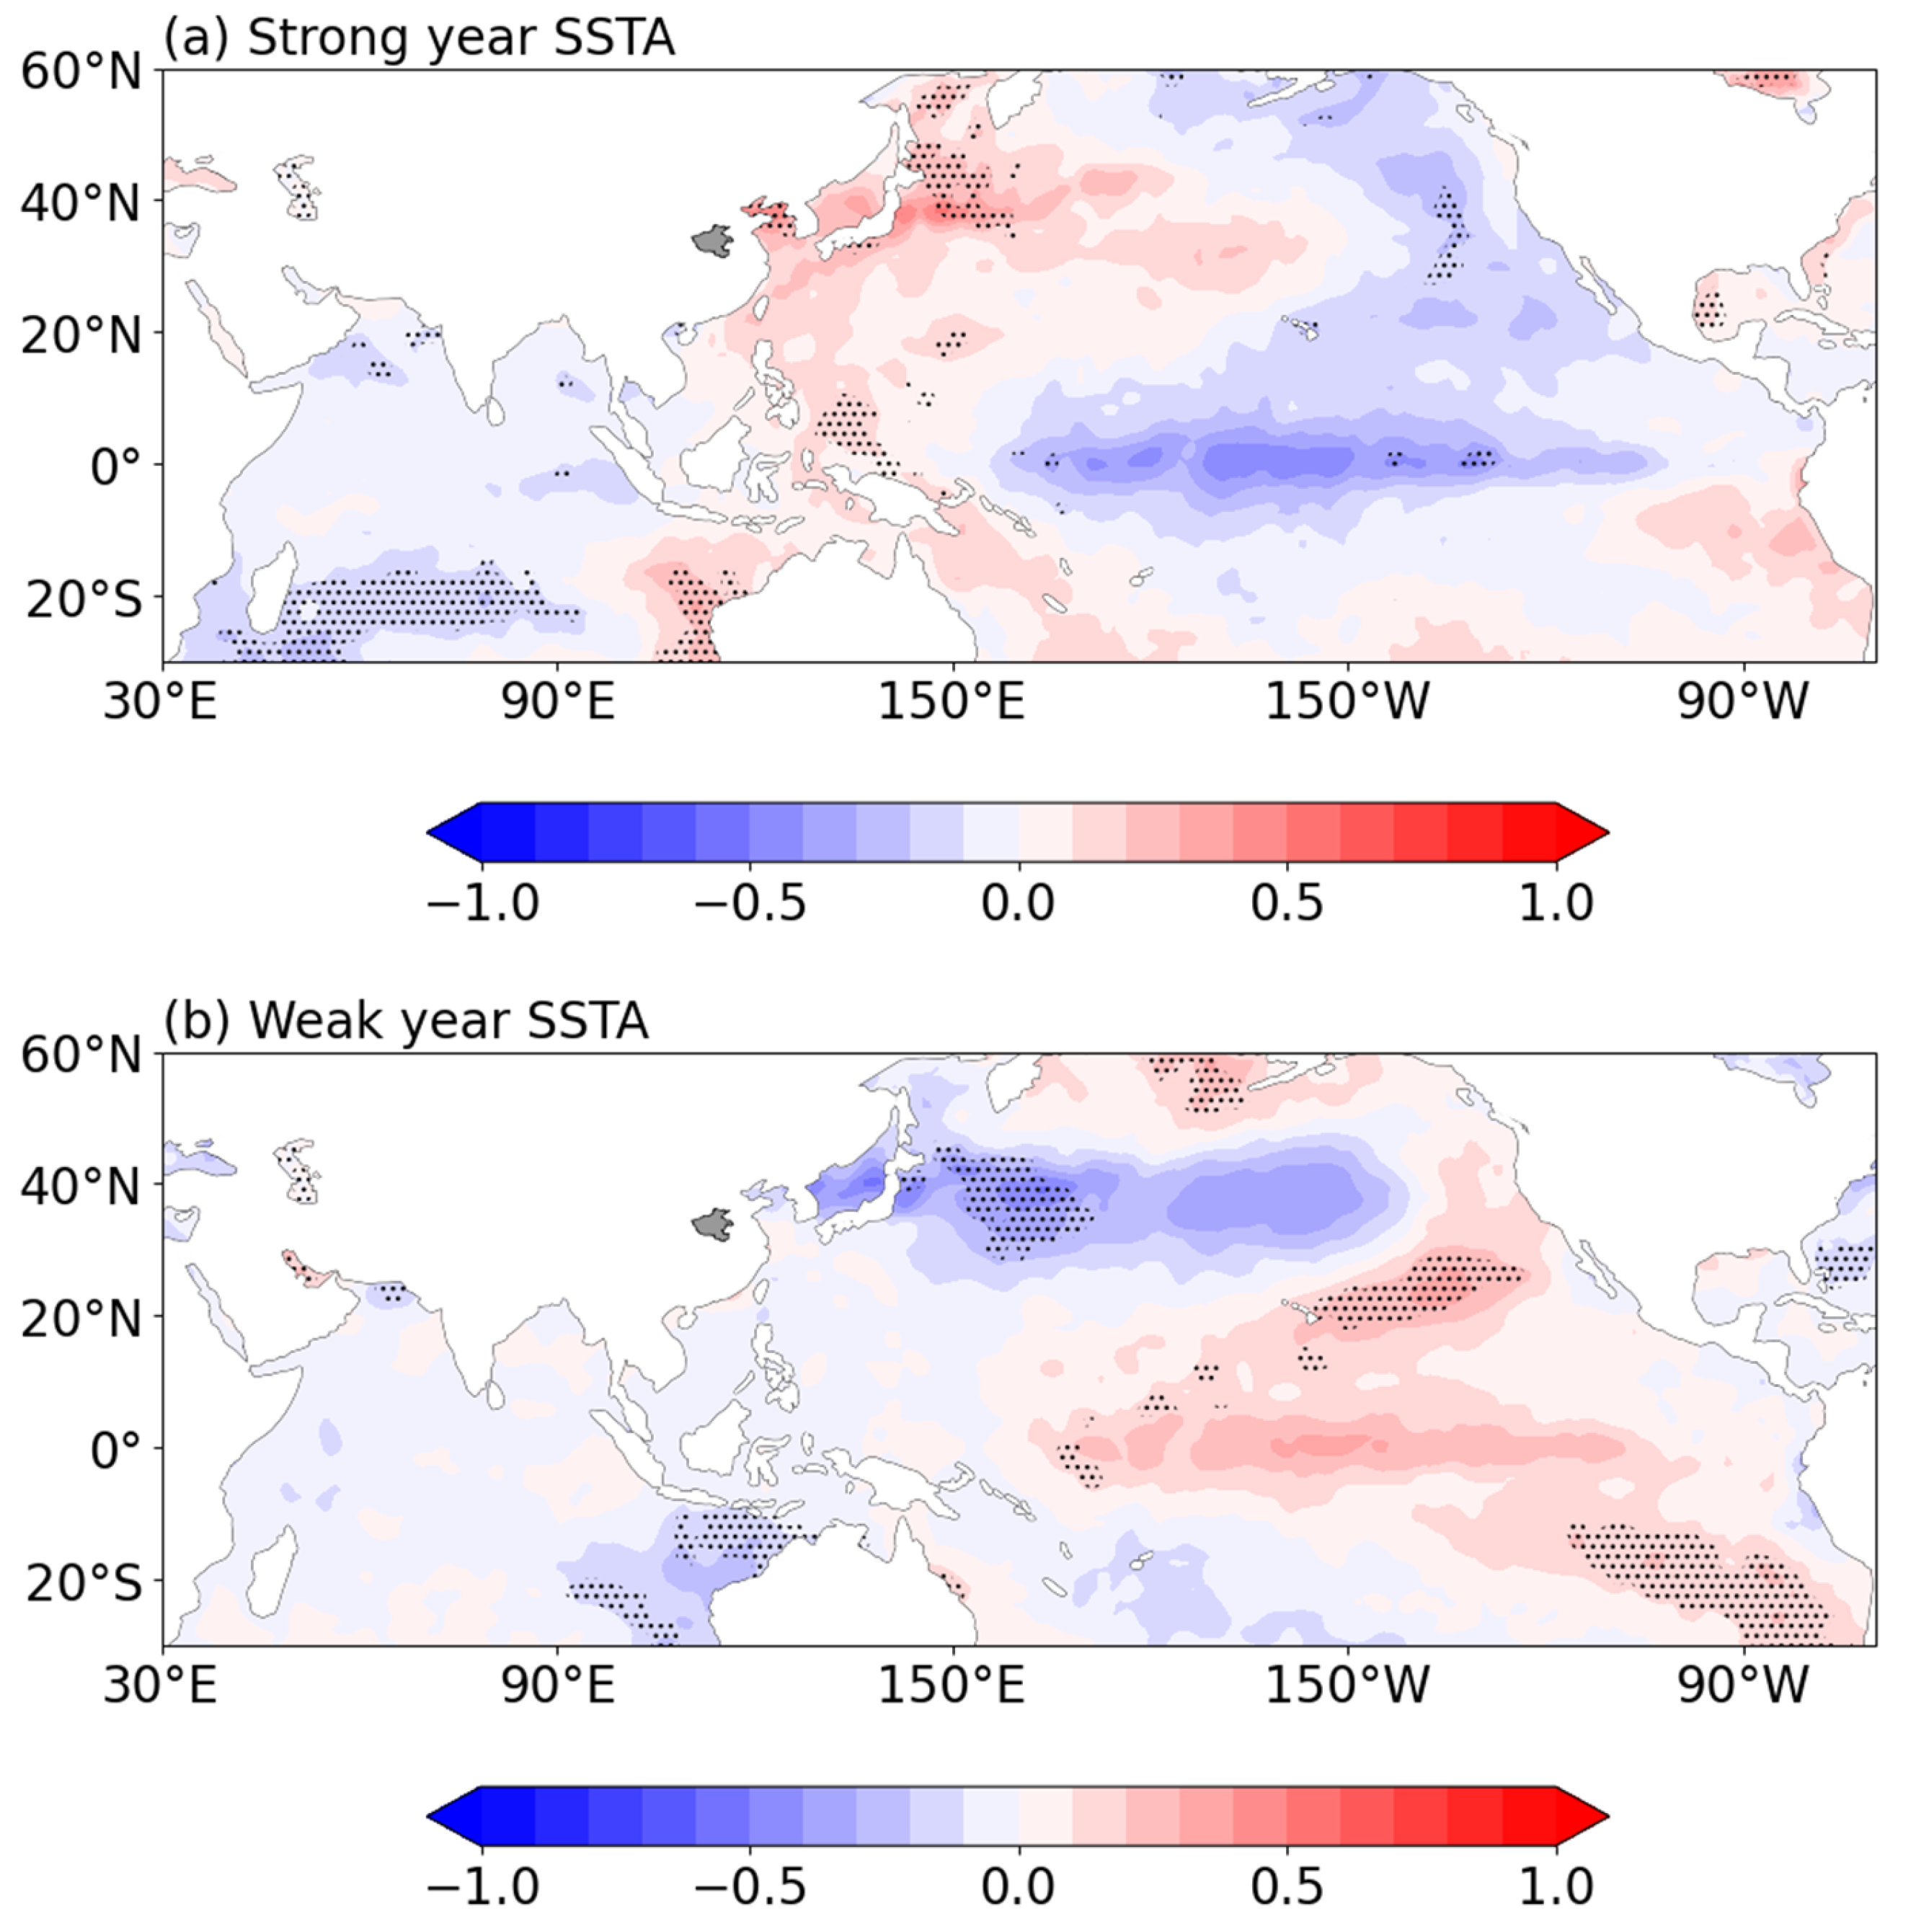
Figure 5) are consistent with the correlation analysis findings, confirming the presence of a significant relation between precipitation in Henan and the El Niño–Southern Oscillation (ENSO).
The strong and weak precipitation years in
Table 3 are used to investigate the similarities and differences in sea temperature anomalies during years of strong and weak precipitation. During the strong precipitation years, the Bohai Sea, Yellow Sea, and Sea of Japan exhibit significant positive anomalies, and the eastern part of Australia also shows a positive mode. The central and eastern equatorial regions display significant negative anomalies resembling those occurring during La Niña events. During the weak precipitation years, the East China Sea shows significant positive anomalies, which it also exhibits during years of strong precipitation; however, the Bohai Sea and the Sea of Japan exhibit weak positive and negative anomalies, respectively, contrasting their modes during the strong precipitation years. Notably, during the weak precipitation years, two conspicuous negative anomaly centers appear in the North Pacific and are approximately symmetric around the 0° meridian. In summary, the sea temperature anomaly modes in the eastern coastal area of China and the Sea of Japan can aptly indicate the annual precipitation volume in Henan. Thus, the annual total precipitation in Henan can be predicted by observing the changes in sea temperature in the aforementioned marine areas.
Synthesis analysis is conducted on vertical velocity anomalies during the strong and weak precipitation years to elucidate the atmospheric circulation context of the precipitation anomalies in Henan. As depicted in
Figure 6, during the strong precipitation years an anomalous updraft appears over Henan; furthermore, predominantly anomalous downdrafts emerge over the ocean, and are conducive to precipitation in Henan. On the other hand, during the weak precipitation years, an anomalous downdraft is observed over Henan, and a predominant updraft appears over the ocean, which indicate impending precipitation in Henan. Under the influence of local sea temperatures, the anomalous heating or cooling of the atmosphere near the sea surface results in anomalous vertical airflows, thereby forcing out anomalous circulation. Consequently, in the context of sea–air interaction, precipitation in Henan is controlled by sea temperatures.
3.2. Evolution Characteristics of Future Extreme Precipitation Events in Henan
The trends in the changes in the extreme precipitation events in Henan in the mid-21st century (2041–2070) and the late 21st century (2071–2100) relative to the studied historical period (1985–2014) are analyzed.
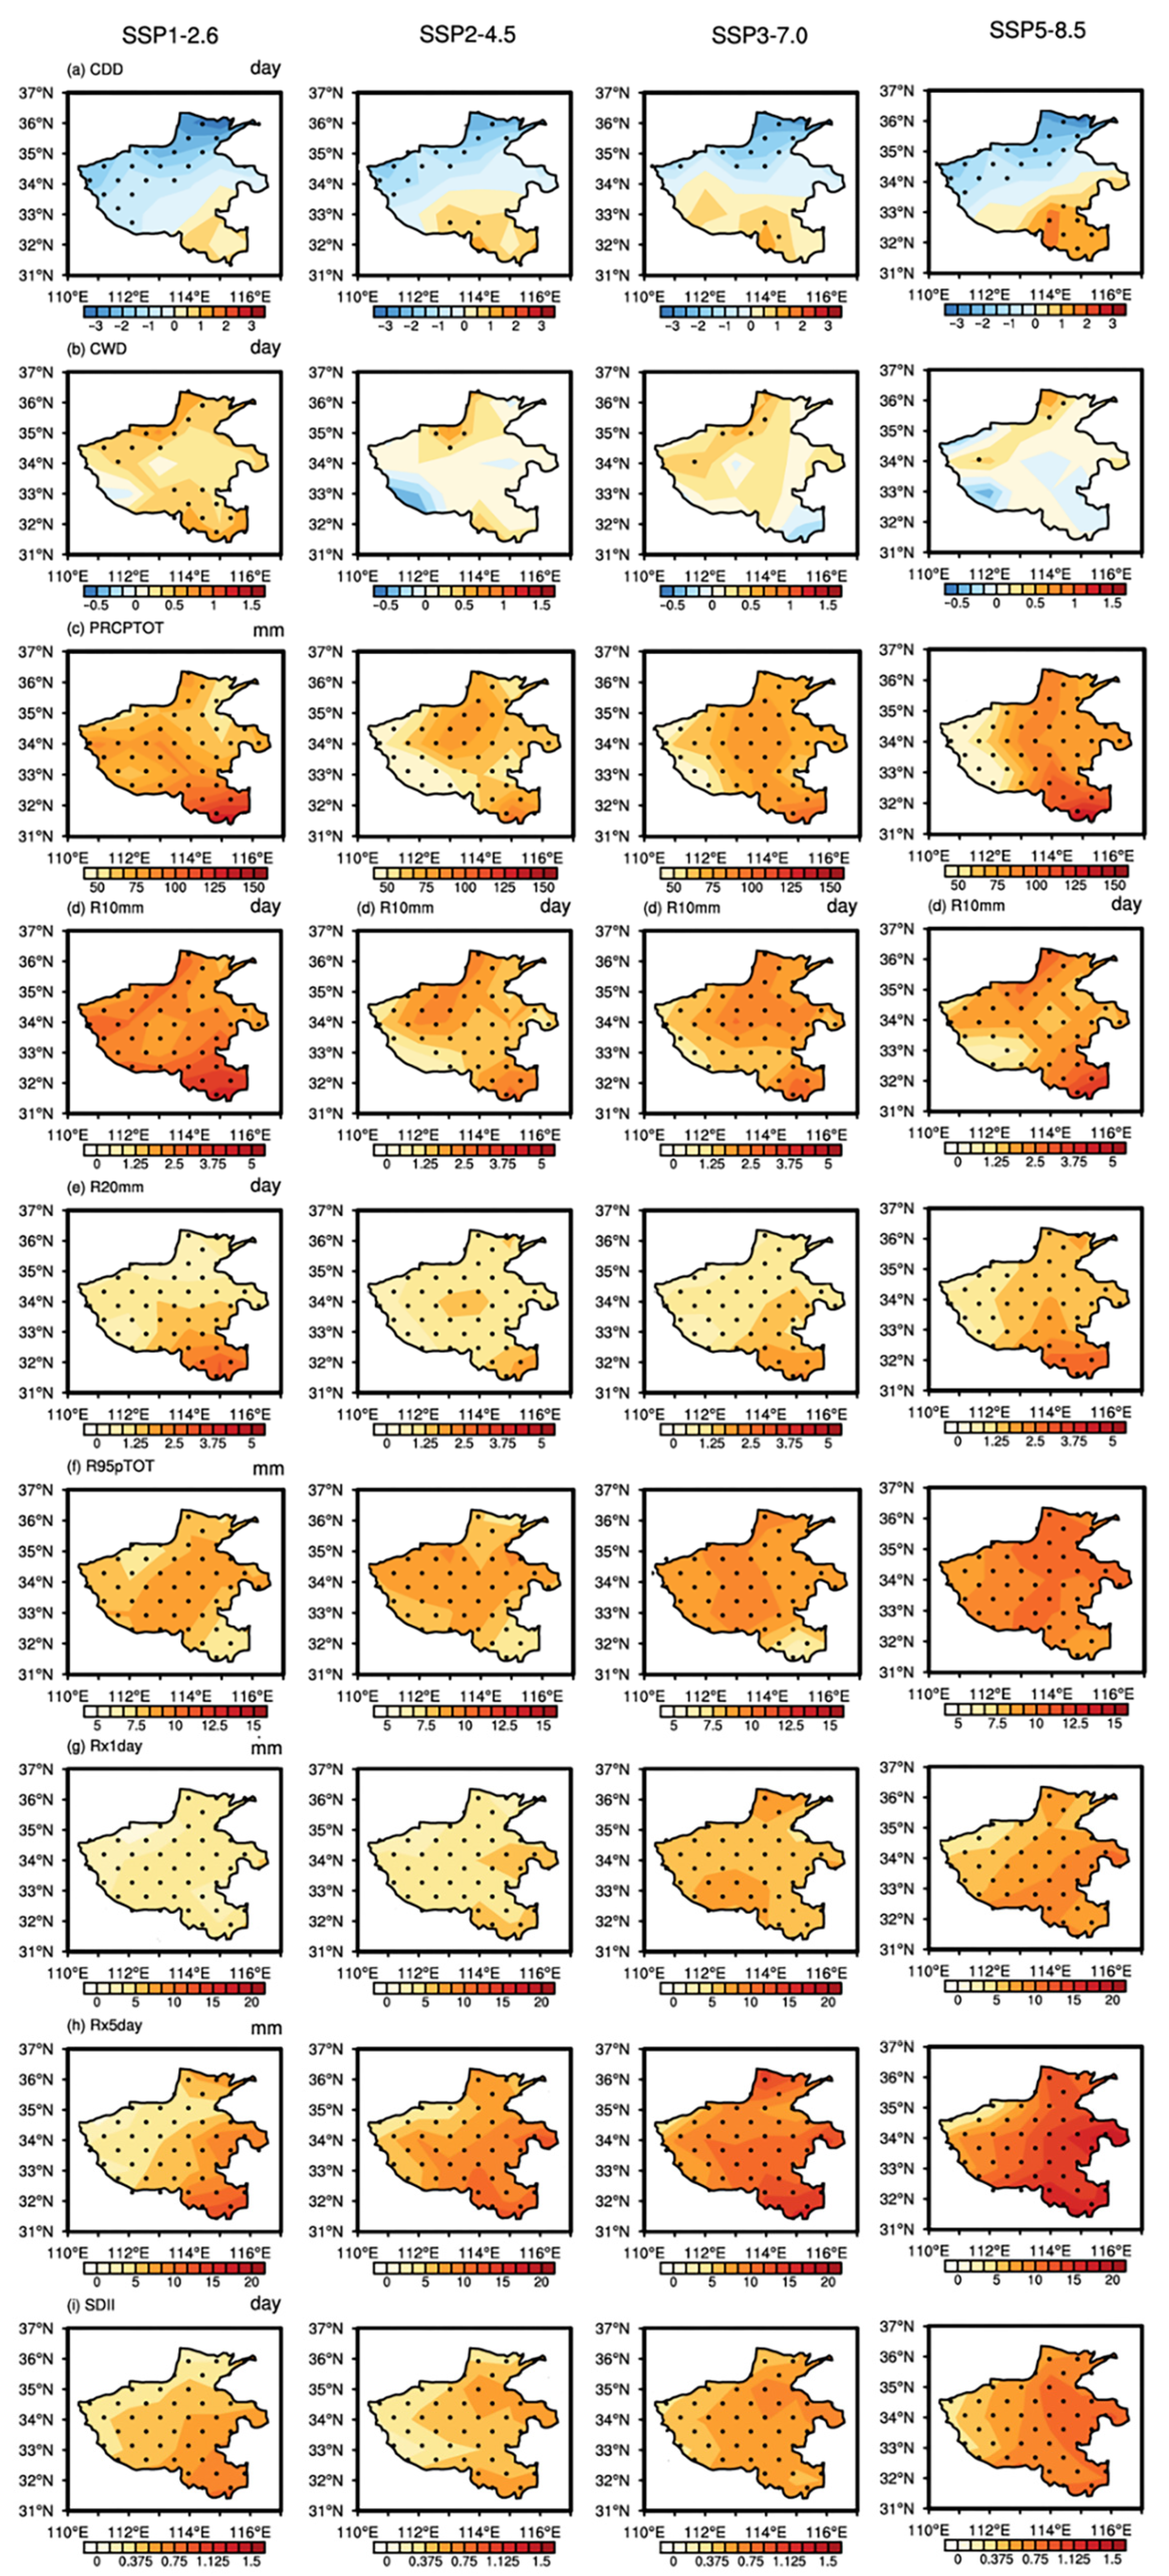
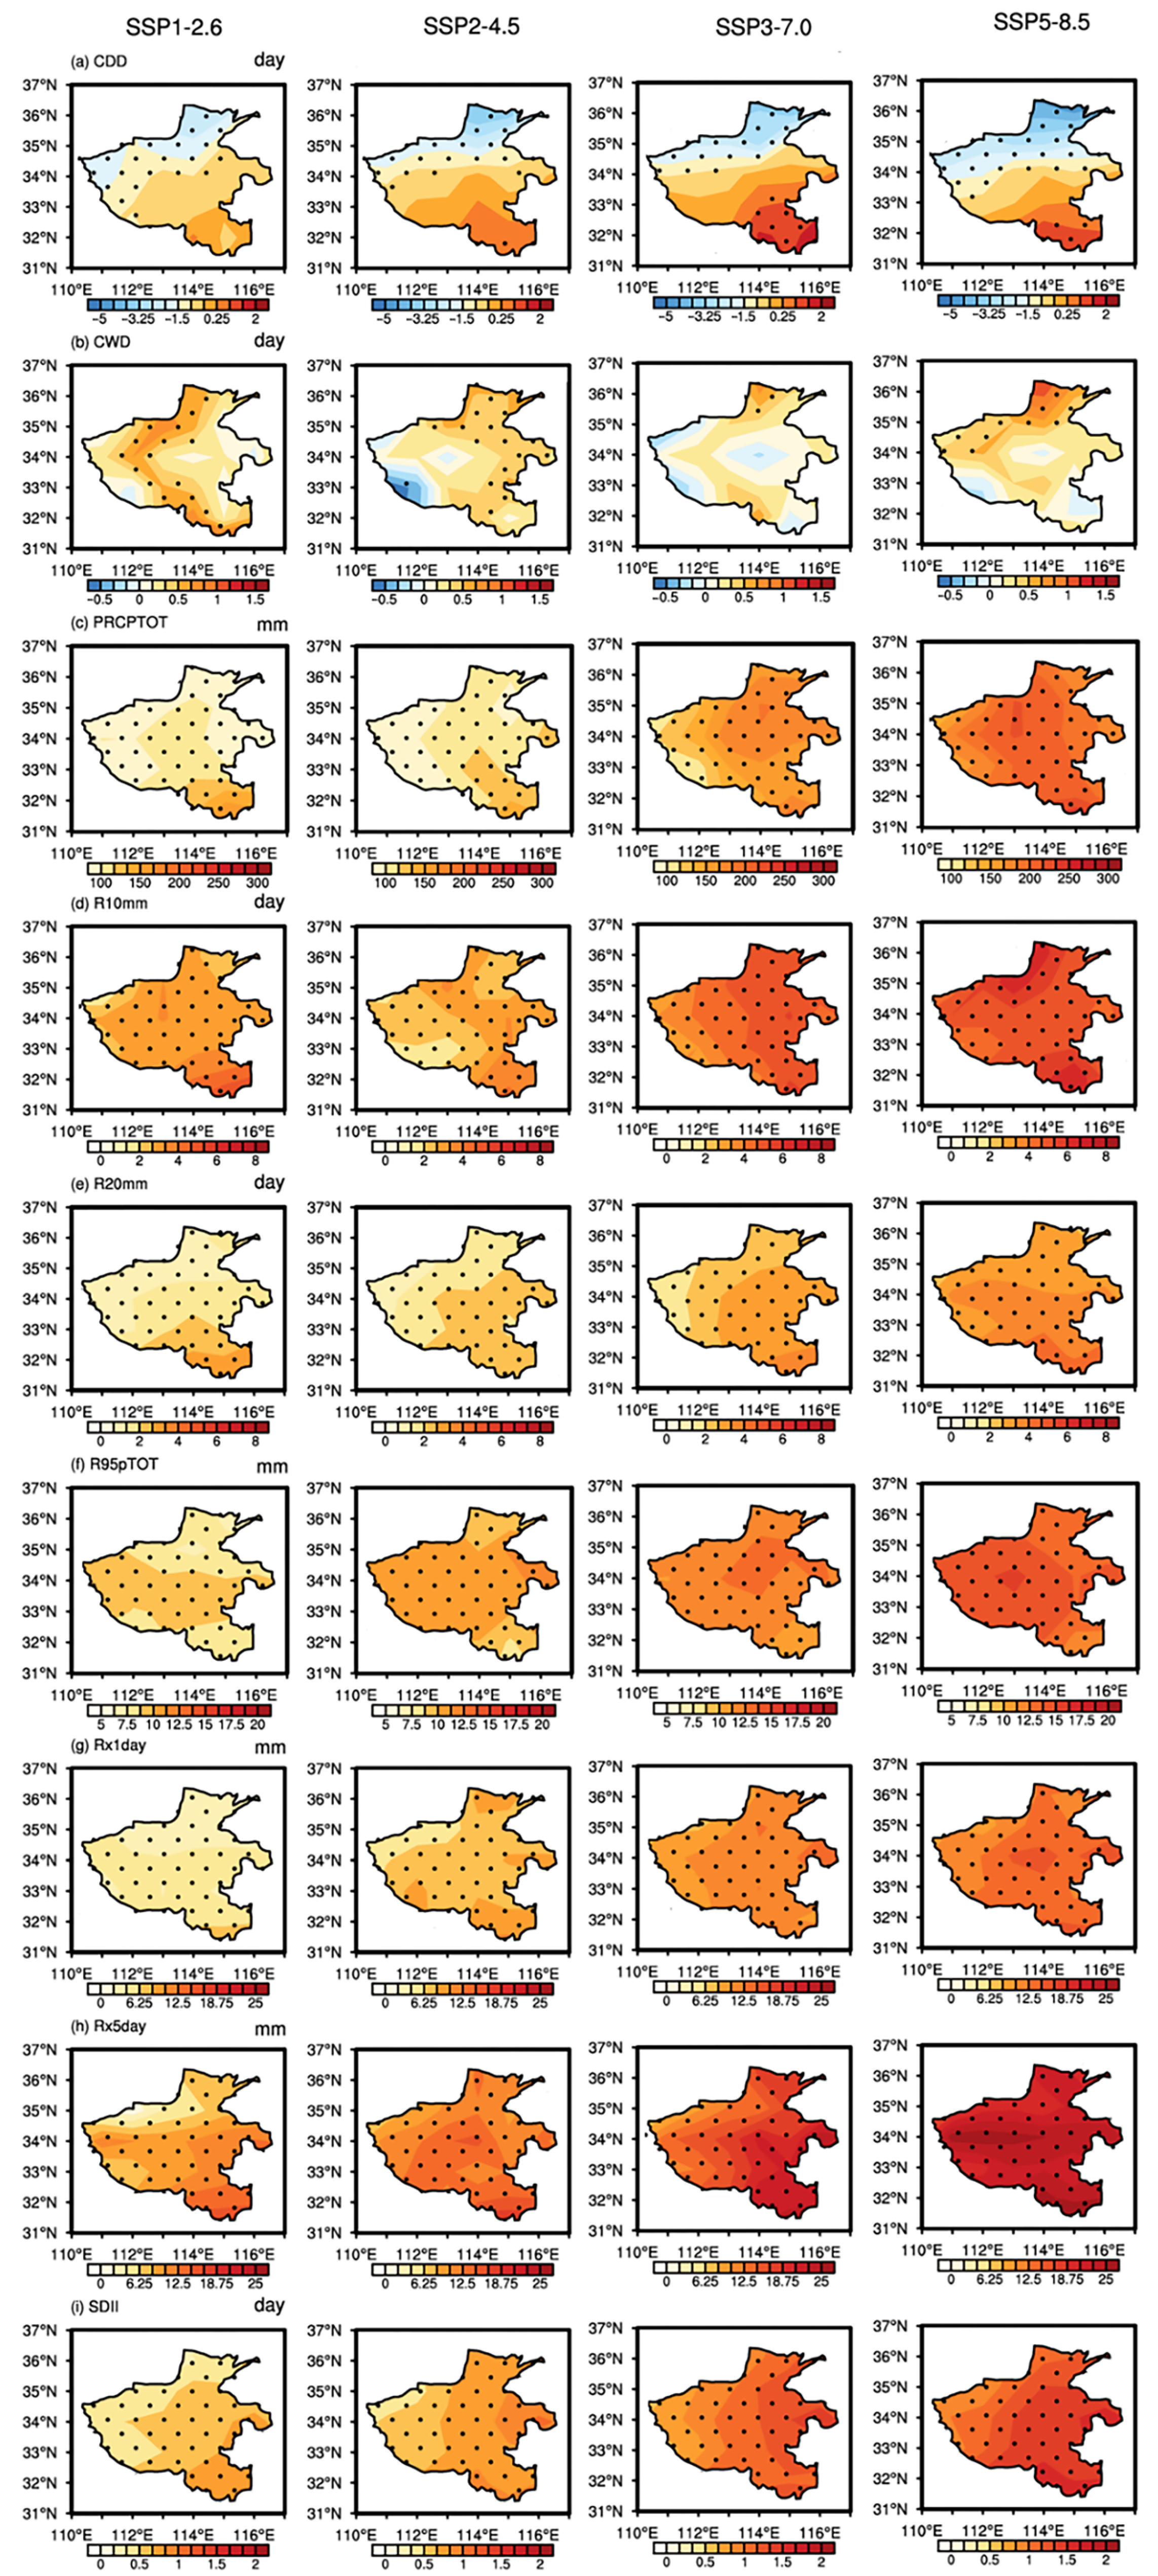
Figure 7 and
Figure 8 display the spatial distributions of the median estimates of the nine extreme-precipitation indices from the CMIP6 model ensemble. The spatial variation distributions of the indices are consistent in the four emission scenarios, indicating that extreme precipitation events will become more severe in higher-emission scenarios. The mid-century CDD shows a decreasing trend in northern Henan and a significant increase in the south, and their range will expand in higher-emission scenarios. Furthermore, in such scenarios, regions with increasing late-century CDD will further expand; the number of increasing days will rise with the emission level, reaching a maximum of 3 days in Xinyang. The CWD changes are less significant; most areas in Henan show an increasing trend, and considerable spatial distribution differences are seen between different scenarios, implying high uncertainty. Overall, the changes in CDD and CWD suggest that, in the context of global warming, the southern part of Henan will experience longer droughts and shorter rainy periods in this century, exacerbating the extremity of the climate.
All the other indices exhibit increasing trends. The spatial distributions of the changes in PRCPTOT, R10mm, and R20mm are consistent. Markedly higher increases are seen in the southern regions than in the other areas, with certain periods of extreme precipitation. In the mid-century high-emission scenario (SSP5-8.5), the maximum increase in PRCPTOT exceeds 150 mm, and it can be over 250 mm in the late-century period. The increases in R10mm and R20mm in the mid-century period relative to the historical period are not attributable to the increase in emission. Surprisingly, R10mm is more significant in the low-emission scenarios, with a maximum increase of over 5 days in the southern regions; the maximum increase in R20mm is 2.7 days. In the late-century period, R10mm and R20mm increase with the increasing emission levels, and the range of increase gradually expands. Although the largest number of dry days in this region slightly increases, the frequency and total amount of precipitation increase considerably. This suggests an enhancement in the extremity of precipitation, and heavy precipitation is more likely to occur in a concentrated period. Unlike the maximum values of the other indices, which are in the south, the increase in R95pTOT is considerably higher in the central regions than in the other areas. Its increment reaches 12% in the mid-century period in the SSP5-8.5 scenario and 15% in the late-century period. The increases in Rx1day and Rx5day are the most pronounced among all indices. For the entire province, the Rx5day increase relative to the historical period is nearly 25 mm in the late-century SSP5-8.5 scenario. In summary, Henan, particularly its southern regions, exhibits overall increases in the total amount, frequency, and intensity of extreme precipitation in this century. Compared with the chosen historical period, the persistence of extreme precipitation is slightly weaker, the spatiotemporal concentration of precipitation considerably increases, and the risk of flood disasters escalates.
3.3. Characteristics of Population Exposure to Extreme Precipitation Events in Henan
Henan, which is one of the most populous provinces in China, has a population of 98.72 million as of 2022. Extreme precipitation events in the context of global warming will expose more residents of Henan to various disasters, such as urban floods, floods, and landslides, posing greater threats to the local economy, life, and property. Therefore, the local government should estimate future changes in population exposure with regard to extreme precipitation events in order to implement appropriate adaptation and mitigation measures. Changes in population and extreme precipitation lead to changes in population exposure [
22,
23]. Changes in population exposure are jointly influenced by climate effects, population effects, and their synergistic effects. Equation (8) estimates the contribution of each component of population exposure (climate effects
, population effects
, and synergistic effects
) in different emission and population scenarios.
Figure 9 illustrates the estimation of changes in population exposure in Henan with regard to the different radiative forcing scenarios and population prediction paths. In the same radiative forcing scenario and population prediction path, the population exposure decreases over time on the regional scale. For instance, in the SSP1-2.6 radiative forcing scenario and the SSP1 population prediction pathway, the total population exposure decreases from 613,200 person-days in the mid-21st century to 24,000 person-days by the end of the 21st century. In the SSP5-8.5 radiative forcing scenario and the SSP5 population prediction pathway, the total population exposure decreases from 732,000 person-days in the mid-21st century to 324,000 person-days by the end of the 21st century. Comparative analysis reveals that in the same population prediction pathway, the total population exposure in the high radiative forcing scenario is greater than that in the low radiative forcing scenario, especially in Kaifeng City, where the total population exposure in SSP1 and SSP5-8.5 exceeds that in SSP1-2.6 by 2 million person-days (figure omitted). However, in the same radiative forcing scenario, the total population exposure under a high population prediction (SSP5) is not greater than that under a low population prediction (SSP1). For example, in Henan, the total population exposure in each emission scenario increases and then decreases with an increase in the population prediction. This is due to the various features of population prediction in the different pathways.
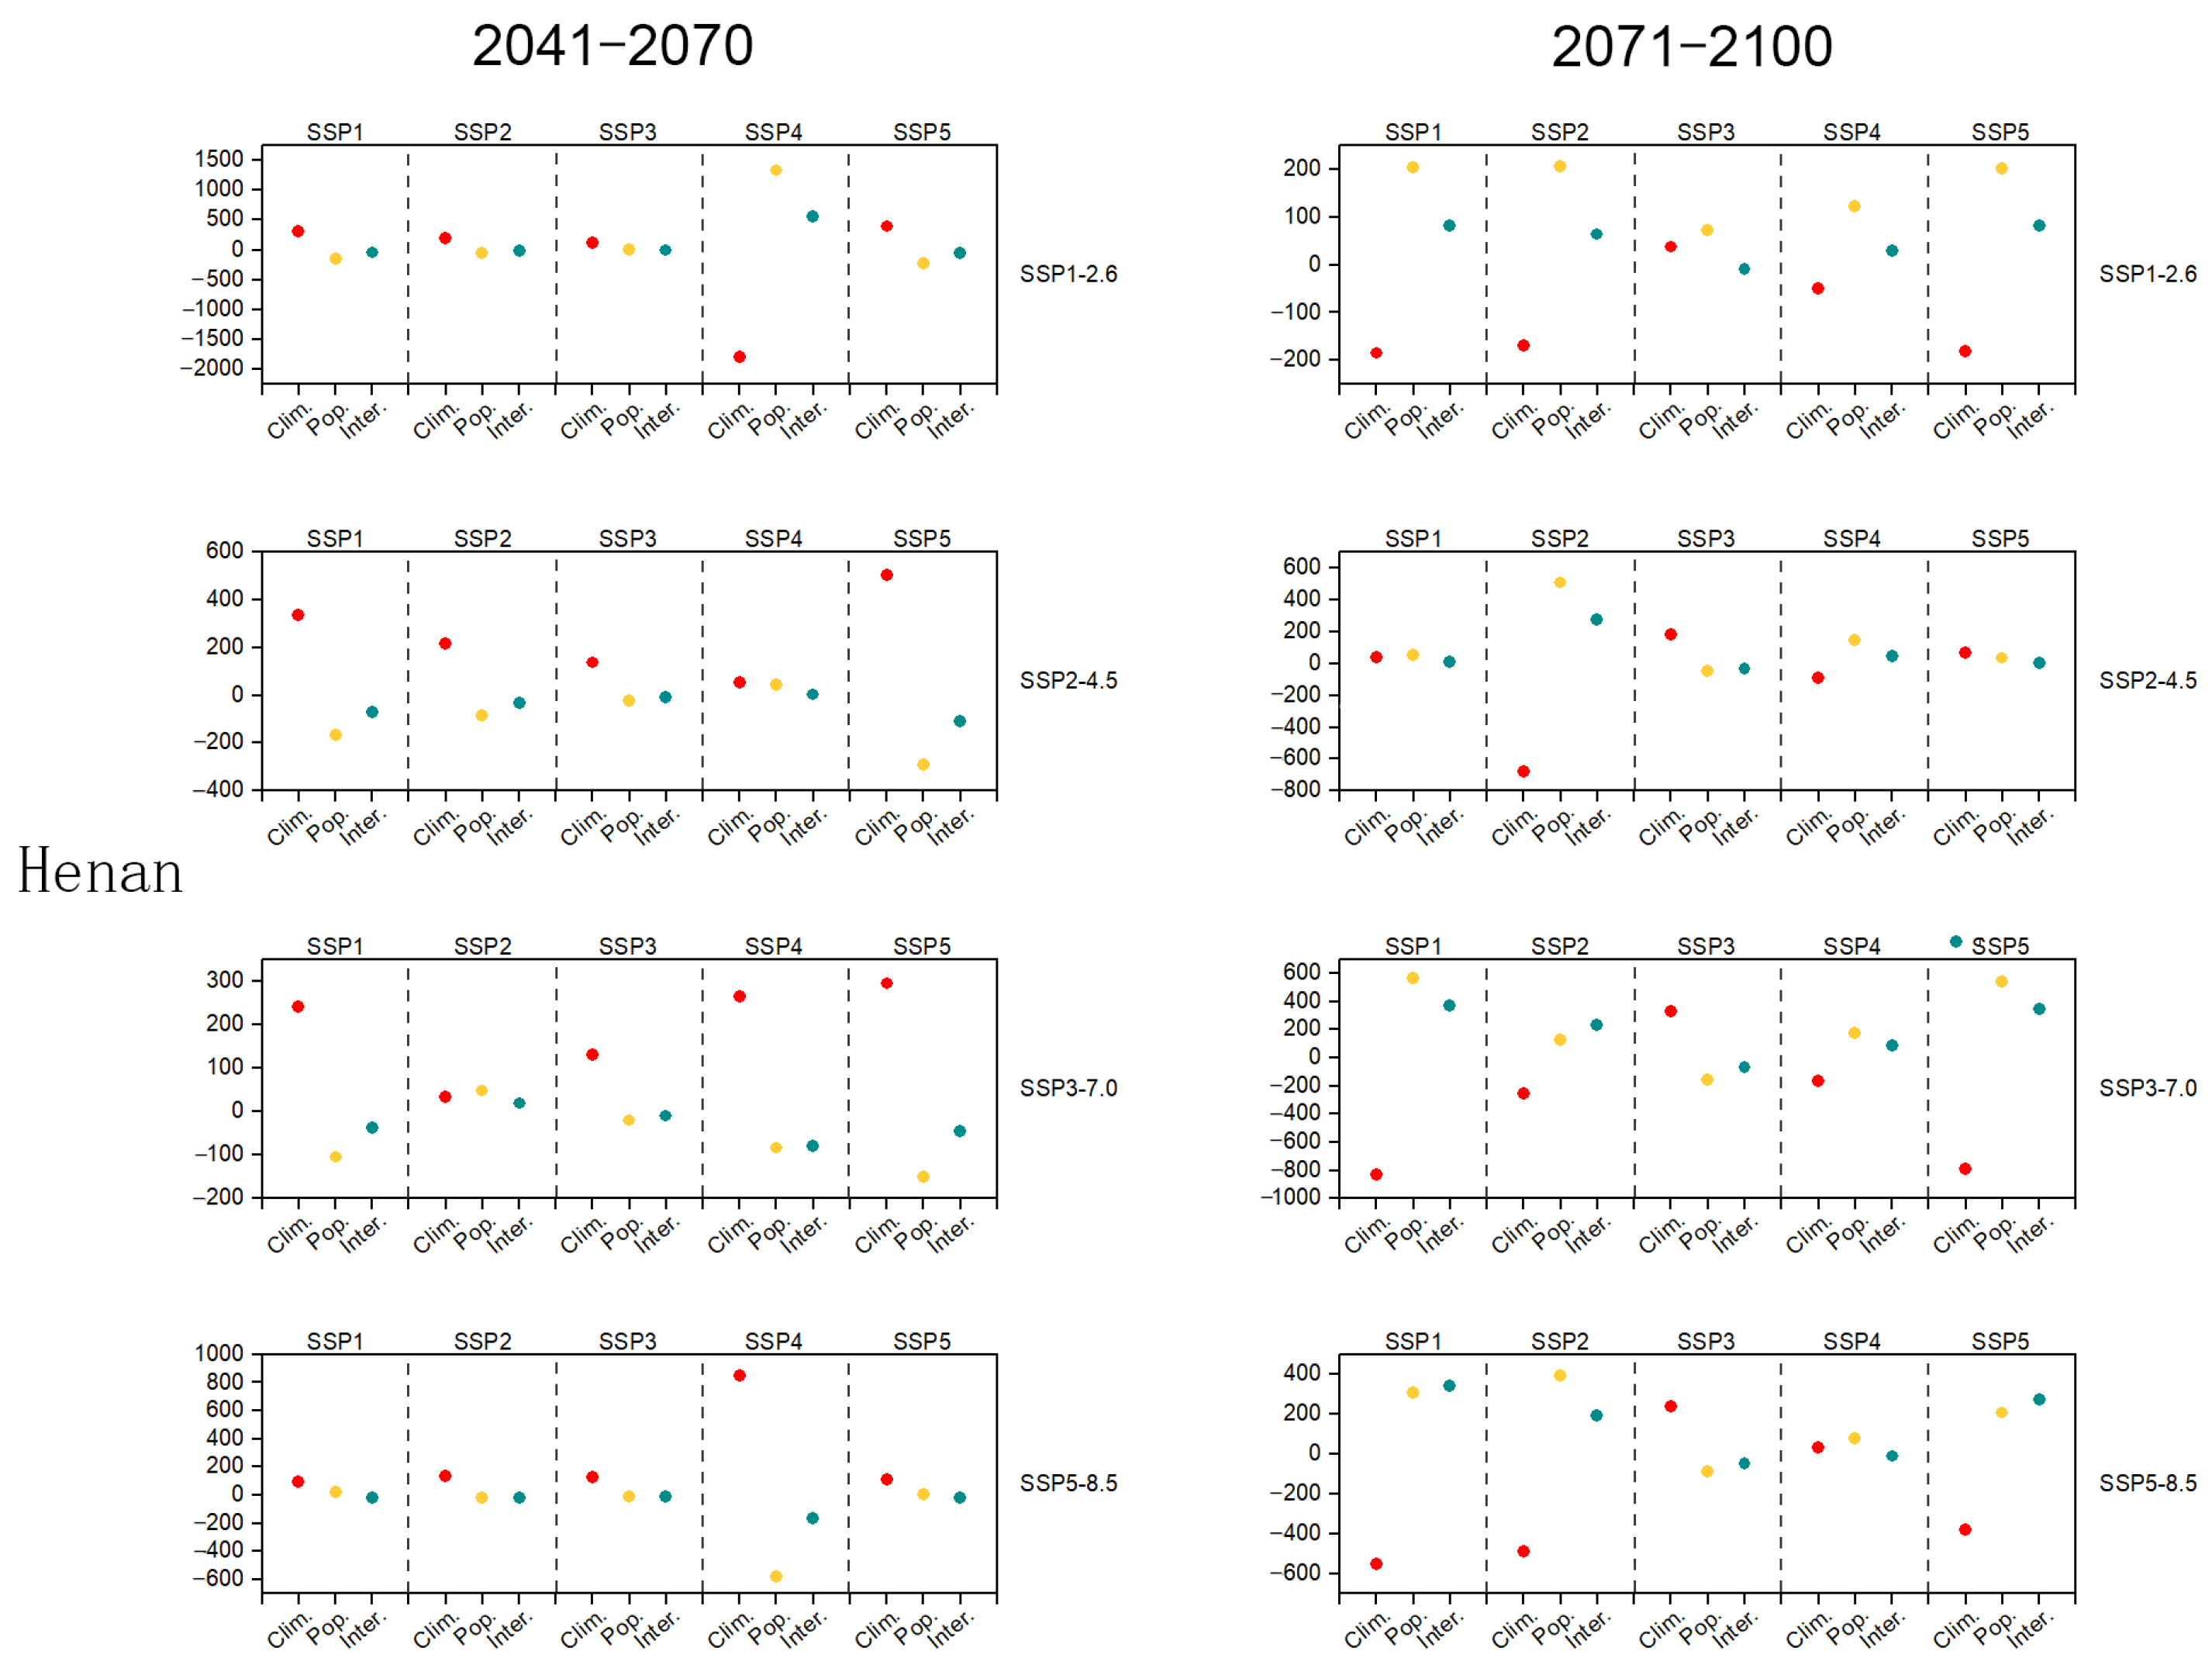
The contribution of each component to population exposure is depicted in
Figure 10. In the mid-century period, climate effects have a profound influence on the change in total population exposure. In the different radiative forcing scenarios, the contributions of the population and synergistic effects vary considerably. By the end of the century, the contribution of population effects to the total population exposure in Henan is the largest among all components. In most scenarios, the contribution of climate effects decreases or even becomes negative. Furthermore, the contribution of each component differs greatly between scenarios and population predictions. Comparative analysis of these contributions in various cities suggests that most results are consistent with the total population exposure results in Henan (figure omitted). Remarkably, in several cities, under the SSP2 and SSP3 population predictions, by the end of the century the climate effect contribution maintains a high positive rate.
In summary, for Henan, future climate change and population shifts will greatly affect population exposure. Under the same population prediction, the exposure of the population to extreme precipitation will gradually increase with global warming. Therefore, limiting global warming to reduce the detrimental effects of climate change and adopting rational development pathways are essential.
4. Conclusions and Discussion
In this study, the CN05.1 data set is used to evaluate the performance of 20 CMIP6 global climate models in simulating historical extreme precipitation events in Henan. Integrated assessment results are then used to analyze the changing characteristics of extreme precipitation events in this century in sustainable-emission (SSP1-2.6), moderate-emission (SSP2-4.5 and SSP3-7.0), and high-emission (SSP5-8.5) scenarios. The impact of future precipitation changes on SSP population data is assessed to determine the potential population exposure to extreme precipitation events due to climate and population changes. The conclusions are as follows:
- (1)
Synthesis of the strong and weak precipitation years in Henan historically presents an ENSO modality, indicating a close relation between precipitation in Henan and ENSO. To a certain extent, ENSO indicates anomalies in the annual total precipitation in Henan.
- (2)
The changes in the extreme precipitation events in Henan in this century show substantial regional differences. The total amount, frequency, and intensity of extreme precipitation in the south increase, whereas the same factors are weaker in the north as compared to the south. Extreme precipitation in Henan is temporally and spatially concentrated, leading to the possibility of heavy rainfall, which will lead to flooding and waterlogging in a short period.
- (3)
By the end of the century, population exposure to extreme precipitation in Henan will decrease compared with that in the mid-century period. The changes in population exposure across cities are consistent with those in the total population exposure in Henan. Under the same population prediction, the SSP5-8.5 scenario has a higher total population exposure than SSP1-2.6, with the population exposure of Kaifeng City being the most significant. In the same radiative forcing scenario, the total population exposure under SSP5 does not considerably increase compared with the total population exposure under SSP1.
- (4)
In the mid-century period, climate effects contribute most considerably to changes in total population exposure. Their contribution largely differs from those of population and synergistic effects. By the end of the century, population effects dominate, and their contribution rate considerably increases. In most scenarios, the contribution of climate effects decreases or even becomes negative; however, in most cities under the SSP2 and SSP3 population predictions, the climate contribution maintains a high positive rate.
Henan has been experiencing frequent extreme precipitation events in recent years, which often cause serious losses. In previous studies, there has been limited research on the potential changes in future extreme precipitation in Henan. This article analyzes the spatiotemporal changes of extreme precipitation in Henan in this century, pointing out particularly that the floods and waterlogging caused by short-term heavy precipitation will increase in the future. That is, the temperature rise tends to make extreme precipitation occur in a shorter time (within a few hours) [
38,
39,
40,
41], indicating that climate warming has significant impacts on the precipitation process in Henan, which must be closely monitored. Compared to the heavy precipitation events caused by long-term accumulation, the small-scale convective systems causing short-term heavy precipitation have the characteristics of small spatial scale, rapid development, and difficult prediction. Therefore, these systems pose greater challenges for meteorological operational forecasting, urban construction, and social emergency management. Additionally, this article also discusses the contributions of climate change and population structure adjustment to exposure risk, providing support for future Henan heavy rain catastrophe insurance design and risk assessment work.
In addition, it should be noted that complex ocean–atmosphere interactions and teleconnections, such as ENSO and the Madden–Julian oscillation, contribute to significant climate variability in the province. Presently, climate models exhibit deficiencies in simulation resolution, parameterization schemes, and physical processes, leading to substantial uncertainties in their precipitation predictions. To enhance the consistency and credibility of ensemble forecasts in response to global warming, future researchers should select models that demonstrate good simulation effects during reference historical periods or use bias correction methods to train and validate simulations during the said periods, to obtain more reliable results for potential climate change.


