Article

Can Inner Mongolia Learn from Zhejiang’s Low-Carbon Policy?—Comparative Analysis Based on the EPS Model

1
School of Economics and Management, Inner Mongolia University of Technology, Hohhot 010051, China
2
Inner Mongolia Management Modernization Research Center, Hohhot 010051, China
*
Author to whom correspondence should be addressed.
Atmosphere 2023, 14(1), 169; https://doi.org/10.3390/atmos14010169
Submission received: 5 December 2022 / Revised: 29 December 2022 / Accepted: 11 January 2023 / Published: 12 January 2023
(This article belongs to the Special Issue Carbon Emission and Carbon Neutrality in China)

Abstract

:
Based on the energy policy simulation model (EPS model) and the reality of Zhejiang Province and Inner Mongolia Autonomous Region, the carbon pricing policy scenario and the early retirement policy scenario of coal power generation units were constructed, respectively, and the policy effects simulated. The study explored whether Inner Mongolia Autonomous Region can learn from the low-carbon policies that have played a good role in Zhejiang Province in the process of achieving a carbon peak. The research found that: (1) Under the baseline scenario, both Zhejiang Province and Inner Mongolia Autonomous Region failed to achieve a carbon peak by 2030. (2) Under the scenarios of carbon pricing and early retirement of coal power generation units, the peak time of carbon in Zhejiang Province and Inner Mongolia Autonomous Region has been advanced, which shows the effectiveness of carbon pricing and early retirement of coal power generation units. (3) The above two policies have achieved good results in the overall implementation process of Zhejiang Province, but the carbon pricing policy has caused dramatic fluctuations in the power generation in Inner Mongolia Autonomous Region, and the early retirement policy of coal power units has failed to achieve the goal of reaching the peak carbon in Inner Mongolia Autonomous Region on schedule.

1. Introduction

Since reform and opening up, China’s industrial modernization process has accelerated, and the consumption of oil, coal, and other energy has increased rapidly, making China a major carbon emitter in the world [1,2,3]. As a major energy province in China, how the local government of Inner Mongolia Autonomous Region will formulate relevant policies, guide industrial transformation and upgrading, get rid of energy difficulties, and achieve the goal of carbon peak in the Region as soon as possible is a key issue for the current Autonomous Region government to consider. This is also related to the smooth progress of China’s carbon peak.
When formulating relevant policies, developing countries will generally learn from the policy experience of developed countries and formulate policies with similar routes to improve the effectiveness of policies. Xiang, Mu, and Zhang et al. all proposed that China should draw on the policies, measures, and advanced experience of developed countries to formulate relevant low-carbon development strategies [4,5,6]. So can underdeveloped regions learn from the policy experience of economically developed regions and follow relevant policies to achieve the goal of carbon peak?
Before the formal implementation of a policy, China will generally select some regions for a policy pilot. For example, the national pilot project of low-carbon cities in Hangzhou and other cities has promoted the implementation of China’s greenhouse-gas emission control target and provided practical experience for low-carbon development [7]. However, different scholars have different views on whether the pilot policy of low-carbon cities should be learned by other regions. Low-carbon city pilot policies can provide policy effect feedback for local governments, provide a scientific basis for formulating carbon emission reduction policies [8], and help local governments to formulate policies and routes. Moreover, under the influence of the learning mechanism of local governments, low-carbon pilot policies have been spread [9]. However, it is precisely because of this learning diffusion effect that the carbon peak paths proposed by different regions are generally similar [10]. Tian et al. used the PSM-DID method to evaluate the emission reduction effect of carbon emission trading pilot policies in different regions. The study found that each region showed an ideal emission reduction effect, and the regional carbon emissions and intensity were significantly reduced [11]. However, some scholars believe that due to the impact of the economic development stage, resource endowment, and other factors, there will be differences in carbon emission reduction in different regions, making it difficult for the same policy to achieve the same effect in different regions. Pan Dong and others used the STIRPAT model to predict the carbon emission trends of 11 provinces and cities in eastern China under different scenarios. The results show that under the same scenario, there are differences in the carbon peak situation of each province and city in the east, and each province and city should develop differentiated peak goals according to the actual situation [12]. Zhou et al. used the DID method to evaluate the pilot policies of low-carbon cities and found that the policies that worked well in eastern China failed in central and western China [13]. Unbalanced economic development has led to significant regional differences in the industrial distribution of carbon emissions in China [14,15]. Therefore, all regions should comprehensively consider economic, resource, and other factors, avoid the one-size-fits-all promotion of low-carbon pilot policies, and formulate “common but differentiated” low-carbon policies according to local conditions [16,17,18].
Due to the obvious difference in economic development between the eastern and western provinces and cities in China, most of the eastern coastal provinces and cities are in economically developed regions, while the western provinces and cities are located inland with inconvenient transportation and relatively backward economic development. The first batch of low carbon policy pilots are mostly concentrated in the eastern provinces and cities, and the policies in the eastern economically developed areas have a “guiding role”. Under the learning mechanism between governments, when Inner Mongolia Autonomous Region is promoting low-carbon development and formulating relevant low-carbon policies, it is bound to refer to the low-carbon pilot policies and the advanced experience of the eastern developed regions. It is worth discussing whether the low-carbon policies that have achieved good results in the eastern economically developed regions can be used for reference by the Inner Mongolia Autonomous Region.
Based on the above issues, this paper conducts a scenario simulation study. Moreover, it has the following characteristics. First of all, taking 2017 as the benchmark year, we collected the relevant data from the Inner Mongolia Autonomous Region and established the Inner Mongolia EPS model. Secondly, the carbon pricing policy scenario and the early retirement policy scenario of coal power generation units were, respectively, constructed and operated through the EPS model. Finally, we conducted a long-term simulation of the trend of carbon emissions in each year of the Inner Mongolia Autonomous Region from 2019 to 2050 and explored whether the Region could learn from low-carbon policies that have good effects in Zhejiang Province by comparing it with the implementation effect of policies in Zhejiang Province. It can provide an effective reference and help the Inner Mongolia Autonomous Region to formulate more effective low-carbon policies in line with local conditions.

2. Introduction to Research Area and Model

2.1. Study Area

Zhejiang Province attaches great importance to low-carbon development. During the “Twelfth Five Year Plan” period, Zhejiang Province prepared and implemented the Implementation Plan for Controlling Greenhouse Gas Emissions in Zhejiang Province, took the lead in establishing a provincial cooperation center for climate change and low-carbon development, and established a provincial climate change expert committee. In May 2016, Zhejiang Province issued the 13th Five Year Plan for Low Carbon Development in Zhejiang Province, which is the first provincial low-carbon development plan released in China during the 13th Five Year Plan period. In June 2021, Zhejiang Province will take the lead in introducing a scientific and technological innovation action plan on the “dual carbon” goal nationwide—the “Zhejiang Carbon Peak Carbon Neutralization Science and Technology Innovation Action Plan”, which proposes a specific technology roadmap for Zhejiang Province to achieve the “dual carbon” goal.
Under the influence of the above policies, low carbon emission reduction in Zhejiang Province has achieved significant results. In the primary energy consumption structure of the province, the proportion of non-fossil energy in primary energy consumption increased significantly, from 9.8% in 2010 to 20.3% in 2020. In addition, Zhejiang Province has coordinated the relationship between economic growth and low-carbon development well. During the “13th Five Year Plan” period, the growth rate of energy consumption in Zhejiang Province was only 2.5%, but it brought a 6.5% growth rate of GDP. In 2020, Zhejiang Province, with its total energy consumption accounting for 5.0% of the country’s total, will create 9.4% of the new urban employment population, 8.6% of the tax revenue, and 6.4% of GDP.
Zhejiang Province has achieved remarkable results in low-carbon and green development and is in a leading position in policy formulation and implementation, which is exemplary and instructive. However, whether the relevant policies of Zhejiang Province can be used for reference by other provinces, especially in the economically underdeveloped western regions, and whether policies with good results in Zhejiang Province can achieve similar policy implementation effects in the western regions remains a big question. Therefore, this paper selects the Inner Mongolia Autonomous Region, which is quite different from Zhejiang Province in terms of economic development and resource endowment, for comparative study.
As shown in Table 1, Inner Mongolia Autonomous Region is located in the west, characterized by rich resources, a sparse population, and an underdeveloped economy. Compared with Zhejiang Province, Inner Mongolia has shown a great imbalance in economic and social development due to the limitations of the regional economy, basic natural conditions, and other factors. This imbalance is mainly reflected in the regional GDP, per capita GDP, total imports and exports, etc., for which the Inner Mongolia Autonomous Region only accounts for 26.9%, 72.0%, and 3.1% of Zhejiang Province, respectively. In addition, the total energy production of Zhejiang Province in 2019 was only 4.6% of that of the Inner Mongolia Autonomous Region, and the energy self-sufficiency rate was only 13.1%. In sharp contrast, in terms of energy consumption and use efficiency, although the total energy consumption of Zhejiang Province is lower than that of the Inner Mongolia Autonomous Region, its GDP is nearly four times that of the Inner Mongolia Autonomous Region, and the conversion efficiency of resource output value is significantly different.
To sum up, in the past decade, under the policy guidance of the local government, Zhejiang Province has made obvious achievements in low-carbon emission reduction. This also provides a relevant policy reference for the Inner Mongolia Autonomous Region. As a typical western province, Inner Mongolia Autonomous Region is obviously different from Zhejiang Province in terms of economic development and resource endowment. Therefore, it is unknown whether the low carbon policy in Inner Mongolia Autonomous Region is still effective after learning from the low carbon policy in Zhejiang Province. Therefore, this paper selects Zhejiang Province and Inner Mongolia Autonomous Region as the control provinces to test the difference in the implementation effect of the same low-carbon policy among different types of provinces.

2.2. Model Introduction

2.2.1. EPS Model

Based on the “bottom-up” perspective, the EPS model simulates the development path of each department in detail from a microscopic perspective. It is a positive simulation model, not a goal-seeking model. That is to say, through specific measures that affect actions, such as changing the price of something, rather than through unknown actions to achieve the specified goal. Therefore, the EPS model can more directly reflect the implementation effect of policies on various departments and help the government make more targeted policy choices [19]. The model is mainly developed and operated according to the theoretical framework of “system dynamics”. This method regards the process of energy consumption and economic development as an open and fluctuating non-equilibrium system, which can better analyze the internal structure of the system and the interrelationship between various elements, such as input−output relationship, mutual causality, etc. The system dynamics model contains many time-series data variables, which are not only affected by the external environment but also by their own inflow and outflow. For example, the installed capacity of wind power plants will increase or decrease with the construction or retirement of wind turbines. On this basis, the annual wind power generation will also be recalculated based on the installed capacity of that year. Therefore, the simulation calculation of the EPS model is a constantly changing process.
Since 2015, the EPS model development team has continued to refine the logical framework of each department and optimize the internal structure of the model. At present, it has experienced many versions of innovation and has been applied in many countries and regions, such as the United States, Canada, Hong Kong, Zhejiang, etc., and has accumulated a lot of data and experience. In addition, because the EPS model is a large open-source system dynamic model, the code that constitutes the model exceeds 10,000 lines, and more than 1300 variables are defined [20], which contains a lot of content and is relatively complex. Specific models, variables, and parameters can be found at https://us.energypolicy.solutions/docs/index.html (accessed on 10 January 2023).
Based on the EPS model, this paper constructs a realistic scenario by collecting a large number of basic data from Inner Mongolia and uses scenario analysis to introduce different policies on the development path of the initial scenario. Under the influence of the policy, different scenario development results can be formed to effectively observe the impact of different energy policies on carbon dioxide emissions, local energy consumption, and other indicators to evaluate the policy effect.

2.2.2. Data Source

The EPS model has a complete set of input data from the United States. All input data are read and generated from external Excel files. The data can also be found at https://us.energypolicy.solutions/docs/index.html (accessed on 10 January 2023). At the same time, because the EPS model has a modular structure, it can adapt to different countries and regions by replacing the input data. Therefore, this paper refers to the description of the EPS model development team on the priority of variables and classifies the model variables according to their importance to the region, which are mainly divided into four grades: very high, high, medium, and low. When establishing the Inner Mongolia EPS model, the variables of very high and high levels are preferentially replaced based on the open US EPS model data. Variables with medium and low importance are less affected by regional changes and can be updated as appropriate. The specific data and sources replaced in this paper are shown in Table 2. In terms of coefficients, to ensure the observation consistency of the policy simulation effect and the convenience of analysis, the model coefficients have not changed.
At present, the Zhejiang EPS model has been synchronized to the web interface, where users can set different policy scenarios to simulate carbon dioxide emissions. The relevant results of the policy scenarios in Zhejiang Province in this paper are all from the website version of the Zhejiang EPS model, The relevant scenario settings of Zhejiang Province are completed on this page, and relevant data are extracted one by one for summary and mapping (https://zhejiang.energypolicy.solutions/scenarios/home) (accessed on 10 January 2023).

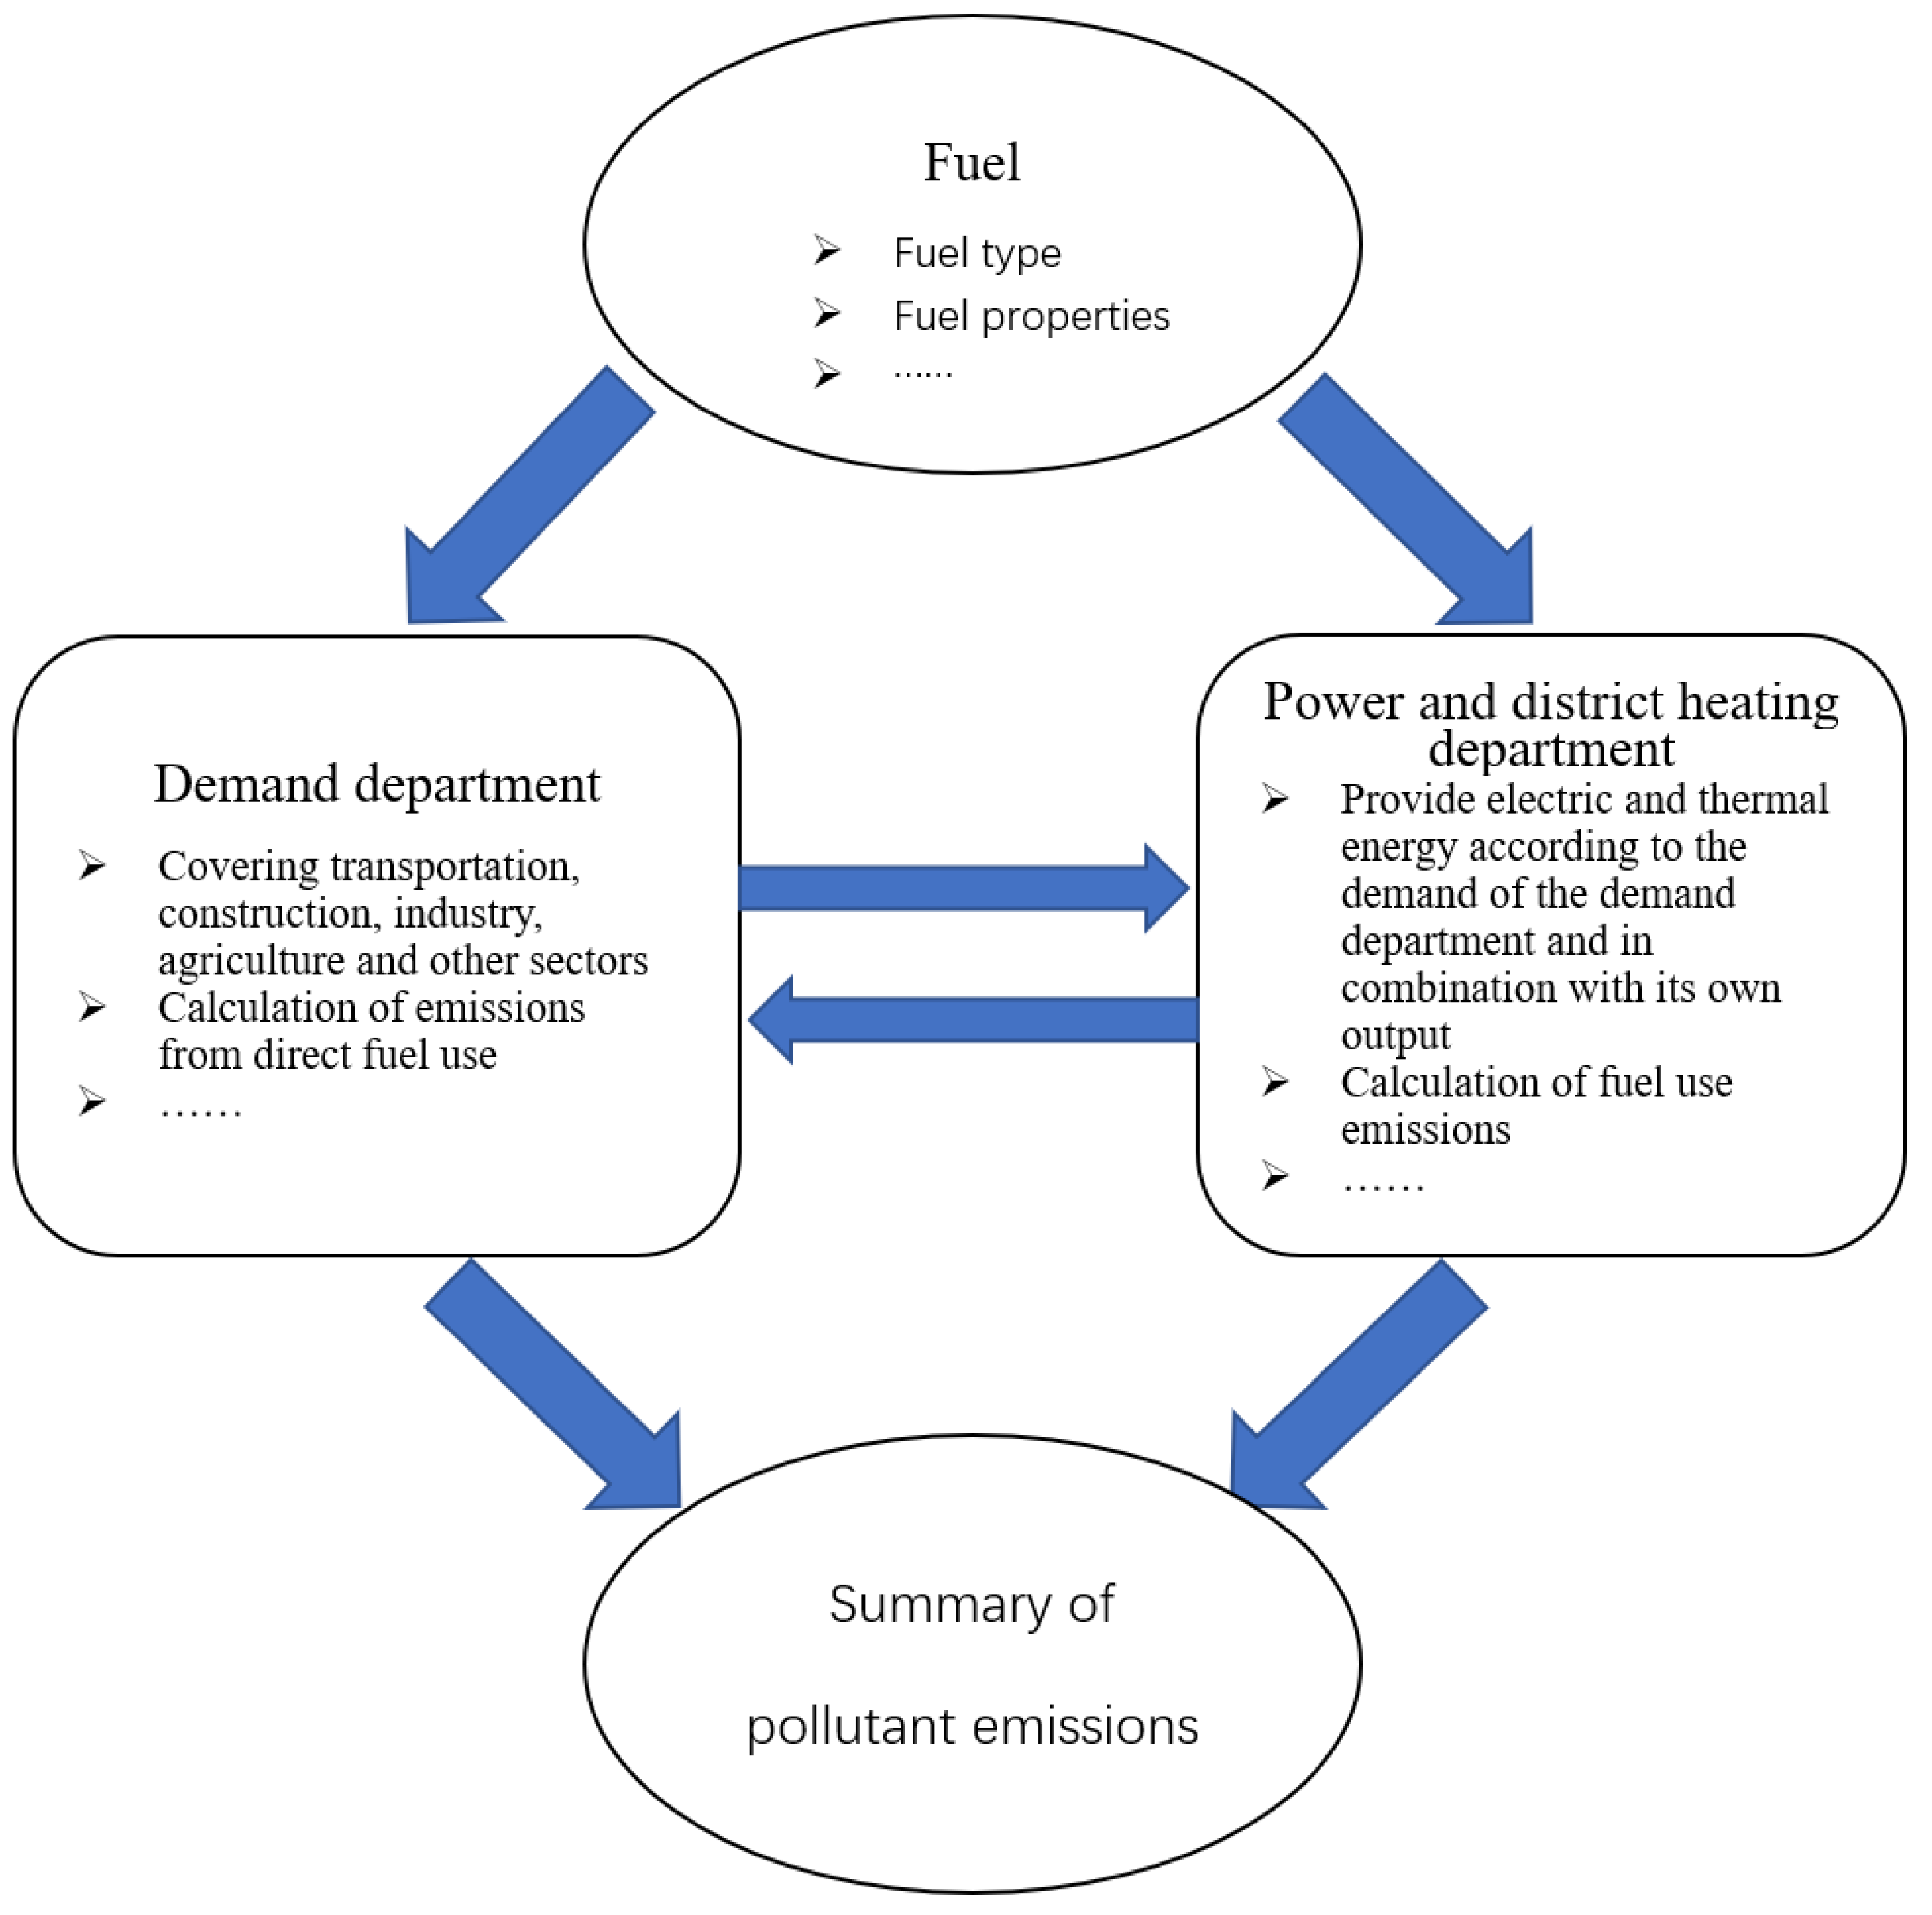
2.2.3. Operating Mechanism and Structure of EPS Model

The EPS model regards economic development and energy use as an open, dynamic system. This model can better analyze the internal structure of the system and the input−output relationship between various elements [21]. Figure 1 shows the main parts of the model and the logical relationship between the modules. The arrows indicate the calculation order. In this paper, the more important “fuel-sector utilization emissions” process in the EPS model is used to analyze Figure 1. As shown in Figure 2, first of all, the calculation logic of the model starts from the fuel sector, which mainly includes gasoline, diesel, biofuel, natural gas, etc., and sets the basic properties of each fuel. Then, the fuel will be allocated to transportation, construction, industry, and other demand departments according to the quantity and the demand of each department in the current year. These sectors then calculate their emissions from direct fuel use, such as fossil fuels burned in vehicles, buildings, and industrial facilities. In addition, these demand departments also specify the power or heat required each year (the energy carrier provided by other parts of the model). The power and district heating sectors consume fuel to meet the energy needs of the demand sectors. Finally, the pollutant emission data generated by each department are summarized in the pollutant module. Among them, the emission calculation methods of all sectors follow the principle of greenhouse gas inventory preparation. For example, the emissions related to energy activities are ultimately calculated based on the energy consumption method; that is, the energy consumption is multiplied by the corresponding emission factors of various types of energy.
At the same time, each module in the model has its own internal operation logic. The most complex power module in the EPS model is introduced as an example:
Power modules mainly include thermal power, solar photovoltaic power, wind power, hydropower, and other power generation types. The share of each type of power generation is determined according to the actual situation of each region. As shown in Figure 3, first of all, the generation demand is calculated according to the demand of each industry, power transfer in and out, and transmission and distribution losses. Secondly, according to the new construction and decommissioning of various types of generator units, and taking into account the policy guidance, such as mandatory installation and decommissioning plans, the generator assembly capacity is configured. If the installed capacity is insufficient, the type of new power plant will be determined and the corresponding installed capacity calculated after comprehensive consideration of such influencing factors as unit power generation cost and grid peak shaving capacity. Thirdly, according to the dispatching priority and the principle of minimum marginal cost, the power dispatching sequence is arranged. Finally, we summarize the fuel consumption of various types of power plants and calculate carbon emissions.
Because the model is relatively large and limited in space, this paper takes the first step of “power demand determination” in the power sector as an example to show and explain the causality diagram.
As shown in Figure 4, first calculate the total power required by each department in the model. According to the percentage of transmission and distribution losses and the imported and exported power, the power required for power generation and dispatching of the power plant is determined.
Then, the expected capacity coefficient is determined according to the elasticity of each type of power generation, distributed photovoltaic capacity, power generation in the previous year, and other variables; that is, the capacity coefficient that the power supplier wants to operate each type of power plant. In this model, the power generated by wind energy, solar photovoltaic energy, and other new energy power generation methods is set to be used preferentially. However, because wind energy, solar photovoltaic energy, and other new energy power generation methods are not sustainable in the process of power generation, thermal power, natural gas power generation, and other power generation methods are needed as supplements. In the model, their availability is expressed by “flexibility point”. If the available flexibility points are not allocated enough, the model will reduce the expected capacity factor of power plant types (wind and solar PV) with high flexibility requirements.
After determining the expected capacity factor, the model then calculates the potential power generation of the previous model year (i.e., the power plants that have not been decommissioned). The model uses the “expected capacity factor” and multiplies it with the annual operating hours of various power generation modes to obtain the “expected capacity factor × hours per year”. Then multiply with the electricity generation capacity, the start year electricity generation capacity and the retirement generation capacity by quality level to get the output of last year and the retired electricity output.
Finally, the decommissioned power output is subtracted from the output of last year to determine the power output that will last until this year to determine the new output required this year.

3. Comparative Analysis of Policy Implementation Effect

In 2016, Zhejiang Province proposed in its 13th Five Year Plan for Low Carbon Development to establish and improve the initial allocation system of carbon emission rights, strengthen the paid use awareness of enterprises’ carbon emission rights, strengthen quota management and market supervision, and encourage the development of carbon assets. It is also proposed to comprehensively promote the clean and efficient development of coal power, and not launch new coal power projects. Later, in the “Fourteenth Five Year Plan” of Zhejiang Province, the action goal of “reducing the use of high carbon energy and increasing the use of low carbon and zero carbon energy as the main line” was further proposed. In July 2021, China’s carbon emission trading market will officially open. To sum up, the carbon market and coal power control will be the work that local governments will strive to promote in the future, while the policy implementation of Zhejiang Province is earlier than that of the country, which has a certain pioneering and exemplary nature. Therefore, based on the benchmark scenario, this paper establishes the carbon pricing scenario and the early retirement scenario of coal power generation units. We compare the effect of the policy itself and the implementation effect of the same policy in Zhejiang Province and Inner Mongolia Autonomous Region to explore the impact of the same policy on carbon emission reduction and carbon peak in the two provinces.

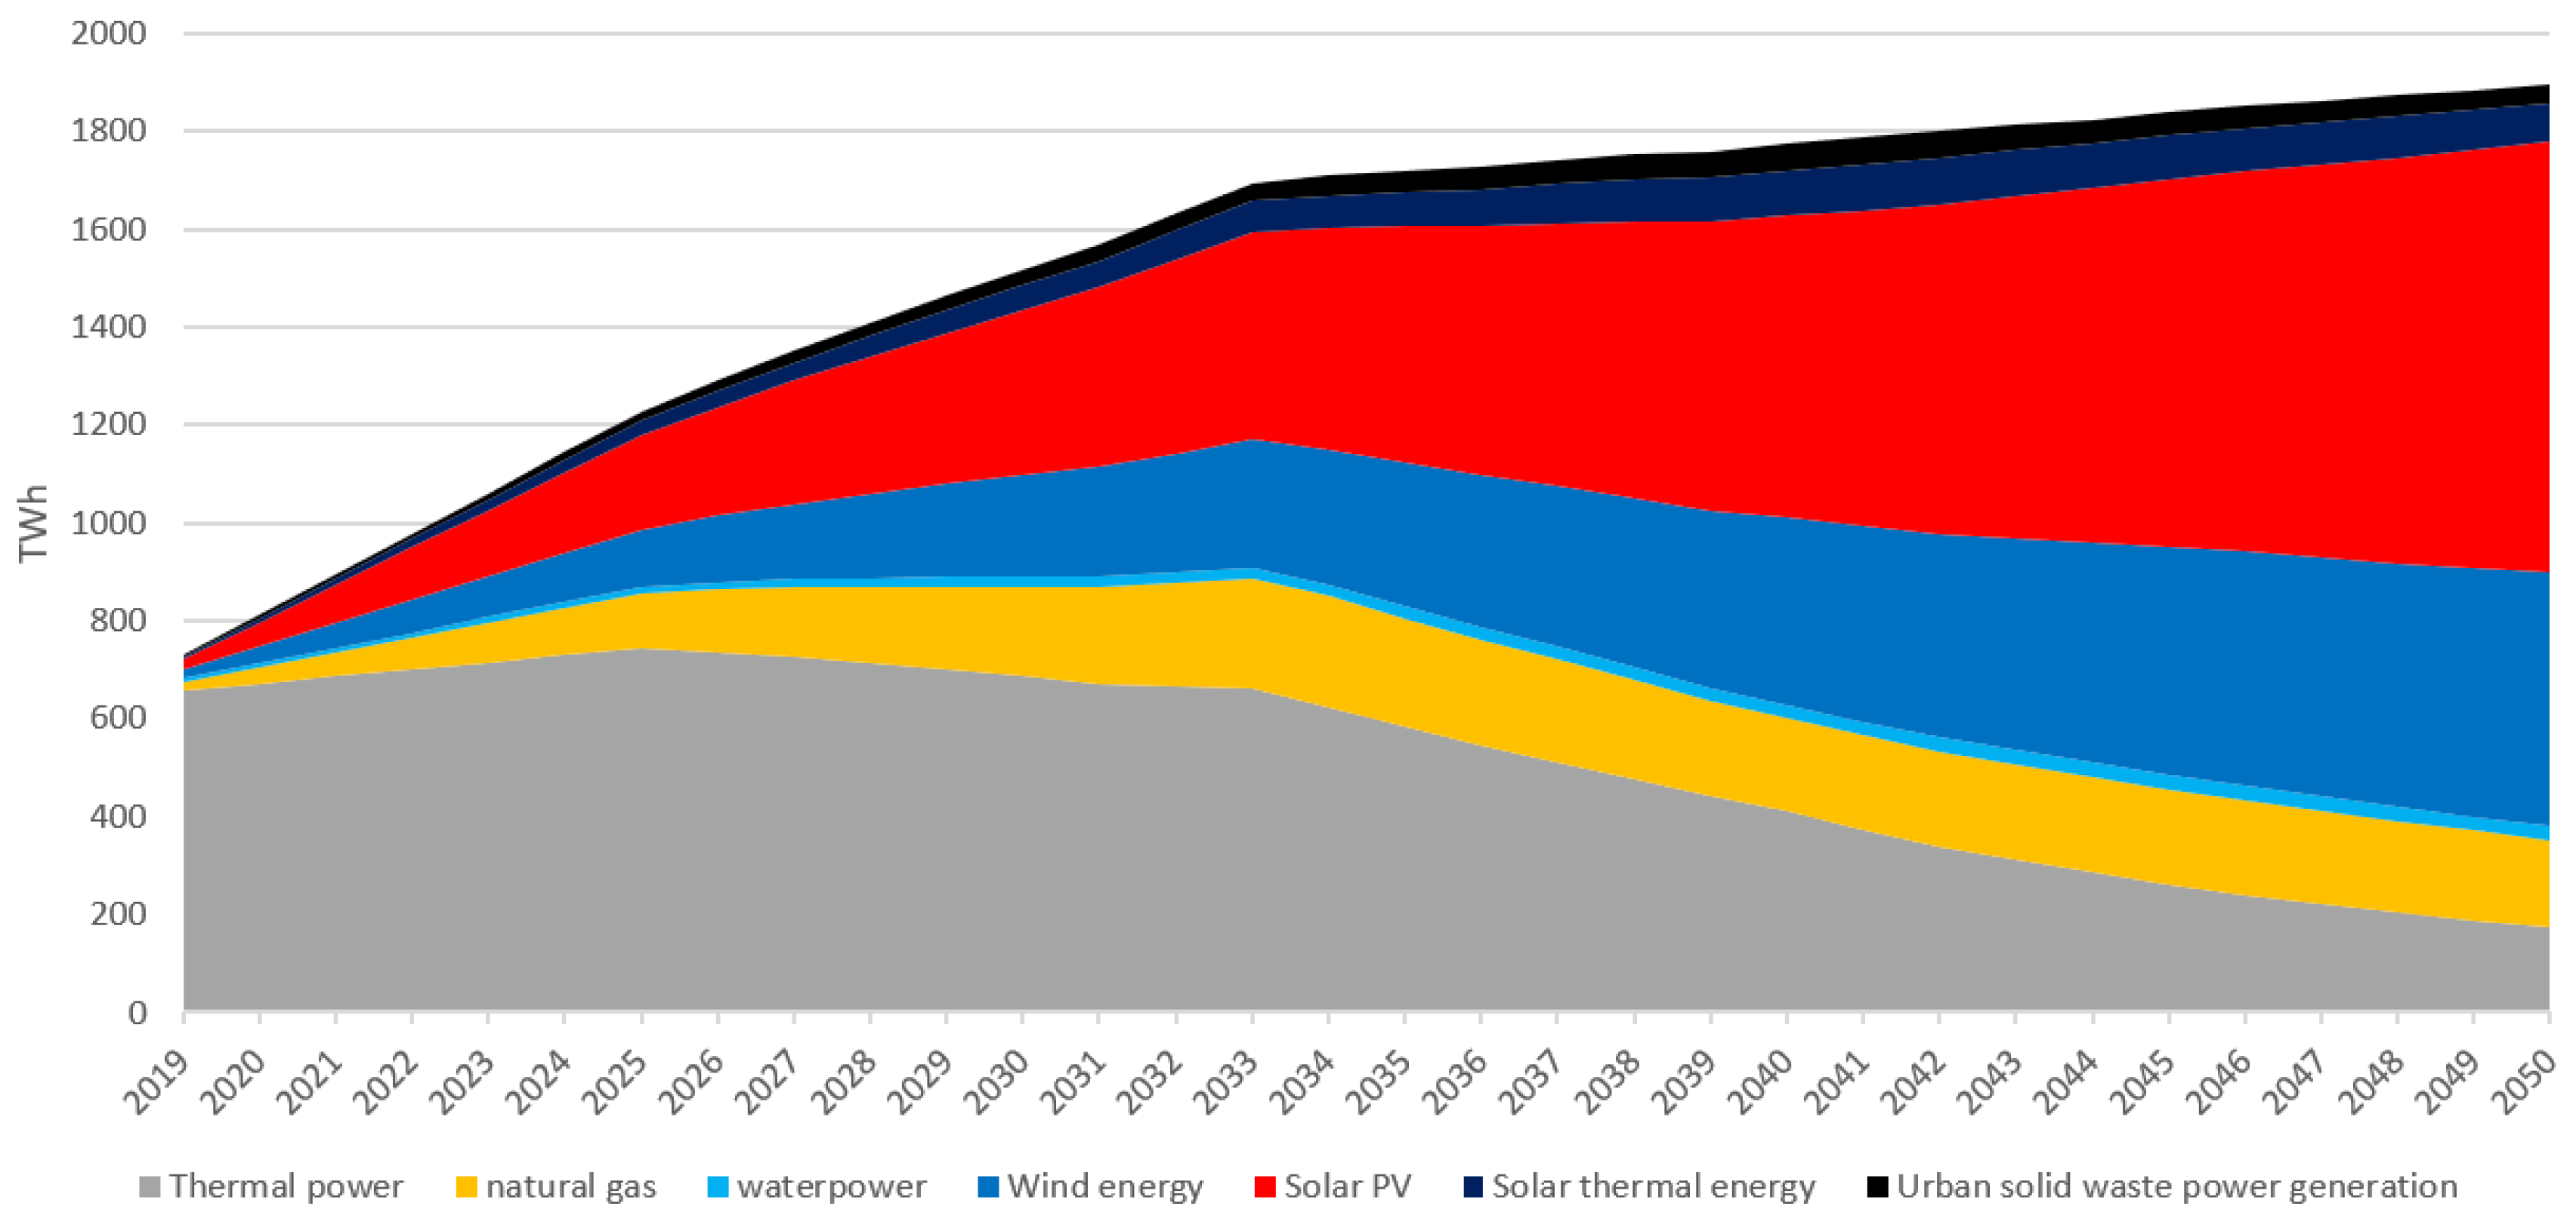
3.1. Baseline Scenario

The benchmark scenario is to observe the natural operation trend of Zhejiang Province and Inner Mongolia Autonomous Region in terms of carbon dioxide emissions, power generation, etc. while continuing the current state and no new policies introduced. By setting the benchmark scenario, one can directly observe the carbon emission trend of Zhejiang Province and Inner Mongolia Autonomous Region, which better reflects the real situation of the two provinces and the difficulty of carbon emission reduction. The second is to compare the follow-up policy scenarios. Through the principle of controlling variables, explore the role of the same low carbon policy in Zhejiang Province and Inner Mongolia Autonomous Region to compare better the impact of the same low carbon policy on the two provinces.
As shown in Figure 5, under the baseline scenario, the carbon dioxide emissions of Zhejiang Province reached a peak of 610 million tons in 2032 and then showed a downward trend year by year. The carbon dioxide emissions in 2050 will be 540 million tons, an increase of 12.5% over 2019 and a decrease of about 11.5% over the peak. By sector, the main CO2 emission sectors in Zhejiang Province are the power and industrial sectors. They will reach their peak in 2033 and 2027, respectively, with carbon dioxide emissions of 250 million tons and 220 million tons.
It can be seen from Figure 6 that the power generation in Zhejiang Province will increase from 475.1 TWh in 2019 to 874.6 TWh in 2050, an increase of about 84.1%. In terms of power generation structure, Zhejiang Province is mainly composed of thermal power, nuclear power, and electricity transferred from other provinces. In 2019, thermal power generation in Zhejiang Province accounted for 44.7% of the total power generation, while in 2050, thermal power generation accounted for only 20.6%. Thermal power generation in Zhejiang Province has been greatly reduced, replaced by nuclear power and power transferred from other provinces. In 2019, the total proportion of nuclear power and power transferred from other provinces was about 37%, and by 2050, it will increase to 54.4%. Among them, due to the good foundation for the development of nuclear power in Zhejiang Province, there are the first Qinshan Nuclear Power Station designed and built by China itself, as well as the second and third Qinshan Nuclear Power Stations, Fangjiashan Nuclear Power Station, and Sanmen Nuclear Power Station. In addition, San’ao Nuclear Power Station is being built in Zhejiang Province, increasing the proportion of nuclear power in Zhejiang Province from 15.4% in 2019 to 22.7% in 2050. Furthermore, from 2019 to 2050, the proportion of electricity transferred from other provinces increased year by year, from 21.6% in 2019 to 31.7% in 2050, reflecting that Zhejiang Province is increasingly dependent on external electricity.
It can be seen from Figure 7 that the power and industrial sectors also account for a large share of carbon dioxide emissions in Inner Mongolia. Among them, the carbon dioxide emissions of the power sector will reach a peak of 920 million tons in 2030. Subsequently, it decreased year by year, and since 2037, the annual carbon emissions stabilized at about 670 million tons. In contrast, the industrial sector will continue to show a slow growth trend from 2019 to 2050, with carbon dioxide emissions increasing by nearly 33.5%. On the whole, from 2019 to 2030, the emission of carbon dioxide in Inner Mongolia will continue to increase, from 3.37 billion tons to 3.99 billion tons. Later, it showed a slow downward trend. However, from 2038, the emission of carbon dioxide in Inner Mongolia rebounded and exceeded the previous peak in 2043, reaching 4.15 billion tons in 2050. In addition, the carbon emission of Zhejiang Province is far less than that of Inner Mongolia Autonomous Region, which is only 13–16% of that of Inner Mongolia Autonomous Region. The regional difference of carbon emission is obvious.
As shown in Figure 8, under the benchmark scenario, the power generation in Inner Mongolia shows a continuous growth trend, with a growth rate of about 160%. Among them, thermal power, solar photovoltaic power, natural gas power generation, and wind power will grow steadily from 2019 to 2030. Thermal power generation will account for 49.2% of the total power generation in 2030, and thermal power will play a major role in this stage. However, when the thermal power generation began to decline, the inflection point of power generation growth in Inner Mongolia also appeared, and the power generation growth slowed down. In addition, due to the rich solar and wind resources in Inner Mongolia Autonomous Region, the new energy power generation represented by solar photovoltaic and wind power has developed rapidly. In 2050, solar photovoltaic power generation will be 688.7 TWh, wind power generation will be 345.7 TWh, and thermal power generation will be 610.0 TWh. It is worth noting that although new energy power generation has accounted for more than 50% of the total power generation in Inner Mongolia, thermal power generation still accounts for a large share, and the pressure on carbon emission reduction in Inner Mongolia Autonomous Region is still large.
To sum up, the total emission of carbon dioxide in Zhejiang Province is relatively small, only 13–16% of that in Inner Mongolia Autonomous Region. The pressure on carbon emission reduction is relatively small, but it is still unable to achieve carbon peak on time based on its own operating trend. In addition, about 1/3 of the electricity generated by the power sector of Zhejiang Province is transferred from other provinces, which further reduces the pressure on carbon emission reduction in Zhejiang Province. One of Inner Mongolia’s responsibilities as a major energy province, is to ensure the national energy supply. At present, the power generation mode in Inner Mongolia Autonomous Region is still dominated by thermal power, which is difficult to be replaced by new energy in a short time; In terms of industry, Inner Mongolia is mainly composed of coal, metallurgy and other high energy consumption industries, resulting in high carbon dioxide emissions. Therefore, it is difficult for Inner Mongolia to curb the growth of carbon emissions in the natural state, and the goal of reaching the carbon peak is facing severe challenges.

3.2. Carbon Pricing Scenario

The carbon emission right can act on the power industry through the market mechanism, which can not only inhibit carbon emissions but also effectively guide the coal power manufacturers to take the initiative to reduce emissions. From the perspective of enterprises, the carbon emission reduction behavior of enterprises can reduce costs in the carbon market, or even make profits from it. From the national perspective, the establishment of the carbon market can mobilize the enthusiasm of enterprises to reduce carbon emissions more effectively [22].
From July to November 2021, the domestic carbon price will fluctuate between 38.5 and 61.07 yuan/ton, which is about 6.02–9.54 dollars at the exchange rate of 6.4 yuan/dollar. In view of the low activity of the current domestic carbon market, the international carbon prices continue to rise in many places. For the convenience of calculation, in the carbon pricing scenario, the current carbon price of power sector and industrial sector is defined as 10 dollars/ton, and the carbon price will increase linearly from 2021 to 2050. By 2050, the carbon price in the industrial sector will be USD 30/ton and that in the power sector will be USD 60/ton.
According to Figure 9, under the carbon pricing policy, the overall carbon dioxide emissions of Zhejiang Province have declined steadily, and will reach their peak in 2027. Compared with the baseline scenario, it is five years ahead of schedule, and the peak carbon emission is 610 million tons, down about 6.6% from the baseline scenario.
As shown in Figure 10 in 2019, thermal power generation accounted for 43.7% of the total power generation in Zhejiang Province. With the introduction of carbon pricing policy, the cost of thermal power generation enterprises was increased, which led to the gradual withdrawal of thermal power generation in Zhejiang Province from the power generation market. After 2024, thermal power generation in Zhejiang Province will decrease year by year. In 2050, thermal power will only account for 10.2% of the total power generation in Zhejiang Province, reducing by about 33.5%, which effectively curbs the carbon dioxide emissions in the electricity sector of Zhejiang Province. However, it is worth noting that in 2019, the proportion of electricity transferred from other provinces in Zhejiang’s total power generation will be 21.9%, while in 2050, the proportion will be 33.5%, an increase of 11.6%. In addition, during the gradual withdrawal of thermal power generation, the power generation capacity of natural gas began to increase year by year. The proportion of natural gas power generation in the total power generation capacity of Zhejiang Province increased from 8.3% in 2019 to 25.0% in 2050, an increase of about 16.7%. Due to the increase of power generation transferred from other provinces and natural gas, which makes up for the power shortage caused by the withdrawal of thermal power, the power generation in Zhejiang Province increased from 467.8 TWh in 2019 to 828 TWh in 2050, an increase of about 77%. Under the influence of carbon pricing policy, the power generation industry in Zhejiang Province has achieved a smooth transition, and the power generation has continued to grow.
As shown in Figure 11, under the carbon pricing scenario, the overall trend of carbon dioxide emissions in Inner Mongolia is downward. As the power and industrial sectors are the two major sources of carbon emissions in Inner Mongolia, under the precise governance and impact of carbon pricing, Inner Mongolia Autonomous Region will achieve a carbon peak in 2021. Although there will be a slight rebound in 2030 and 2044, the growth of carbon emissions is slow and does not break through the previous high trend. By sector, after the introduction of carbon pricing policy, the cost of thermal power generation enterprises will increase. As the current thermal power generation in Inner Mongolia accounts for more than 80% of the total power generation, thermal power generation will produce a lot of carbon dioxide. Therefore, the power industry is most affected by carbon pricing policies. Under the intervention of the carbon pricing policy, the carbon dioxide emissions of the power sector dropped rapidly to 23 million tons by 2030. Compared with the power sector, carbon pricing has less impact on the industrial sector. However, compared with the baseline scenario, the industrial sector’s carbon emissions will decrease by 26.2% in 2050, and the carbon pricing policy is still effective in curbing the industrial sector’s carbon emissions. Therefore, the carbon pricing policy has a positive role in promoting carbon emission reduction in Inner Mongolia Autonomous Region.
As shown in Figure 12, the power generation of Inner Mongolia in 2050 will be 1809.2 TWh. Compared with the baseline scenario, the carbon pricing policy will only reduce the power generation by 91.3 TWh, but not significantly reduce the power generation of Inner Mongolia Autonomous Region. However, from 2021 to 2028, affected by the carbon pricing policy, the scale of thermal power generation in Inner Mongolia will shrink rapidly from 582.6 TWh to 18.9 TWh. At the same time, affected by the decline in the scale of thermal power, the overall power generation in Inner Mongolia also declined, with a decline of about 34.5%. The implementation of the carbon pricing policy has led to an increase in the operating costs of thermal power plants, thereby significantly reducing thermal power generation. However, during 2021–2028, the layout of new energy power generation has not been completed, reducing the overall power generation in Inner Mongolia. After 2028, the power generation of solar photovoltaic and wind energy will increase rapidly, which will make up for the gap in thermal power generation.
To sum up, Zhejiang Province has achieved a smooth transition in terms of carbon emission reduction and power generation in sharp contrast to the sharp fluctuations in power generation in Inner Mongolia. The reason is that the power generation structure of Zhejiang Province is mainly composed of power, thermal power, and nuclear power from other provinces, and the proportion of thermal power generation is lower than that of Inner Mongolia Autonomous Region. With the gradual withdrawal of thermal power generation, Zhejiang Province has increased the supply of electricity and nuclear power transferred from other provinces. Therefore, in the process of gradually improving carbon pricing, the power sector can achieve a smooth transition. In Inner Mongolia Autonomous Region, although the implementation of carbon pricing has promoted the development of photovoltaic and wind power generation, the proportion of both has been rising. However, this policy has also indirectly led to large fluctuations in power generation in Inner Mongolia. If not handled properly, it will affect the security of energy supply throughout the country.

3.3. Early Retirement Scenario of Coal Power Units

At present, China’s coal consumption ranks first in the world, of which more than half is used for thermal power generation [23,24]. However, the existing coal power generation units in China are generally young, and the coal power emissions will remain at a high level for a long time [25]. Therefore, carbon emissions can be effectively controlled through early retirement of coal power generation units [26,27]. Therefore, in this scenario, the coal power generation units will be decommissioned in advance from 2026, and 2500 MW of coal power generation units will be decommissioned in advance every year.
According to Figure 13 and Figure 14. Among them, Figure 14 lists the CO2 emissions of each sector in 2030, peak year, and 2050 in the baseline scenario, carbon pricing scenario, and early retirement scenario of coal power generation units to intuitively compare the changes in carbon emissions of each scenario at peak, 2030, and 2050, and the decline rate of carbon emissions of each scenario from peak year to 2050. Under the policy of early retirement of coal power units, the carbon dioxide emissions of Zhejiang Province will reach a peak of 590 million tons in 2027, five years ahead of the baseline scenario. In 2050, the carbon dioxide emissions will decrease by 140 million tons compared with the peak value, a decrease of about 23.7%. The power sector will reach a peak of 230 million tons in 2025. By 2050, the carbon emissions of the power sector have decreased by 52.2% compared with the peak. The policy of early retirement of coal power generation units guides the upgrading and transformation of thermal power plants by phasing out thermal power generation units to enable thermal power plants with high pollution attributes to exit the power market in an orderly manner, thus effectively curbing the carbon emissions of the power sector.
As shown in Figure 15, under the effect of the early retirement policy of coal power units, thermal power generation in Zhejiang Province reached its peak in 2024, then decreased year by year, and completely exited the power generation system in Zhejiang Province in 2048. In addition, under this scenario, the nuclear power generation capacity of Zhejiang Province in 2050 will increase by about 33.6% compared with the benchmark scenario. The policy of early retirement of coal power units made the government aware of the unsustainable nature of thermal power, so that it was more active to find alternative paths and effectively promoted the development of a new energy industry in Zhejiang Province.
As shown in Figure 16 and Figure 17, the power sector in Inner Mongolia will achieve a carbon peak in 2026. Subsequently, the carbon dioxide emissions showed a significant downward trend. Compared with the peak, the carbon dioxide emissions in 2050 decreased by about 540 million tons, a decline of 66.7%. The policy effect was obvious. On the whole, the emission of carbon dioxide in Inner Mongolia will reach a peak of 3.9 billion tons in 2033. In 2050, the carbon emissions will be 3.72 billion tons, a decrease of about 4.6% compared with the peak carbon emissions. Compared with the baseline scenario, the policy of early retirement of coal power generation units did not make the carbon dioxide emissions in Inner Mongolia rebound, indicating the effectiveness of the policy.
According to Figure 18, thermal power generation in Inner Mongolia will reach a peak of 743.8 TWh in 2025, and then continue to decline. Thermal power generation accounted for 9.2% of the total power generation, down from 60.4% at the peak of thermal power generation. During this period, photovoltaic and wind power continued to expand, accounting for 46.5% and 27.2%, respectively, in 2050, becoming the main power generation path in Inner Mongolia. As the policy of early retirement of coal power generation units is carried out gradually every year, no additional cost is imposed like the carbon pricing policy, which has less impact on the local power market. Moreover, after the policy is released, the government and power generation enterprises will have an expectation for the future and adjust the power generation structure accordingly. Therefore, affected by the early retirement of coal power units and the expected retirement, the new energy industry has received the attention of local governments and enterprises, and the new energy industries such as solar photovoltaic and wind energy have been greatly developed, making up for the power gap caused by the early retirement of coal power units, and making the power generation in Inner Mongolia grow steadily.
Under the policy of early retirement of coal power generation units, the carbon peak time of Zhejiang Province and Inner Mongolia is 2027 and 2033, respectively. Compared with the corresponding peak, the overall carbon emissions of Inner Mongolia and the power sector in 2050 will change by −4.6% and −66.7%, respectively, while those of Zhejiang Province will change by −23.7% and −52.2%, respectively. Although the carbon emission reduction effect of the power sector in Inner Mongolia is more obvious under this policy, the Inner Mongolia Autonomous Region has failed to achieve the carbon peak goal by 2030. In addition, although the overall carbon dioxide emissions in Inner Mongolia Autonomous Region have been effectively controlled, the decline rate is too slow, which is not conducive to the achievement of the subsequent carbon neutralization goal.

4. Conclusions

In this paper, carbon pricing scenarios and early retirement scenarios of coal power generation units are constructed. Through EPS model simulation, the carbon emissions and power generation of Zhejiang Province and Inner Mongolia Autonomous Region from 2019 to 2050 are quantitatively analyzed. Then, according to the quantitative results, observe the effects of the above policy scenarios in the two provinces are observed, and the policy implementation effects of Zhejiang Province and Inner Mongolia Autonomous Region in the two scenarios are compared to explore whether Inner Mongolia Autonomous Region can learn from policies that have good effects in Zhejiang Province. The final findings are:
(1)
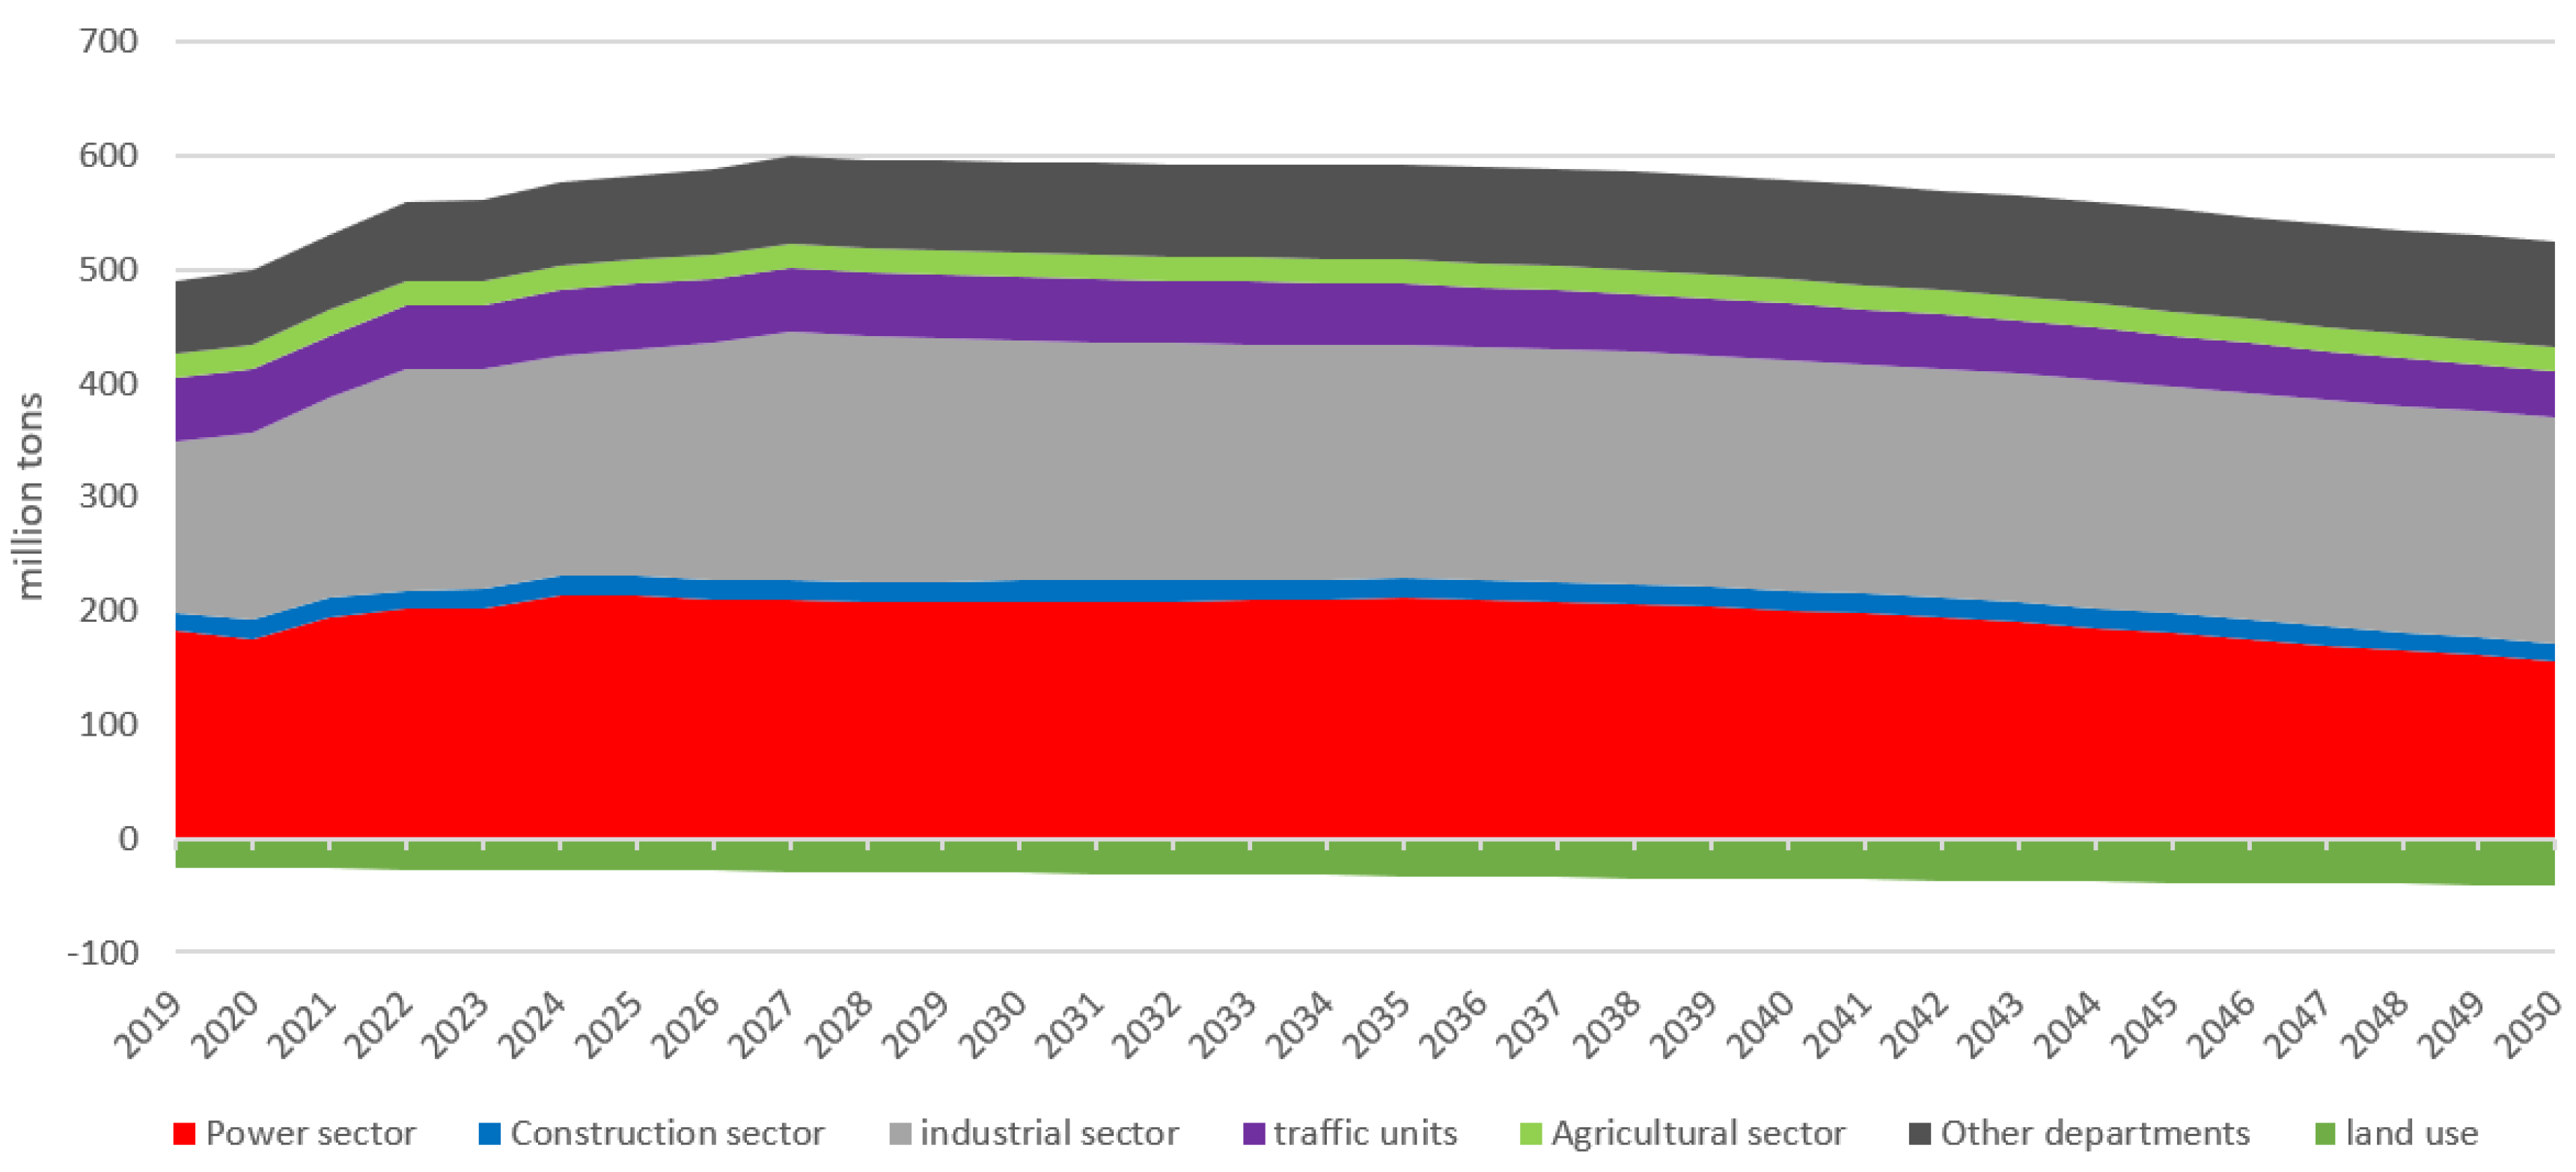
In the baseline scenario, Zhejiang Province will achieve a carbon peak in 2032; Inner Mongolia Autonomous Region reached a periodic carbon peak in 2030, but rebounded in 2038, and exceeded the periodic peak in 2030 in 2043. As of 2050, the carbon emissions in Inner Mongolia have continued to grow, which is 23.1% higher than that in 2019, and there is no slowing down trend, and the long-term carbon peak has not been achieved. Therefore, both Zhejiang Province and Inner Mongolia Autonomous Region have failed to achieve the goal of reaching the carbon peak by 2030. As the carbon dioxide emissions of the Inner Mongolia Autonomous Region are still rising by 2050, Inner Mongolia faces greater difficulty in reaching the carbon peak than Zhejiang Province.
(2)
Under the carbon pricing policy scenario, Zhejiang Province and Inner Mongolia Autonomous Region will achieve carbon peak in 2027 and 2021, respectively; Under the policy scenario of early retirement of coal power generation units, the two provinces will achieve carbon peak targets in 2027 and 2033, respectively. Compared with the baseline scenario, both the carbon pricing policy and the early retirement policy of coal power generation units have advanced the peak time of carbon in the two provinces, reflecting that the policy has a good effect on carbon emission reduction. However, under the policy of early retirement of coal power units, Inner Mongolia failed to achieve the goal of carbon peak by 2030, indicating that the policy has a relatively weak effect on the Inner Mongolia Autonomous Region.
(3)
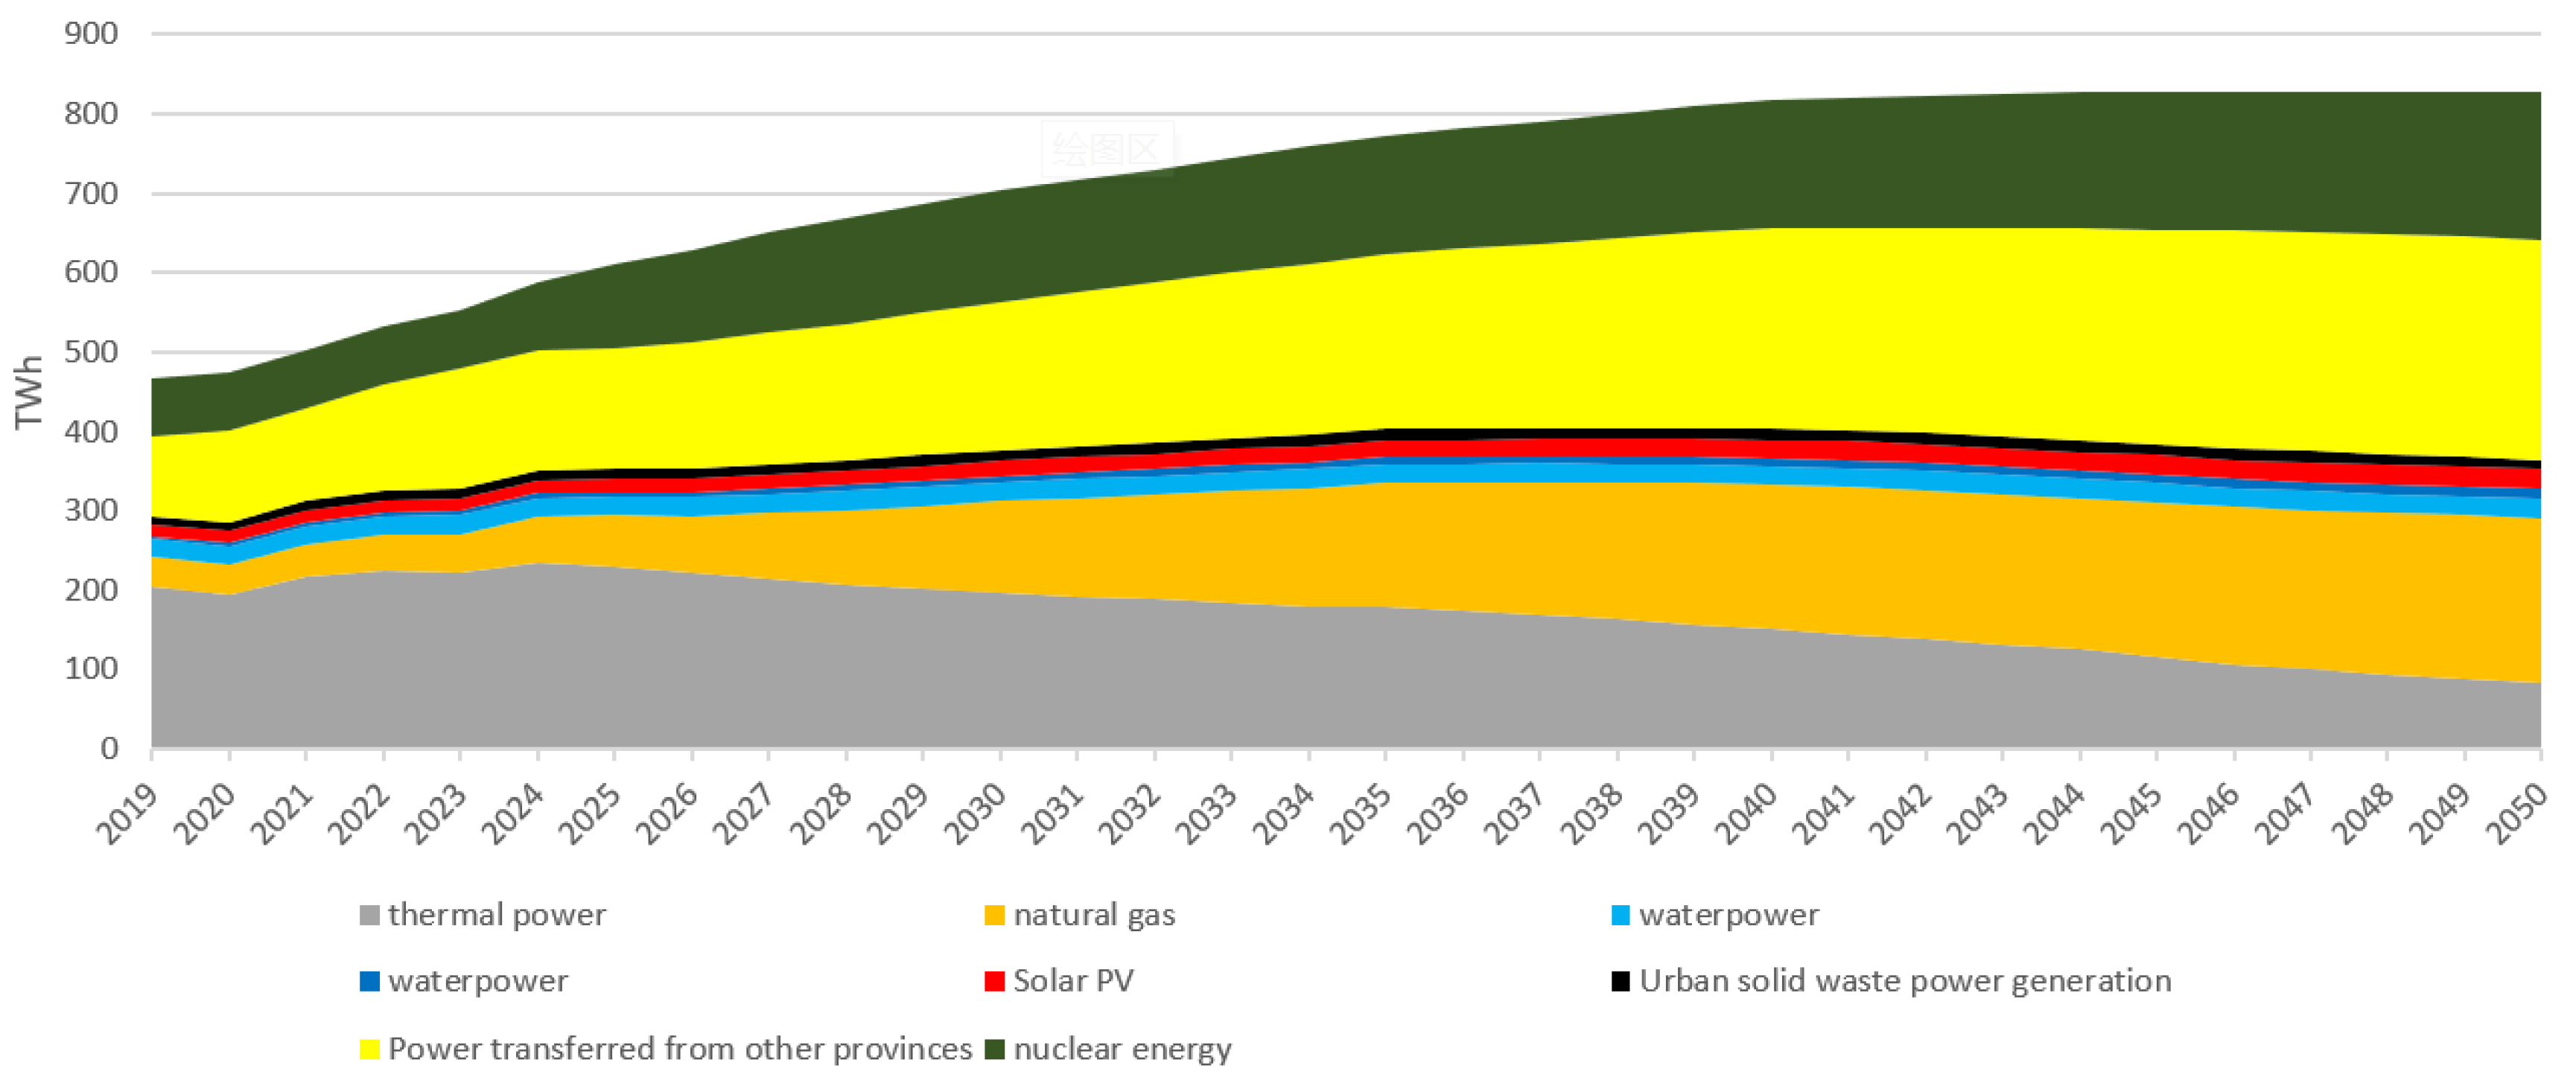
Compared with the good and stable policy implementation effect of Zhejiang Province, under the carbon pricing scenario, although the Inner Mongolia Autonomous Region has achieved the goal of reaching the carbon peak by 2030, the power generation has experienced dramatic fluctuations. Compared with 2019, the total power generation in Inner Mongolia will decline by 28.5% in 2028, the lowest point. In the context of China’s increasing electricity consumption and Inner Mongolia’s responsibility for power output to ensure the national energy supply, the reduction of power generation in Inner Mongolia is not conducive to the stable development of China’s economy; Under the scenario of early retirement of coal power generation units, Inner Mongolia failed to reach the carbon peak by 2030 as scheduled. In addition, the overall carbon emission reduction effect of this policy in Inner Mongolia Autonomous Region is relatively weak. Compared with the peak value, the carbon dioxide emissions in Inner Mongolia in 2050 will only decrease by 4.7%, which is not conducive to the achievement of the subsequent carbon neutralization goal. Therefore, policies that can achieve good results in Zhejiang Province will lead to drastic fluctuations in power generation in Inner Mongolia or failure to achieve the carbon peak goal on schedule. Therefore, Inner Mongolia Autonomous Region must distinguish when drawing on the carbon emission reduction policies of economically developed regions. When promoting the necessary low-carbon policies in an orderly manner, we should increase the flexibility of policy implementation and strengthen the supervision and management of policy effects.
In addition, as a resource-based province, Inner Mongolia shoulders a major responsibility for energy output and plays an important role in ensuring the national energy supply. Therefore, when formulating low-carbon policies, the local government of Inner Mongolia should not only fully consider the overall effect after the implementation of the policy but also strive to formulate low-carbon policies with Inner Mongolia characteristics according to its own positioning under the condition of ensuring adequate energy supply and energy security. In addition, this paper mainly conducts comparative research on policy effects. In order to focus on the comparison of policy effects, there is no discussion on low-carbon technology, energy efficiency and other aspects in this paper.

Author Contributions

Methodology, W.D. and G.L.; software, W.D. and G.L.; validation, W.D., G.L. and D.X.; formal analysis, G.L.; writing—original draft preparation, G.L.; writing—review and editing, W.D. and D.X.; supervision, W.D. and D.X. All authors have read and agreed to the published version of the manuscript.

Funding

Supported by a project grant from National Natural Science Foundation of China (Grant No. 72264029), Inner Mongolia Natural Science Foundation (Grant No. 2021MS07016 and 2022MS07012) and Basic Scientific Research Funds of Colleges and Universities Directly under the Autonomous Region (Grant No. JY20220023 and JY20220055).

Institutional Review Board Statement

Not applicable.

Informed Consent Statement

Not applicable.

Data Availability Statement

Not applicable.

Conflicts of Interest

The authors declare no conflict of interest.

References

  1. IEA. CO2 Emissions from Fuel Combustion. 2016. Available online: https://www.iea.org/ (accessed on 10 January 2023).
  2. BP Company. Statistical Review of World Energy. Available online: https://www.bp.com/ (accessed on 10 January 2023).
  3. Li, Y.N.; Zhu, S.L.; Luo, L.J.; Yang, D.P. Theoretical Discussion on Low Carbon Development as a Macroeconomic Target—Based on China’s Situation. Manag. World 2017, 6, 1–8. [Google Scholar] [CrossRef]
  4. Xiang, Z.; Liu, X.Y.; Xiao, D.D. The path choice of sustainable development of fossil energy in China: An international comparative study. J. Shandong Univ. Philos. Soc. Sci. Ed. 2016, 3, 150–160. [Google Scholar]
  5. Zhang, Y.C.; Mu, X.Y. Low carbon energy transformation in the UK: Strategy, scenario, policy and inspiration. Int. Pet. Econ. 2020, 28, 17–29. [Google Scholar] [CrossRef]
  6. Zhang, Y.X.; Luo, H.L.; Wang, C. International trend analysis of carbon neutral action. Prog. Clim. Change Res. 2021, 17, 88–97. [Google Scholar] [CrossRef]
  7. Wu, F.; Liu, X.J.; Sang, B.C. Development Status, Problems and Path Selection of National Pilot Low Carbon Cities (Towns). Mod. Manag. Sci. 2017, 2, 18–20. [Google Scholar] [CrossRef]
  8. Liu, F. The impact of china’s low-carbon city pilot policy on carbon emissions: Based on the multi-period did model. Environ. Sci. Pollut. Res. 2022, 29, 45783–45792. [Google Scholar] [CrossRef]
  9. Zhuang, G.Y. Policy Design Logic of China’s Low Carbon City Pilot. China’s Popul. Resour. Environ. 2020, 30, 19–28. [Google Scholar] [CrossRef]
  10. Cao, Y.; Li, X.M.; Liu, Q.; Xu, H.Q.; Zhao, X.C. Analysis on the status quo of promoting carbon emissions in some regions to reach the peak first. Environ. Prot. 2019, 47, 27–30. [Google Scholar]
  11. Tian, G.; Yu, S.; Wu, Z.; Xia, Q. Study on the Emission Reduction Effect and Spatial Difference of Carbon Emission Trading Policy in China. Energies 2022, 15, 1921. [Google Scholar] [CrossRef]
  12. Pan, D.; Li, N.; Li, F.; Feng, K.S.; Peng, L.L.; Wang, Z. Development of peak reaching strategy in eastern China based on energy carbon emission prediction. J. Environ. Sci. 2021, 41, 1142–1152. [Google Scholar] [CrossRef]
  13. Zhou, S.; Zhou, C. Evaluation of China’s low-carbon city pilot policy: Evidence from 210 prefecture-level cities. PLoS ONE 2021, 16, e0258405. [Google Scholar] [CrossRef] [PubMed]
  14. Hu, B. Industrial Experience and Path Selection of Accelerating the Low Carbon Transformation of China’s Industrial Structure. Theor. Discuss. 2017, 1, 76–80. [Google Scholar]
  15. Liu, H.; Fan, J.; Zhou, K.; Wang, Q. Exploring regional differences in the impact of high energy-intensive industries on CO2 emissions: Evidence from a panel analysis in China. Environ. Sci. Pollut. Res. 2019, 26, 26229–26241. [Google Scholar] [CrossRef] [PubMed]
  16. Tu, Z.G.; Chen, R.J. Regional division and emission reduction path of China’s carbon emissions—Cluster analysis based on multi indicator panel data. J. China Univ. Geosci. Soc. Sci. Ed. 2012, 12, 7–13+136. [Google Scholar]
  17. Lu, X.W. Research on the Implementation Effect of Low Carbon Pilot Policies—Evidence Based on the Composite Control Method. Soft Sci. 2017, 31, 98–101+109. [Google Scholar] [CrossRef]
  18. Zheng, J.J.; Yang, M.M.; Ma, G.; Xu, Q.; He, Y.J. Multi-Agents-Based Modeling and Simulation for Carbon Permits Trading in China: A Regional Development Perspective. Int. J. Environ. Res. Public Health 2020, 17, 301. [Google Scholar] [CrossRef] [Green Version]
  19. Xi, W.Y.; Zhou, H.F.; Wu, H.M.; He, H.; Chen, L.J.; Wu, J.H.; Xu, Q.L.; Wu, J.R. Introduction to Zhejiang Energy Policy Simulation Model (EPS) and Example of Results. Technical Paper, Beijing: World Resources Research Institute. 2020. Available online: http://wri.org.cn/publication (accessed on 10 January 2023).
  20. He, Z.; Zhou, Y.N.; Liu, Y. System Dynamics Simulation of China’s Energy Consumption Structure in 2050—Based on the Transformation Scenario of Key Industries. J. Nat. Resour. 2020, 35, 2696–2707. [Google Scholar] [CrossRef]
  21. Liu, Q.; Tian, C.; Zheng, X.Q.; Chen, Y. Evaluation of policies related to carbon emission reduction in China’s power industry. Resour. Sci. 2017, 39, 2368–2376. [Google Scholar] [CrossRef] [Green Version]
  22. Jin, J.; Wen, Q.; Zhang, X.; Cheng, S.; Guo, X. Economic Emission Dispatch for Wind Power Integrated System with Carbon Trading Mechanism. Energies 2021, 14, 1870. [Google Scholar] [CrossRef]
  23. Yang, L.; Lin, B. Carbon dioxide-emission in China׳s power industry: Evidence and policy implications. Renew. Sustain. Energy Rev. 2016, 60, 258–267. [Google Scholar] [CrossRef]
  24. Sun, W.; Meng, M.; He, Y.; Chang, H. CO2 Emissions from China’s Power Industry: Scenarios and Policies for 13th Five-Year Plan. Energies 2016, 9, 825. [Google Scholar] [CrossRef] [Green Version]
  25. Zhang, X.L.; Cui, X.Q.; Wang, K.; Fu, S.; Zou, J. China’s coal power locks on carbon emissions and its impact on emission reduction targets. China’s Population. Resour. Environ. 2020, 30, 31–41. [Google Scholar] [CrossRef]
  26. David, R.; Li, X. Closing Coal in China: International Experiences to Inform Power Sector Reform Working Paper. 2017. Available online: https://www.smithschool.ox.ac.uk/ (accessed on 10 January 2023).
  27. Liu, Q.; Chen, Y.; Tian, C.; Zheng, X.-Q.; Li, J.-F. Strategic deliberation on development of low-carbon energy system in China. Adv. Clim. Change Res. 2016, 7, 26–34. [Google Scholar] [CrossRef]
Figure 1. Overview of EPS model.
Atmosphere 14 00169 g001
Figure 2. Overview of the “fuel-sector-use emissions” process.
Atmosphere 14 00169 g002
Figure 3. Overview of Power Module.
Atmosphere 14 00169 g003
Figure 4. Cause and effect diagram of “power demand determination” in the power sector.
Atmosphere 14 00169 g004
Figure 5. Change of CO2 emissions in Zhejiang Province under the baseline scenario.
Atmosphere 14 00169 g005
Figure 6. Power generation change in Zhejiang Province under the benchmark scenario.
Atmosphere 14 00169 g006
Figure 7. Change of carbon dioxide emissions in Inner Mongolia under the baseline scenario.
Atmosphere 14 00169 g007
Figure 8. Power generation change in Inner Mongolia under the benchmark scenario.
Atmosphere 14 00169 g008
Figure 9. Changes in CO2 emissions in Zhejiang Province under the carbon pricing scenario.
Atmosphere 14 00169 g009
Figure 10. Power generation change in Zhejiang Province under carbon pricing scenario.
Atmosphere 14 00169 g010
Figure 11. Change of carbon dioxide emissions in Inner Mongolia under carbon pricing scenario.
Atmosphere 14 00169 g011
Figure 12. Power generation change in Inner Mongolia under carbon pricing scenario.
Atmosphere 14 00169 g012
Figure 13. Change of CO2 emissions in Zhejiang Province under the scenario of early retirement of coal power units.
Atmosphere 14 00169 g013
Figure 14. Comparison of CO2 emissions in Zhejiang Province under three scenarios.
Atmosphere 14 00169 g014
Figure 15. Power generation change in Zhejiang Province under the scenario of early retirement of coal power units.
Atmosphere 14 00169 g015
Figure 16. Change of carbon dioxide emissions in Inner Mongolia under the scenario of early re-tirement of coal power units.
Atmosphere 14 00169 g016
Figure 17. Comparison of carbon dioxide emissions in Inner Mongolia under three scenarios.
Atmosphere 14 00169 g017
Figure 18. Power generation change in Inner Mongolia under the scenario of early retirement of coal power units.
Atmosphere 14 00169 g018
Table 1. Comparison of basic data between Zhejiang Province and Inner Mongolia Autonomous Region in 2020.
IndexZhejiang ProvinceInner Mongolia Autonomous Region
Population (10,000)6456.82404.9
Regional GDP (USD 100 million)9230.52480.0
GDP per capita (USD 10,000/person)1.431.03
Total import and export (USD 100 million)4834.0150.2
Total energy production (10,000 tons of standard coal, 2019)2937.064,214.7
Total energy consumption (10,000 tons of standard coal, 2019)22,393.025,345.6
Data source: Zhejiang Statistical Yearbook 2021, Inner Mongolia Statistical Yearbook 2021.
Table 2. EPS Model Data and Sources in Inner Mongolia.
Variable NameImportanceSource
Amount spent on building components under the reference scenarioHighUS EPS model, per capita GDP ratio of Inner Mongolia Autonomous Region and the US
US EPS model, per capita GDP ratio of Inner Mongolia Autonomous Region and the USVery highResearch on Building Energy Saving Standards and Implementation Mechanism Based on Total Energy Consumption Control, Inner Mongolia Statistical Yearbook, American EPS Model, and the per capita GDP ratio of Inner Mongolia Autonomous Region and the United States
Future GDP growthVery highChina Statistical Yearbook, IMF World Economic Outlook
Heating proportion of different fuel types under the reference scenarioHighInner Mongolia Energy Balance Table 2017
Retired unit capacity under the reference scenarioHighChina Electricity Statistics Yearbook 2020
Proportion of renewable energy power generation under the reference scenarioHighChina Energy Statistics Yearbook 2019, China Power Statistics Yearbook 2020
Transmission and distribution loss rate under the reference scenarioHighInner Mongolia Statistical Yearbook 2018, Inner Mongolia Power Balance Sheet
Incoming and outgoing electric quantity of Inner Mongolia Autonomous RegionHighInner Mongolia Statistical Yearbook 2018, Inner Mongolia Power Balance Sheet
Future maximum growth space of installed capacityVery highRelevant planning of Inner Mongolia Autonomous Region and consultation with relevant experts
Maximum potential installed capacityHighRelevant planning of Inner Mongolia Autonomous Region and consultation with relevant experts
Initial annual installed capacityHighChina Electricity Statistics Yearbook 2020, China Energy Development Report 2017
Flexibility of power generation equipmentMidCIGRE-related research results, and consult relevant experts
Forest carbon sink under the reference scenarioVery highInner Mongolia Statistical Yearbook 2018, statistical data of land resources in Inner Mongolia Autonomous Region, US EPS model
Potential land area affected by new policies within one yearVery highInner Mongolia Statistical Yearbook 2018, US EPS model, land area ratio between Inner Mongolia Autonomous Region and the US
Annual average mileage of different types of vehicles under the reference scenarioHighWind database, Technical Guidelines for the Preparation of Air Pollutants Emission Inventory of Road Vehicles (Trial) issued by the Ministry of Ecology and Environment, Statistical Bulletin on the Development of China’s Civil Aviation Industry in 2015
Subsidy proportion of electric vehicles under the reference scenarioHighImplementation Opinions on Accelerating the Promotion and Application of New Energy Vehicles of Inner Mongolia Autonomous Region
Minimum requirements for the proportion of electric vehicle sales under the reference scenarioHighMongolia Autonomous Region, and Medium and Long term Development Plan of Automobile Industry of Ministry of Industry and Information Technology, and consult relevant experts
Proportion of vehicles owned by different entitiesHighInner Mongolia Statistical Yearbook 2018, China Public Transport Resources Atlas
Vehicle ownership in the starting year (2017)Very highInner Mongolia Statistical Yearbook 2018, statistical bulletin on the development of civil aviation industry over the years, US EPS model
Disclaimer/Publisher’s Note: The statements, opinions and data contained in all publications are solely those of the individual author(s) and contributor(s) and not of MDPI and/or the editor(s). MDPI and/or the editor(s) disclaim responsibility for any injury to people or property resulting from any ideas, methods, instructions or products referred to in the content.

