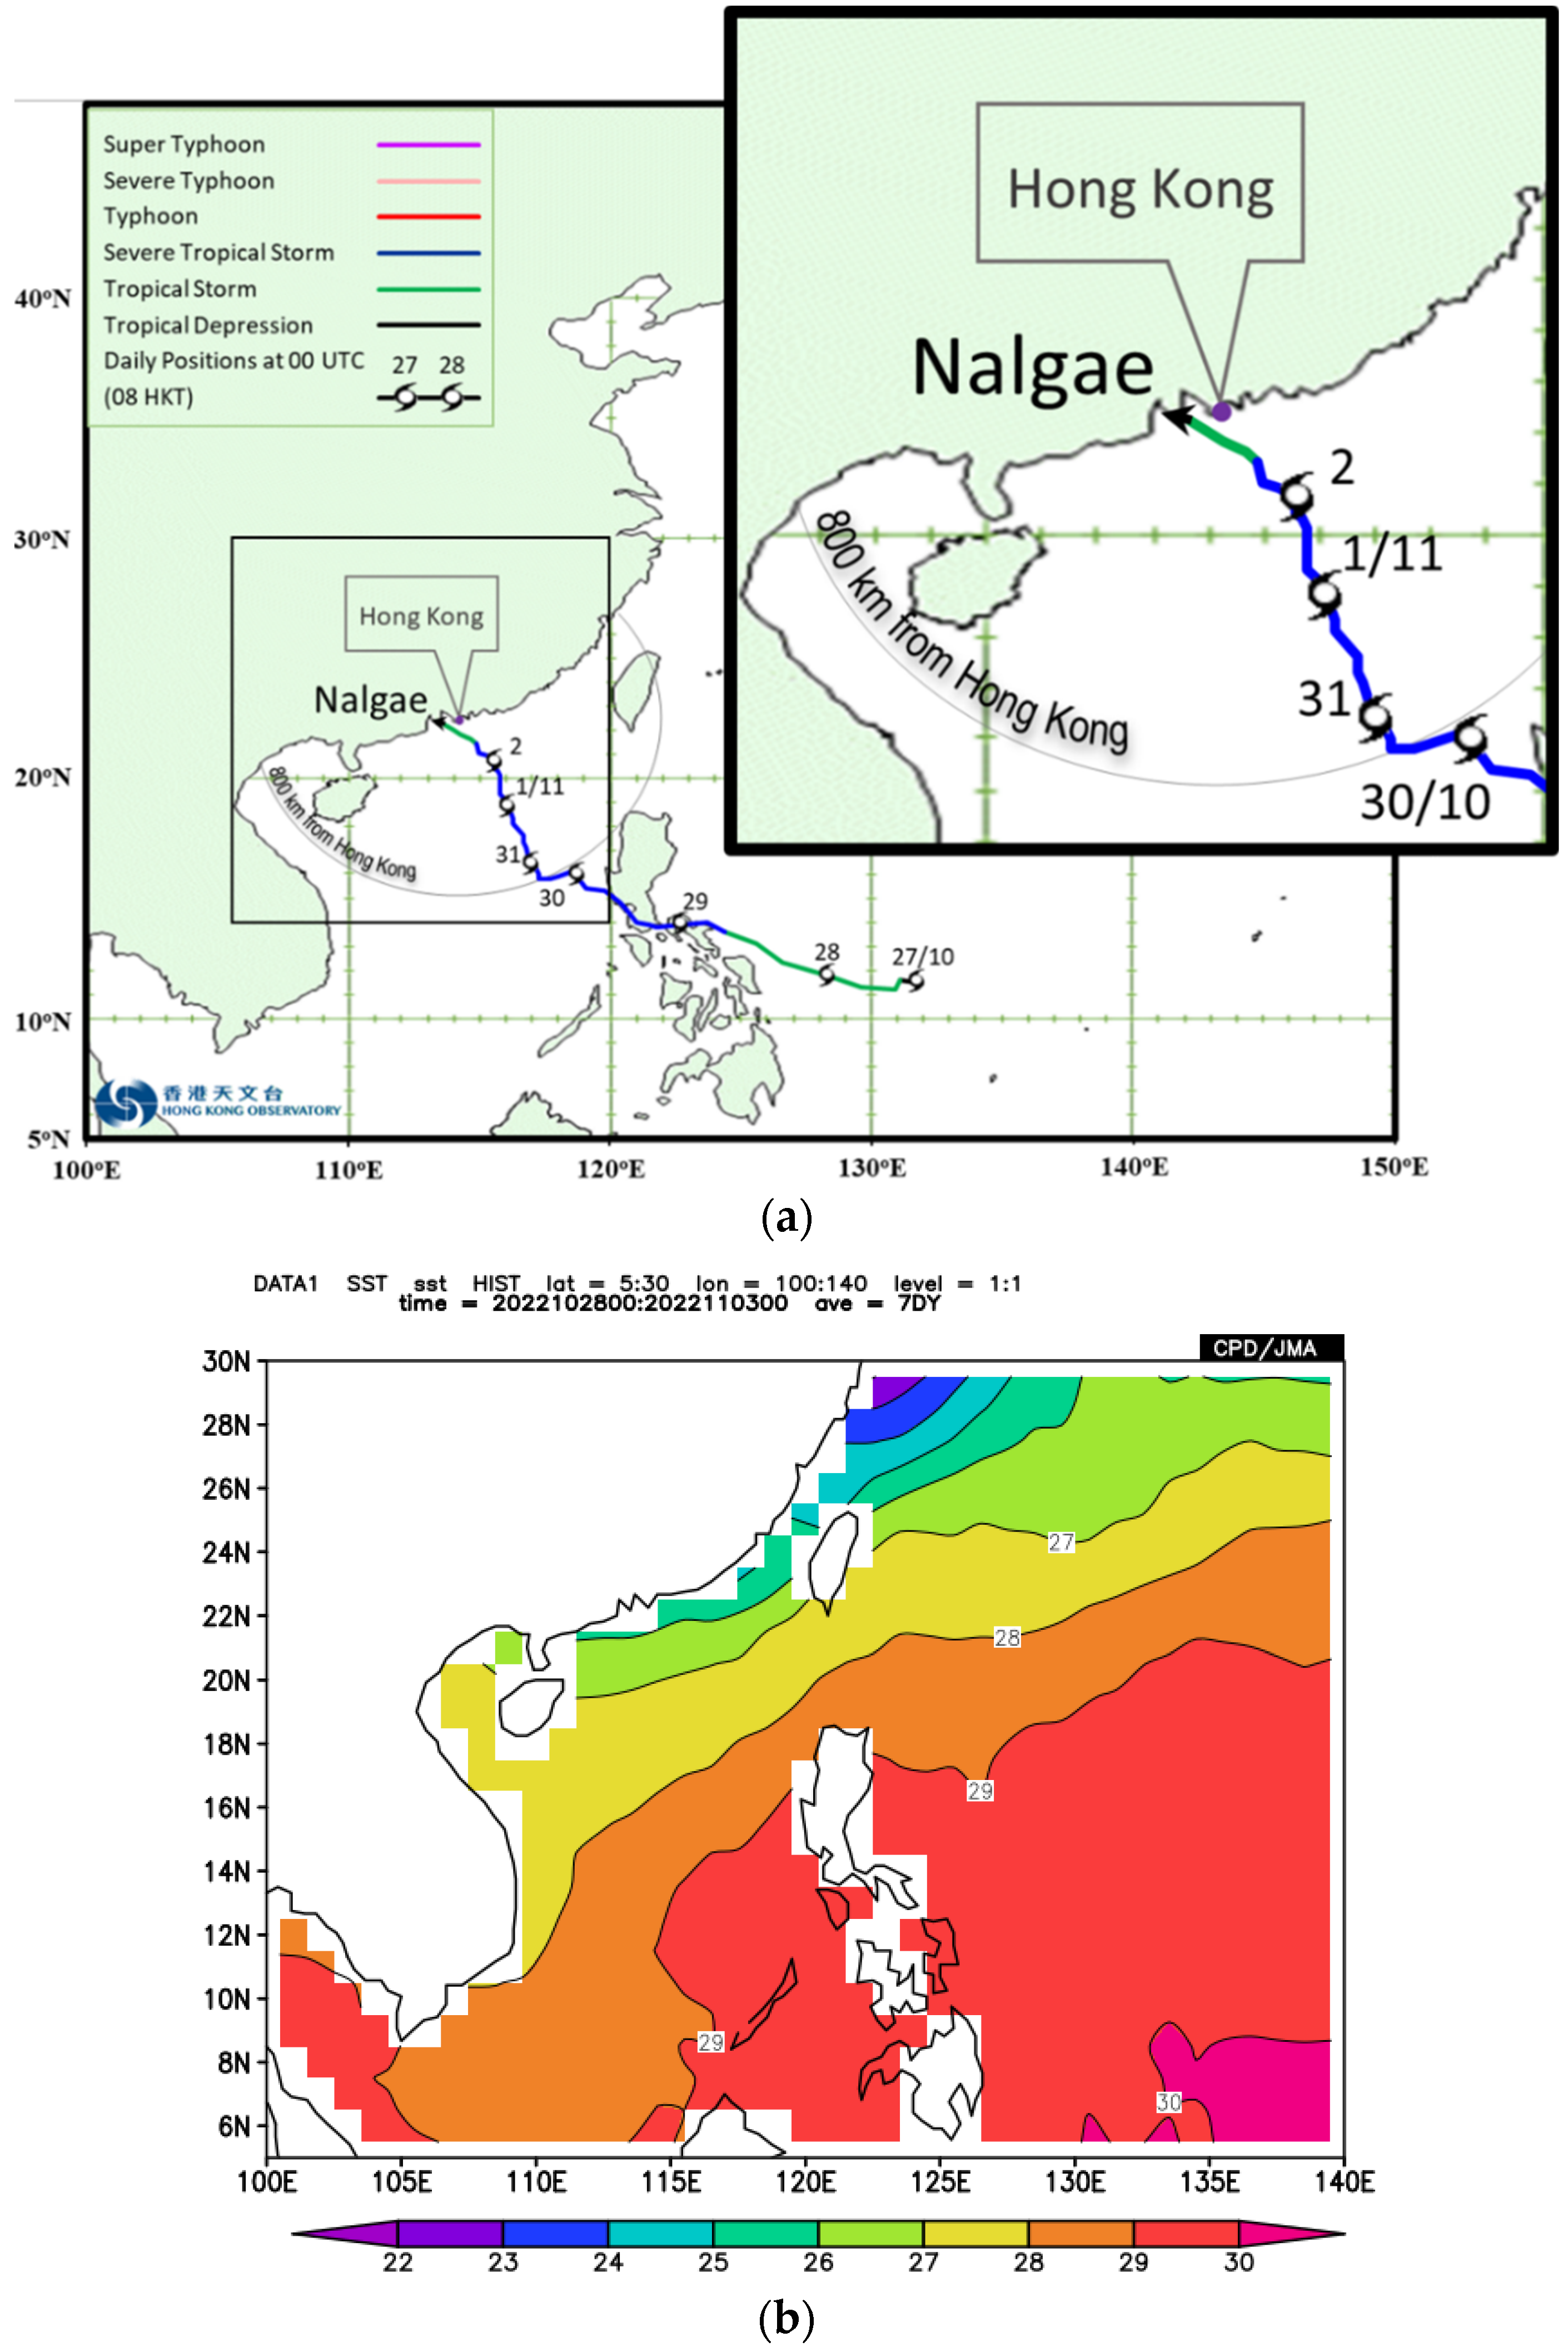
Figure 1.
(a) is the provisional track of Nalgae and (b) is the average sea surface temperature over the South China Sea and the western north Pacific between 28 October and 3 November 2022, based on COBE-SST dataset from Japan Meteorological Agency (JMA).
Figure 1.
(a) is the provisional track of Nalgae and (b) is the average sea surface temperature over the South China Sea and the western north Pacific between 28 October and 3 November 2022, based on COBE-SST dataset from Japan Meteorological Agency (JMA).
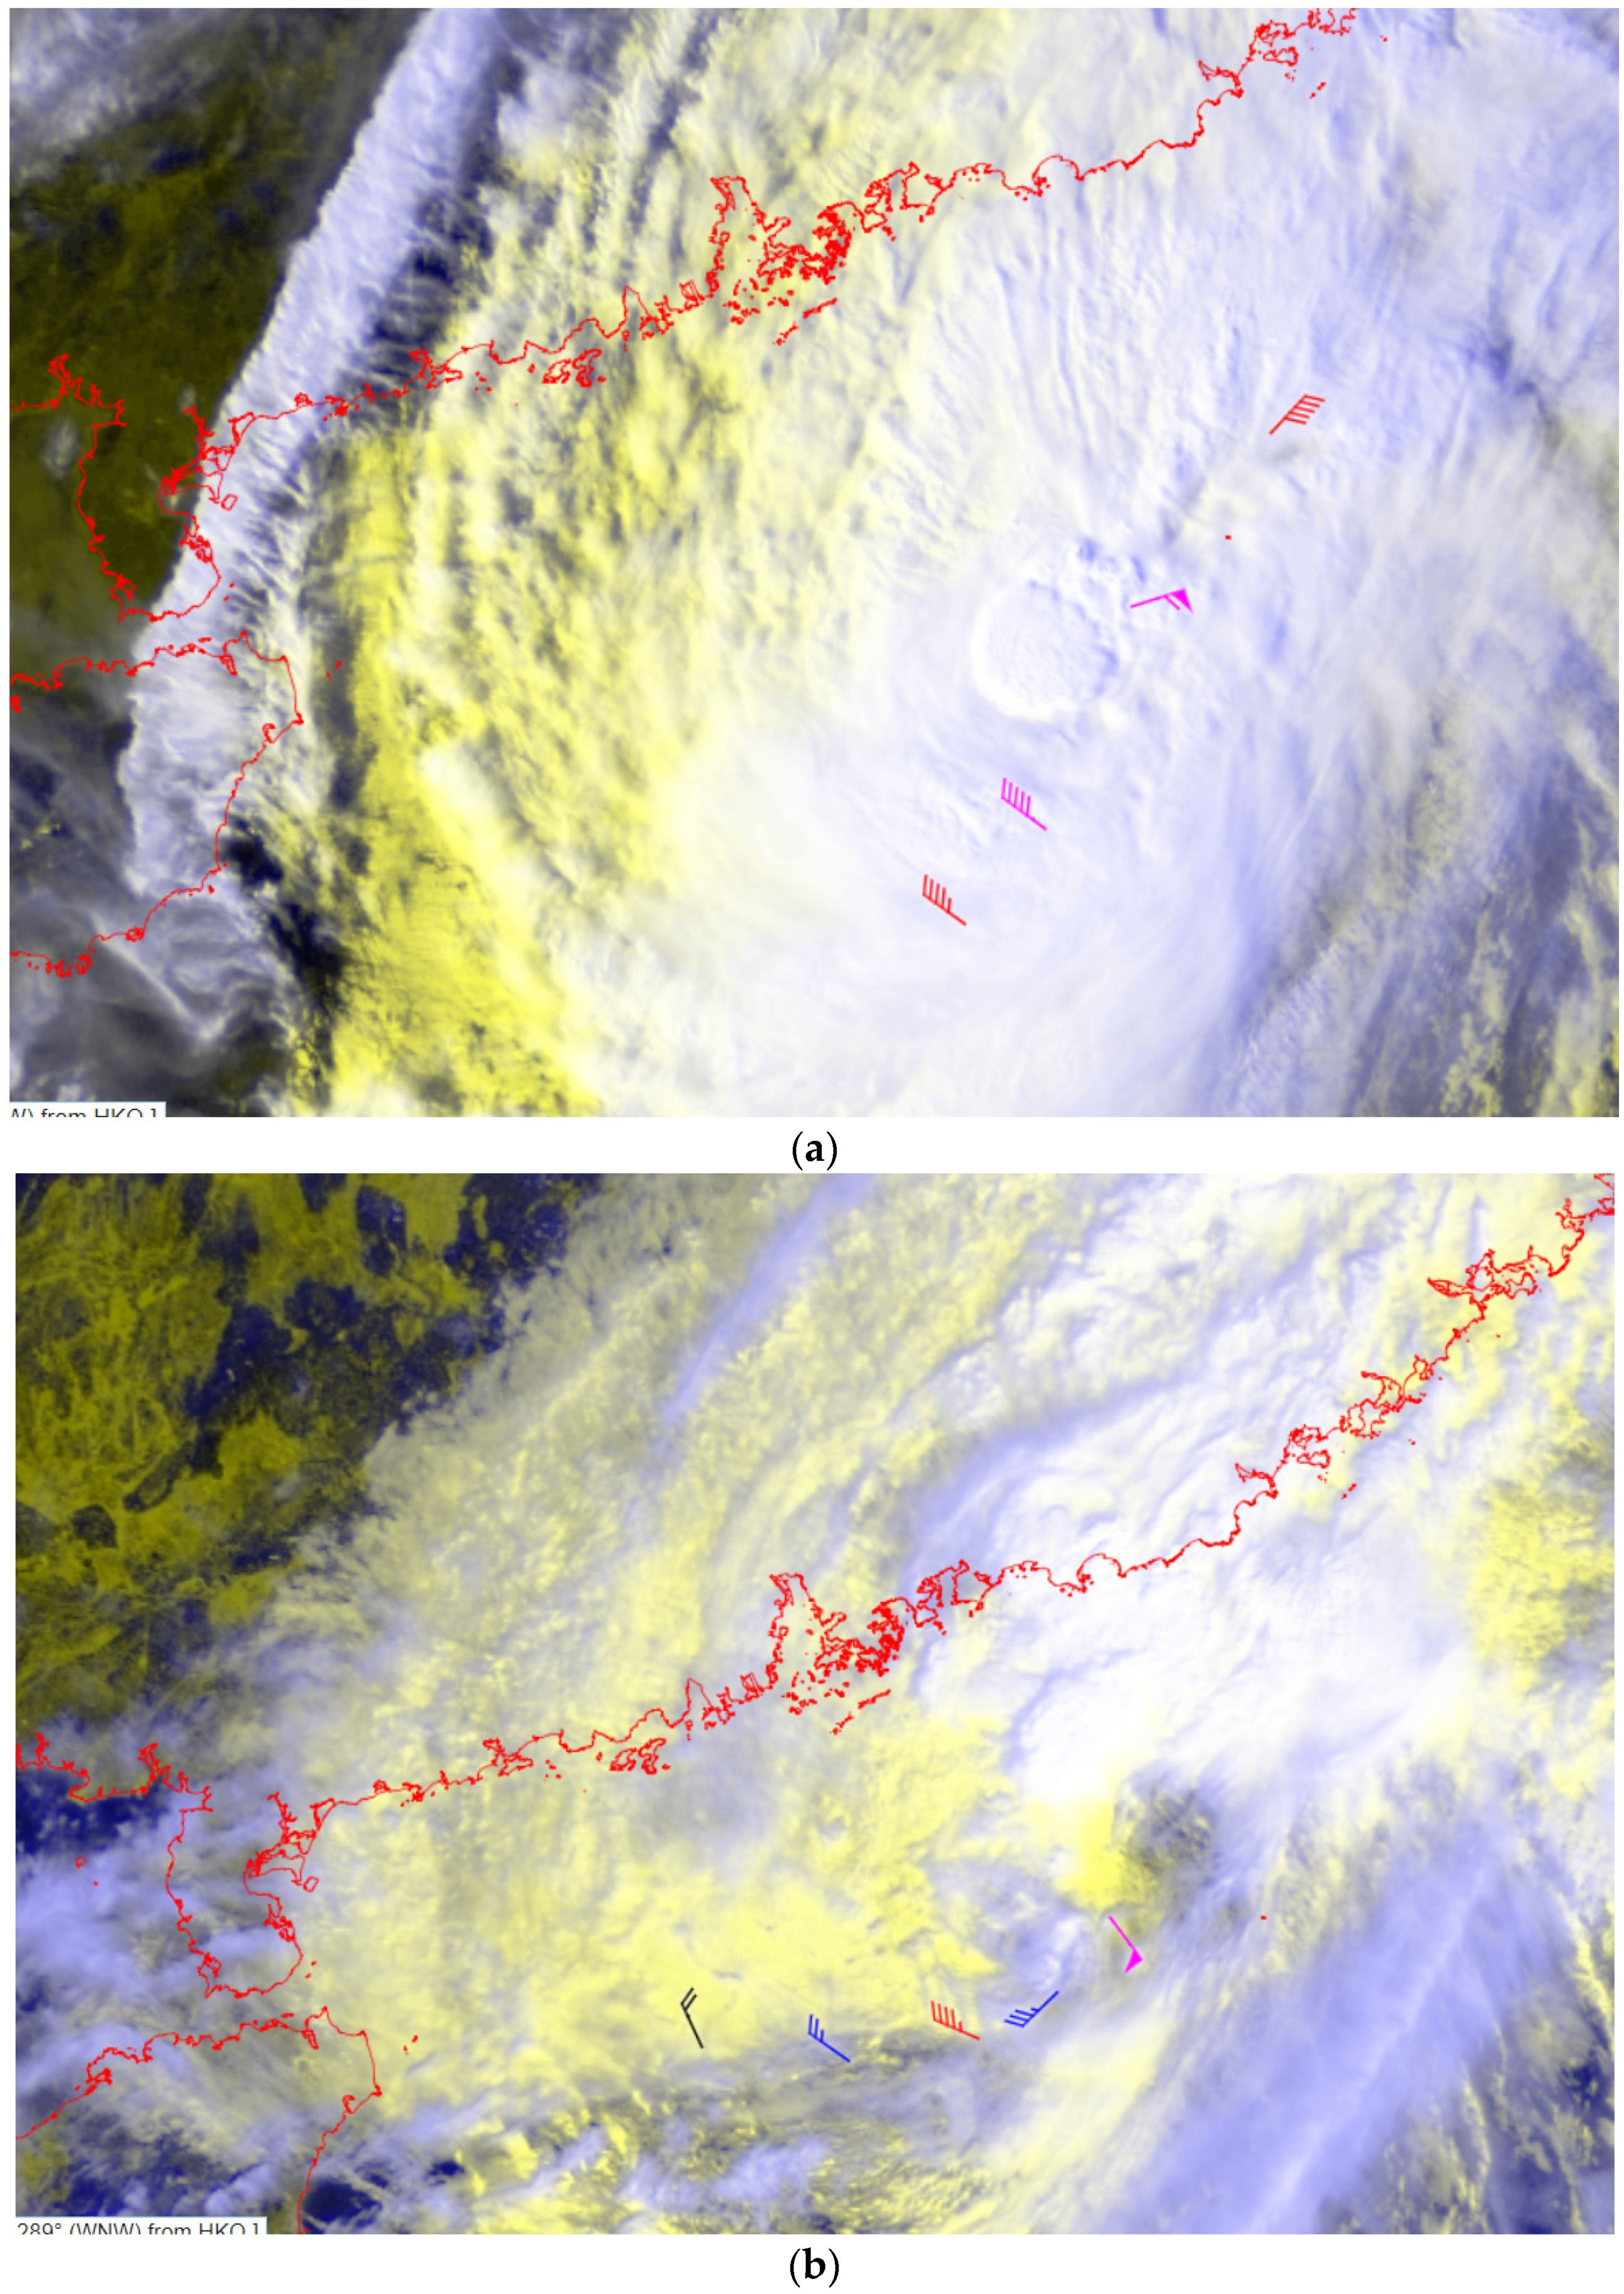
Figure 2.
Dropsonde data (winds below 50 m) overlaid on false-color satellite imagery at (a) around 0700 UTC on 1 November 2022 and (b) around 0200 UTC on 2 November 2022. The satellite imagery was originally captured by Himawari-8 Satellite (H-8) of Japan Meteorological Agency (JMA).
Figure 2.
Dropsonde data (winds below 50 m) overlaid on false-color satellite imagery at (a) around 0700 UTC on 1 November 2022 and (b) around 0200 UTC on 2 November 2022. The satellite imagery was originally captured by Himawari-8 Satellite (H-8) of Japan Meteorological Agency (JMA).
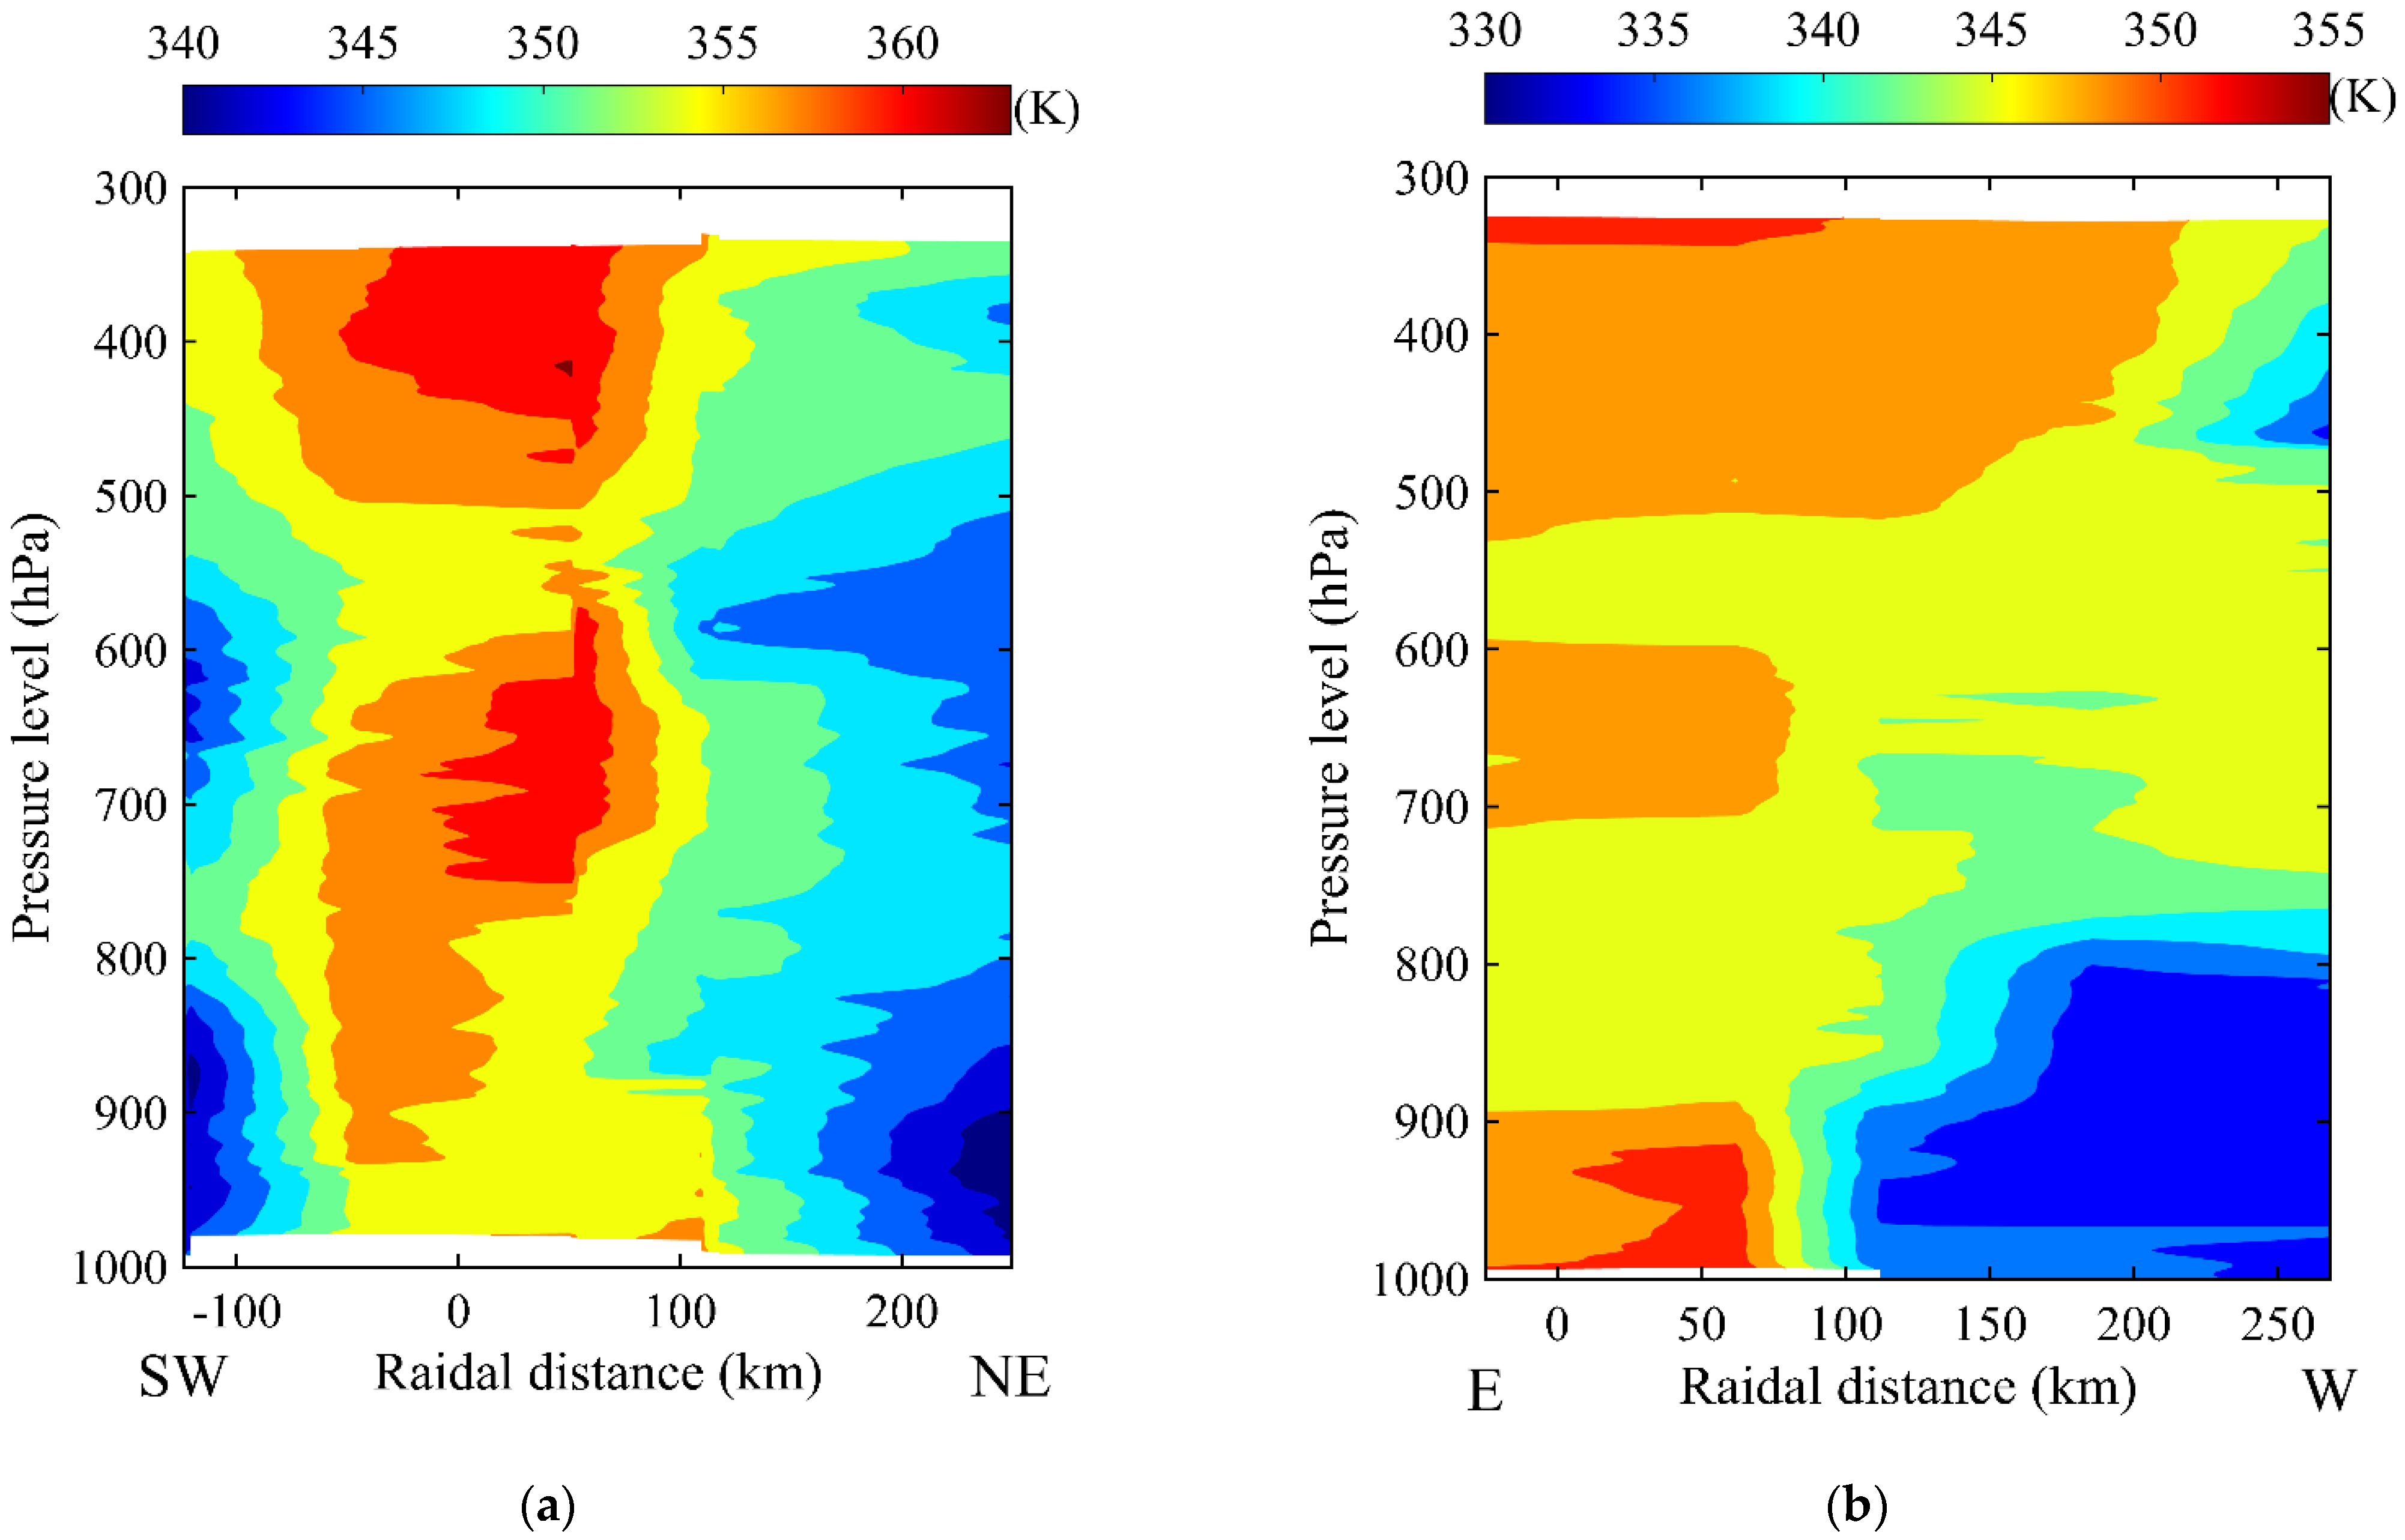
Figure 3.
Contour plot of equivalent potential temperature considering all the sondes at (a) around 0700 UTC on 1 November 2022 and (b) around 0200 UTC on 2 November 2022.
Figure 3.
Contour plot of equivalent potential temperature considering all the sondes at (a) around 0700 UTC on 1 November 2022 and (b) around 0200 UTC on 2 November 2022.
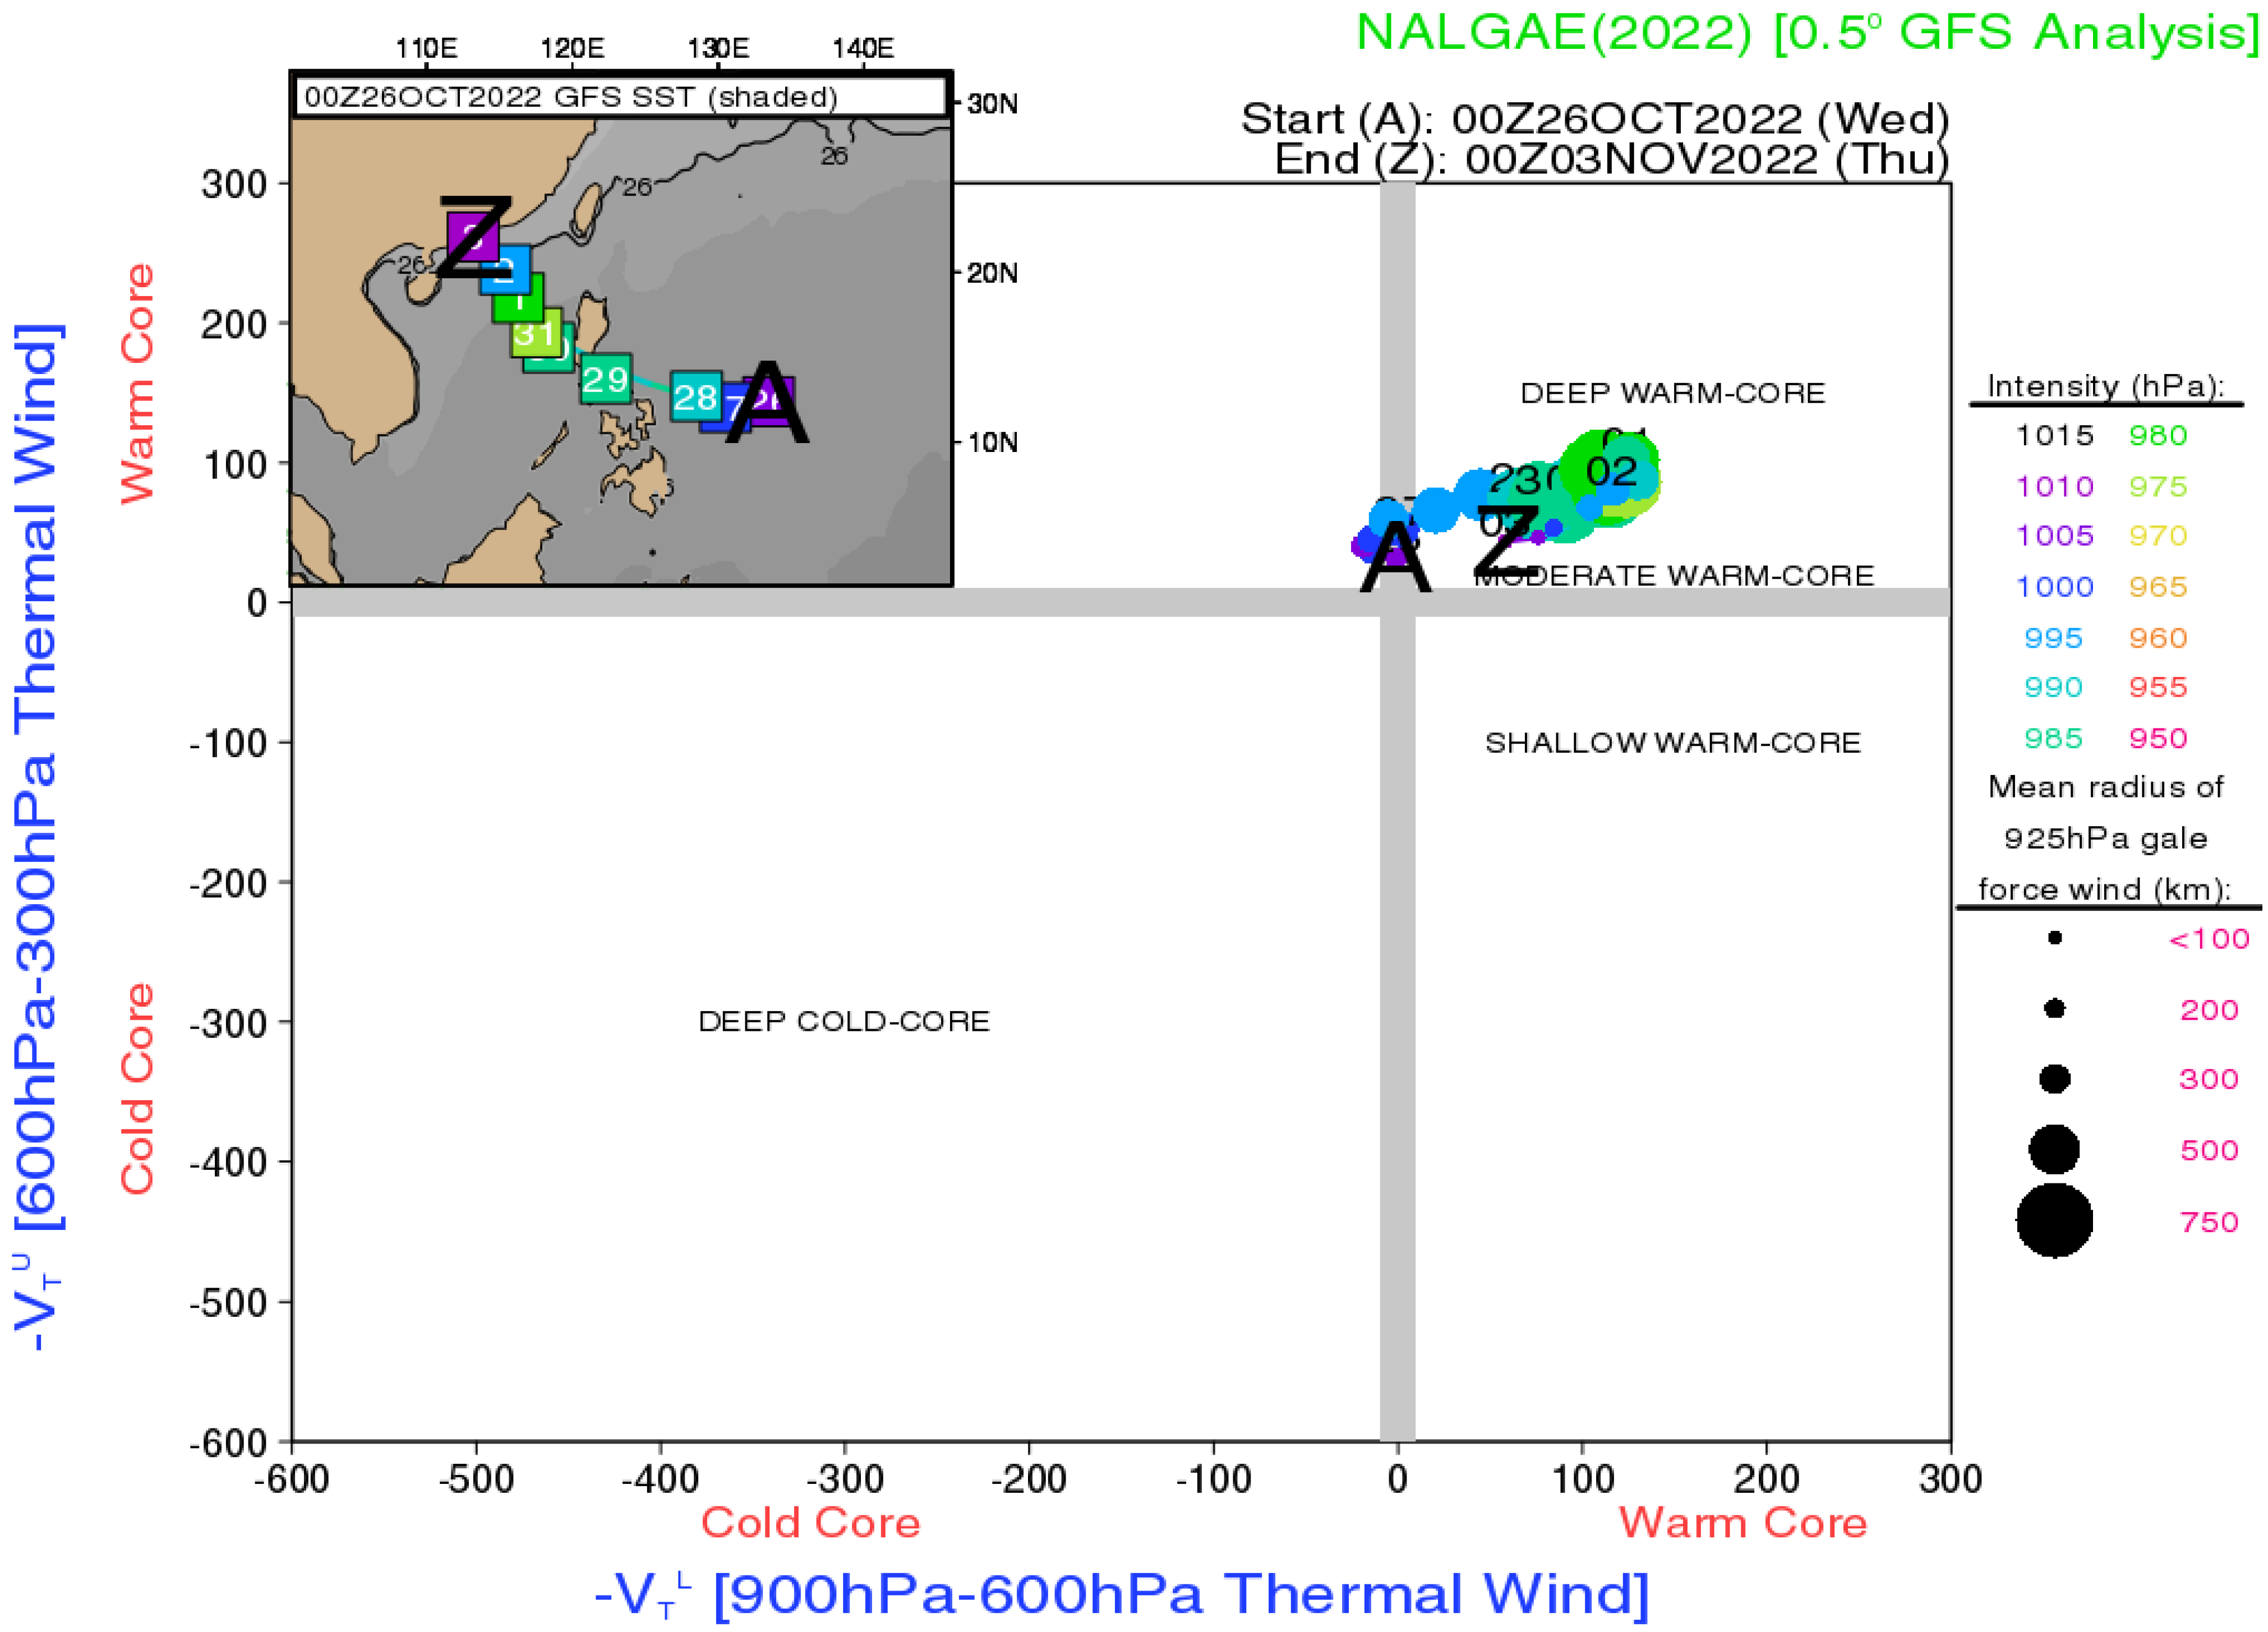
Figure 4.
The cyclone phase analysis [
2] of Nalgae based on 0.50 Global Forecast System (GFS) analysis between 00 UTC 26 October 2022 and 00 UTC 3 November 2022. The inset gives the track of Nalgae and the model analysis Sea Surface Temperature field (SST, in degrees Celsius). The black “A” and “Z” indicates the beginning and the end of the life cycle of Nalgae. A marker is placed every 12 h. The shading of each marker indicates cyclone Mean Sea Level Pressure (MSLP) and the size of the circular marker within the phase space indicates the relative size (mean radius) of the 925-hPa gale force wind field. Positions at 0000 UTC are labeled with the day. Image courtesy of Cyclone Phase webpage (
https://moe.met.fsu.edu/cyclonephase/, accessed on 12 January 2023).
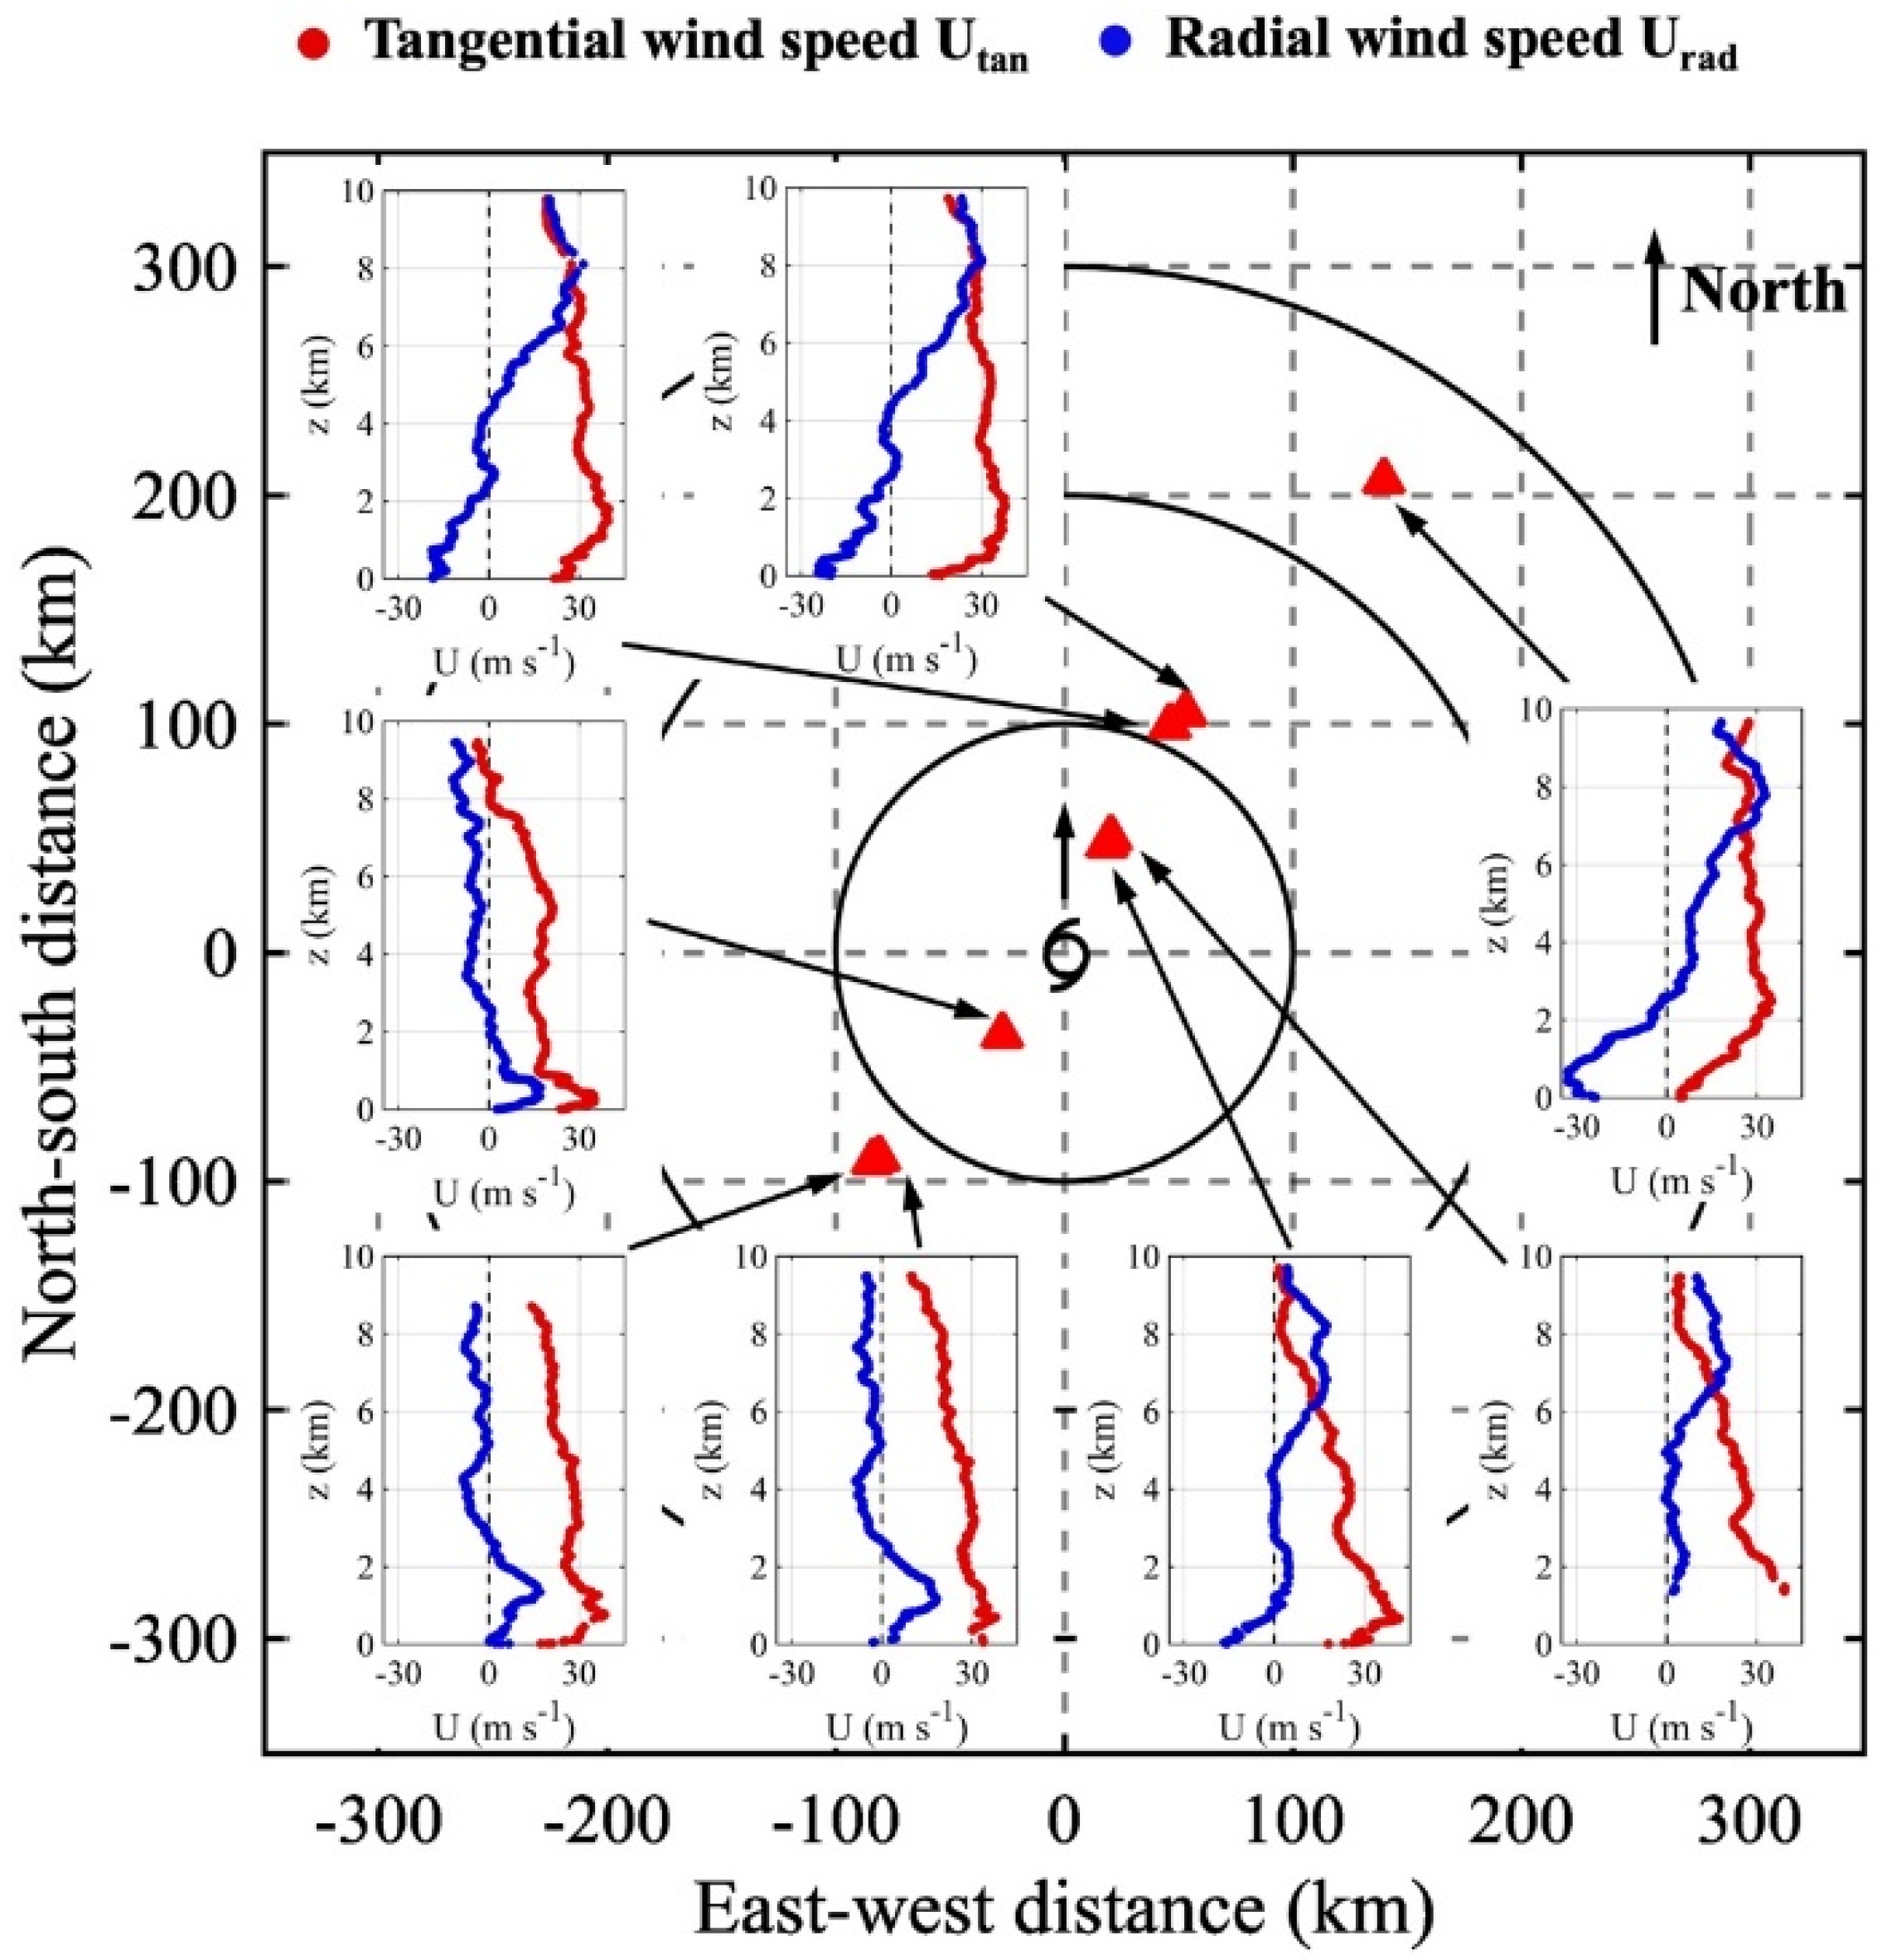
Figure 5.
Vertical profiles of tangential (red) and radial (blue) wind speeds in Severe Tropical Storm Nalgae at 0700UTC 1 November 2022. Tangential wind speed: anti-clockwise positive; radial wind speed: outflow positive. Red triangles represent dropsonde locations relative to the storm center.
Figure 5.
Vertical profiles of tangential (red) and radial (blue) wind speeds in Severe Tropical Storm Nalgae at 0700UTC 1 November 2022. Tangential wind speed: anti-clockwise positive; radial wind speed: outflow positive. Red triangles represent dropsonde locations relative to the storm center.
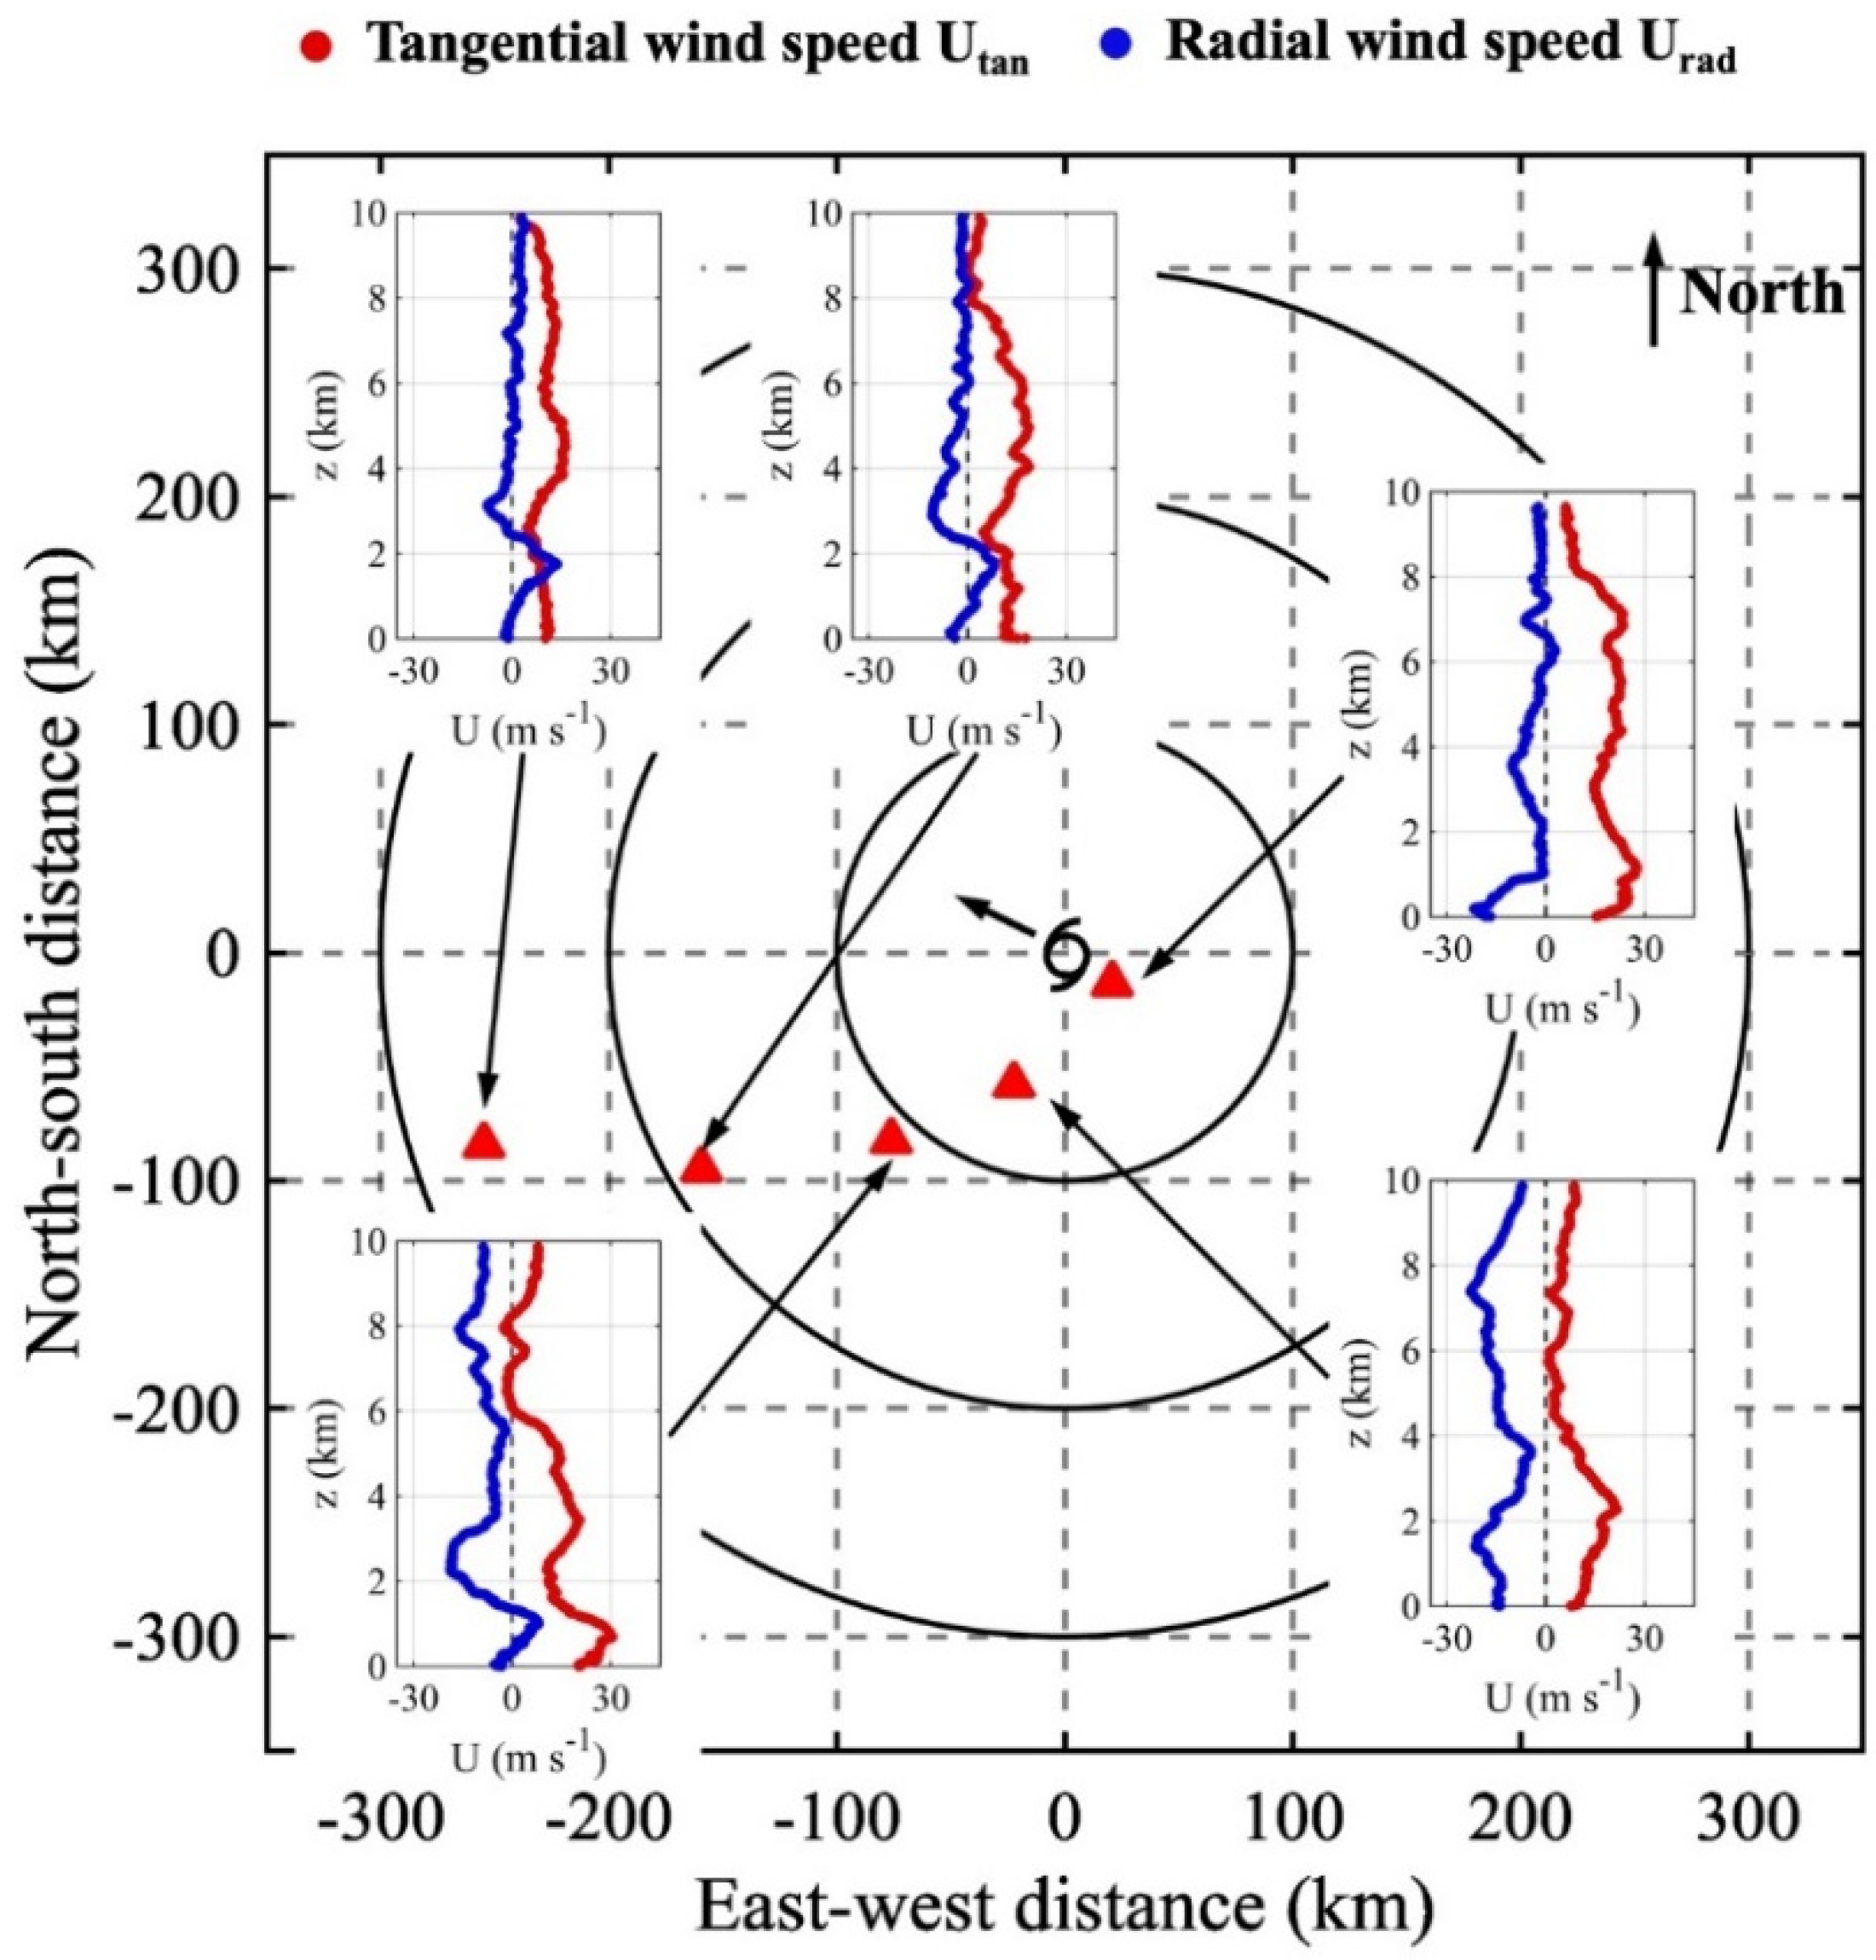
Figure 6.
Vertical profiles of tangential (red) and radial (blue) wind speeds in Severe Tropical Storm Nalgae at 0100 UTC 2 November 2022. Tangential wind speed: anti-clockwise positive; radial wind speed: outflow positive. Red triangles represent dropsonde locations relative to the storm center.
Figure 6.
Vertical profiles of tangential (red) and radial (blue) wind speeds in Severe Tropical Storm Nalgae at 0100 UTC 2 November 2022. Tangential wind speed: anti-clockwise positive; radial wind speed: outflow positive. Red triangles represent dropsonde locations relative to the storm center.
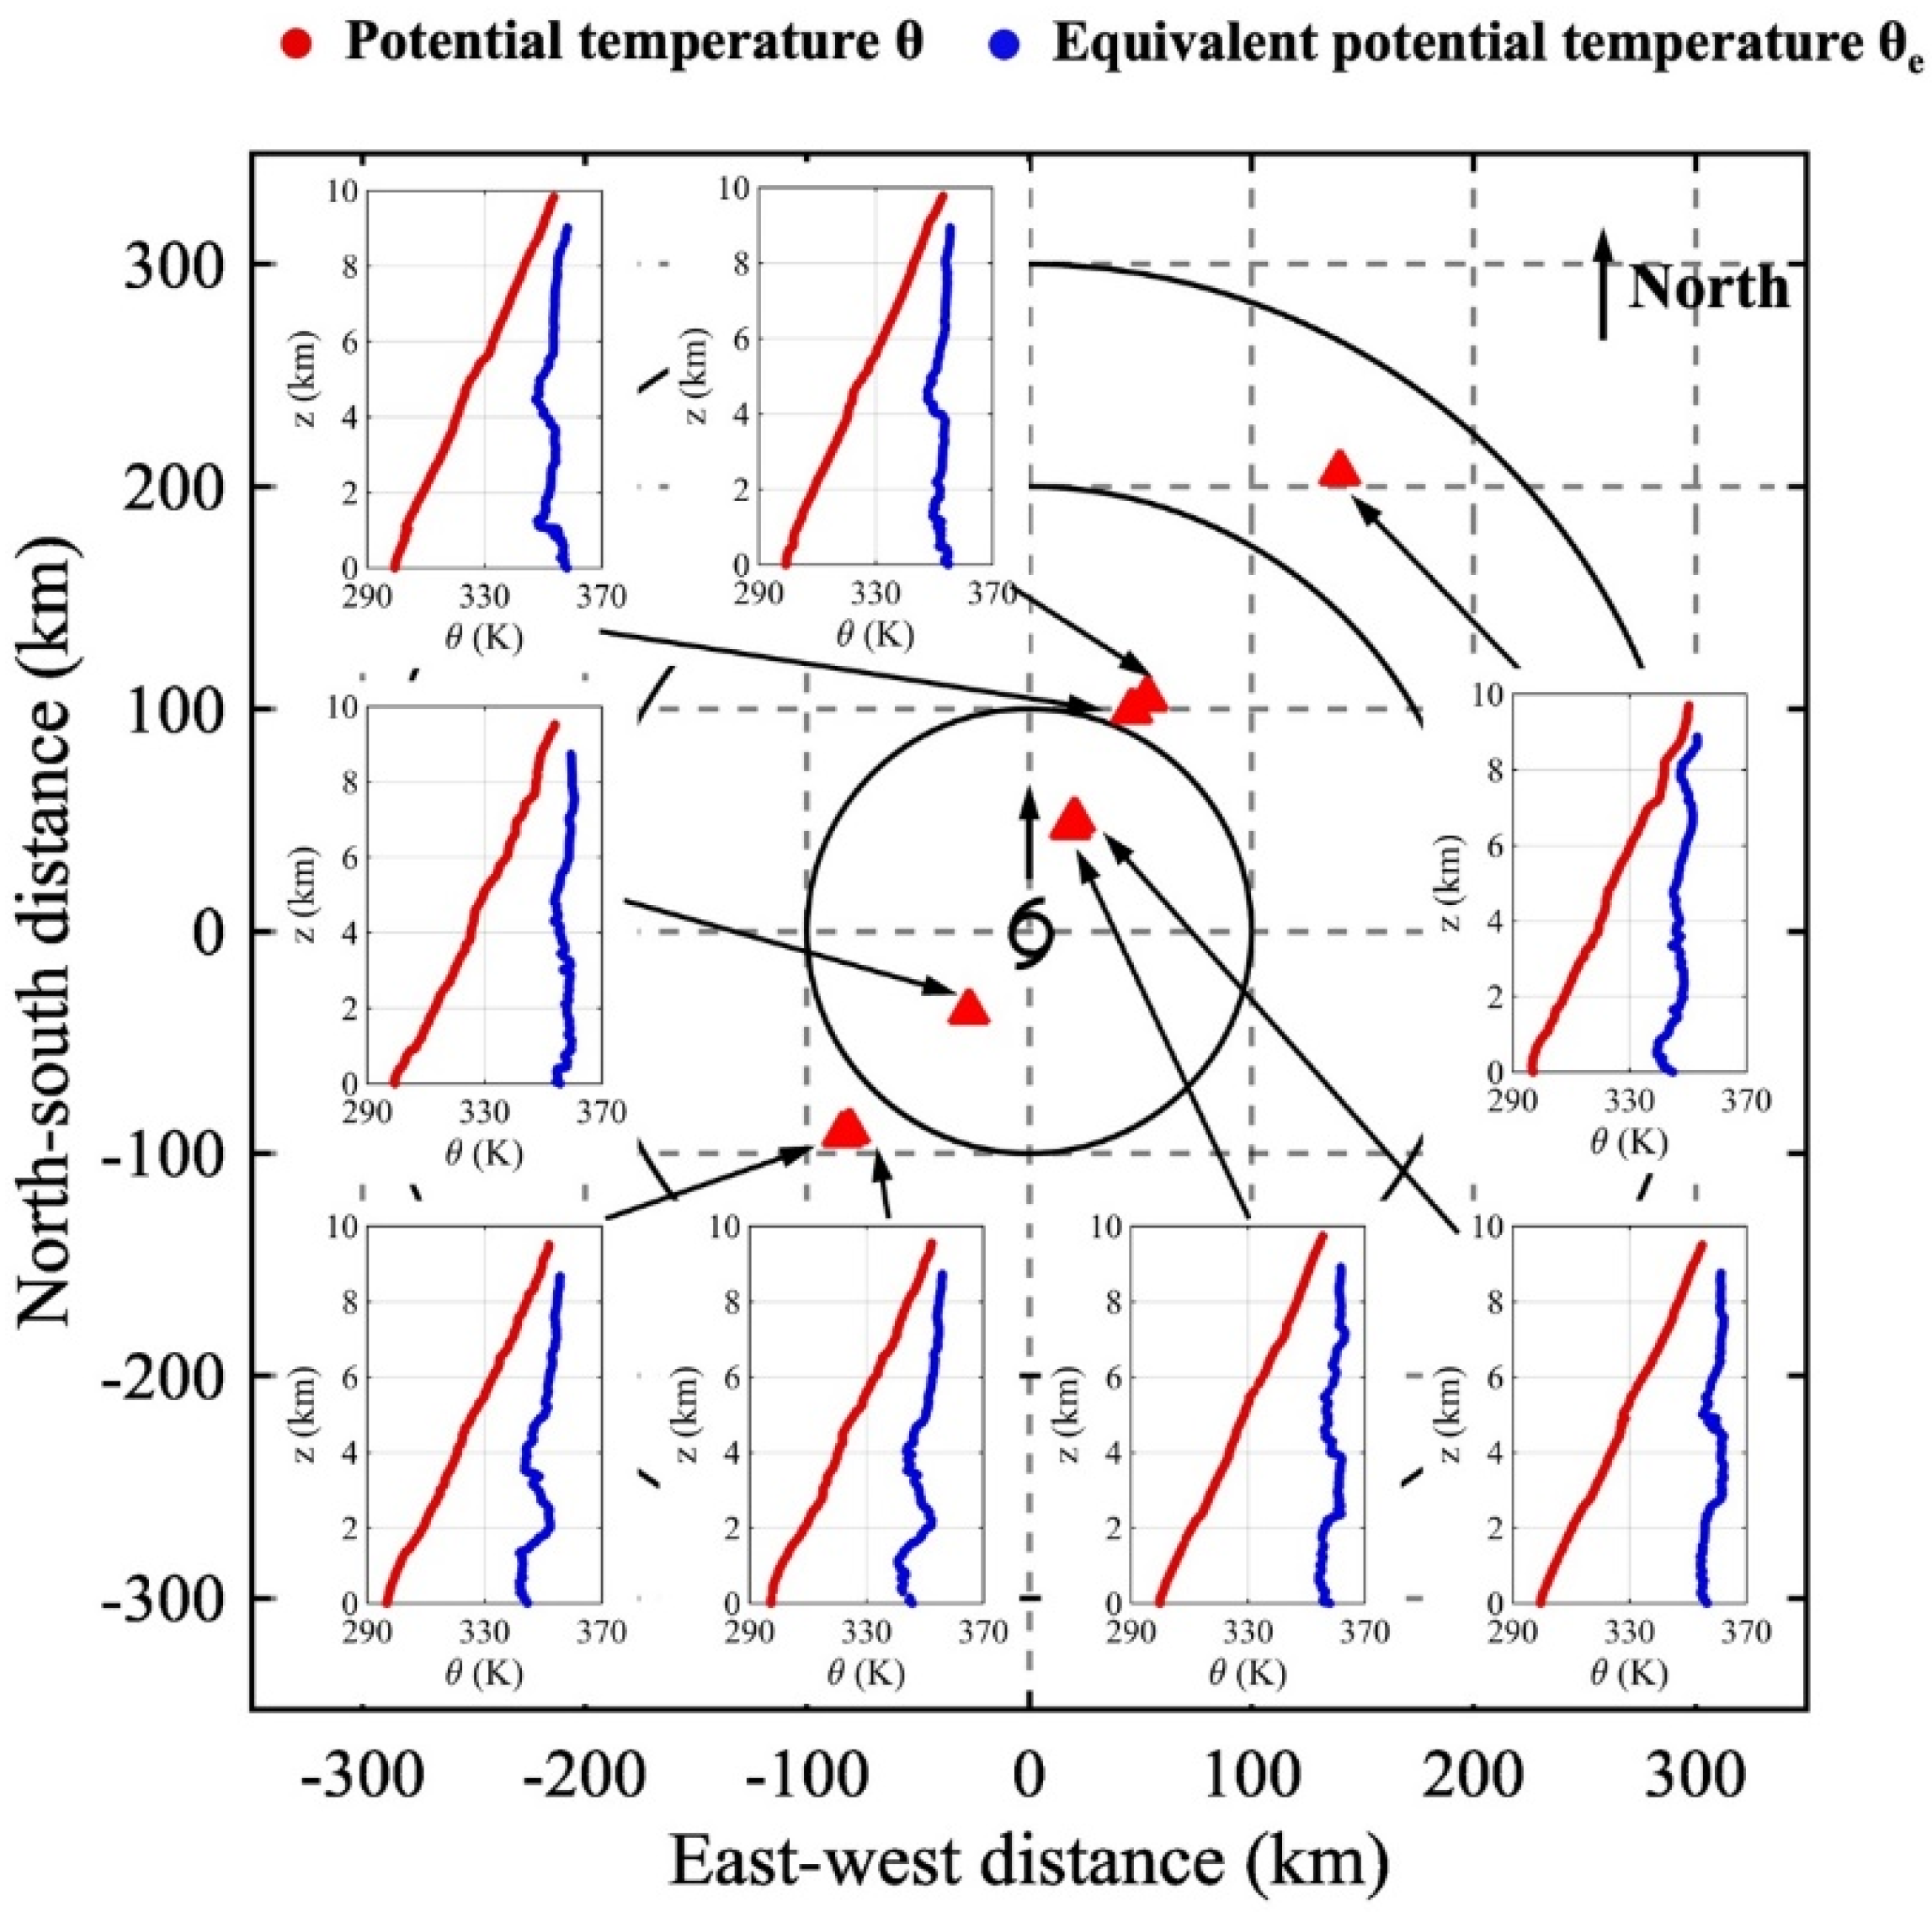
Figure 7.
Vertical profiles of potential temperature (red) and equivalent potential temperature (blue) in Severe Tropical Storm Nalgae at 0700 UTC 1 November 2022. Red triangles represent dropsonde locations relative to the storm center.
Figure 7.
Vertical profiles of potential temperature (red) and equivalent potential temperature (blue) in Severe Tropical Storm Nalgae at 0700 UTC 1 November 2022. Red triangles represent dropsonde locations relative to the storm center.
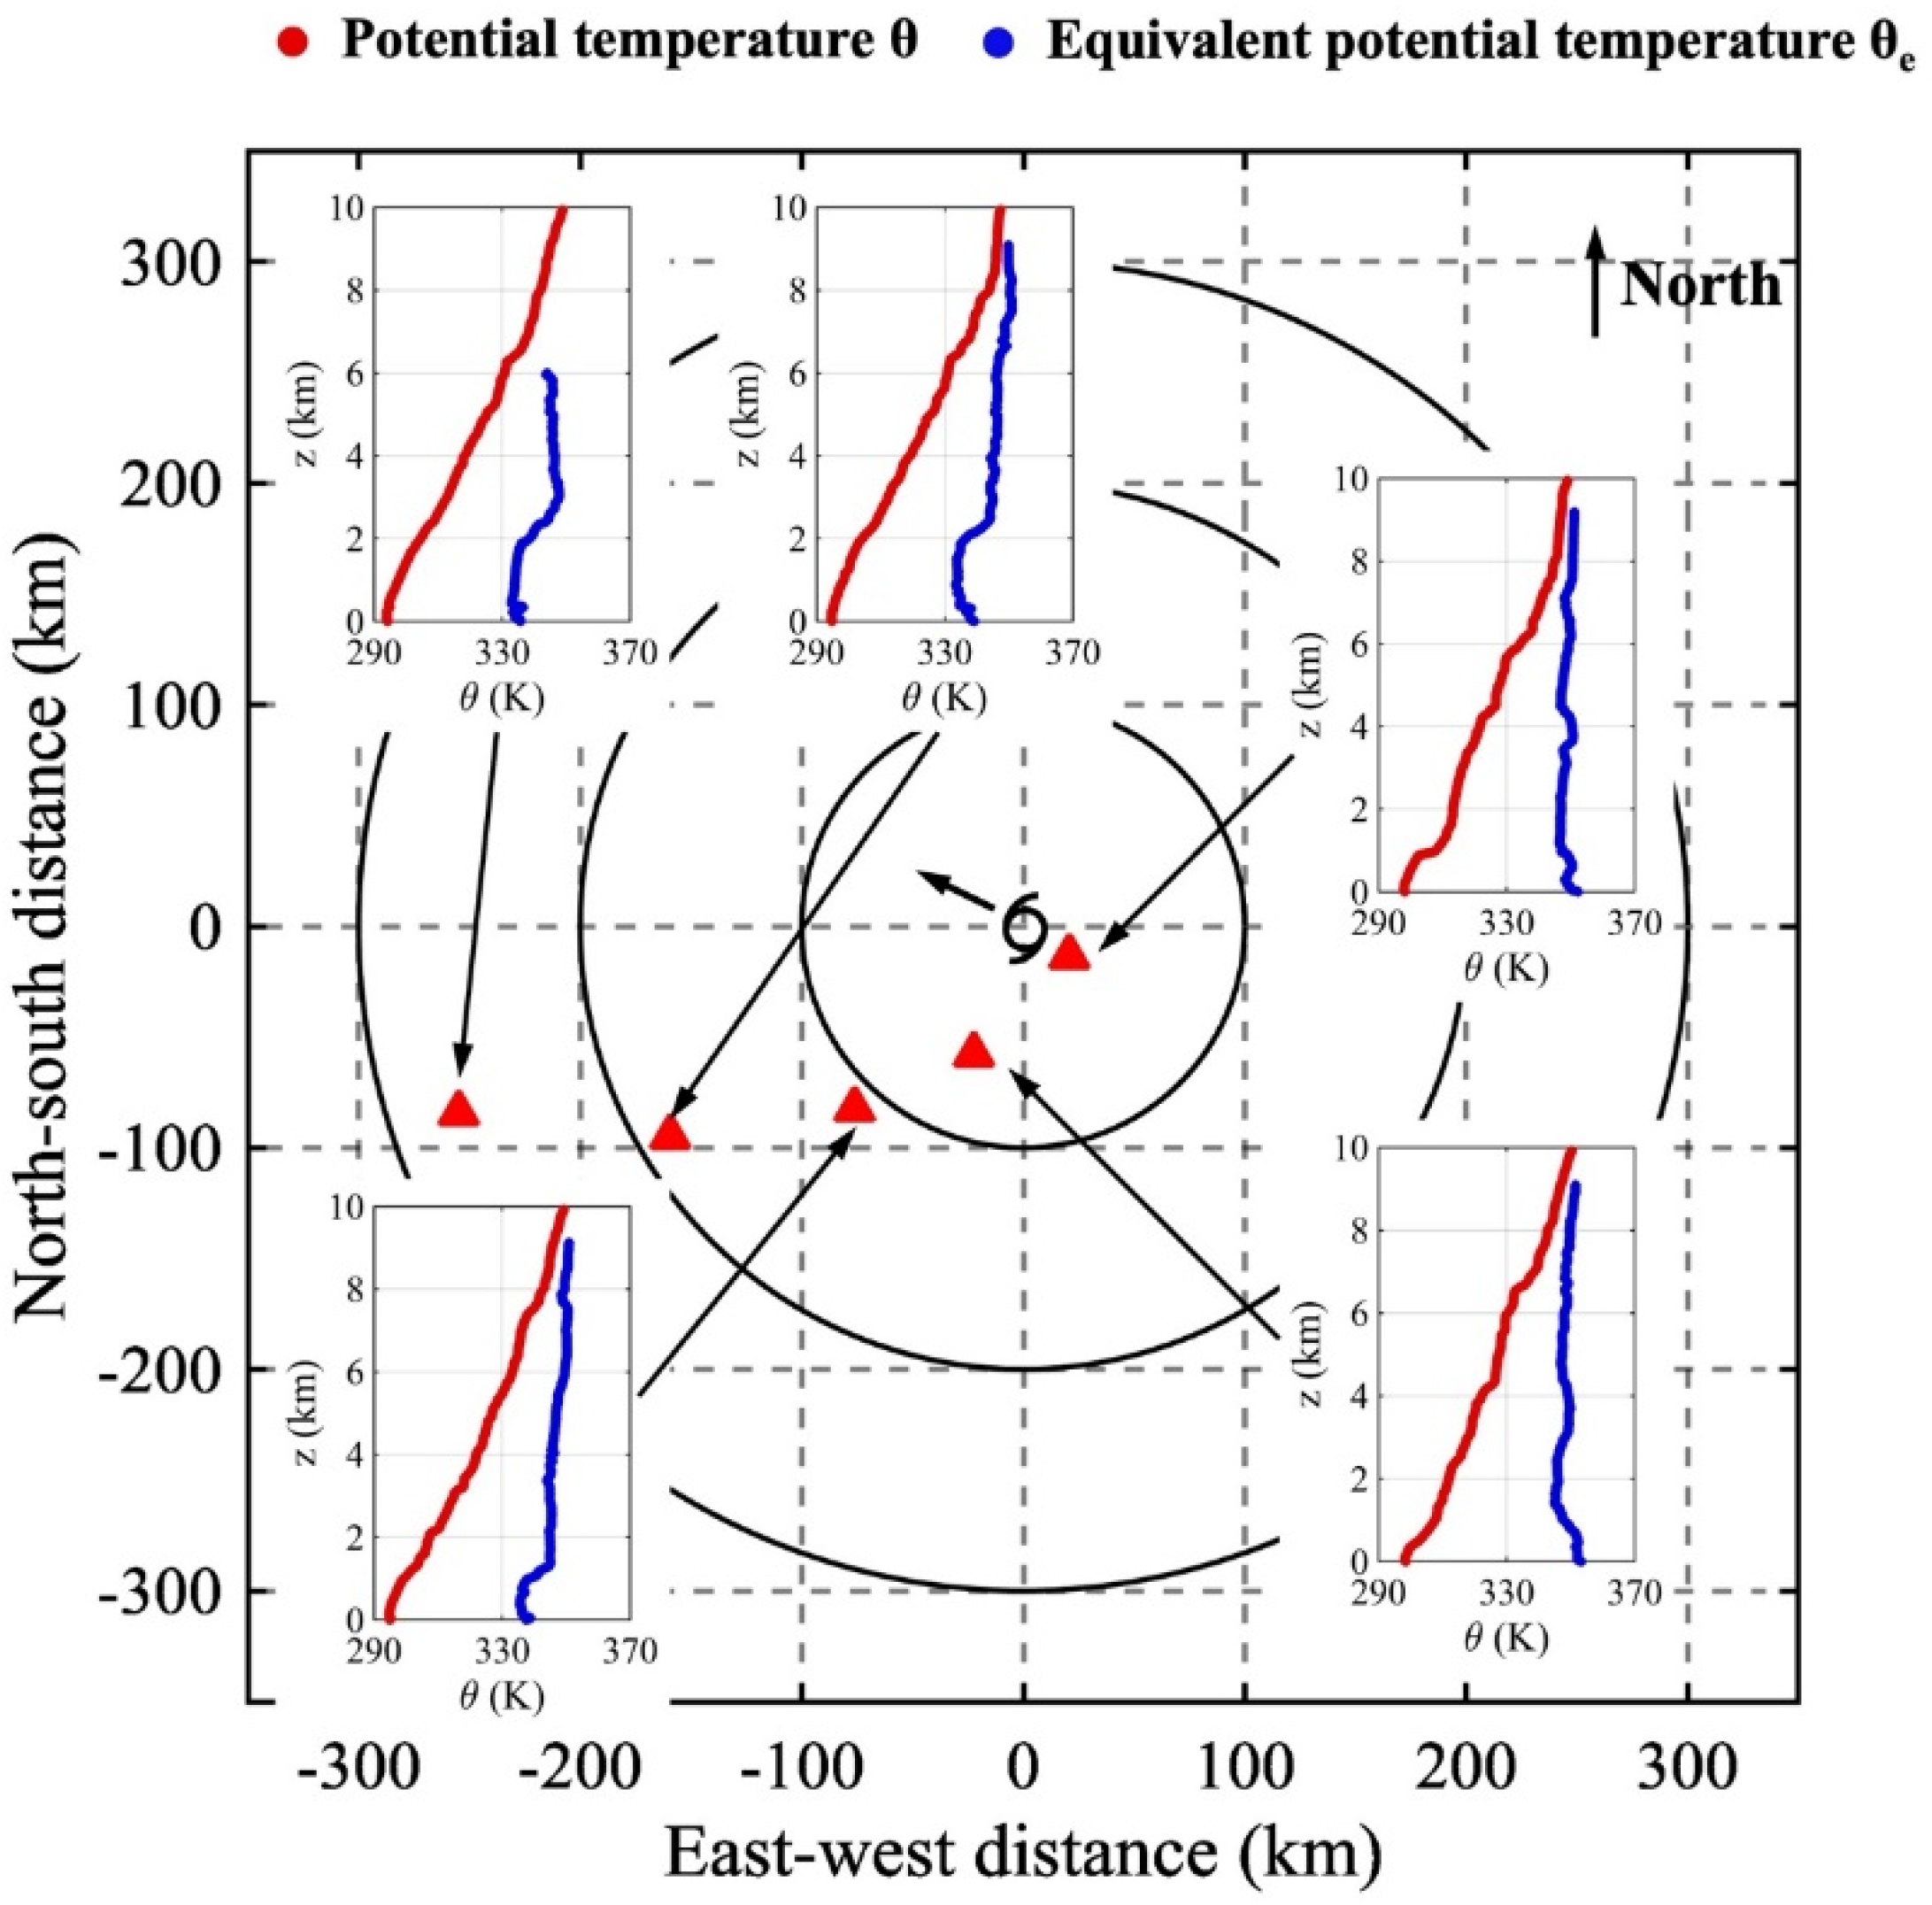
Figure 8.
Vertical profiles of potential temperature (red) and equivalent potential temperature (blue) in Severe Tropical Storm Nalgae at 0100 UTC 2 November 2022. Red triangles represent dropsonde locations relative to the storm center.
Figure 8.
Vertical profiles of potential temperature (red) and equivalent potential temperature (blue) in Severe Tropical Storm Nalgae at 0100 UTC 2 November 2022. Red triangles represent dropsonde locations relative to the storm center.
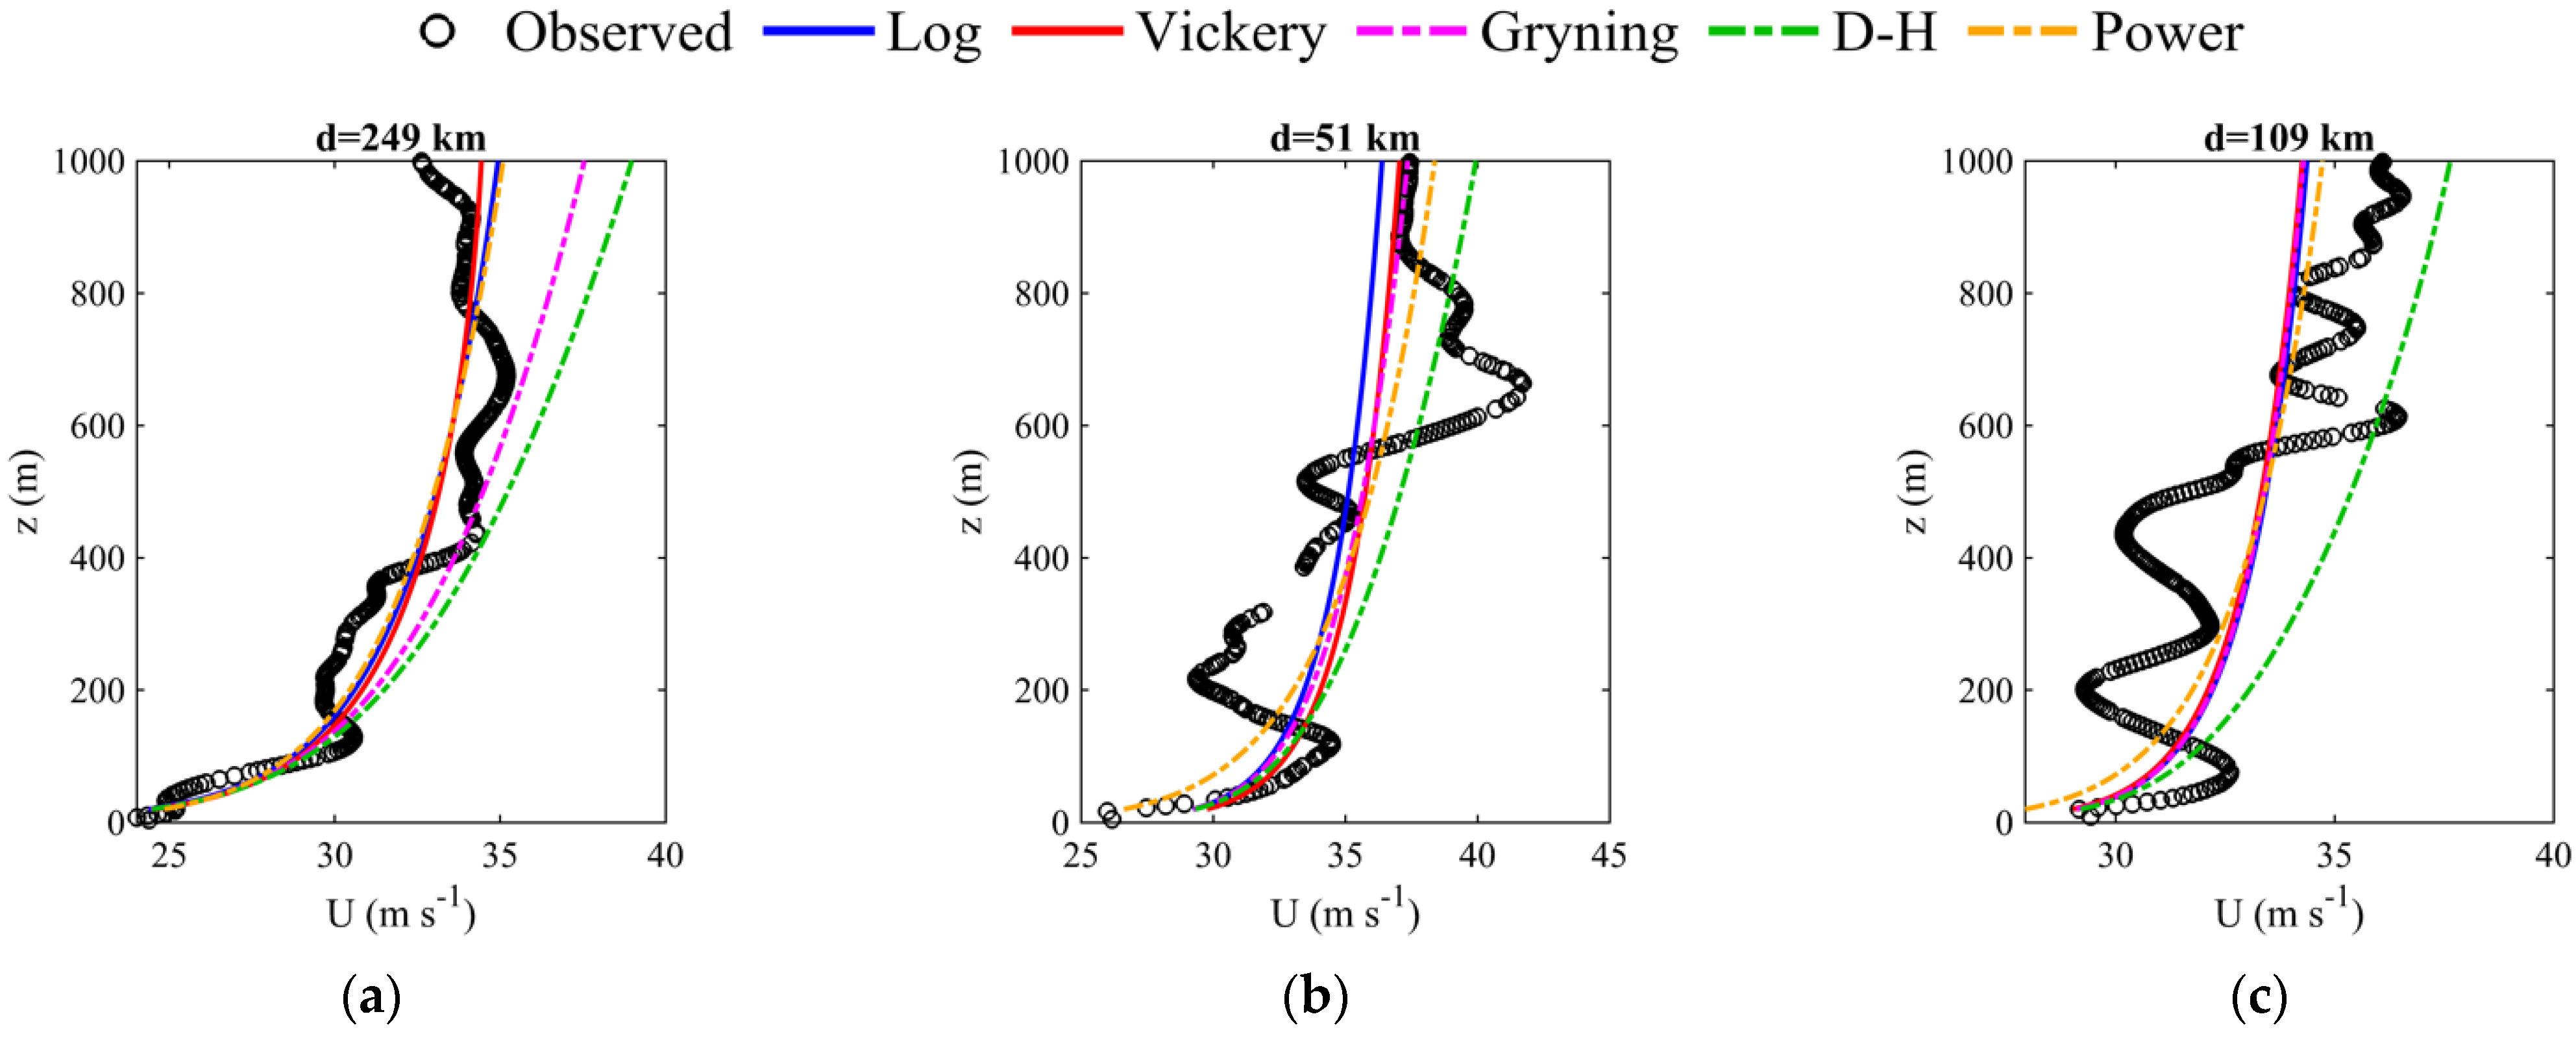
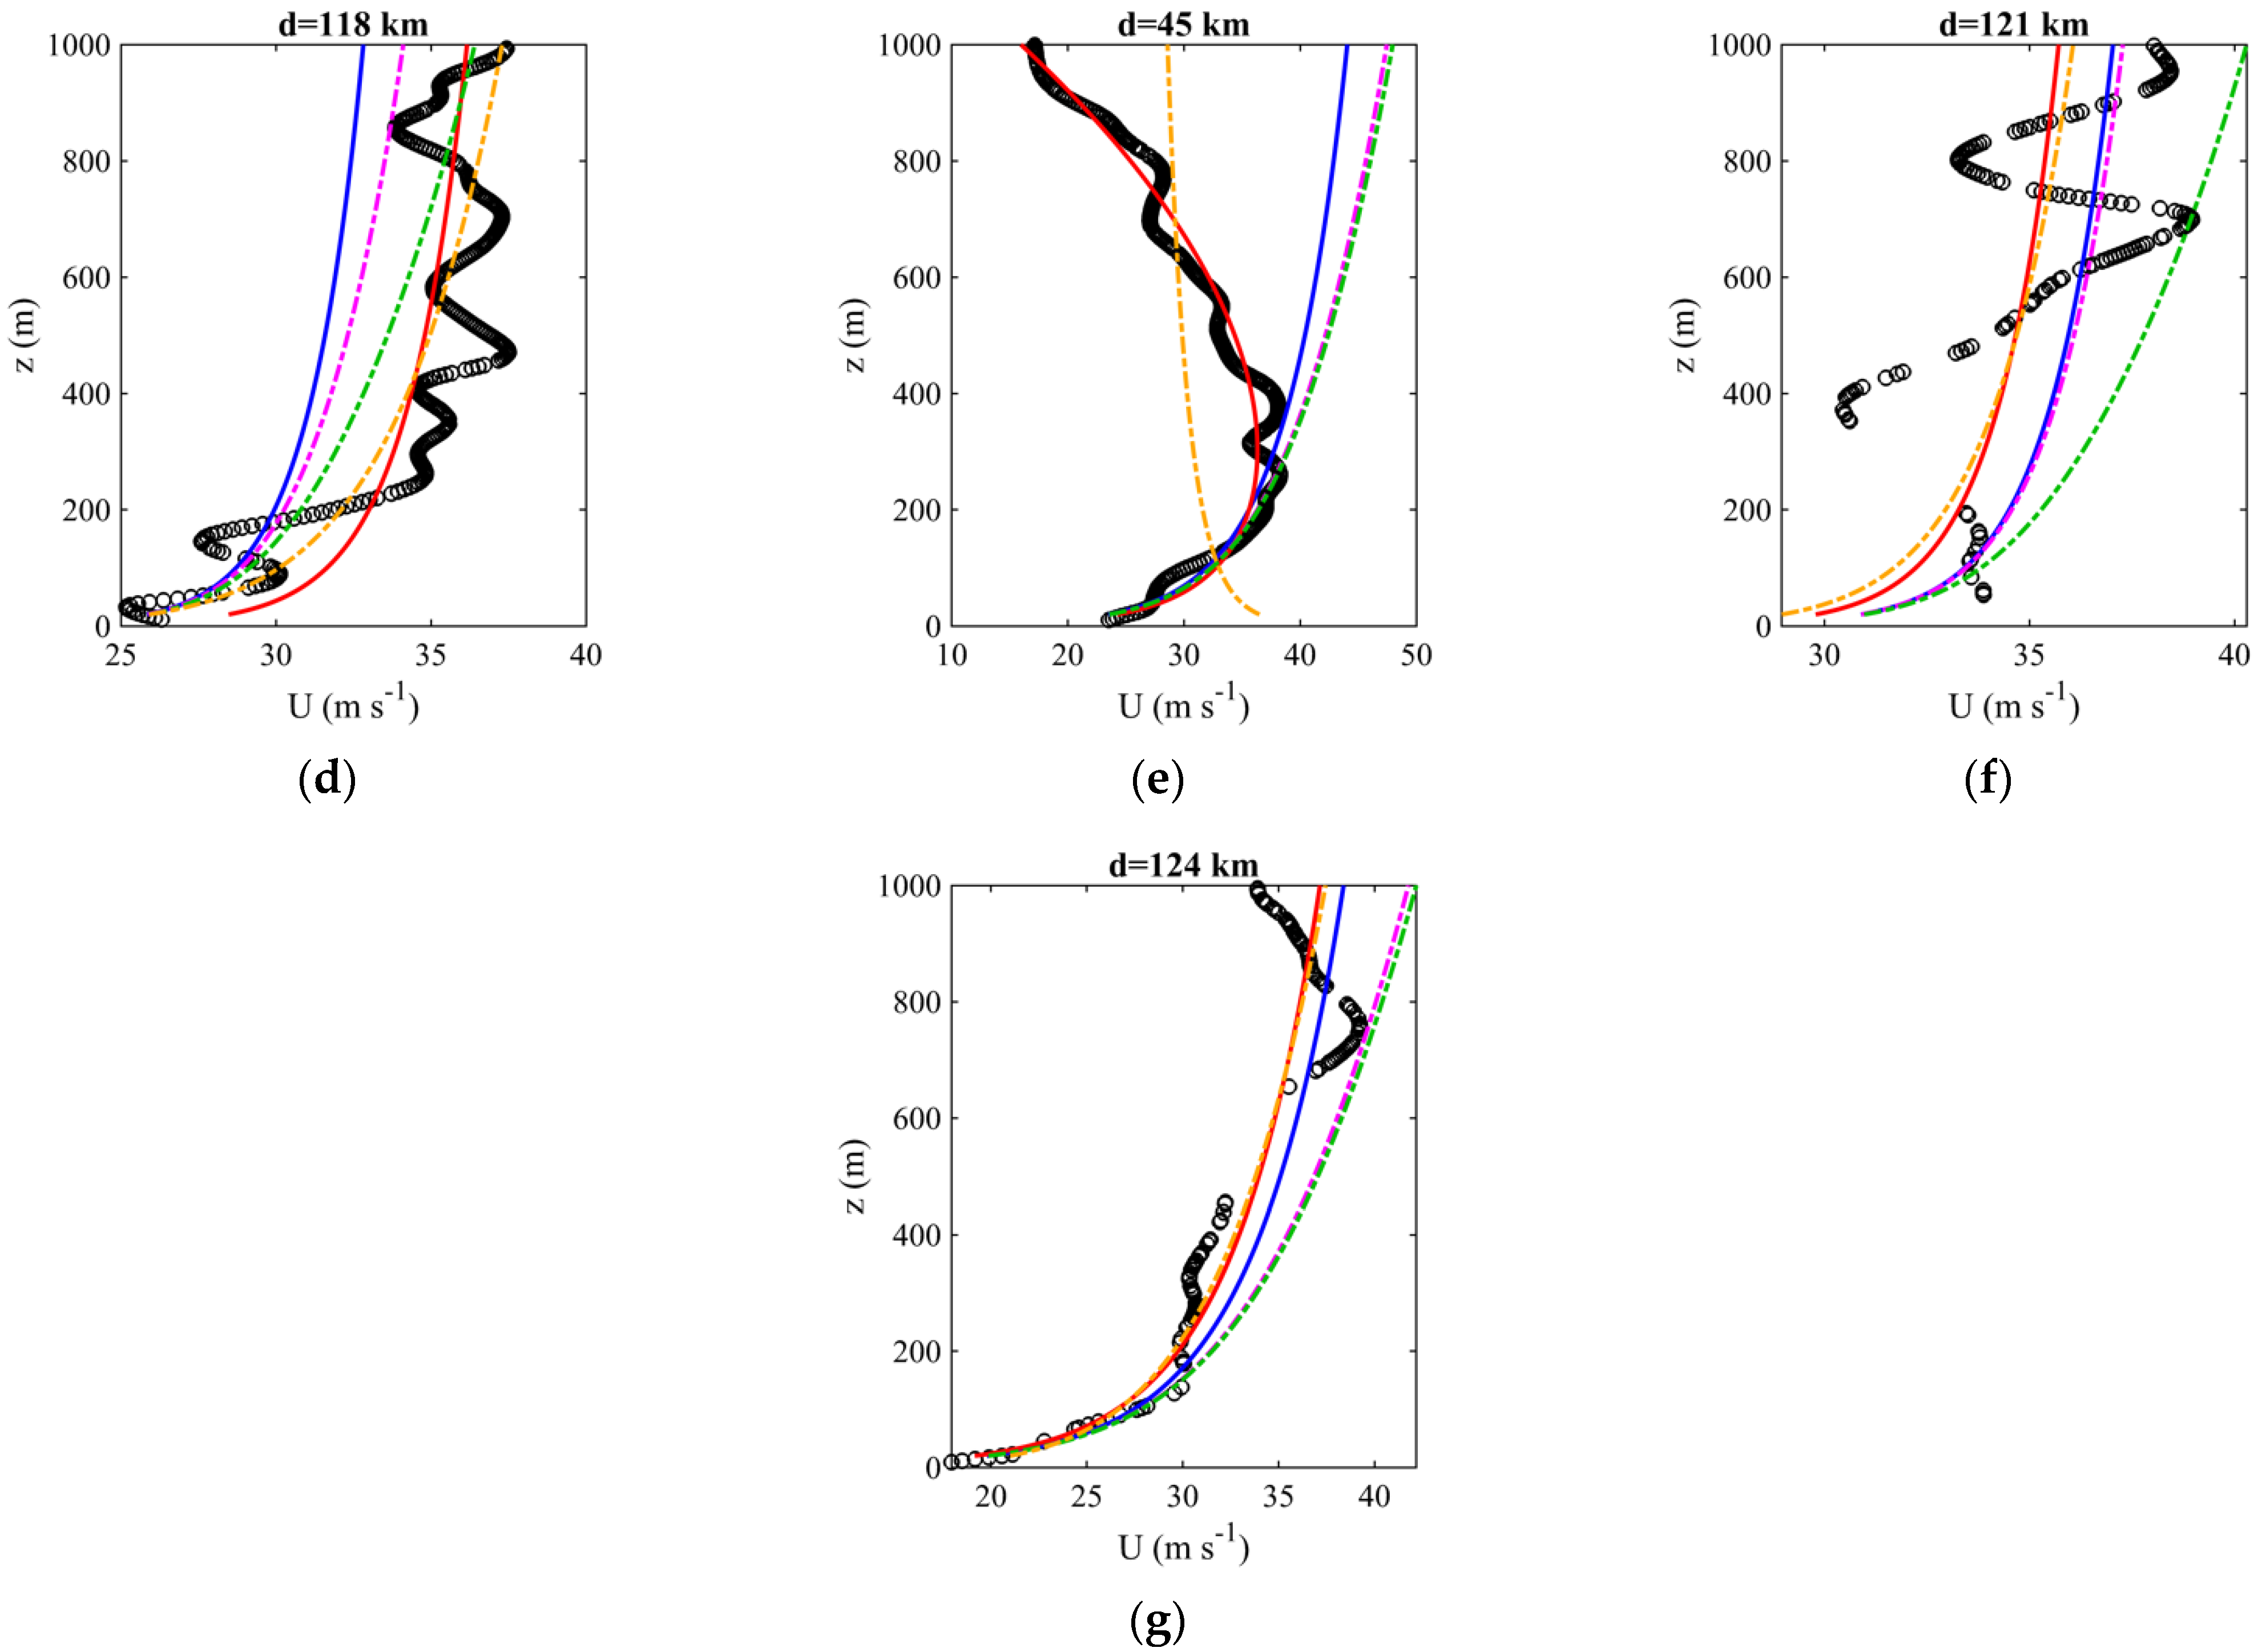
Figure 9.
Fitting of the vertical profiles of wind speeds in the lowest 1000 m in Severe Tropical Storm Nalgae at 0700 UTC 1 November 2022 to the wind profile models, including logarithmic law, Vickery model, Gryning model, Deaves and Harris model, and power law. d represents the distance to the storm center. Only dropsonde cases with sufficient measurements in the lowest 1000 m are shown (a–g).
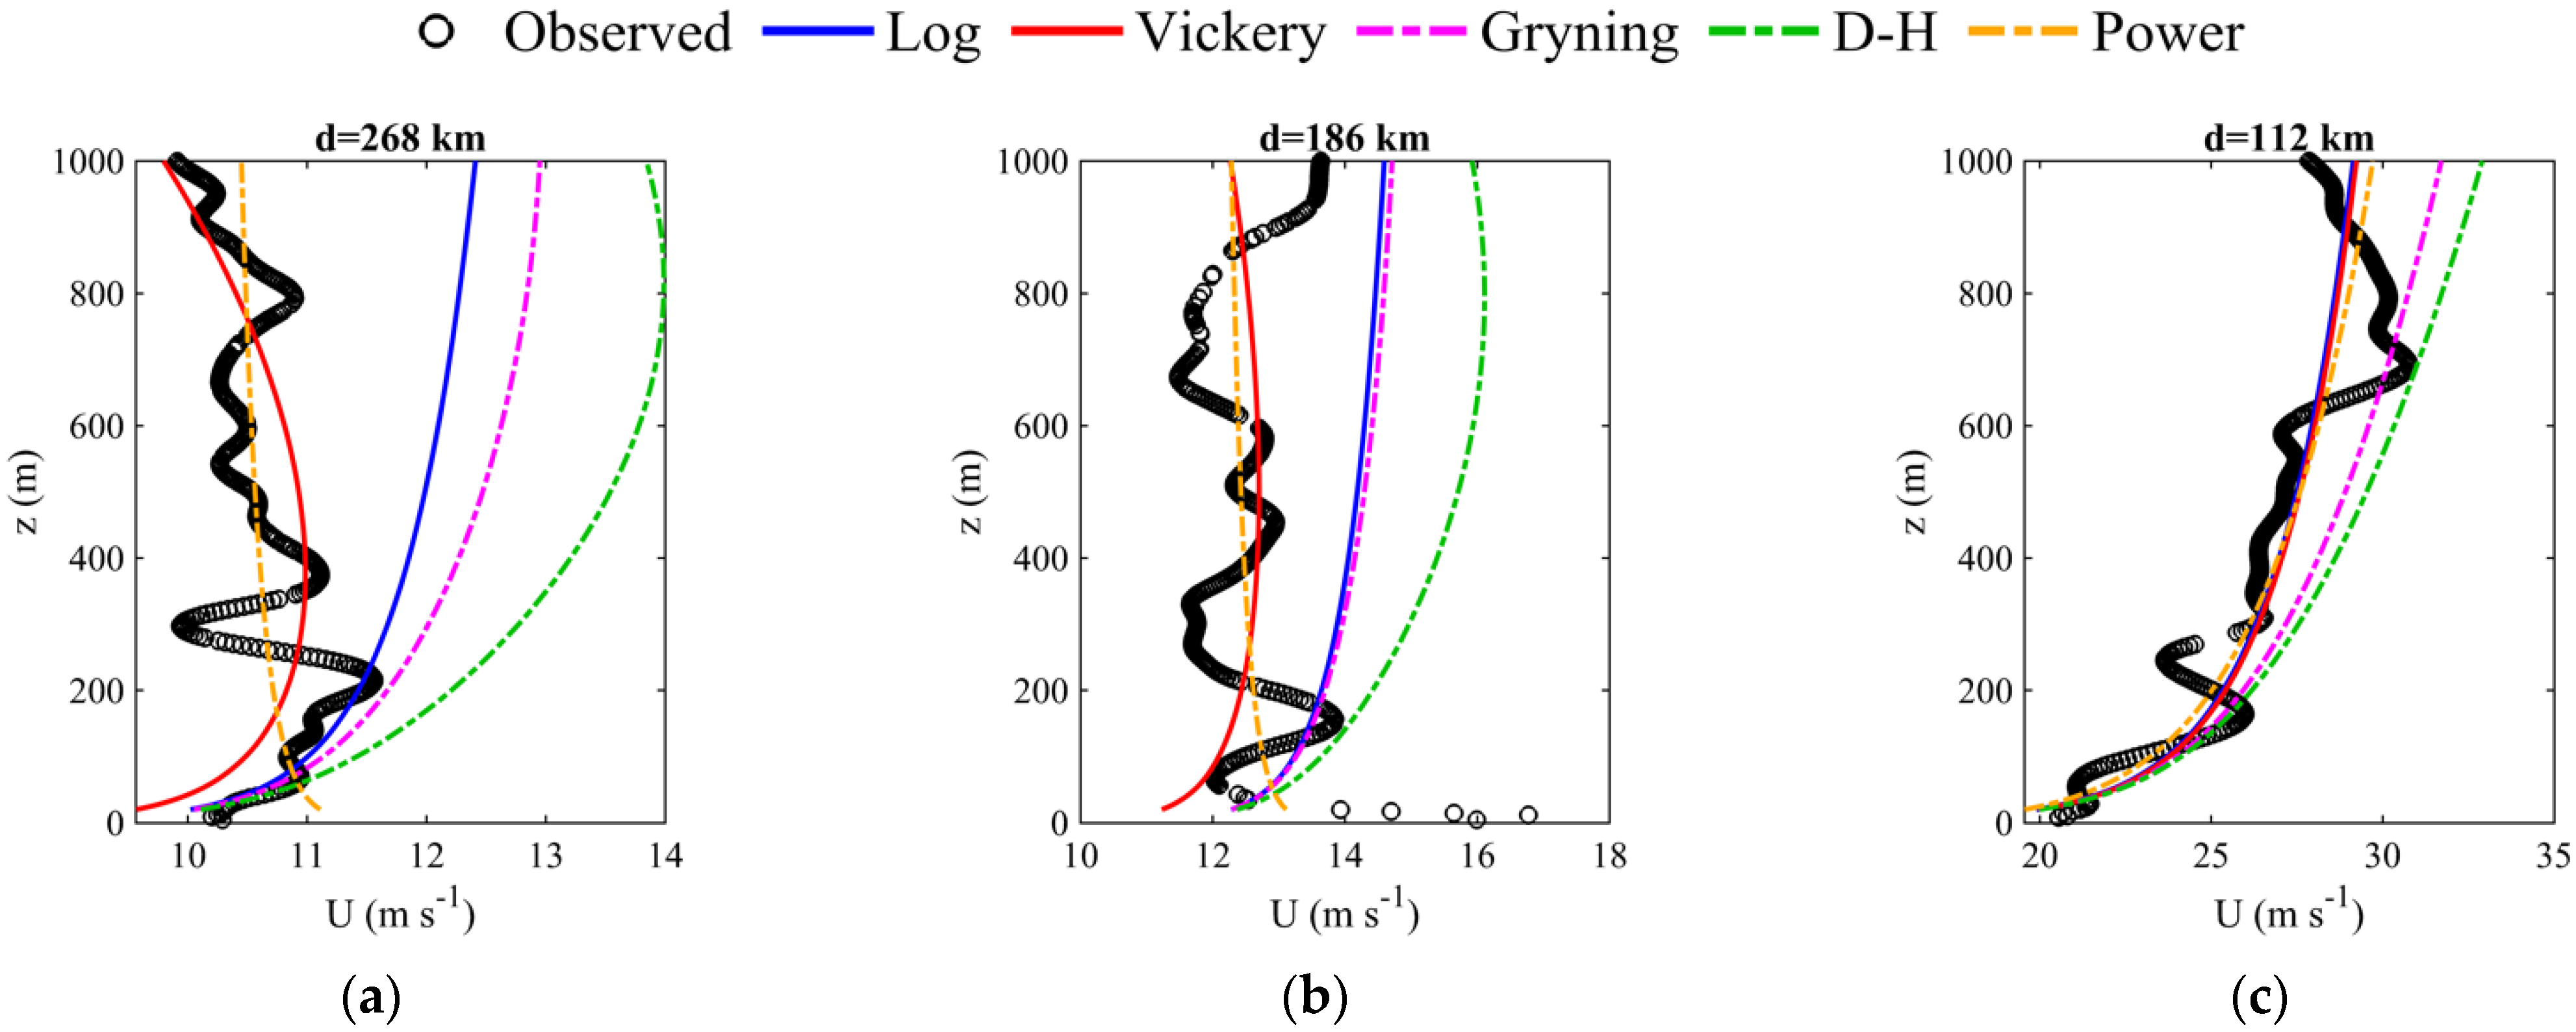
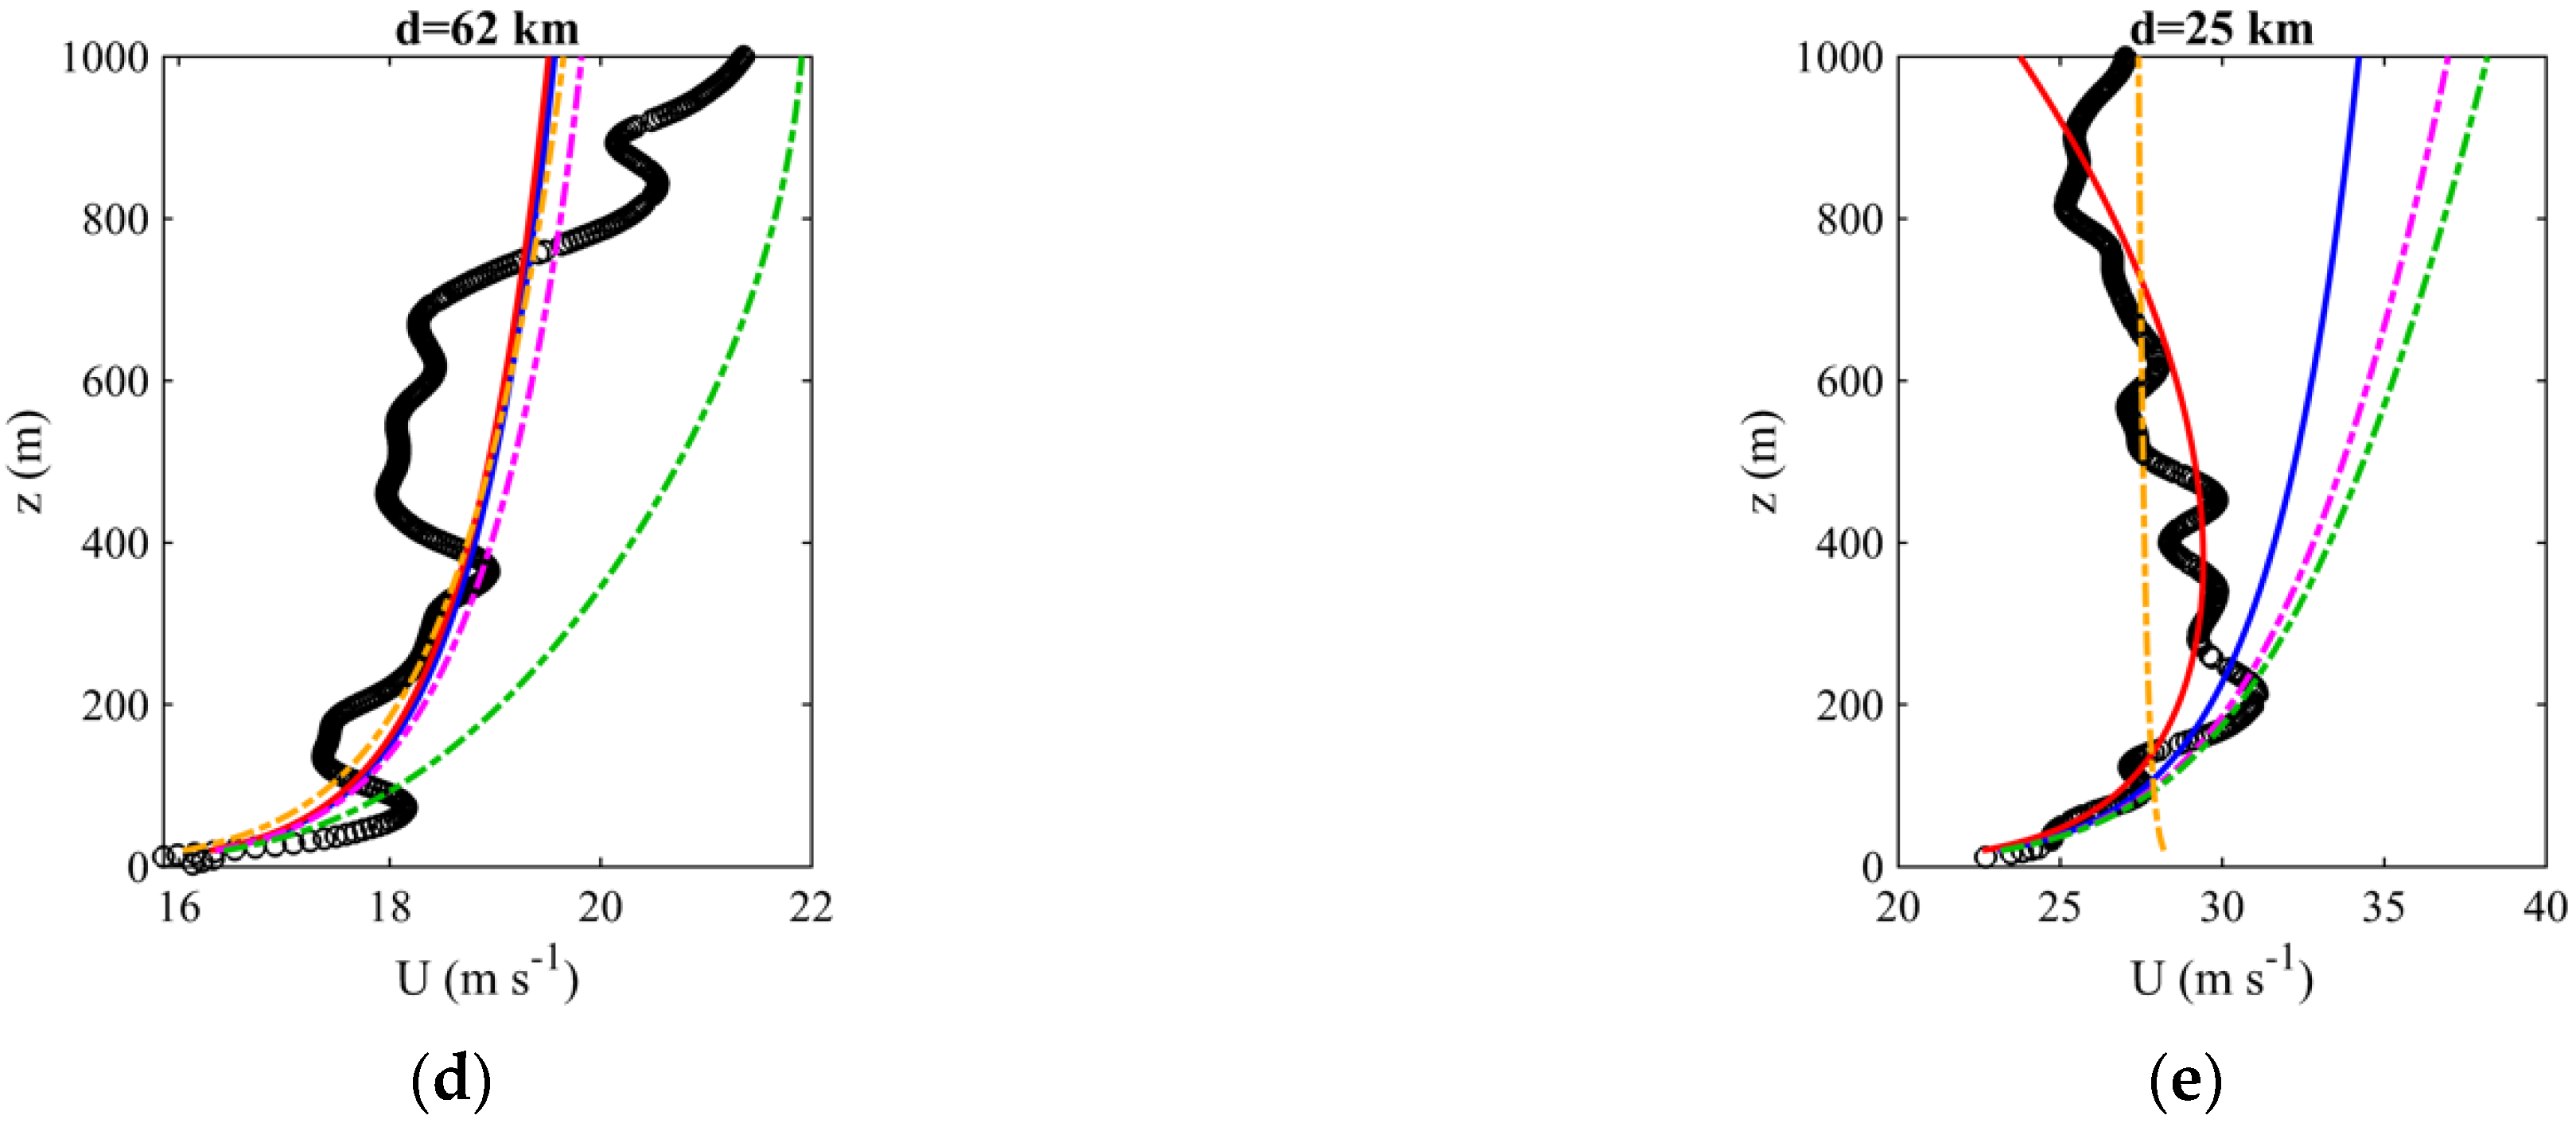
Figure 10.
Fitting of the vertical profiles of wind speeds in the lowest 1000 m in Severe Tropical Storm Nalgae at 0100UTC 2 November 2022 to the wind profile models, including logarithmic law, Vickery model, Gryning model, Deaves and Harris model, and power law. d represents the distance to the storm center. Only dropsonde cases with sufficient measurements in the lowest 1000 m are shown (a–e).
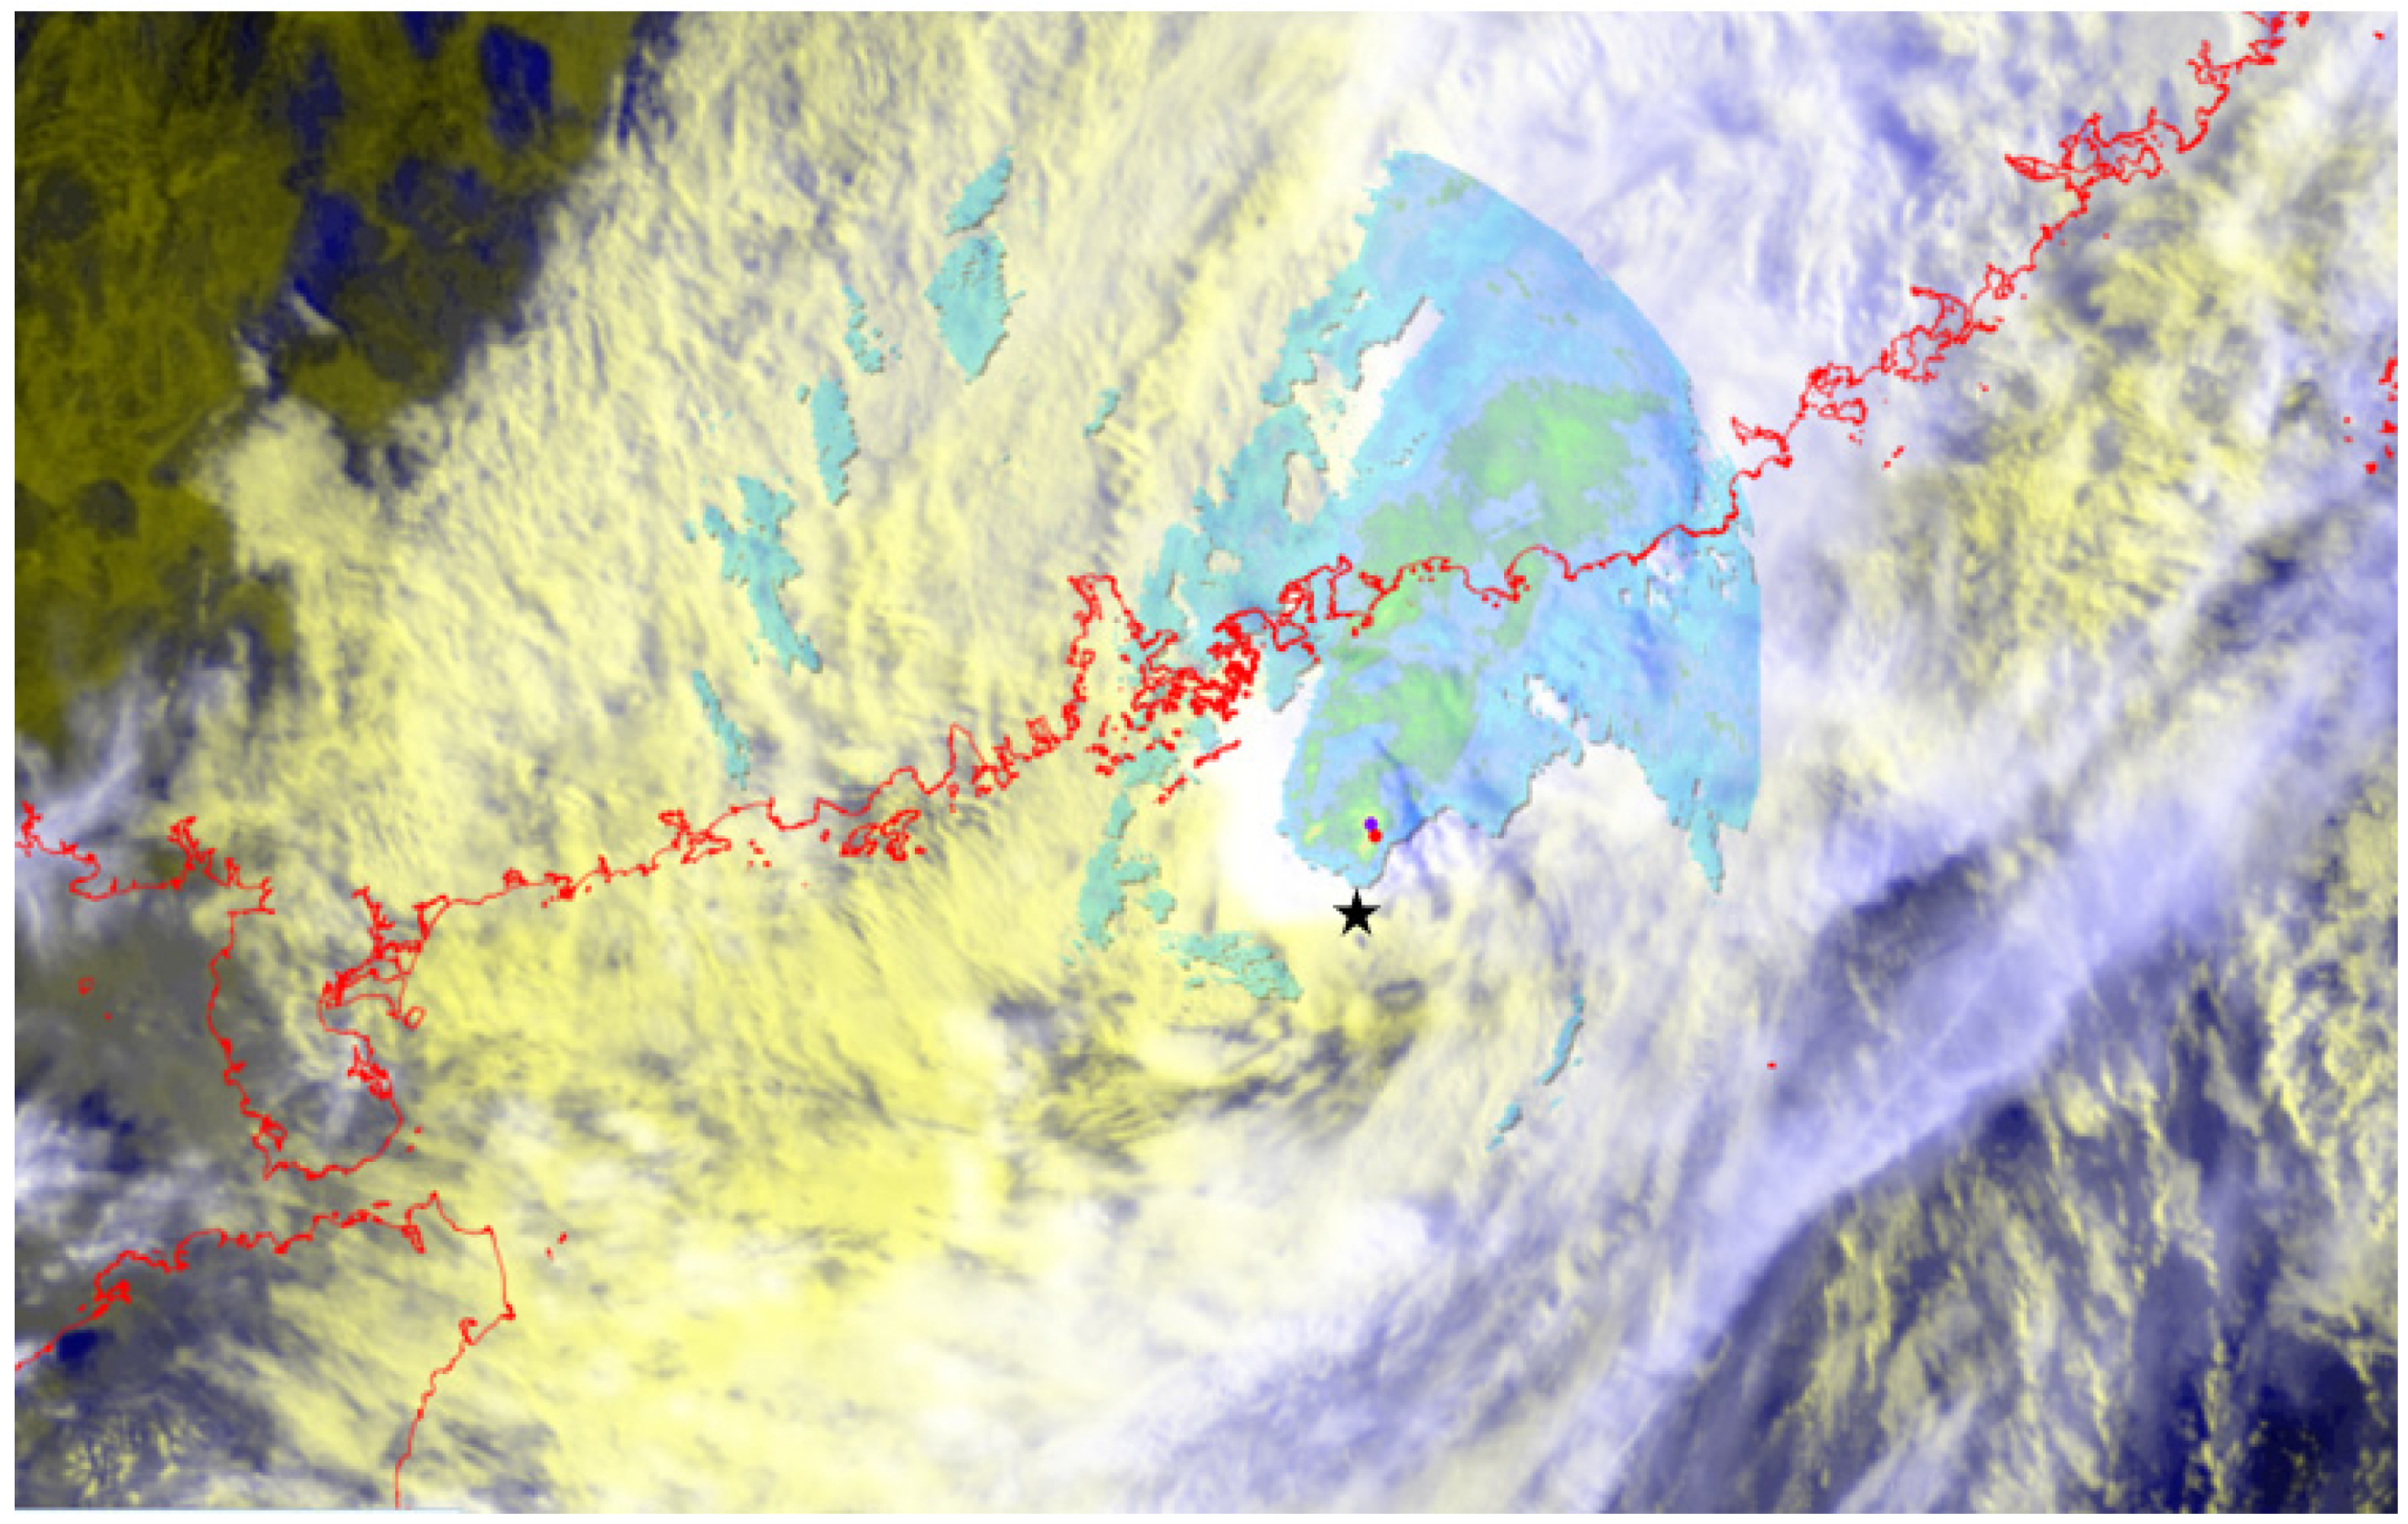
Figure 11.
Lightning (location shown in purple and red dots) overlaid on radar imagery and false-colour satellite imagery at 0800 UTC on 2 November 2022. The center of Nalgae is indicated by a black star symbol. The satellite imagery was originally captured by Himawari-8 Satellite (H-8) of Japan Meteorological Agency (JMA) and the lightning data is from the Hong Kong Observatory (HKO).
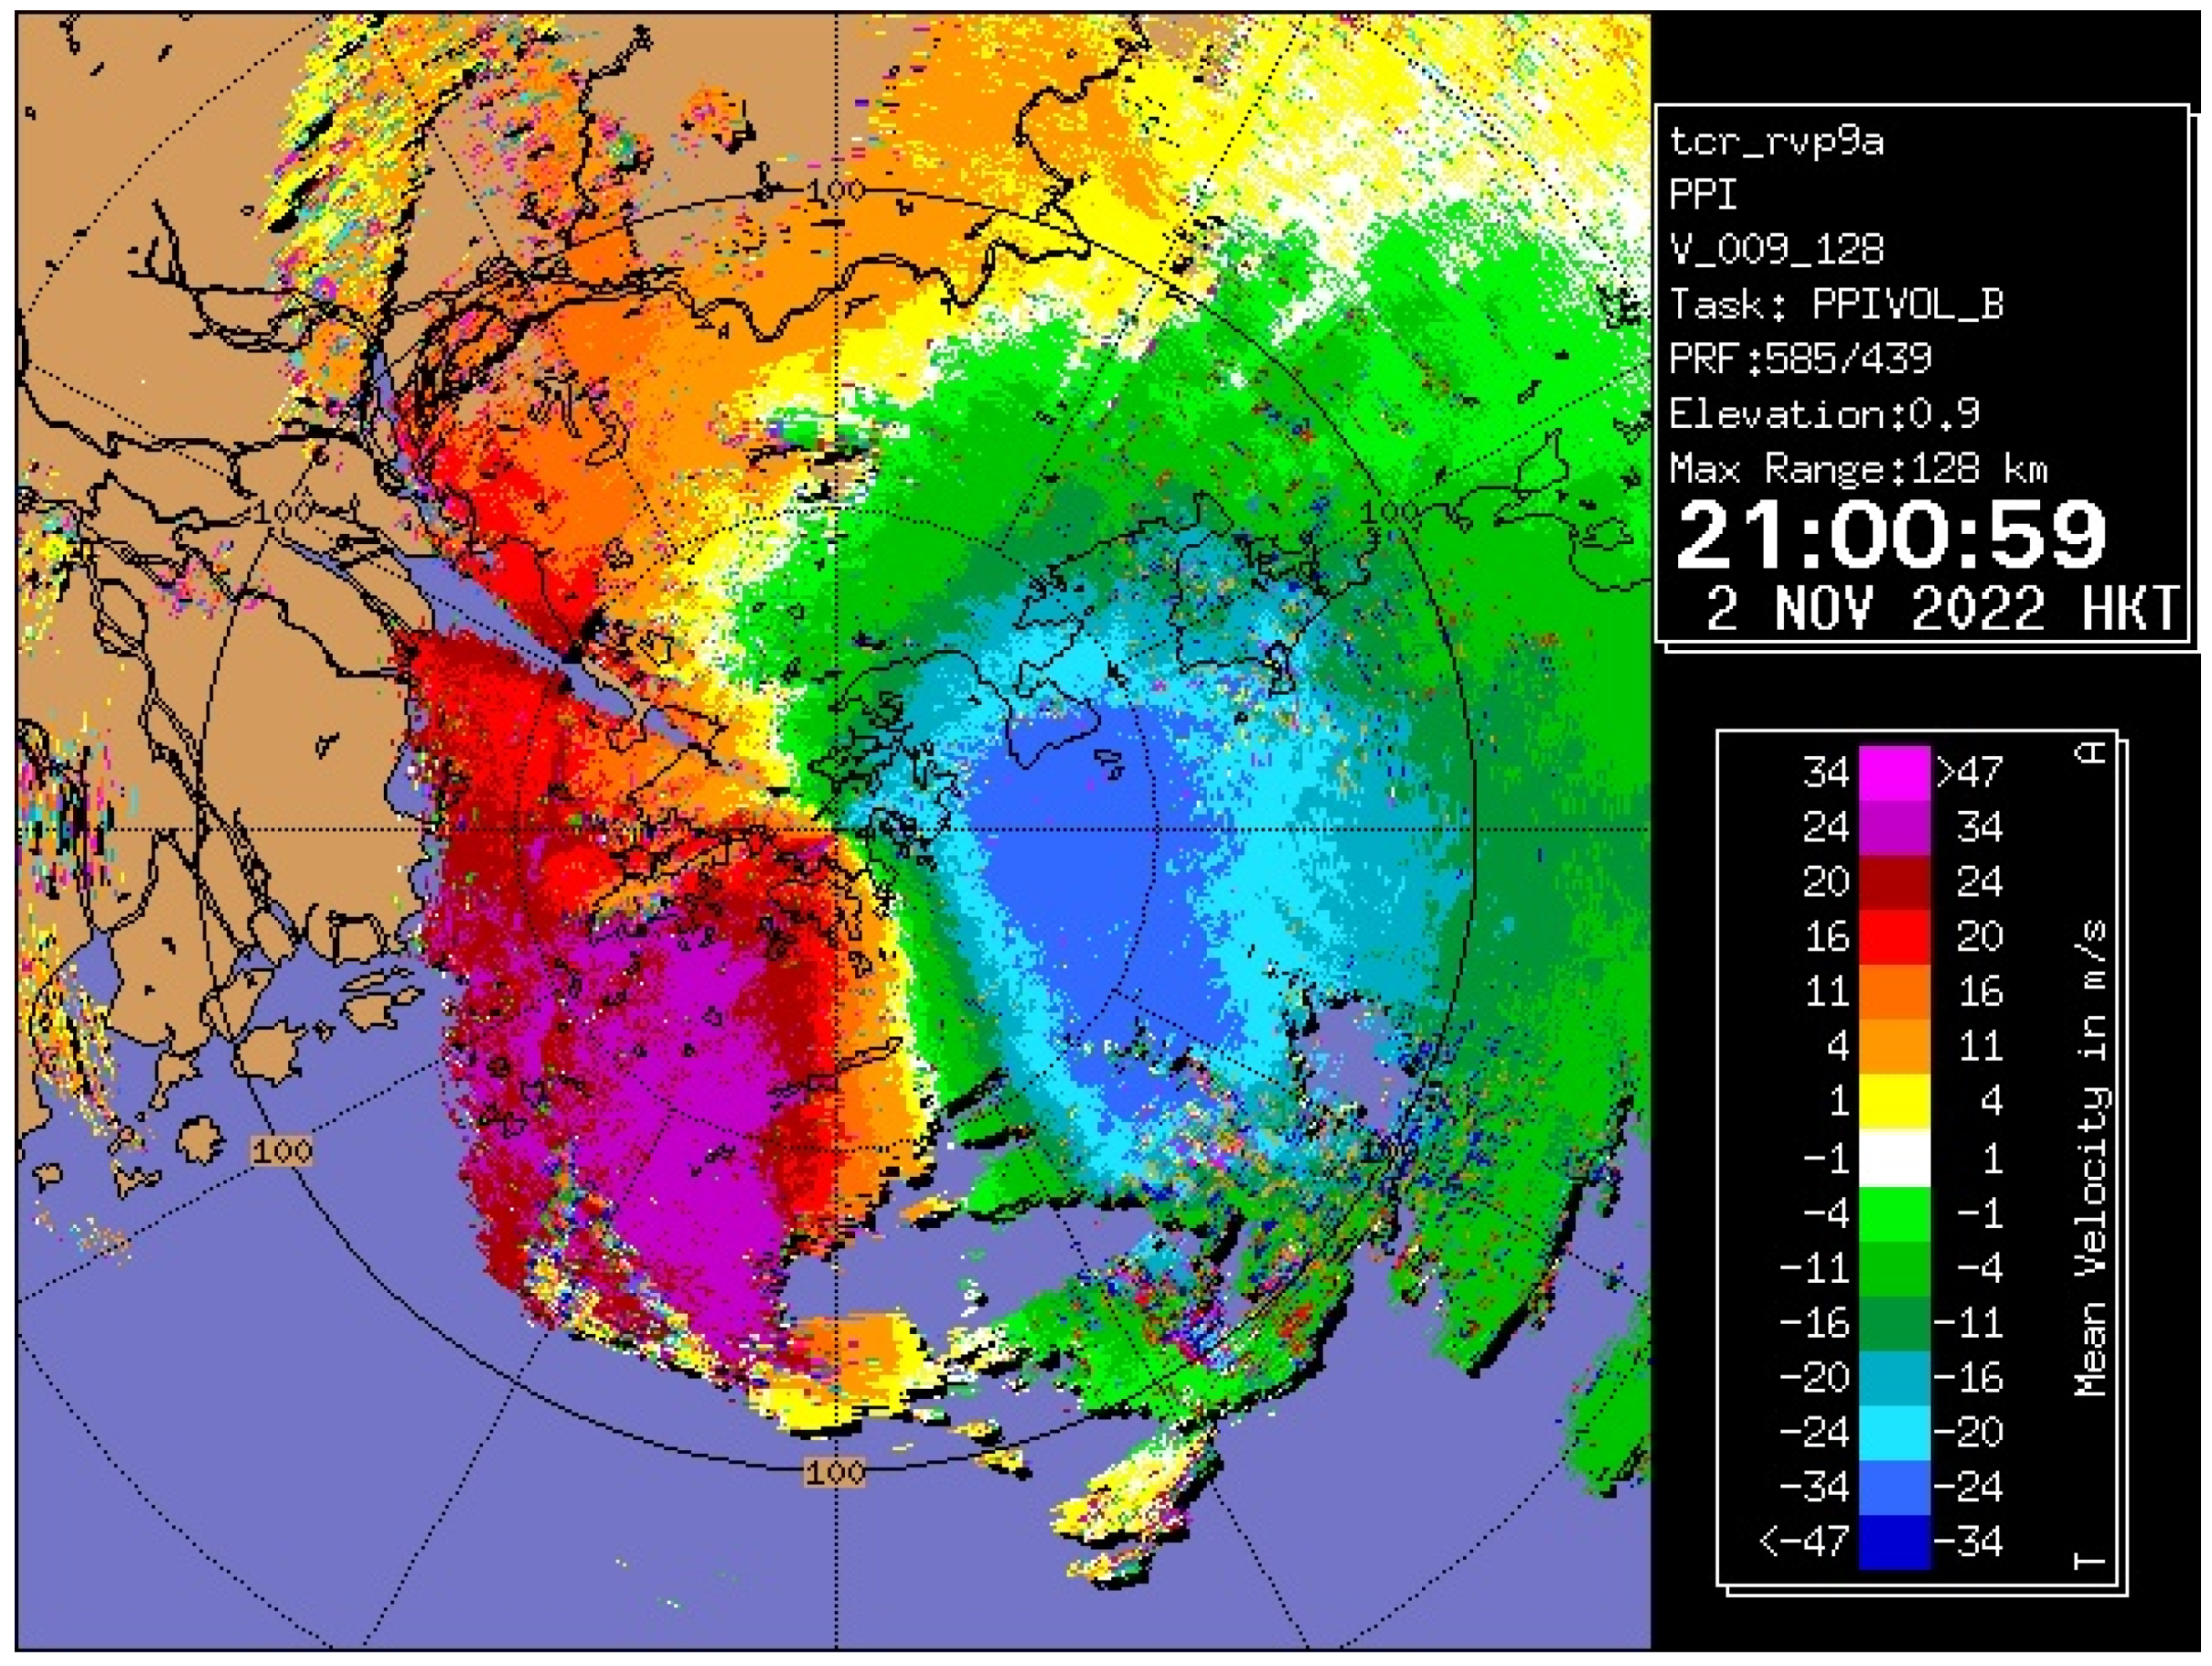
Figure 12.
Doppler radar image of Nalgae at 1300 UTC on 2 November 2022. The elevation angle of the scan is 0.9 degrees with a range of 128 km.
Figure 12.
Doppler radar image of Nalgae at 1300 UTC on 2 November 2022. The elevation angle of the scan is 0.9 degrees with a range of 128 km.
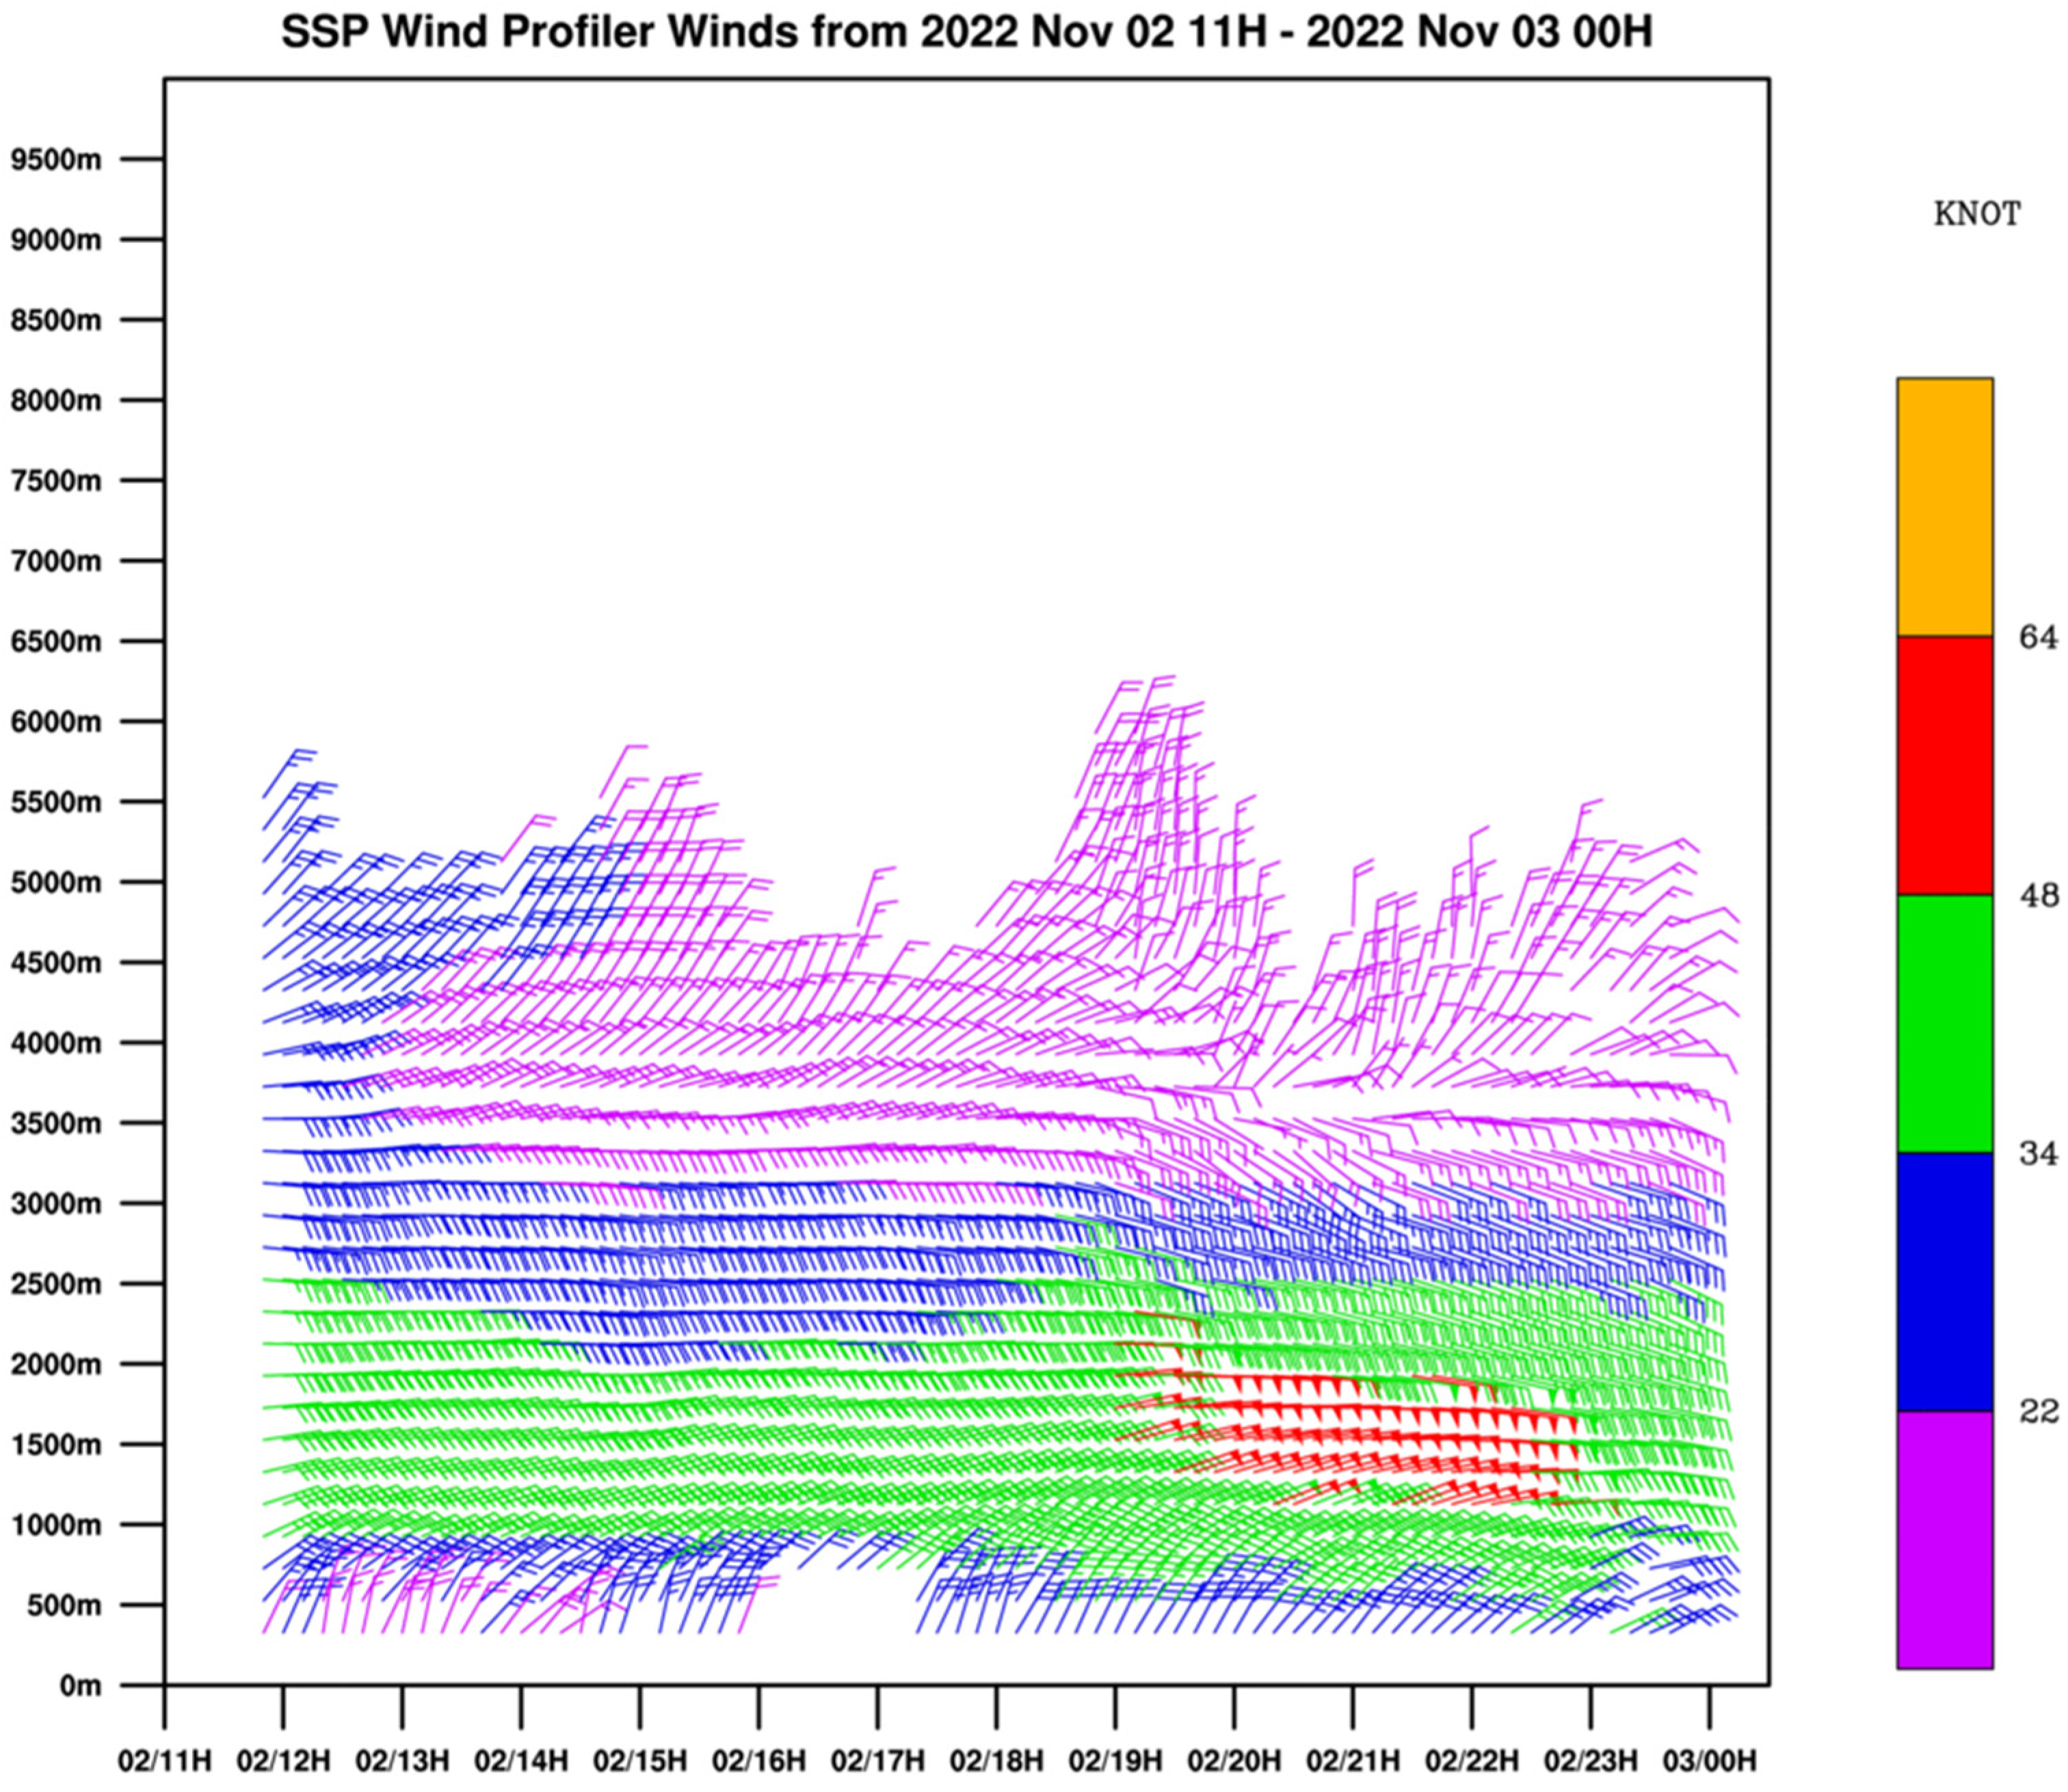
Figure 13.
Wind profiler measurements at Sham Shui Po, Hong Kong, on 2–3 November 2022. The x-axis is the local time in the format of DD/HH and the y-axis is the height.
Figure 13.
Wind profiler measurements at Sham Shui Po, Hong Kong, on 2–3 November 2022. The x-axis is the local time in the format of DD/HH and the y-axis is the height.
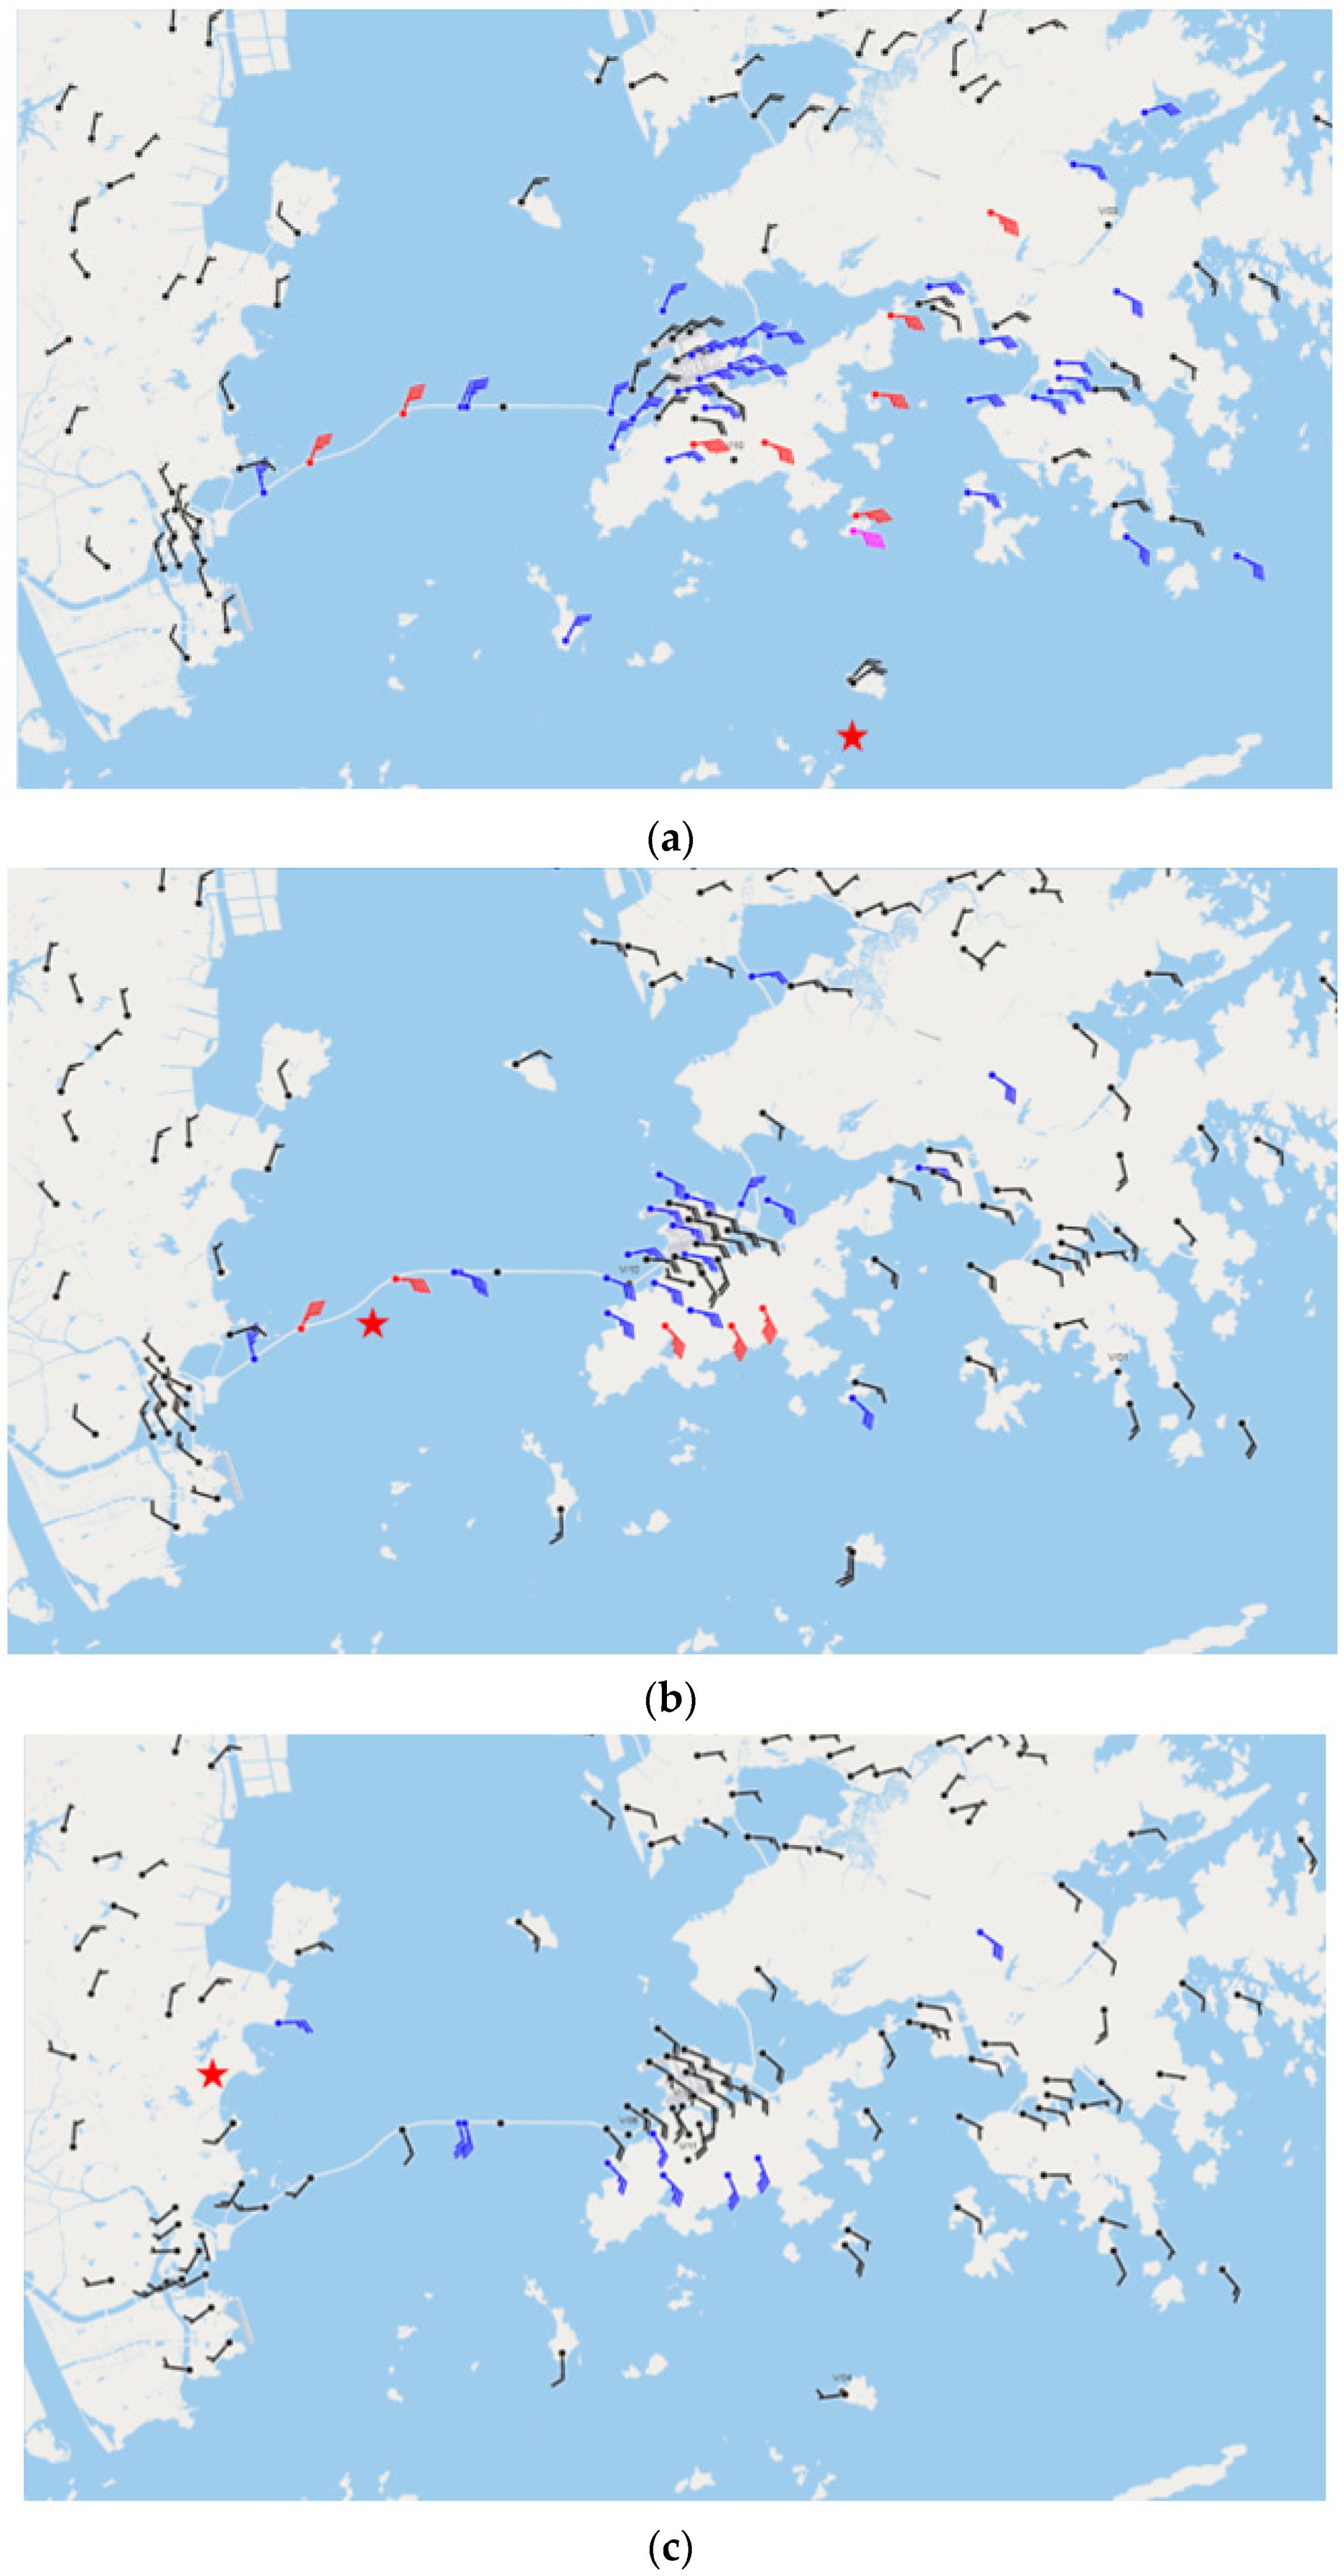
Figure 14.
Surface wind observation in the Pearl River Estuary at (a) 1750 UTC, (b) 1955 UTC, and (c) 2100 UTC on 2 November. The center of Nalgae is indicated by a red star symbol.
Figure 14.
Surface wind observation in the Pearl River Estuary at (a) 1750 UTC, (b) 1955 UTC, and (c) 2100 UTC on 2 November. The center of Nalgae is indicated by a red star symbol.
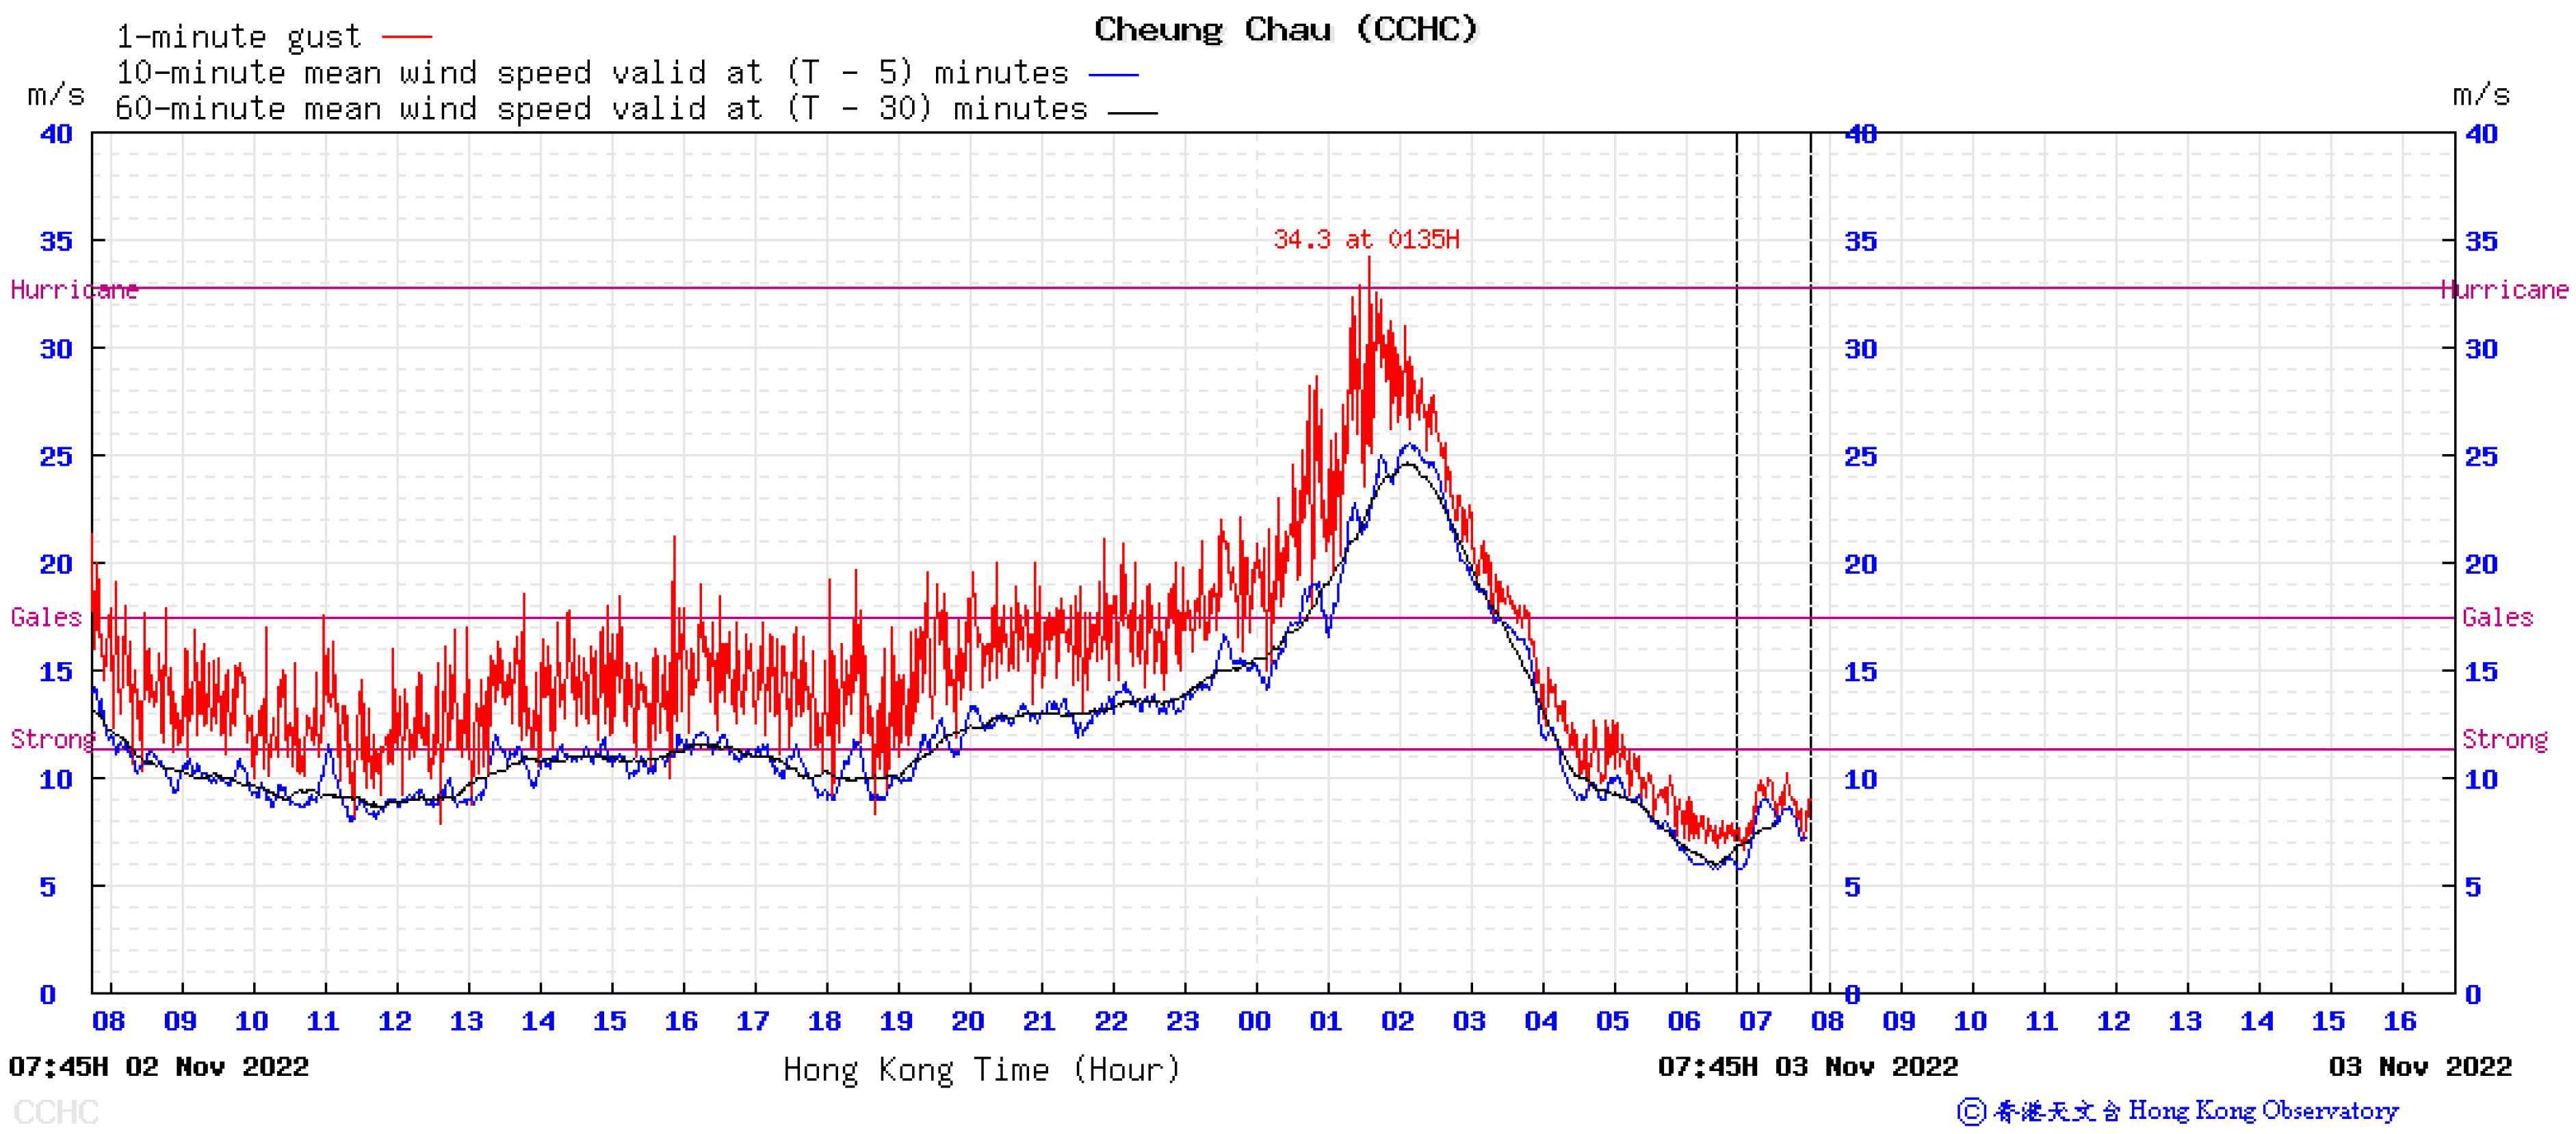
Figure 15.
Time series of 10 min mean wind speed (blue line), 60 min mean wind speed (black line), and 3-second gust (red line) recorded at Cheung Chau (elevation of anemometer: 99 m above mean sea-level) on 2–3 November (Hong Kong Time, UTC+8).
Figure 15.
Time series of 10 min mean wind speed (blue line), 60 min mean wind speed (black line), and 3-second gust (red line) recorded at Cheung Chau (elevation of anemometer: 99 m above mean sea-level) on 2–3 November (Hong Kong Time, UTC+8).
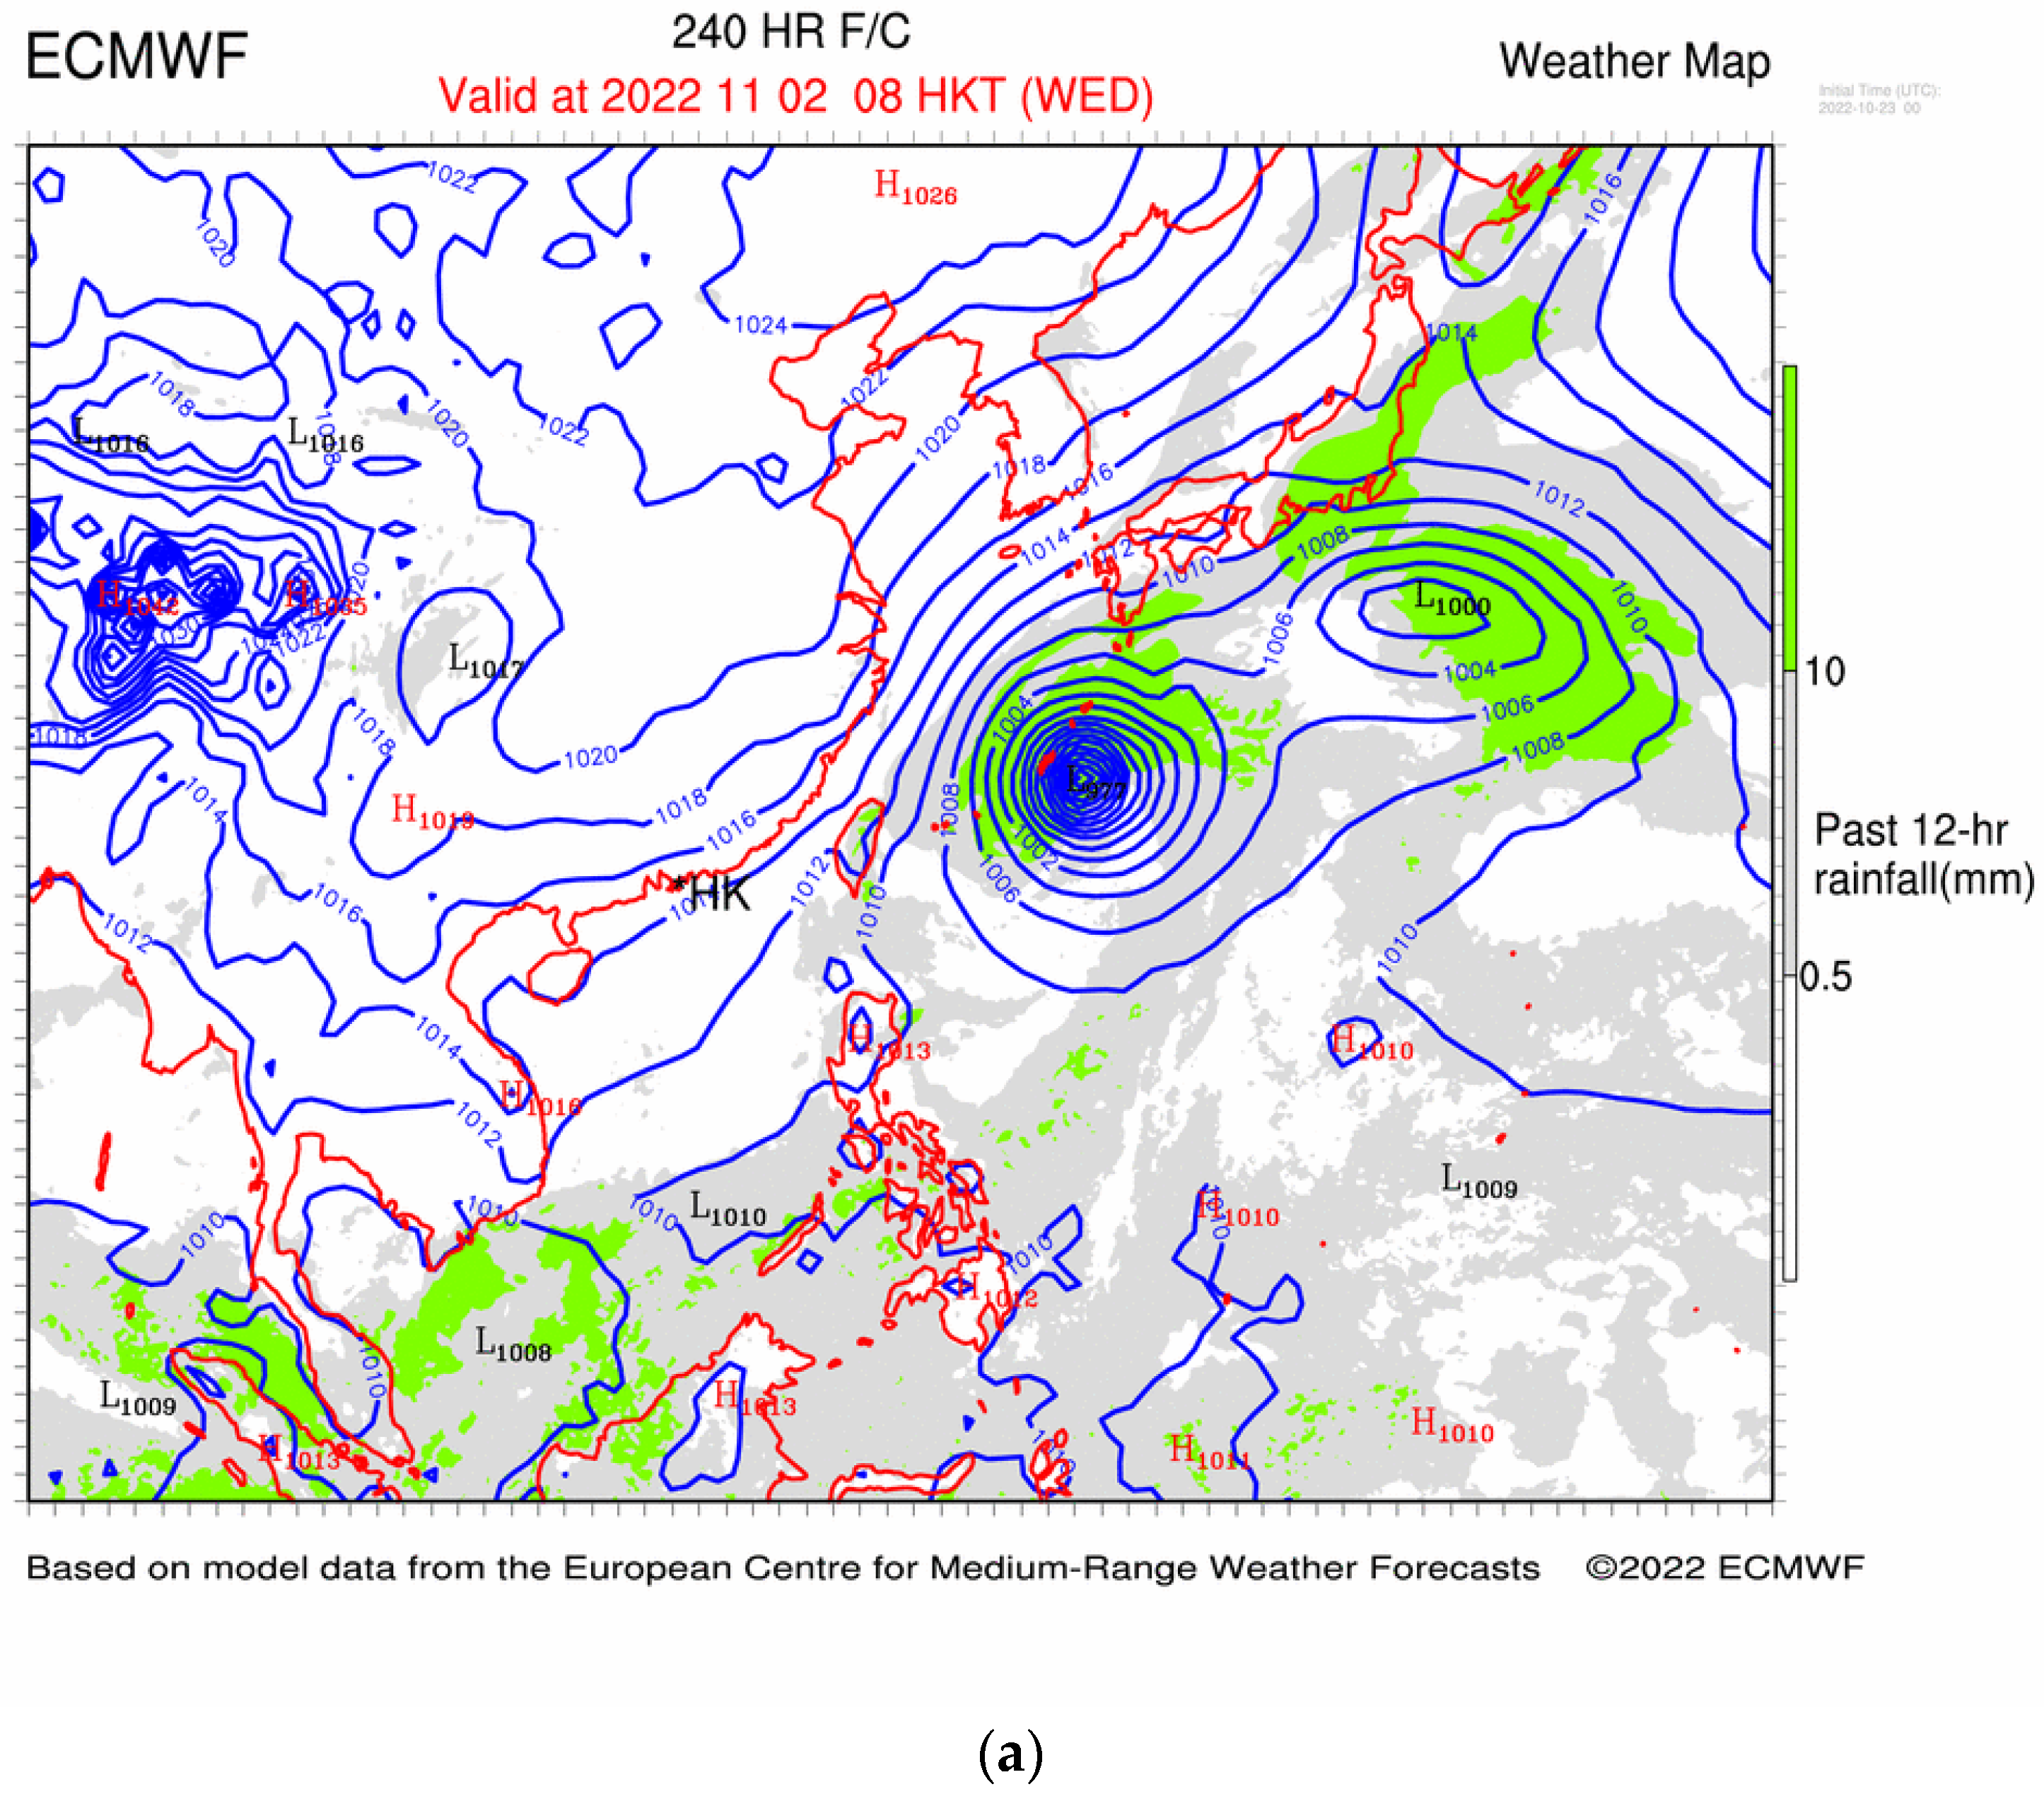
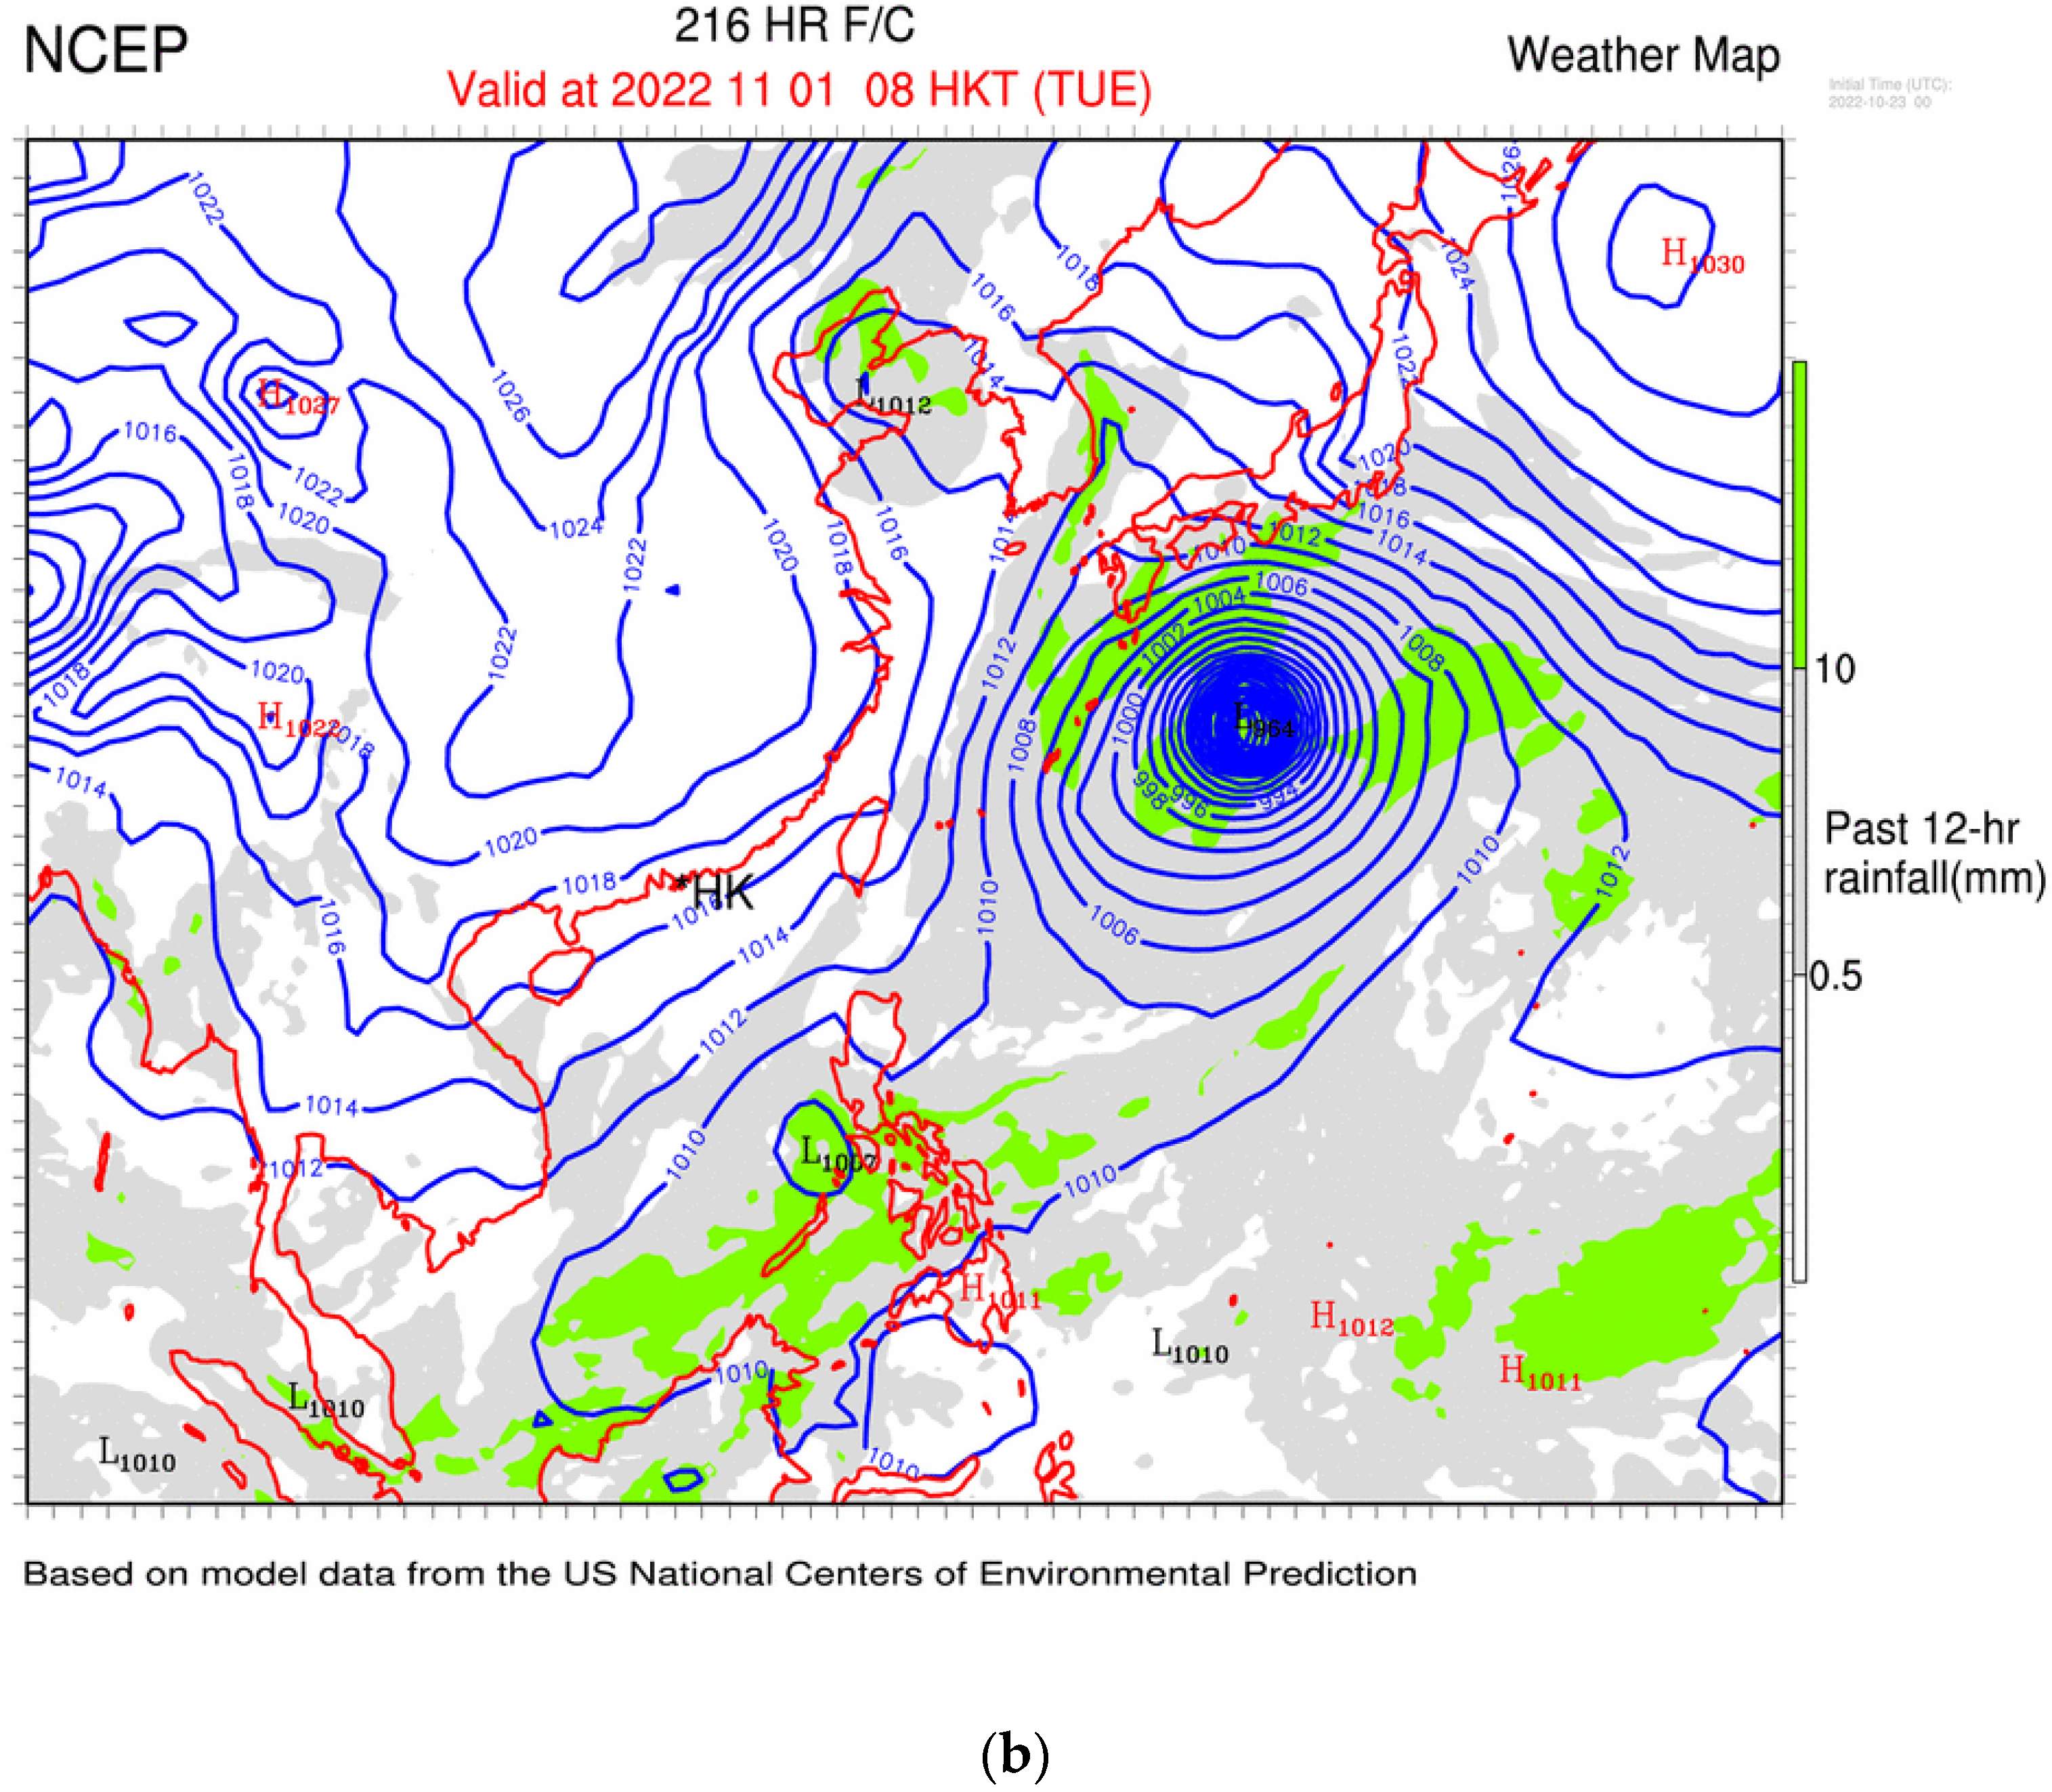
Figure 16.
(a) The 240-hour forecasts from the European Center for Medium Range Weather Forecasts (ECMWF) global model and (b) the 216-hour forecast of The United States National Centers for Environmental Protection (NCEP) at the surface, including precipitation (color shading) and pressure contours, from the run initialized at 0000 UTC, 23 November 2022.
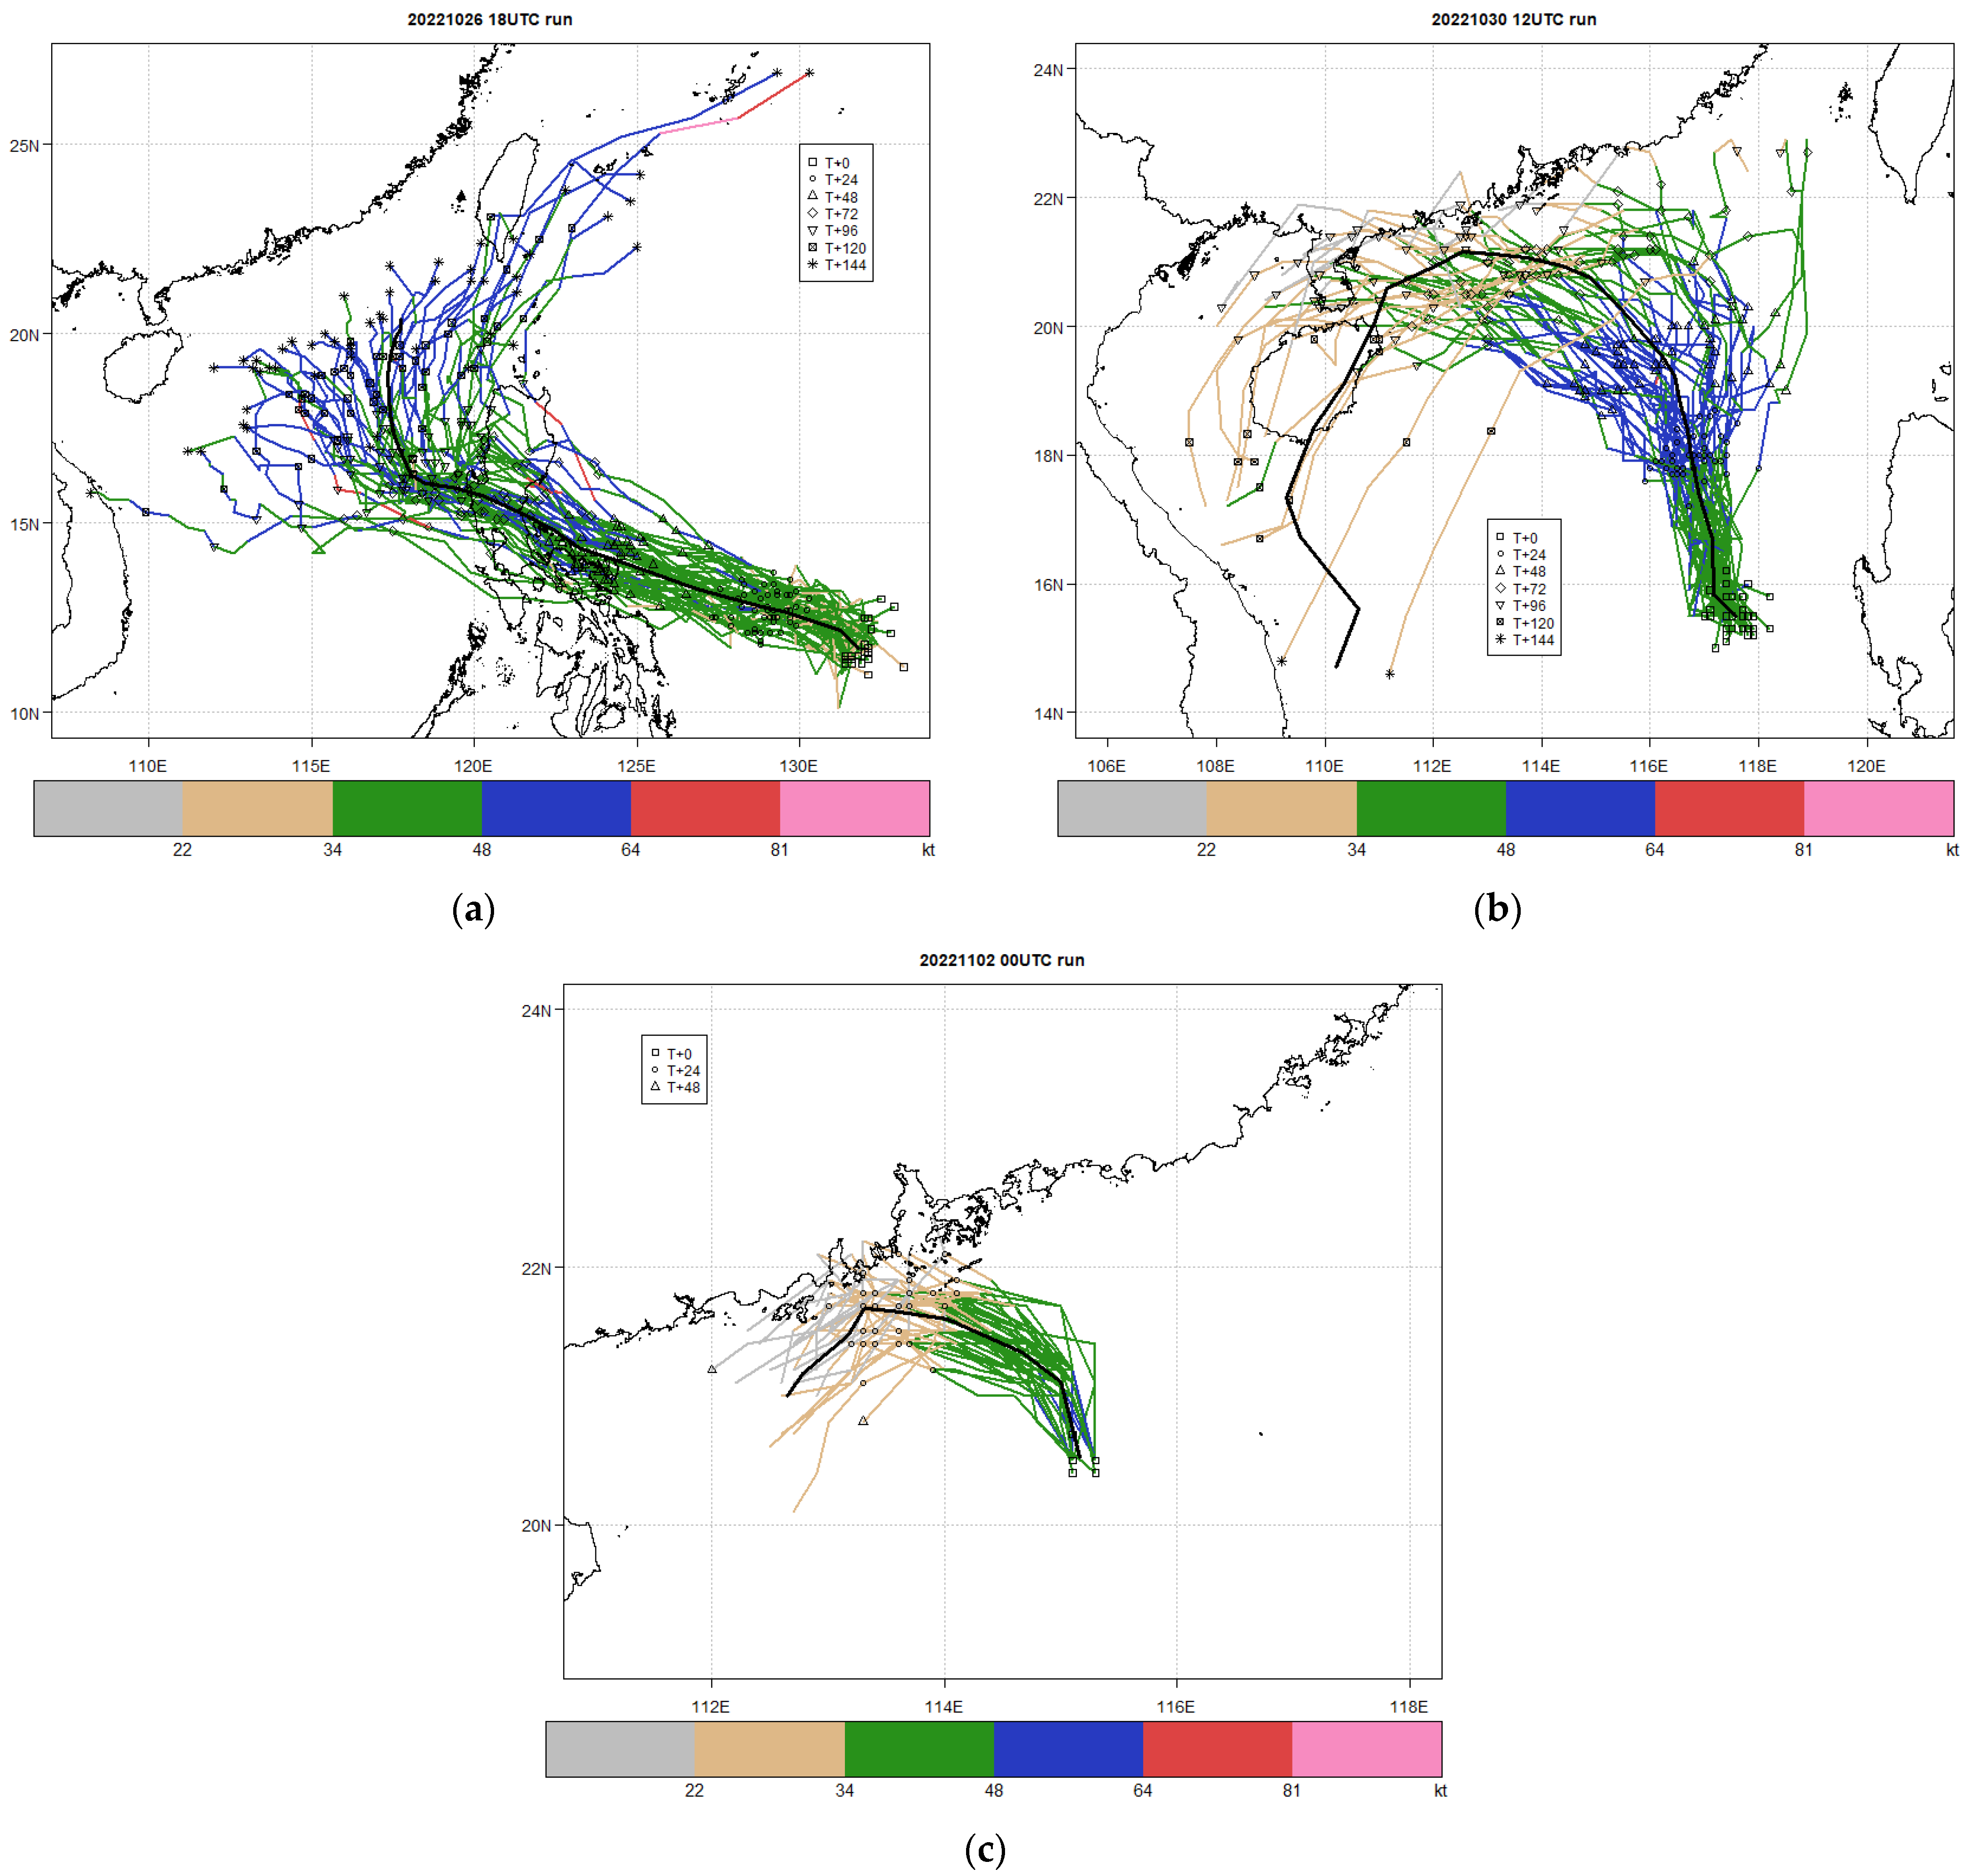
Figure 17.
The EPS forecast tracks from the European Center for Medium Range Weather Forecasts (ECMWF) global model, from the run initialized at (a) 1800 UTC on 26 October 2022, (b) 1200 UTC on 30 October 2022, and (c) 0000 UTC on 2 November 2022. The color indicated the maximum sustained wind of Nalgae (in knots).
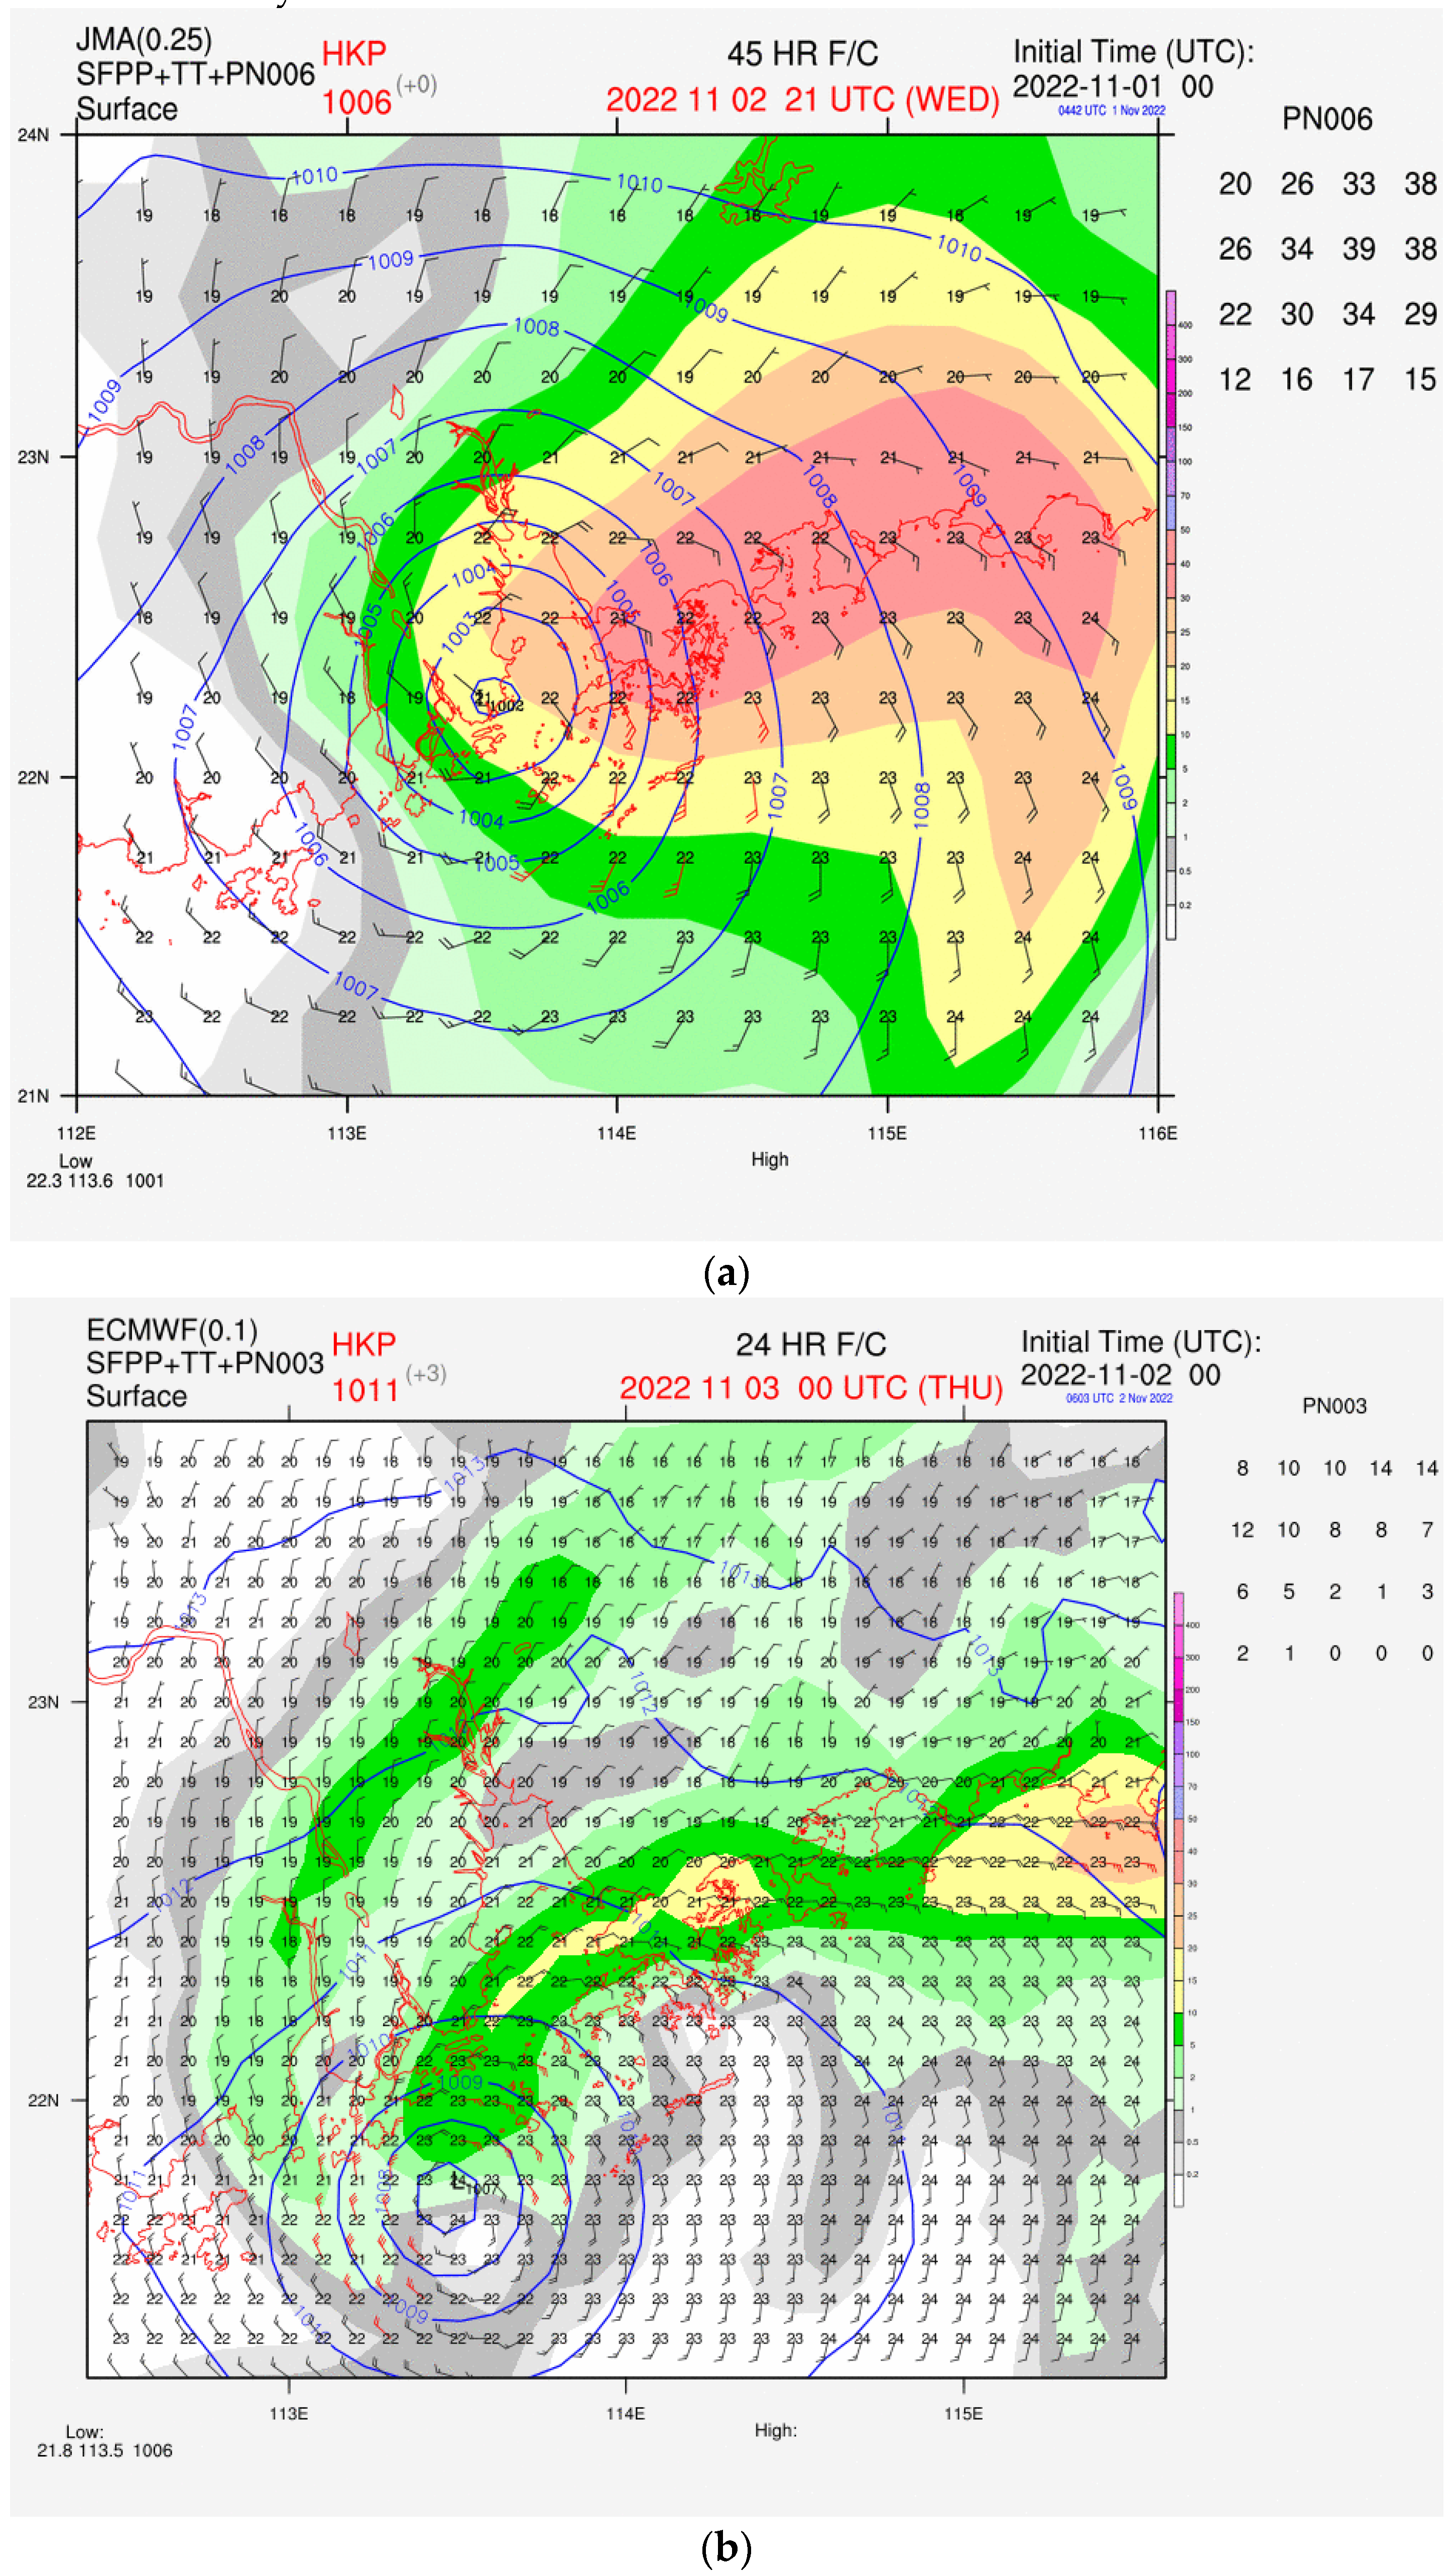
Figure 18.
(a) The 45-hour forecast from the Japan Meteorological Agency (JMA) global model and (b) the 24-hour forecast from the European Center for Medium Range Weather Forecasts (ECMWF) global model at the surface, including surface wind (wind barbs over the grid points), temperature (numbers over the grid points), precipitation (color shading), and pressure contours, from the run initialized at (a) 0000 UTC on 1 November 2022 and (b) 0000 UTC on 2 November 2022.
Table 1.
Fitting parameters for the wind profiles in the lowest 1000 m in Tropical Storm Nalgae at 0700UTC on 1 November 2022.
Table 1.
Fitting parameters for the wind profiles in the lowest 1000 m in Tropical Storm Nalgae at 0700UTC on 1 November 2022.
| Case | d (km) | | z0 (m) | α | H* (m) |
|---|
| a | 249 | 1.08 | 0.0024 | 0.088 | 1163 |
| b | 51 | 0.73 | 2.31 × 10⁻⁶ | 0.094 | 140,437 |
| c | 109 | 0.54 | 7.83 × 10⁻⁹ | 0.056 | 194,153 |
| d | 118 | 0.71 | 1.02 × 10⁻⁵ | 0.093 | 102,430 |
| e | 45 | 2.10 | 0.23 | −0.062 | 271 |
| f | 121 | 0.63 | 5.79 × 10⁻⁸ | 0.056 | 102,430 |
| g | 124 | 1.90 | 0.31 | 0.148 | 37,911 |
Table 2.
Fitting parameters for the wind profiles in the lowest 1000 m in Tropical Storm Nalgae at 0100UTC on 2 November 2022.
Table 2.
Fitting parameters for the wind profiles in the lowest 1000 m in Tropical Storm Nalgae at 0100UTC on 2 November 2022.
| Case | d (km) | (m s−1) | z0 (m) | α | H* (m) |
|---|
| a | 268 | 0.24 | 1.49×10⁻⁶ | −0.016 | 337 |
| b | 186 | 0.24 | 1.93×10⁻⁸ | −0.017 | 447 |
| c | 112 | 0.95 | 0.0044 | 0.107 | 380,556 |
| d | 62 | 0.33 | 4.89×10⁻⁸ | 0.052 | 88,154 |
| e | 25 | 1.14 | 0.0060 | −0.007 | 338 |
Table 3.
Verification of TC track forecasts (direct position error, along track error and cross track error) from the European Center for Medium-Range Weather Forecasts ensemble prediction system (ECMWF EPS) and the global model of Japan Meteorological Agency (JMA) deterministic forecast and subjective forecast issued by the Hong Kong Observatory (HKO) (00 UTC on 30 October–12 UTC 2 November). For along-track error, negative (positive) indicates a slow (fast) bias. For cross-track error, negative (positive) indicates a left (right) bias.
| Forecast | T + 24 hours | T + 48 hours | T + 72 hours |
|---|
| ECMWF EPS | 59/−1/−29 | 112/−1/−63 | 73/−35/−63 |
| JMA deterministic | 51/−23/−13 | 114/−49/−40 | 138/−85/−103 |
| HKO | 71/−2/−18 | 73/−33/−11 | 90/−66/−53 |


