Abstract
The global transmission of COVID-19 has caused considerable health burdens, and epidemiological studies have proven that temperature and humidity play an important role in the transmission of infectious respiratory diseases. This effect may not be immediate and can be delayed by days to weeks. In this study, the comprehensive effect of temperature and humidity on COVID-19 was evaluated using the discomfort index (DI). We analyzed the lag effect of the DI on COVID-19 from 21 January to 29 February 2020 in 11 Chinese cities by designing a generalized additive model (GAM). We classified the 11 Chinese cities into southern cities and northern cities to compare the potential effects in these two types of cities. The results reveal that the DI had the same negative correlation and different lag effects on daily COVID-19 cases. There was a significant negative correlation between the DI and daily COVID-19 cases (p < 0.05), except in Wuhan. The lag effect was stronger in the cities located further north. In northern cities, each unit decrease in the DI increased the COVID-19 risk from 7 to 13 lag days. In southern China, each unit decrease in the DI increased the COVID-19 risk from 0 to 7 lag days, especially in Shanghai, Guangzhou, and Shenzhen.
1. Introduction
COVID-19 is a respiratory disease caused by the SARS-CoV-2 virus. It is mainly transmitted by respiratory aerosols or airborne droplets [1,2]. The clinical features of COVID-19 include fever, fatigue, coughing, and difficulty breathing. The incubation period is 5 to 6 days on average but can last as long as 14 days [3,4,5].
Epidemiological studies revealed that meteorological factors play an important role in the transmission of respiratory diseases, especially temperature and humidity [6,7,8,9]. Social factors, such as population mobility and travel between cities, directly affect the risk of COVID-19 transmission [10,11,12]. Many researchers have studied the impact of temperature on COVID-19 and revealed a moderate negative correlation between temperature and the number of daily infections [7,13,14,15,16,17,18,19]. One study in Shanghai showed the exposure–response relationship between COVID-19, and the average temperature was negative when 5 °C < average temperature < 15 °C [19]. One study found that 60.0% of confirmed COVID-19 cases occurred in places where the air temperature ranged from 5 °C to 15 °C [20]. The effect of humidity on COVID-19 requires more in-depth studies. One laboratory study revealed that the relationship between virus inactivation and humidity was not monotonic and that there was a greater survival or a greater protective effect at low humidity (20%) and high humidity (80%) than at moderate humidity (50%) [21].
The lag effect in this study manifested as a temperature increase (decrease) for one day that lead to a decrease (increase) in COVID-19 cases during the next 0–14 days. The influences of temperature and humidity on COVID-19 may not be immediate and can be delayed by days to weeks. One American study on the meteorological impacts of lag on COVID-19 suggested that the temperature, relative humidity, and precipitation had a significant positive association with COVID-19 incidence from 3 to 11 lag days [22]. One study in Queens, New York, indicated the significant effects of temperature and humidity on new COVID-19 cases with 9–13 lag days [23]. One case study in New Jersey, USA, indicated that temperature has a negative association with new COVID-19 cases without lag and with two days of lag, respectively [24].
This time period showed the entire process of COVID-19 transmission from its initial outbreak to simultaneous containment in multiple cities. By 21 January, most cities had single-digit numbers of COVID-19 cases. By 29 February, the number of confirmed cases in all cities except Wuhan dropped to zero. This indicates that the outbreak was under government control in these 11 cities.
It is valuable to research the suspected effects of temperature and humidity on COVID-19 in different cities. We attempted to compare and contrast the results from these 11 cities. This study may help to deliver more targeted COVID-19 control and prevention in Chinese cities. It may contribute to the implementation of early warning surveillance of COVID-19 cases by using weather forecasting for up to 14 days in cities with COVID-19 cases.
2. Data and Methods
2.1. Study Area
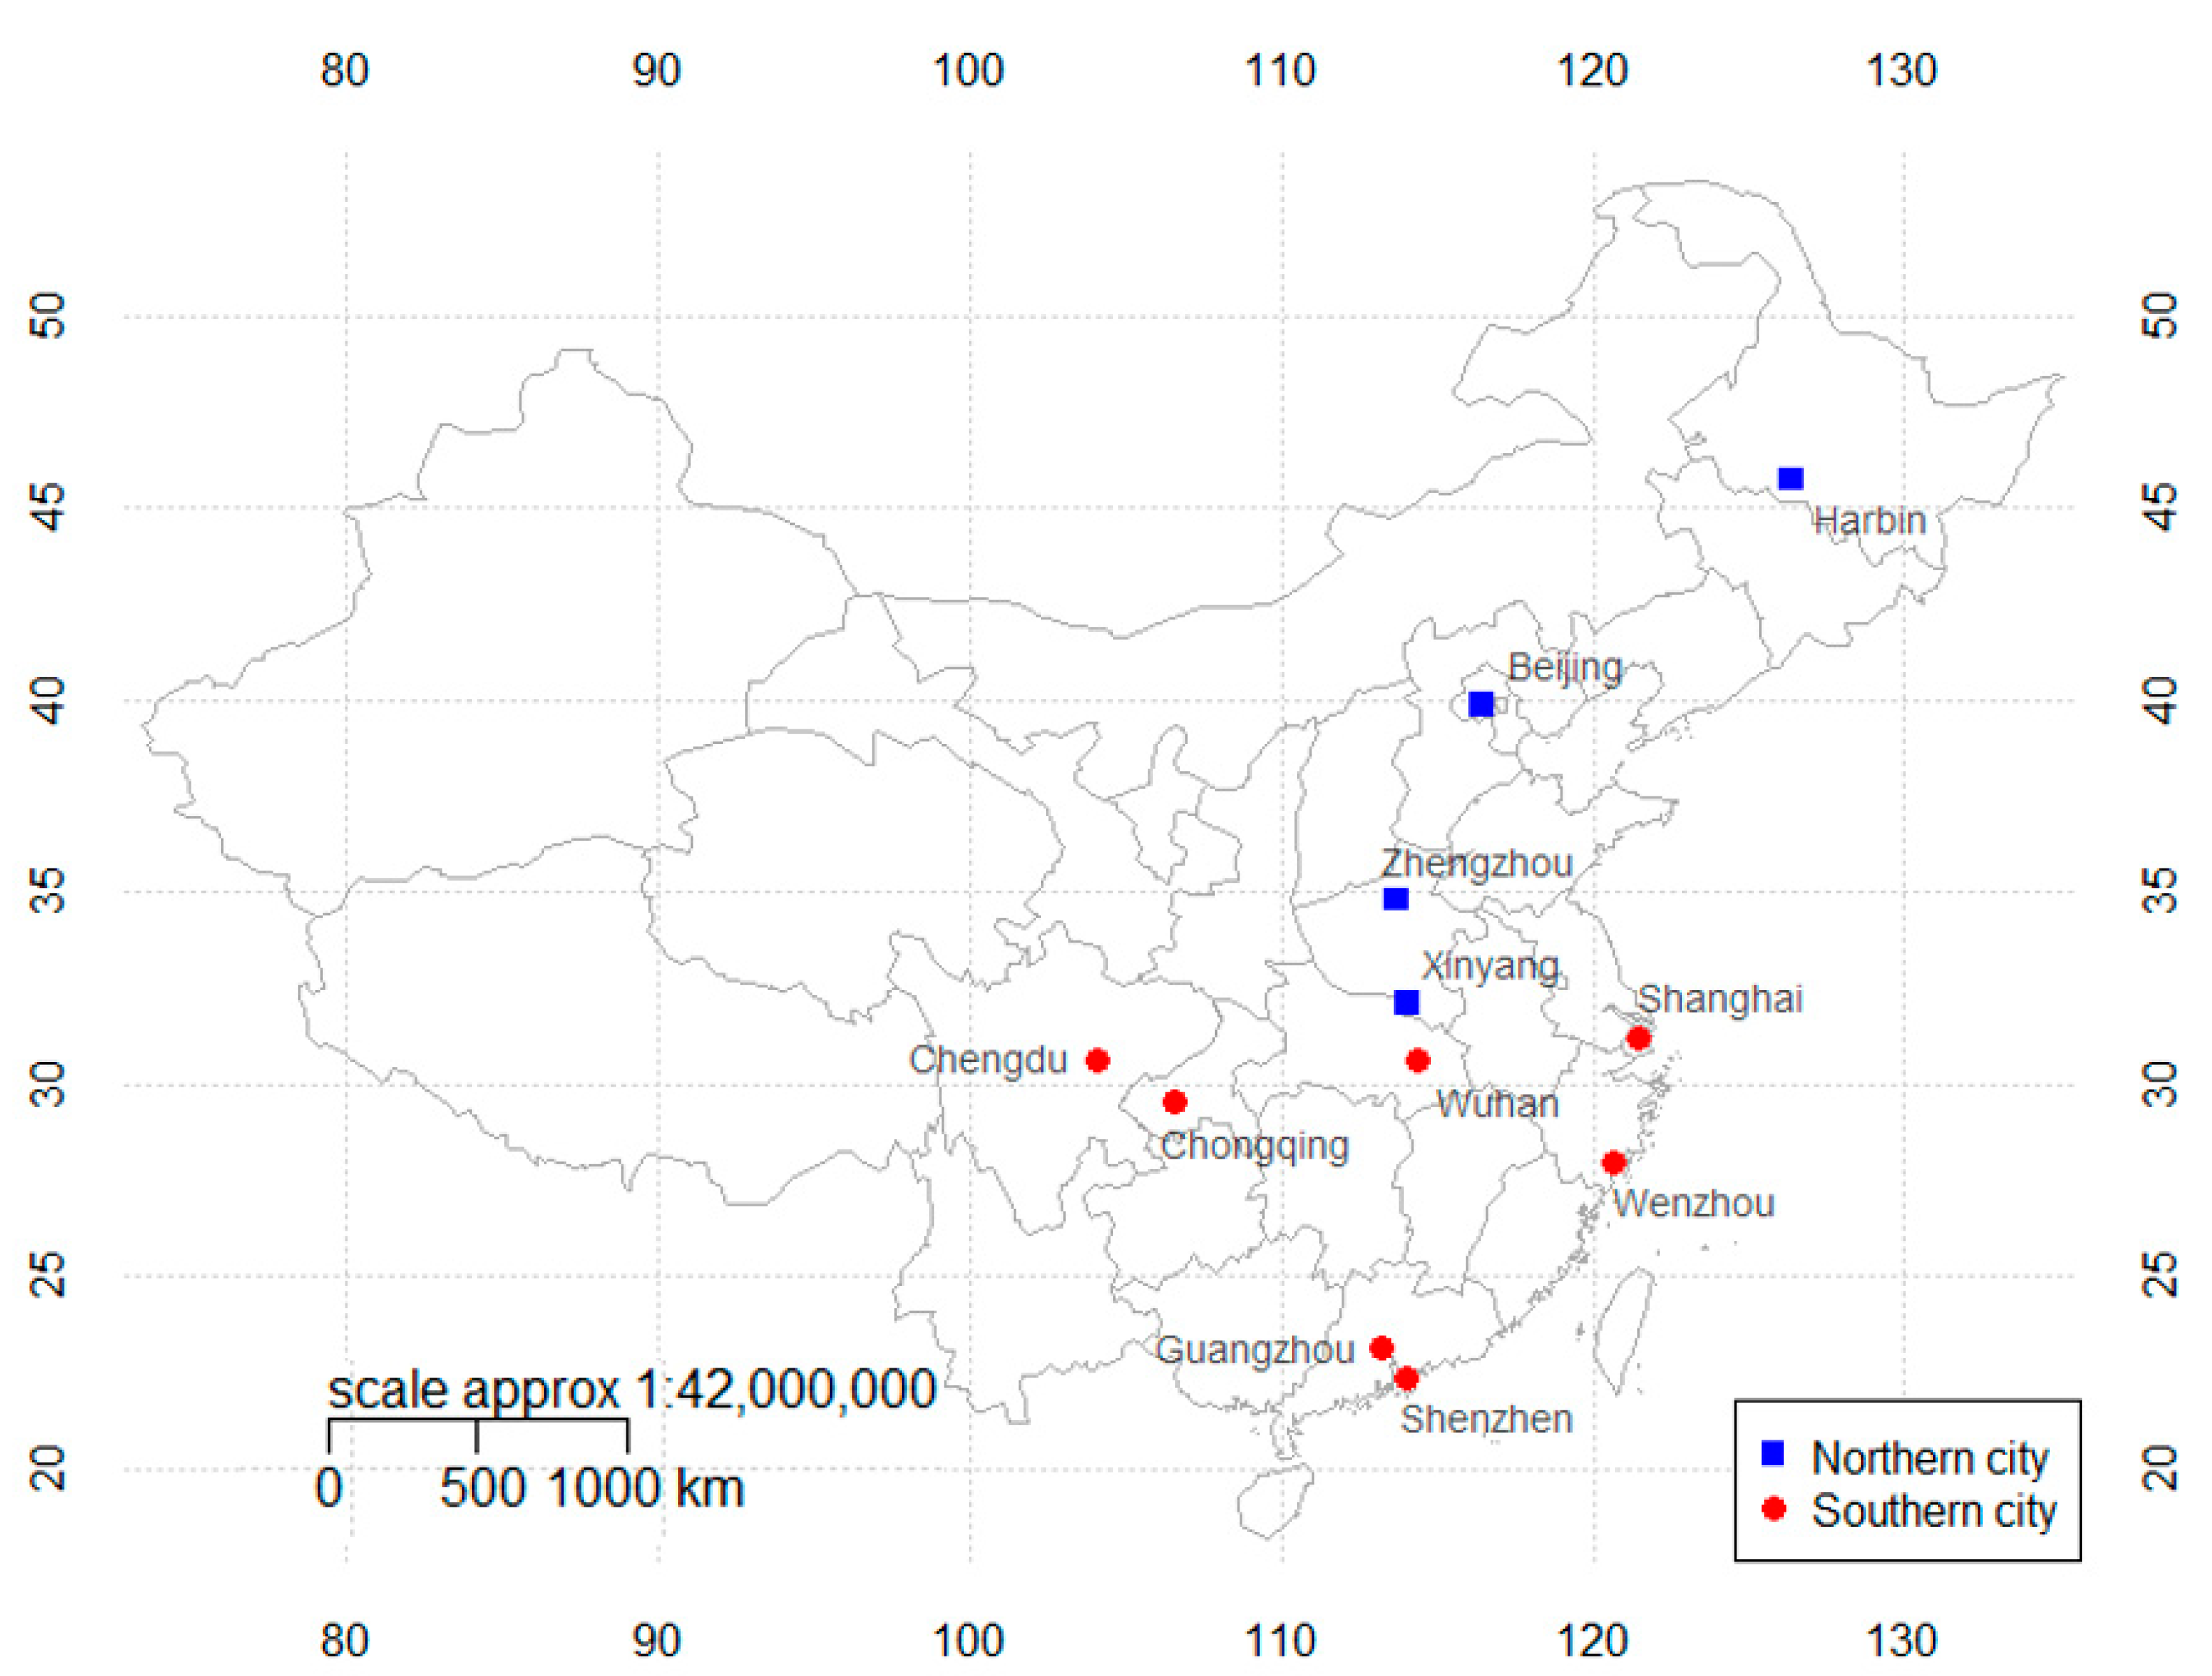
The 11 selected cities included three municipalities (Beijing, Shanghai, and Chongqing), the epicenter of COVID-19 (Wuhan), four provincial capitals (Harbin, Zhengzhou, Chengdu, and Guangzhou), and three large cities with severe COVID-19 cases (Shenzhen, Wenzhou, and Xinyang).
We classified the 11 selected cities into two types by geographical location. The first group included four northern inland cities (Harbin, Beijing, Zhengzhou, and Xinyang). The second group included seven southern cities (Chengdu, Chongqing, Wenzhou, Shanghai, Shenzhen, Guangzhou, and Wuhan). The Qinling Mountains–Huaihe River line (32° N~34° N) is the boundary between the northern and southern cities in this study, and it is an important climatic dividing line between northern and southern China. This line is also the boundary between the warm temperate zone and subtropical zone and the boundary between humid and sub-humid areas in China [25,26]. For example, Nanyang (34°40′ N, 112°21′ E) is located to the north of the line, while Wuhan (30°60′ N, 114°30′ E) is located to the south of the line, so the cities of China are divided into two types in this way (see Figure 1).
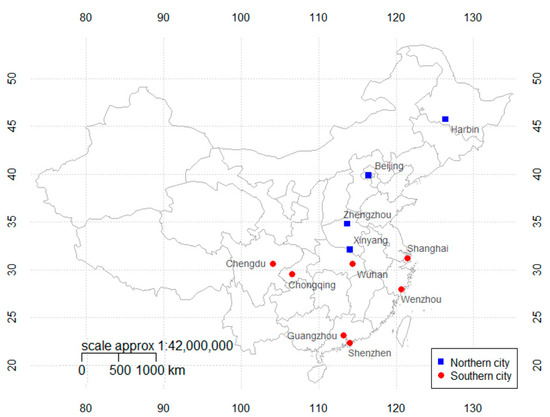
Figure 1.
Geographical locations of the 11 selected cities in China, including northern cities and southern cities (classification was made according to climate type and geographical location).
2.2. Meteorological Data
Daily meteorological data from 21 January to 29 February 2020 were collected from these cities’ meteorological bureaus and included the daily average temperature, maximum temperature, minimum temperature, relative humidity, wind speed, sunshine hours, and air pressure. There were no missing data, and the meteorological data were accurate with international standards. In China, the data collected by the meteorological bureau were derived from local national–level surface meteorological stations, which are of reliable quality and can provide solid data to support scientific research.
2.3. COVID-19 Data
Daily numbers of COVID-19 cases from 21 January to 29 February were collected from each city’s daily COVID-19 case reports. By 21 January, many cities had begun to report the hospitalization of COVID-19 patients, which meant the beginning of the spread of COVID-19 in China. By 27 February, the number of confirmed cases in all cities except Wuhan dropped to zero for the first time. From 29 February to 1 March, the number of confirmed cases in Wuhan decreased from 565 to 193 per day, and the number of confirmed cases in other cities remained at zero. The clear decrease in cases in Wuhan indicates that the COVID-19 situations in Chinese cities were under control, and the end date for this experiment was set as 29 February. Since the diagnosis of COVID-19 cases was carried out in hospitals by experienced doctors, and quality control was implemented by the local Center for Disease Control and Prevention, this data source is considered to be credible and has been widely used in legitimate epidemiological studies.
2.4. Social Factors
Two population movement indexes were used to indicate the social factors by which the city models were refined: the population inflow index (PII) and urban travel index (UTI), both of which are products of Baidu Migration (https://qianxi.baidu.com accessed on 6 July 2020). Baidu Migration is a big data visualization project on the theme of population migration. Baidu Migration uses Baidu Maps, a location-based service (LBS) open platform, and Baidu Sky Eye to analyze LBS-related big data and calculate these two indices, indicating population movement effects in China. The PII can show how many people traveled into the city during this time period. The UTI can show whether people are more likely to stay at home or carry out their daily activities, which could reveal the social distance between people to some extent. By incorporating the PII and UTI, the model may be explained by meteorological factors, on the one hand, and the influence of social factors on COVID-19 cases, on the other hand. These two social factors will make the model more explicable, and the influence of temperature and humidity on COVID-19 cases will be clearer. These two social indexes were crawled by Python 3.7.
3. Analytical Method
Previous studies demonstrated that meteorological factors have notable effects on the transmission of respiratory diseases, especially temperature and humidity [12,16,19]. We considered a human biometeorological index to assess COVID-19 risks.
In 1959, Thom gave the following empirical formula to obtain the discomfort index (°F) from the dry temperature (td) and the wet temperature (tw) [27]. The equation is as follows:
If we want to use the equation with the temperature (°C) and relative humidity (%), the equation is as follows:
where Ta is air temperature (°C) and RH is relative humidity (%). The unit of discomfort index (DI) is degree Celsius (°C). DI was a biometeorological index related to person’s thermal discomfort [27,28]. This biometeorological index describes human discomfort due to air temperature and humidity. Additionally, many related studies have suggested using this index in human health research. Epstein and Moran conducted a review on thermal indices and their correlation with thermal sensation and comfort. It has been suggested that the discomfort index (DI) was adopted as a universal heat stress index [29]. Vaneckova et al. used the discomfort index (DI) to assess heat-related health risks [30]. Coccolo et al. published a comprehensive review on outdoor human comfort and thermal stress using certain models and standards, in which the discomfort index (DI) constituted an important part of the article [31].
The GAM is a semiparametric model; it includes parametric and nonparametric parts. The parametric part is a linear model based on a least square method; the linear part uses variables with a strong influence on the COVID-19 lag model. The nonparametric part includes variables that supplement the model’s linear factors. The nonparametric part uses the spline function as a smoothing function to adjust the model’s details, whose functional forms are always nonspecific [32,33]. If we add the parametric part and nonparametric part together, we obtain a nonlinear relationship between the meteorological data and COVID-19 data for the selected cities.
The basic model formula of the GAM is as follows:
where Yj is the number of daily confirmed COVID-19 cases, and E(Yj) is the expected confirmed cases at lay j day. The distribution of Yj approximately follows a Poisson distribution because COVID-19 cases have a small probability. α is the interception of function, and l is the lag day. DIi is the DI variable at day i; β is the coefficient of DI. NS is the natural spline cubic function. DOW is the day of the week with the coefficient θ to explain the weekday effect. PIIi is the PII variable on day i with the coefficient γ, and UTIi is the UTI variable on day i with the coefficient ε. Hi, Pi, and Vi represent the variables of sunshine duration, average air pressure, and average wind speed on day i, respectively. We used the df (degree of freedom) of time to explain the long-term trend and the DOW to control the weekday effect. We adjusted the df of P (sea-level pressure, in hPa), H (sunshine hours), and V (average daily wind speed, in m/s) to minimize the Akaike information criterion. These parameters functioned as the model’s smooth terms, which may make the contribution of the DI in COVID-19 cases clearer.
The relative risk (RR) and 95% confidence intervals (CIs) were used to assess the influence of the DI on COVID-19 cases. The formulas of the RR and 95% CIs were as follows:
where ∆x is the change in the DI, which in this study, is a 1 unit decrease in the DI; SE is the standard error of βl.
The RR indicates that each unit increase (∆x = 1) in the DI will lead to an RR × 100(%) increase in the risk of COVID-19. Many studies revealed a moderate negative correlation between the temperature and daily confirmed cases [7,13,14,15,16,17,18,19]. If the RR is less than 1.0, it indicates that an increase in the DI will lead to a decrease in the COVID-19 risk, and the result is significant.
The lag effect is that a temperature increase (decrease) on one day will lead to a decrease (increase) in the COVID-19 risk in the next 0–14 days. This study attempted to establish the relationship between the temperature on that day and the COVID-19 risk on a future day. If the RR was less than 1.0 on one lag day, the lag effect on that day was significant. The MGCV package was used for the GAM analysis based on the R 3.5.3 software program (R Foundation for Statistical Computing, Vienna, Austria).
4. Results
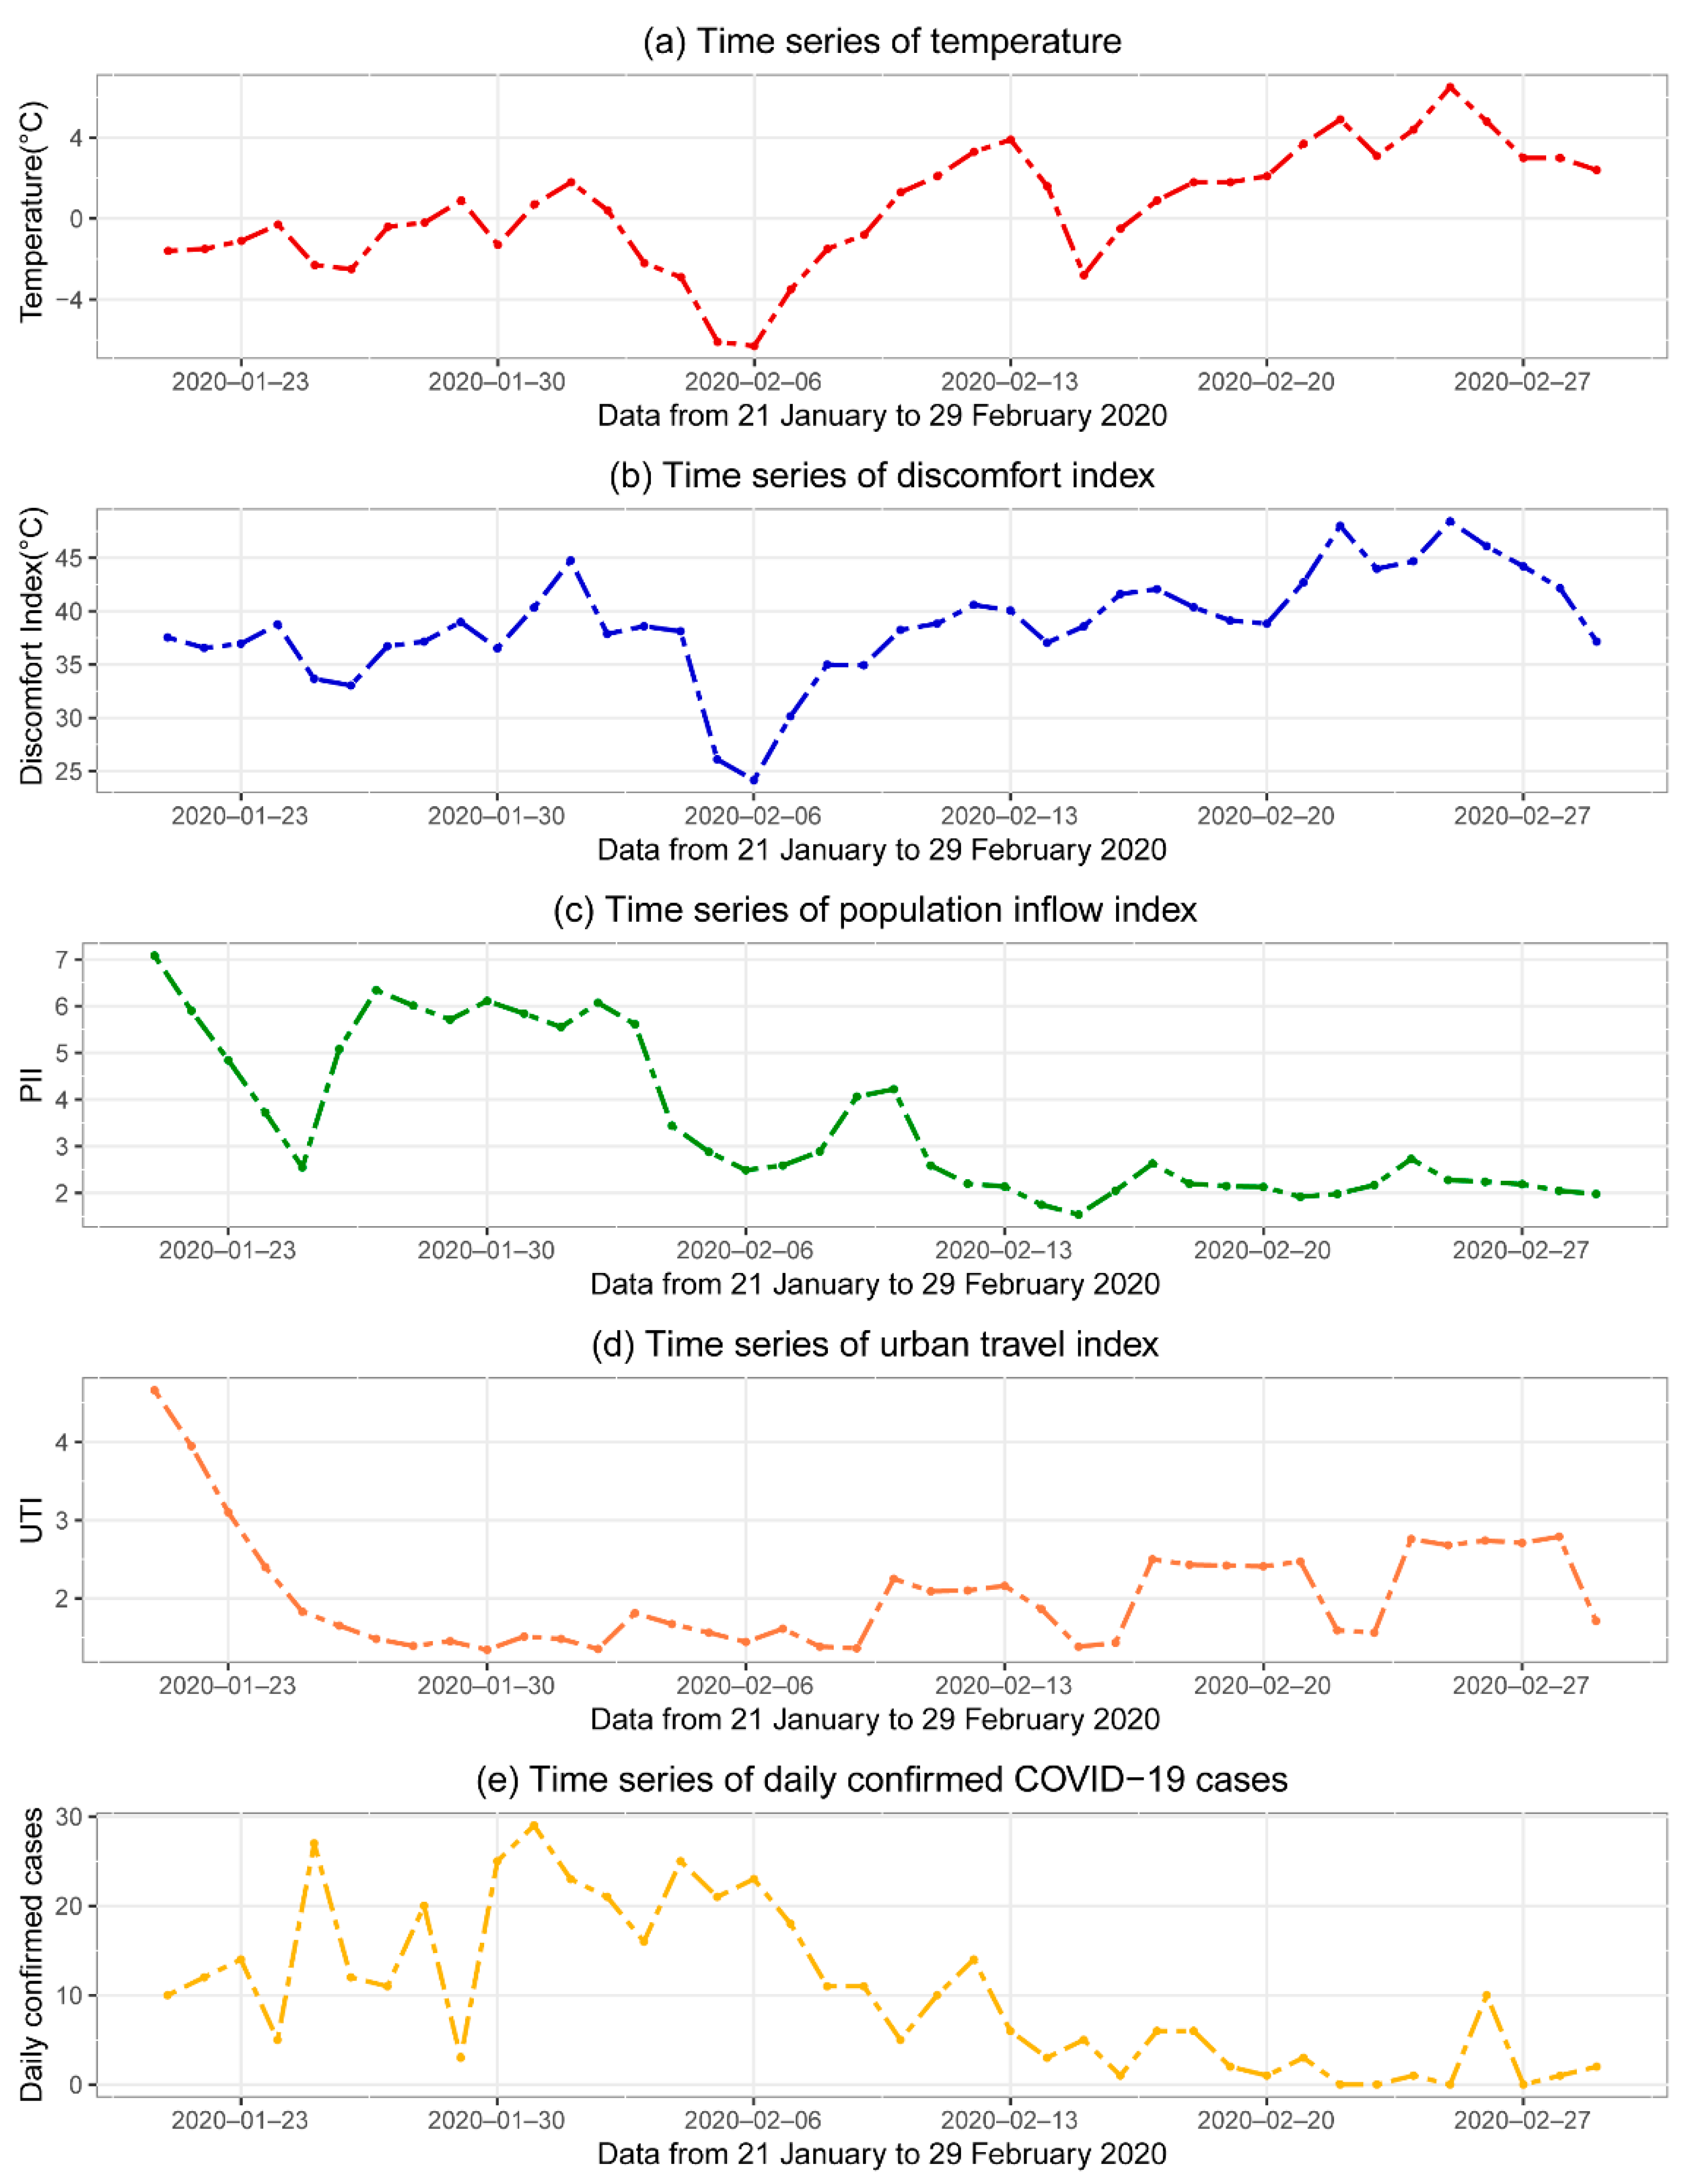
Figure 2 illustrates time series analyses of meteorological and social factors in Beijing. As the capital of China, Beijing had a significant number of COVID-19 cases during this period. Therefore, meteorological data and data on the daily COVID-19 cases in Beijing were selected as the representative data in this study. Figure 2 displays a comparison of the DI and the daily average temperature. The time series trend of DI is consistent with temperature.
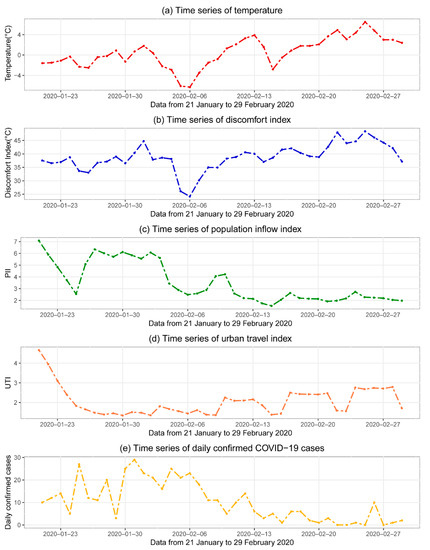
Figure 2.
Time series analyses of temperature (a), discomfort index (b), population inflow index (c), urban travel index (d), and daily COVID-19 confirmed cases (e) in Beijing. The data range was from 21 January to 29 February 2020.
Table 1 presents a Spearman correlation analysis, lag model r-squared values of COVID-19 diagnoses, and meteorological and social factors in 11 Chinese cities. There was a significant negative correlation between the DI and daily COVID-19 cases (p < 0.05), except in Wuhan. The correlation coefficients of the DI in 10 cities, those of the PII in six cities, and those of the UTI in nine cities were all significant (p < 0.05). The adjusted r-squared values of the lag models were above 0.75 for nine cities, and all of the deviances explained were above 70%. This means that these models had significant fitting effects and may be contrasted to obtain credible results.

Table 1.
Spearman correlation analysis, GAM models r-squared values for COVID-19 diagnoses, and DI (discomfort index) and social factors in 11 Chinese cities.
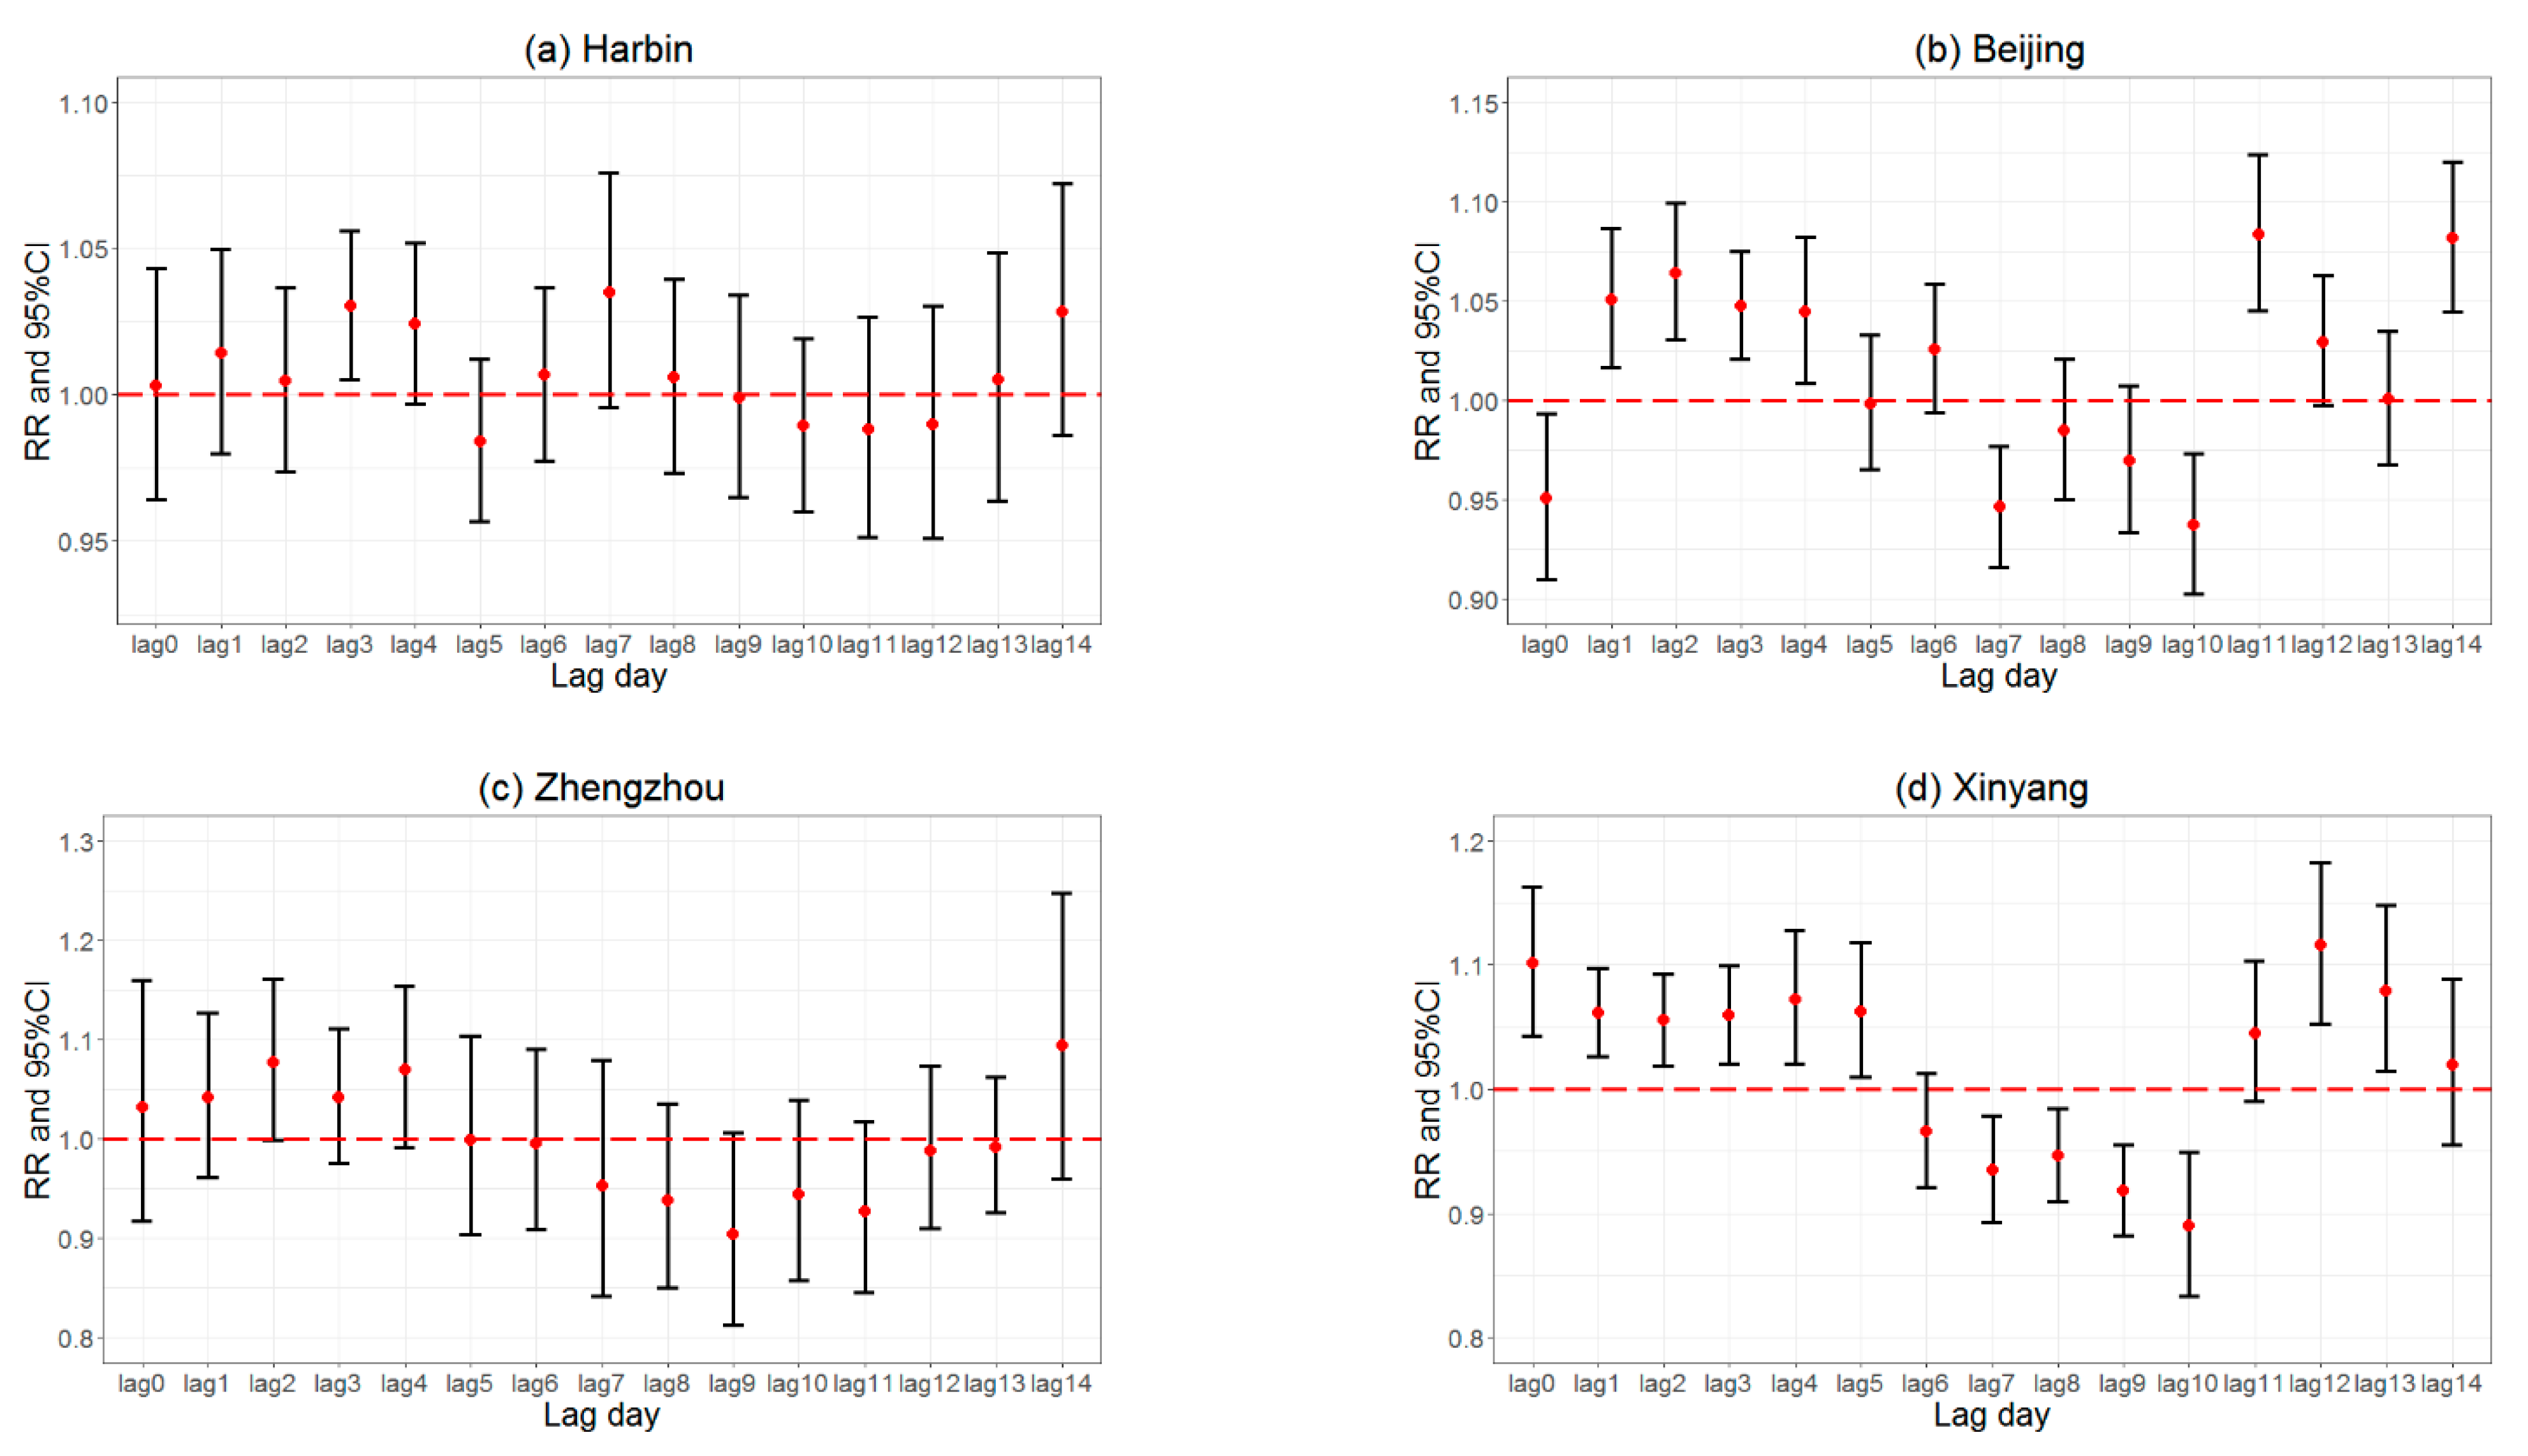
Figure 3 displays the RRs for COVID-19 cases in northern inland cities. When the RRs are below 1.0, this indicates an increased COVID-19 risk for each unit decrease in the DI. In the northern cities, each unit decrease in the DI increased the COVID-19 risk, mainly from 7 to 13 lag days. In Harbin, the RRs were below 1.0 at 5 and 10–12 lag days. In Beijing, the RRs were below 1.0 at 0, 5, and 7–10 lag days. In Zhengzhou, the RRs were below 1.0 at 5–13 lag days. In Xinyang, the RRs were below 1.0 at 6–10 lag days. The RRs in Harbin had a smaller CI and more stable RR values. Other cities located further south showed unstable RR changes and larger CIs.
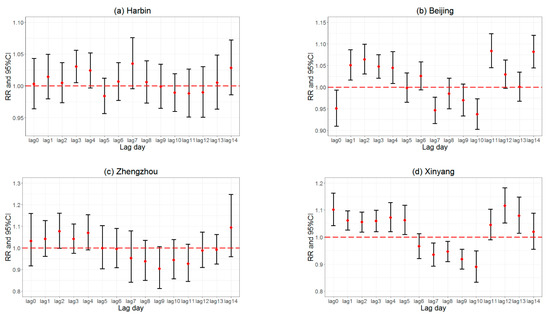
Figure 3.
Lag effects of discomfort index on COVID-19 risks from lag 0 day to lag 14 days in Harbin (a), Beijing (b), Zhengzhou (c), and Xinyang (d), four northern cities in China.
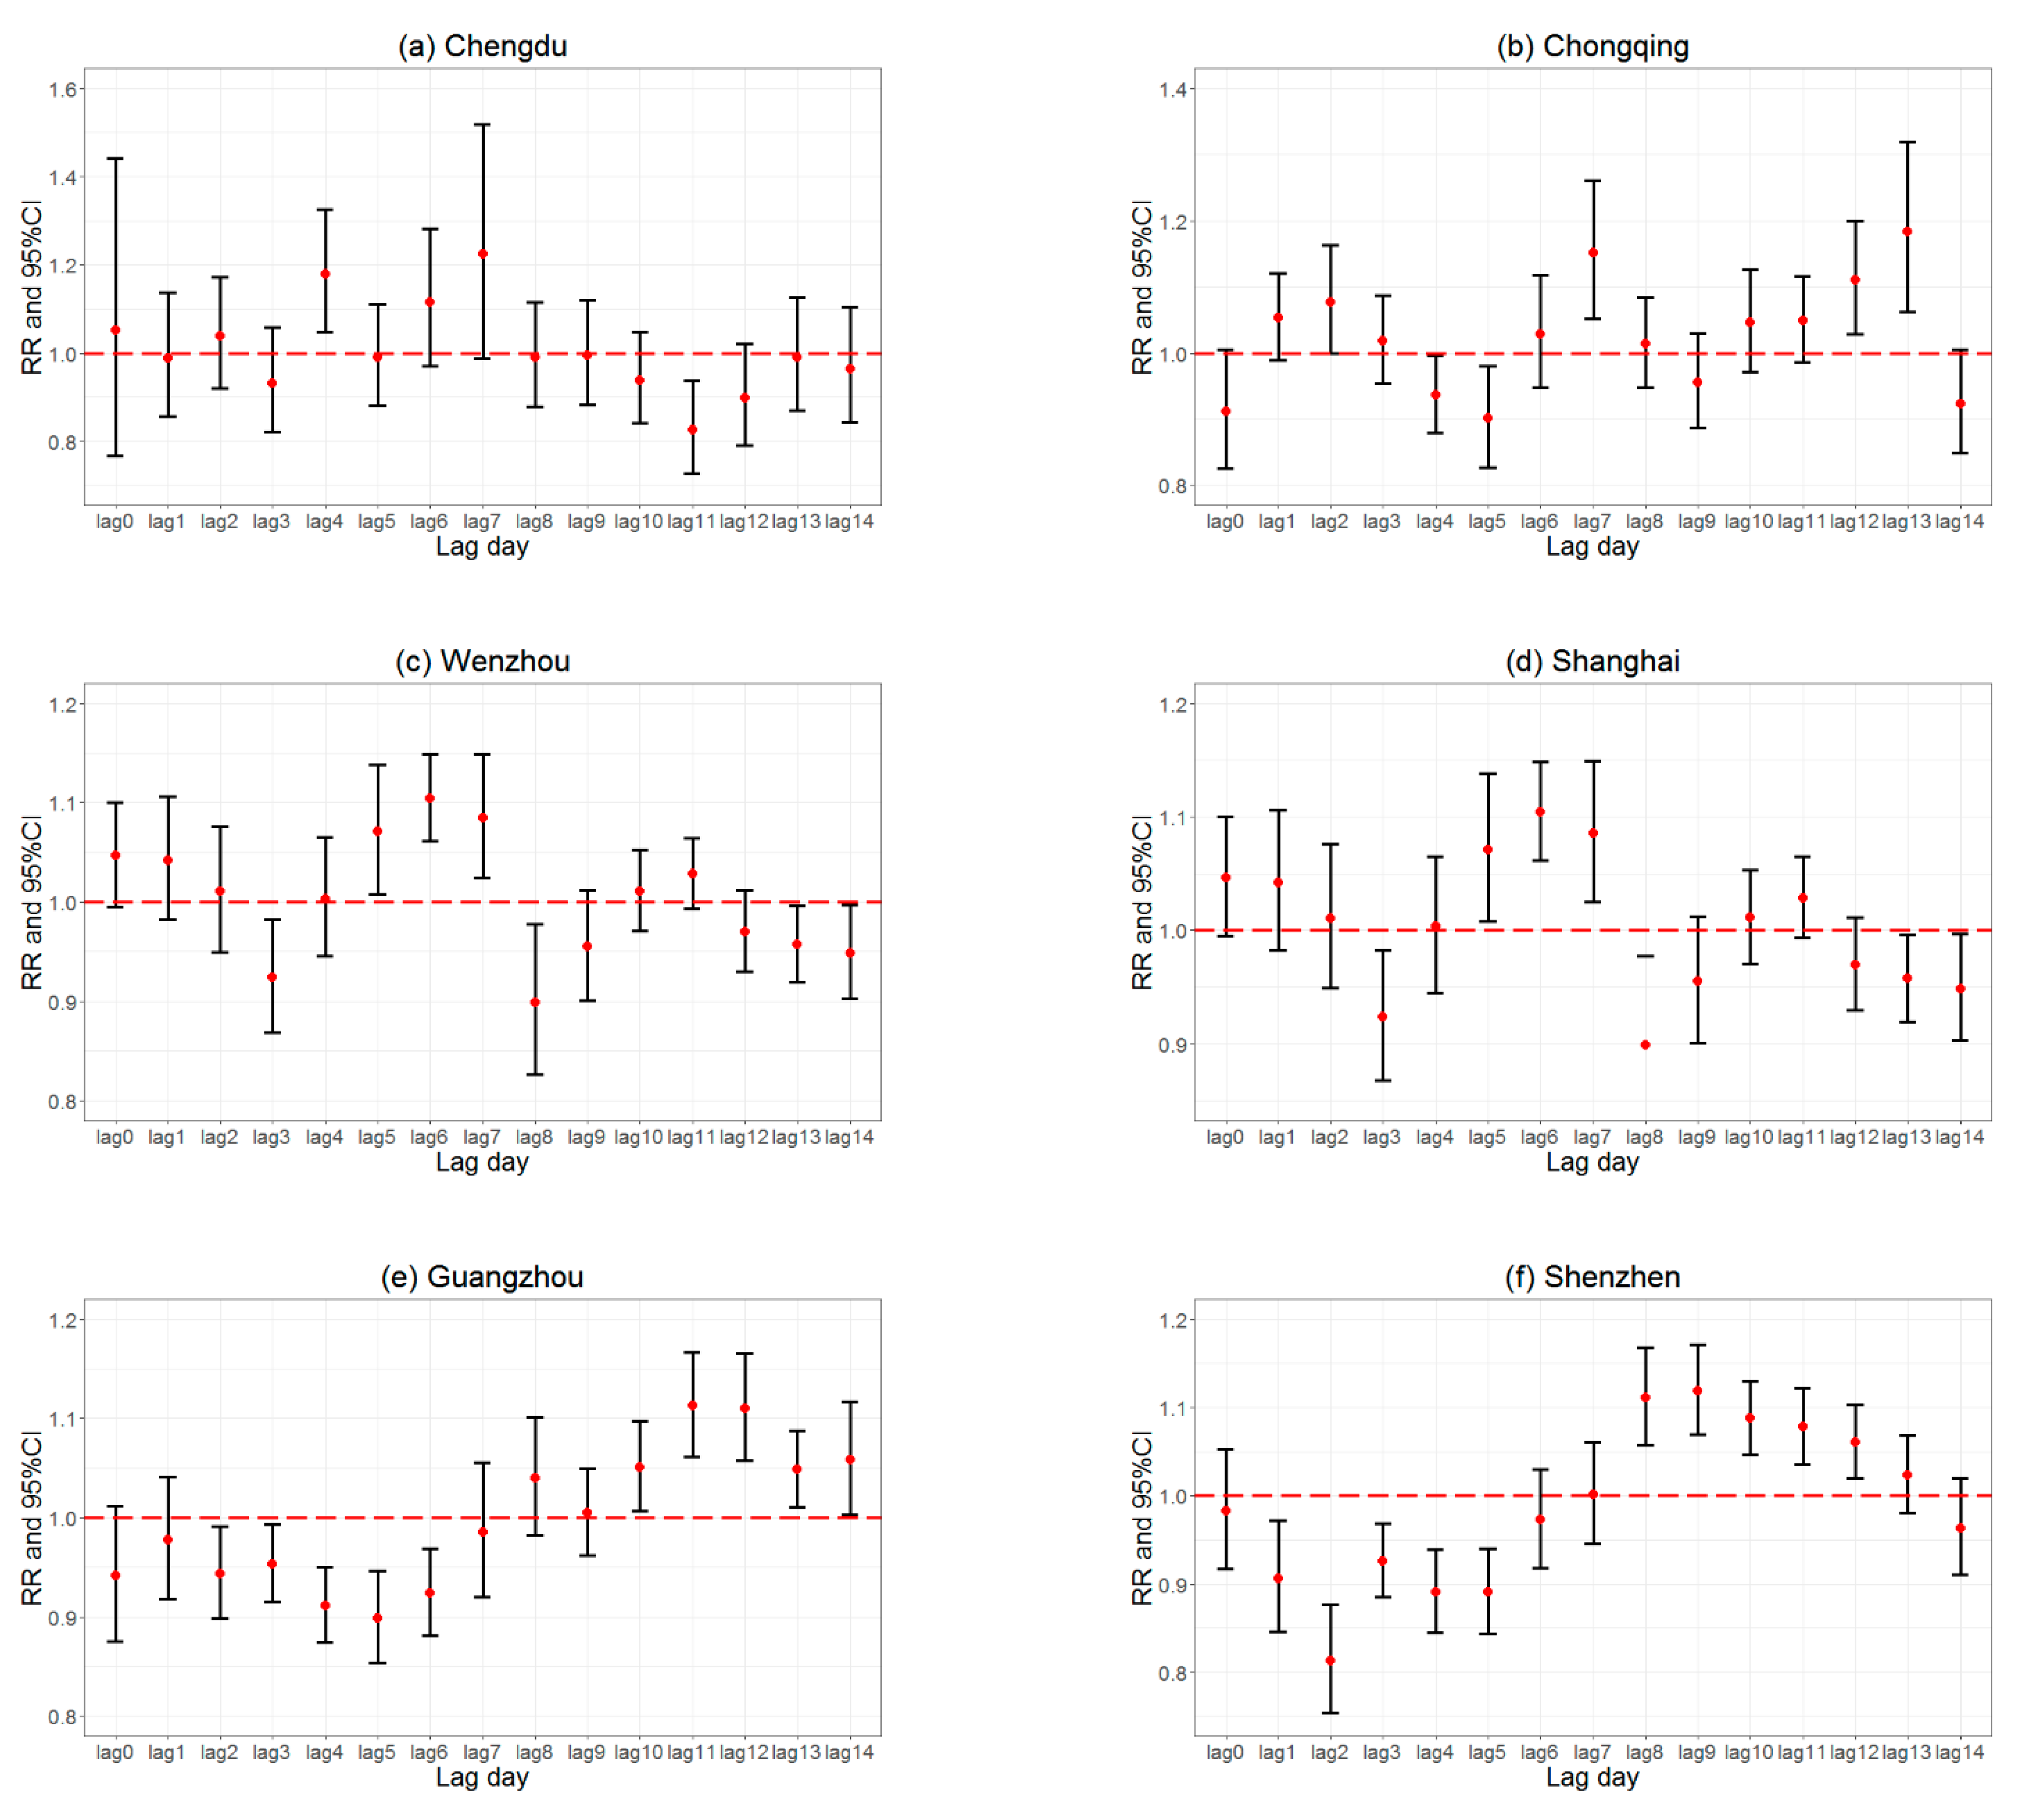
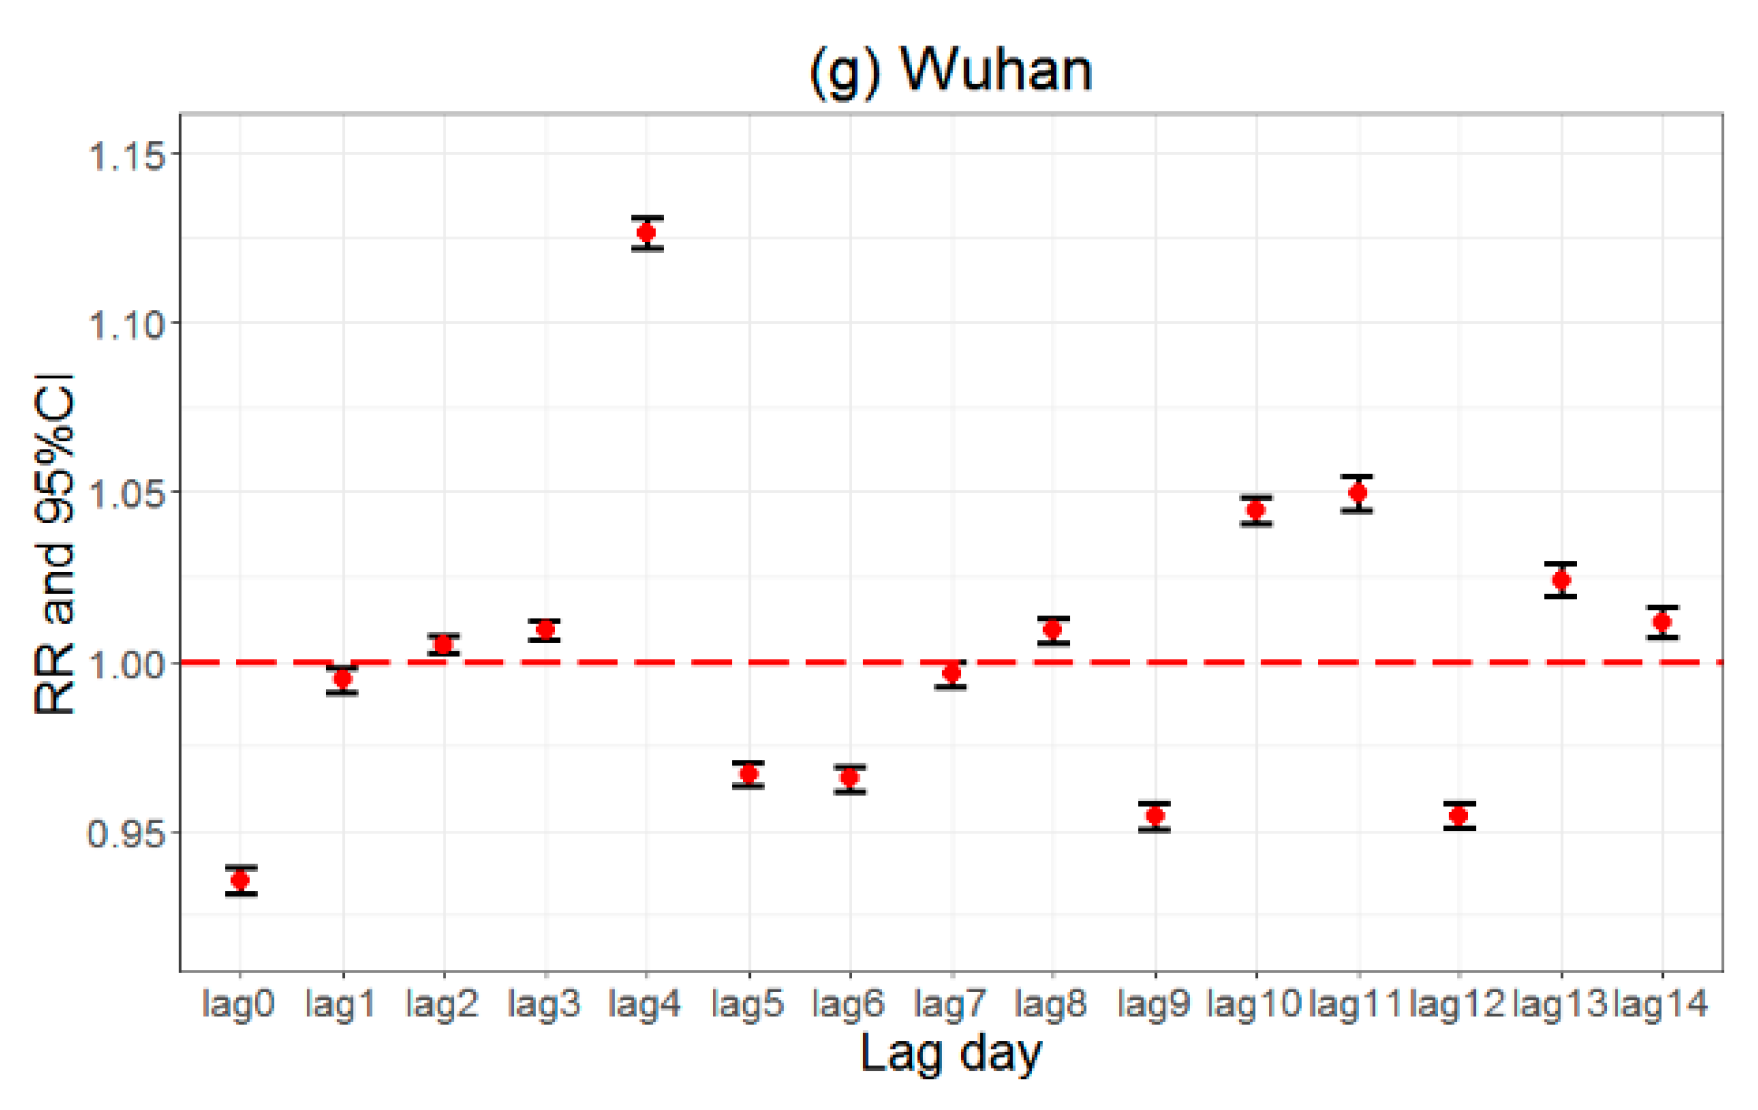
Figure 4 displays the RRs for COVID-19 cases in the southern cities. We concluded that each unit decrease in the DI increased the COVID-19 risk, mainly from 0 to 7 lag days in southern China, especially in Shanghai, Guangzhou, and Shenzhen. In Chengdu, the RRs were below 1.0 at 1, 3, 5, and 8–14 lag days. In Chongqing, the RRs were below 1.0 at 0, 4–5, 9, and 14 lag days. In Wenzhou, the RRs were below 1.0 at 3, 8, 9, and 12–14 lag days. In Wuhan, the RRs were below 1.0 at 0–1, 5–7, 9, and 12 lag days. In Shanghai, the RRs were below 1.0 at 0–1 and 5–6 lag days. In Guangzhou, the RRs were below 1.0 at 0–7 lag days. In Shenzhen, the RRs were below 1.0 at 0–6 and 14 lag days.
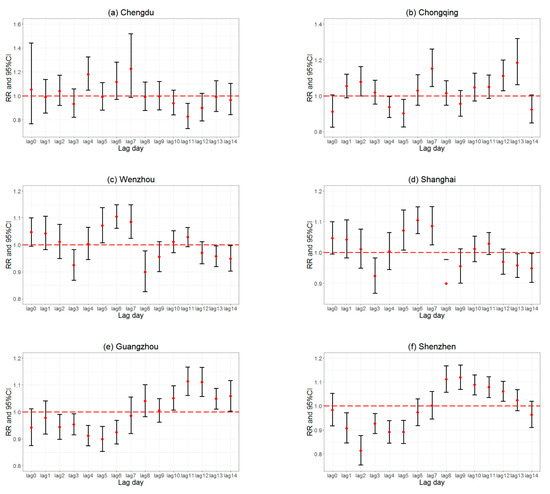
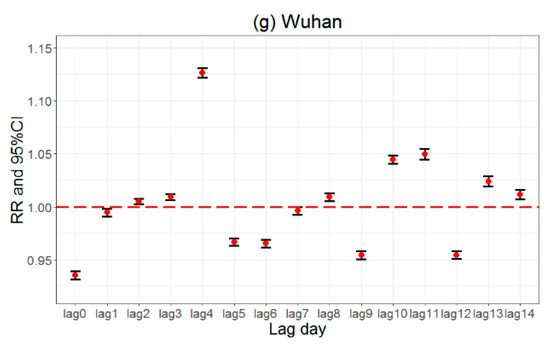
Figure 4.
Lag effects of discomfort index on COVID-19 risks from lag 0 day to lag 14 days in Chengdu (a), Chongqing (b), Wenzhou (c), Shanghai (d), Shenzhen (e), Guangzhou (f), and Wuhan (g), seven southern cities in China.
5. Discussion
In the present study, we used a 14-day GAM model of COVID-19 to compare the lag effect in 11 cities from 21 January to 29 February 2020. Our study indicated that the latitudes of the cities influenced the lag effect of the temperature and humidity on COVID-19 transmission. The lag effect was more significant in the northern cities than in the southern cities, and the lag effect was stronger in the cities located further north.
In four northern cities (Harbin, Beijing, Zhengzhou, and Xinyang), the lag effect was mainly found during the second week of temperature decrease (from 7 to 13 lag days) except for the RR (0.950, 95%CI: 0.910–0.993) at 0 lag days in Beijing. One study in Queens, New York, showed that the lag effects of ozone, PM2.5, and meteorological factors were significant for new COVID-19 cases after 9–13 lag days, which was similar to the research in the four northern cities [23].
In southern cities, the lag effect was mainly found during the first week of temperature decrease (from 0 to 6 lag days), especially in Shanghai, Shenzhen, and Guangzhou. Shenzhen and Guangzhou are both big cities in southern China. The distance between Guangzhou and Shenzhen is 138 km, and both of these two cities are located near 23°N. This indicates that an increase in the COVID-19 risk was most significant from 0 to 6 lag days with a temperature decrease. Some researchers found that a negative relationship between the temperature and COVID-19 was significant in the first 6 days, and 6 days was the mean incubation period of COVID-19 [3,15,34].
We used the population inflow index (PII) and urban travel index (UTI) to study the impact of social distancing on COVID-19 cases. The correlation coefficients between the daily confirmed cases and PII were significant (p < 0.05) in four cities, and most of them were negatively correlated. The correlation coefficients between the daily confirmed cases and UTI were significant (p < 0.05) in seven cities, and all of them had a negative correlation. This indicates that a decrease in these two social indexes occurred as a result of the increase in the daily confirmed cases of the cities. One study evaluated the impact of social distancing measures on the growth rate of confirmed COVID-19 cases across US counties and indicated the potential danger of the exponential spread of COVID-19 in the absence of interventions [35]. One study in China indicated that an earlier intervention of social distancing may have significantly limited the epidemic. With 30 days of substantial social distancing, the reproductive number in Wuhan and Hubei was reduced from 2.2 (95%-CI: 1.4∼3.9) to 1.58 (95%-CI: 1.34∼2.07) and in other provinces from 2.56 (95%-CI: 2.43∼2.63) to 1.65 (95%-CI: 1.56∼1.76) [36].
As the source city of COVID-19, Wuhan’s lag effect is unique. In Wuhan, the lag model had the smallest confidence interval (p < 0.01). This indicates that the model in Wuhan was the most significant because the number of COVID-19 cases reached 49,615. Wuhan’s RR was the lowest at lag 0 day (0.935, 95%CI: 0.931–0.939). This proves that the risk of COVID-19 significantly increased on the same day that the temperature decreased.
Comparing the lag effect of southern cities and northern cities revealed that the lag effect was more significant in northern cities than in southern cities, and the lag effect was stronger in the cities located further north. We concluded that cities with lower temperatures and humidity had more significant lag effects on COVID-19 transmission. One study suggested that COVID-19 will be characterized by a seasonal transmission similar to seasonal influenza in the coming years and that COVID-19 outbreaks will occur each winter after the initial pandemic [14].
COVID-19 is part of the respiratory diseases, so we considered the lag effects of common respiratory diseases. A study on temperature and mortality in 272 Chinese cities demonstrated that, at the national average level, relative to the minimum mortality temperature (22.8 °C, 79th percentile), the mortality risk of extremely cold temperatures (−1.4 °C, 2.5th percentile) lasted for more than 14 days, whereas the risk of extremely hot temperatures (at 29.0 °C, the 97.5th percentile) immediately appeared and lasted for 2 to 3 days [37]. It has been suggested that low temperatures can cause other common respiratory diseases that make the body more susceptible to COVID-19.
More factors may be taken into account. A study in Japan suggested that older people have a higher RR of COVID-19, revealing that age demographics have an influence on COVID-19 transmission rates [13,38,39]. The educational level of the population was an important factor on COVID-19 risks and revealed a strong negative association with COVID-19 cases [7]. Some studies demonstrated that the population outflow from the pandemic source region posed a higher risk to destination regions than other economic and social factors. As the epicenter of the pandemic, we should consider the outflow from Wuhan to other cities as a separate factor [10]. City population density is also another important variable that should be considered [40,41].
This study revealed that cities with lower temperatures and humidities had more significant lag effects on COVID-19 transmission. This indicates that the government should control the COVID-19 epidemic situation for longer periods in cold and dry areas, which tended to cause the spread of COVID-19 when cold weather occurred.
6. Conclusions
This study demonstrated that northern and southern Chinese cities had the same negative effects and different lag effects between the DI and daily COVID-19 cases. There was a significant negative correlation between the DI and daily COVID-19 cases (p < 0.05), except in Wuhan. Cities in northern China showed a stronger lag effect than cities in southern China. In the northern cities, each unit decrease in the DI increased the COVID-19 risk from 7 to 13 lag days. In southern China, each unit decrease in the DI increased the COVID-19 risk from 0 to 7 lag days, especially in Shanghai, Guangzhou, and Shenzhen. This revealed that cities with lower temperatures and humidities had a more significant lag effect on COVID-19 cases. These two different lag effects indicated that the government should control the COVID-19 epidemic situation for longer periods in cold and dry areas.
Author Contributions
Conceptualization, F.F. and Y.M.; methodology, F.F. and Y.M.; writing—review and editing, F.F. and B.C.; software, Y.Z.; data curation H.L.; visualization, P.Q. All authors have read and agreed to the published version of the manuscript.
Funding
This research is funded by the National Natural Science Foundation of China (Grant Nos. 41975141). Part of the work is funded by a scholarship awarded to Yuxia Ma (File No. 20206185010), supported by the China Scholarship Council.
Institutional Review Board Statement
Not applicable.
Informed Consent Statement
Not applicable.
Data Availability Statement
Data will be available on request.
Acknowledgments
Not applicable.
Conflicts of Interest
The authors declare no conflict of interest.
References
- Ortiz-Prado, E.; Simbaña-Rivera, K.; Gomez-Barreno, L.; Rubio-Neira, M.; Guaman, L.P.; Kyriakidis, N.C.; Muslin, C.; Jaramillo, A.M.G.; Barba-Ostria, C.; Cevallos-Robalino, D. Clinical, molecular, and epidemiological characterization of the SARS-CoV-2 virus and the Coronavirus Disease 2019 (COVID-19), a comprehensive literature review. Diagn. Microbiol. Infect. Dis. 2020, 98, 115094. [Google Scholar] [CrossRef] [PubMed]
- Lai, C.-C.; Shih, T.-P.; Ko, W.-C.; Tang, H.-J.; Hsueh, P.-R. Severe acute respiratory syndrome coronavirus 2 (SARS-CoV-2) and coronavirus disease-2019 (COVID-19): The epidemic and the challenges. Int. J. Antimicrob. Agents 2020, 55, 105924. [Google Scholar] [CrossRef] [PubMed]
- Huang, C.; Wang, Y.; Li, X.; Ren, L.; Zhao, J.; Hu, Y.; Zhang, L.; Fan, G.; Xu, J.; Gu, X. Clinical features of patients infected with 2019 novel coronavirus in Wuhan, China. Lancet 2020, 395, 497–506. [Google Scholar] [CrossRef]
- Chen, R.; Yin, P.; Wang, L.; Liu, C.; Niu, Y.; Wang, W.; Jiang, Y.; Liu, Y.; Liu, J.; Qi, J. Association between ambient temperature and mortality risk and burden: Time series study in 272 main Chinese cities. BMJ 2018, 363, k4306. [Google Scholar] [CrossRef] [PubMed]
- Nishiura, H.; Linton, N.M.; Akhmetzhanov, A.R. Serial interval of novel coronavirus (COVID-19) infections. Int. J. Infect. Dis. 2020, 93, 284–286. [Google Scholar] [CrossRef]
- Ma, Y.; Jiao, H.; Zhang, Y.; Feng, F.; Cheng, B.; Ma, B.; Yu, Z. Short-term effect of extreme air temperature on hospital emergency room visits for cardiovascular diseases from 2009 to 2012 in Beijing, China. Environ. Sci. Pollut. Res. 2020, 27, 38029–38037. [Google Scholar] [CrossRef]
- Ozyigit, A. Understanding Covid-19 transmission: The effect of temperature and health behavior on transmission rates. Infect. Dis. Health 2020, 25, 233–238. [Google Scholar] [CrossRef]
- Auler, A.; Cássaro, F.; Da Silva, V.; Pires, L. Evidence that high temperatures and intermediate relative humidity might favor the spread of COVID-19 in tropical climate: A case study for the most affected Brazilian cities. Sci. Total Environ. 2020, 729, 139090. [Google Scholar] [CrossRef]
- Xie, J.; Zhu, Y. Association between ambient temperature and COVID-19 infection in 122 cities from China. Sci. Total Environ. 2020, 724, 138201. [Google Scholar] [CrossRef]
- Qiu, Y.; Chen, X.; Shi, W. Impacts of social and economic factors on the transmission of coronavirus disease 2019 (COVID-19) in China. J. Popul. Econ. 2020, 33, 1127–1172. [Google Scholar] [CrossRef]
- Adda, J. Economic activity and the spread of viral diseases: Evidence from high frequency data. Q. J. Econ. 2016, 131, 891–941. [Google Scholar] [CrossRef]
- Qi, H.; Xiao, S.; Shi, R.; Ward, M.P.; Chen, Y.; Tu, W.; Su, Q.; Wang, W.; Wang, X.; Zhang, Z. COVID-19 transmission in Mainland China is associated with temperature and humidity: A time-series analysis. Sci. Total Environ. 2020, 728, 138778. [Google Scholar] [CrossRef] [PubMed]
- Ujiie, M.; Tsuzuki, S.; Ohmagari, N. Effect of temperature on the infectivity of COVID-19. Int. J. Infect. Dis. 2020, 95, 301–303. [Google Scholar] [CrossRef]
- Kissler, S.M.; Tedijanto, C.; Goldstein, E.; Grad, Y.H.; Lipsitch, M. Projecting the transmission dynamics of SARS-CoV-2 through the postpandemic period. Science 2020, 368, 860–868. [Google Scholar] [CrossRef]
- Lauer, S.A.; Grantz, K.H.; Bi, Q.; Jones, F.K.; Zheng, Q.; Meredith, H.R.; Azman, A.S.; Reich, N.G.; Lessler, J. The incubation period of coronavirus disease 2019 (COVID-19) from publicly reported confirmed cases: Estimation and application. Ann. Intern. Med. 2020, 172, 577–582. [Google Scholar] [CrossRef] [PubMed]
- Liu, J.; Zhou, J.; Yao, J.; Zhang, X.; Li, L.; Xu, X.; He, X.; Wang, B.; Fu, S.; Niu, T. Impact of meteorological factors on the COVID-19 transmission: A multi-city study in China. Sci. Total Environ. 2020, 726, 138513. [Google Scholar] [CrossRef]
- Engle, S.; Stromme, J.; Zhou, A. Staying at home: Mobility effects of COVID-19. 2020. Available online: https://ssrn.com/abstract=3565703 (accessed on 27 July 2020).
- Holtmann, M.; Jones, M.; Shah, A.; Holtmann, G. Low ambient temperatures are associated with more rapid spread of COVID-19 in the early phase of the endemic. Environ. Res. 2020, 186, 109625. [Google Scholar] [CrossRef]
- Ma, Y.; Cheng, B.; Shen, J.; Wang, H.; Feng, F.; Zhang, Y.; Jiao, H. Association between environmental factors and COVID-19 in Shanghai, China. Environ. Sci. Pollut. Res. 2021, 28, 45087–45095. [Google Scholar] [CrossRef]
- Huang, Z.; Huang, J.; Gu, Q.; Du, P.; Liang, H.; Dong, Q. Optimal temperature zone for the dispersal of COVID-19. Sci. Total Environ. 2020, 736, 139487. [Google Scholar] [CrossRef]
- Casanova, L.M.; Jeon, S.; Rutala, W.A.; Weber, D.J.; Sobsey, M.D. Effects of air temperature and relative humidity on coronavirus survival on surfaces. Appl. Environ. Microbiol. 2010, 76, 2712–2717. [Google Scholar] [CrossRef] [Green Version]
- Chien, L.-C.; Chen, L.-W.A.; Lin, R.-T. Lagged meteorological impacts on COVID-19 incidence among high-risk counties in the United States—a spatiotemporal analysis. J. Expo. Sci. Environ. Epidemiol. 2021, 1–8. [Google Scholar] [CrossRef] [PubMed]
- Adhikari, A.; Yin, J. Lag effects of ozone, PM2. 5, and meteorological factors on COVID-19 new cases at the disease epicenter in queens, New York. Atmosphere 2021, 12, 357. [Google Scholar] [CrossRef]
- Doğan, B.; Jebli, M.B.; Shahzad, K.; Farooq, T.H.; Shahzad, U. Investigating the effects of meteorological parameters on COVID-19: Case study of New Jersey, United States. Environ. Res. 2020, 191, 110148. [Google Scholar] [CrossRef] [PubMed]
- Jingyun, F.; Yongchang, S.; Hongyan, L.; Shilong, P. Vegetation-climate relationship and its application in the division of vegetation zone in China. Acta Bot. Sin. 2002, 44, 1105–1122. [Google Scholar]
- Huang, C.; Yang, Q.; Guo, Y.; Zhang, Y.; Guo, L. The pattern, change and driven factors of vegetation cover in the Qin Mountains region. Sci. Rep. 2020, 10, 20591. [Google Scholar] [CrossRef]
- Thom, E.C. The discomfort index. Weatherwise 1959, 12, 57–61. [Google Scholar] [CrossRef]
- Jáuregui, E.; Soto, C. Wet-bulb temperature and discomfort index areal distribution in Mexico. Int. J. Biometeorol. 1967, 11, 21–28. [Google Scholar] [CrossRef]
- Epstein, Y.; Moran, D.S. Thermal comfort and the heat stress indices. Ind. Health 2006, 44, 388–398. [Google Scholar] [CrossRef]
- Vaneckova, P.; Neville, G.; Tippett, V.; Aitken, P.; FitzGerald, G.; Tong, S. Do biometeorological indices improve modeling outcomes of heat-related mortality? J. Appl. Meteorol. Climatol. 2011, 50, 1165–1176. [Google Scholar] [CrossRef]
- Coccolo, S.; Kämpf, J.; Scartezzini, J.-L.; Pearlmutter, D. Outdoor human comfort and thermal stress: A comprehensive review on models and standards. Urban Clim. 2016, 18, 33–57. [Google Scholar] [CrossRef]
- Wood, S.N.; Augustin, N.H. GAMs with integrated model selection using penalized regression splines and applications to environmental modelling. Ecol. Model. 2002, 157, 157–177. [Google Scholar] [CrossRef] [Green Version]
- Wood, S.N. On p-values for smooth components of an extended generalized additive model. Biometrika 2013, 100, 221–228. [Google Scholar] [CrossRef]
- Linton, N.M.; Kobayashi, T.; Yang, Y.; Hayashi, K.; Akhmetzhanov, A.R.; Jung, S.-M.; Yuan, B.; Kinoshita, R.; Nishiura, H. Incubation period and other epidemiological characteristics of 2019 novel coronavirus infections with right truncation: A statistical analysis of publicly available case data. J. Clin. Med. 2020, 9, 538. [Google Scholar] [CrossRef] [PubMed]
- Courtemanche, C.; Garuccio, J.; Le, A.; Pinkston, J.; Yelowitz, A. Strong Social Distancing Measures In The United States Reduced The COVID-19 Growth Rate: Study evaluates the impact of social distancing measures on the growth rate of confirmed COVID-19 cases across the United States. Health Aff. 2020, 39, 1237–1246. [Google Scholar] [CrossRef]
- Zhang, Y.; Jiang, B.; Yuan, J.; Tao, Y. The impact of social distancing and epicenter lockdown on the COVID-19 epidemic in mainland China: A data-driven SEIQR model study. medRxiv 2020. [Google Scholar] [CrossRef]
- Chen, N.; Zhou, M.; Dong, X.; Qu, J.; Zhang, L. Epidemiological and clinical characteristics of 99 cases of 2019 novel coronavirus pneumonia in Wuhan, China: A descriptive study. Lancet 2020, 395, 507–513. [Google Scholar] [CrossRef]
- Prem, K.; Liu, Y.; Russell, T.W.; Kucharski, A.J.; Eggo, R.M.; Davies, N.; Flasche, S.; Clifford, S.; Pearson, C.A.; Munday, J.D. The effect of control strategies to reduce social mixing on outcomes of the COVID-19 epidemic in Wuhan, China: A modelling study. Lancet Public Health 2020, 5, e261–e270. [Google Scholar] [CrossRef]
- Dowd, J.B.; Andriano, L.; Brazel, D.M.; Rotondi, V.; Mills, M.C. Demographic science aids in understanding the spread and fatality rates of COVID-19. Proc. Natl. Acad. Sci. USA 2020, 117, 202004911. [Google Scholar] [CrossRef]
- Hughes, V.C. The Effect of Temperature, Dewpoint, and Population Density on COVID-19 Transmission in the United States: A Comparative Study. Am. J. Public Health Res. 2020, 8, 112–117. [Google Scholar]
- Rocklöv, J.; Sjödin, H. High population densities catalyse the spread of COVID-19. J. Travel Med. 2020, 27, taaa038. [Google Scholar] [CrossRef]
Publisher’s Note: MDPI stays neutral with regard to jurisdictional claims in published maps and institutional affiliations. |
© 2022 by the authors. Licensee MDPI, Basel, Switzerland. This article is an open access article distributed under the terms and conditions of the Creative Commons Attribution (CC BY) license (https://creativecommons.org/licenses/by/4.0/).

