1. Introduction
Tropospheric delay, which refers to signal delay caused by electromagnetic signals passing through the neutral atmosphere at an altitude of <50 km, is an essential factor in satellite navigation. In the zenith direction, the tropospheric delay may be approximately 2 m and can increase to 20 m with a decrease in the satellite altitude angle [
1,
2]. High-precision initial tropospheric delay information can greatly reduce the convergence time of precise point positioning (PPP) and considerably improve the accuracy of elevation component estimation, especially in global navigation satellite system (GNSS) PPP [
3,
4,
5,
6]. And zenith tropospheric delay (ZTD) is also a key factor in GNSS water vapor retrieval. In recent years, ZTD derived from atmospheric reanalysis data has been widely applied to GNSS real-time and high-precision positioning as well as GNSS water vapor inversion [
7,
8,
9,
10]. However, in China, substantial height differences occur because of the highly fluctuant terrain. Due to the inconsistent height between the grid points of atmospheric reanalysis data and GNSS users, especially in western China at the position of GNSS users, the tropospheric delay information must be obtained through spatial interpolation with a high-precision tropospheric vertical profile model. Therefore, high-precision and real-time and ZTD vertical profile models must be studied in China.
Current tropospheric models are based on observed meteorological parameters and empirical analyses. Models requiring the observed meteorological parameters mainly include Hopfield [
11], Saastamoinen [
12], and Black models [
13]. The application of such models in real-time vertical tropospheric correction remains challenging because the meteorological parameters measured at GNSS user locations are not easy to obtain in real-time. Therefore, several regional or global real-time tropospheric models, such as the UNB series models [
14], and the EGNOS model [
15] have been proposed. These models highly depend on the meteorological parameters at the sea level. They exhibit a good correction effect but have some limitations. For example, a low temporal-spatial resolution is observed in their meteorological parameters. So, some refined tropospheric models based on the reanalysis data have been proposed, such as the GPT series models, which are developed by the reanalysis data from European Centre for Medium-Range Weather Forecasts (ECMWF). In GPT series models, the GPT2w model was improved by Bohm et al. on the basis of the GPT2 model and was widely applied in the study of GNSS meteorology [
16]. The latest GPT3 model was proposed in recent years [
17]. Compared with the GPT2 model, GPT2w and GPT3 models not only show the improved horizontal resolution of model parameters but also provide other information. And in real-time precise tropospheric corrections, some studies focus on the joint use of GNSS and numerical weather prediction (NWP) data to maximize its advantages. For example, Zhang et al. [
18] proposed real-time wide-area precise tropospheric corrections (WAPTCs) for China based on the GNSS-ZTDs and NWP-ZTDs, which has better performance than the conventional models in the tropospheric delay domain.
Due to the extensive use of reanalysis data in tropospheric correction, the development of tropospheric vertical tropospheric profile models has been widely concerned, and many global or regional tropospheric delay models have been established. The tropospheric vertical profile model is mainly expressed using the quadratic polynomial [
19], highly grid model [
20,
21], and negative exponential function [
22,
23,
24,
25,
26,
27]. The ZTD vertical profile function is the key factor for developing a vertical profile model and obtaining high-precision ZTD information. Moreover, various functions, such as linear, exponential, and Gaussian functions, have been developed for ZTD vertical stratification [
16,
17,
19]. These models present excellent performance in tropospheric vertical correction, but the spatial resolution of their parameters is low. Therefore, global tropospheric vertical profile models with high spatial resolution have been developed using atmospheric reanalysis data [
28,
29,
30,
31,
32], and these models achieve a good result. For example, Hu et al. [
29] combined the monthly mean ZTD data from ERA-Interim data of ECMWF to develop a ZTD vertical profile model based on seasonal Gaussian function. Huang et al. [
33] developed a ZTD vertical profile model based on the second Modern-Era Retrospective analysis for Research and Applications (MERRA-2) data and a sliding window algorithm method. However, the accuracy and applicability of tropospheric vertical profile models based on different high-precision atmospheric reanalysis data should be further and comprehensively studied.
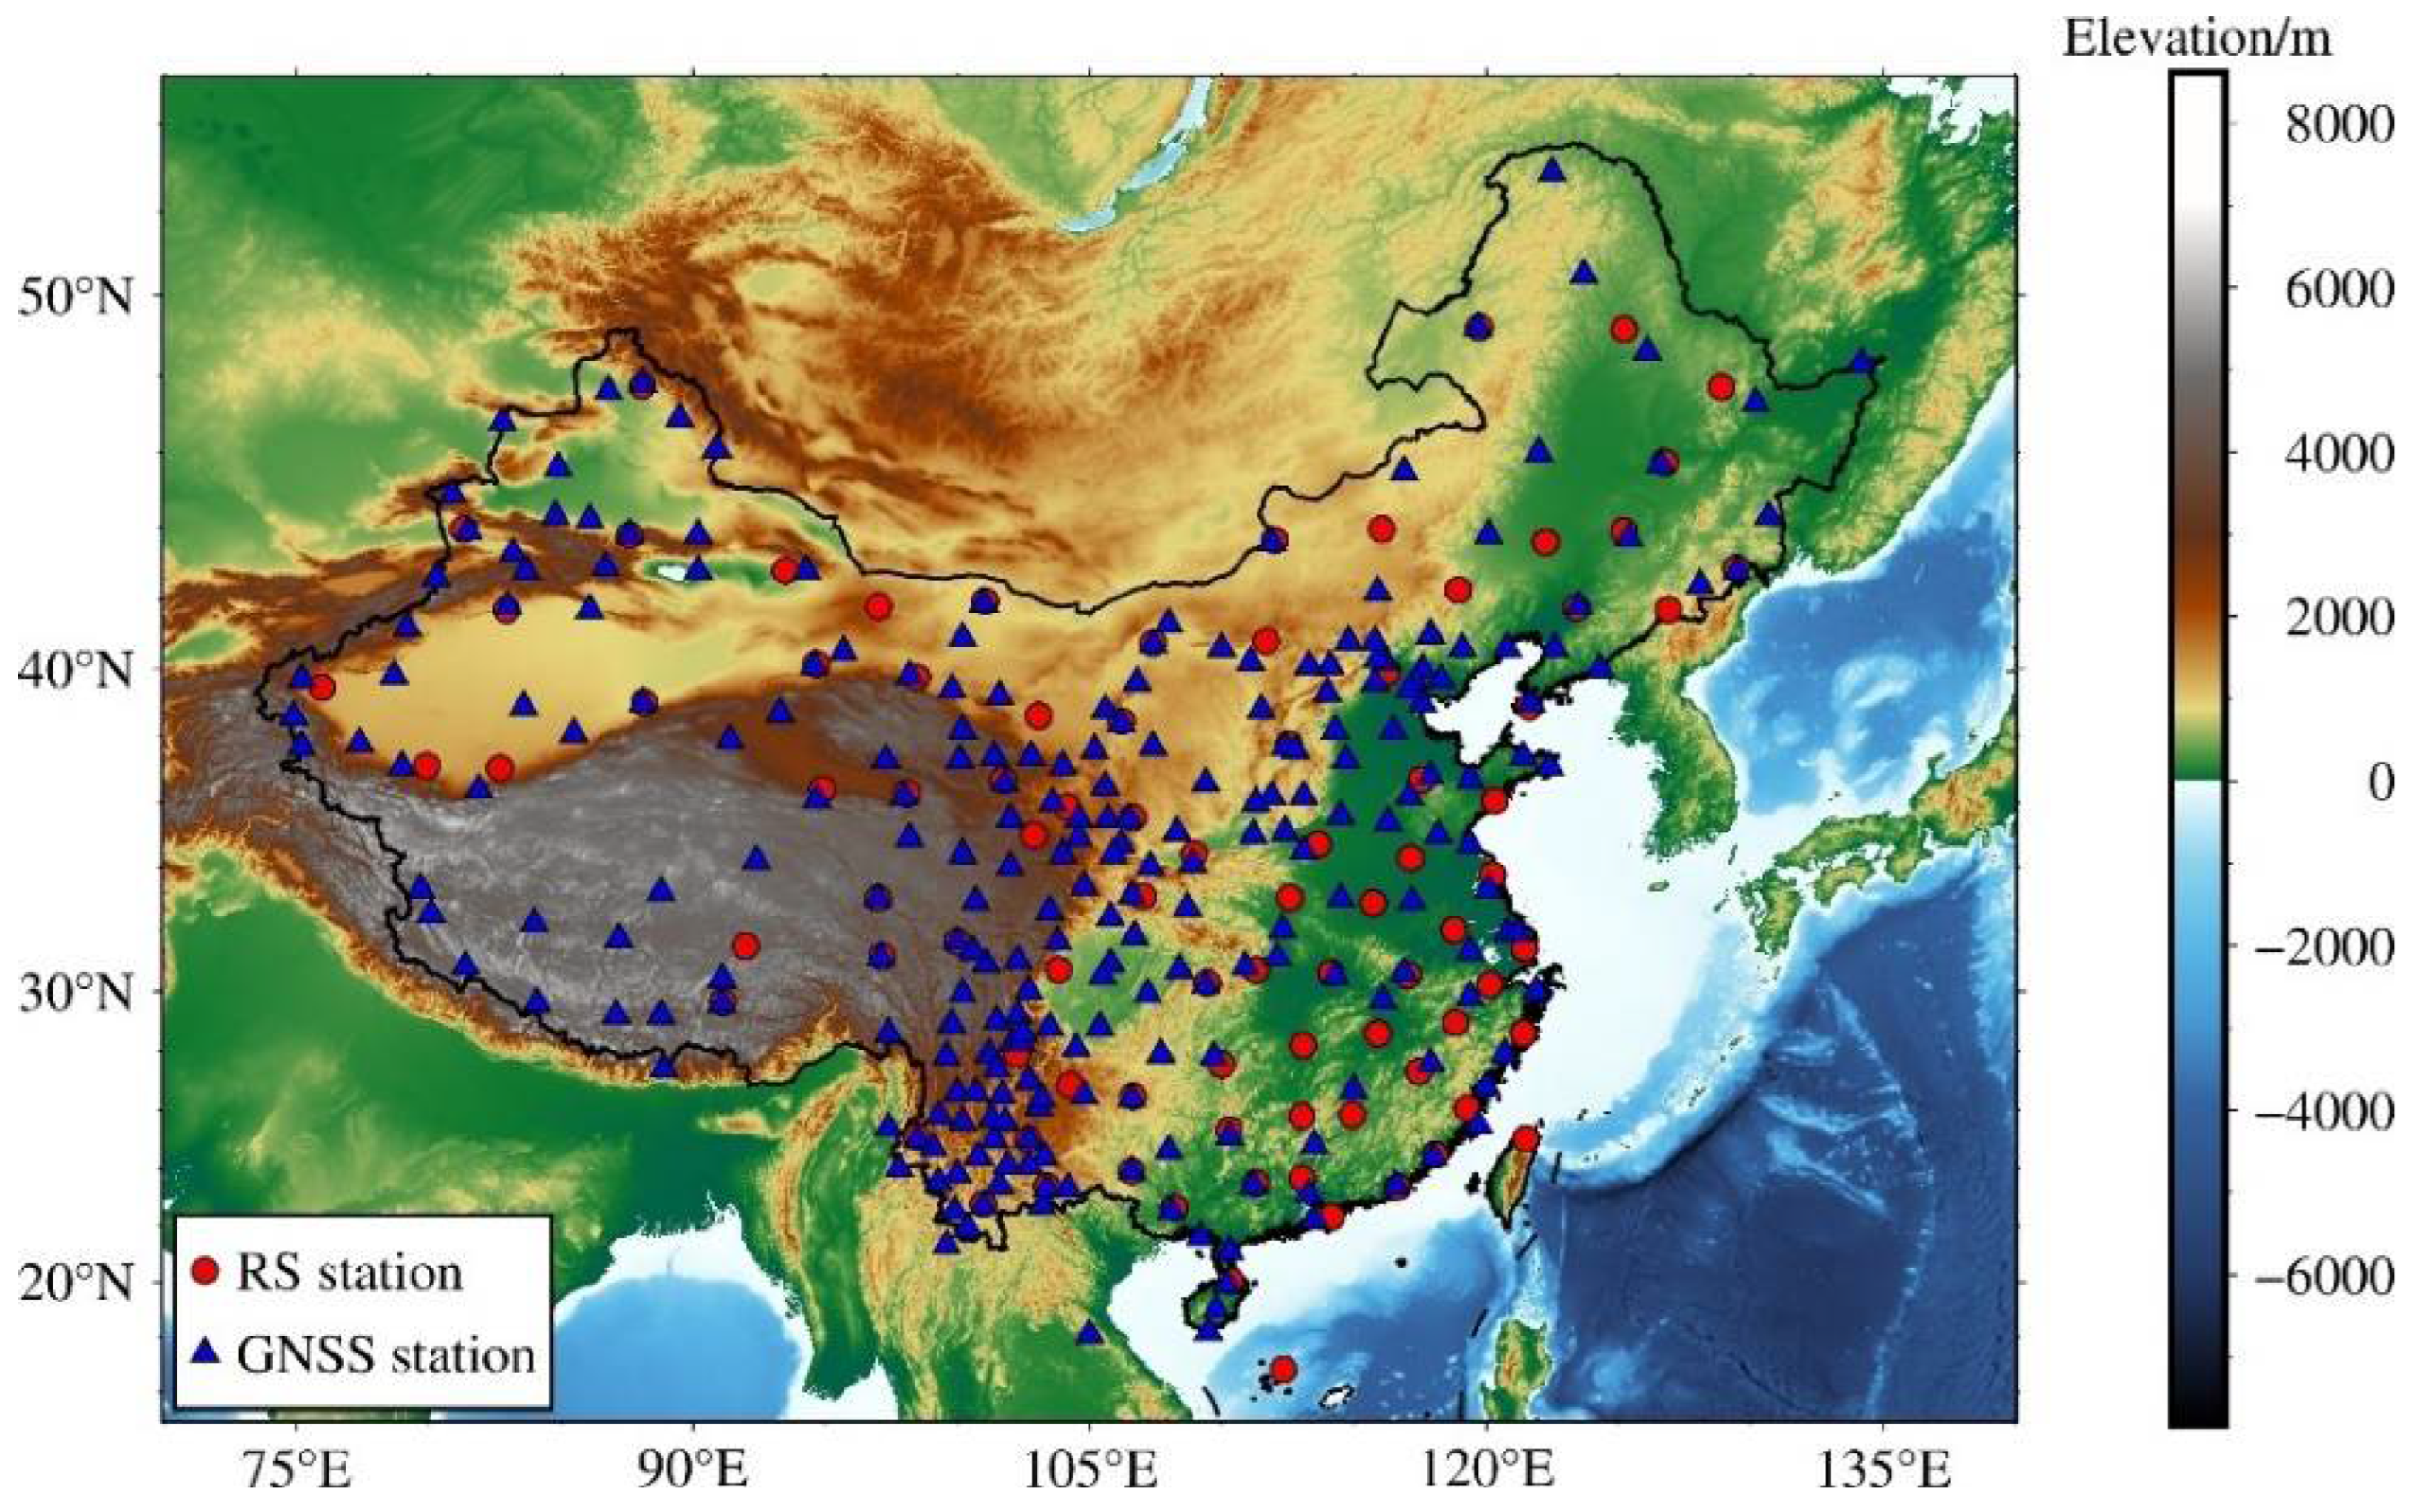
Although these tropospheric vertical profile models present unique advantages, a ZTD vertical profile model with excellent all-around performance remains unavailable in China. Due to large topographic fluctuations and complex climate in China, especially in western China, a tropospheric vertical profile model that considers the fine space-time characteristics of the tropospheric height scale factor must be urgently established to meet the requirements of real-time and high-precision tropospheric vertical correction. Therefore, we proposed a method to develop a ZTD vertical-profile grid model (CZTD-H model) by considering the time-varying height scale factor on the basis of high-resolution reanalysis data for China. The layered ZTD profile information obtained from the integral calculation of MERRA-2 reanalysis data provided by the National Aeronautics and Space Administration (NASA) and the fifth generation Global Climate Reanalysis dataset (ERA5) operated by ECMWF were used to develop CZTD-HM and CZTD-HE models, respectively. The spatial interpolation performance of these two models was verified using radiosonde (RS) data acquired for China and GNSS data obtained from the Crustal Movement Observation Network of China (CMONOC) as reference values, and the applicability of these models was compared and studied with GPT3 model. The research results can provide crucial references for real-time and high-precision satellite positioning and GNSS water vapor detection in China.
3. Development of the ZTD Vertical Profile Model Considering the Time-Varying Height Scale Factor
3.1. Analysis of the ZTD Height Scale Factor
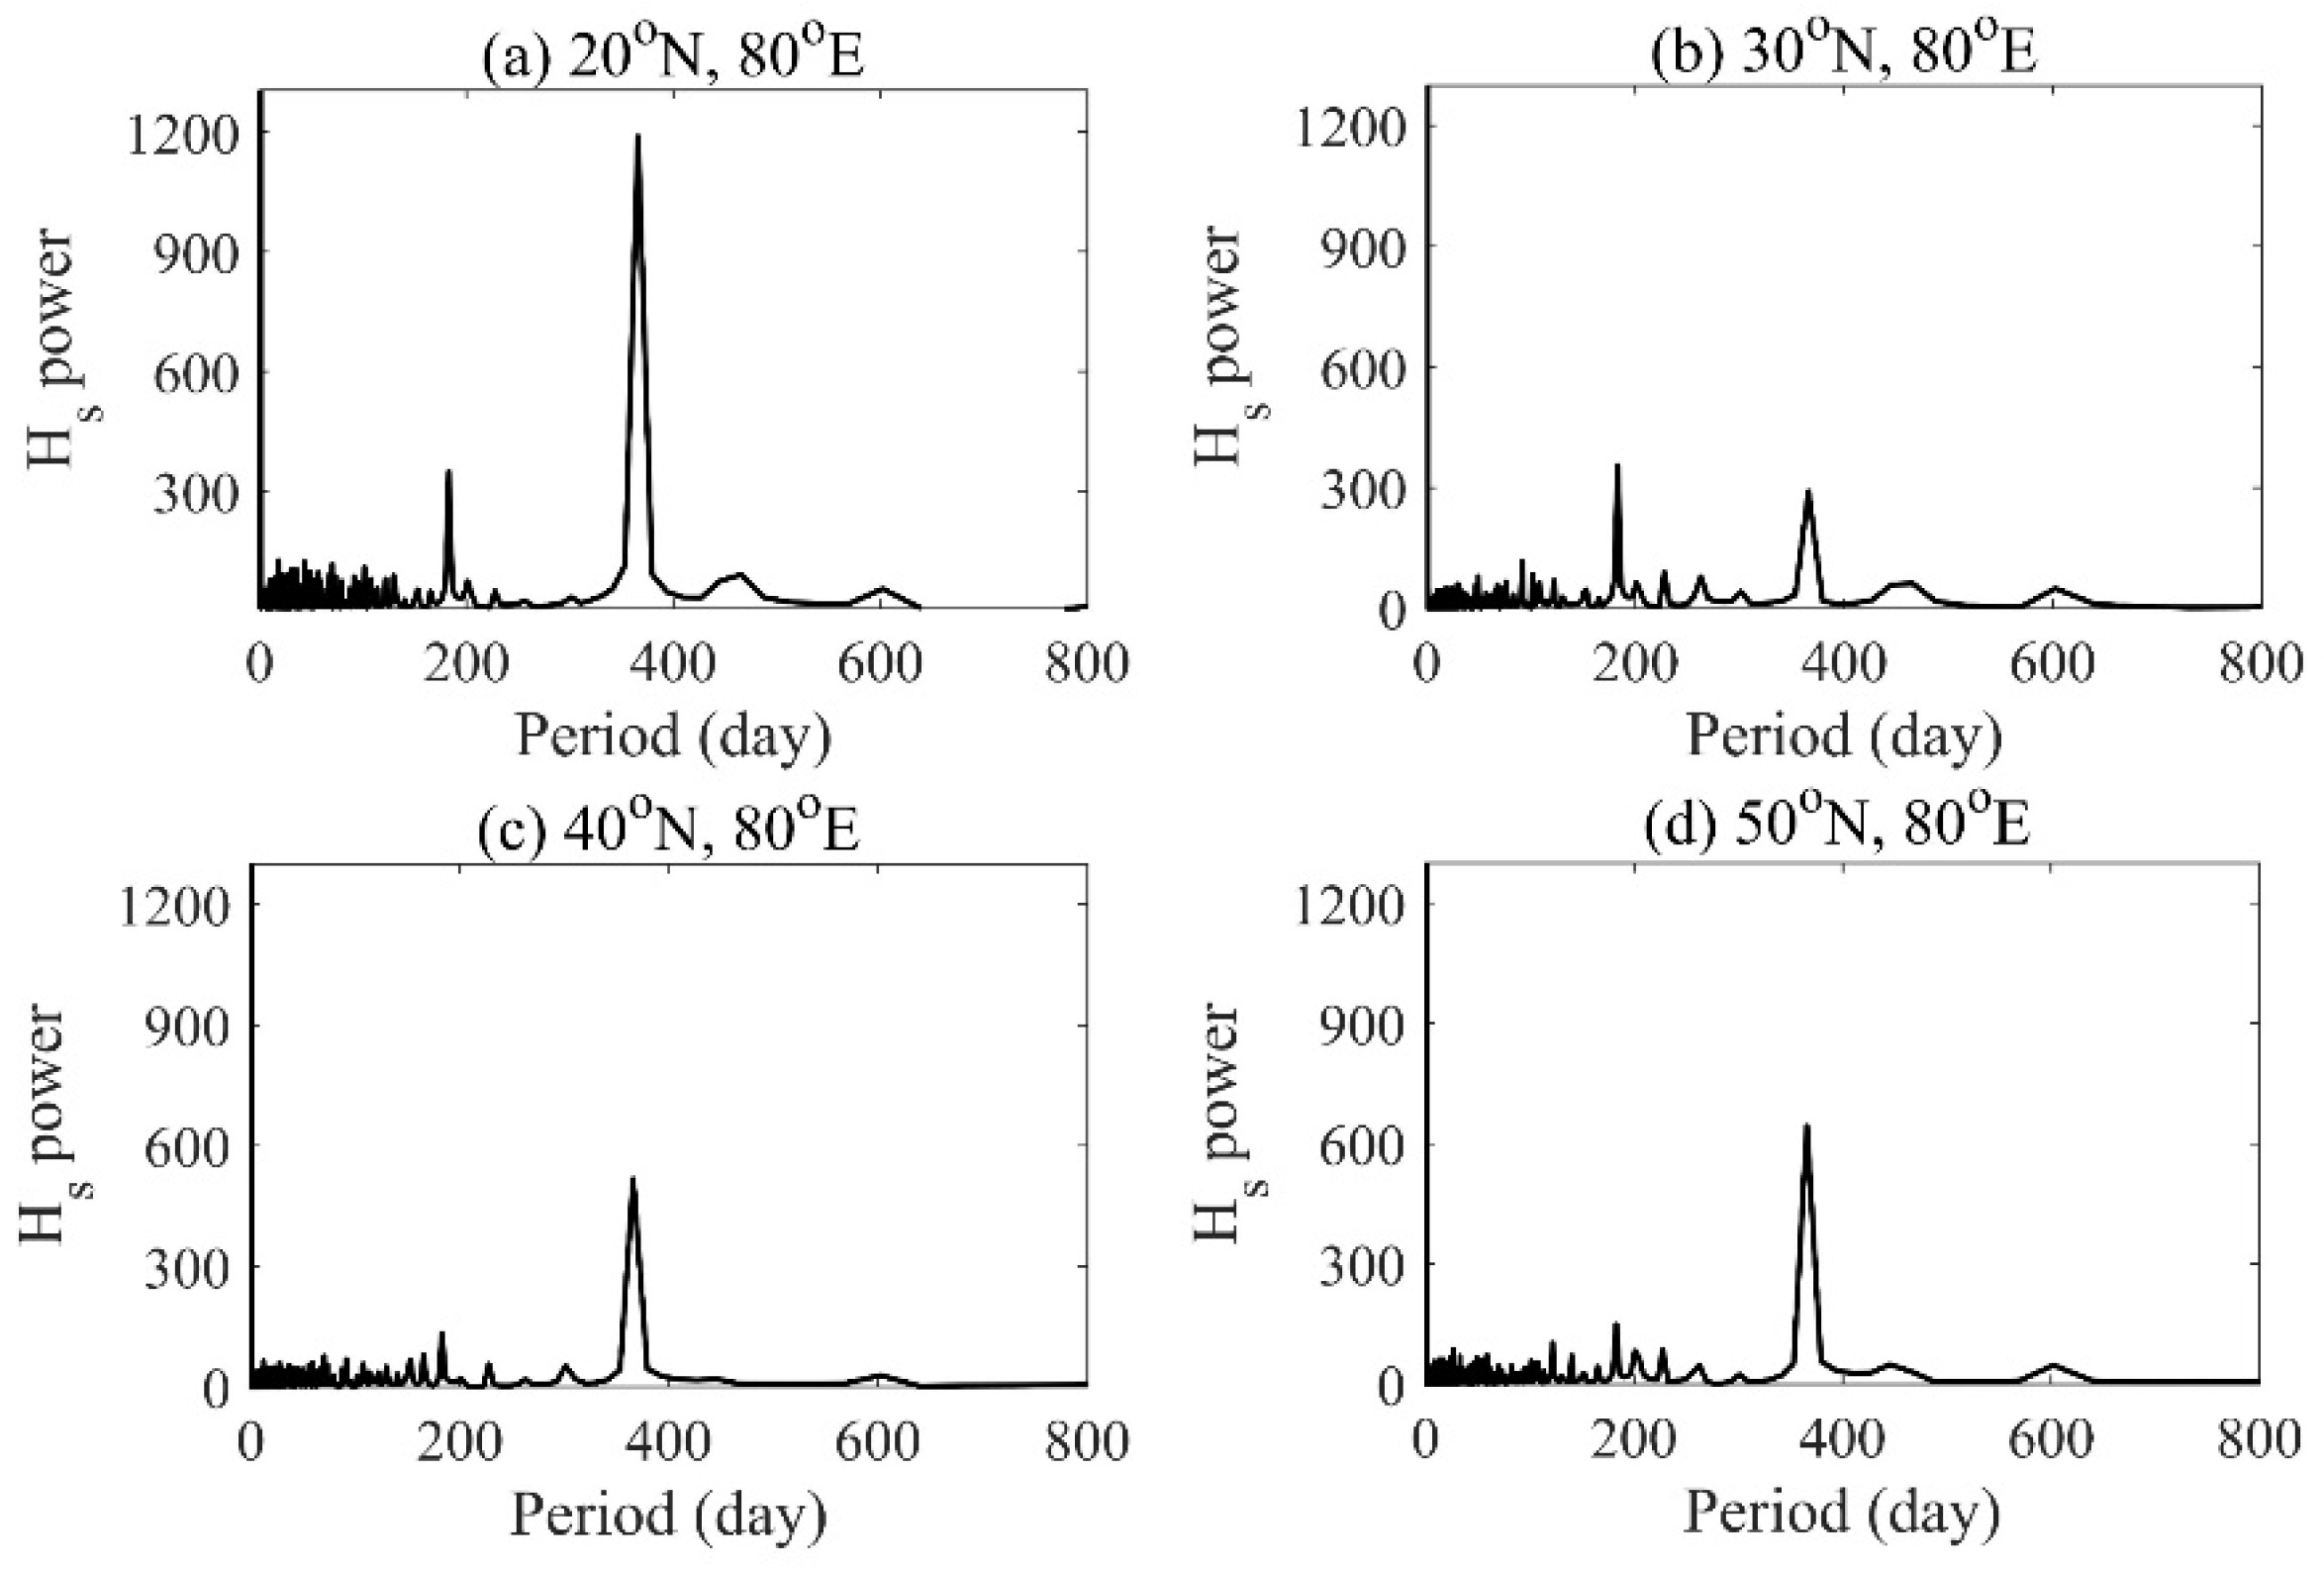
To analyze the spatial and temporal characteristics of
, four MERRA-2 grid point data were selected and their time series of daily
during 2012–2016 was calculated. Then,
was fitted through the cosine function of annual and semi-annual periods, and the periodic change of
was analyzed using fast-Fourier transform (FFT). The results are shown in
Figure 2 and
Figure 3.
shows considerable seasonal variations, which are mainly manifested as annual and semi-annual cycles (
Figure 2 and
Figure 3). The evident characteristics of annual and semi-annual cycles are shown in the low-latitude region, and the middle-latitude area presents more considerable annual cycle changes than semi-annual cycle changes. The annual mean value and annual and semi-annual period amplitudes of
were calculated for each grid of MERRA-2 and ERA5 data in China during 2012–2016 to analyze the distribution characteristics of
. The results are shown in
Figure 4. The large annual mean values of
resulting from large topographic fluctuations can be observed in western China. The annual amplitude presents an obvious latitude-related trend, that is, a large amplitude is obtained at low and high latitudes, and a small amplitude is acquired at middle latitudes. The semi-annual amplitude is larger in southwestern and northeastern China. Therefore, the annual and semi-annual cycle change of
should be carefully addressed during the establishment of the ZTD vertical model for China.
3.2. Establishment of the CZTD-H Model
The analysis presented in
Section 3.1 indicates that
shows important spatial-temporal characteristics in China; thus, the fine spatial-temporal variation in
should be considered in a model. A grid with the same horizontal resolution as the reanalysis data was selected to develop the ZTD vertical profile grid model with a high horizontal resolution. For each grid point (15–55° N, 70–135° E) covering China, the ZTD vertical profile model can be expressed as follows:
where
represents the number of grid outlets. For each grid point, the following formula can be used to describe
due to evident annual and semiannual cycles of
in China:
where DOY represents the day of the year,
is the annual mean value of the grid point
, and (
) and (
) are the annual and semi-annual periodic amplitude coefficients of grid point
, respectively.
Therefore, based on the reanalysis of grid data for China obtained during 2012–2016, the ZTD layered data of each grid point was calculated using the integral method. Then, combining Equations (8)–(13), a negative exponential function was used to express the ZTD vertical profile information of each grid point. Based on the data from the ZTD vertical profile, the model coefficient of was solved through least-squares adjustment, and the ZTD vertical profile grid model named CZTD-H was developed. Two variants of the CZTD-H model were established in this study: CZTD-HM and CZTD-HE. These two models primarily differ in the data source. The CZTD-HM and CZTD-HE models employ MERRA-2 ZTD and ERA5 ZTD data, respectively. For the comparison of different tropospheric vertical-profile models, ERA5 reanalysis data were resampled to obtain grid data with the horizontal and time resolution of 0.5° × 0.5° (longitude × latitude) and 6 h (UTC 00:00, 06:00, 12:00, and 18:00), respectively; these data are similar to MERRA-2 reanalysis data.
The model is considerably easy to use, and the process is as follows: (1) A user is only required to provide the DOY and location information of the target point. According to the location information of the target point (user), the nearest model parameter of the grid point is found, and then, model parameters are obtained. (2) Based on the user’s elevation information, the ZTD value of the target point at the reference elevation can be vertically corrected to the target elevation according to Equations (14) and (15).
4. Validation and Comparison of CZTD-HM and CZTD-HE Models
The ZTD vertical correction accuracy obtained using the CZTD-H model was tested by employing RS data. The spatial interpolation accuracy of the CZTD-H model was verified using GNSS ZTD data acquired from 249 GNSS stations and GGOS grid point data. The performance of the CZTD-H model was evaluated and compared with that of the GPT3 model. The applicability of and difference between CZTD-HM and CZTD-HE models were further analyzed. The GPT3 model parameters of two horizontal resolution grids (1° × 1° and 5° × 5°) are represented as GPT3-1 and GPT3-5 models, respectively, in the subsequent description.
The bias and RMSE were used to evaluate the model’s accuracy. They can be calculated using the following equations:
where
is the number of the ZTD samples,
and
are the i-th ZTD values calculated using the model and used as the reference value.
4.1. ZTD Spatial Interpolation Method
For the vertical correction of the ZTD value, ZTD vertical profile (CZTD-H model) and GPT3 models can be used to obtain the ZTD value at the target elevation. For the spatial interpolation of ZTD grid products, the interpolation method is presented below. First, based on CZTD-H and GPT3 models, the ZTD values of the four GGOS grid points nearest to GNSS stations were calculated and corrected vertically from grid points to GNSS stations. Second, after vertical correction, the ZTD values of these nearest four grid points were interpolated through bilinear interpolation, and then, the ZTD values of GGOS atmospheric grid data at each GNSS station were obtained.
The GPT3 model cannot directly provide ZTD vertical-profile model parameters. So, the ZHD and ZWD vertical profile information should be calculated on the basis of the meteorological parameters provided by the GPT3 model and the model established using physical methods. In our previous study, a physical method of using the GPT3 model was established from the UNB3 model [
37]; this method can be used to conduct vertical correction starting from any reference height (
). Therefore, in the model accuracy comparison, the vertical correction of ZTD by using the GPT3 model can be realized by combining Equations (18)–(20), and the specific derivation process can be seen in our previous article [
33].
where
and
represent the ZHD values at the target altitude
and reference height
, respectively;
β is the temperature gradient;
is the temperature in Kelvin; g is the surface acceleration of gravity,
represents the dry gas constant and is 287.0538 J·kg
−1;
and
denote the ZWD values at
and
, respectively; and
=
, where
is the water vapor gradient.
4.2. Accuracy Validation in ZTD Spatial Interpolation
4.2.1. Accuracy Validation and Comparison by Using Radiosonde Data
To test the ZTD vertical interpolation accuracy of the CZTD-H model in China, 84 RS stations were selected, and the ZHD/ZWD/ZTD layered profile information of each RS station was calculated at UTC 00:00 and UTC 12:00 in 2017 by using the integral method. This information was treated as the reference value for accuracy validation. In model validation through RS profile data, the data at the surface layer of the RS station were vertically interpolated to each layer until they reached the top layer of the RS profile. Because the CZTD-H model exhibited a higher horizontal resolution than the GPT3-1 and GPT3-5 models, the parameters of CZTD-H were resampled in a similar or the same horizontal resolution as those of the GPT3 model for fair model comparison. The CZTD-HM model parameters were resampled to 1.25° × 1° (longitude × latitude) and 5° × 4° (long × lat) resolutions and denoted as CZTD-HM-1 and CZTD-HM-5 models, respectively. The CZTD-HE model parameters were resampled to 1° × 1° (long × lat) and 5° × 5° (long × lat) resolutions and denoted as CZTD-HE-1 and CZTD-HE-5 models, respectively. The accuracy of CZTD-HM and CZTD-HE models with different horizontal resolutions applied for RS ZTD vertical interpolation was tested. The results are presented in
Table 1. CZTD-HM and CZTD-HE models with different horizontal resolutions exhibit a similar accuracy for the vertical interpolation of RS ZTD data (
Table 1). Therefore, the accuracy of CZTD-HM and CZTD-HE models with the horizontal resolutions of 0.5° × 0.625° (long × lat) and 0.5° × 0.5° (long × lat) was used and compared with that of GPT3-1 and GPT3-5 models. The statistical results of each RS station are presented in
Table 2 and
Figure 5. With an average bias of −16.9 mm, whereas the positive bias of the CZTD-HE model was more obvious, with an average bias of 9.5 mm. Compared with GPT3-1 and GPT3-5 models, the absolute value of mean bias between CZTD-HM and CZTD-HE models decreased by 31.4 mm (76.8%)/24 mm (58.68%) and 32.3 mm (77.3%)/24.9 mm (59.6%), respectively. CZTD-HM and CZTD-HE models showed small RMSEs in ZTD vertical interpolation; these RMSEs were 6.9 mm (12.9%)/8.7 mm (16.23%) and 7.5 mm (13.8%)/9.3 mm (17.16%) lower than those of GPT3-1 and GPT3-5 models, respectively. The CZTD-H model showed high stability and accuracy in ZTD vertical interpolation in China.
Both GPT3-1 and GPT3-5 models showed considerable negative bias in the vertical interpolation of RS ZTD data, indicating that the interpolated ZTD data of the GPT3 model was smaller than RS ZTD data (
Table 2). The CZTD-H model showed obvious positive and negative bias. However, the negative bias of the CZTD-HM model was more obvious.
The ZTD interpolation performance of various models for China is shown in
Figure 5. The GPT3 model showed a negative bias in China. The CZTD-HM model exhibited a positive bias in most regions of China and a negative bias in most regions of southeast China. The CZTD-HE model showed less negative bias than the GPT3 model in most regions of China. The GPT3 model exhibited a large error in some regions of southeast and northwest China. The southeast region may be vulnerable to the strong influence of the East Asian monsoon because of its proximity to the West Coast of the Pacific Ocean, and the water vapor content in the sea area was high and changed violently. The complex terrain and alpine climate may influence the northwest region. The CZTD-H model showed a small error in the northwest and southeast regions, which indicated a certain accuracy improvement. CZTD-HM and CZTD-HE models had higher accuracy in northwest and southeast China, respectively. In addition, the ZTD vertical interpolation accuracy of the CZTD-H model certainly improved compared with that of the GPT3-1 and GPT3-5 models in some regions of northeast China. The CZTD-HE model showed higher performance than the CZTD-HM model in eastern China. However, the CZTD-H model exhibited few improvements in central China. Compared with the GPT3 model, the CZTD-HE model had a similar accuracy, and the CZTD-HM model showed a slightly decreased accuracy for ZTD vertical interpolation in central China. In conclusion, the CZTD-HE model exhibited higher accuracy and stability than the CZTD-HM model in China. CZTD-HM and CZTD-HE models are highly suitable for northwest China and southeast and northeast China, respectively. Therefore, the combined use of multiple models can be considered for the vertical correction of ZTD.
4.2.2. Accuracy Validation and Comparison Using GNSS ZTD Data
The spatial interpolation of ZTD grid products is widely employed in GNSS atmospheric research. ZTD changes more in the vertical direction than that in the horizontal direction. Therefore, the ZTD vertical profile model is essential for obtaining excellent results from ZTD spatial interpolation. Based on the application of the GGOS ZTD grid data interpolated to GNSS sites through different models, the ZTD products obtained from 249 GNSS stations of CMONOC in 2018 were the reference values used to test the results of spatial interpolation. The accuracy statistics of the spatial interpolation of GGOS grid ZTD data are presented in
Table 3 and
Figure 6.
GPT3-1 and GPT3-5 models exhibited similar accuracy for the ZTD spatial interpolation of GGOS grid data validated through the GNSS ZTD data of CMONOC (
Table 3). Compared with the GPT3 model, the CZTD-H model showed a small bias and RMSE. The mean bias of CZTD-HM and CZTD-HE models decreased by 6.3 mm (88.7%) and 4.1 mm (57.75%) compared with GPT3-1 and GPT3-5 models, respectively. The mean RMSE of CZTD-HM and CZTD-HE models decreased by 2.8 mm (19.7%) and 2.6 mm (18.6%), respectively. Both GPT3-1 and GPT3-5 models showed a small bias and RMSE in eastern China and a large bias and RMSE in western China (
Figure 6). The CZTD-H model showed a small bias and RMSE in China, especially in western China, and exhibited considerable improvement compared with the GPT3 model. This may be due to the large topographic relief in the western region, which makes it difficult to accurately simulate the ZTD layered profile for the GPT3 model. Nevertheless, the GPT3 model still shows good accuracy in China. The CZTD-H model exhibited a small error and excellent performance when expressing the ZTD variation in the vertical direction, and both CZTD-HM and CZTD-HE models showed high accuracy. Furthermore, the CZTD-H model provided better results for grid ZTD spatial interpolation than the GPT3 model.
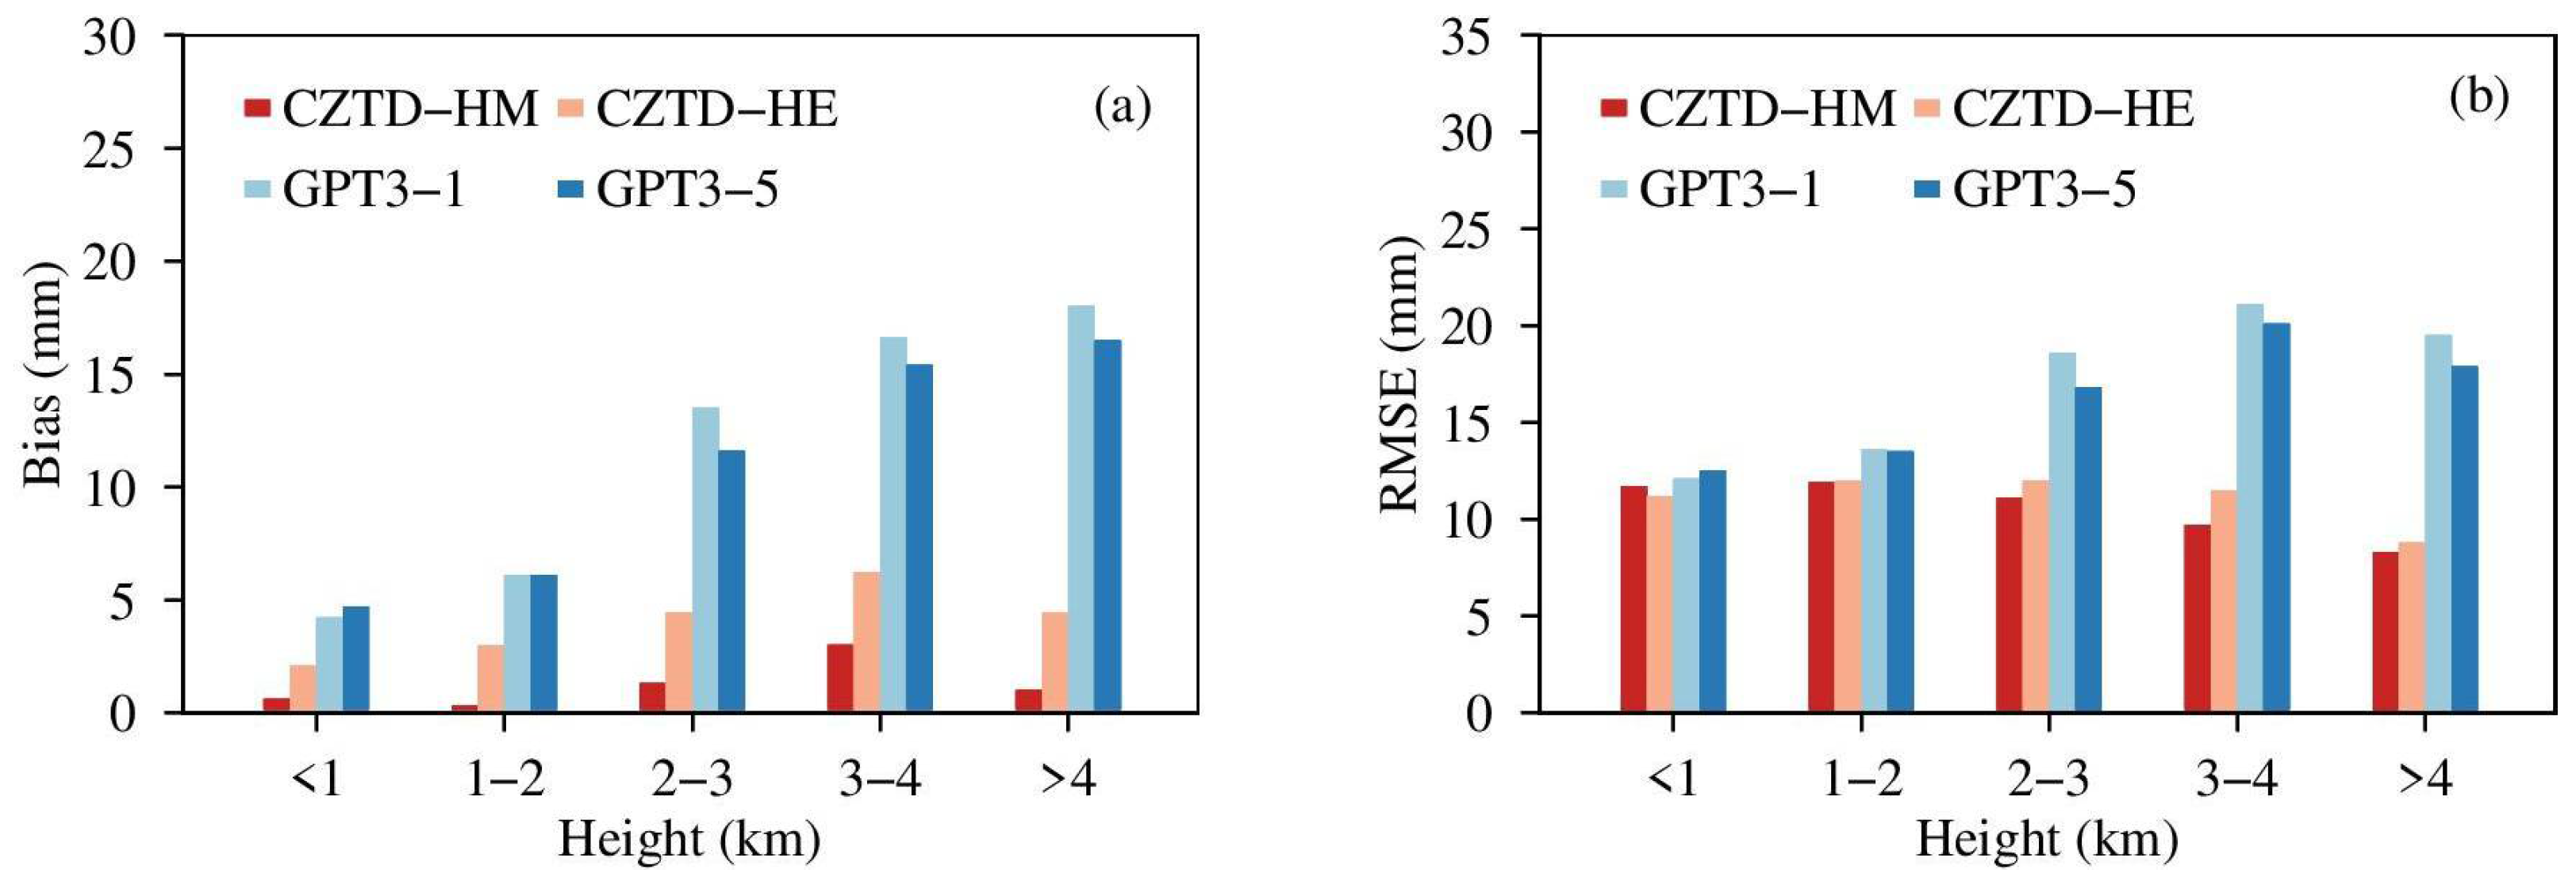
To analyze the interpolation results of each model at different heights, the heights of GNSS stations were divided into five ranges of 0 to 1, 1 to 2, 2 to 3, 3 to 4, and >4 km. The bias and RMSE were calculated (
Figure 7). With the increase in the height, the bias and RMSE of GPT3-1 and GPT3-5 models gradually increased, and their accuracy decreased. The CZTD-H model showed a completely opposite trend. The RMSE and accuracy of the CZTD-H model gradually decreased and increased, respectively. Based on the RMSE value, compared with the GPT3 model, the accuracy improvement of the CZTD-H model was obvious at the height of >2 km and was substantial at the height of >4 km. At the height of >4 km, compared with that of GPT3-1 and GPT3-5 models, the RMSE of CZTD-HM and CZTD-HE models decreased by 11.2 mm (57%)/15.09 mm (77.38%) and 9.6 mm (54%)/9.13 mm (51%), respectively, in ZTD spatial interpolation. This finding further indicated that the CZTD-H model provided excellent performance in ZTD spatial interpolation, especially in high-altitude areas. At different heights, for the bias value, the CZTD-HM model shows small values than the CZTD-HE model. For the RMSE value, the accuracy of the CZTD-HM and CZTD-HE models was similar at 1 to 2 km and considerably different at 3 to 4 km. The CZTD-HE model had good accuracy at <1 km, and the CZTD-HM model had high accuracy at >2 km. CZTD-HM and CZTD-HE models can be used to describe the changes in ZTD at different heights, which can be advantageous, and the CZTD-HM model may be more suitable at different heights in spatial interpolation.
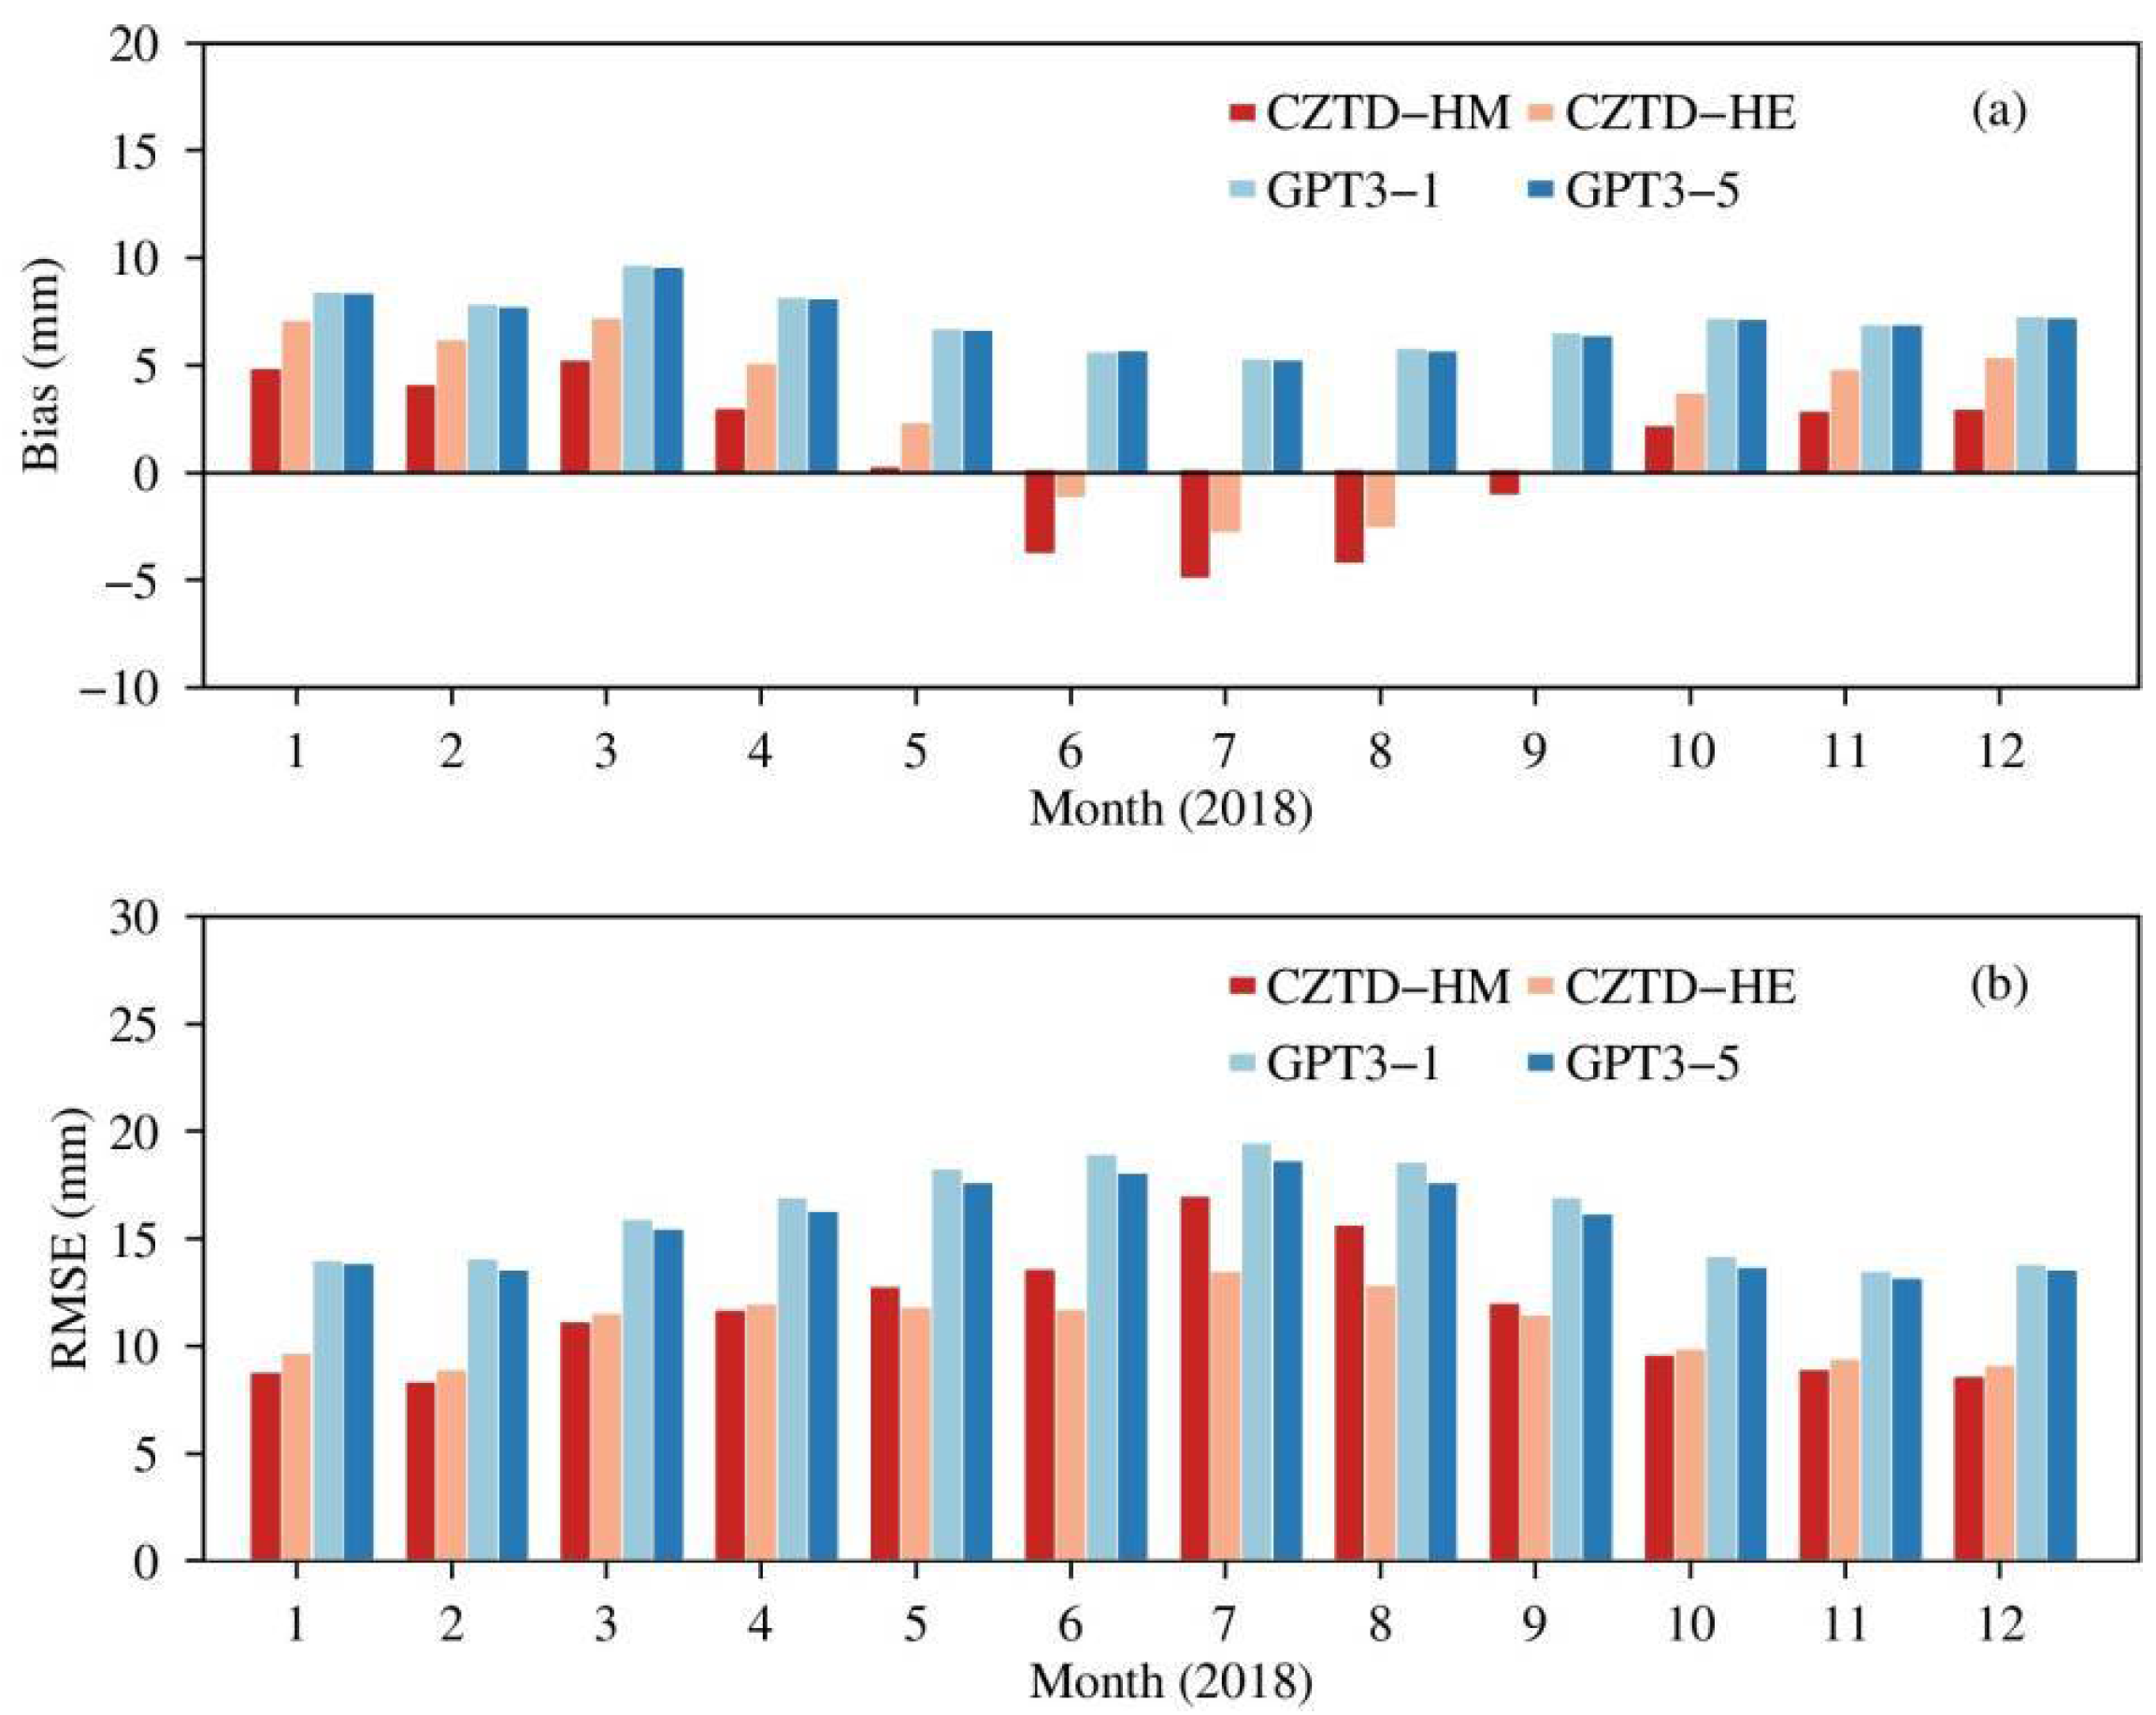
To analyze the seasonal variations in the bias and RMSE of different models for ZTD spatial interpolation, the monthly mean bias and RMSE of 249 GNSS stations were calculated (
Figure 8). The GPT3 model showed a positive mean bias throughout the year, and the CZTD-H model exhibited a negative mean bias in summer and a positive mean bias during other seasons (
Figure 8). The RMSE of CZTD-H and GPT3 models showed obvious seasonal variations. RMSE reached the maximum value in summer may be because of the climatic characteristics of summer. Monsoon climate is the main feature of China’s climate. Affected by the warm and humid airflow from the ocean, water vapor and other meteorological parameters are highly active in summer, which made accurate modeling difficult and it’s hard to accurately detect changes in ZTD, thereby affecting the model accuracy. However, the CZTD-H model showed better performance for improving the accuracy of the ZTD spatial interpolation of GGOS grid data than the GPT3 model. Therefore, the CZTD-H model presented more advantages in ZTD spatial interpolation than the GPT3 model.
The accuracy of CZTD-HM and CZTD-HE models showed slight differences in spring, autumn, and winter but obvious differences in summer. The CZTD-HE model showed higher performance than other models in the summer. In July, when the water vapor varied considerably, the monthly RMSE of CZTD-HM and CZTD-HE models decreased by 2.48 mm (12.78%)/5.98 mm (30.82%) and 1.64 mm (8.45%)/5.14 mm (27.69%) for spatial interpolation compared with that of GPT3-1 and GPT3-5 models, respectively. This finding may attribute to the higher spatial resolution of ERA5 reanalysis data, which facilitated the capture of changes caused by some active meteorological parameters. Simultaneously, the CZTD-HE model showed high stability and slight error fluctuations throughout the year. For spatial interpolation, the CZTD-HM model is highly suitable for spring, autumn, and winter, whereas the CZTD-HE model is highly suitable for summer.
5. Discussion and Conclusions
The ZTD vertical profile model plays a crucial role in realizing the high-precision spatial interpolation of ZTD products and developing excellent ZTD models. In this study, the ZTD vertical profile grid model (CZTD-H model) was developed for China by considering the fine seasonal variations in , and the applicability of CZTD-HM and CZTD-HE models was analyzed on the basis of MERRA-2 and ERA5 data. The vertical interpolation accuracy and spatial interpolation of the CZTD-H model in China were verified using ZTD data acquired from the RS stations, GNSS stations, and GGOS grid products, and the CZTD-H model showed higher performance than the GPT3 model.
The results showed that: (1) For ZTD vertical interpolation by using RS data, the CZTD-HE model showed higher accuracy and stability than the GPT3 model, especially in northwestern and southeastern China. The CZTD-HM model was highly suitable for northwest China, whereas the CZTD-HE model was highly suitable for southeast and northeast China. (2) For ZTD spatial interpolation by GGOS grid ZTD data, the CZTD-H model showed higher accuracy and stability than the GPT3 model, especially in western China. For spatial interpolation, the CZTD-HM model was suitable at the height of >1km and in summer, whereas the CZTD-HE model was favorable at the height of <1 km and in spring, autumn, and winter.
The CZTD-H model can provide real-time and high-precision ZTD vertical correction in China on the basis of the time information and location of users. Therefore, the CZTD-H model is easy to apply. Its good correction effect of tropospheric ZTD products helps obtain high-precision ZTD information, thereby promoting the application of atmospheric reanalysis data in GNSS studies, such as atmospheric exploration and precise positioning. However, this paper only takes a relatively comprehensive data analysis and verification to prove the stability and applicability of the developed model, and further application and improvement of the model need to be further studied. The performance of the model applied to the positioning should be discussed. The ways to expand the specific application of the model in GNSS meteorology and to extend the CZTD-H model into the ZTD vertical profile model with a comprehensive performance by combining different advantages and characteristics of multi-source reanalysis data will be the focus of our future research.


 ,
, 


