
High Resolution Future Projections of Drought Characteristics in Greece Based on SPI and SPEI Indices

 ,
,  ,
,  ,
,  and
and 
Abstract
1. Introduction
2. Materials and Methods
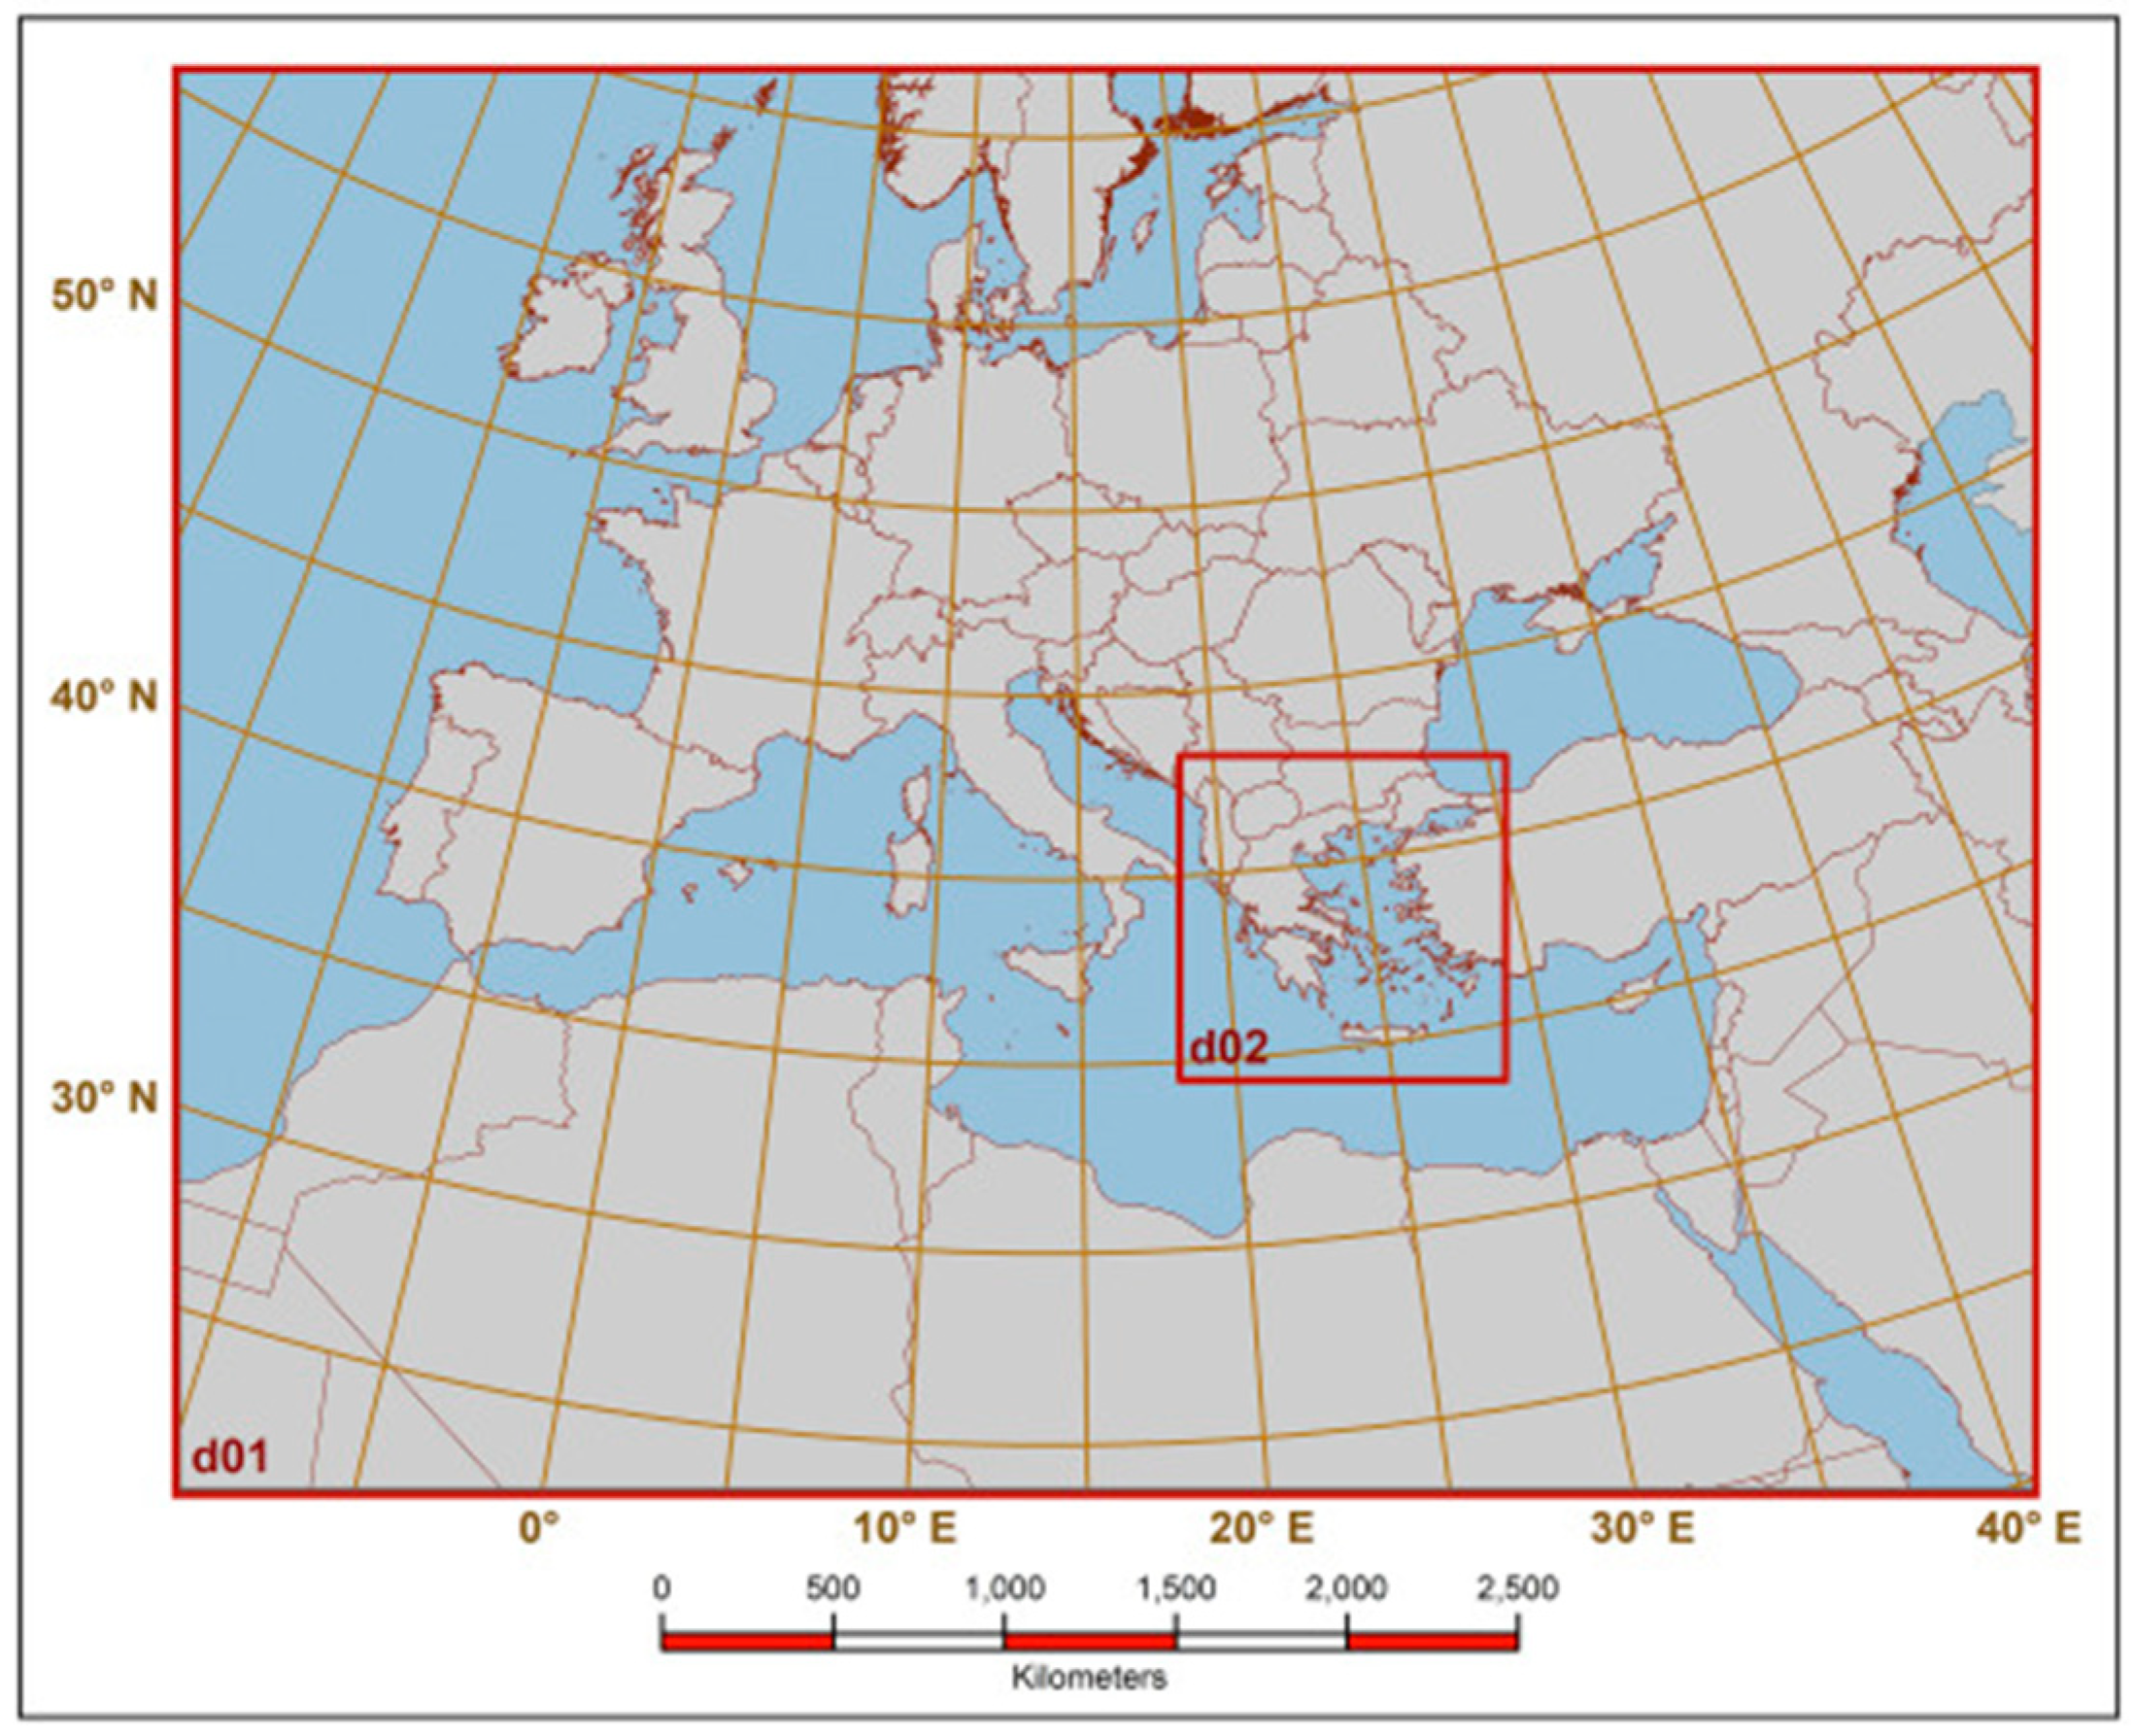
2.1. Model Setup
2.2. Drought Analysis Method
3. Results and Discussion
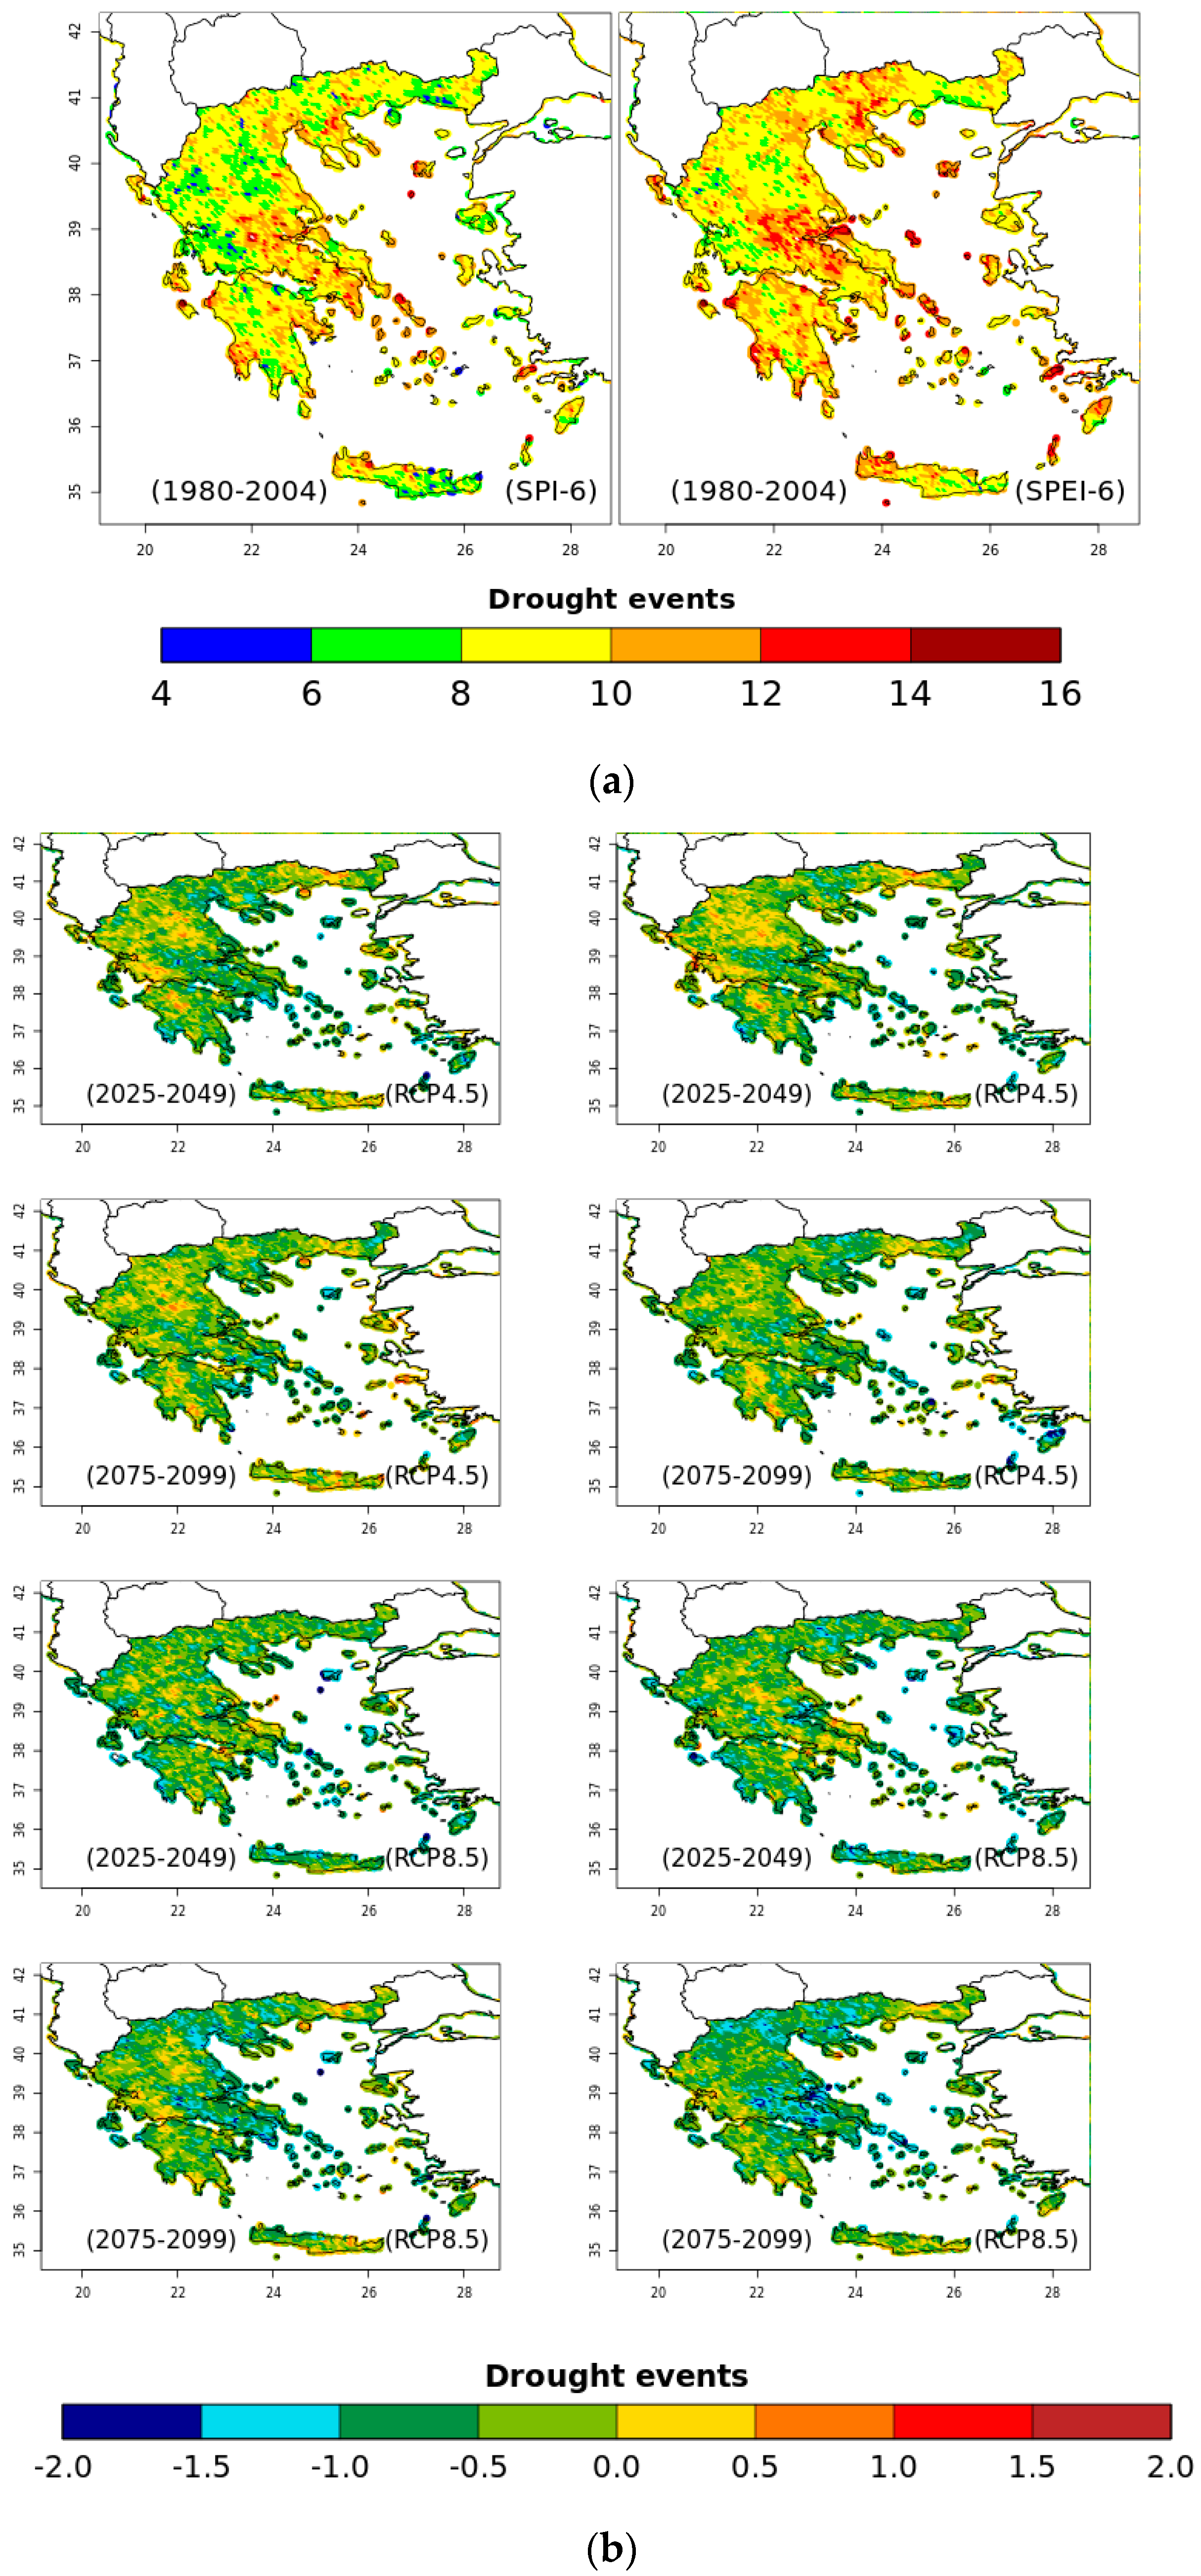
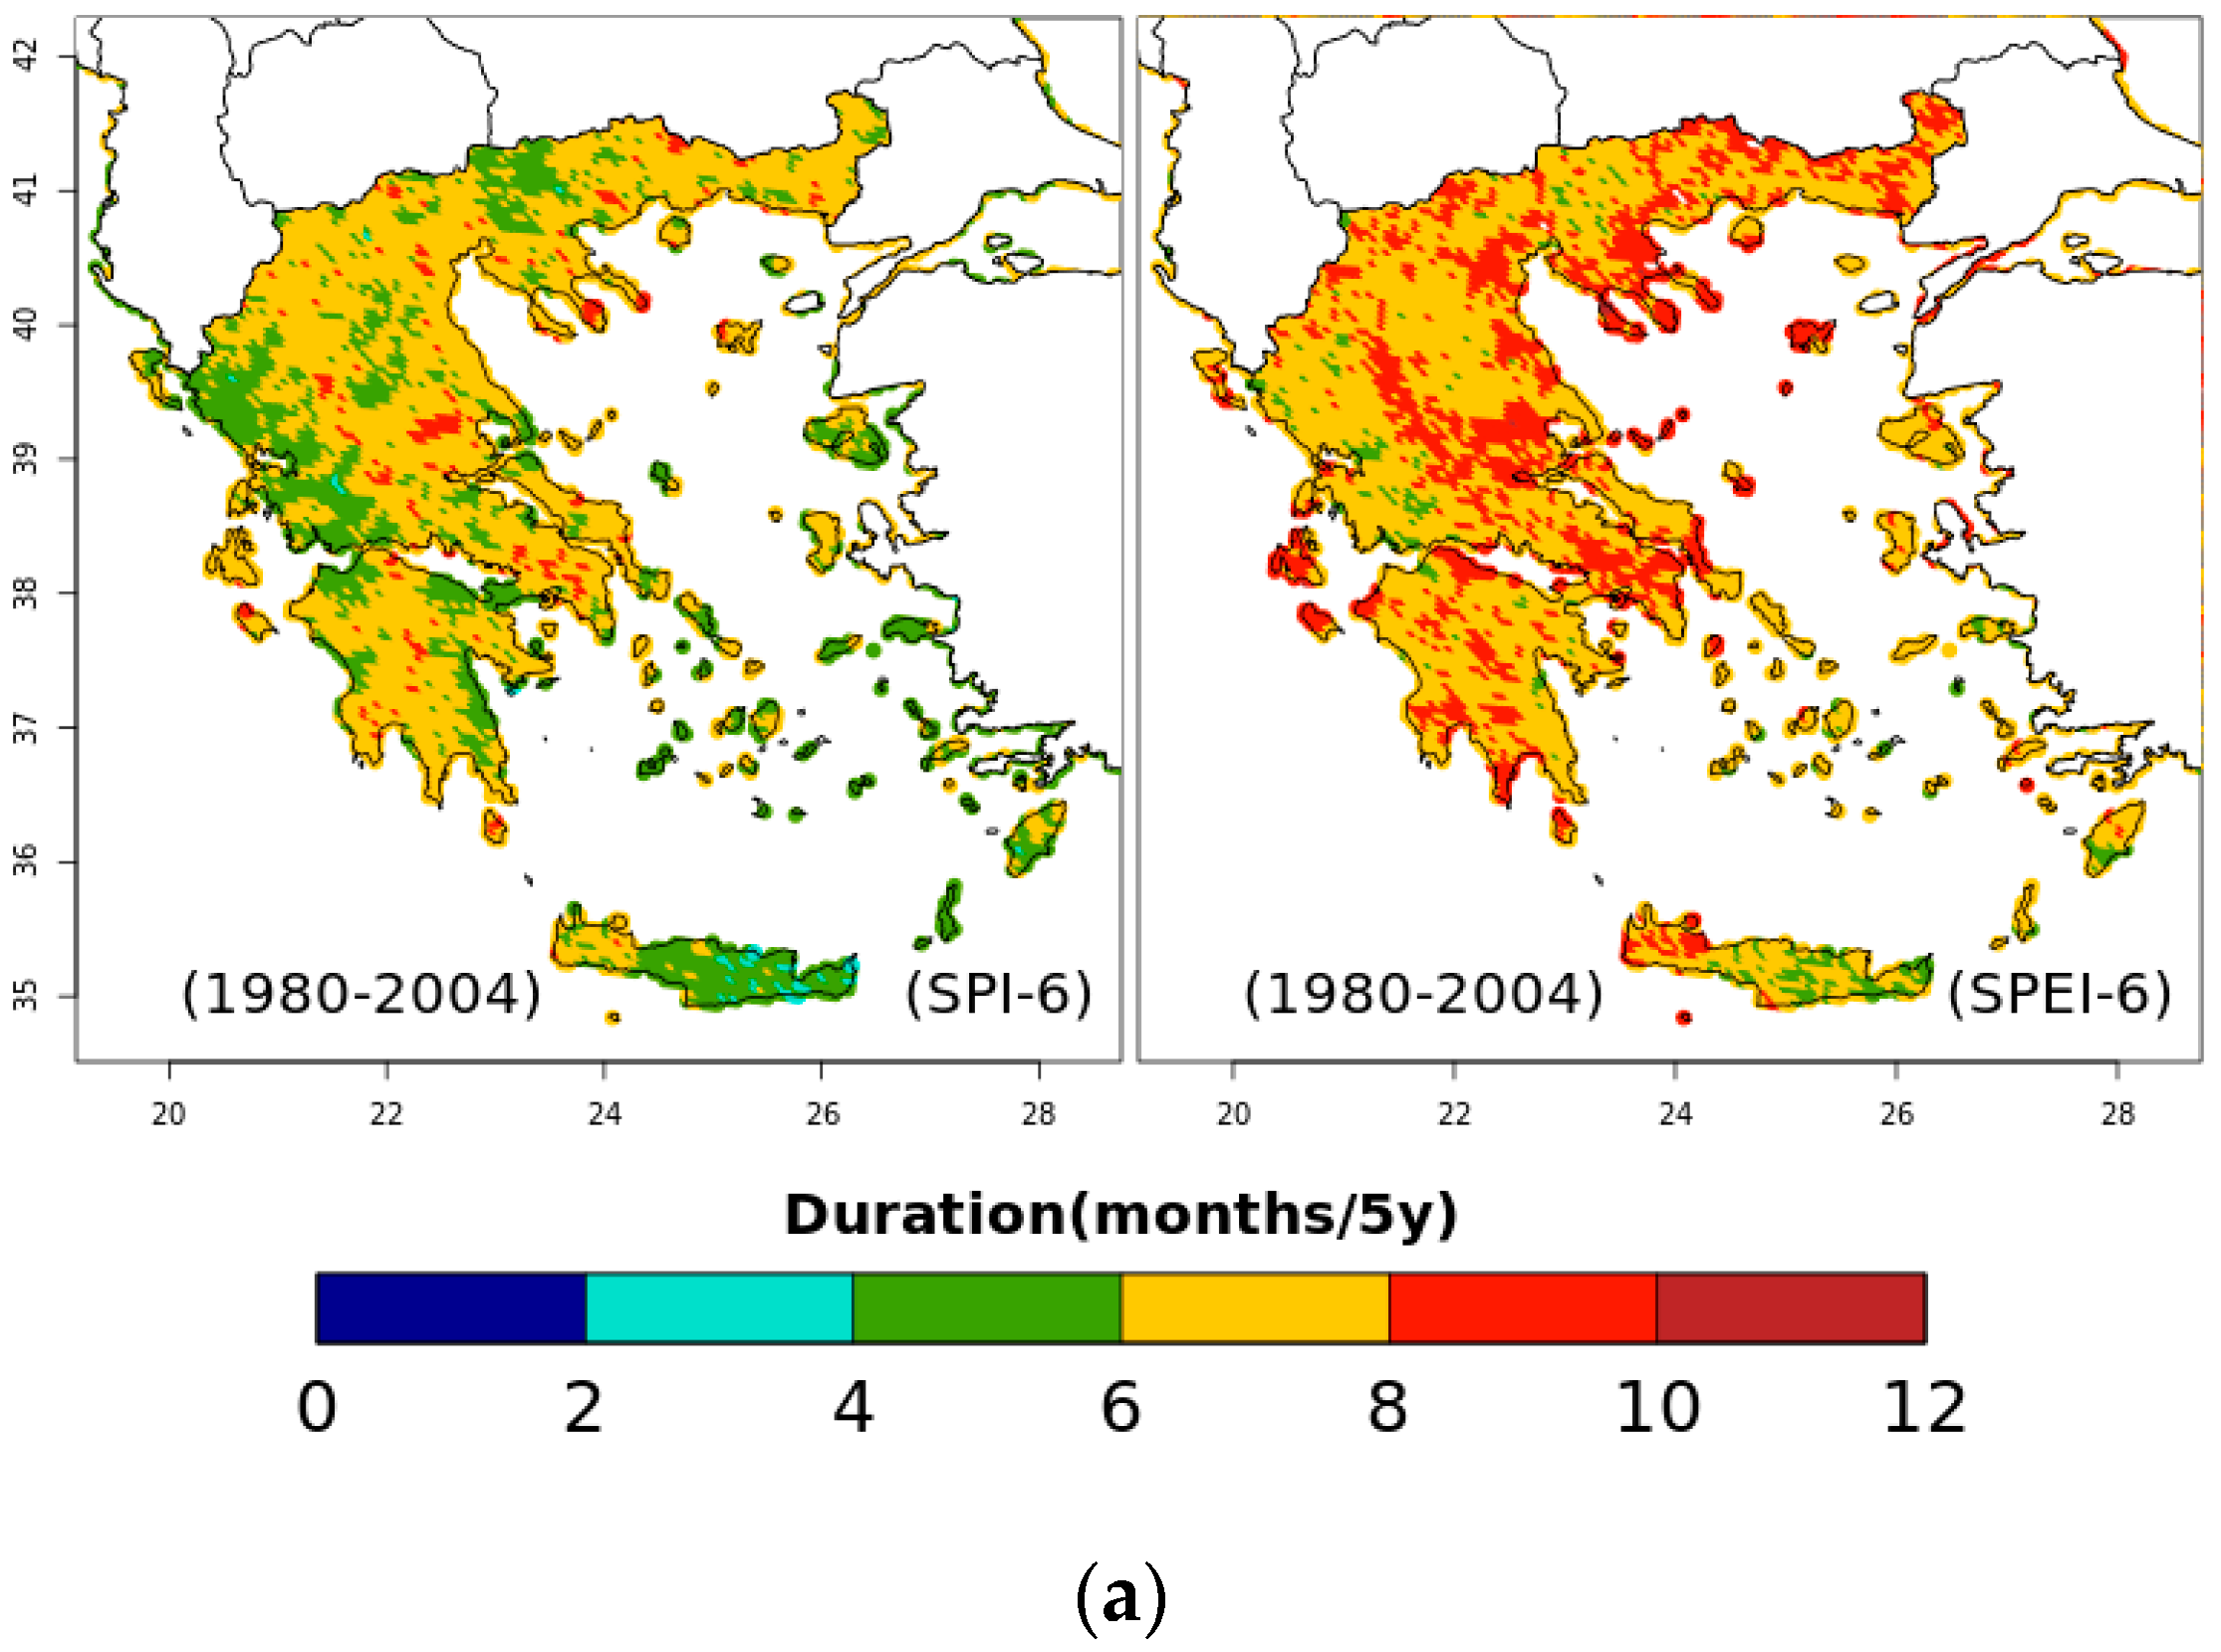
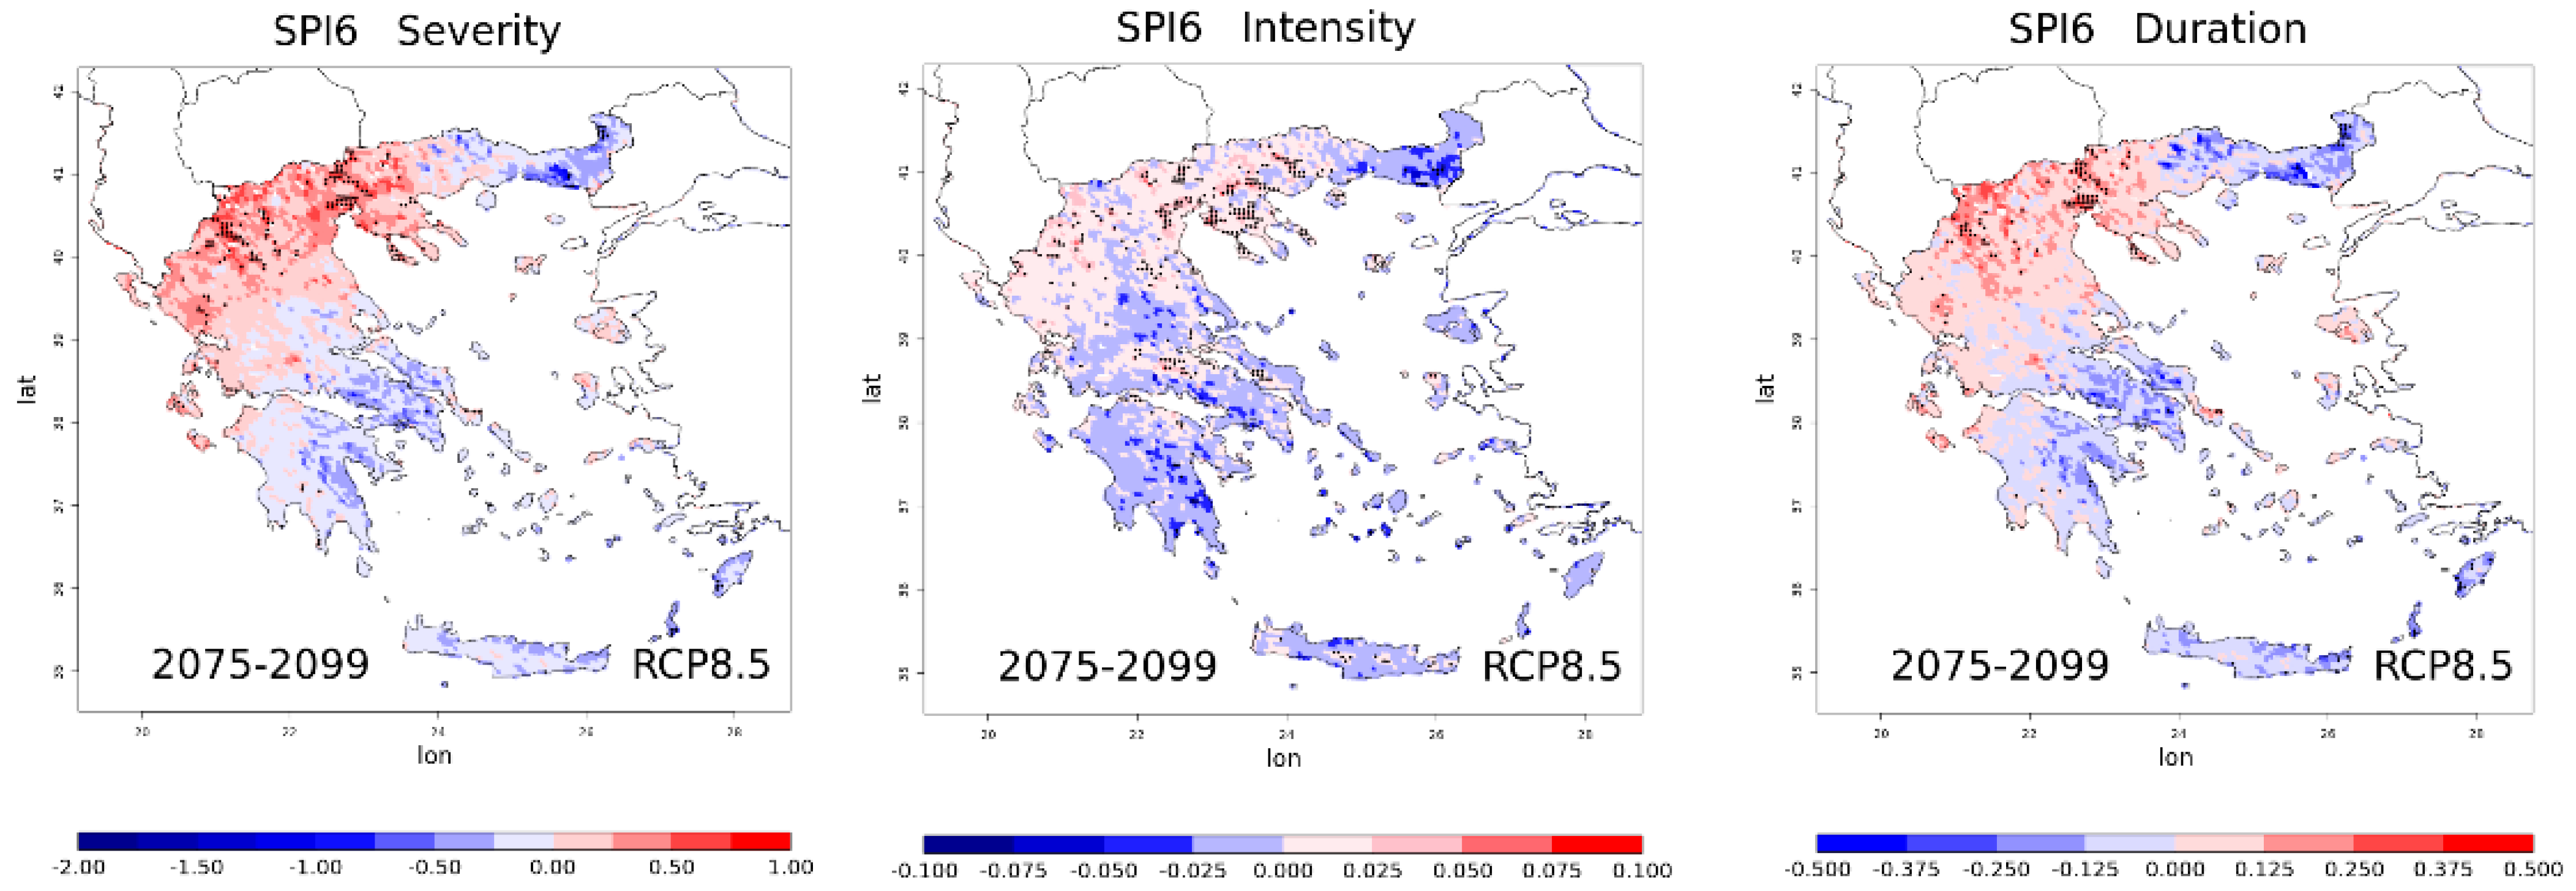
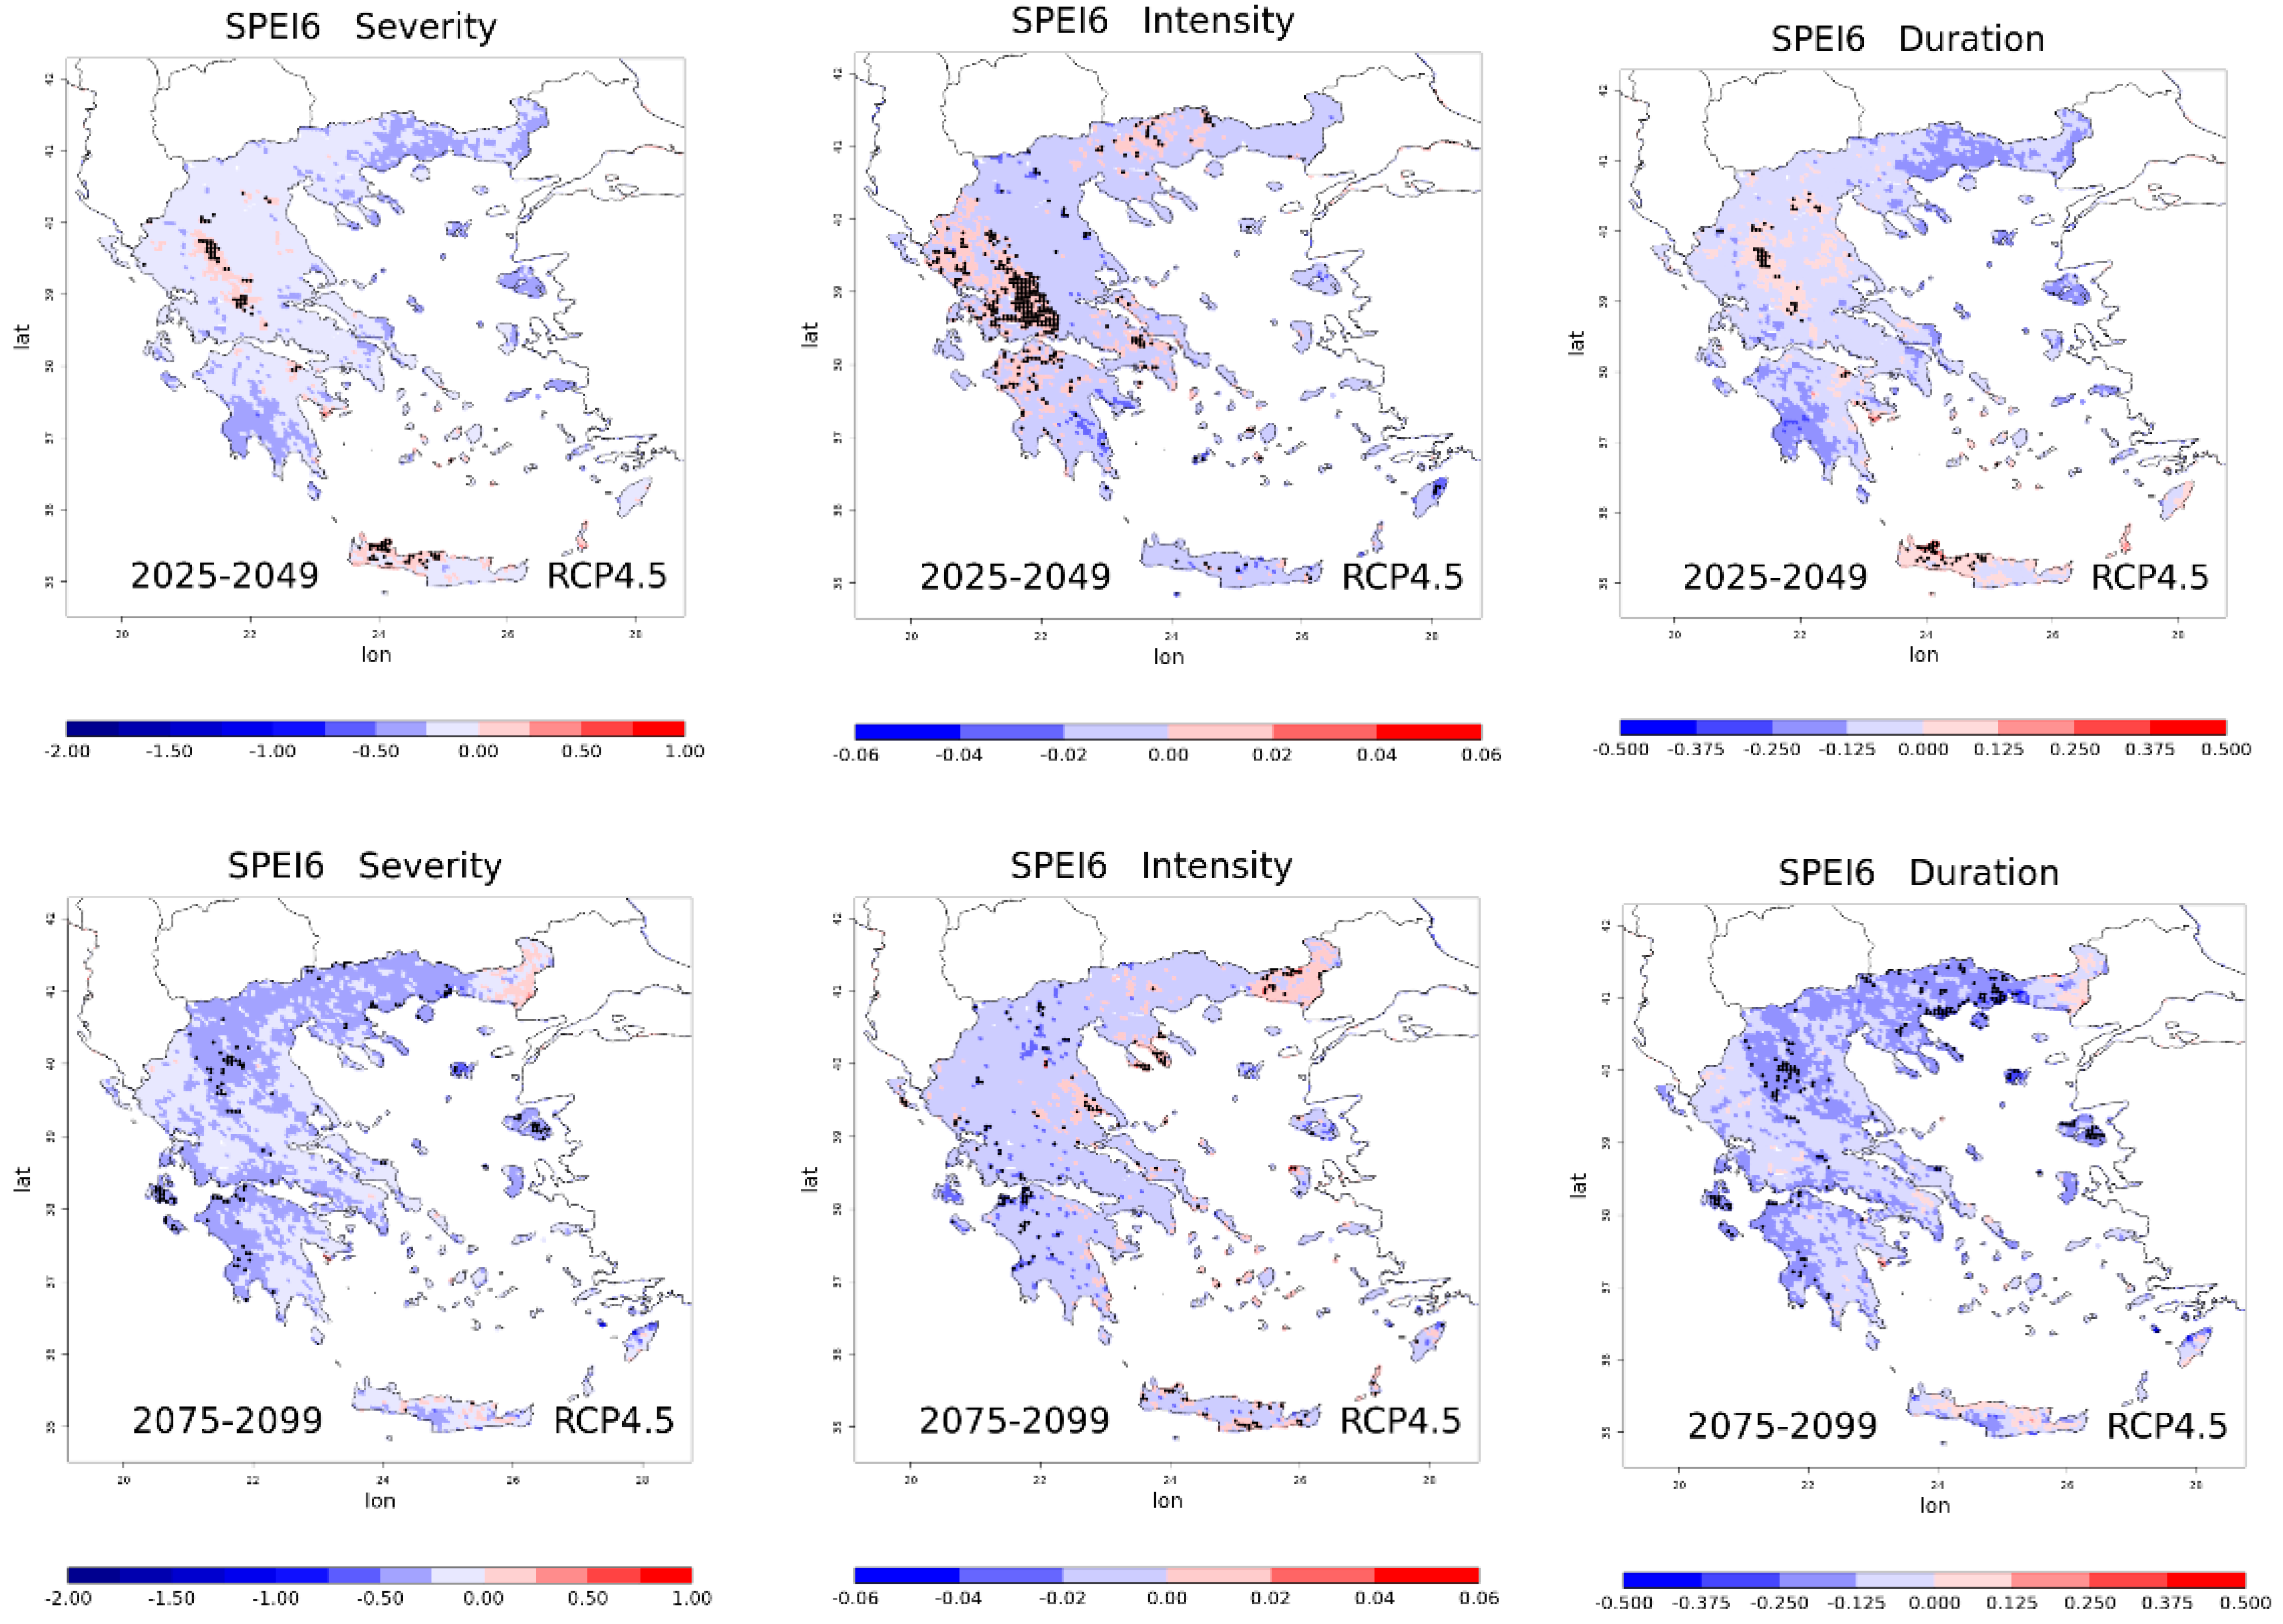
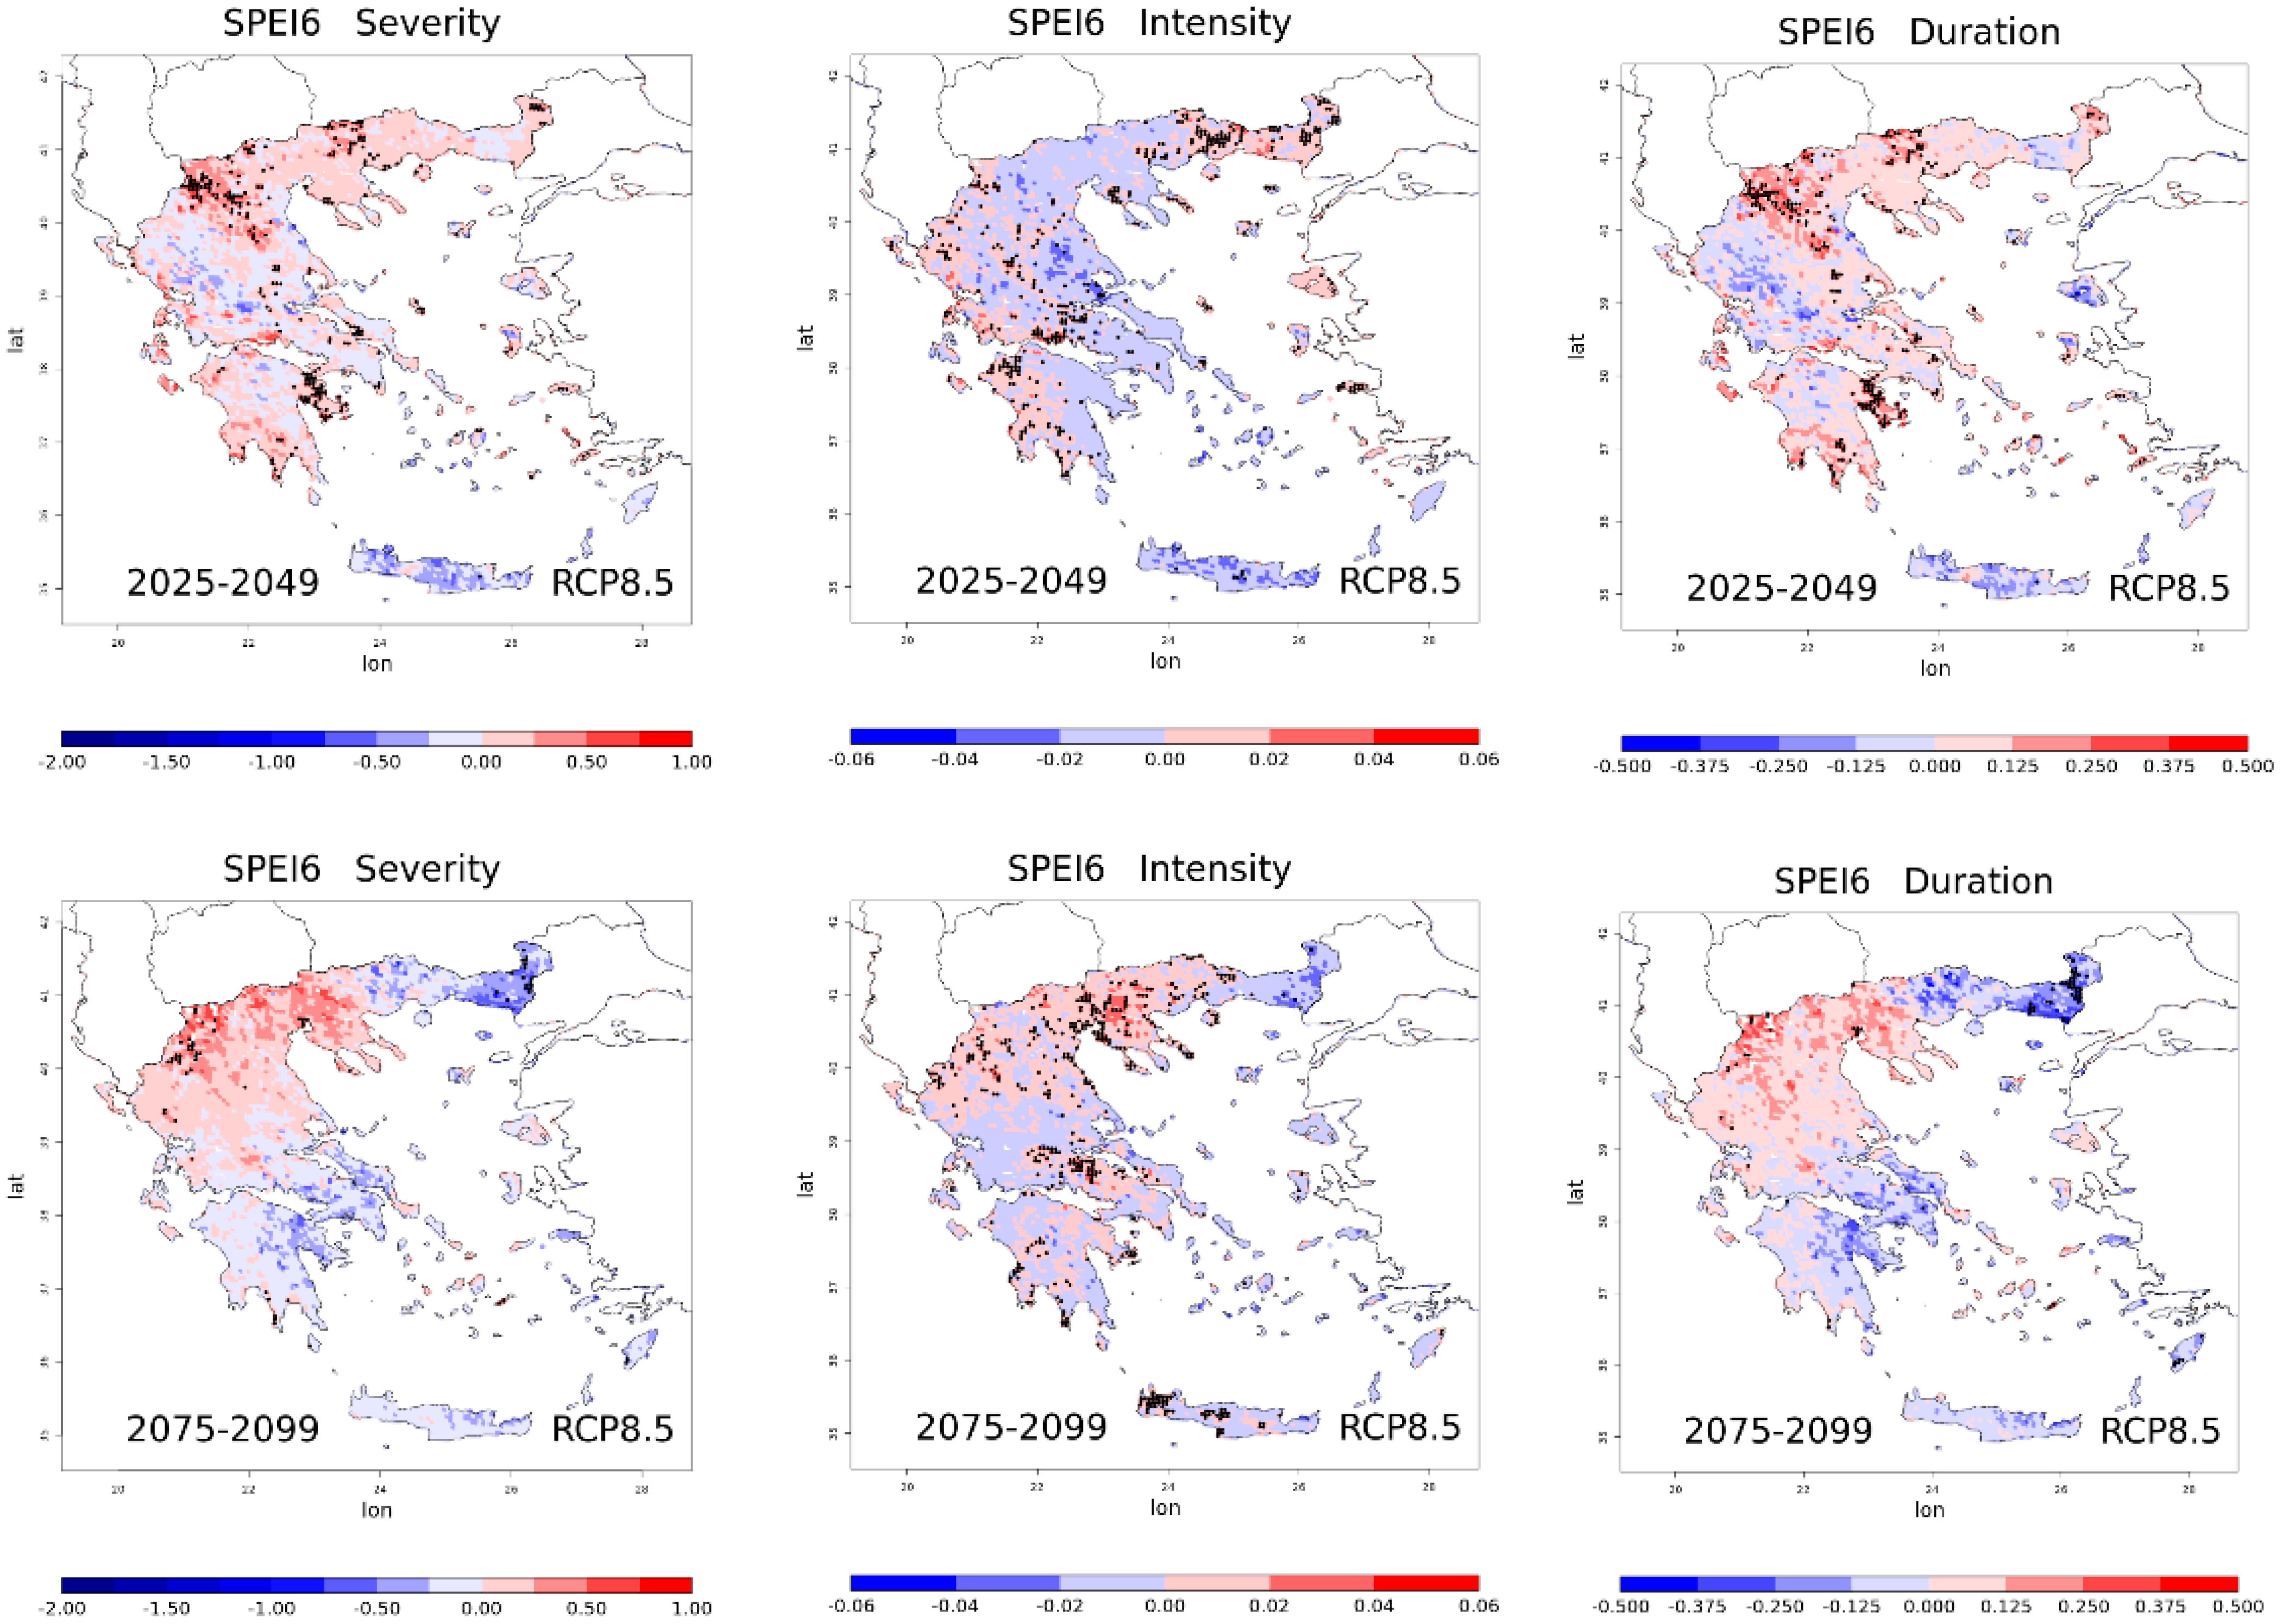
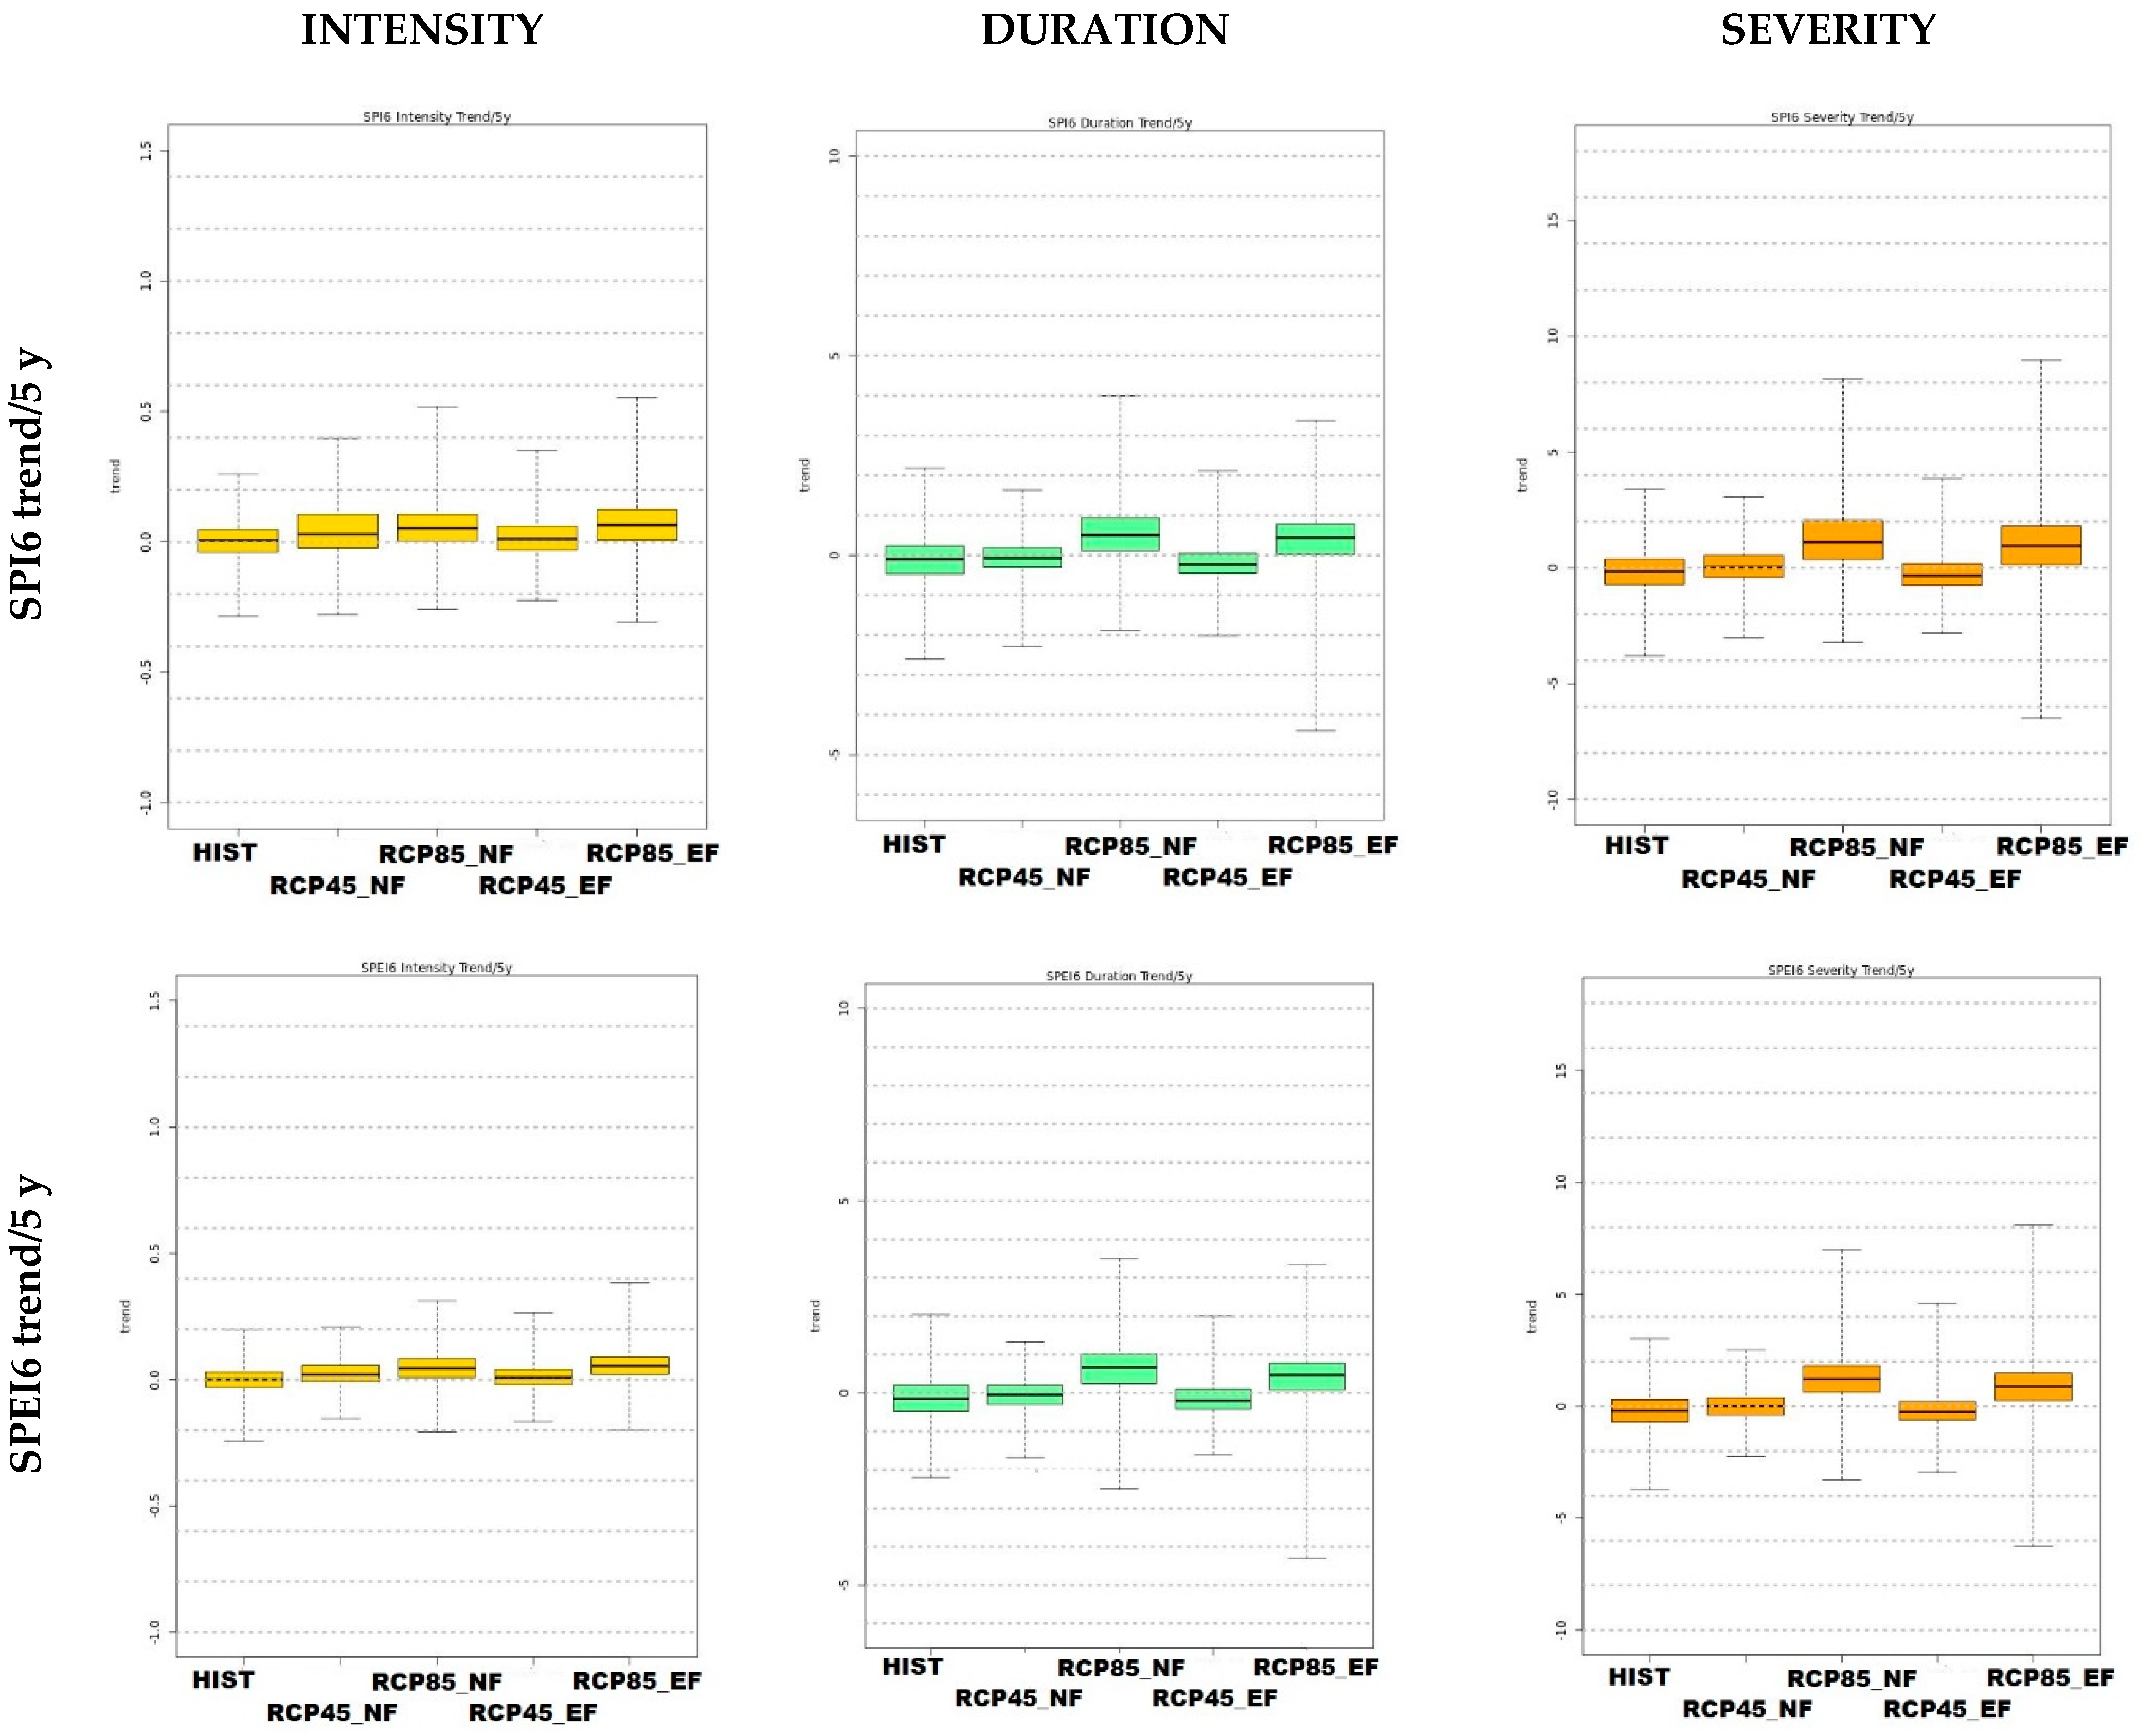
3.1. SPI-SPEI 6
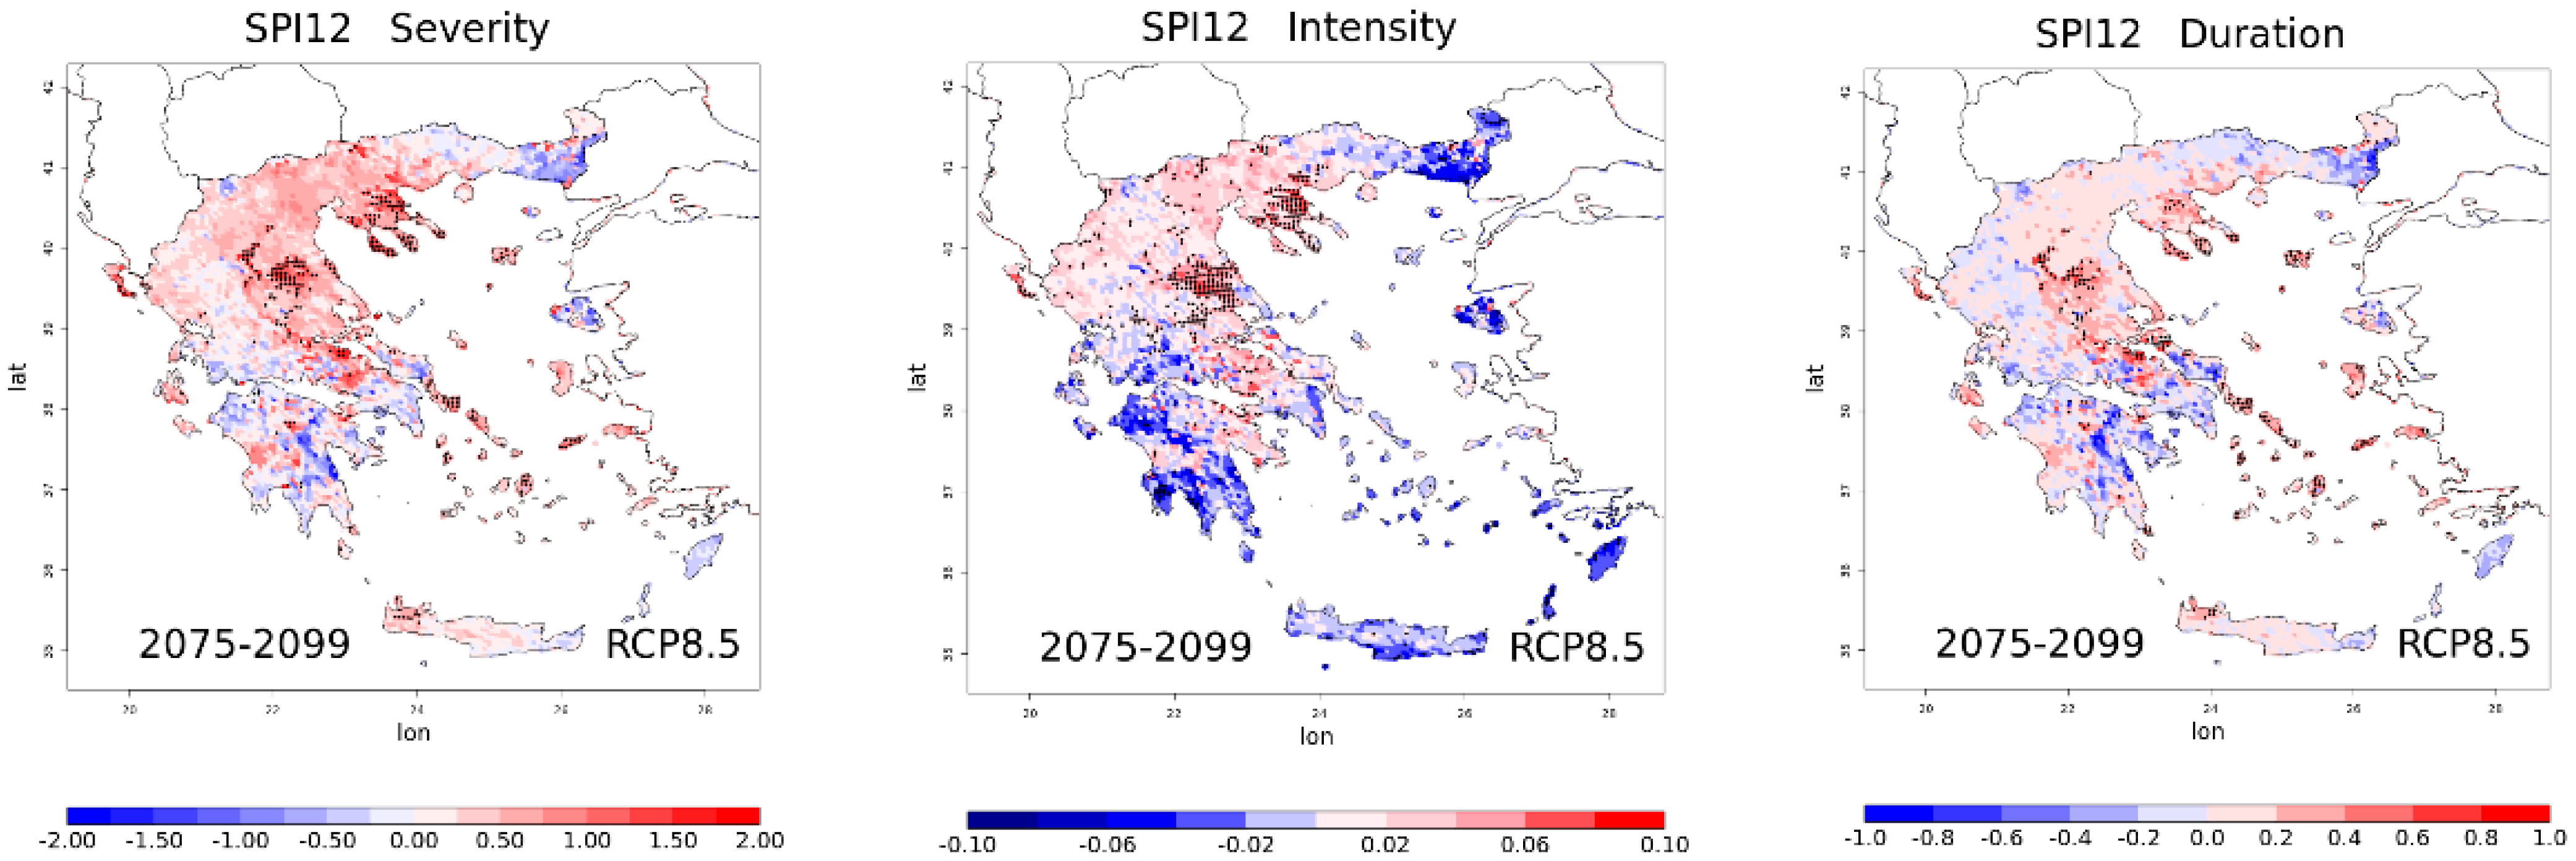
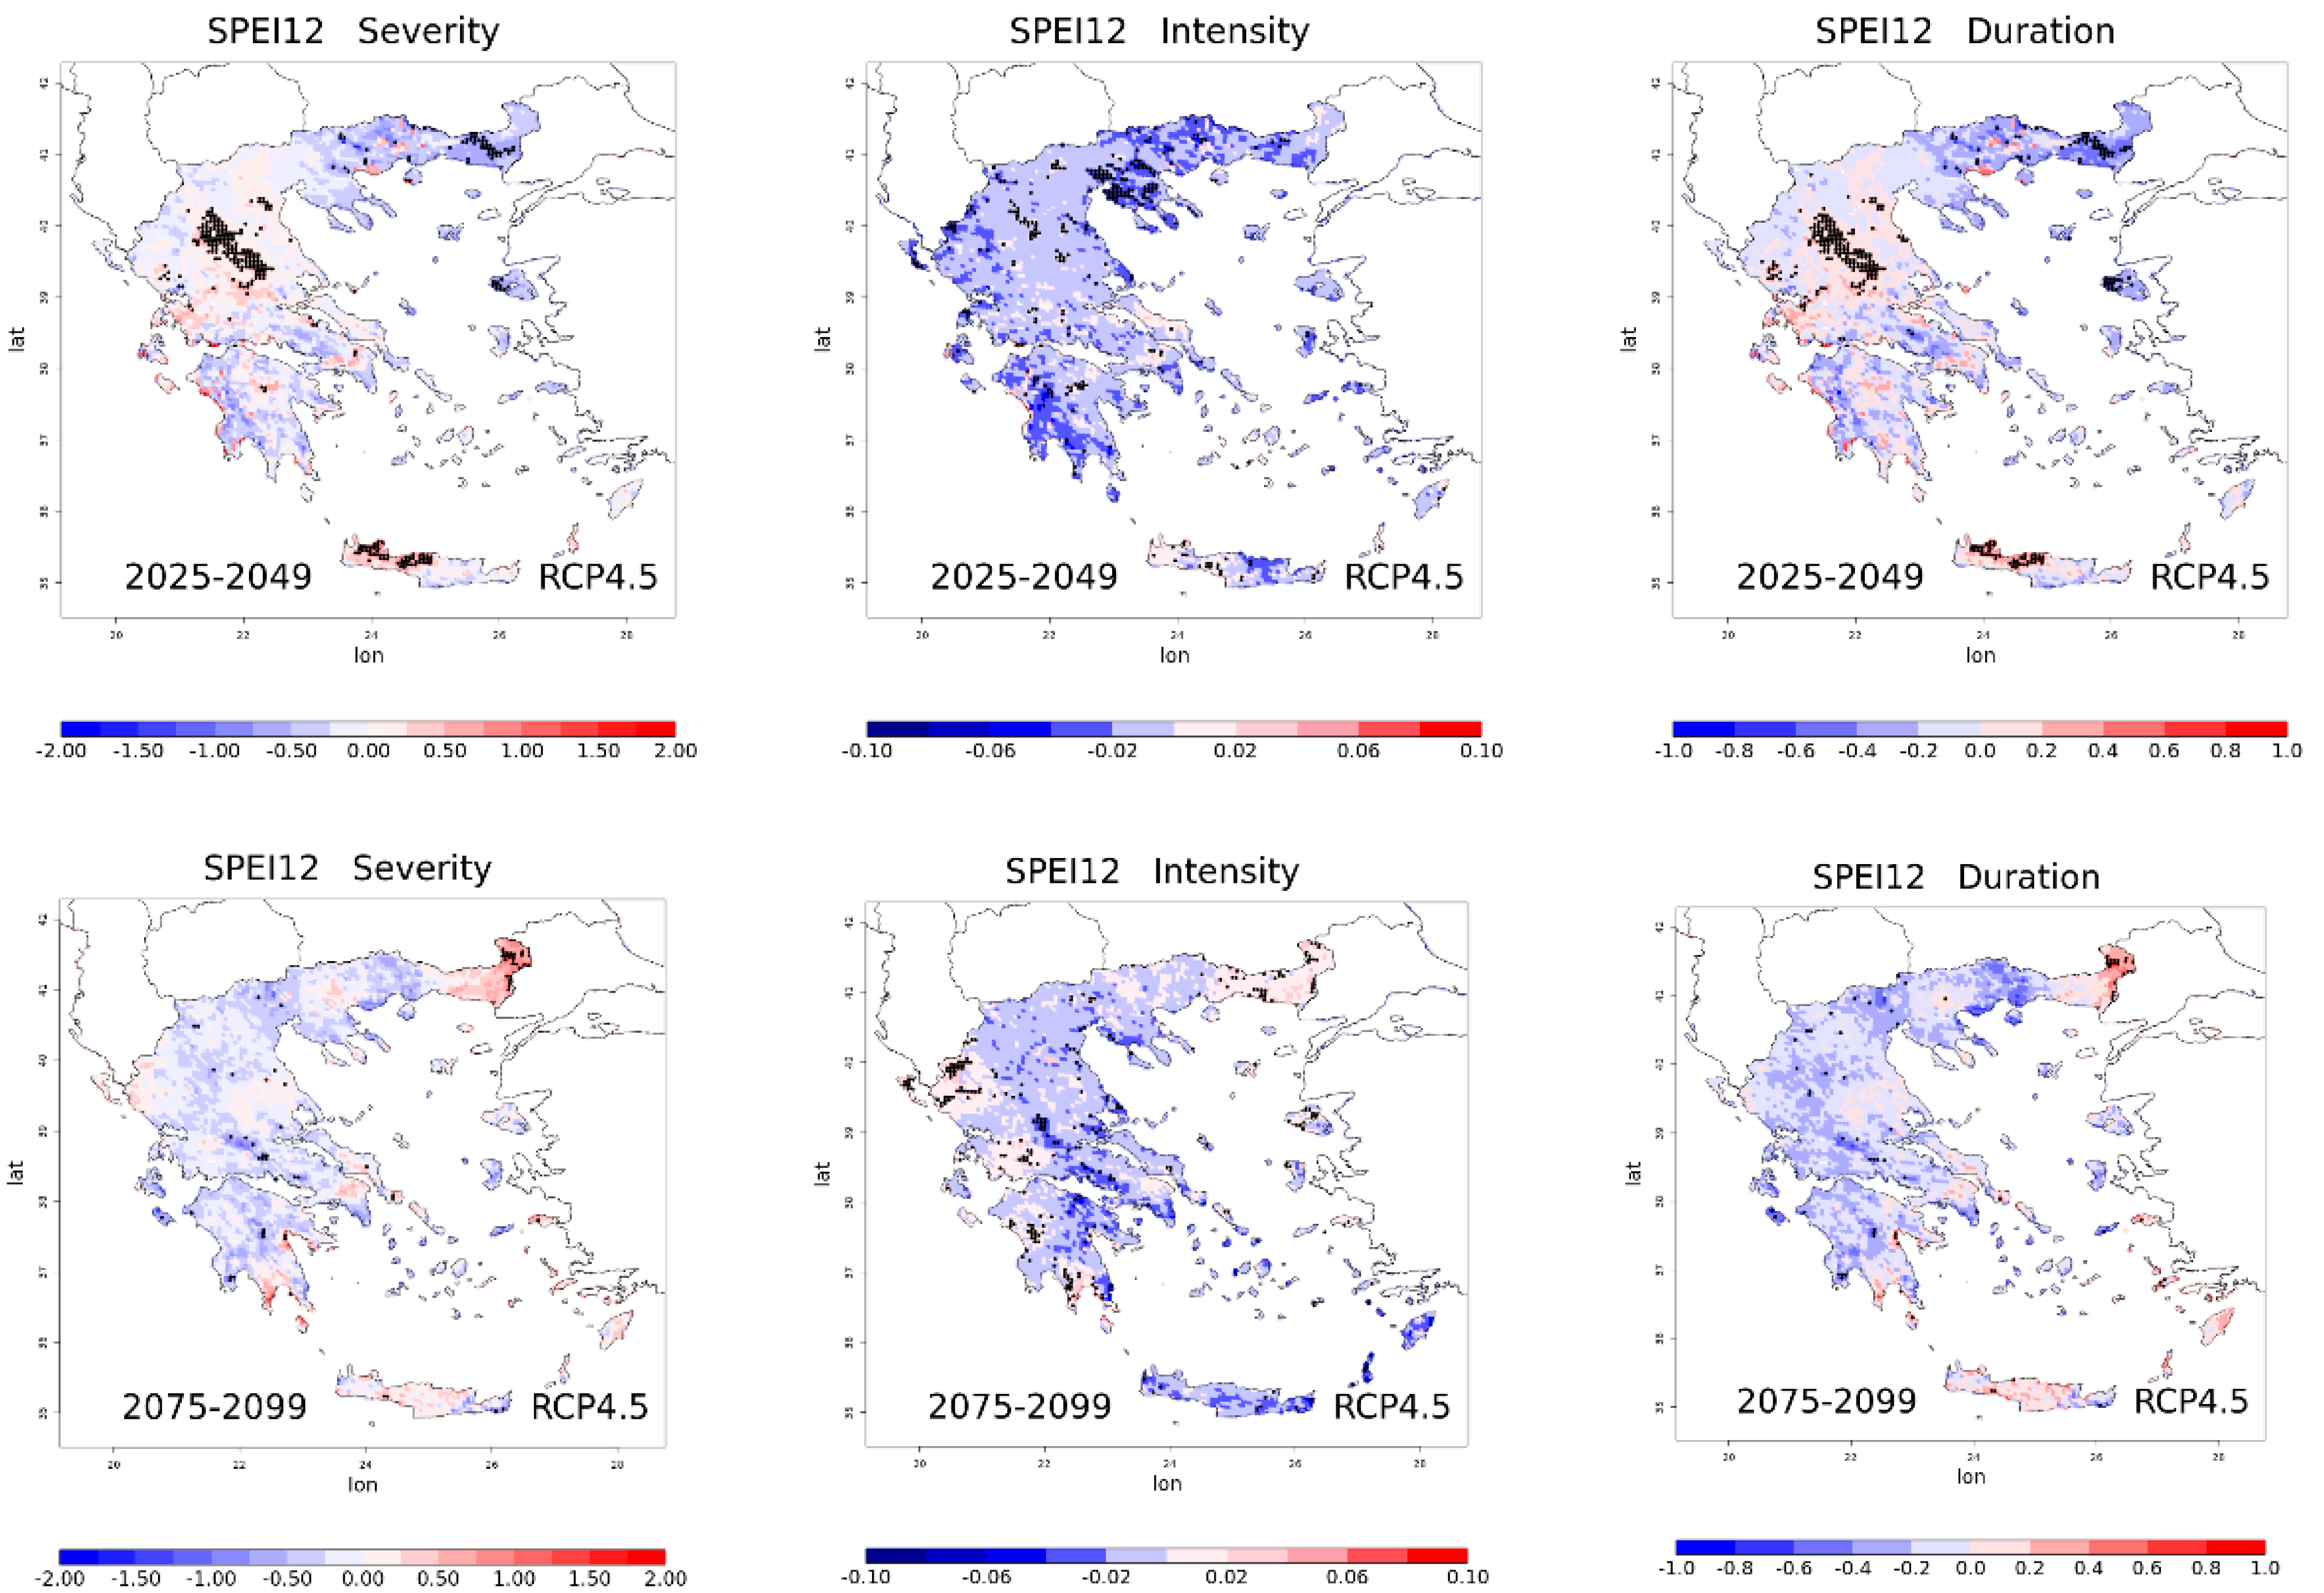
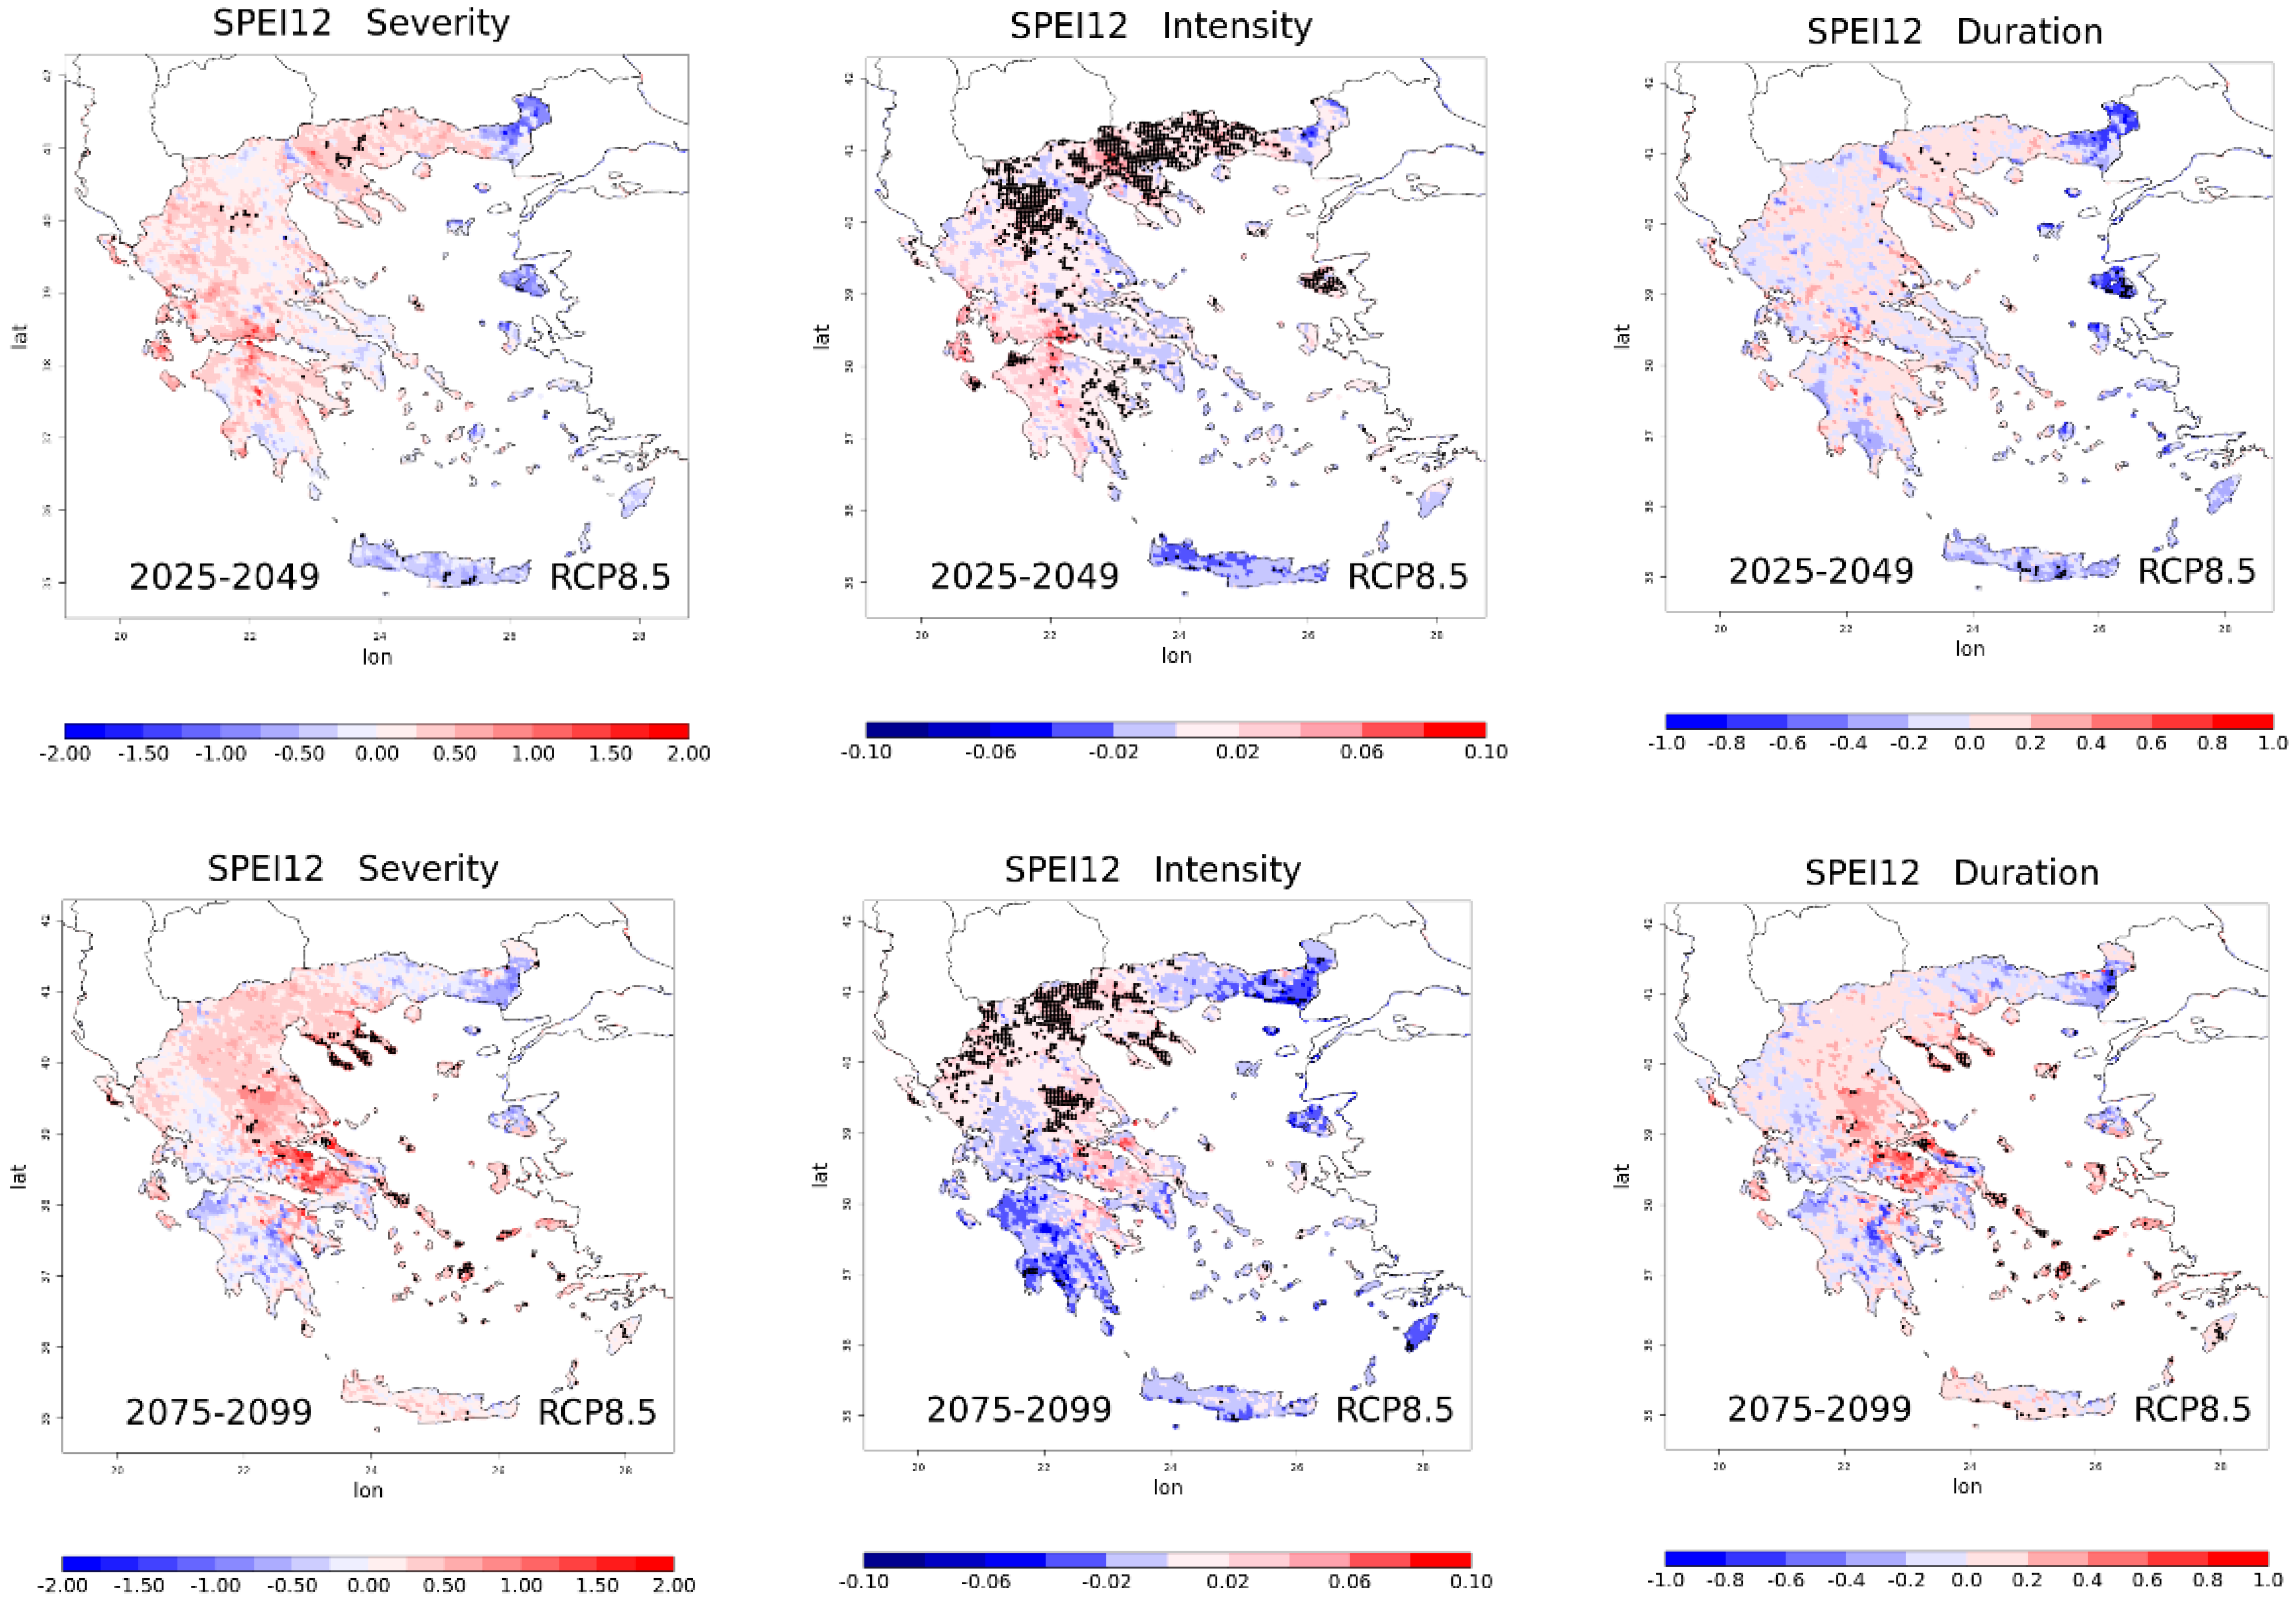
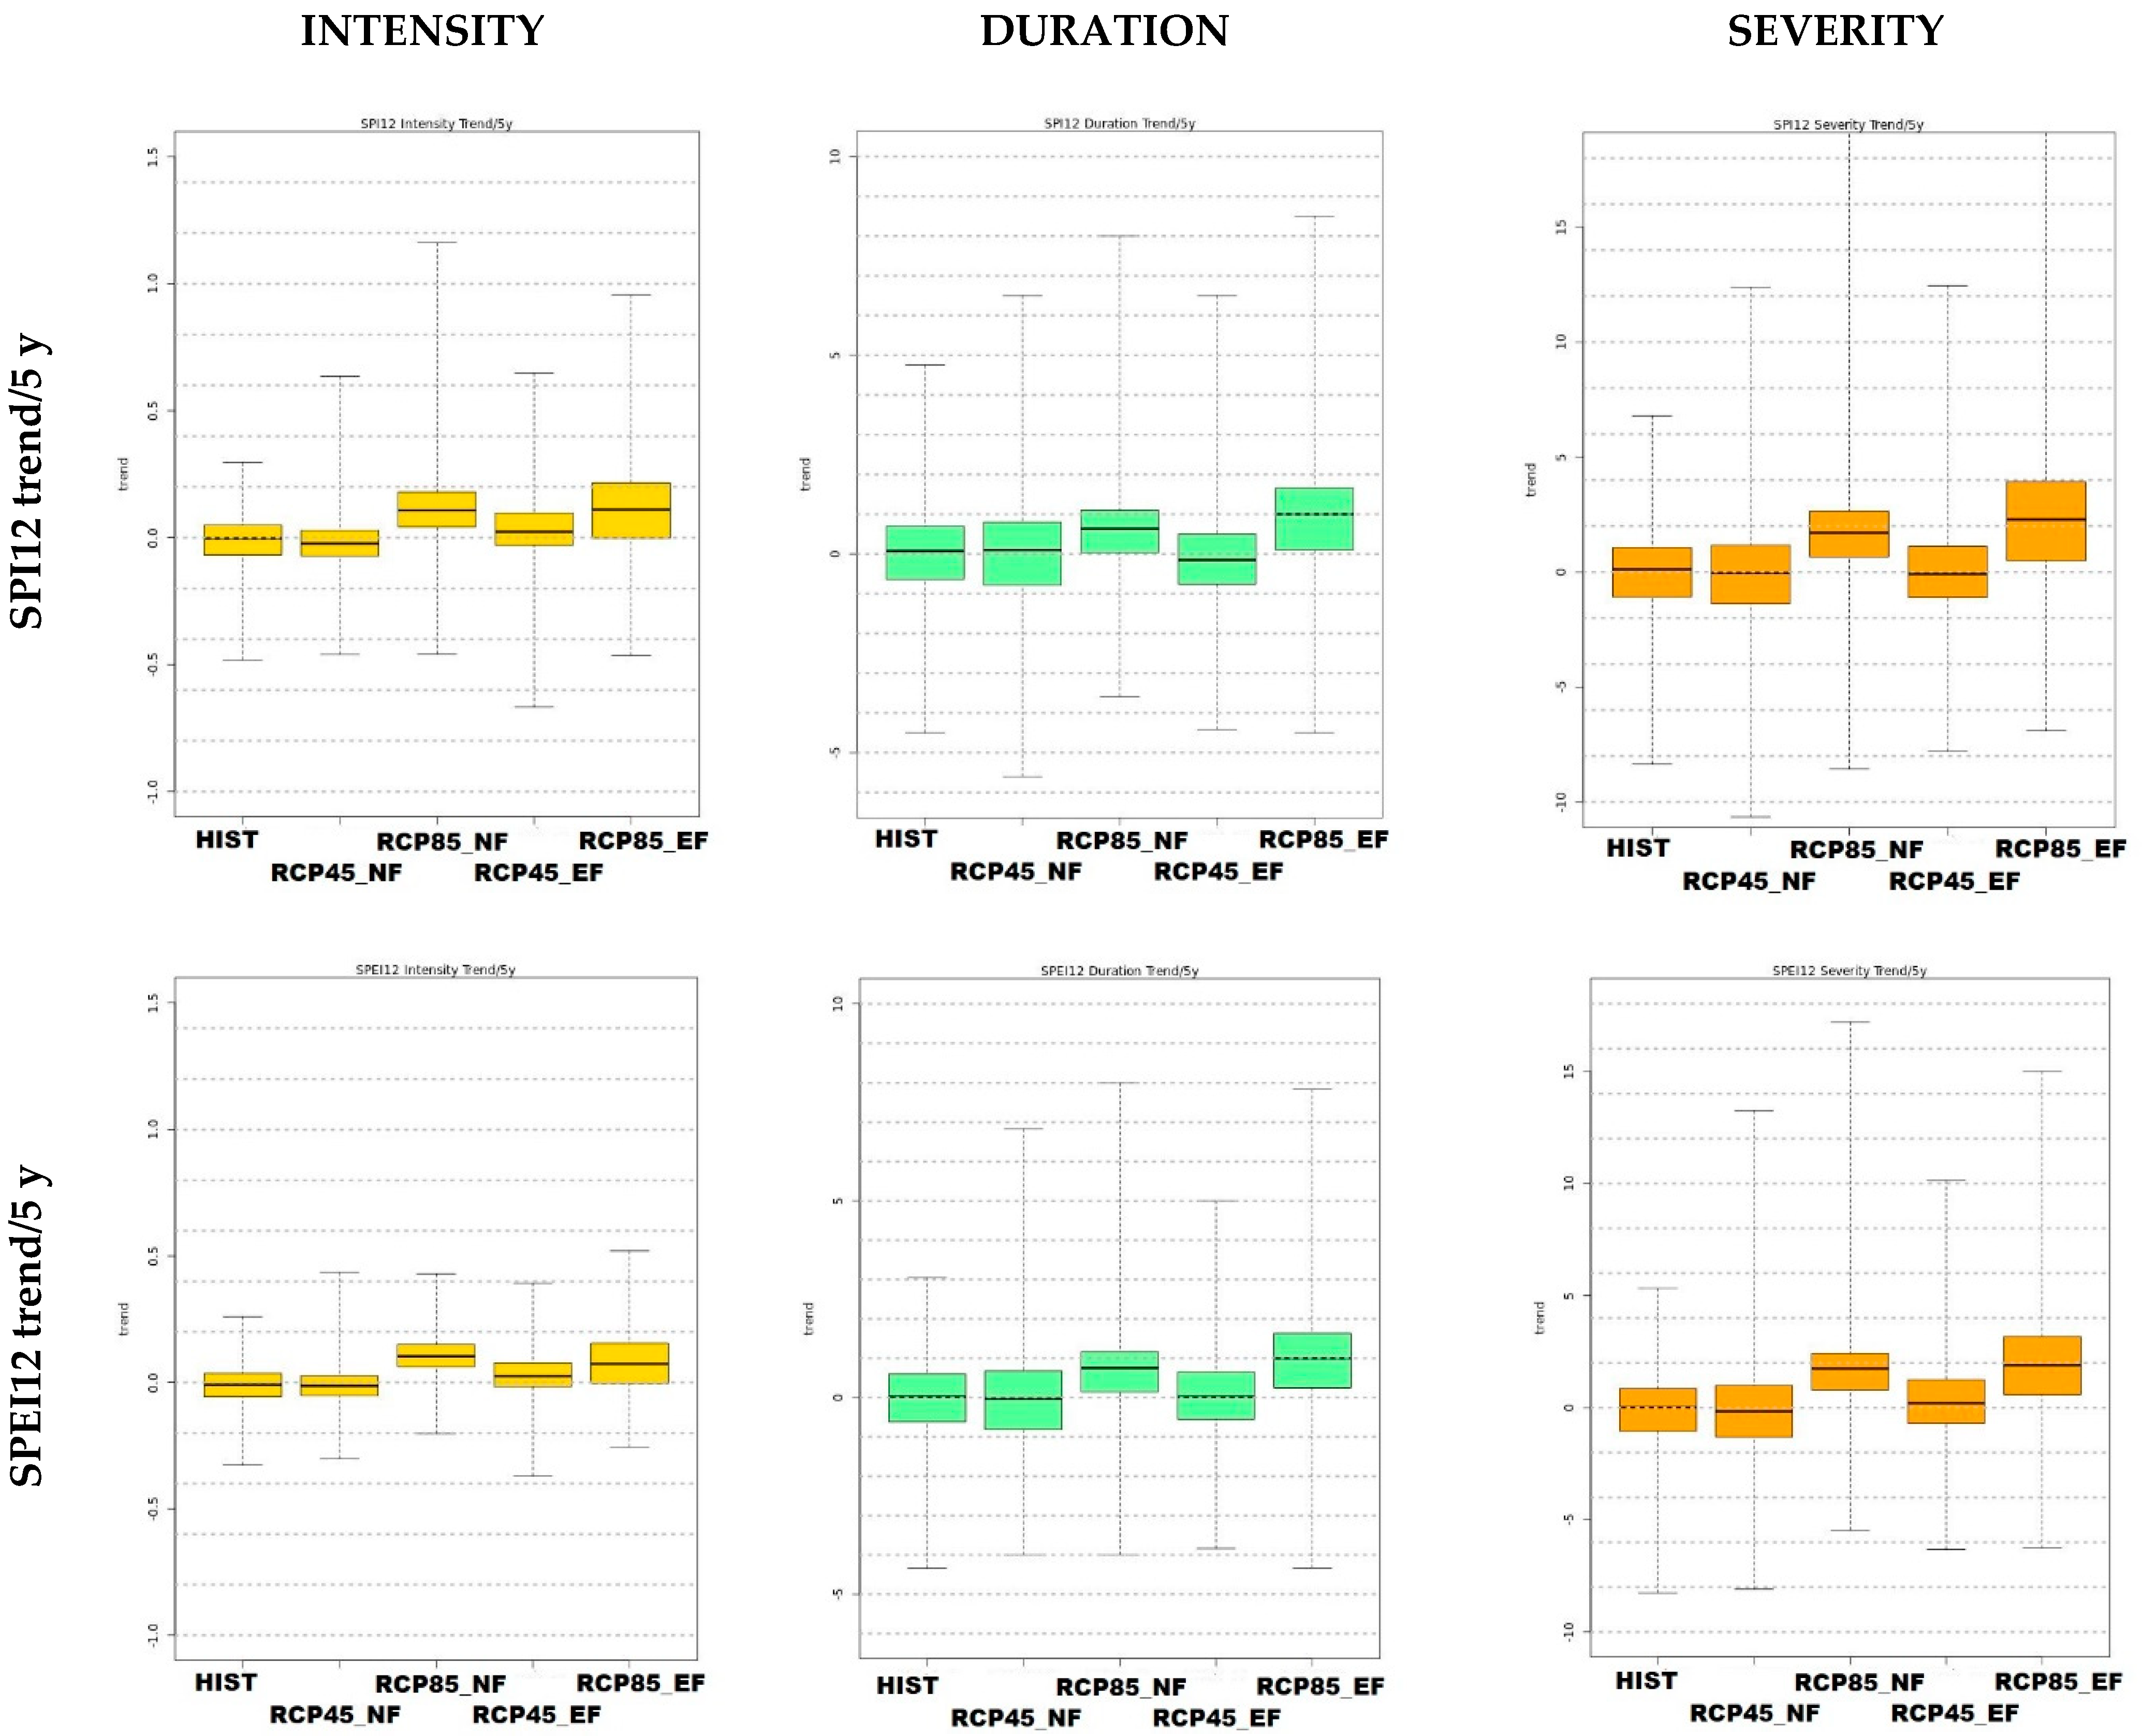
3.2. SPI-SPEI 12
4. Discussion
5. Conclusions
Author Contributions
Funding
Institutional Review Board Statement
Informed Consent Statement
Data Availability Statement
Acknowledgments
Conflicts of Interest
References
- Ali, E.; Cramer, W.; Carnicer, J.; Georgopoulou, E.; Hilmi, N.J.M.; le Cozannet, G.; Lionello, P. Cross-Chapter Paper 4: Mediterranean Region. In Climate Change 2022: Impacts, Adaptation, and Vulnerability. Contribution of Working Group II to the Sixth Assessment Report of the Intergovernmental Panel on Climate Change; Pörtner, H.-O., Roberts, D.C., Tignor, M., Poloczanska, E.S., Mintenbeck, K., Alegría, A., Craig, M., Langsdorf, S., Löschke, S., Möller, V., et al., Eds.; Cambridge University Press: Cambridge, UK; New York, NY, USA, 2022; pp. 2233–2272. [Google Scholar] [CrossRef]
- Vicente-Serrano, S.M.; Quiring, S.M.; Peña-Gallardo, M.; Yuan, S.; Domínguez-Castro, F. A Review of Environmental Droughts: Increased Risk under Global Warming? Earth Sci. Rev. 2020, 201, 102953. [Google Scholar] [CrossRef]
- Wilhite, D.A.; Pulwarty, R.S. National Drought Management Policy Guidelines: A Template for Action; CRC Press: Boca Raton, FL, USA, 2017; ISBN 9781351967525. [Google Scholar]
- Pörtner, H.-O.; Roberts, D.C.; Tignor, M.; Poloczanska, E.S.; Mintenbeck, K.; Alegría, A.; Craig, M.; Langsdorf, S.; Löschke, S.; Möller, V.; et al. (Eds.) IPCC Summary for Policymakers. In Climate Change 2022: Impacts, Adaptation, and Vulnerability. Contribution of Working Group II to the Sixth Assessment Report of the Intergovernmental Panel on Climate Change; Cambridge University Press: Cambridge, UK, 2022; ISBN 978-92-9169-159-3. [Google Scholar]
- Dai, A. Drought under Global Warming: A Review. Wiley Interdiscip. Rev. Clim. Chang. 2011, 2, 45–65. [Google Scholar] [CrossRef]
- Orlowsky, B.; Seneviratne, S.I. Global Changes in Extreme Events: Regional and Seasonal Dimension. Clim. Chang. 2012, 110, 669–696. [Google Scholar] [CrossRef]
- Prudhomme, C.; Giuntoli, I.; Robinson, E.L.; Clark, D.B.; Arnell, N.W.; Dankers, R.; Fekete, B.M.; Franssen, W.; Gerten, D.; Gosling, S.N.; et al. Hydrological Droughts in the 21st Century, Hotspots and Uncertainties from a Global Multimodel Ensemble Experiment. Proc. Natl. Acad. Sci. USA 2014, 111, 3262–3267. [Google Scholar] [CrossRef]
- Touma, D.; Ashfaq, M.; Nayak, M.A.; Kao, S.C.; Diffenbaugh, N.S. A Multi-Model and Multi-Index Evaluation of Drought Characteristics in the 21st Century. J. Hydrol. 2015, 526, 196–207. [Google Scholar] [CrossRef]
- Ukkola, A.M.; Pitman, A.J.; de Kauwe, M.G.; Abramowitz, G.; Herger, N.; Evans, J.P.; Decker, M. Evaluating CMIP5 Model Agreement for Multiple Drought Metrics. J. Hydrometeorol. 2018, 19, 969–988. [Google Scholar] [CrossRef]
- Polade, S.D.; Gershunov, A.; Cayan, D.R.; Dettinger, M.D.; Pierce, D.W. Precipitation in a Warming World: Assessing Projected Hydro-Climate Changes in California and Other Mediterranean Climate Regions. Sci. Rep. 2017, 7, 1–10. [Google Scholar] [CrossRef]
- Cook, B.I.; Smerdon, J.E.; Seager, R.; Coats, S. Global Warming and 21st Century Drying. Clim. Dyn. 2014, 43, 2607–2627. [Google Scholar] [CrossRef]
- Sharafati, A.; Pezeshki, E.; Shahid, S.; Motta, D. Quantification and Uncertainty of the Impact of Climate Change on River Discharge and Sediment Yield in the Dehbar River Basin in Iran. J. Soils Sediments 2020, 20, 2977–2996. [Google Scholar] [CrossRef]
- Salman, S.A.; Shahid, S.; Sharafati, A.; Salem, G.S.A.; Bakar, A.A.; Farooque, A.A.; Chung, E.S.; Ahmed, Y.A.; Mikhail, B.; Yaseen, Z.M. Projection of Agricultural Water Stress for Climate Change Scenarios: A Regional Case Study of Iraq. Agriculture 2021, 11, 1288. [Google Scholar] [CrossRef]
- Eyring, V.; Bony, S.; Meehl, G.A.; Senior, C.A.; Stevens, B.; Stouffer, R.J.; Taylor, K.E. Overview of the Coupled Model Intercomparison Project Phase 6 (CMIP6) Experimental Design and Organization. Geosci. Model Dev. 2016, 9, 1937–1958. [Google Scholar] [CrossRef]
- Forster, P.M.; Maycock, A.C.; McKenna, C.M.; Smith, C.J. Latest Climate Models Confirm Need for Urgent Mitigation. Nat. Clim. Chang. 2019, 10, 7–10. [Google Scholar] [CrossRef]
- Li, H.; Li, Z.; Chen, Y.; Xiang, Y.; Liu, Y.; Kayumba, P.M.; Li, X. Drylands Face Potential Threat of Robust Drought in the CMIP6 SSPs Scenarios. Environ. Res. Lett. 2021, 16, 114004. [Google Scholar] [CrossRef]
- Spinoni, J.; Barbosa, P.; Bucchignani, E.; Cassano, J.; Cavazos, T.; Christensen, J.H.; Christensen, O.B.; Coppola, E.; Evans, J.; Geyer, B.; et al. Future Global Meteorological Drought Hot Spots: A Study Based on CORDEX Data. J. Clim. 2020, 33, 3635–3661. [Google Scholar] [CrossRef]
- Raymond, F.; Ullmann, A.; Tramblay, Y.; Drobinski, P.; Camberlin, P. Evolution of Mediterranean Extreme Dry Spells during the Wet Season under Climate Change. Reg. Environ. Chang. 2019, 19, 2339–2351. [Google Scholar] [CrossRef]
- Spinoni, J.; Vogt, J.V.; Naumann, G.; Barbosa, P.; Dosio, A. Will Drought Events Become More Frequent and Severe in Europe? Int. J. Climatol. 2018, 38, 1718–1736. [Google Scholar] [CrossRef]
- Turkes, M.; Turp, M.T.; An, N.; Ozturk, T.; Kurnaz, M.L. Impacts of Climate Change on Precipitation Climatology and Variability in Turkey. In Water Resources of Turkey; Springer: Cham, Switzerland, 2020; pp. 467–491. [Google Scholar] [CrossRef]
- García-Valdecasas Ojeda, M.; Gámiz-Fortis, S.R.; Romero-Jiménez, E.; Rosa-Cánovas, J.J.; Yeste, P.; Castro-Díez, Y.; Esteban-Parra, M.J. Projected Changes in the Iberian Peninsula Drought Characteristics. Sci. Total Environ. 2021, 757, 143702. [Google Scholar] [CrossRef]
- Daliakopoulos, I.N.; Panagea, I.S.; Tsanis, I.K.; Grillakis, M.G.; Koutroulis, A.G.; Hessel, R.; Mayor, A.G.; Ritsema, C.J. Yield Response of Mediterranean Rangelands under a Changing Climate. Land Degrad. Dev. 2017, 28, 1962–1972. [Google Scholar] [CrossRef]
- Ozturk, T.; Ceber, Z.P.; Türkeş, M.; Kurnaz, M.L. Projections of Climate Change in the Mediterranean Basin by Using Downscaled Global Climate Model Outputs. Int. J. Climatol. 2015, 35, 4276–4292. [Google Scholar] [CrossRef]
- Marcos, R.; Llasat, M.C.; Quintana-Seguí, P.; Turco, M. Seasonal Predictability of Water Resources in a Mediterranean Freshwater Reservoir and Assessment of Its Utility for End-Users. Sci. Total Environ. 2017, 575, 681–691. [Google Scholar] [CrossRef]
- Mathbout, S.; Lopez-Bustins, J.A.; Royé, D.; Martin-Vide, J. Mediterranean-Scale Drought: Regional Datasets for Exceptional Meteorological Drought Events during 1975–2019. Atmosphere 2021, 12, 941. [Google Scholar] [CrossRef]
- Nastos, P.T.; Kapsomenakis, J.; Douvis, K.C. Analysis of Precipitation Extremes Based on Satellite and High-Resolution Gridded Data Set over Mediterranean Basin. Atmos. Res. 2013, 131, 46–59. [Google Scholar] [CrossRef]
- Vasiliades, L.; Loukas, A.; Patsonas, G. Evaluation of a Statistical Downscaling Procedure for the Estimation of Climate Change Impacts on Droughts. Nat. Hazards Earth Syst. Sci. 2009, 9, 879–894. [Google Scholar] [CrossRef]
- Dalezios, N.R.; Papazafiriou, Z.G.; Papamichail, D.M.; Karacostas, T.S. Drought Assessment for the Potential of Precipitation Enhancement in Northern Greece. Theor. Appl. Climatol. 1991, 44, 75–88. [Google Scholar] [CrossRef]
- Dalezios, N.R.; Loukas, A.; Vasiliades, L.; Liakopoulos, E. Severity-Duration-Frequency Analysis of Droughts and Wet Periods in Greece. Hydrol. Sci. J. 2000, 45, 751–769. [Google Scholar] [CrossRef]
- Anagnostopoulou, C.; Maheras, P.; Karacostas, T.; Vafiadis, M. Spatial and Temporal Analysis of Dry Spells in Greece. Theor. Appl. Climatol. 2003, 74, 77–91. [Google Scholar] [CrossRef]
- Tsakiris, G.; Vangelis, H. Towards a Drought Watch System Based on Spatial SPI. Water Resour. Manag. 2004, 18, 1–12. [Google Scholar] [CrossRef]
- Livada, I.; Assimakopoulos, V.D. Spatial and Temporal Analysis of Drought in Greece Using the Standardized Precipitation Index (SPI). Appl. Clim. 2007, 89, 143–153. [Google Scholar] [CrossRef]
- Karavitis, C.A.; Alexandris, S.; Tsesmelis, D.E.; Athanasopoulos, G. Application of the Standardized Precipitation Index (SPI) in Greece. Water 2011, 3, 787–805. [Google Scholar] [CrossRef]
- Karavitis, C.A.; Chortaria, C.; Alexandris, S.; Vasilakou, C.G.; Tsesmelis, D.E. Development of the Standardised Precipitation Index for Greece. Urban Water J. 2012, 9, 401–417. [Google Scholar] [CrossRef]
- Tsesmelis, D.E.; Vasilakou, C.G.; Kalogeropoulos, K.; Stathopoulos, N.; Alexandris, S.G.; Zervas, E.; Oikonomou, P.D.; Karavitis, C.A. Drought Assessment Using the Standardized Precipitation Index (SPI) in GIS Environment in Greece. In Computers in Earth and Environmental Sciences; Elsevier: Amsterdam, The Netherlands, 2022; pp. 619–633. [Google Scholar] [CrossRef]
- Nastos, P.T.; Zerefos, C.S. Spatial and Temporal Variability of Consecutive Dry and Wet Days in Greece. Atmos. Res. 2009, 94, 616–628. [Google Scholar] [CrossRef]
- Nastos, P.T.; Zerefos, C.S. Decadal Changes in Extreme Daily Precipitation in Greece. Adv. Geosci. 2008, 16, 55–62. [Google Scholar] [CrossRef]
- Vangelis, H.; Tigkas, D.; Tsakiris, G. The Effect of PET Method on Reconnaissance Drought Index (RDI) Calculation. J. Arid. Environ. 2013, 88, 130–140. [Google Scholar] [CrossRef]
- Paparrizos, S.; Maris, F.; Matzarakis, A. Integrated Analysis And Mapping Of Aridity Over Greek Areas with Different Climate Conditions. Glob. NEST J. 2016, 18, 131–145. [Google Scholar]
- Loukas, A.; Vasiliades, L.; Tzabiras, J. Evaluation of Climate Change on Drought Impulses in Thessaly, Greece. Eur. Water 2007, 17, 17–28. [Google Scholar]
- Vrochidou, A.E.K.; Tsanis, I.K.; Grillakis, M.G.; Koutroulis, A.G. The Impact of Climate Change on Hydrometeorological Droughts at a Basin Scale. J. Hydrol. 2013, 476, 290–301. [Google Scholar] [CrossRef]
- Vrochidou, A.E.K.; Grillakis, M.G.; Tsanis, I.K. Drought Assessment Based on Multi-Model Precipitation Projections for the Island of Crete. J. Earth Sci. Clim. Chang. 2013, 4, 1–7. [Google Scholar] [CrossRef]
- Nastos, P.T.; Politi, N.; Kapsomenakis, J. Spatial and Temporal Variability of the Aridity Index in Greece. Atmos. Res. 2013, 119, 140–152. [Google Scholar] [CrossRef]
- Anagnostopoulou, C. Future Drought Projection For The Greek Region. Bull. Geol. Soc. Greece 2017, 50, 1038. [Google Scholar] [CrossRef][Green Version]
- Paparrizos, S.; Maris, F.; Weiler, M.; Matzarakis, A. Analysis and Mapping of Present and Future Drought Conditions over Greek Areas with Different Climate Conditions. Appl. Clim. 2018, 131, 259–270. [Google Scholar] [CrossRef]
- Georgoulias, A.K.; Akritidis, D.; Kalisoras, A.; Kapsomenakis, J.; Melas, D.; Zerefos, C.S.; Zanis, P. Climate Change Projections for Greece in the 21st Century from High-Resolution EURO-CORDEX RCM Simulations. Atmos. Res. 2022, 271, 106049. [Google Scholar] [CrossRef]
- Im, E.-S.; Coppola, E.; Giorgi, F.; Bi, X. Validation of a High-Resolution Regional Climate Model for the Alpine Region and Effects of a Subgrid-Scale Topography and Land Use Representation. J. Clim. 2010, 23, 1854–1873. [Google Scholar] [CrossRef]
- Skamarock, W.C.; Skamarock, W.C.; Klemp, J.B.; Dudhia, J.; Gill, D.O.; Barker, D.M.; Wang, W.; Powers, J.G. A Description of the Advanced Research WRF Version 3; NCAR Technical Note -475+STR; University Corporation for Atmospheric Research: Boulder, CO, USA, 2008. [Google Scholar]
- Hazeleger, W.; Severijns, C.; Semmler, T.; Ştefǎnescu, S.; Yang, S.; Wang, X.; Wyser, K.; Dutra, E.; Baldasano, J.M.; Bintanja, R.; et al. EC-Earth: A Seamless Earth-System Prediction Approach in Action. Bull. Am. Meteorol. Soc. 2010, 91, 1357–1364. [Google Scholar] [CrossRef]
- van Vuuren, D.P.; Edmonds, J.; Kainuma, M.; Riahi, K.; Thomson, A.; Hibbard, K.; Hurtt, G.C.; Kram, T.; Krey, V.; Lamarque, J.-F.; et al. The Representative Concentration Pathways: An Overview. Clim. Chang. 2011, 109, 5. [Google Scholar] [CrossRef]
- Riahi, K.; Rao, S.; Krey, V.; Cho, C.; Chirkov, V.; Fischer, G.; Kindermann, G.; Nakicenovic, N.; Rafaj, P. RCP 8.5-A Scenario of Comparatively High Greenhouse Gas Emissions. Clim. Chang. 2011, 109, 33–57. [Google Scholar] [CrossRef]
- Hazeleger, W.; Wouters, B.; van Oldenborgh, G.J.; Corti, S.; Palmer, T.; Smith, D.; Dunstone, N.; Kröger, J.; Pohlmann, H.; von Storch, J.S. Predicting Multiyear North Atlantic Ocean Variability. J. Geophys. Res. Ocean. 2013, 118, 1087–1098. [Google Scholar] [CrossRef]
- Hazeleger, W.; Wang, X.; Severijns, C.; Ştefănescu, S.; Bintanja, R.; Sterl, A.; Wyser, K.; Semmler, T.; Yang, S.; van den Hurk, B.; et al. EC-Earth V2.2: Description and Validation of a New Seamless Earth System Prediction Model. Clim. Dyn. 2012, 39, 2611–2629. [Google Scholar] [CrossRef]
- Vautard, R.; Kadygrov, N.; Iles, C.; Boberg, F.; Buonomo, E.; Bülow, K.; Coppola, E.; Corre, L.; van Meijgaard, E.; Nogherotto, R.; et al. Evaluation of the Large EURO-CORDEX Regional Climate Model Ensemble. J. Geophys. Res. Atmos. 2021, 126, e2019JD032344. [Google Scholar] [CrossRef]
- Jacob, D.; Petersen, J.; Eggert, B.; Alias, A.; Christensen, O.B.; Bouwer, L.M.; Braun, A.; Colette, A.; Déqué, M.; Georgievski, G.; et al. EURO-CORDEX: New High-Resolution Climate Change Projections for European Impact Research. Reg. Environ. Chang. 2014, 14, 563–578. [Google Scholar] [CrossRef]
- Prein, A.F.; Gobiet, A.; Truhetz, H.; Keuler, K.; Goergen, K.; Teichmann, C.; Fox Maule, C.; van Meijgaard, E.; Déqué, M.; Nikulin, G.; et al. Precipitation in the EURO-CORDEX 0.11◦ and 0.44◦ Simulations: High Resolution, High Benefits. Clim. Dyn. 2016, 46, 383–412. [Google Scholar] [CrossRef]
- Cardoso, R.M.; Soares, P.M.M.; Lima, D.C.A.; Miranda, P.M.A. Mean and Extreme Temperatures in a Warming Climate: EURO CORDEX and WRF Regional Climate High-Resolution Projections for Portugal. Clim. Dyn. 2019, 52, 129–157. [Google Scholar] [CrossRef]
- Soares, P.M.M.; Cardoso, R.M.; Lima, D.C.A.; Miranda, P.M.A. Future Precipitation in Portugal: High-Resolution Projections Using WRF Model and EURO-CORDEX Multi-Model Ensembles. Clim. Dyn. 2017, 49, 2503–2530. [Google Scholar] [CrossRef]
- Coppola, E.; Nogherotto, R.; Ciarlo’, J.M.; Giorgi, F.; van Meijgaard, E.; Kadygrov, N.; Iles, C.; Corre, L.; Sandstad, M.; Somot, S.; et al. Assessment of the European Climate Projections as Simulated by the Large EURO-CORDEX Regional and Global Climate Model Ensemble. J. Geophys. Res. Atmos. 2021, 126, e2019JD032356. [Google Scholar] [CrossRef]
- Katopodis, T.; Markantonis, I.; Vlachogiannis, D.; Politi, N.; Sfetsos, A. Assessing Climate Change Impacts on Wind Characteristics in Greece through High Resolution Regional Climate Modelling. Renew. Energy 2021, 179, 427–444. [Google Scholar] [CrossRef]
- Politi, N.; Vlachogiannis, D.; Sfetsos, A.; Nastos, P.T. High Resolution Projections for Extreme Temperatures and Precipitation over Greece. Working Paper. Available online: https://www.researchsquare.com (accessed on 11 May 2022).
- Politi, N.; Vlachogiannis, D.; Sfetsos, A.; Nastos, P.T. High-Resolution Dynamical Downscaling of ERA-Interim Temperature and Precipitation Using WRF Model for Greece. Clim. Dyn. 2021, 57, 799–825. [Google Scholar] [CrossRef]
- Politi, N.; Nastos, P.T.; Sfetsos, A.; Vlachogiannis, D.; Dalezios, N.R. Evaluation of the AWR-WRF Model Configuration at High Resolution over the Domain of Greece. Atmos. Res. 2018, 208, 229–245. [Google Scholar] [CrossRef]
- Politi, N.; Sfetsos, A.; Vlachogiannis, D.; Nastos, P.T.; Karozis, S. A Sensitivity Study of High-Resolution Climate Simulations for Greece. Climate 2020, 8, 44. [Google Scholar] [CrossRef]
- Politi, N.; Nastos, P.T.; Sfetsos, A.; Vlachogiannis, D.; Dalezios, N.R.; Gounaris, N.; Cardoso, M.R.; Soares, M.M.P.; Sfetsos, Á.A.; Vlachogiannis, Á.D.; et al. Comparison and Validation of WRF Model Physics Parameterizations Over the Domain of Greece. In Proceedings of the Perspectives on Atmospheric Sciences; Springer: Cham, Switzerland, 2017; pp. 55–61. [Google Scholar]
- Katopodis, T.; Markantonis, I.; Politi, N.; Vlachogiannis, D.; Sfetsos, A. High-Resolution Solar Climate Atlas for Greece under Climate Change Using the Weather Research and Forecasting (WRF) Model. Atmosphere 2020, 11, 761. [Google Scholar] [CrossRef]
- Mckee, T.B.; Doesken, N.J.; Kleist, J. The Relationship of Drought Frequency and Duration to Time Scale. In Proceedings of the Eighth Conference on Applied Climatology, Anaheim, CA, USA, 17–22 January 1993; pp. 17–22. [Google Scholar]
- Vicente-Serrano, S.M.; Beguería, S.; López-Moreno, J.I. A Multiscalar Drought Index Sensitive to Global Warming: The Standardized Precipitation Evapotranspiration Index. J. Clim. 2010, 23, 1696–1718. [Google Scholar] [CrossRef]
- Spinoni, J.; Naumann, G.; Vogt, J. Spatial Patterns of European Droughts under a Moderate Emission Scenario. Adv. Sci. Res. 2015, 12, 179–186. [Google Scholar] [CrossRef]
- Akbari, M.; Ownegh, M.; Asgari, H.; Sadoddin, A.; Khosravi, H. Drought Monitoring Based on the SPI and RDI Indices under Climate Change Scenarios (Case Study: Semi-Arid Areas of West Golestan Province). Ecopersia 2016, 4, 1585–1602. [Google Scholar] [CrossRef]
- Jehanzaib, M.; Sattar, M.N.; Lee, J.H.; Kim, T.W. Investigating Effect of Climate Change on Drought Propagation from Meteorological to Hydrological Drought Using Multi-Model Ensemble Projections. Stoch. Environ. Res. Risk Assess. 2020, 34, 7–21. [Google Scholar] [CrossRef]
- Dukat, P.; Bednorz, E.; Ziemblińska, K.; Urbaniak, M. Trends in Drought Occurrence and Severity at Mid-Latitude European Stations (1951–2015) Estimated Using Standardized Precipitation (SPI) and Precipitation and Evapotranspiration (SPEI) Indices. Meteorol. Atmos. Phys. 2022, 134, 1–21. [Google Scholar] [CrossRef]
- Faye, C. Comparative Analysis of Meteorological Drought Based on the SPI and SPEI Indices. HighTech Innov. J. 2022, 3, 15–27. [Google Scholar] [CrossRef]
- World Meteorological Organization (WMO); Global Water Partnership (GWP). Handbook of Drought Indicators and Indices (M. Svoboda and B.A. Fuchs); Integrated Drought Management Tools and Guidelines Series 2; Integrated Drought Management Programme (IDMP): Geneva, Switzerland, 2016; ISBN 978-92-63-11173-9. [Google Scholar]
- Beguería, S.; Vicente-Serrano, S.M.; Reig, F.; Latorre, B. Standardized Precipitation Evapotranspiration Index (SPEI) Revisited: Parameter Fitting, Evapotranspiration Models, Tools, Datasets and Drought Monitoring. Int. J. Climatol. 2014, 34, 3001–3023. [Google Scholar] [CrossRef]
- Spinoni, J.; Barbosa, P.; de Jager, A.; McCormick, N.; Naumann, G.; Vogt, J.V.; Magni, D.; Masante, D.; Mazzeschi, M. A New Global Database of Meteorological Drought Events from 1951 to 2016. J. Hydrol. Reg. Stud. 2019, 22, 100593. [Google Scholar] [CrossRef] [PubMed]
- Hargreaves, G.H.; Samani, Z.A. Reference Crop Evapotranspiration from Temperature. Appl. Eng. Agric. 1985, 1, 96–99. [Google Scholar] [CrossRef]
- Vangelis, H.; Spiliotis, M.; Tsakiris, G.; Vangelis, H.; Tsakiris, G. Drought Severity Assessment Based on Bivariate Probability Analysis. Water Resour. Manag. 2011, 25, 357–371. [Google Scholar] [CrossRef]
- Vicente-Serrano, S.M.; López-Moreno, J.I.; Drumond, A.; Gimeno, L.; Nieto, R.; Morán-Tejeda, E.; Lorenzo-Lacruz, J.; Beguería, S.; Zabalza, J. Effects of Warming Processes on Droughts and Water Resources in the NW Iberian—Peninsula (1930−2006). Clim. Res. 2011, 48, 203–212. [Google Scholar] [CrossRef]
- Karavitis, C.A.; Tsesmelis, D.E.; Skondras, N.A.; Stamatakos, D.; Alexandris, S.; Fassouli, V.; Vasilakou, C.G.; Oikonomou, P.D.; Gregorič, G.; Grigg, N.S.; et al. Linking Drought Characteristics to Impacts on a Spatial and Temporal Scale. Water Policy 2014, 16, 1172–1197. [Google Scholar] [CrossRef]
- Oikonomou, P.D.; Tsesmelis, D.E.; Waskom, R.M.; Grigg, N.S.; Karavitis, C.A. Enhancing the Standardized Drought Vulnerability Index by Integrating Spatiotemporal Information from Satellite and in Situ Data. J. Hydrol. 2019, 569, 265–277. [Google Scholar] [CrossRef]
- Stagge, J.H.; Kingston, D.G.; Tallaksen, L.M.; Hannah, D.M. Observed Drought Indices Show Increasing Divergence across Europe. Sci. Rep. 2017, 7, 14045. [Google Scholar] [CrossRef]
- Tsesmelis, D.E.; Oikonomou, P.D.; Vasilakou, C.G.; Skondras, N.A.; Fassouli, V.; Alexandris, S.G.; Grigg, N.S.; Karavitis, C.A. Assessing Structural Uncertainty Caused by Different Weighting Methods on the Standardized Drought Vulnerability Index (SDVI). Stoch. Environ. Res. Risk Assess. 2019, 33, 515–533. [Google Scholar] [CrossRef]
- Copernicus European Drought Observatory (EDO). Standardized Precipitation Index (SPI). Available online: https://edo.jrc.ec.europa.eu/documents/factsheets/factsheet_spi.pdf (accessed on 24 August 2022).
- Hay, L.E.; Wilby, R.L.; Leavesley, G.H. A Comparison of Delta Change and Downscaled GCM Scenarios for Three Mountainous Basins in the United States. JAWRA J. Am. Water Resour. Assoc. 2000, 36, 387–397. [Google Scholar] [CrossRef]
- Loukas, A.; Vasiliades, L. Probabilistic Analysis of Drought Spatiotemporal Characteristics in Thessaly Region, Greece. Nat. Hazards Earth Syst. Sci. 2004, 4, 719–731. [Google Scholar] [CrossRef]
- Vlachogiannis, D.; Sfetsos, A.; Markantonis, I.; Politi, N.; Karozis, S.; Gounaris, N. Quantifying the Occur-rence of Multi-Hazards Due to Climate Change. Appl. Sci. 2022, 12, 1218. [Google Scholar] [CrossRef]
- Chang, E.K.M.; Ma, C.-G.; Zheng, C.; Yau, A.M.W. Observed and Projected Decrease in Northern Hemisphere Extratropical Cyclone Activity in Summer and Its Impacts on Maximum Temperature. Geophys. Res. Lett. 2016, 43, 2200–2208. [Google Scholar] [CrossRef]
- Heim, R.R. A Review of Twentieth-Century Drought Indices Used in the United States. Bull. Am. Meteorol. Soc. 2002, 83, 1149–1166. [Google Scholar] [CrossRef]
- Karozis, S.; Sfetsos, A.; Gounaris, N.; Vlachogiannis, D. An Assessment of Climate Change Impact on Air Masses Arriving in Athens, Greece. Theor. Appl. Climatol. 2021, 145, 501–517. [Google Scholar] [CrossRef]
- Zerefos, C.S.; Repapis, C.; Giannakopoulos, C.; Kapsomenakis, J.; Papanikolaou, D.; Papanikolaou, M.; Poulos, S.; Vrekoussis, M.; Philandras, C.; Tselioudis, G.; et al. The Climate of the Eastern Mediterranean and Greece: Past, Present and Future. Environ. Econ. Soc. Impacts Clim. Chang. Greece 2011, 1–126. [Google Scholar]
- Kourgialas, N.N. A Critical Review of Water Resources in Greece: The Key Role of Agricultural Adaptation to Climate-Water Effects. Sci. Total Environ. 2021, 775, 145857. [Google Scholar] [CrossRef]
- Kairis, O.; Karamanos, A.; Voloudakis, D.; Kapsomenakis, J.; Aratzioglou, C.; Zerefos, C.; Kosmas, C. Identifying Degraded and Sensitive to Desertification Agricultural Soils in Thessaly, Greece, under Simulated Future Climate Scenarios. Land 2022, 11, 395. [Google Scholar] [CrossRef]
- Ault, T.R.; Mankin, J.S.; Cook, B.I.; Smerdon, J.E. Relative Impacts of Mitigation, Temperature, and Precipitation on 21st-Century Megadrought Risk in the American Southwest. Sci. Adv. 2016, 2, e1600873. [Google Scholar] [CrossRef]
- Brogli, R.; Gauthier, S.; Keane, C.J.; Niemela, J.J.; Lund Sørland, S.; Kröner, N.; Schär, C. Causes of Future Mediterranean Precipitation Decline Depend on the Season. Environ. Res. Lett. 2019, 14, 114017. [Google Scholar] [CrossRef]
- Sillmann, J.; Kharin, V.V.; Zhang, X.; Zwiers, F.W.; Bronaugh, D. Climate Extremes Indices in the CMIP5 Multimodel Ensemble: Part 1. Model Evaluation in the Present Climate. J. Geophys. Res. Atmos. 2013, 118, 1716–1733. [Google Scholar] [CrossRef]
- García-Valdecasas Ojeda, M.; Gámiz-Fortis, S.R.; Castro-Díez, Y.; Esteban-Parra, M.J. Evaluation of WRF Capability to Detect Dry and Wet Periods in Spain Using Drought Indices. J. Geophys. Res. Atmos. 2017, 122, 1569–1594. [Google Scholar] [CrossRef]
- Guerreiro, S.B.; Dawson, R.J.; Kilsby, C.; Lewis, E.; Ford, A. Future Heat-Waves, Droughts and Floods in 571 European Cities. Environ. Res. Lett. 2018, 13, 034009. [Google Scholar] [CrossRef]
- Sordo-Ward, A.; Bejarano, M.D.; Iglesias, A.; Asenjo, V.; Garrote, L. Analysis of Current and Future SPEI Droughts in the La Plata Basin Based on Results from the Regional Eta Climate Model. Water 2017, 9, 857. [Google Scholar] [CrossRef]


Publisher’s Note: MDPI stays neutral with regard to jurisdictional claims in published maps and institutional affiliations. |
© 2022 by the authors. Licensee MDPI, Basel, Switzerland. This article is an open access article distributed under the terms and conditions of the Creative Commons Attribution (CC BY) license (https://creativecommons.org/licenses/by/4.0/).
Share and Cite
Politi, N.; Vlachogiannis, D.; Sfetsos, A.; Nastos, P.T.; Dalezios, N.R. High Resolution Future Projections of Drought Characteristics in Greece Based on SPI and SPEI Indices. Atmosphere 2022, 13, 1468. https://doi.org/10.3390/atmos13091468
Politi N, Vlachogiannis D, Sfetsos A, Nastos PT, Dalezios NR. High Resolution Future Projections of Drought Characteristics in Greece Based on SPI and SPEI Indices. Atmosphere. 2022; 13(9):1468. https://doi.org/10.3390/atmos13091468
Chicago/Turabian StylePoliti, Nadia, Diamando Vlachogiannis, Athanasios Sfetsos, Panagiotis T. Nastos, and Nicolas R. Dalezios. 2022. "High Resolution Future Projections of Drought Characteristics in Greece Based on SPI and SPEI Indices" Atmosphere 13, no. 9: 1468. https://doi.org/10.3390/atmos13091468
APA StylePoliti, N., Vlachogiannis, D., Sfetsos, A., Nastos, P. T., & Dalezios, N. R. (2022). High Resolution Future Projections of Drought Characteristics in Greece Based on SPI and SPEI Indices. Atmosphere, 13(9), 1468. https://doi.org/10.3390/atmos13091468