1. Introduction
In the context of global warming, in recent decades, the frequency and intensity of extreme precipitation in semi-arid regions have changed significantly with large spatial differences [
1,
2]. It is well known that precipitation in semi-arid regions occurs rarely and that the frequency of extreme precipitation is less than that in humid regions [
3]. Nevertheless, interannual variations of extreme precipitation in semi-arid regions are spatially uneven and the heavy rainfall period is relatively concentrated [
4,
5,
6]. In semi-arid regions, the vegetation cover fraction is generally low, and the geological environment is frail [
7]. As a result, extreme precipitation is very likely to cause disasters, such as floods, debris flows and landslides. Improving the ability of models to simulate and predict extreme precipitation in semi-arid regions is crucial for disaster prevention.
A deep understanding of the mechanisms linked to extreme precipitation occurrence is the basis for parameterization improvements in the description of extreme precipitation physical processes (e.g., convection, condensation and the phase conversion of water vapor) in semi-arid regions. Large-scale circulation, atmospheric instability and water vapor transport are important factors that affect the occurrence of extreme precipitation in semi-arid regions [
8,
9,
10]. A factor limiting the occurrence of precipitation is the presence of water vapor in semi-arid regions, due to the distance from the ocean [
3]. The process of extreme precipitation occurrence in semi-arid regions with respect to water vapor has attracted much attention [
11,
12,
13,
14,
15,
16]. In the early 1960s, studies analyzing the water vapor sources of summer precipitation in Xinjiang, in the northwest of China [
11], indicated that water vapor in the southeastern part of Xinjiang originated from the Sichuan Basin [
12], while water vapor in northern Xinjiang originated from central Asia [
13]. Some studies have suggested that the precipitation in the eastern part of northwest China is controlled by a low trough over mid-latitudes, and that the water vapor in Ningxia and Qinghai originates from the Bay of Bengal and the southeastern coast of China [
14,
15]. For inland arid regions, such as the Hexi corridor in northwest China, the water vapor mainly comes from precipitation recycling and the melting of snow and ice in high mountainous areas [
16]. The source of water vapor is closely related to the large-scale atmospheric circulation, which is influenced by diabatic heating, synoptic processes, etc. Thus, analysis of the link between water vapor sources and large-scale atmospheric circulation is important for a deeper understanding of the mechanisms underpinning extreme precipitation occurrence.
Numerical models are important tools for simulating and forecasting extreme precipitation. With developments in parameterizations, numerical models’ capability to simulate precipitation in semi-arid regions has been greatly improved [
17,
18]. However, due to the anomalous nature of extreme precipitation, flaws in precipitation simulation in semi-arid regions remain. For example, the occurrence of rainstorms is accompanied by strong convection and precipitation simulation is sensitive to the choice of cumulus parameterization schemes [
19]. High horizontal resolution of models is beneficial for reducing simulation biases, but scale adaptation of cumulus parameterization schemes is difficult due to tradeoffs. Therefore, choice of a scale-adapted cumulus parameterization scheme is key for high resolution simulations of precipitation. Previous studies indicated that, if the model can describe the convective process with a horizontal resolution below 4 km, then a cumulus parameterization scheme might be omitted [
20]. Some studies have also indicated that a horizontal resolution below 20 m is required to fully resolve the entrainment process in convection [
21]. A horizontal resolution of 1~5 km in the model is called the “gray zone” of cumulus parameterization; the cumulus parameterization scheme often needs to be improved and adjusted to adapt to horizontal resolutions [
22]. The adjustment of a cumulus parameterization scheme according to the model’s resolution can help to improve a model’s ability to simulate precipitation [
23]. Studies have shown that a scale-adapted KF scheme and the new Tiedtke scheme can better reproduce the diurnal variation of precipitation and reduce occurrence of spurious precipitation [
24].
Precipitation in semi-arid regions is affected by factors such as topography, large-scale atmospheric circulation, water vapor conditions and land surface processes (e.g., soil temperature and moisture) [
3,
8,
9,
10]. Statistics show that about 80% of the precipitation in semi-arid region occurs from May to September [
25]. The duration is short and the rainfall is concentrated. In the context of climate change, the characteristics of extreme precipitation in semi-arid regions have changed [
3]. For example, while extreme precipitation in northwest China increased during 1961–2010, and abrupt changes in extreme precipitation days occurred in the 1980s and 2000s [
26], the physical mechanism of extreme precipitation occurrence is likely to be different. How well numerical models simulate the occurrence of extreme precipitation in recent years should be investigated. This study focuses on the following questions: What are the impacts of different cumulus parameterization schemes on extreme precipitation simulation in semi-arid regions? What are the possible determinants of the performance of numerical models with different cumulus parameterizations?
In view of the above questions, based on the WRF (weather research and forecasting) model, this study examined a rainstorm event that occurred on 21 July 2019, in Qingyang (hereafter referred to as the “7.21” rainstorm event) located over a semi-arid region. Numerical simulations to analyze the influence of different cumulus parameterization schemes on precipitation simulations, and to explore the possible causes of precipitation simulation deviations in semi-arid regions, were performed. The paper is organized as follows:
Section 2 introduces the data and methods used in this study. The characteristics of precipitation and atmospheric circulation are analyzed in
Section 3. The influence of cumulus parameterization schemes on precipitation simulations is discussed in
Section 4. Possible causes of precipitation simulation deviations are explored in
Section 5. Conclusions and further discussions are provided in
Section 6.
3. Characteristics of Precipitation and Atmospheric Circulation in “7.21” Rainstorm
“Semi-arid regions” generally refers to regions with an annual precipitation of 200~500 mm. The 200 mm precipitation isoline in China ranges from the western part of Inner Mongolia through Ningxia and Gansu to the Tibetan Plateau (TP), and the 500 mm precipitation isoline ranges from northeast China to the southern Gansu. In the north and northeast sides of the TP, the entire semi-arid region is distributed as a northeast-southwest belt. Extreme precipitation in semi-arid regions mainly occurs in the summer half-year, especially in July and August. Although the frequency of extreme rainstorms in semi-arid regions is relatively low, the proportion of extreme precipitation to annual precipitation is larger than that of the southeastern coastal regions of China (wet regions). Extreme precipitation in Gansu often occurs in the western regions of the Loess Plateau, and generally has obvious convective characteristics.
To analyze summer extreme precipitation in a semi-arid region with topographic inequality, the “7.21” rainstorm event with 24-h precipitation up to 30% of the annual precipitation, which occurred from the afternoon to the night of 21 July 2019 in Qingyang city, located on the eastern side of TP and the western Loess Plateau, was selected,. As shown in
Figure 1, during this rainstorm event, the precipitation quantity was relatively large, and the precipitation intensity was strong. The maximum precipitation quantity in 24 h reached 115 mm. The period with maximum precipitation occurred at 22:00 on the 21 July (UTC+8), and the maximum precipitation quantity at the Qingcheng Station in Qingyang reached 60.2 mm in one hour.
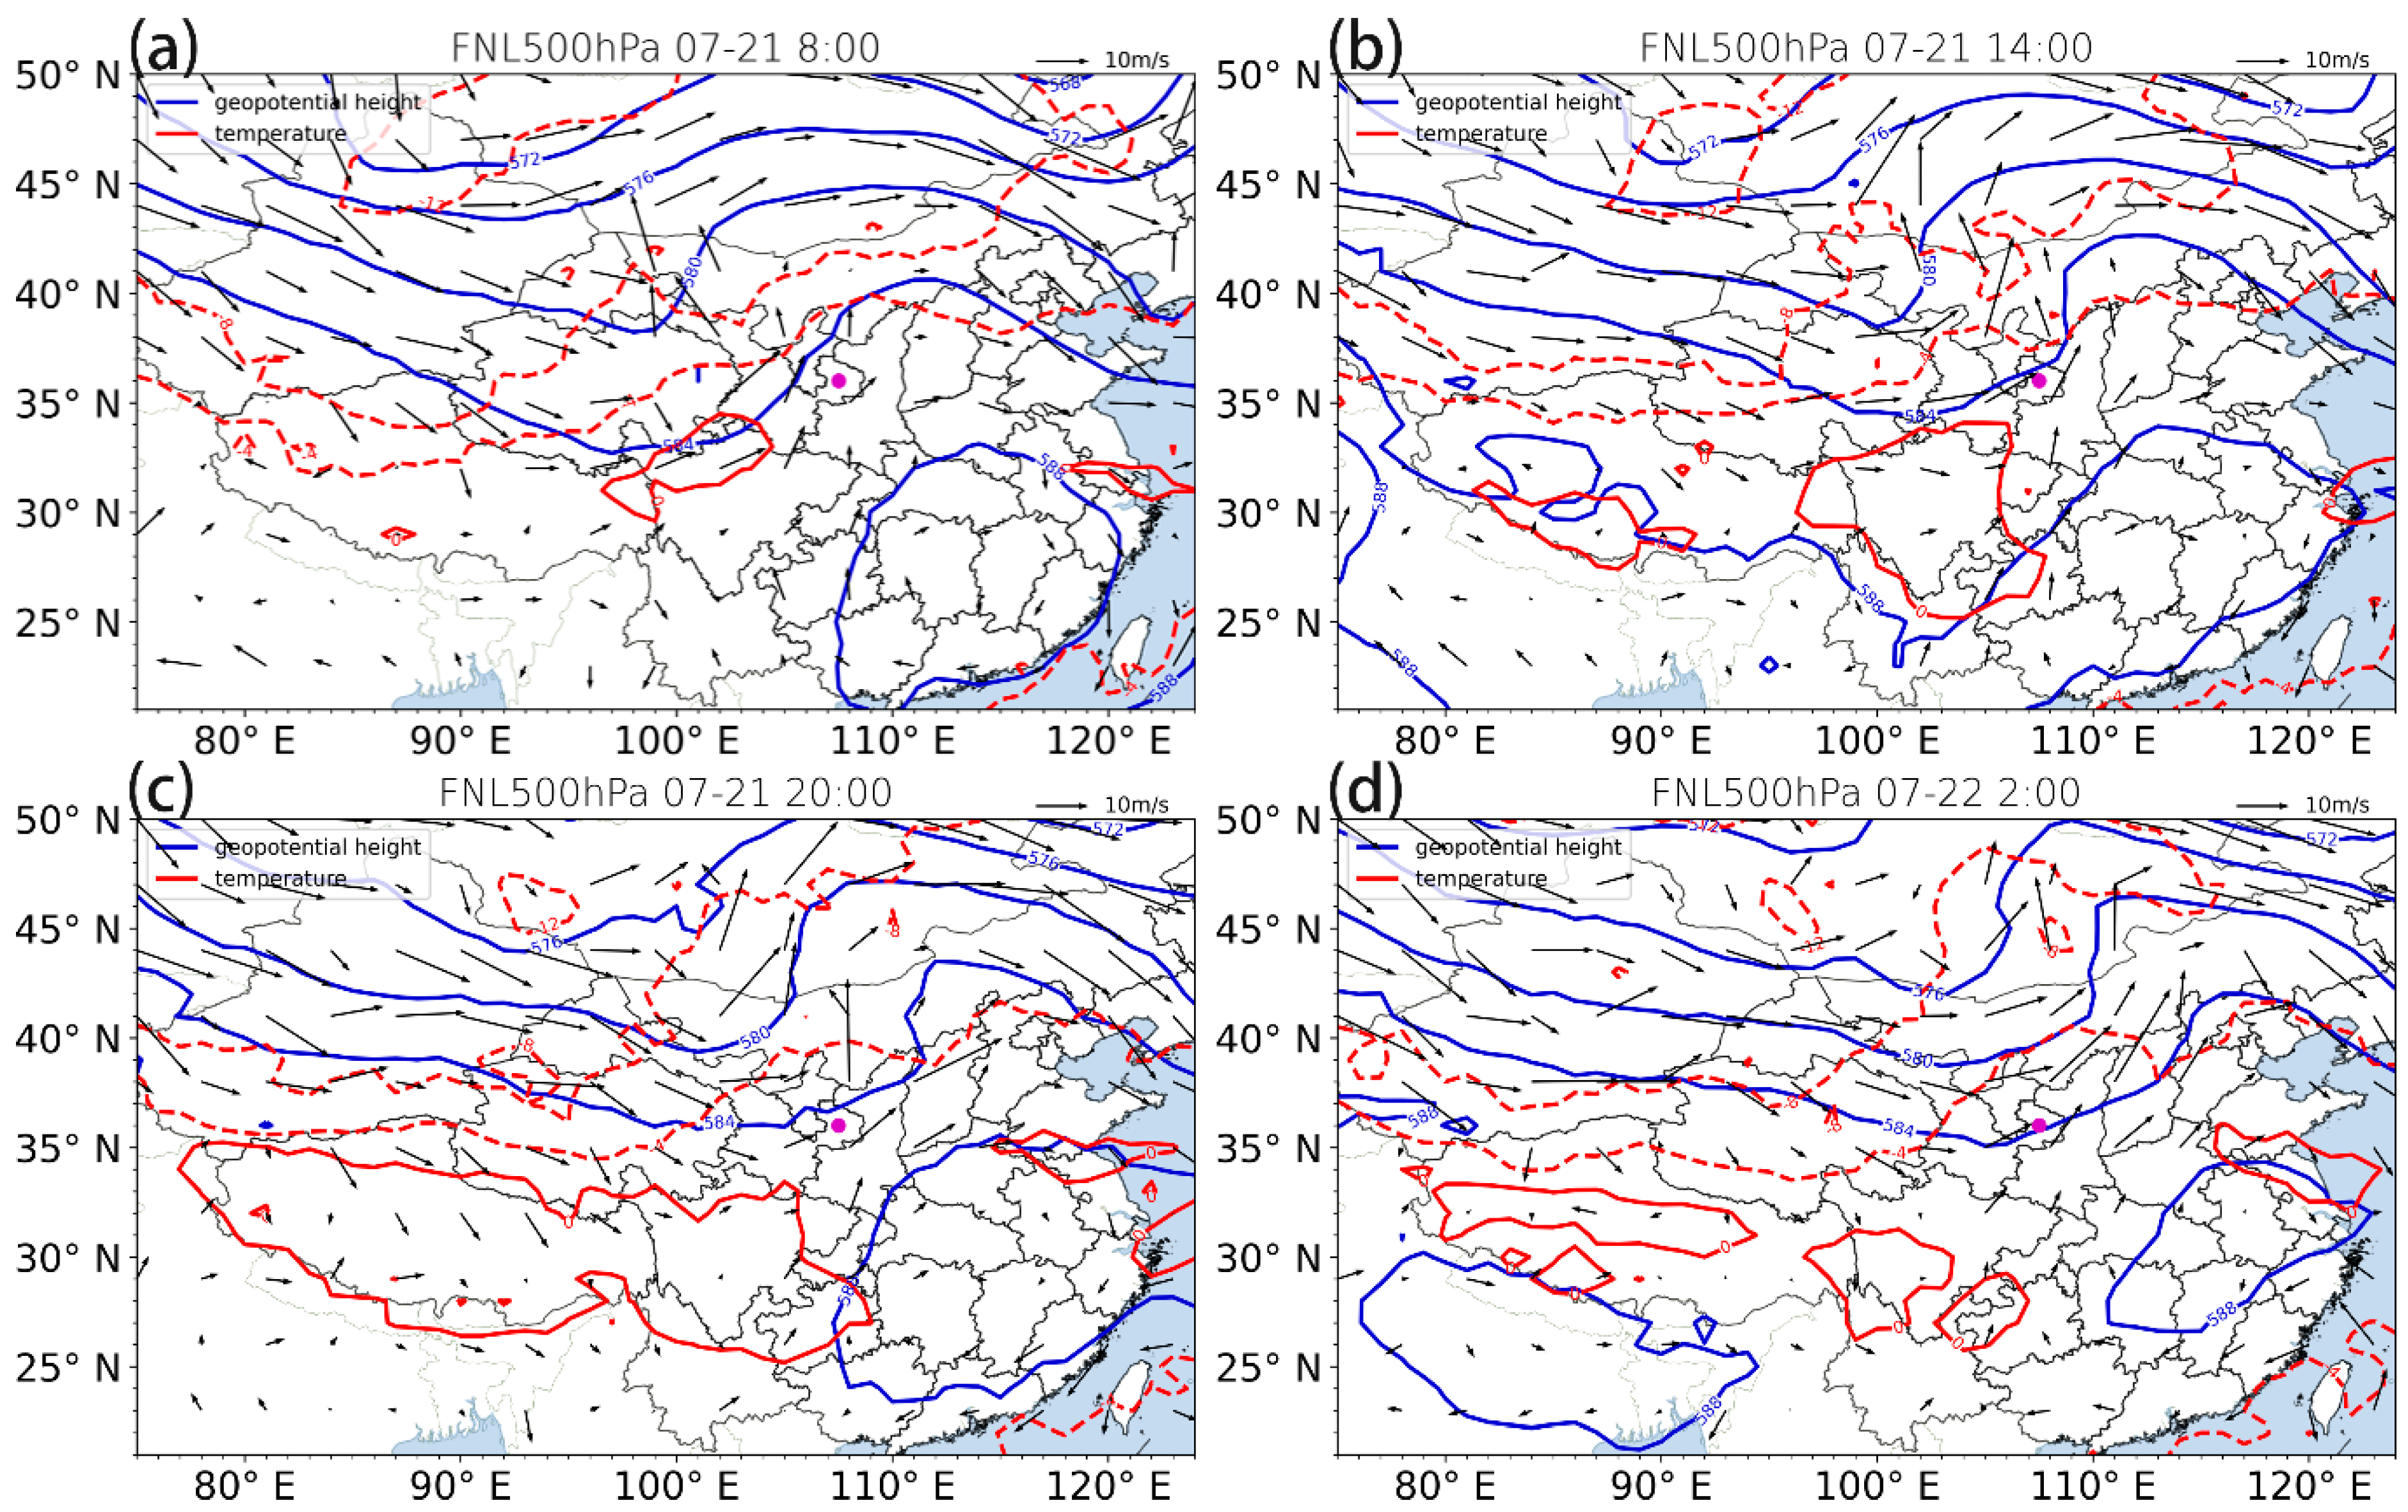
To analyze the atmospheric circulation characteristics of the “7.21” rainstorm event,
Figure 2 shows the 500 hPa geopotential height field at 08:00, 14:00 and 20:00 on 21 July and 2:00 on 22 July (UTC+8). It can be seen that a trough occurred in the middle and high latitudes of east Asia, with Qingyang located in the front of the trough. At 08:00 on 21 July (UTC+8), the trough line was located on the west side of the Mongolian Plateau; there was warm advection in front of the trough. The 500 hPa horizontal wind over Qingyang was dominated by southwesters, which benefitted the warm and humid airflow transported from the south to Qingyang. From 08:00 on 21 July to 02:00 on 22 July (UTC+8), the trough moved eastwards (
Figure 2c,d).
4. Impacts of Cumulus Parameterization Schemes on Precipitation Simulations
The above results show that this rainstorm event was accompanied by a trough in the middle and high latitudes of east Asia, which influenced the water vapor transport and location and intensified precipitation; along with the development of precipitation, there was obvious convection (Figure 7d; analysis in the following section). Whether the WRF can reproduce the characteristics of precipitation and large-scale atmospheric circulations during the rainstorm event in semi-arid regions is analyzed below. First, a comparison of precipitation simulations is provided; then possible causes linked to the impacts of cumulus parameterizations on extreme precipitation simulations are discussed.
4.1. Design of Experiments
Compared to convection processes in wet regions, convection in rainstorms in semi-arid regions is relatively weak and the cloud-top height is relatively high [
29]. Currently, WRF models provide several cumulus parameterization schemes. The most commonly used schemes include the Kain–Fritsch (KF) and Grell–Devenyi (GD) approaches. The KF scheme is a deep and shallow convection sub-grid scheme using a mass flux approach with downdrafts and a CAPE removal time scale. The KF scheme considers the minimum involvement rate to suppress the large-scale convection in the marginal unstable and dry environment; shallow convection is considered for the updraft that cannot reach the minimum precipitation cloud thickness and the minimum precipitation cloud thickness varies with the temperature at the cloud base [
30]. The GD scheme is an integrated cumulus scheme which provides a quantitative assessment of the parameters of entrainment and detrainment and the precipitation rate caused by different airflows in the convective process. The cloud mass flux is controlled by both static and dynamic conditions, and the dynamic control is determined by the convective available potential energy, the vertical velocity at low level and the water vapor convergence. The BW (Bullock–Wang) scheme developed by Wang et al. [
22] is a revised KF scheme, which proposes a new convective adjustment time-scale and considers the convective cloud’s radius for convection with the depth of shallow clouds. Focusing on the characteristics of convection, three experiments were designed, based on WRF-ARW v4.3 with the KF, GD and BW cumulus parameterization schemes, to validate the capability and compare the performance of different cumulus parameterization schemes on simulations of rainstorm in semi-arid regions,.
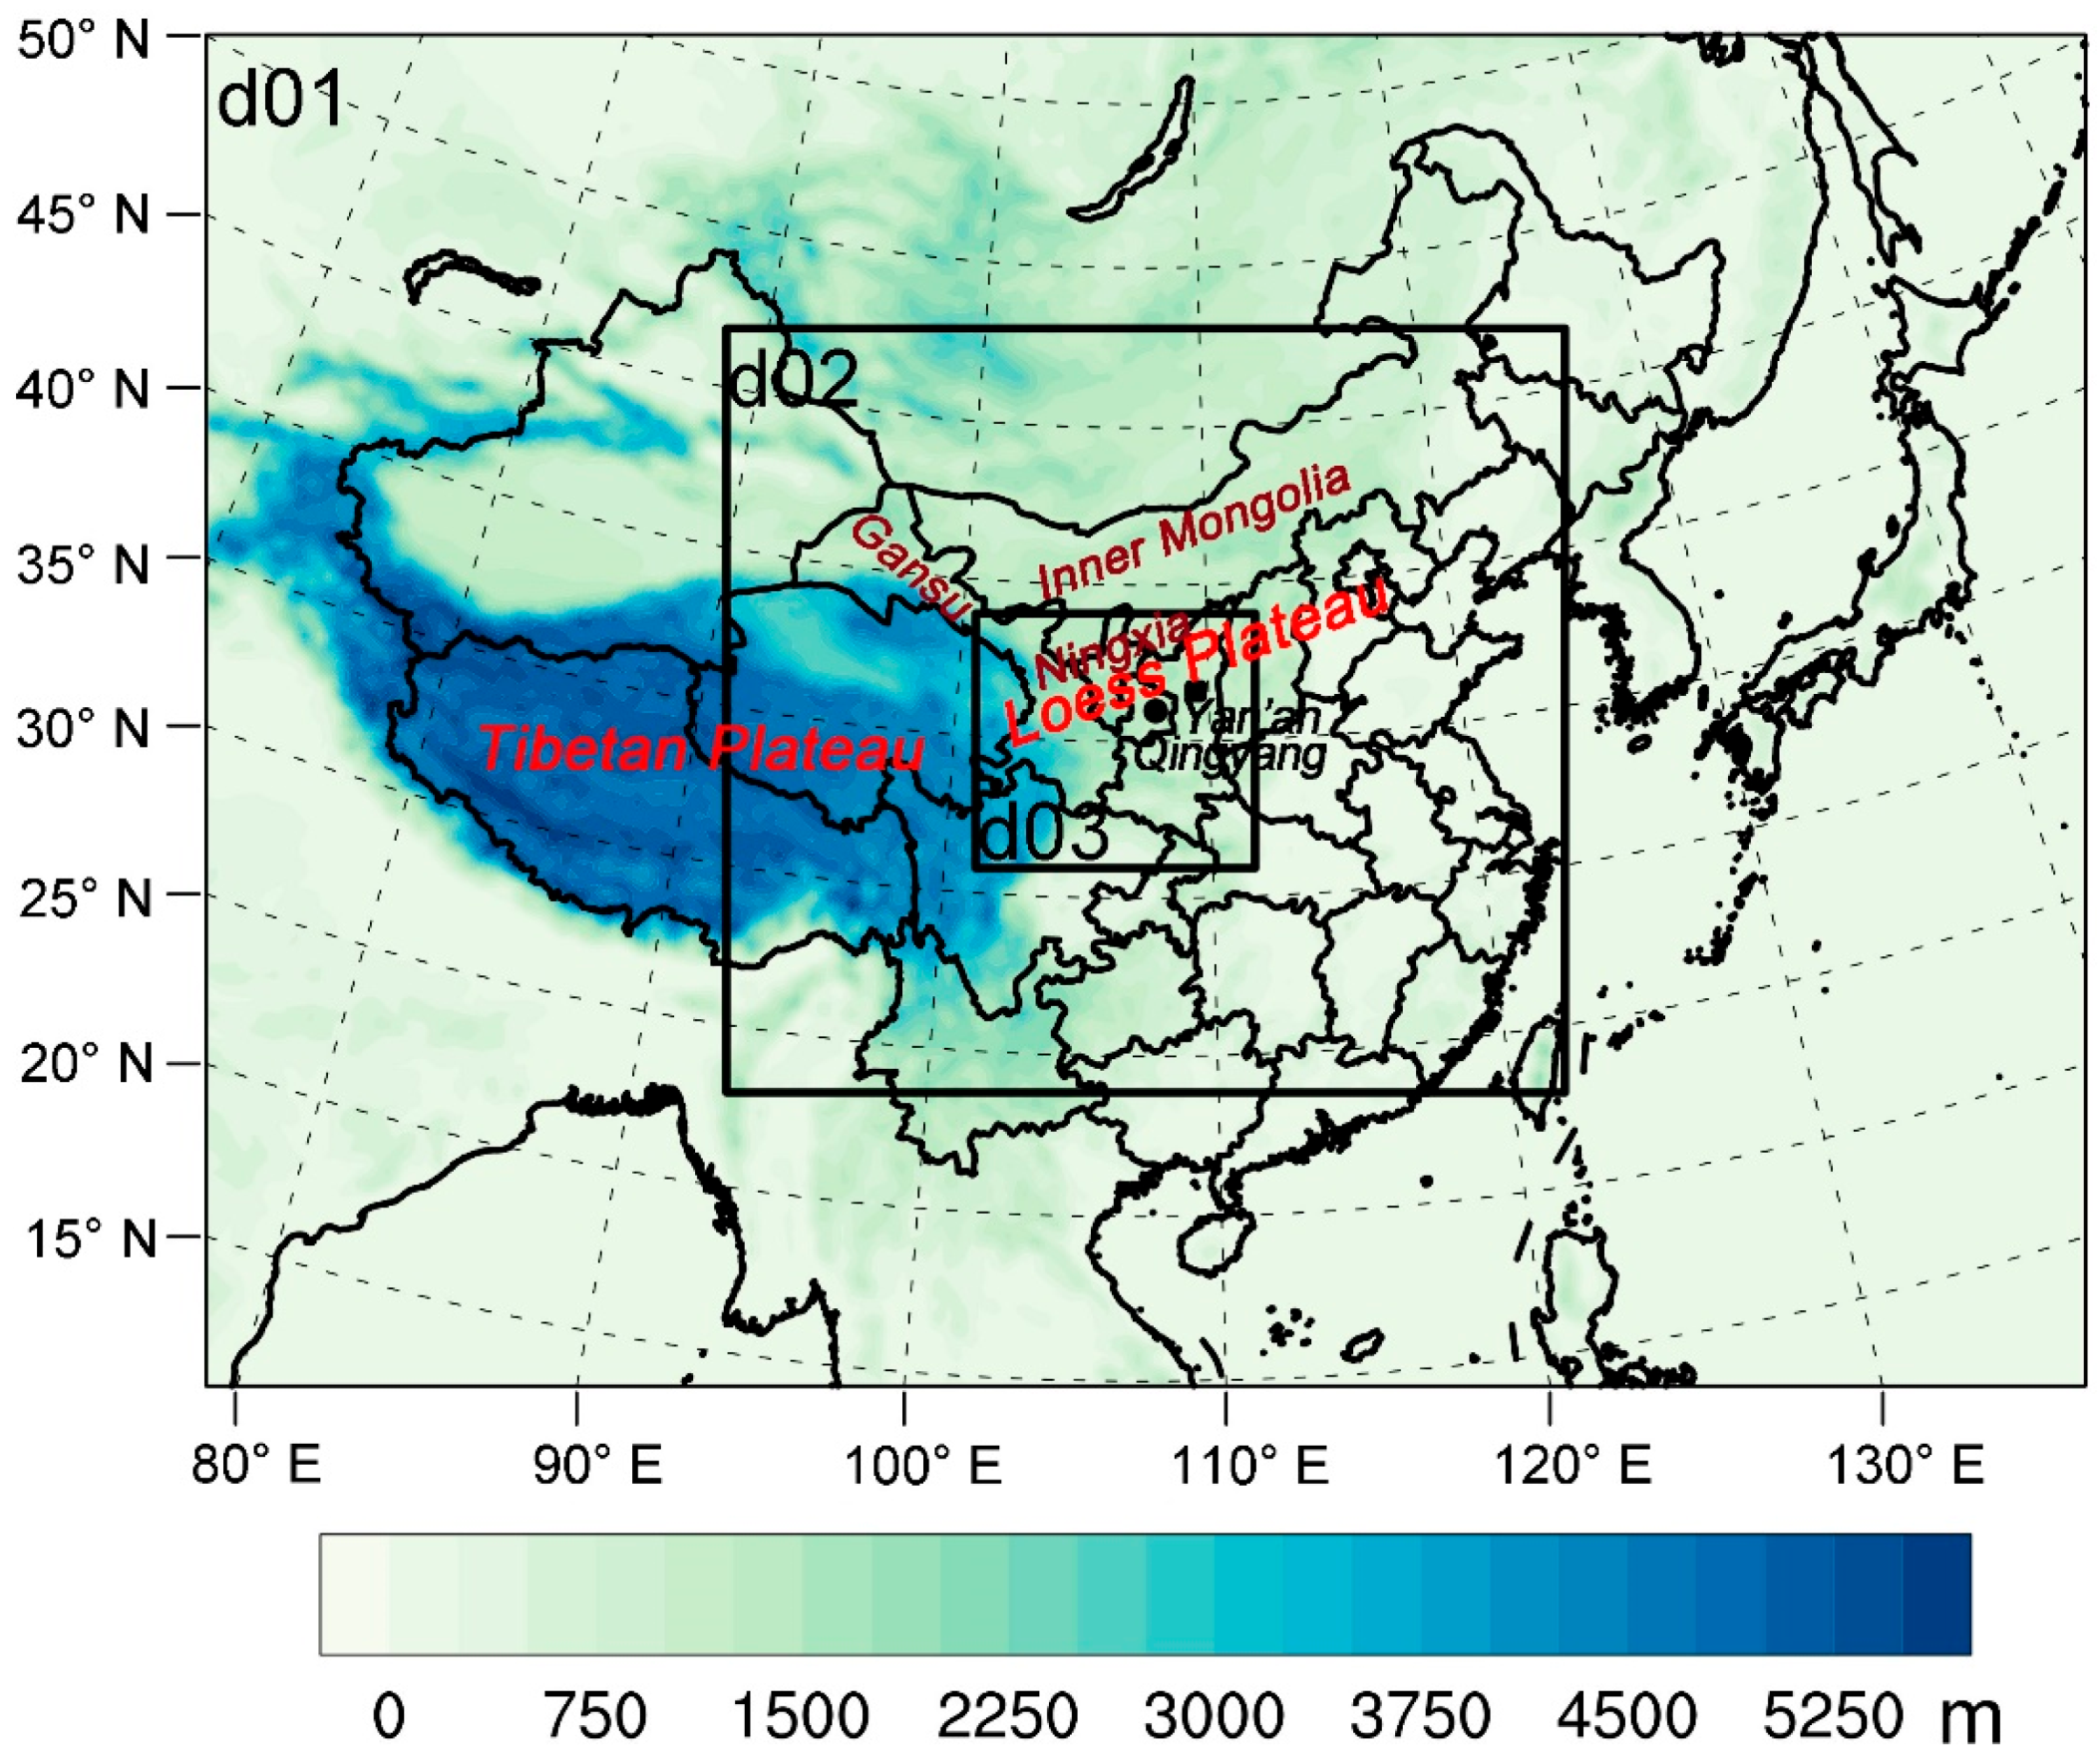
All experiments were conducted over the triple-nesting domains (as shown in
Figure 3). The domain center was located near Qingyang (36° N, 107.5° E), the grid resolutions of d01, d02 and d02 were 27 km, 9 km and 3 km, respectively, and the corresponding grid points were 250 × 180, 334 × 304 and 406 × 376, respectively. The vertical direction of the model was 34 layers, the time integration step was 30 s, the initial and boundary fields used FNL global analysis data, and the simulation period was from 12:00 on 20 July to 12:00 on 23 July 2019 (UTC+8). Except for the cumulus parameterization, the other parameterization schemes and model setting were the same for all three experiments. The main physical parameterization schemes included the Double-Moment 6-class scheme for microphysics, the Yonsei University scheme for the planetary boundary layer, the revised MM5 surface layer scheme and the Noah land surface model.
4.2. Evaluation of Precipitation Simulation
To analyze the performances of the WRF model with different cumulus parameterization schemes on precipitation simulation in the rainstorm event,
Figure 4 shows the distribution of the observed and simulated precipitation during the rainstorm occurrence main period from 21:00 to 23:00 on 21 July (UTC+8). Compared to observations, the WRF simulations with three cumulus parameterization schemes essentially reproduced the distribution of precipitation. However, the WRF simulations generated strong spurious precipitation in the south sides of Qingyang, and the location of the simulated precipitation belt was to the west compared with observations.
Comparing the precipitation simulated by each of the three cumulus parameterization schemes, the precipitation area simulated by the KF scheme was concentrated over Qingyang, the location and structure of the precipitation belt were the closest to the observations, and the spurious precipitation to the south of Qingyang was less compared to the simulations with the GD and BW schemes. The observed precipitation reached a maximum at 22:00 on 21 July (UTC+8) (
Figure 4b). The maximum precipitation center simulated with the KF scheme was close to the observation (
Figure 4e), while the location of the maximum precipitation center simulated with the GD scheme was to the north side of Qingyang, with strong spurious precipitation on the north side of Qingyang (
Figure 4h). The simulated precipitation amount with the GD scheme at 23:00 on 21 July (UTC+8) was larger than that at 22:00 on 21 July (UTC+8), which means that the GD scheme failed to reproduce the evolution of precipitation in this rainstorm event. The maximum precipitation center simulated with the BW scheme was slightly westward, and the simulated precipitation area and intensity (
Figure 4k) were smaller than that simulated with the KF scheme. Overall, the performance of WRF with the KF scheme in simulating precipitation during the rainstorm event which occurred in a semi-arid region was better than for the GD and BW schemes.
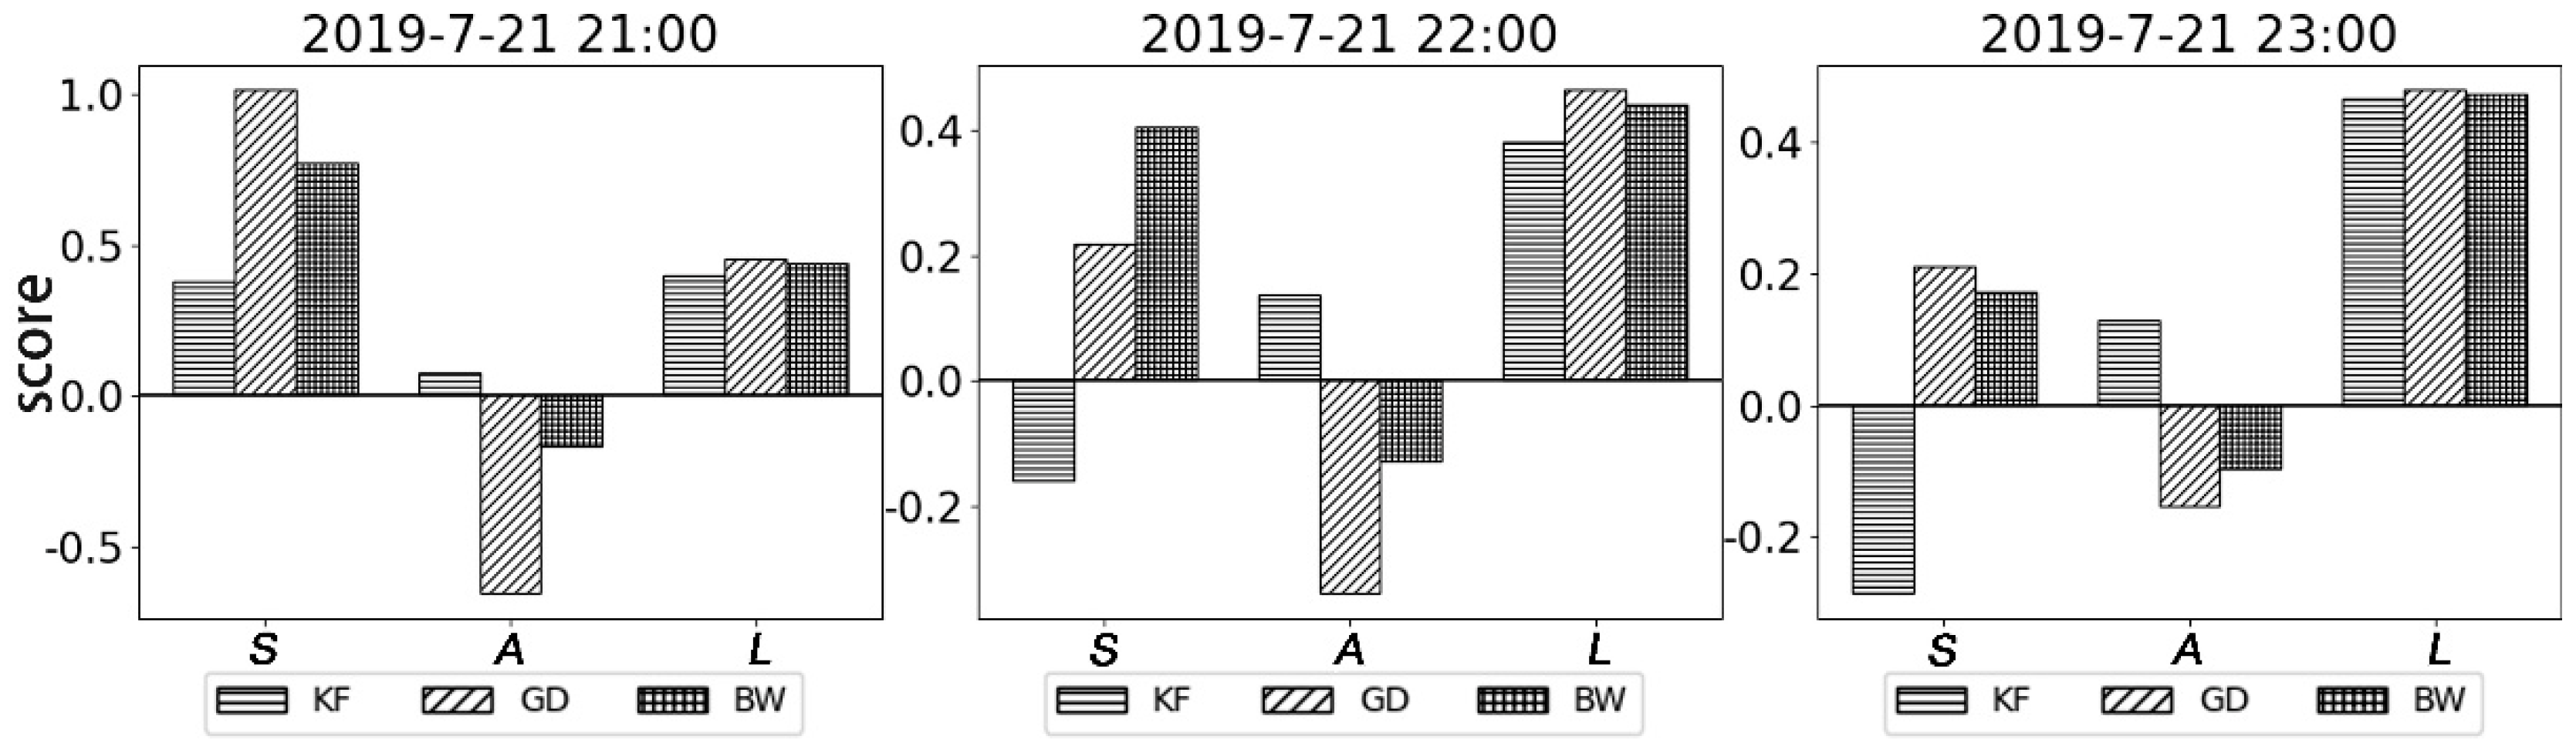
To further objectively evaluate the simulations with three cumulus parameterization schemes, this study used the
SAL method for scoring (
Figure 5). For the structure component
S of simulated precipitation, the WRF simulation with three cumulus parameterization schemes produced positive scores at 21:00 on 21 July (UTC+8); among them, the structure score
S for the KF scheme was the smallest, while the GD scheme produced the largest score value. The structure score
S for simulated precipitation at 22:00 and 23:00 on 21 July (UTC+8) with the KF scheme was negative—this might have been because the precipitation area simulated by the KF scheme was slightly larger than that for the observations—while the structure scores for the GD and BW schemes were positive. Comparing the absolute values of structural scores among the three cumulus parameterization schemes, the simulations with the KF scheme were generally better.
The simulations with the three cumulus parameterization schemes showed obvious differences in the amplitude component A. The value of A for precipitation simulated with the KF schemes at 21:00 on 21 July (UTC+8) was positive, while the amplitude component A for precipitation simulated with the GD scheme was largely negative, and the amplitude component A of the BW scheme was also negative, but larger than that of the GD scheme. Comparing their absolute values, the WRF simulations with the KF scheme performed better for precipitation intensity than the other two schemes, which could also be seen at 22:00 on 21 July (UTC+8).
The location component scores (L) of the simulated precipitation with three cumulus parameterization schemes were positive at 21:00, 22:00 and 23:00 on 21 July (UTC+8); the values of L were near 0.4. Based on the position scores, the KF scheme was slightly better than the other two schemes.
Combining the three components of SAL, simulation with the KF scheme showed better performance in simulating the precipitation structure and intensity than the other two schemes, especially during the period of maximum precipitation (21:00 and 22:00 on 21 July, UTC+8), while the BW scheme, which was revised based on the KF scheme for the adjustment time-scale and the convective cloud radius, had larger biases than those of the KF scheme. The BW scheme requires further revision to be suitable for the simulation of extreme precipitation in semi-arid regions.
5. Possible Causes of Precipitation Biases Simulated with Different Cumulus Parameterization Schemes
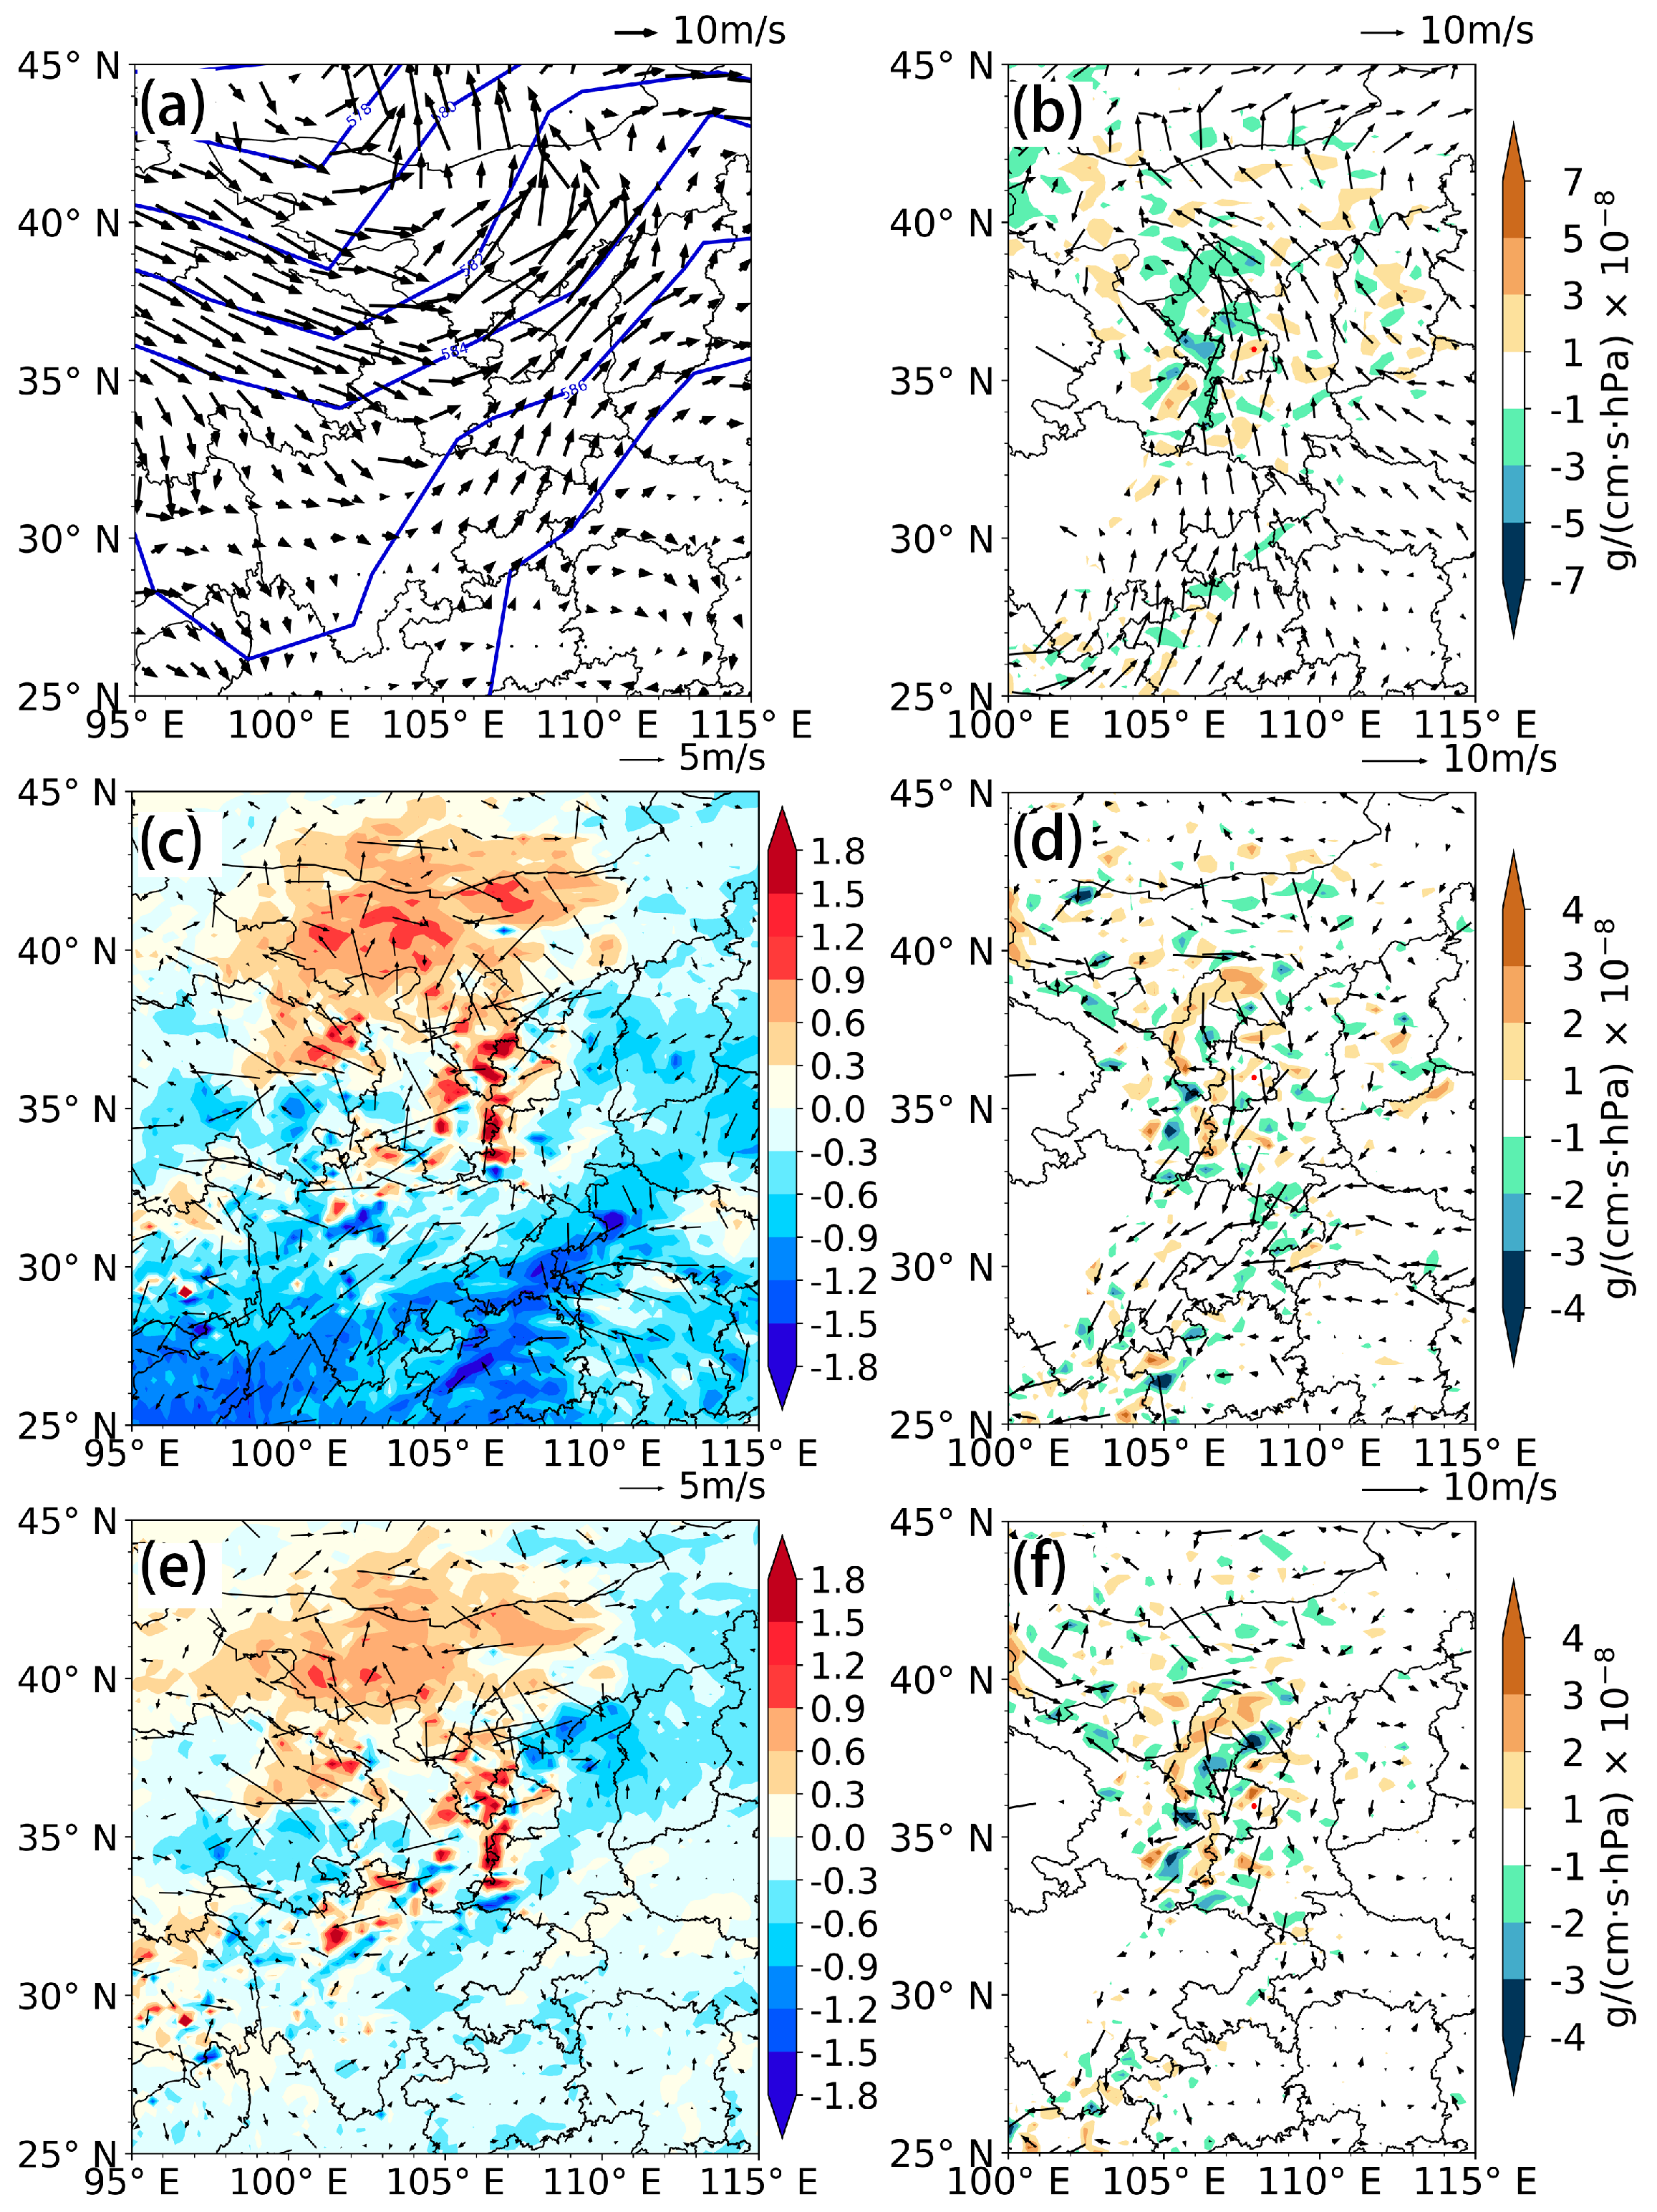
To analyze the possible causes of the differences in precipitation simulations and deviations by WRF with the three cumulus parameterization schemes,
Figure 6 shows the 500 hPa fields for simulated geopotential height, horizontal wind and the differences between the KF scheme and the GD and BW schemes at 20:00 on 21 July. The WRF model was able to reproduce the characteristics of atmospheric circulation at 20:00 on 21 July (UTC+8). There was a low trough over northern China at 500 hPa, and Qingyang was located in front of the trough (
Figure 6a), which is generally consistent with the FNL reanalysis (
Figure 2c). The southwest airflow in front of the trough was able to transport water vapor from the southern region to Qingyang, the water vapor over Qingyang showing convergence (
Figure 6b), which provided abundant water vapor conditions for the occurrence and enhancement of precipitation at 22:00 on 21 July (UTC+8). Since the KF scheme effectively reproduced the 500 hPa atmospheric circulation in the rainstorm event, precipitation simulation by the KF scheme was closest to observations among the three cumulus parameterization schemes.
Compared to the simulations with the KF scheme, the 500 hPa geopotential heights simulated by the GD and BW schemes were larger in the region from Inner Mongolia to Qingyang (
Figure 6c,e), which means that the low trough over northern China simulated by each of the two schemes was weaker than that of the KF scheme. The differences in horizontal wind at 500 hPa and 850 hPa showed anomalous northeasterly wind, indicating that the southwesterly wind in front of the trough simulated by the GD and BW schemes was weaker than that of the KF scheme. This reduced the water vapor transported from the south to Qingyang, with anomalies of water vapor divergence, leading the reduced convergence of water vapor over Qingyang (
Figure 6d,f). This, in turn, led to the weaker intensity of precipitation simulated by the BW and GD schemes.
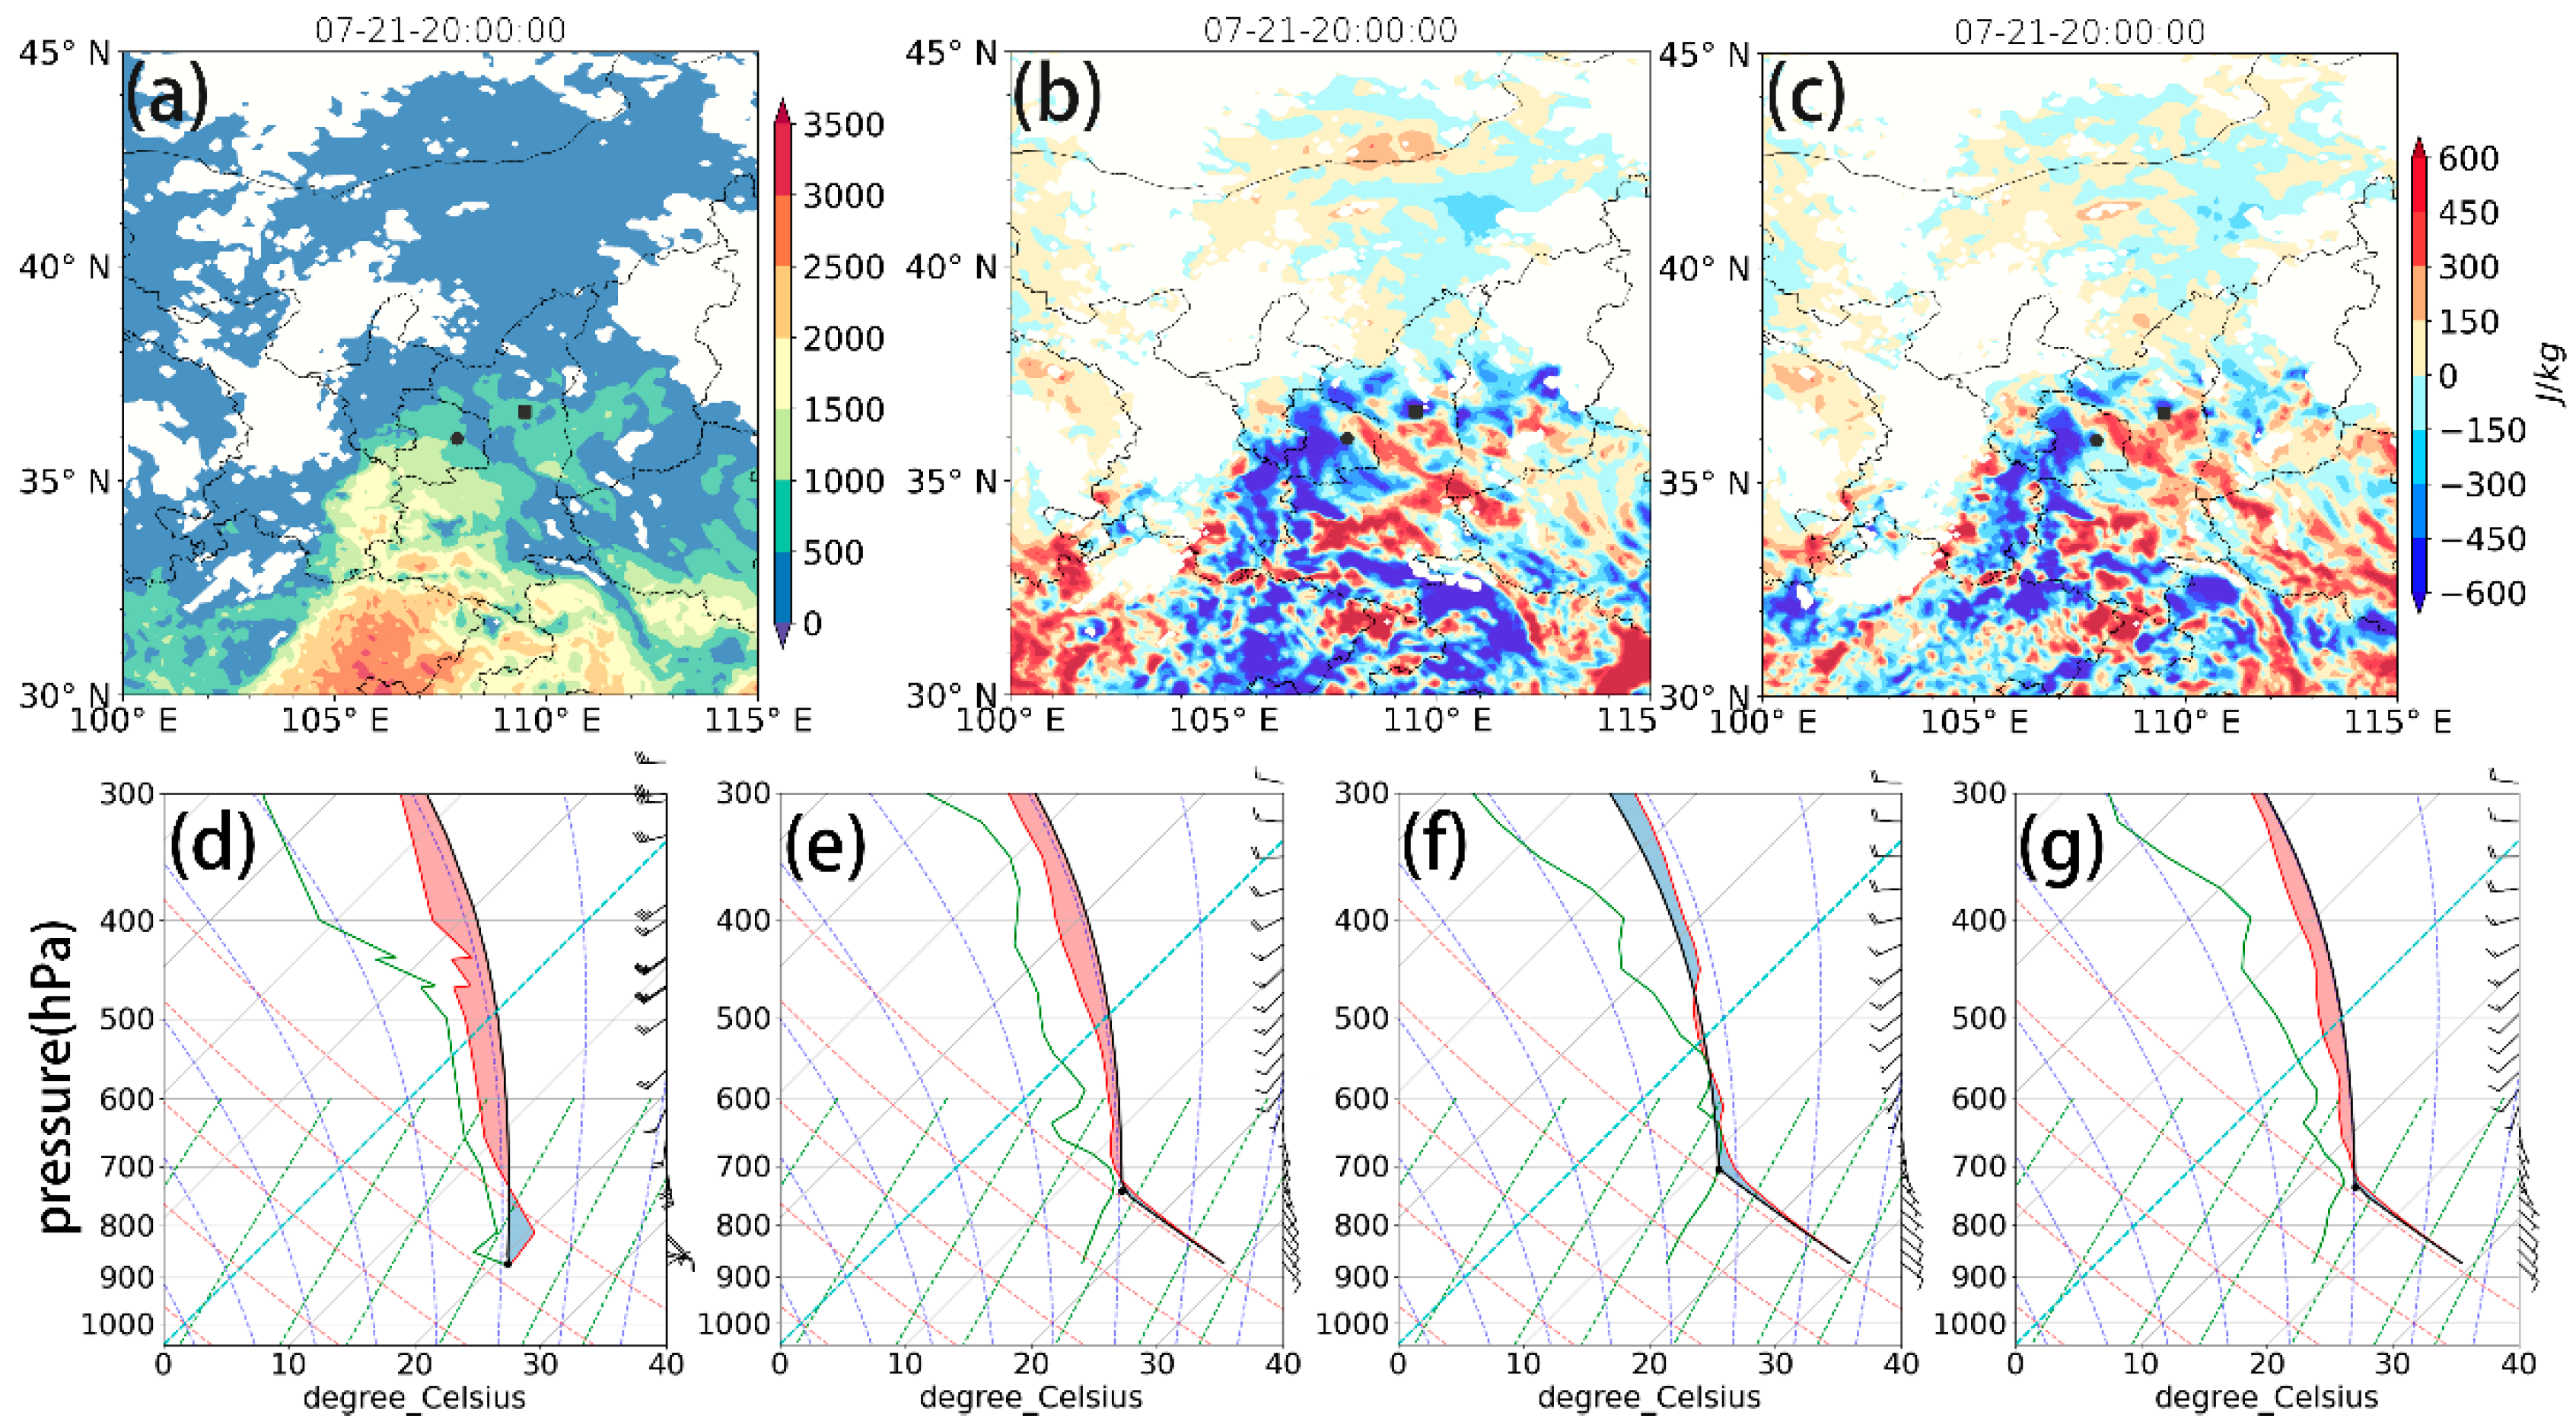
During the process of precipitation formation, the latent heat released by the condensation of water vapor contributes to the diabatic heating of the atmosphere, which affects large-scale atmospheric circulation and synoptic processes, and influences precipitation. To analyze the influence of convective process (i.e., the instability energy) simulated by different cumulus parameterization schemes on the precipitation simulations,
Figure 7 shows the convective available potential energy (CAPE) from soundings and simulations with the KF, GD and BW schemes. The CAPE (1000–1500 J/kg) over Qingyang was larger than that of the surrounding regions, indicating that the precipitation process in Qingyang showed relatively strong convection (
Figure 7a). Compared with the simulations with the KF scheme, the CAPE simulated by the GD and BW schemes was smaller than that of the KF scheme over Qingyang (
Figure 7b,c). This implies that the upward motion caused by convection simulated with the GD and BW schemes was weaker than that of the KF scheme, with obviously negative differences of CAPE between the GD and KF schemes. Due to the atmospheric baroclinicity, there was a corresponding low-pressure system in the upper layers of atmosphere. Thus, the weaker upward motion led to the weaker low-trough at 500 hPa simulated by the GD and BW schemes, which resulted in the weaker southwest wind and less water vapor transported to Qingyang; this caused the large deviations in the precipitation simulations.
To further evaluate the capability of the different cumulus parameterization schemes in simulating convection characteristics during this heavy rain,
Figure 7d–g shows a comparison of the skew
T diagram from the sounding, and simulations with the KF, GD and BW schemes. In the middle and upper atmosphere layers from 700 hPa to 300 hPa, the atmosphere had large convective instability energy (CAPE > 0), and the humidity condition of the whole layer was conducive to the occurrence of convection (
Figure 7d). The vertical profiles of temperature and humidity simulated with the KF scheme were generally consistent with observations, while the CAPE was slightly smaller than the observation (
Figure 7e). While the simulations with the GD scheme only showed a small CAPE at layer 600–500 hPa, there was large convection inhibitory (CIN) energy in the middle and upper troposphere (above 500 hPa), making it difficult for the air block to develop into strong convection, so that the characteristics of the vertical profiles simulated with GD were opposite to observation. When the BW scheme was used, the WRF could basically reproduce the characteristics of the temperature and humidity profiles, but the simulated CAPE was smaller than for observation and simulation with the KF scheme, indicating that weaker convection was simulated with this scheme. The above results highlight that deviation in convective process simulation is one of the important causes of precipitation simulation deviation of rainstorm events over semi-arid regions.
6. Conclusions and Discussions
In this study, WRF-ARW v4.3 was used to simulate precipitation in a rainstorm event that occurred in a semi-arid region (Qingyang City) on 21 July 2019. The influence of different cumulus parameterization schemes on extreme precipitation simulation in semi-arid regions were preliminarily investigated.
The WRF with the three cumulus parameterization schemes (i.e., KF, GD and BW schemes) essentially reproduced the shape and structure of the precipitation belt, but the intensity of precipitation was slightly weaker than that observed. The simulated precipitation area was relatively scattered, and the location of the precipitation belt was systematically shifted westward. The KF scheme showed the best performance compared to the other two schemes; the GD and BW schemes did not simulate the extreme precipitation well in a semi-arid region. Although the total precipitation simulated by the BW scheme was broadly consistent with observations, the precipitation area was more dispersed than that of the KF scheme. The GD scheme showed poor performance in the simulation of extreme precipitation occurring over a semi-arid region, and the simulated intensity and structure of precipitation showed large deviations.
The possible causes of the precipitation simulation deviations were explored. The convection (CAPE) simulated by the GD and BW schemes was weaker (smaller) than that of the KF scheme for Qingyang. Correspondingly, the 500 hPa low-pressure trough simulated by the GD and BW schemes was weaker than observation and simulations with the KF scheme, which led to less southwest water vapor transport to Qingyang in front of the trough, resulting, in turn, in less precipitation simulated with the GD and BW schemes.
The results of this study provide a basis for the choice of cumulus parameterization schemes for extreme precipitation simulation in semi-arid regions. It should be noted that the results were obtained for one case, which is representative to a degree, but also requires verification through other rainstorm events. For this rainstorm event in the semi-arid region, simulations with different cumulus parameterization schemes all showed a westward shift of the precipitation belt, which was caused by the slow eastward movement of the simulated low-pressure system. This implies that, in addition to cumulus parameterization, the description of other physical processes involved in extreme precipitation in semi-arid region is still inaccurate and needs to be reviewed and improved in future research [
31].


