Technical Note

Dependence of the Index of Biologically Active Ultraviolet Radiation on the Season and Time of Day

National Institute of Geophysics, Geodesy and Geography-Bulgarian Academy of Sciences, Acad. G. Bonchev Str., bl. 3, 1113 Sofia, Bulgaria
*
Author to whom correspondence should be addressed.
Atmosphere 2022, 13(9), 1455; https://doi.org/10.3390/atmos13091455
Submission received: 25 July 2022 / Revised: 18 August 2022 / Accepted: 5 September 2022 / Published: 8 September 2022

Abstract

:
In the present work, the data from the monitoring of the biologically active ultraviolet (UV) radiation of the Sun at the National Institute of Geophysics, Geodesy and Geography, Bulgarian Academy of Sciences for the period 2007–2021 were used. Based on the data analysis, a statistical method is proposed for determining the UV radiation index values in clear weather. As a result, estimated values of the UV-Index for each day of the year and for each hour are obtained, which can be used for predicting when reporting the cloud forecast. In the present paper, the applicability of the theoretical dependence of the UV-Index on the square of the cosine of the zenith angle of the Sun is investigated. The seasonal dependence of UV-Index values at fixed zenith angles of the Sun is discussed. Through regression analysis, the influence of the Total Ozone Column (TOC) and the concentration of particulate matter with d < 10 μm (PM10) on the UV-Index in the conditions of the city of Sofia was investigated. Explanations of the obtained results are offered.

1. Introduction

For decades, the topic of ultraviolet radiation from the Sun has been relevant not only among scientists, but also in the everyday life of each of us. It is well known that exposure to the Sun’s rays has both positive effects and can also be detrimental to human health.
The benefits of UV radiation are mostly related to the acquisition of vitamin D, which is a product of cholecalciferol in the skin, derived from cholesterol through a chemical reaction dependent on exposure to ultraviolet radiation. Vitamin D deficiency, in turn, leads to reduced absorption of potassium, magnesium and phosphorus [1,2]. Prolonged vitamin D deficiency has a negative effect on bone mineralization and bone strength, as well as on the immune system, resulting in poor immune function and increased susceptibility to disease The use of vitamin D as a supplement is necessary in the treatment of asthma, some immune diseases and for preventing influenza A virus infections [3].
The necessity of sunlight not only for humans but also for plants on our planet is well known. The photochemical processes taking place in plants as a result of UV-A irradiation contribute to the production and cultivation of specific plants such as Silybum marianum (SM). SM is a type of plant used as a medicine and dietary supplement to treat various diseases. “SM has antimicrobial, anticancer, hepatoprotective, cardiovascular-protective, neuroprotective, skin-protective, antidiabetic, and other effects” [4]. Another benefit for human health from UV-A is related to decreases in blood pressure and increases in blood flow and heart rate in humans [5].
Some research suggests that ultraviolet radiation may play a protective role in certain autoimmune diseases such as multiple sclerosis, insulin-dependent diabetes mellitus and rheumatoid arthritis [6].
Everything described above shows the benefits for humans from their exposure to solar radiation, but it is time to pay attention to the harmful effects of UV-B on our health. If we continue to consider the influence of the Sun’s rays on the immune system but this time as a pathogen, we must pay attention to autoimmune diseases. It is well known that in chronic autoimmune diseases such as Systemic Lupus Erythematosus (SLE), prolonged exposure to UV radiation without the use of high protection factor sunscreens is contraindicated. Some experimental studies show a significant immunomodulatory role for UV radiation in this type of patient, but detailed epidemiologic data regarding its role in triggering SLE onset are lacking [7].
The results of epidemiological research show a proportional interdependence of latitude and the prevalence of autoimmune diseases such as multiple sclerosis (MS), insulin-dependent diabetes mellitus (IDDM) and rheumatoid arthritis (RA). There is evidence that UV radiation has a direct effect on the level of antibodies specific for dermatomyositis (DM). On this basis, a hypothesis is established that UV radiation is a risk factor for dermatomyositis [8].
Another negative effect of excessive UV exposure is associated with certain health risks, including atrophy, pigmentary changes, wrinkles and malignancy formations. UV radiation is epidemiologically and molecularly linked to the three most common types of skin cancer, basal cell carcinoma, squamous cell carcinoma and malignant melanoma [9]. Some epidemiological and laboratory studies show that UV radiation is a major factor of skin cancer, including cutaneous melanoma. The results show that UV radiation underlies photo aging, but harmful effects of UV can be partially prevented in skin with higher levels of constitutive pigmentation [10]. Analyses of gene mutations in skin carcinomas have identified UV radiation as the cause. The relationship between the most fatal skin cancer, i.e., malignant melanoma, and solar UV exposure is, however, still unclear and needs to be clarified to optimize preventive measures and minimize mortality from skin cancers [11].
If the biological effects of UV radiation on the organisms of our planet are considered, UV-A (315 nm–400 nm) and a small part of the biologically active ultraviolet radiation UV-B (280 nm–315 nm) components play a major role, since only they manage to reach the surface of the Earth. The main and well-studied factors responsible for the absorption of all UV-C (100 nm–280 nm) and much of the UV-B radiation are: (a) atmospheric ozone; (b) the angle between the horizon and the direction to the sun—i.e., solar elevation; (c) altitude; (d) atmospheric scattering; (e) clouds and haze; (f) ground reflection. UVB power flux reaching the Earth’s surface depends strongly on the total ozone column in the atmosphere [12,13,14]. The Radiation Amplification Factor (RAF) shows the relationship between changes in TOC and UV-B. For small changes in the ozone layer thickness (increase of about 1%) the RAF represents the percent change in UVB intensity for a 1% change in the total column ozone [15]. An interesting study [16] describes the relationship between ozone and changes in biologically active ultraviolet radiation reaching the Earth’s surface: “The RAFs can generally be used only to estimate effects of small ozone changes, e.g., of a few percent, because the relationship between ozone and UVbio becomes non-linear for larger ozone changes”. Everything described above shows the importance of calculating the RAF [17,18,19].
In their work, the scientists show a change in the UV-Index from 8 to 6 with an increase in TOC from 280 to 380 DU, which gives an approximate estimate of the coefficient −0.02. In their paper, the authors of [20] proposed the following assessment: “A 1% decline (or increase) in column ozone yields about a 1.2% increase (or decline) in UV-Index”. This assessment shows an even stronger dependence of the UV-Index on TOC.
Another main dependence is on the power of UV-B from the zenith angle of the Sun. Based on detailed statistical analysis, the authors propose a functional relationship between the cosine of the zenith angle of the Sun and the index of active ultraviolet radiation and offer an explanation of the obtained seasonal characteristics of the atmosphere over Bulgaria [21,22]. The obtained functional dependence of the UV-Index on the square of the cosine of the Sun’s zenith angle is implemented in the created empirical model for predicting the hourly average UV-Index values for Sofia, depending on the local time and day of the year in cloudless and clear weather [23]. Another study provides an opportunity to estimate the approximate permissible time of stay in the Sun without the risk of getting burns on human skin, according to the recommendations of the World Health Organization [24].
The main purpose of this research is based on a 15-year series of data from the monitoring of UV radiation at the National Institute of Geophysics, Geodesy and Geography of the Bulgarian Academy of Sciences. As a result of the data analysis, a methodology is proposed for determining forecast values for each day and hour of the day depending on cloudiness. A study of the theoretical dependence of the UV-Index on the square of the cosine of the zenith angle of the Sun is planned, and an explanation of the seasonal dependence of the UV-Index values at fixed zenith angles of the Sun is additionally proposed. Based on regression analysis, the influence of TOC and the concentration of PM10 on the UV-Index for the city of Sofia were investigated.
The main difficulty for realizing the defined task is the strong dependence of the UV-Index on the cloud cover. In particular, the value measured on a given day and time can be affected even by an isolated cloud located between the Sun and the sensor. According to the recommendations of the World Health Organization [24], in cloudy weather, the UV-Index drops to 20% of its value in clear weather.

2. Data

The equipment used in the present study is a Model 501 UV-Biometer. The device is a stationary instrument for measuring UV-B radiation of the Sun in a horizontal plane with automatic data transmission. The biological effectiveness of the UV irradiation is measured in MED/h (Minimum Erythema Dose per Hour), 1 MED/h = 0.05833 W/m2. This value is entered into the equipment used. One MED/h would cause minimal redness on the most sensitive and lightest type of skin after a one hour of irradiation. The integral of the cross-multiplication of irradiating flux [W/cm2nm] and the Erythema Action Spectrum gives the weighted irradiance [25].
The 501A UV-Biometer is initially calibrated by the manufacturer, to show the biological effectiveness of the solar radiation, according to the McKinlay–Diffey Erythema Action Spectrum and a 21 mJ/cm2 to induce minimal skin redness. The sensor is calibrated for a clear sky, 30° solar zenith angle, 270 DU ozone column, at sea level and at a 25 °C sensor temperature. Some specifications of the device are: (i) Spectral Range Based on Erythema Action Spectrum (280–320 nm—99.503%, 320–400 nm—0.497%); (ii) Measurement Range 0–10 MED/Hr. Other technical characteristics can be found at the following address: https://solarlight.com/wp-content/uploads/Meters_Model-501-UVBiometer-1-1.pdf, accessed on 15 July 2022. The device, placed on the roof of the National Institute of Geophysics, Geodesy and Geography—BAS, allows tracking of UV-B values every hour at the following Internet address: http://data.niggg.bas.bg/uv_index/uv_index_bg.php (accessed on 15 July 2022) for the period 2007–2021. Since 2011, a parallel operating set of the same device has been included, whose data are also used in the present work. The most recent calibration of the device was done in the month of April 2022. The results are presented in [23]. Periodic calibrations have shown that the accuracy of the instrument does not change over time.
A reading of the UV-Index values is performed every hour of the day, where the value is actually the average value for the past hour. In the present study, this is taken into account when calculating the zenith angle of the Sun, which is calculated for the middle of the previous hour. During the compilation of the monitoring database, measures were taken to remove potentially invalid values. Values obtained before sunrise and after sunset, as well as values greater than 10, were removed. From the remaining values, those that—for a given calendar month and for a given hour of the day—differ from the mean value by more than three times the standard deviation of the corresponding data series have been removed. The presence of invalid values was found to be a consequence of technical malfunctions.
TOC data values are obtained from the OMI, located on the AURA satellite and freely available (https://Ozonewatch.gsfc.nasa.gov/data/omi/, accessed on 15 July 2022). Data are provided for each day with a step of 1° × 1° latitude and longitude. The data used in this study are for coordinates 42.5° N, 23.5° E [26].
The air pollutants used in the present study are particulate matter with a diameter of 10 microns or smaller. All data for PM10 were taken from the Druzhba station (located in the city of Sofia). That station is part of the official network of monitoring sites of the Ministry of Environment and Water of Bulgaria. The station in Druzhba, which provides data on AQI, PM2.5 and PM10, has coordinates 42.67° N, 23.40° E. For comparison, the active ultraviolet radiation meter located on the roof at the National Institute of Geophysics, Geodesy and Geography has coordinates 42.68° N, 23.37° E. The Distance between the two points is about 4 km.

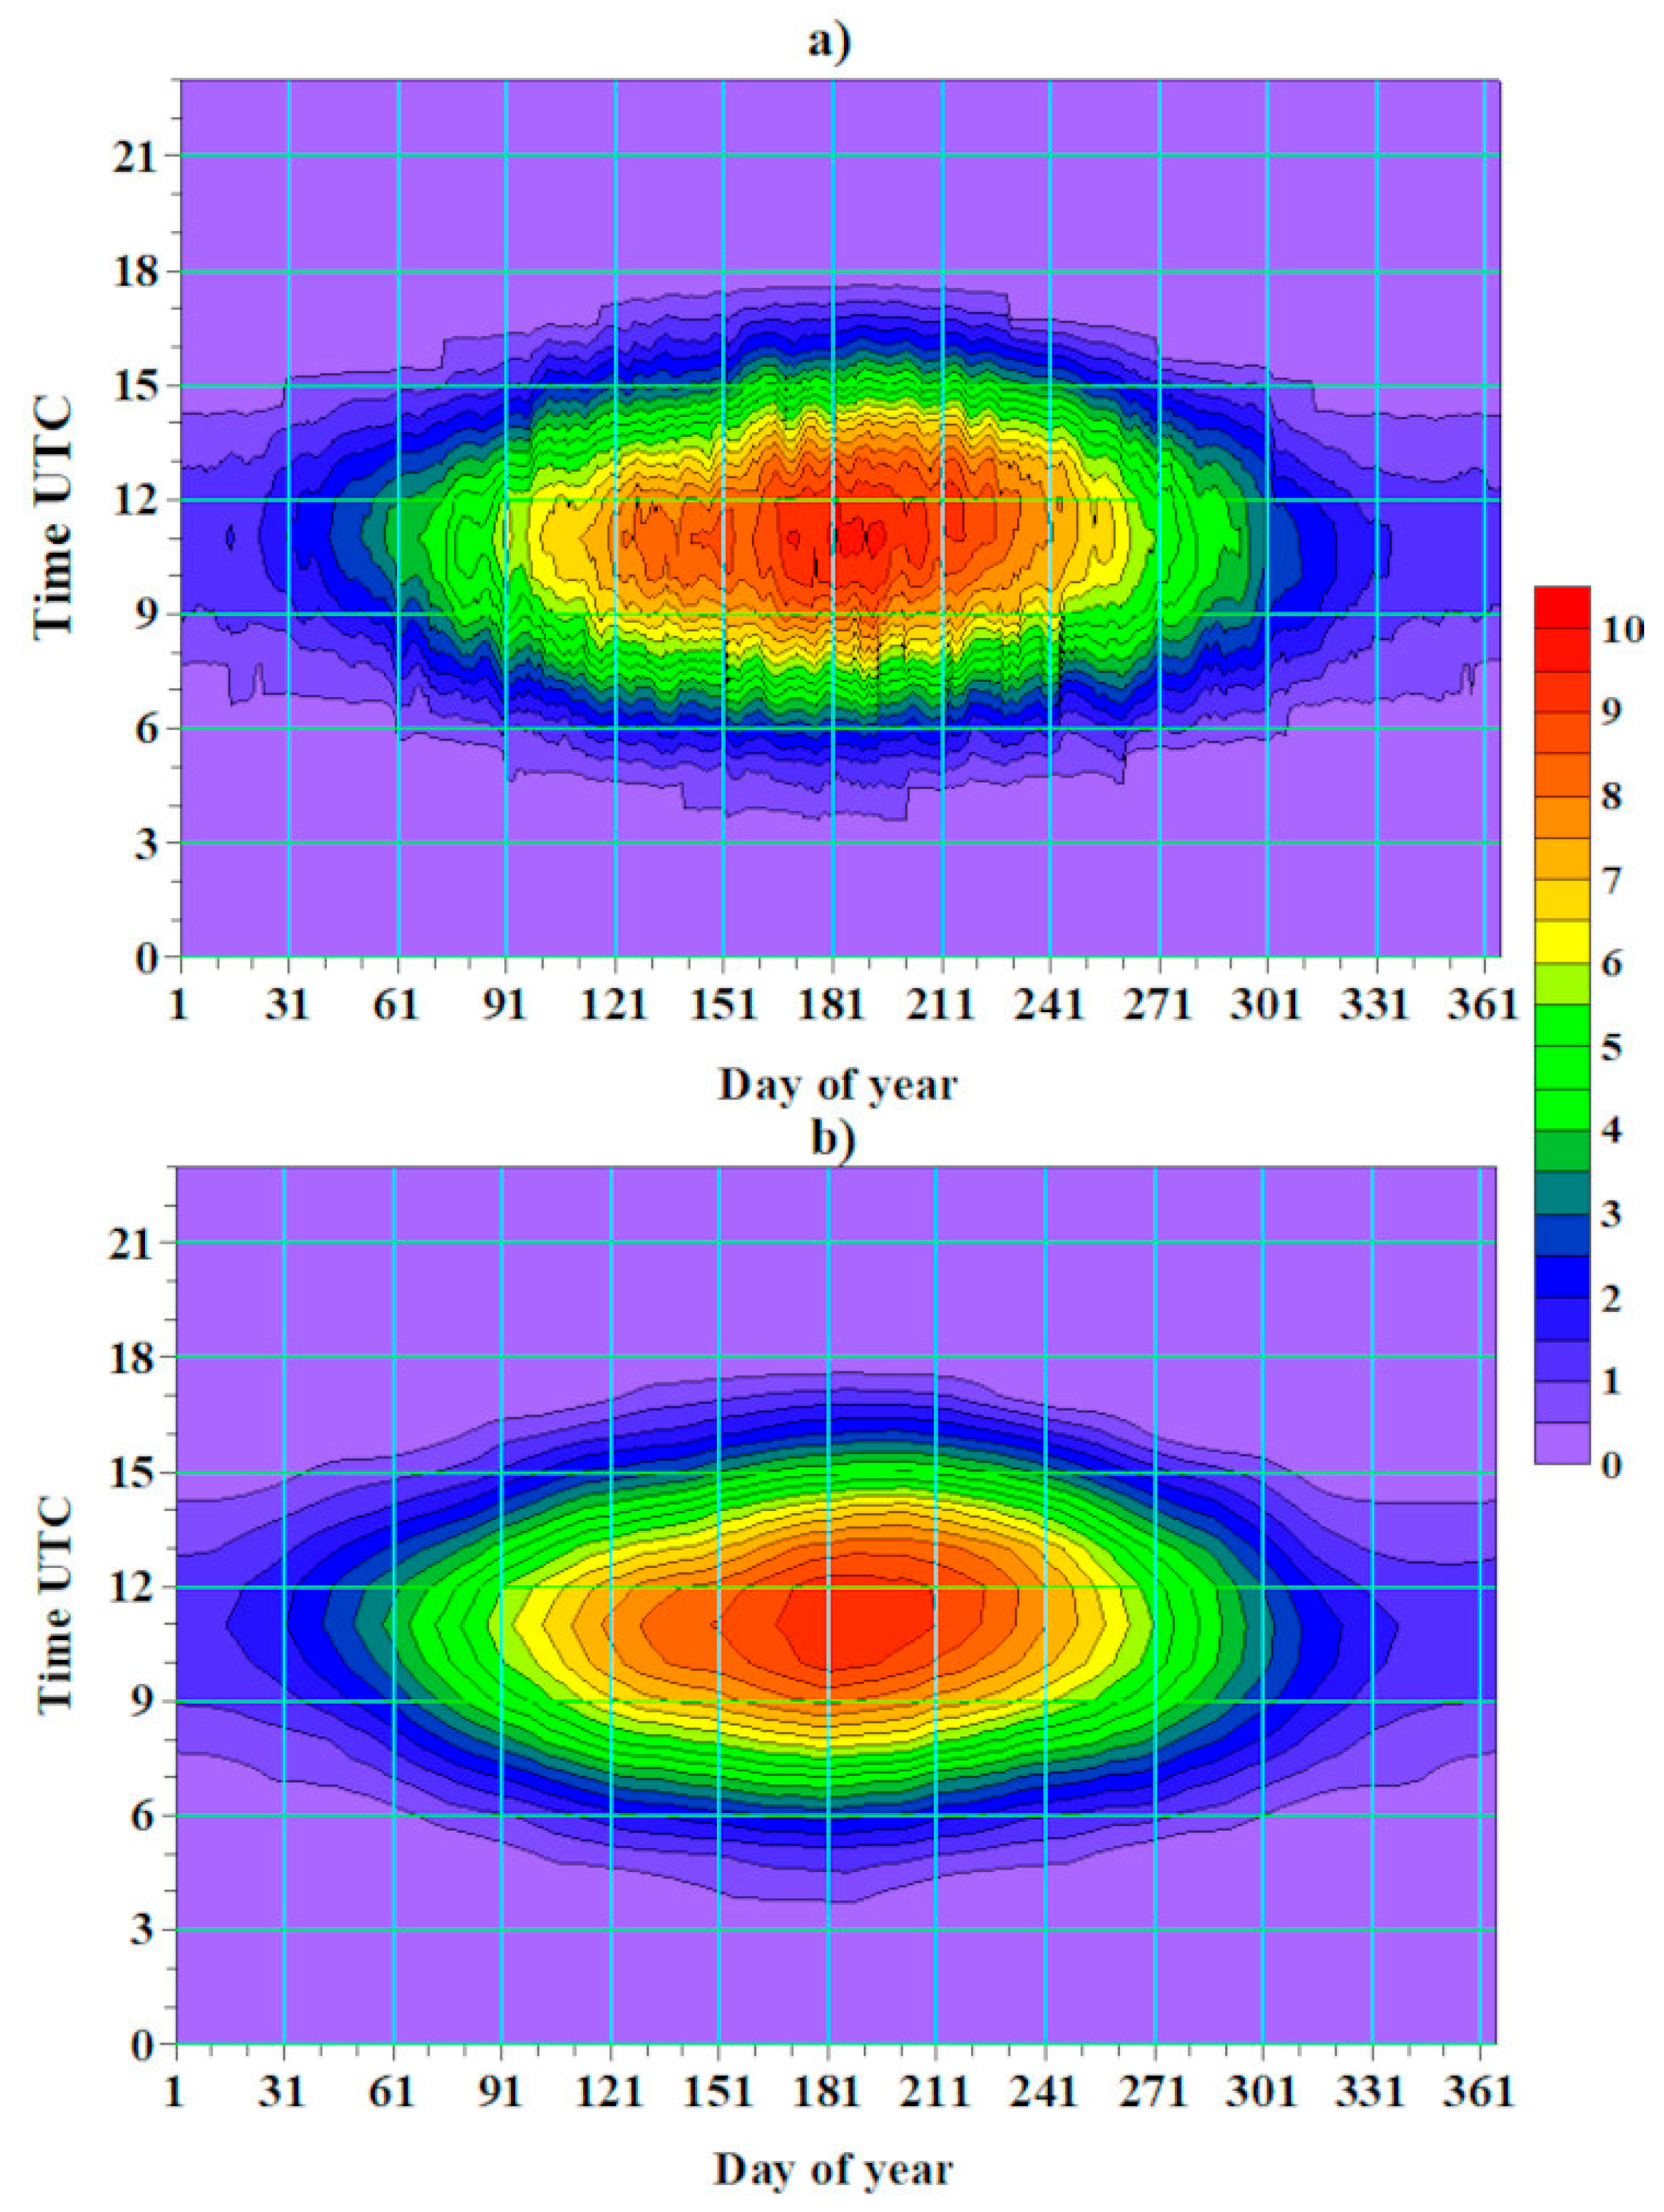
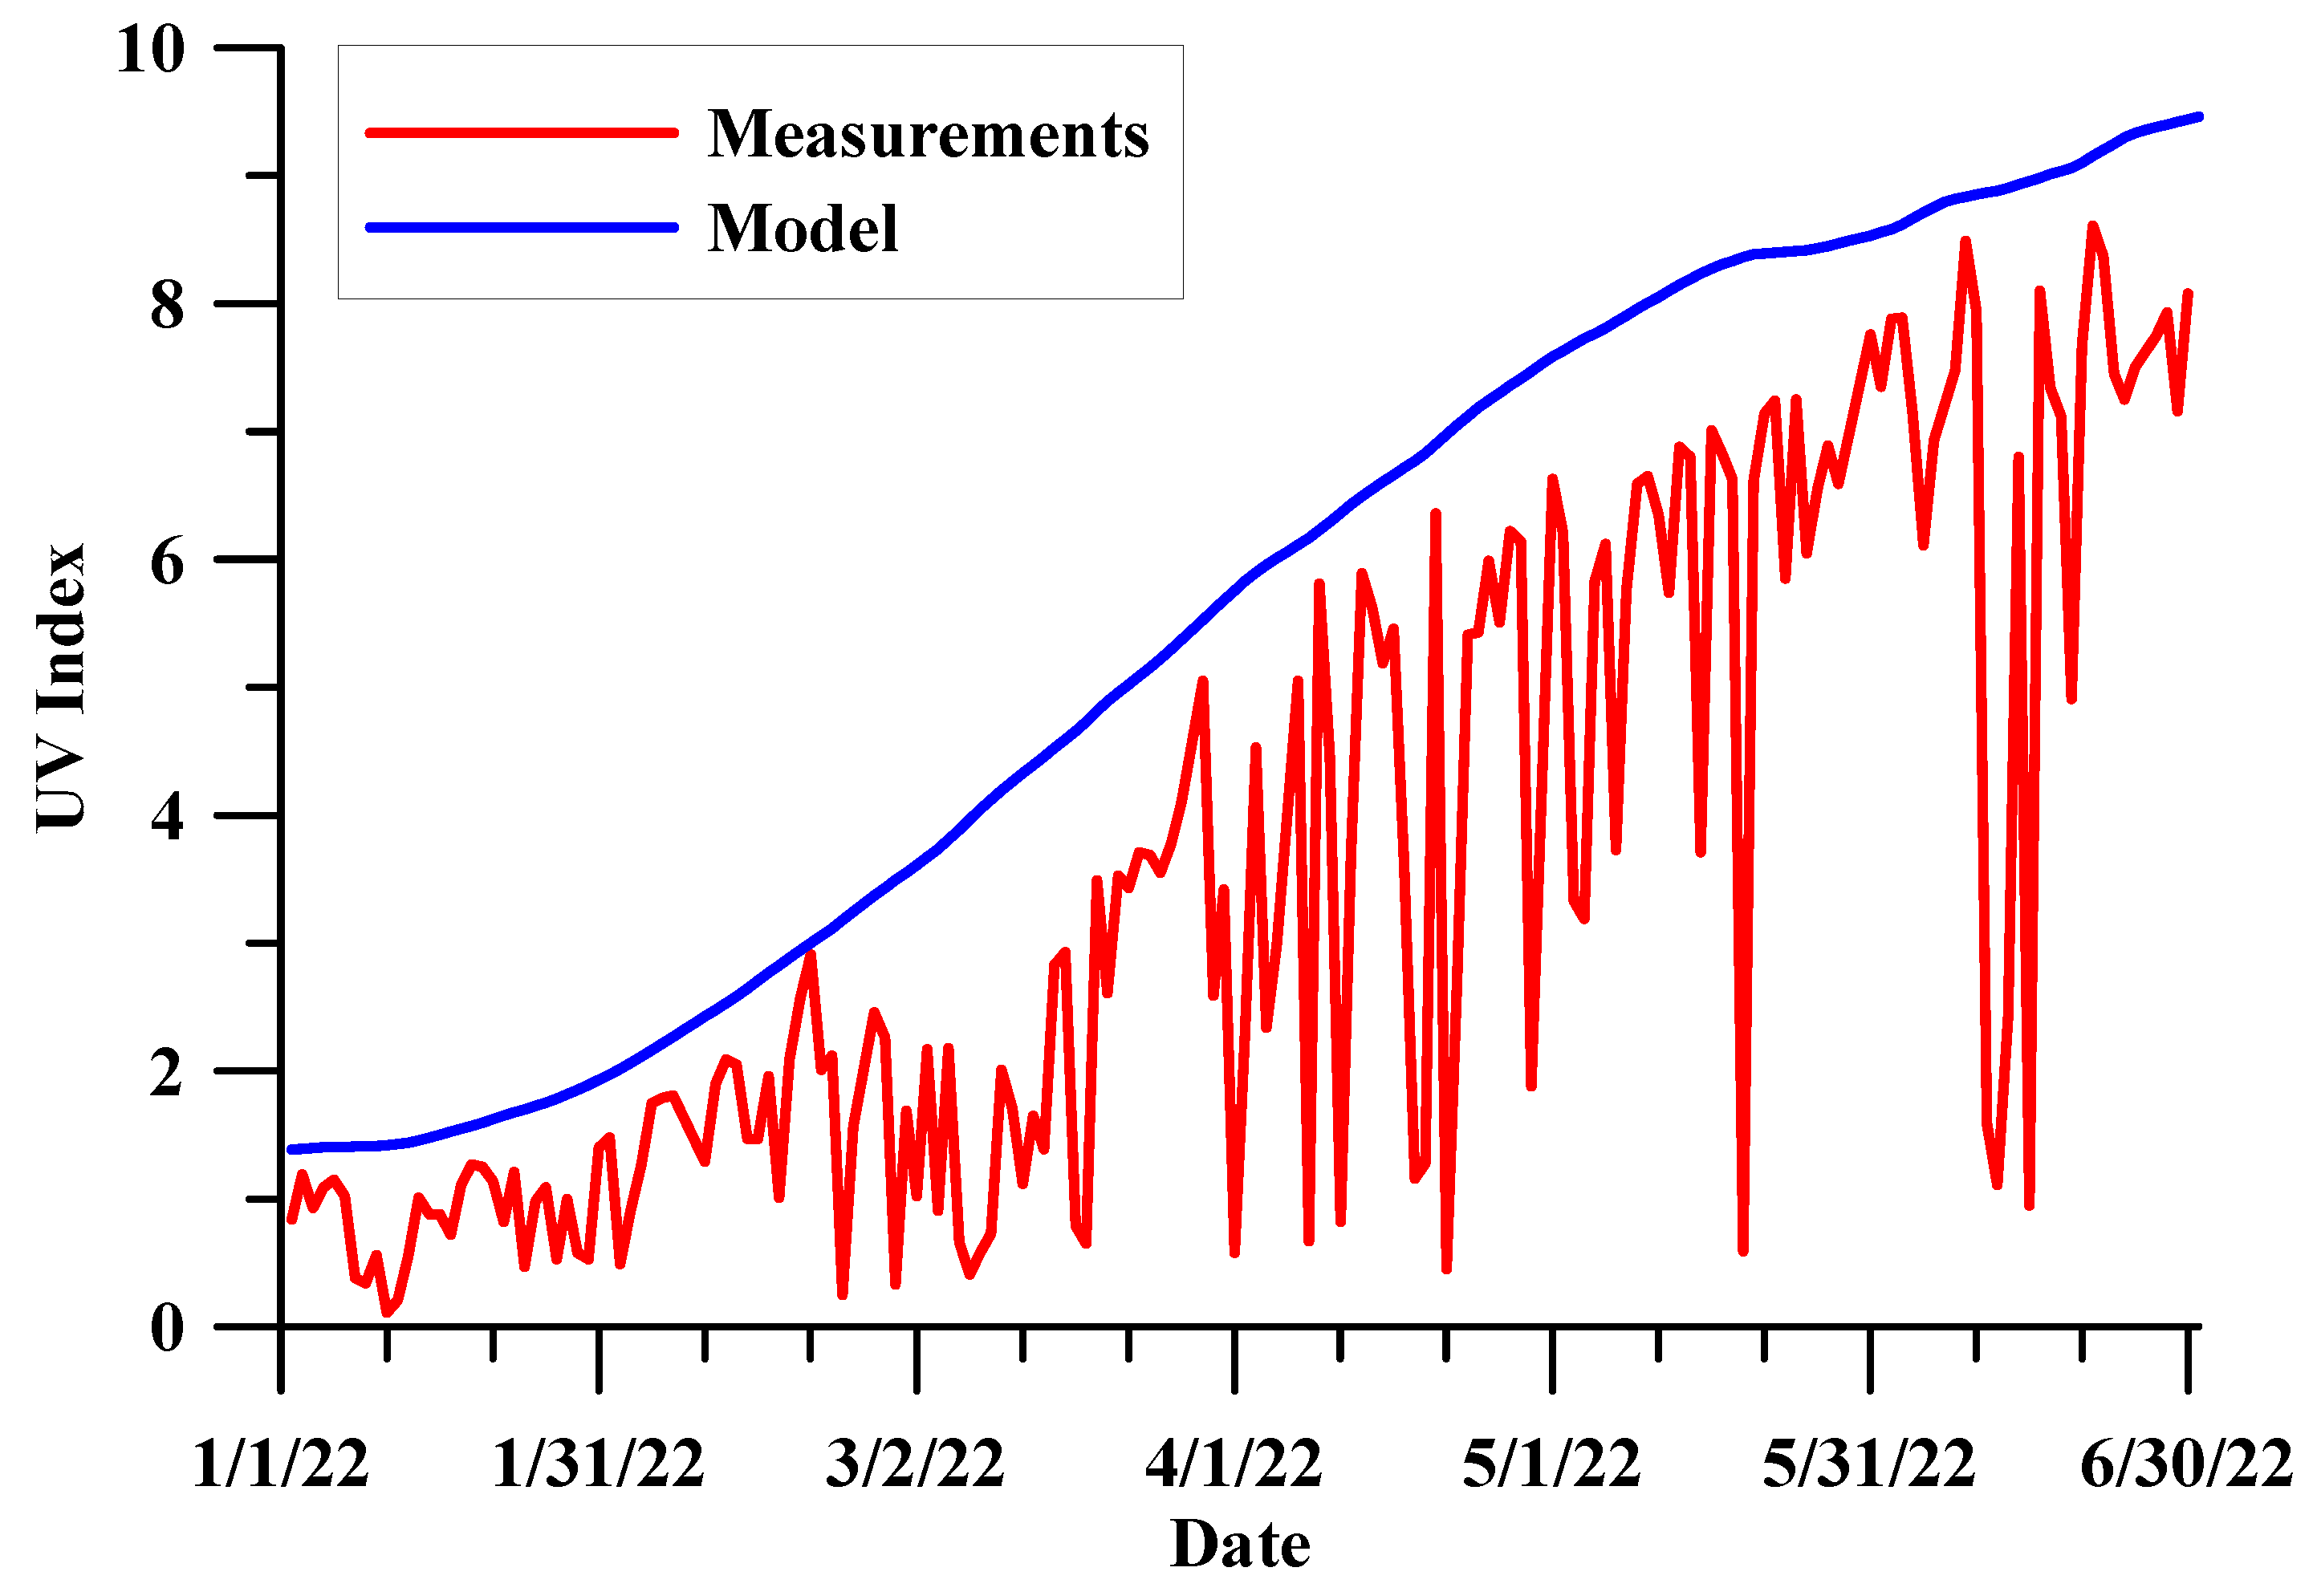
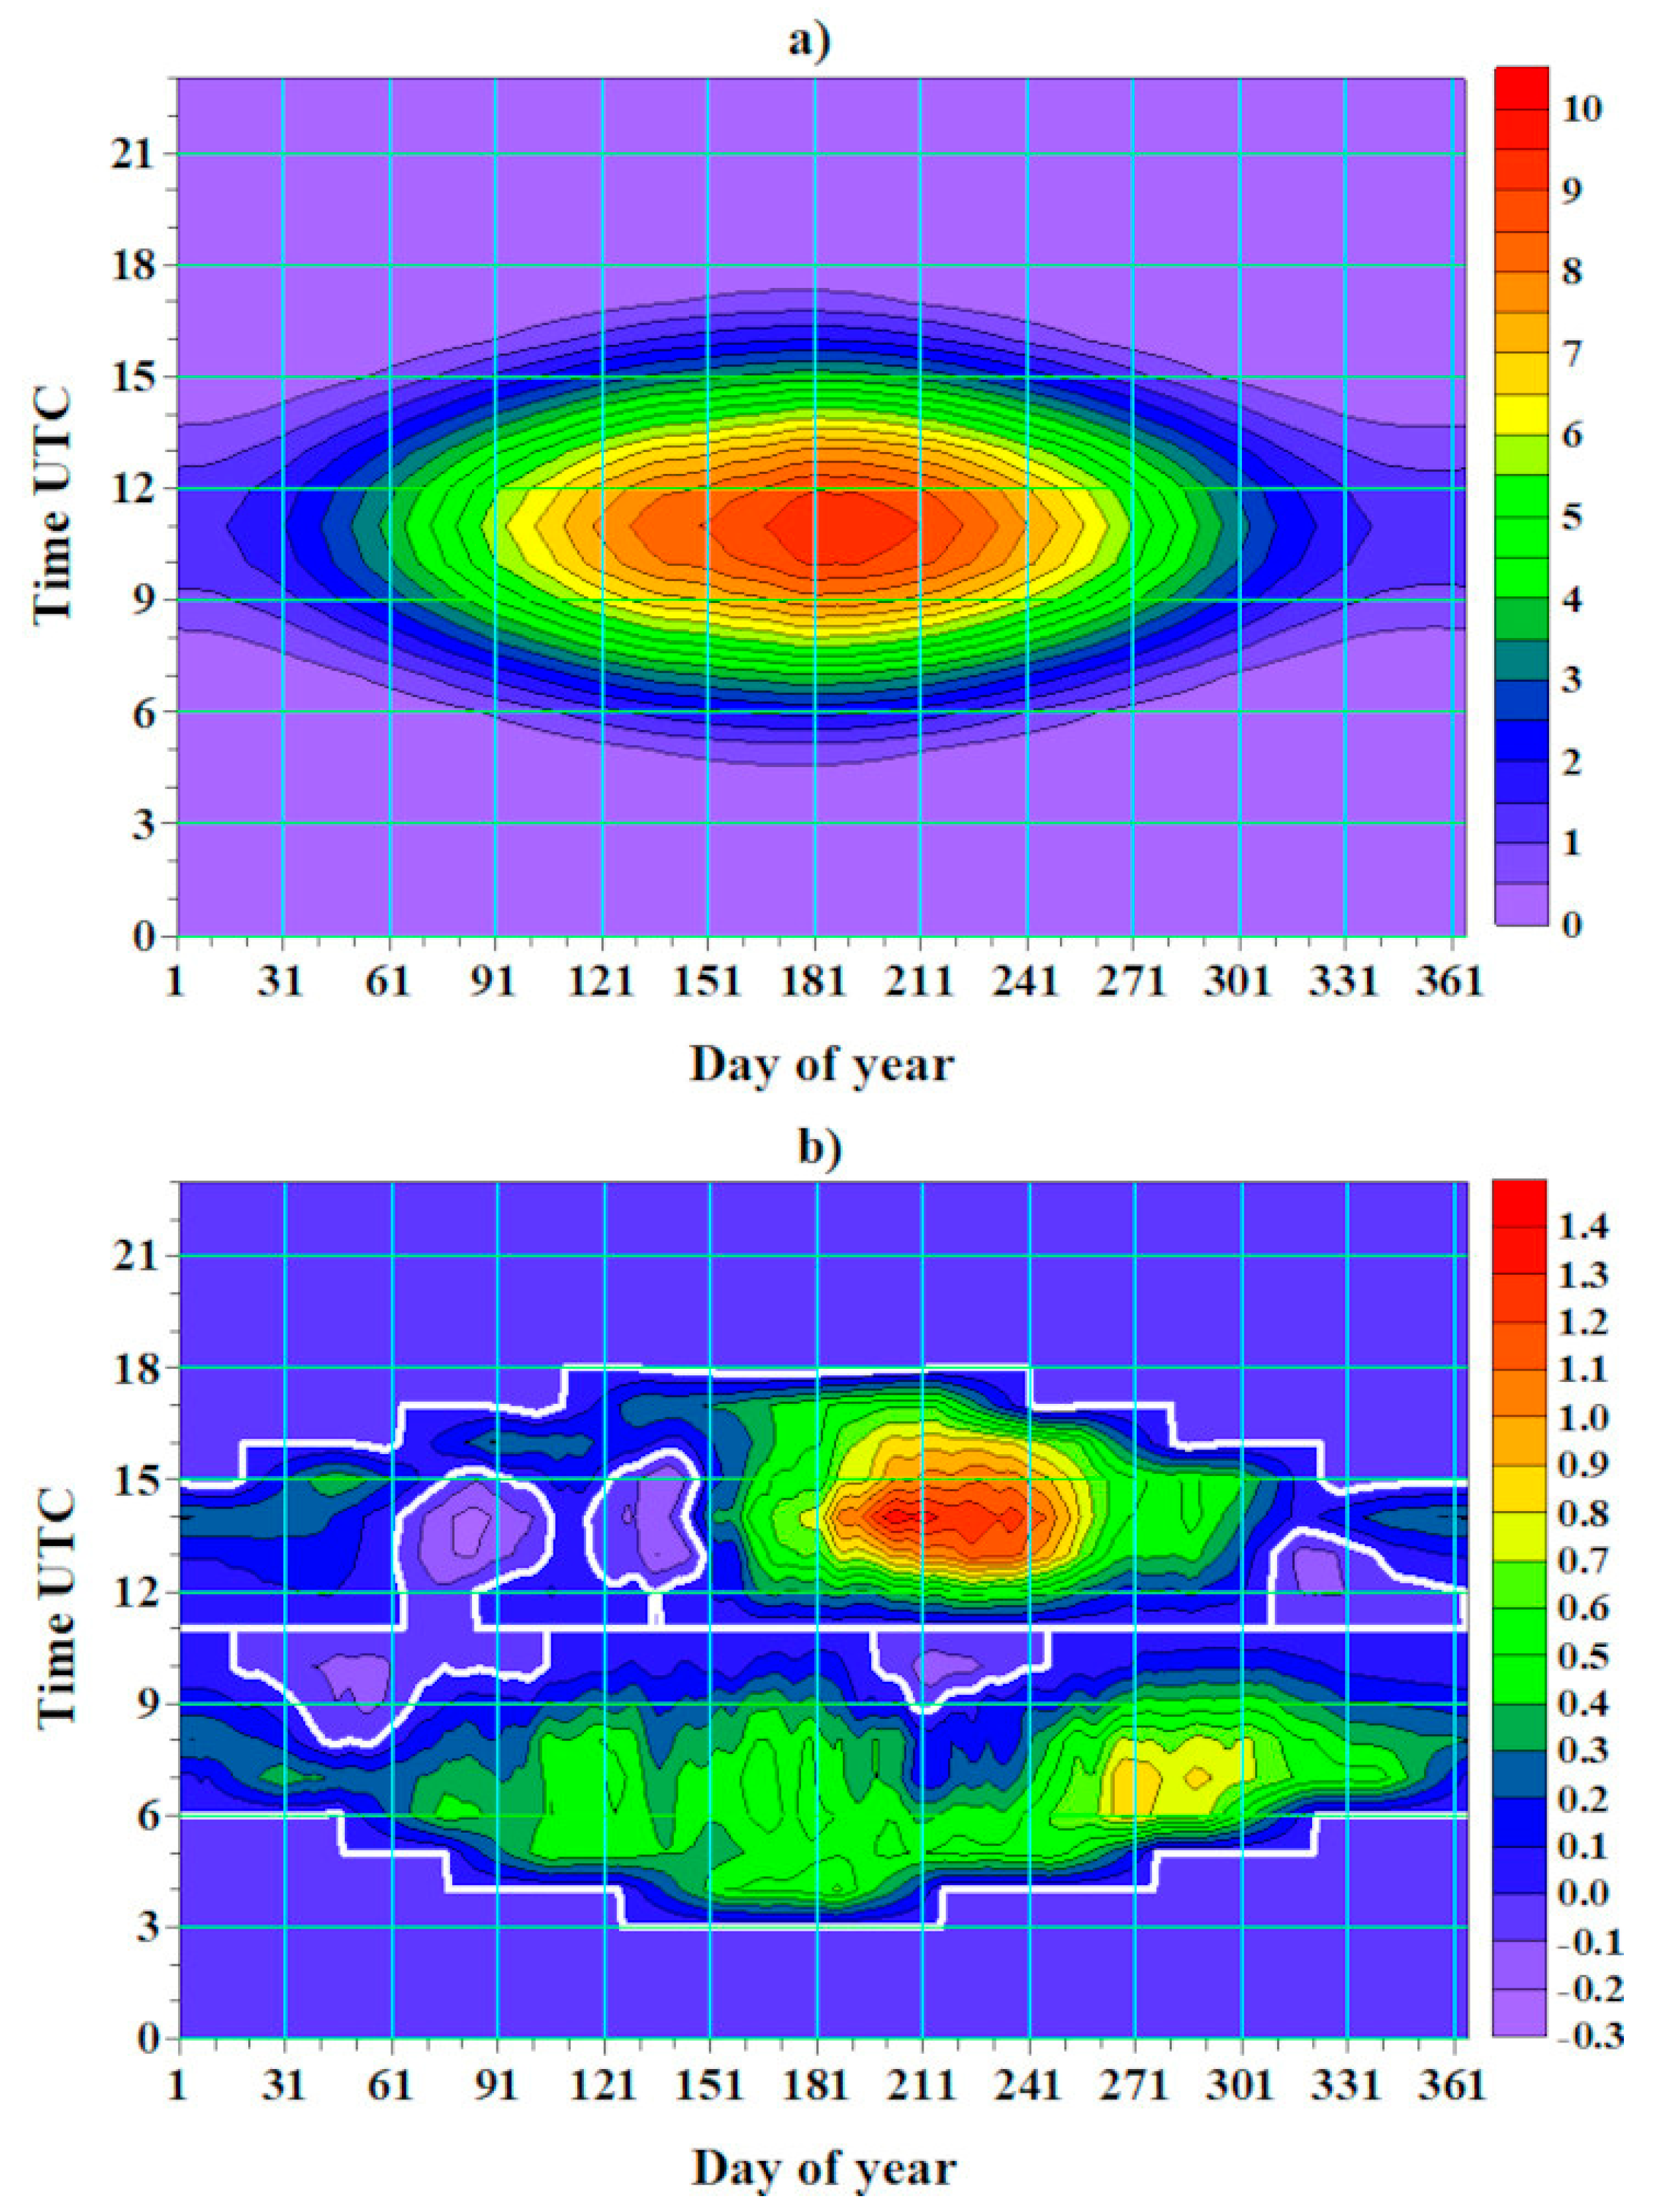
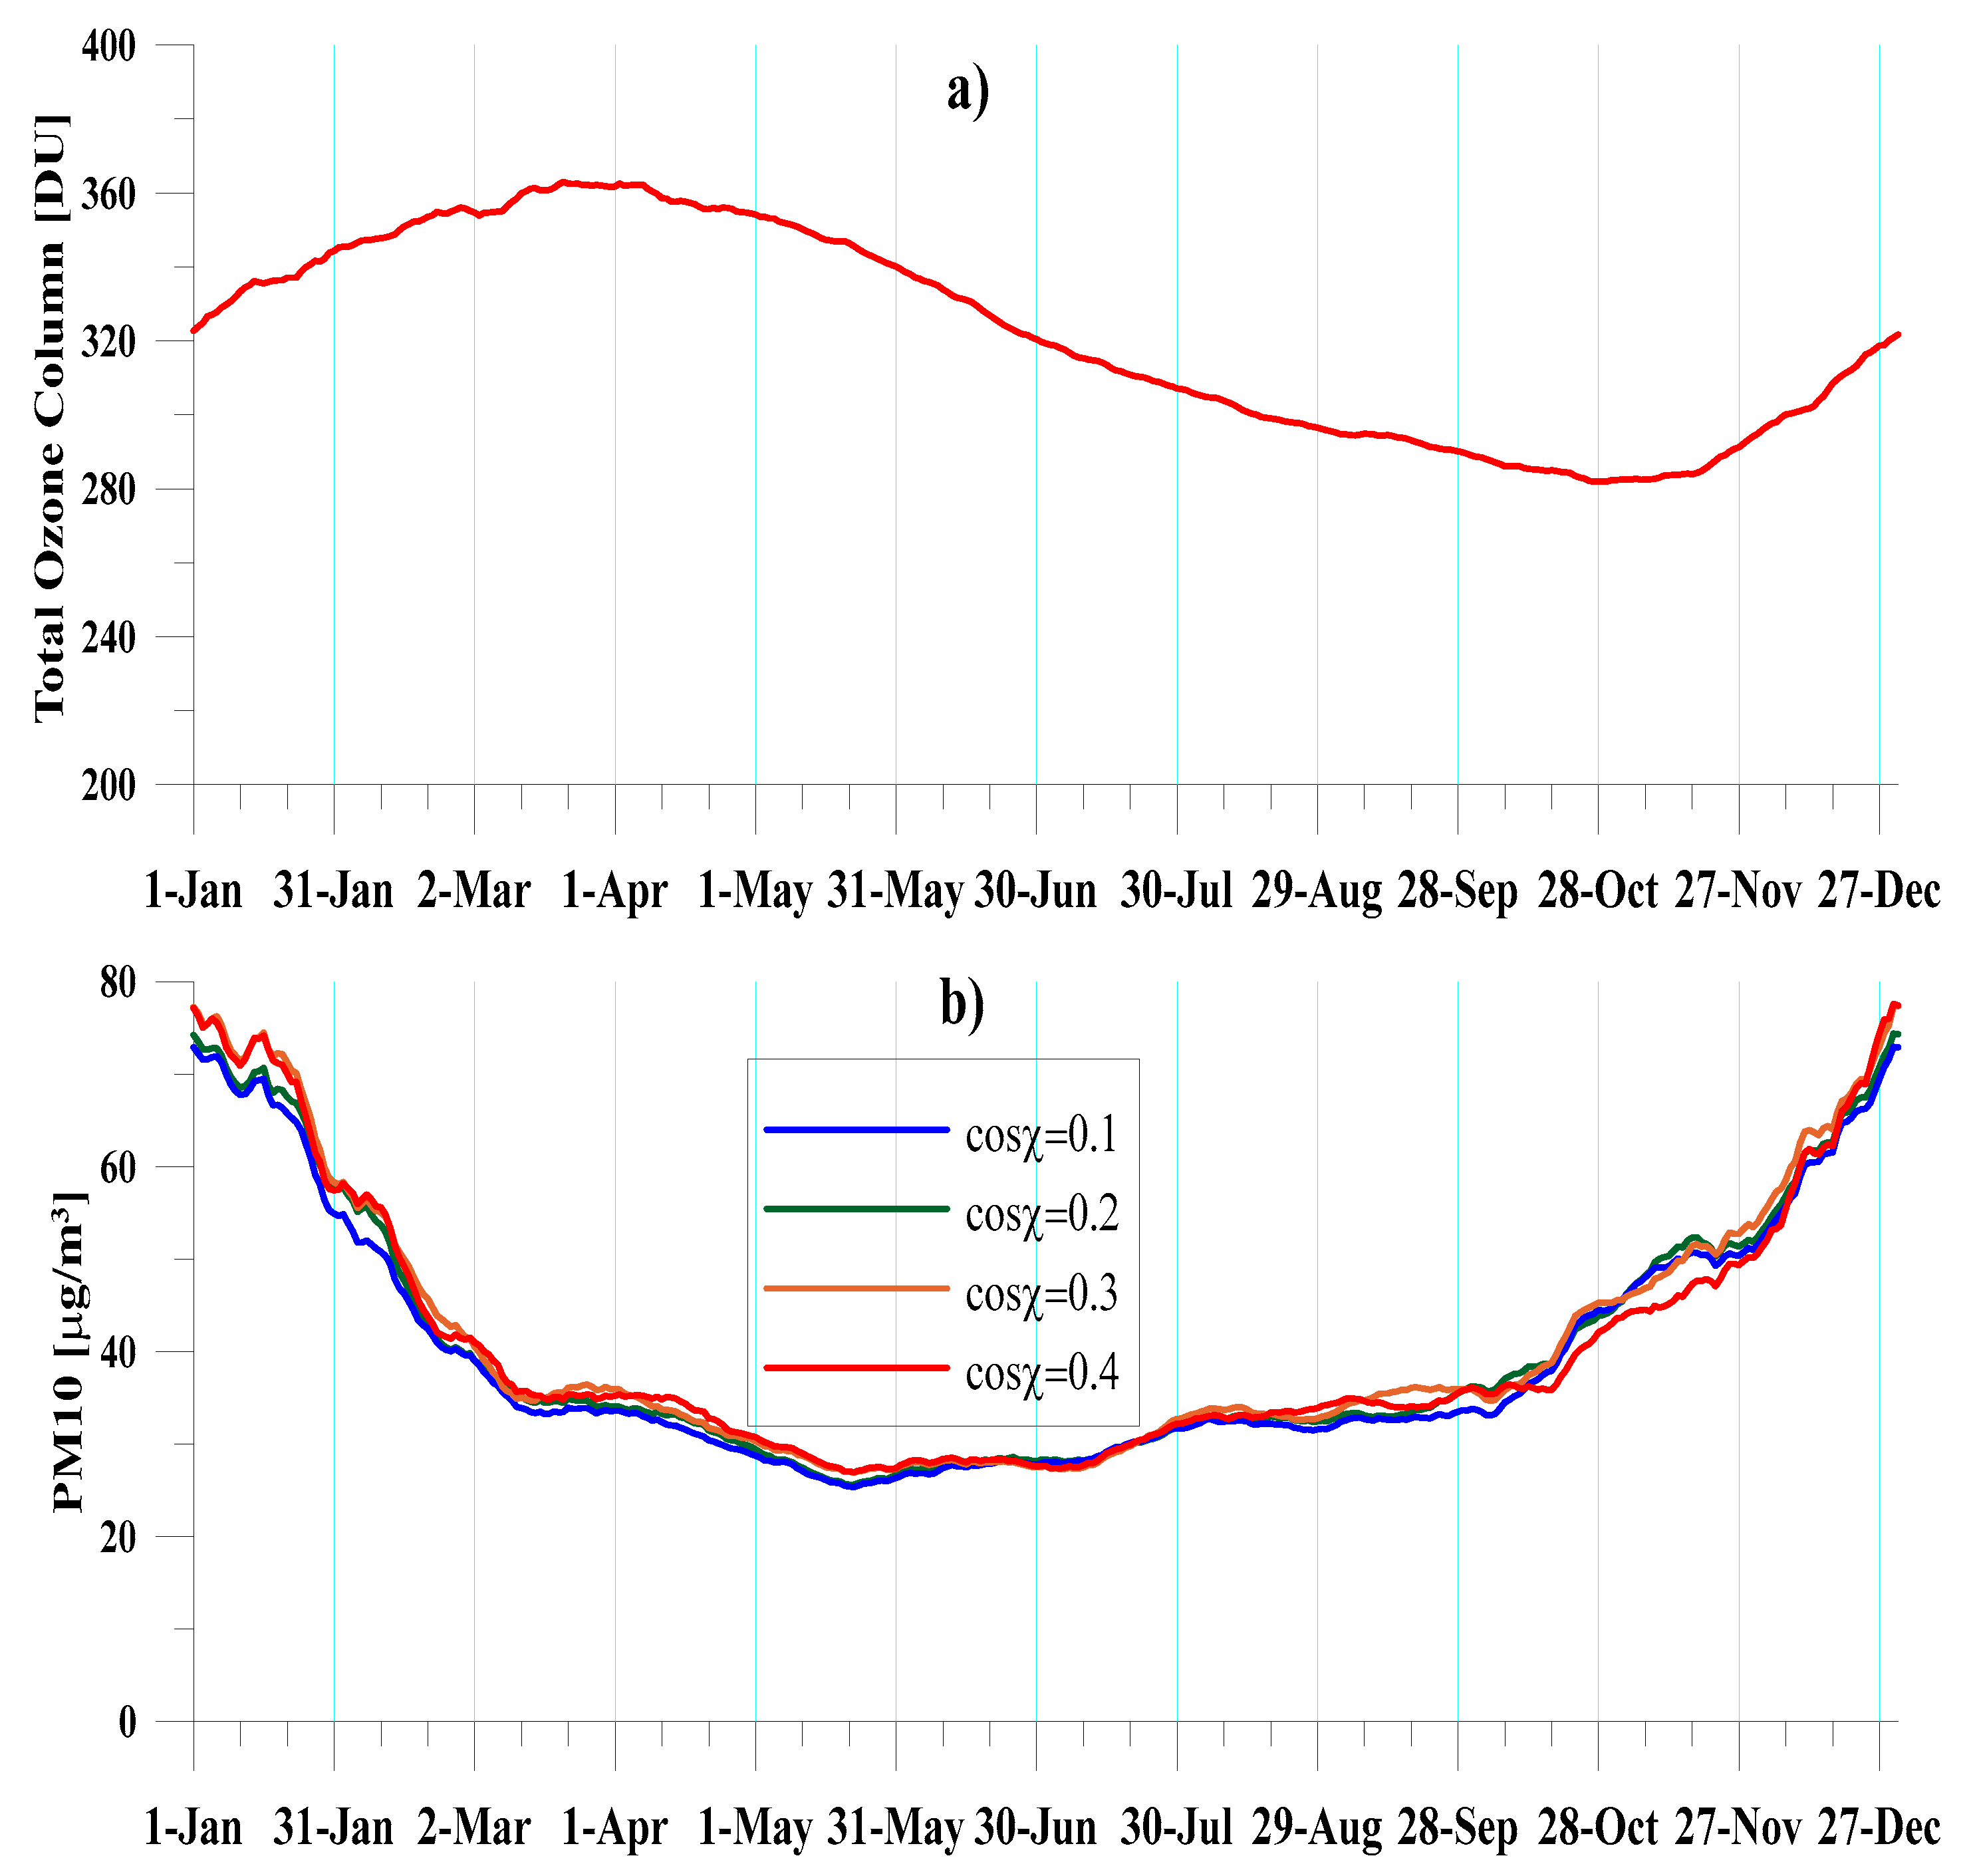
3. Results and Discussion

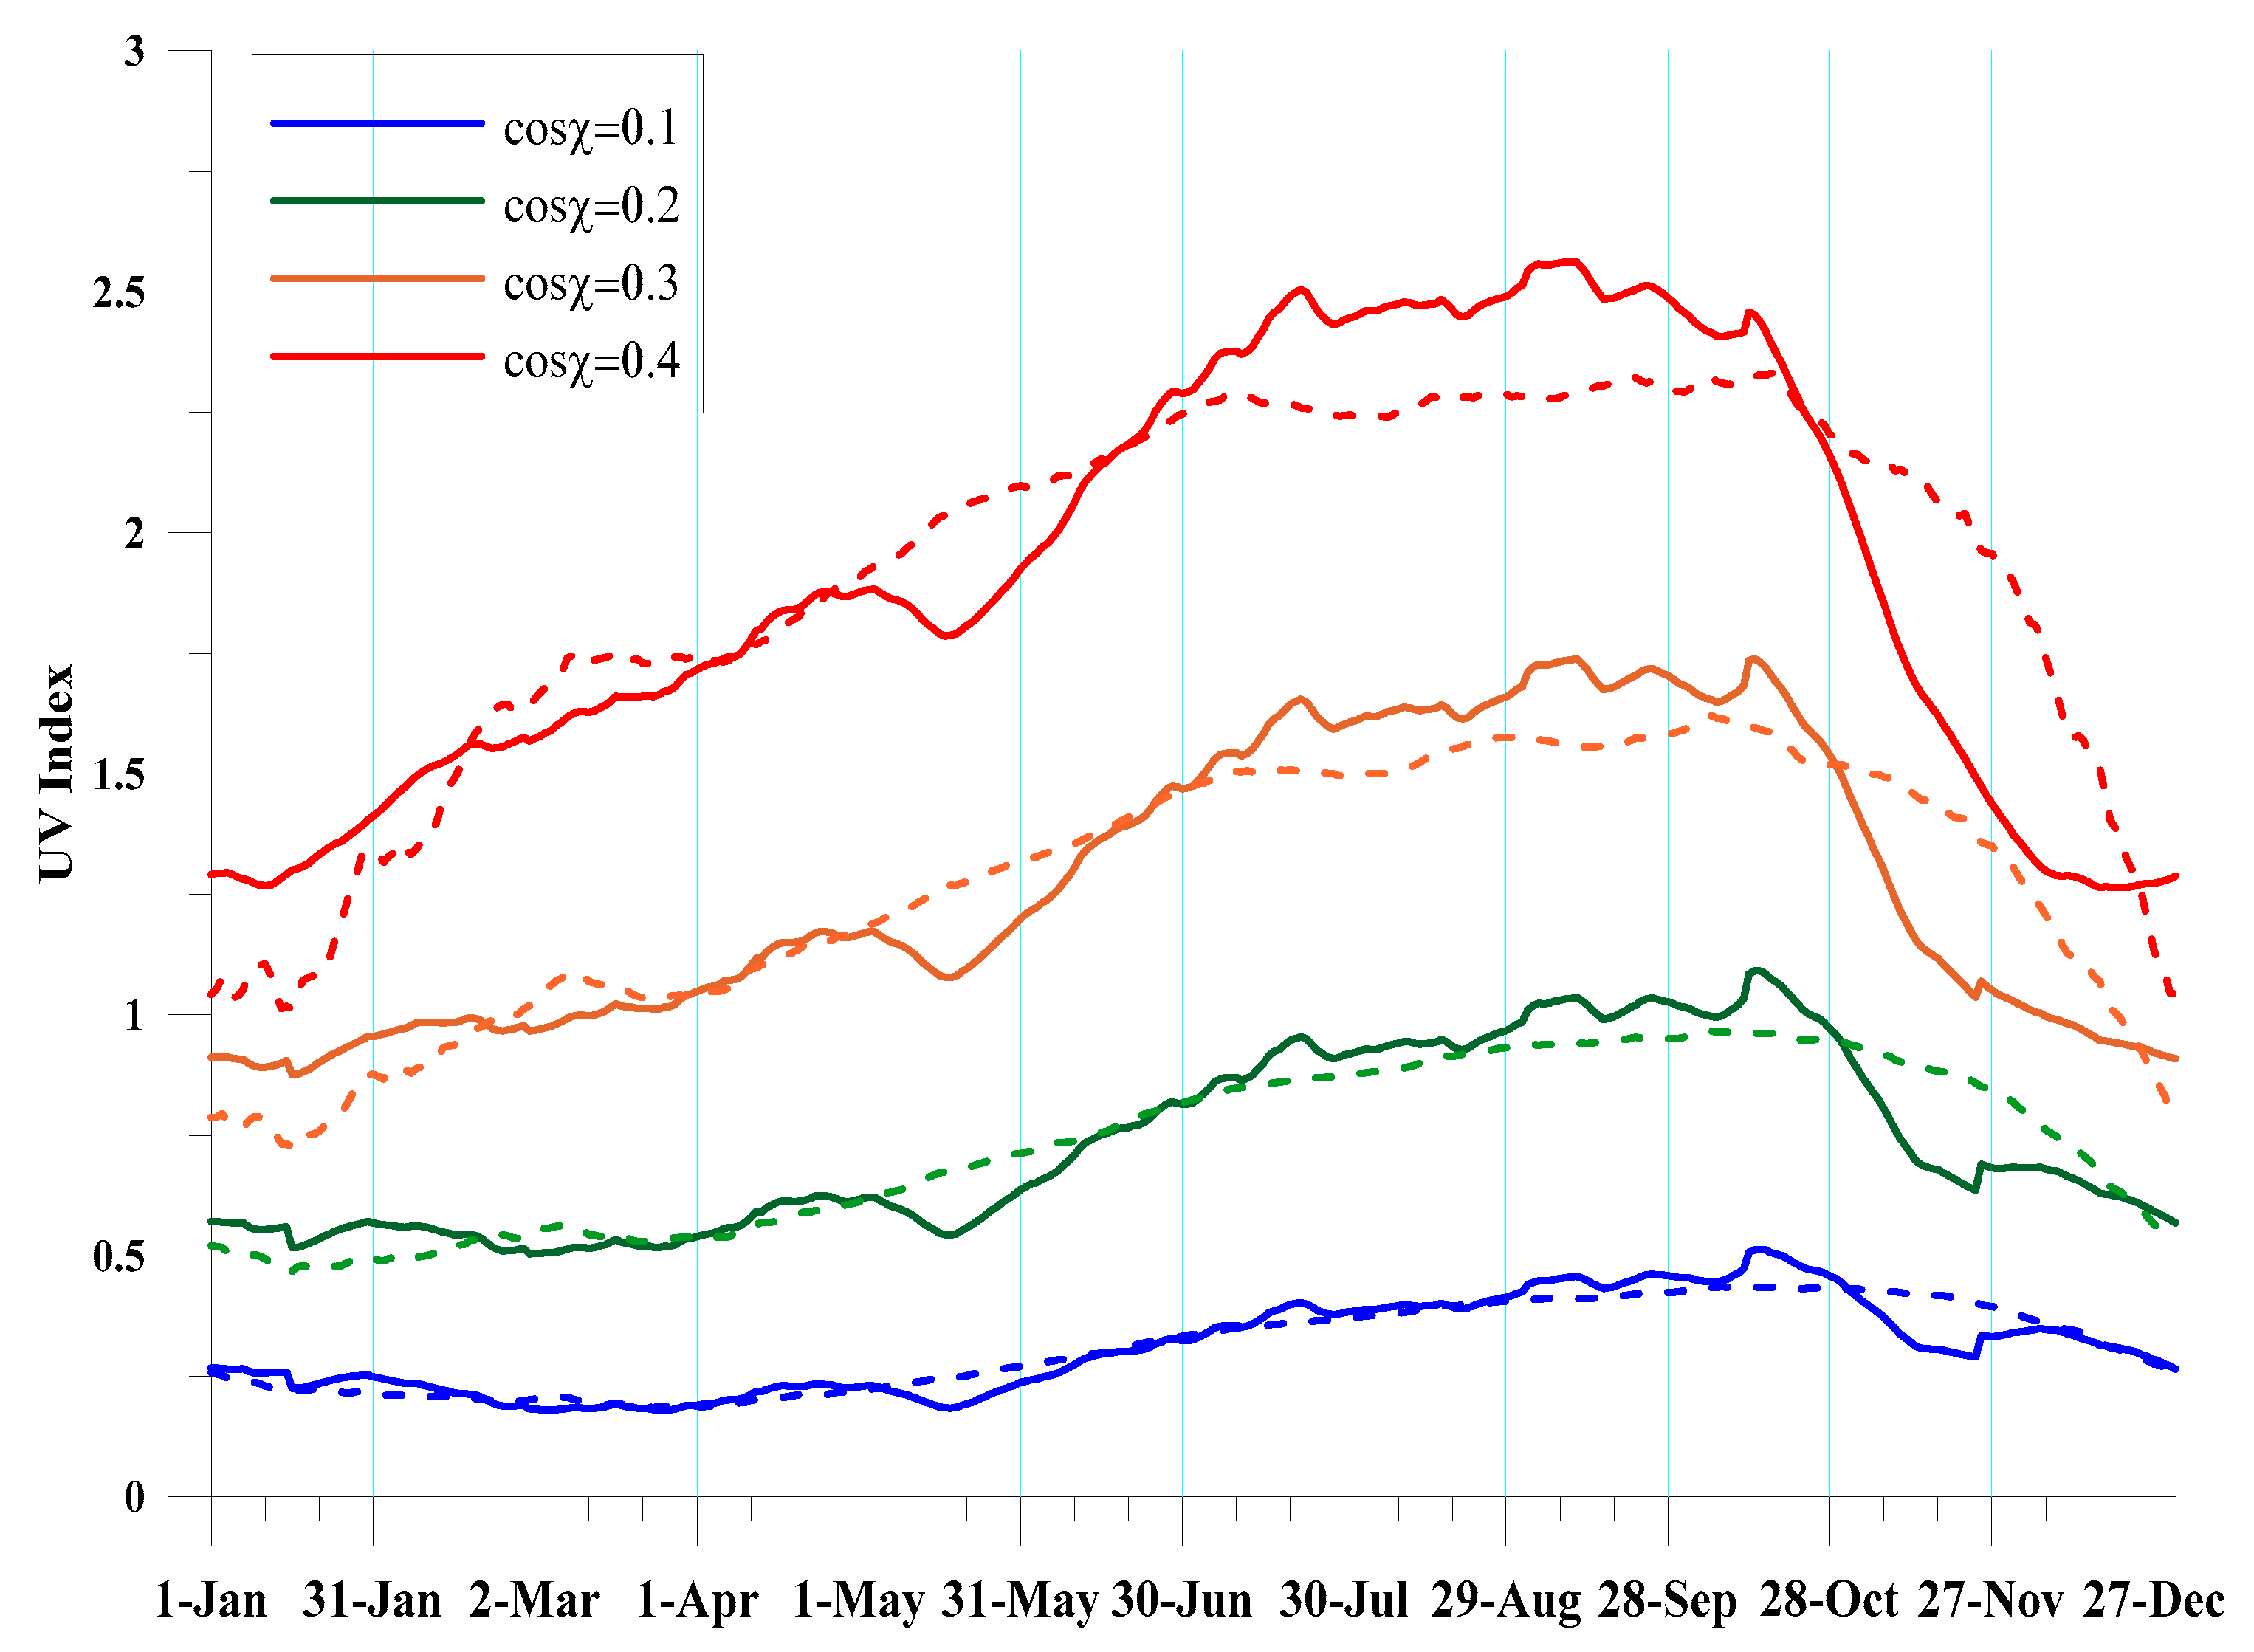
Compiling a Composite Year

It is well known that cloud cover reduces the intensity of UV radiation, and measurements in cloudy weather conditions are not reliable or suitable for studies such as the present one [14].
The above is the rationale to follow the behavior of the UV-Index over Sofia for several consecutive days with different synoptic forecast. Figure 1 shows the course of the UV-Index for six consecutive days from 8 to 13 June 2022, during which the weather in Sofia was variable—from sunny to cloudy with rain. The figure shows that on days with clear and sunny weather, the UV-Index is around 8 (on 8 and 9 June). In the following days, the weather tends to be cloudy and rainy with UV-Index values falling below 6 (see days 10, 11 and 12 June). The decrease in UV-Index in rainy hours actually turns out to be about five times.
To determine by statistical methods the values of the UV-Index for each day and hour of the year, the available quantity is organized as a database of values. These values were measured for a given day and hour of the year for the territory of Sofia by the two sets of equipment. In addition, the data for a given day and hour are included in the measurements of the two previous and the two following days at the same hour. This inclusion is justified by the fact that the change in the zenith angle of the Sun in five days can be considered insignificant. In this way, for each day and hour of the year, around 90–100 measured values are available under different weather conditions, which allows us to apply statistical methods to determine the value of the UV-Index for a given day and hour in clear weather. Figure 2 shows the number of valid values for each hour of the day for four selected days of the year. The accepted definition of a non-valid value is a value that is negative or missing (i.e., missing measurement data). The middle of the months January, April, July and October was chosen to track the number of valid values and the behavior of the UV-Index in the different seasons.
Figure 3 shows the diurnal trend of some statistical characteristics of the composite year thus compiled. The mean value shown in the graph is obviously inappropriate for estimating the UV-Index in clear weather because it corresponds to some average seasonal cloudiness. Some papers have used the upper decile of the data set for a given day and hour for the value corresponding to clear weather, which lowers the high values obtained with a probability of 10%. In their study, the authors of [21] propose an empirical model for predicting the average hourly values of UV-Index over Sofia depending on the local time and day of the year in clear weather. Again on the basis of upper decile and some physical concepts of absorption of UV-radiation in the Earth’s atmosphere, an empirical model is proposed for forecasting its integral value, depending on the daily weather and season [22]. In the present study, it is proposed that we use the mean value of these measurements, which are greater than the upper decile, excluding the maximum value, which often turns out to be inaccurate. In Figure 3, for each of the months under consideration, this is shown with an orange line. The conclusions from the figure are that using the mean value of the measurements achieves a more accurate representation of the UV-Index values in clear weather, reducing the influence of data scattering due to the inaccuracies of the measuring equipment.
Empirical determination of the estimated values in clear weather of the UV-Index is illustrated in Figure 4. The statistically determined probability that the measured value of the UV-Index is less than or equal to the value reported on the vertical axis is shown. For this purpose, for a given hour of a given day, the collected values are ordered by magnitude. Each value corresponds to a probability equal to its sequence number divided by the total number of values. The upper decile value is that value that has a probability of 0.9 (red solid line, see Figure 3). The figure shows how the maximum values with a corresponding probability of 1.0 in some cases come out of the smooth course of the dependence (most clearly seen in Figure 3, upper left panel). The proposed estimated value of the UV-Index in clear weather is obtained by averaging the values that have a probability above 0.9 without the one that has a probability of 1.0. It should be noted that the empirical probabilities shown do not resemble, for example, the standard Gaussian distribution.
Figure 5a shows the full composite year, each day and hour of which is represented by the mean UV-Index value between the upper decile and the maximum of the row of measured values for the corresponding day and hour. The UV-Index at night has a zero value. Figure 5b shows the 31-day running average values of the UV-Index. It can be seen from Figure 5 that the smoothing removes the short-time variations, which apparently have no physical causes, but are due to the inaccuracies of the measurements and the approximate nature of the above method for extracting the measurement data in the absence of cloudiness.
The diurnal and seasonal behavior of the estimated values of the UV-Index shown in Figure 5a allows us to check how much the dependence of the UV-Index on the zenith angle of the Sun, used as a justification for creating an empirical forecasting model, corresponds to reality. In previously published articles [21,22] it is justified that, in a first approximation, the UV-Index must depend on the square of the cosine of the zenith angle (χ). The reasons for this are firstly the projection of the solar radiation flow in a horizontal plane, and secondly the increase in the optical path through the absorbing layer of the atmosphere. As in these works, an attempt was made in the present work to empirically model the diurnal behavior of the UV-Index according to the formula:
U V I ( D O Y , u t c ) = U V I n o o n ( D O Y ) c o s 2 ( χ n o o n ( D O Y ) ) c o s 2 ( χ ( D O Y , u t c ) )
For a given day of the year (DOY), the value from Figure 5b at 11 UTC is used as the noon value (UVInoon(DOY)). As mentioned above, the measuring equipment records the average value for the past hour at 11UTC, which can be considered to correspond to the universal time of 10:30 UTC. At the longitude of the city of Sofia 23.20° E, local noon occurs at 10:45 UTC. Under these assumptions, the seasonal behavior that is due to the seasonal change of the zenith angle of the Sun at noon and the other factors that determine the seasonal variability of the UV-Index is fully empirically accounted for by the data.
Figure 6 shows the trend of the measured UV-Index values at 11UTC during the first 6 months of 2022 and the clear weather index values obtained by the described methodology from the data up to 2022. In very few cases, the measured values at local noon approach the statistically determined values for the previous 15-year period in clear weather, indicating that these values are not underestimated.
Figure 7a shows the diurnal and seasonal variability of the UV-Index obtained according to the simplified model. Figure 7b shows the differences between the measured values (see Figure 5b) and the model values (see Figure 7a). The maximum difference is about 1.5 which can be considered acceptable. Determining the accurate dependence of the UV-Index on the zenith angle of the Sun requires carrying out precise measurements on meteorologically completely clear days. An example study of the influence of certain characteristics such as Total Ozone Column, Water Column and Aerosol Optical Depth on the UV-Index enables an assessment of the extent to which meteorological conditions and cloud cover contribute to the absorption of biologically active ultraviolet radiation. In the same work, the authors show that there is a deviation from the simplified theoretical relationship between the cosine of the zenith angle of the Sun and the UV-Index at the Earth’s surface [23].
The daily-seasonal behavior of the UV-Index obtained in the present work allows us to verify the assumption about the influence of the seasonal course of two of the factors of absorption of ultraviolet radiation—Total Ozone Column and the concentration of PM10. Two works on the territory of Bulgaria and Greece, in which the influence of different atmospheric components on changes in UV radiation is examined, show that total ozone is the most significant for UV radiation that reaches the Earth [23,27]. The other factor presented as an absorber of UV radiation is PM10, which is also one of the main air pollutants [28,29].
Based on OMI satellite data for the period 2007–2021, a composite year was calculated by averaging the daily TOC values for the data grid point with coordinates 42.5° N, 23.5° E. The smoothed values with a 31-day running segment are shown in Figure 8a. The seasonal variability of TOC over Sofia is typical of mid-latitudes in the Northern Hemisphere with a maximum at the spring equinox and a minimum at the autumn equinox [26]. The average seasonal trend of the concentration of PM10 was calculated on the basis of the data of the station “Druzhba” in the city of Sofia. This station is part of the official network for monitoring of the Ministry of Environment and Water of Bulgaria. The data for the time period used, 2009–2020, is hourly, which allows us to calculate a composite year at fixed zenith angles of the Sun, shown in Figure 8b. The concentration of particulate matter is minimal in the summer months and maximal in the winter months, which is characteristic of the conditions of the city of Sofia.
Figure 9 shows the seasonal variability of the UV-Index indicated by solid lines at fixed zenith angles of the Sun. The maximum cosχ = 0.4 corresponds to local noon at the winter solstice, therefore limiting the possibility of obtaining a series of data for the whole year. UV-Index values were calculated from the data shown in Figure 5b by interpolation.
In Figure 9 the reconstruction of the seasonal course of the UV-Index according to the regression dependence described above is shown with a dashed line. The qualitative matching of the data and regression behavior shows that the hypothesis of the influence of the concentration of particulate matter on the UV-Index together with the known role of atmospheric ozone can explain the peculiarities of the seasonal behavior of the UV-Index in urban conditions.
The visible increase in UV-Index in the months of June, July, August and September can be explained by the reduction of TOC in the second half of the year. The decrease in the UV-Index during the winter months can be related to the increase in the concentration of particulate matter. In order to qualitatively verify the hypothesis of the complex influence of the seasonal behavior of the absorbing factors—atmospheric ozone and particulate matter—a regression analysis of the assumed dependence was performed. The simplest linear dependence of the UV-Index on TOC and PM10 is assumed by the following formula:
U V I ( D O Y , c o s χ ) = a T O C ( D O Y ) + b P M 10 ( D O Y ) + c
The regression coefficients a, b, c are determined by the method of least squares. The obtained values are presented in Table 1.
In Table 1, the free term c has no physical meaning; it reflects that the TOC data are daily averages and the PM10 data do not show significant differences depending on the zenith angle of the Sun. Coefficients a and b have negative values, which corresponds to the role of concentrations as an absorption factor of ultraviolet radiation.

4. Conclusions

The statistical analysis of the UV-Index data carried out in this work for a period of 15 years of continuous monitoring allows us to obtain estimated mean values of the UV-Index for the territory of the city of Sofia for every day of the year and every hour of the day in clear weather. These values are sufficient to prepare daily forecasts that can be adjusted depending on the weather forecast for relative cloudiness as recommended by the World Health Organization [24]. Results were obtained that show the applicability for practical purposes of the dependence of the UV-Index on the square of the cosine of the Sun’s zenith angle proposed in [21,22].
The additional study of the peculiarities of the seasonal variability of the UV-Index at a constant zenith angle makes it possible to empirically test the hypothesis of the influence not only of the seasonal variations of the Total Ozone Column, but also of the pollution represented by the concentrations of PM10. The obtained regression coefficients shown in Table 1 are indicative. An analogous result consistent with the present study was obtained in [30].
If, in the analysis of the data in the present work, the influence of dust pollution (particulate matter) in urban conditions is ignored, a regression coefficient of −0.0138 is obtained between the variations of TOC and the UV-Index at cosχ = 0.4, taking into account the values between 1 May and 31 August, when the level of PM10 is relatively constant. Therefore, neglecting the influence of pollution increases the dependence of the UV-Index on TOC by a factor of about two, and the estimate of this dependence approaches the estimate of [30]. In their work, the authors compared eighteen radiative transfer models used to calculate the UV-Index.
In addition to the main idea of the present study is the improvement of the model created for forecasting the active ultraviolet radiation from the Sun for the territory of the Republic of Bulgaria [21]. Monitoring of UV-B is one of the basic tasks of the department of Geophysics at the National Institute of Geophysics, Geodesy and Geography at the Bulgarian Academy of Sciences. The proposed methodology for predicting the active ultraviolet radiation refers to the public contracts related to the provision of information on the level of active ultraviolet radiation and its forecast (for the next day) via the Internet address: http://data.niggg.bas.bg/uv_index/uv_index_bg.php, accessed on 15 July 2022.
All of the above shows the importance and results of the present study and the significance of UV-Index measurements and predictions in order to reduce harm to human health.

Author Contributions

Conceptualization, P.M. and N.M.; methodology, P.M.; software, P.M. and R.B.; validation, P.M. and R.B.; formal analysis, R.B.; investigation, P.M.; resources, P.M.; data curation, P.M. and R.B.; writing—original draft preparation, P.M. and R.B.; writing—review and editing, N.M.; visualization, P.M.; supervision, N.M. All authors have read and agreed to the published version of the manuscript.

Funding

This work is supported by Contract No. DO1-404/18.12.2020—Project “National Geoinformation Center (NGIC)” financed by the National Roadmap for Scientific Infrastructure 2017–2023. This work has also been carried out in the Science and Education for Smart Growth Operational Program (2014–2020) and co-financed by the European Union through the European Structural and Investment funds: BG05M2OP001-1.001-0003.

Institutional Review Board Statement

Not applicable.

Informed Consent Statement

Not applicable.

Data Availability Statement

The database of UV-Index and TOC values for Bulgaria used in the current investigation is available from the corresponding author upon reasonable request. The following information for global TOC data from the Ozone Monitoring Instrument (OMI) can be downloaded at: https://Ozonewatch.gsfc.nasa.gov/data/omi/, accessed on 15 July 2022.

Acknowledgments

The authors express their acknowledgment to Ozone Monitoring Instrument (OMI) for freely available data of TOC.

Conflicts of Interest

The authors declare no conflict of interest.

References

  1. Lyman, D. Undiagnosed vitamin D deficiency in the hospitalized patient. Am. Fam. Physician 2005, 71, 299–304. [Google Scholar]
  2. Ghosh, A.K.; Joshi, S. Disorders of calcium, phosphorus and magnesium metabolism. Japi 2008, 56, 613–621. [Google Scholar]
  3. Hart, P.H.; Gorman, S.; Finlay-Jones, J.J. Modulation of the immune system by UV radiation: More than just the effects of vitamin D? Nat. Rev. Immunol. 2011, 11, 584–596. [Google Scholar]
  4. Wang, X.; Zhang, Z.; Wu, S.C. Health benefits of Silybum marianum: Phytochemistry, pharmacology, and applications. J. Agric. Food Chem. 2020, 68, 11644–11664. [Google Scholar]
  5. Liu, D.; Fernandez, B.O.; Hamilton, A.; Lang, N.N.; Gallagher, J.M.; Newby, D.E.; Feelisch, M.; Weller, R.B. UVA irradiation of human skin vasodilates arterial vasculature and lowers blood pressure independently of nitric oxide synthase. J. Investig. Dermatol. 2014, 134, 1839–1846. [Google Scholar]
  6. Ponsonby, A.L.; McMichael, A.; Van Der Mei, I. Ultraviolet radiation and autoimmune disease: Insights from epidemiological research. Toxicology 2002, 181, 71–78. [Google Scholar]
  7. Barbhaiya, M.; Costenbader, K.H. Ultraviolet radiation and systemic lupus erythematosus. Lupus 2014, 23, 588–595. [Google Scholar]
  8. Artuković, M.; Ikić, M.; Kuštelega, J.; Artuković, I.N.; Kaliterna, D.M. Influence of UV radiation on immunological system and occurrence of autoimmune diseases. Coll. Antropol. 2010, 34, 175–178. [Google Scholar]
  9. D’Orazio, J.; Jarrett, S.; Amaro-Ortiz, A.; Scott, T. UV radiation and the skin. Int. J. Mol. Sci. 2013, 14, 12222–12248. [Google Scholar]
  10. Coelho, S.G.; Choi, W.; Brenner, M.; Miyamura, Y.; Yamaguchi, Y.; Wolber, R.; Smuda, C.; Batzer, J.; Kolbe, L.; Ito, S.; et al. Short-and long-term effects of UV radiation on the pigmentation of human skin. J. Investig. Dermatol. Symp. Proc. 2009, 14, 32–35. [Google Scholar]
  11. De Gruijl, F.R. Skin cancer and solar UV radiation. Eur. J. Cancer 1999, 35, 2003–2009. [Google Scholar]
  12. Kaleyna, P.; Muhtarov, P.; Miloshev, N. Condition of the stratospheric and mesospheric ozone layer over Bulgaria for the period 1996–2012: Part 1—total ozone content, seasonal variations. Bulg. Geophys. J. 2013, 39, 9–16. [Google Scholar]
  13. Kaleyna, P.; Muhtarov, P.; Miloshev, N. Condition of the stratospheric and mesospheric ozone layer over Bulgaria for the period 1996–2012, Part 2: Total ozone content, short term variations. Bulg. Geophys. J. 2013, 39, 17–25. [Google Scholar]
  14. Vanicek, K.; Frei, T.; Litynska, Z.; Schmalwieser, A. UV-Index for the Public; Publication of the European Communities: Brussels, Belgium, 2000. [Google Scholar]
  15. Hall, E.S. Comparison of five modeling approaches to quantify and estimate the effect of clouds on the Radiation Amplification Factor (RAF) for solar ultraviolet radiation. Atmosphere 2017, 8, 153. [Google Scholar]
  16. Madronich, S.; McKenzie, R.L.; Björn, L.O.; Caldwell, M.M. Changes in biologically active ultraviolet radiation reaching the Earth’s surface. J. Photochem. Photobiol. B Biol. 1998, 46, 5–19. [Google Scholar]
  17. Tevini, M. UV-B radiation and ozone depletion. In Effects on Humans, Animals, Microorganisms and Materials; Lewis Publishers: Boca Raton, FL, USA, 1993. [Google Scholar]
  18. Blumthaler, M.; Salzgeber, M.; Ambach, W. Ozone and ultraviolet-B irradiances: Experimental determination of the radiation amplification factor. Photochem. Photobiol. 1995, 61, 159–162. [Google Scholar]
  19. Kim, J.E.; Ryu, S.Y.; Kim, Y.J. Determination of radiation amplification factor of atmospheric aerosol from the surface UV irradiance measurement at Gwangju, Korea. Theor. Appl. Climatol. 2008, 91, 217–228. [Google Scholar]
  20. Fioletov, V.; Kerr, J.B.; Fergusson, A. The UV index: Definition, distribution and factors affecting it. Can. J. Public Health 2010, 101, I5–I9. [Google Scholar]
  21. Bojilova, R.; Mukhtarov, P.; Miloshev, N. Climatology of the index of the biologically active ultraviolet radiation for Sofia. An Empirical Forecast Model for Predicting the UV-Index. Comptes Rendus De L Acad. Bulg. Des Sci. 2020, 73, 531–538. [Google Scholar]
  22. Mukhtarov, P.; Miloshev, N.; Gadzhev, G.; Bojilova, R. Monitoring and forecasting the biologically active ultraviolet radiation of the sun. Bulg. Geophys. J. 2020, 43, 31–42. [Google Scholar]
  23. Bojilova, R.; Mukhtarov, P.; Miloshev, N. Investigation of the dependence of ultraviolet radiation on the day. In International Conference on Environmental Protection and Disaster RISKs; Springer: Cham, Switzerland, 2022; in press. [Google Scholar]
  24. World Health Organization and International Commission on Non-Ionizing Radiation Protection. Global Solar UV Index: A Practical Guide; World Health Organization: Geneva, Switzerland, 2002; No. WHO/SDE/OEH/02.2.
  25. McKinlay, A.; Diffey, B.L. A reference action spectrum for ultraviolet induced erythema in human skin. In Human Exposure to Ultraviolet Radiation: Risks and Regulations; Elsevier: Amsterdam, The Netherlands, 1987; pp. 83–87. [Google Scholar]
  26. Bojilova, R.; Mukhtarov, P.; Miloshev, N. Latitude Dependence of the Total Ozone Trends for the Period 2005–2020: TOC for Bulgaria in the Period 1996–2020. Atmosphere 2022, 13, 918. [Google Scholar]
  27. Bais, A.F.; Zerefos, C.S.; Meleti, C.; Ziomas, I.C.; Tourpali, K. Spectral measurements of solar UVB radiation and its relations to total ozone, SO2, and clouds. J. Geophys. Res. Atmos. 1993, 98, 5199–5204. [Google Scholar]
  28. Su, Y.; Wu, X.; Zhao, Q.; Zhou, D.; Meng, X. Interference of Urban Morphological Parameters in the Spatiotemporal Distribution of PM10 and NO2, Taking Dalian as an Example. Atmosphere 2022, 13, 907. [Google Scholar]
  29. Gadzhev, G.; Ganev, K. Computer simulations of air quality and bio-climatic indices for the city of Sofia. Atmosphere 2022, 12, 1078. [Google Scholar]
  30. Koepke, P.; Bais, A.; Balis, D.; Buchwitz, M.; De Backer, H.; de Cabo, X.; Eckert, P.; Eriksen, P.; Gillotay, D.; Heikkilä, A.; et al. Comparison of models used for UV index calculations. Photochem. Photobiol. 1998, 67, 657–662. [Google Scholar]
Figure 1. Behavior of the UV-Index from 8 to 13 June 2022 under variable weather conditions in the city of Sofia.
Atmosphere 13 01455 g001
Figure 2. Number of valid UV-Index values for each hour of the day for four days of the year (15 January (upper left), 15 April (upper right), 15 July (lower left), 15 October (lower right)) during winter, spring, summer and autumn seasons.
Atmosphere 13 01455 g002
Figure 3. Illustration the mean values (blue solid line), the upper decile (green solid line), the maximum values (red solid line) and the estimated values of the UV-Index in clear weather obtained by the proposed methodology—mean values from upper decile to maximum (orange solid line) for four days of the year (15 January (upper left), 15 April (upper right), 15 July (lower left), 15 October (lower right)).
Atmosphere 13 01455 g003
Figure 4. Empirically determined probability distribution function for four days of the year (15 January (upper left), 15 April (upper right), 15 July (lower left), 15 October (lower right)) and three hours of the day.
Atmosphere 13 01455 g004
Figure 5. (a) Diurnal and seasonal variability of the estimated UV-Index values in clear weather, obtained according to the proposed methodology from the data and (b) 31-day running mean.
Atmosphere 13 01455 g005
Figure 6. Trend of measured UV-Index values at 11UTC in 2022 (solid red line) and estimated clear-weather index values obtained from data before 2022 (solid blue line).
Atmosphere 13 01455 g006
Figure 7. (a) Diurnal and seasonal behavior of the UV-Index in clear weather using the theoretical dependence on the square of the cosine of the zenith angle of the Sun and (b) the differences from the empirically determined values for hours different from 11 UTC. The zero line is marked with white color.
Atmosphere 13 01455 g007
Figure 8. (a) Average seasonal behavior of the TOC over Sofia and (b) average seasonal variability of the concentration of PM10.
Atmosphere 13 01455 g008
Figure 9. Seasonal distribution of UV-Index estimates at fixed zenith angles of the Sun (all solid lines) and values obtained by linear regression with Total Ozone Column and the concentration of PM10 (all dash lines).
Atmosphere 13 01455 g009
Table 1. Values of the obtained regression coefficients.
cosχa (TOC)b (PM10)c
0.1−0.00329−0.001501.42798
0.2−0.00586−0.006162.87053
0.3−0.00754−0.013304.24745
0.4−0.00791−0.023975.44401
Publisher’s Note: MDPI stays neutral with regard to jurisdictional claims in published maps and institutional affiliations.

