

Practical Application of a Multi-Bed Adsorbent Tube Coupled with GC-MS for Low-Level VOCs Identification to Achieve Comprehensive Odor Management


Abstract
:
1. Introduction
2. Materials and Methods
2.1. Materials
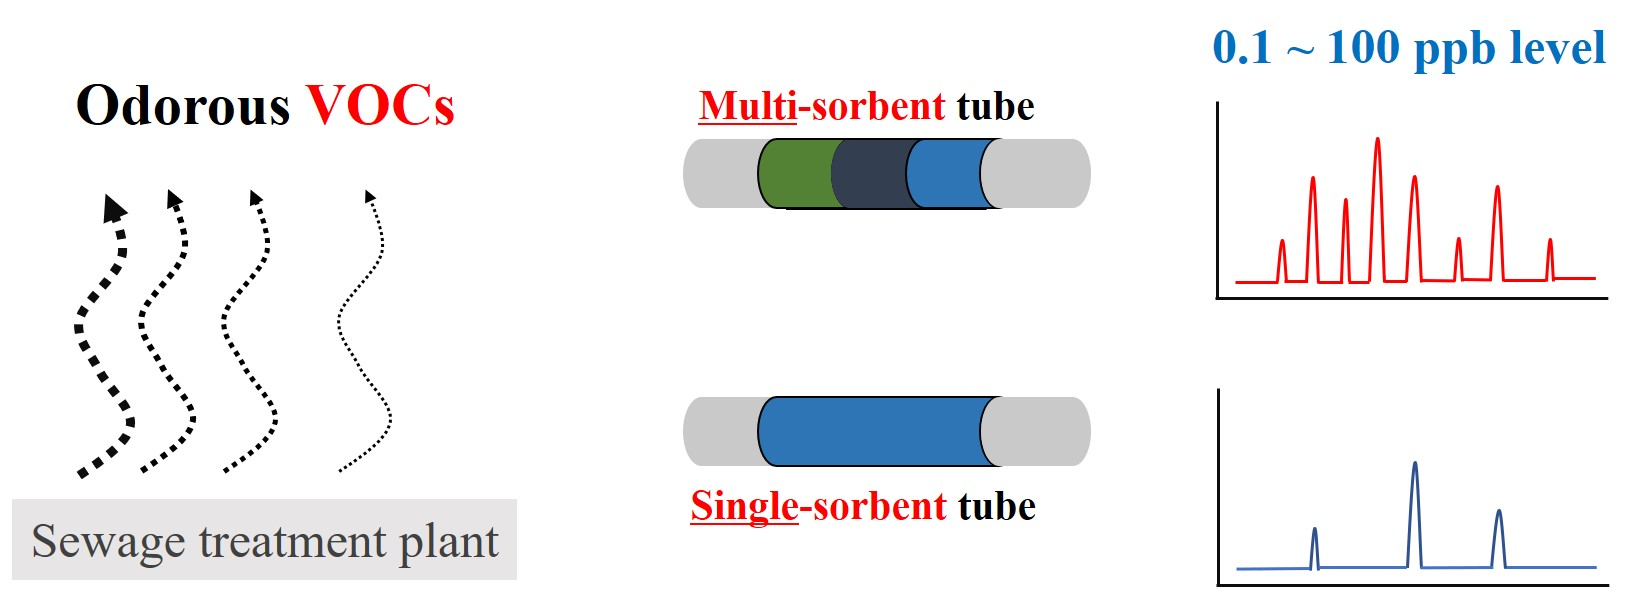
2.2. Sorbent Tubes
2.3. Experiments
2.3.1. Analytical Sensitivity
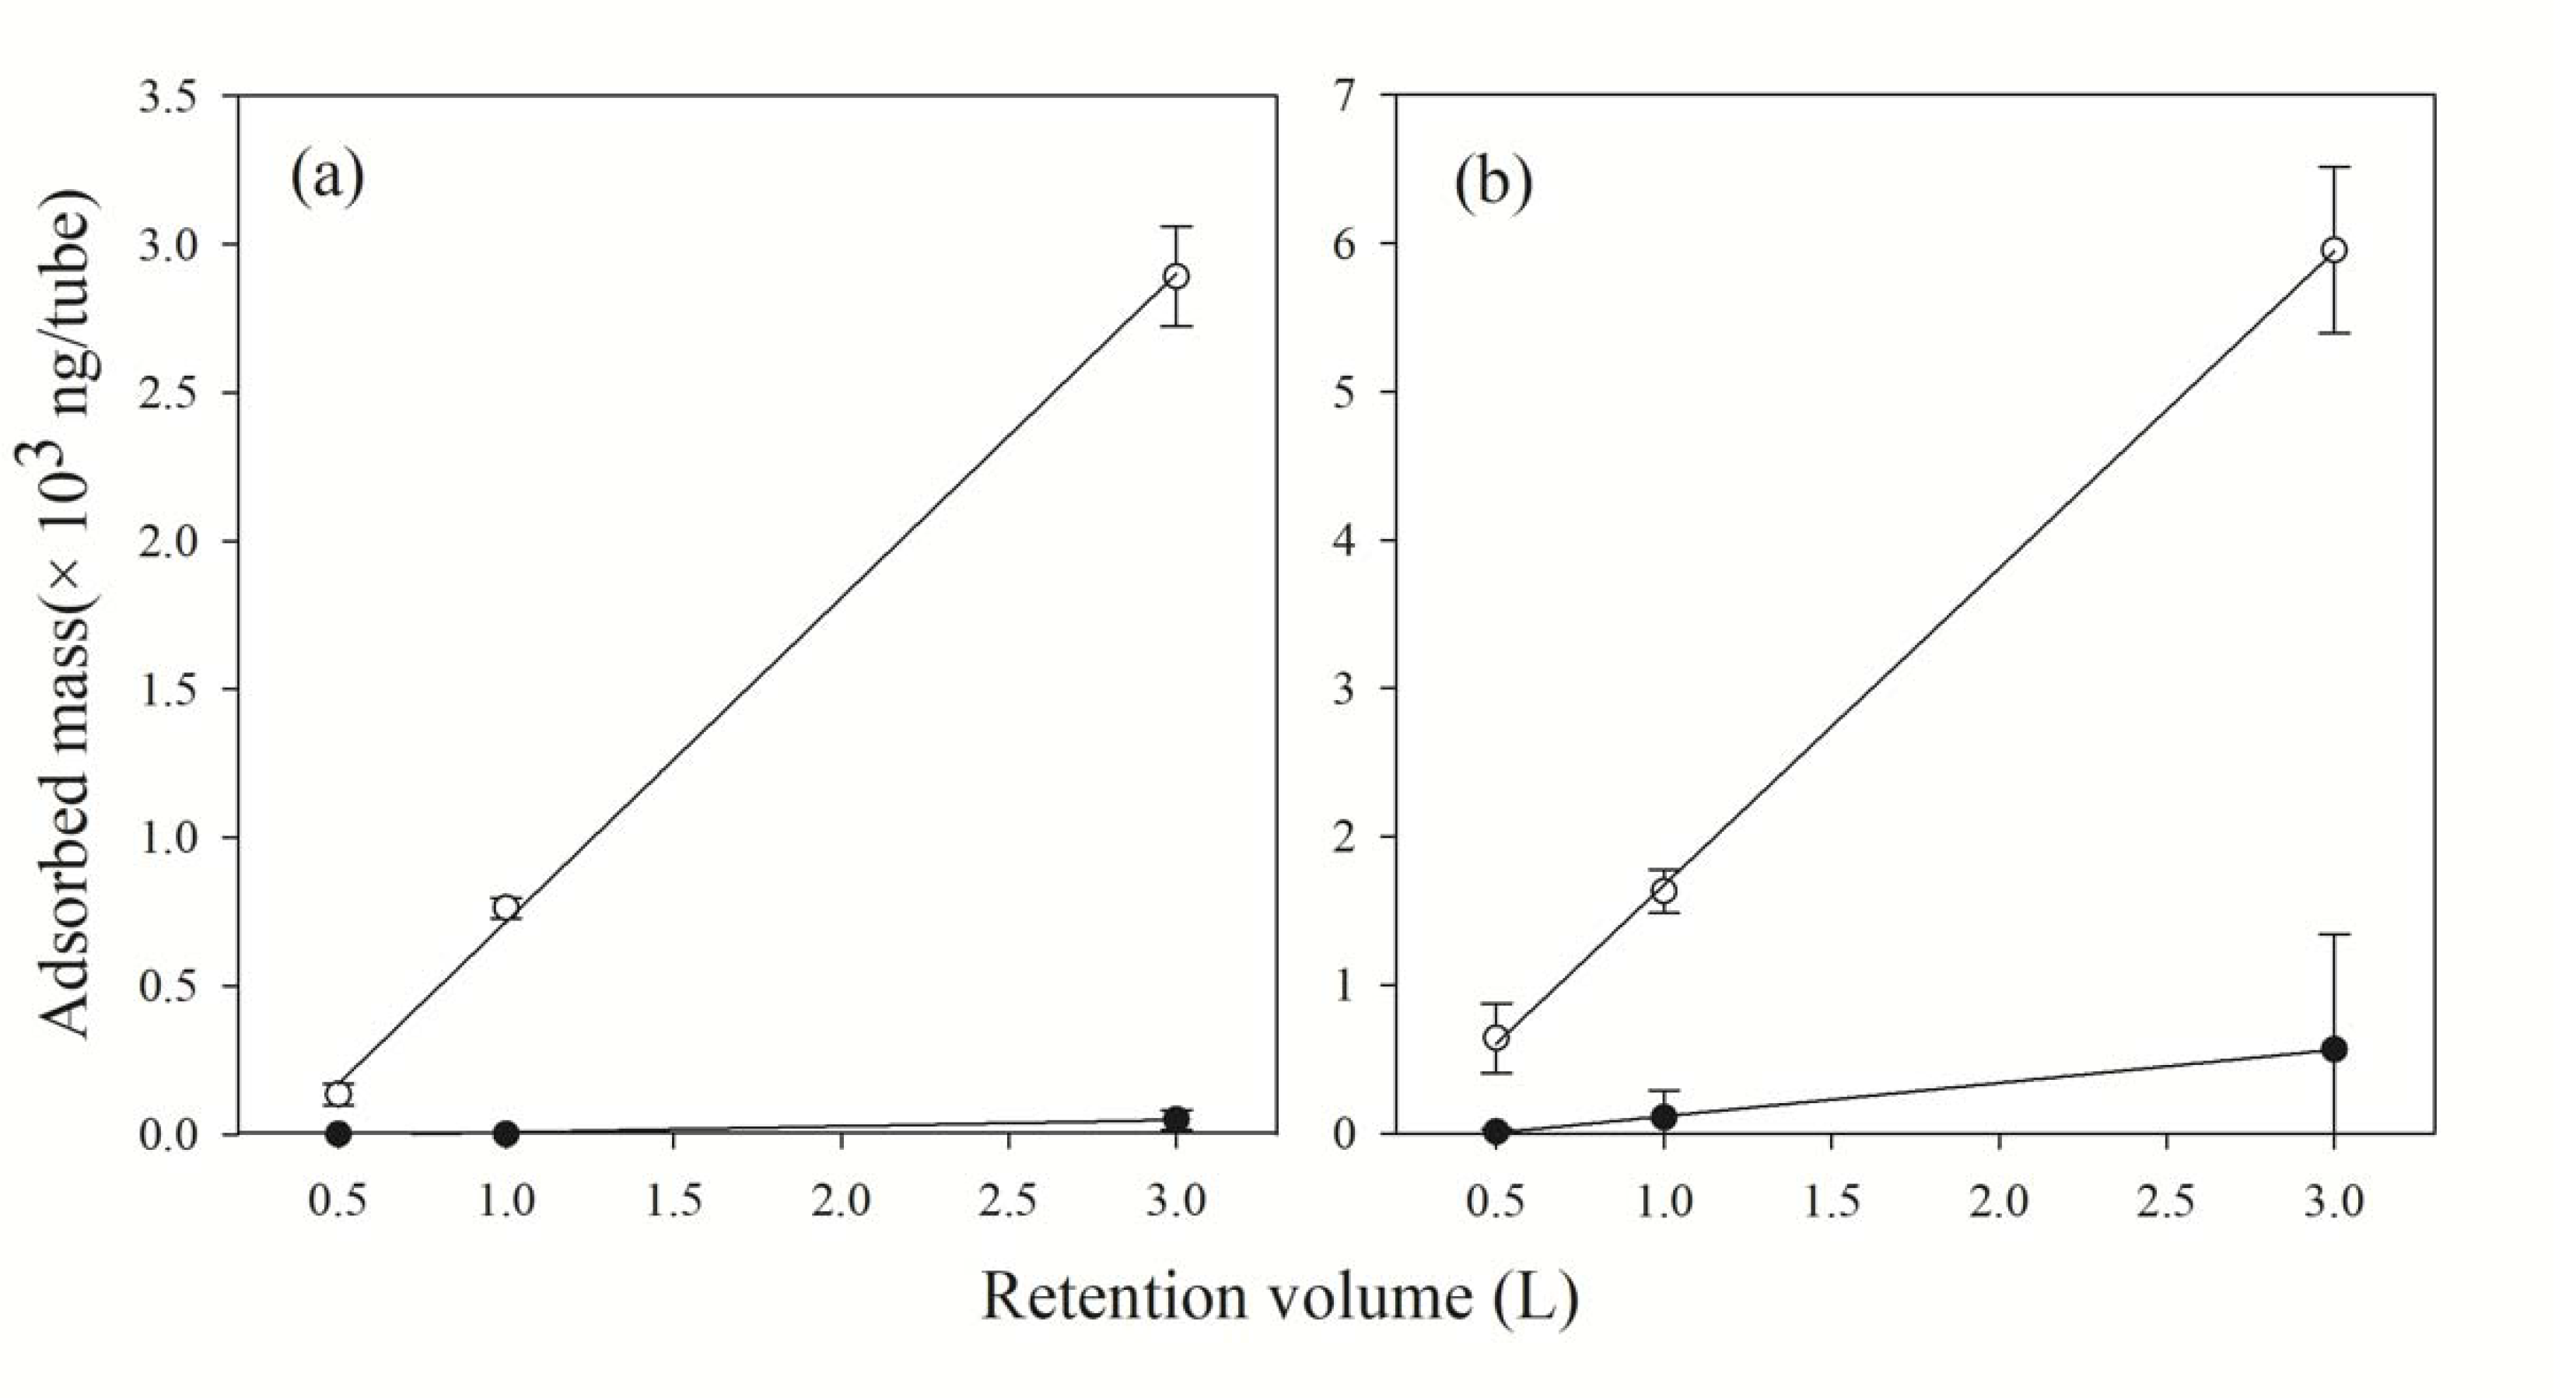
2.3.2. Breakthrough Volume
2.3.3. Analysis
2.3.4. Application to a Field Test
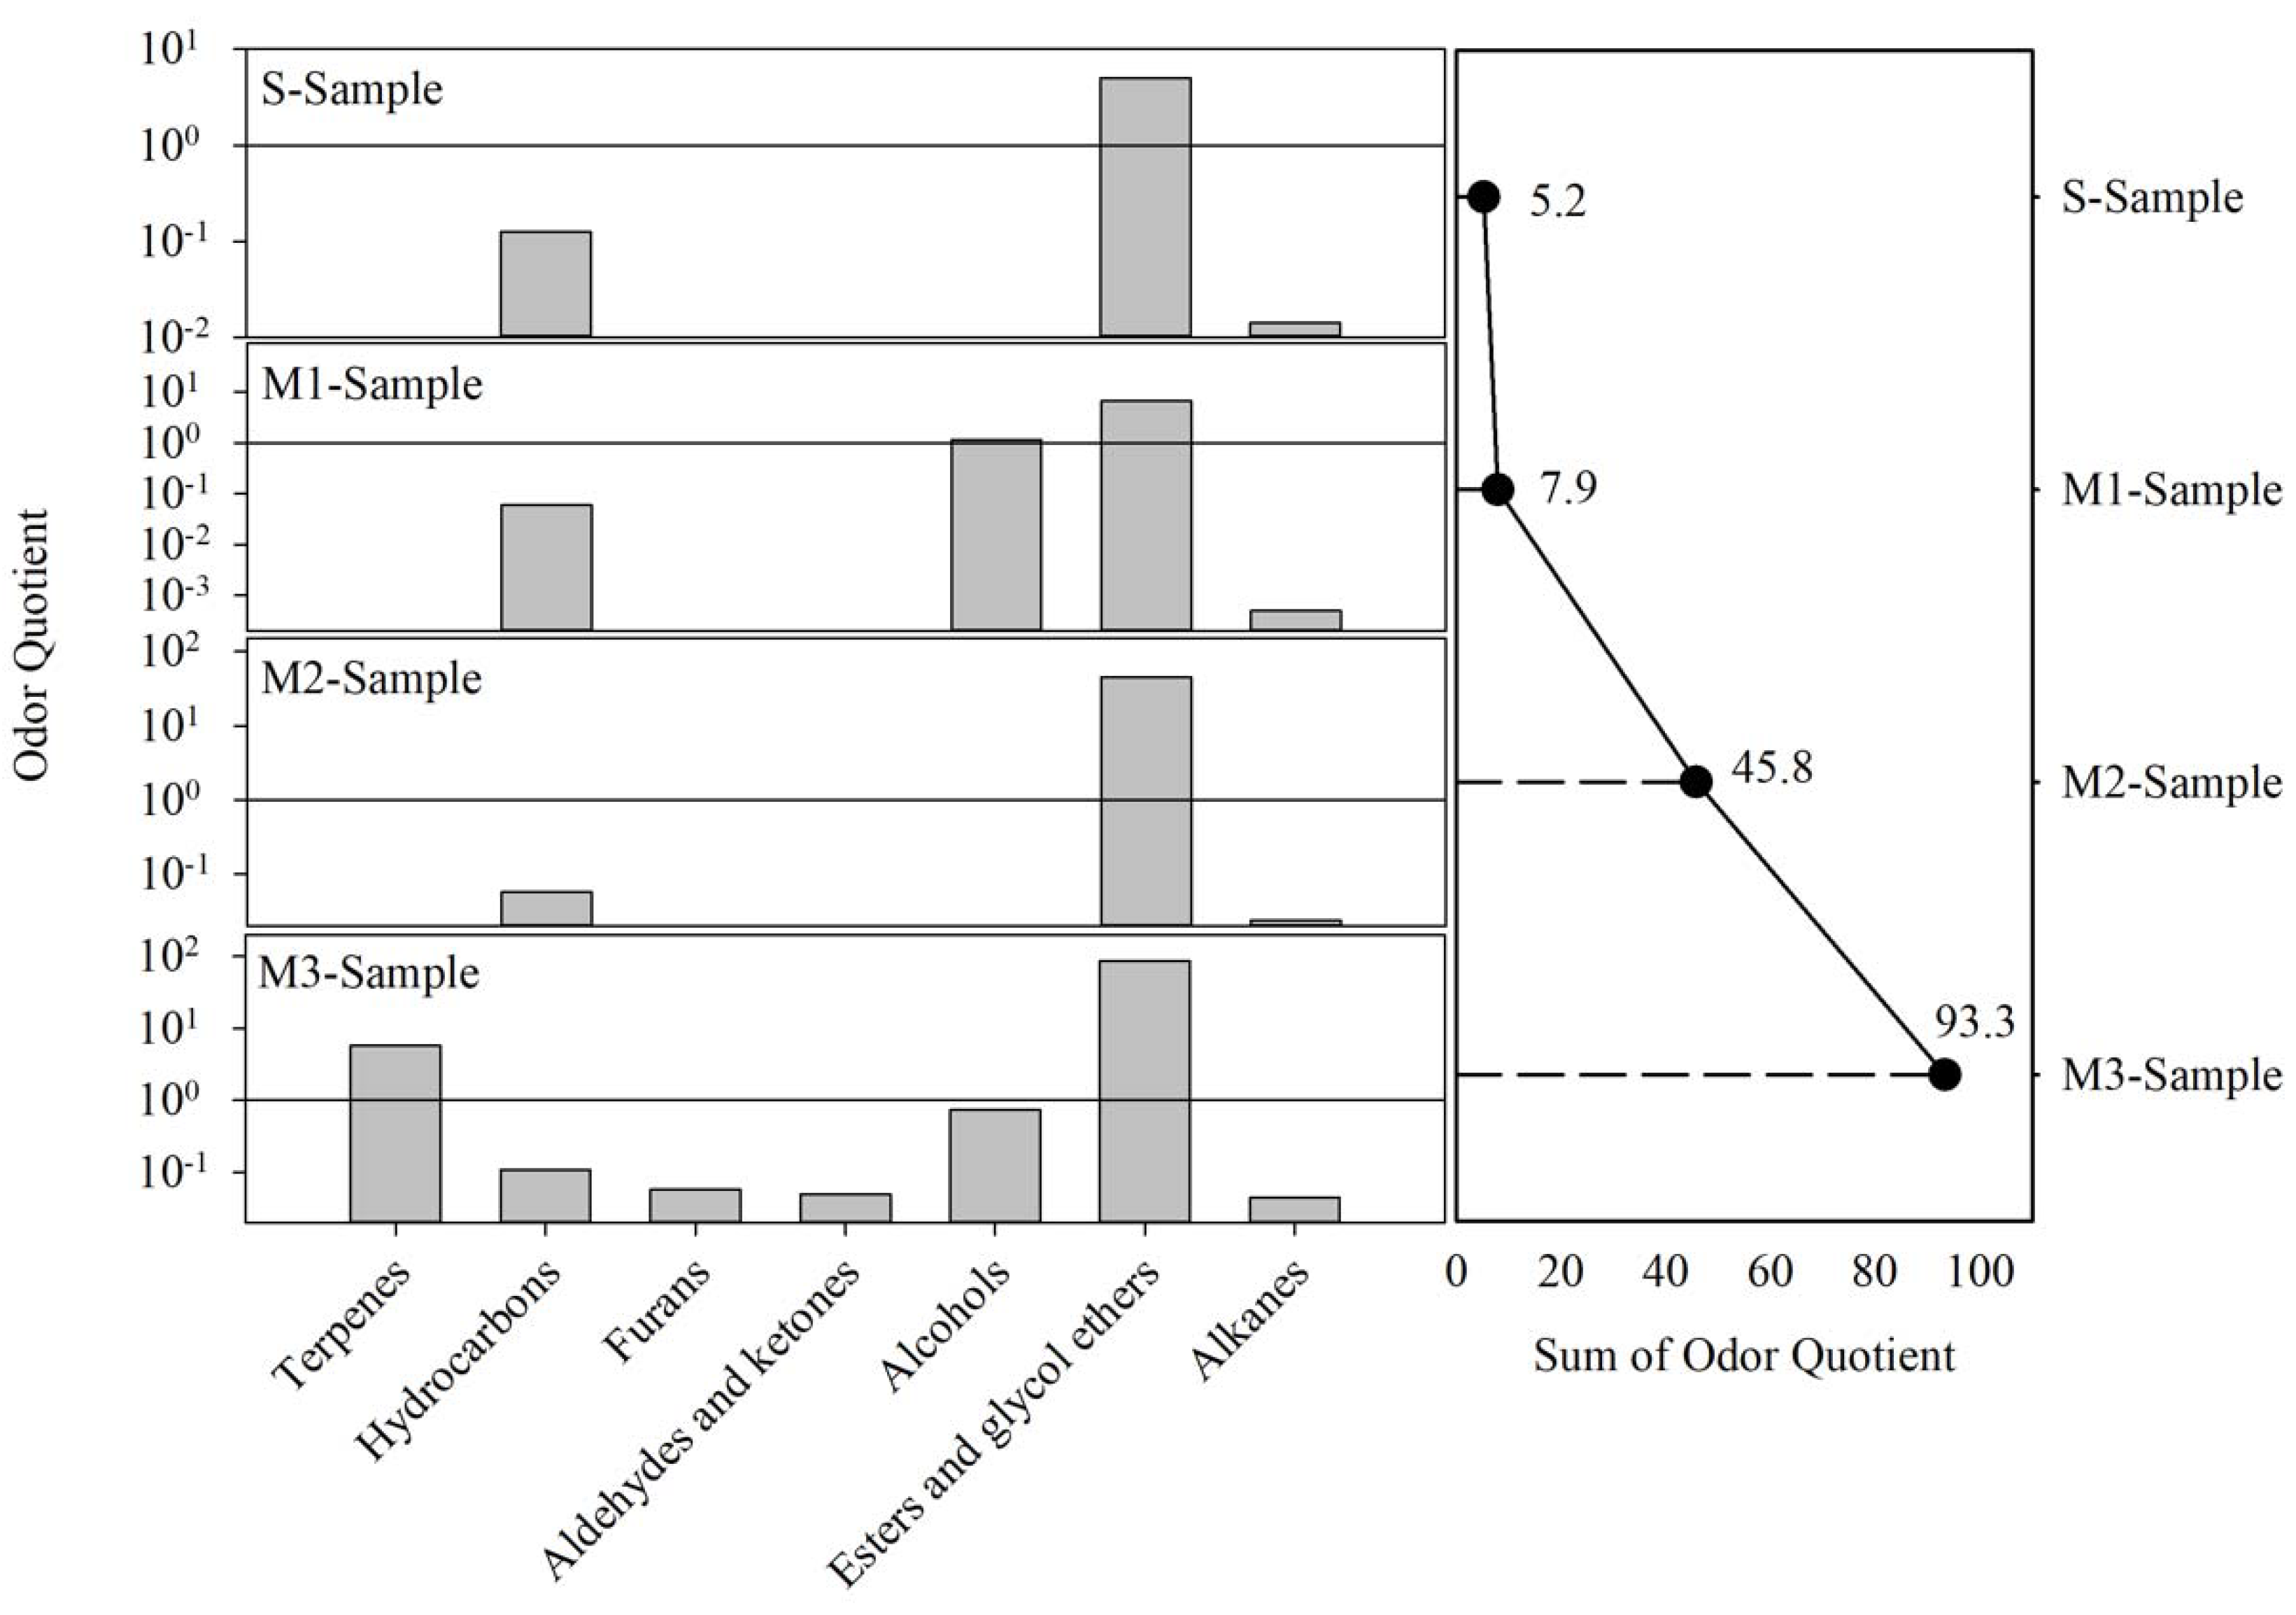
2.4. Odor Assessment
3. Results
3.1. TD/GC/MS Sensitivity
3.2. Breakthrough Volume
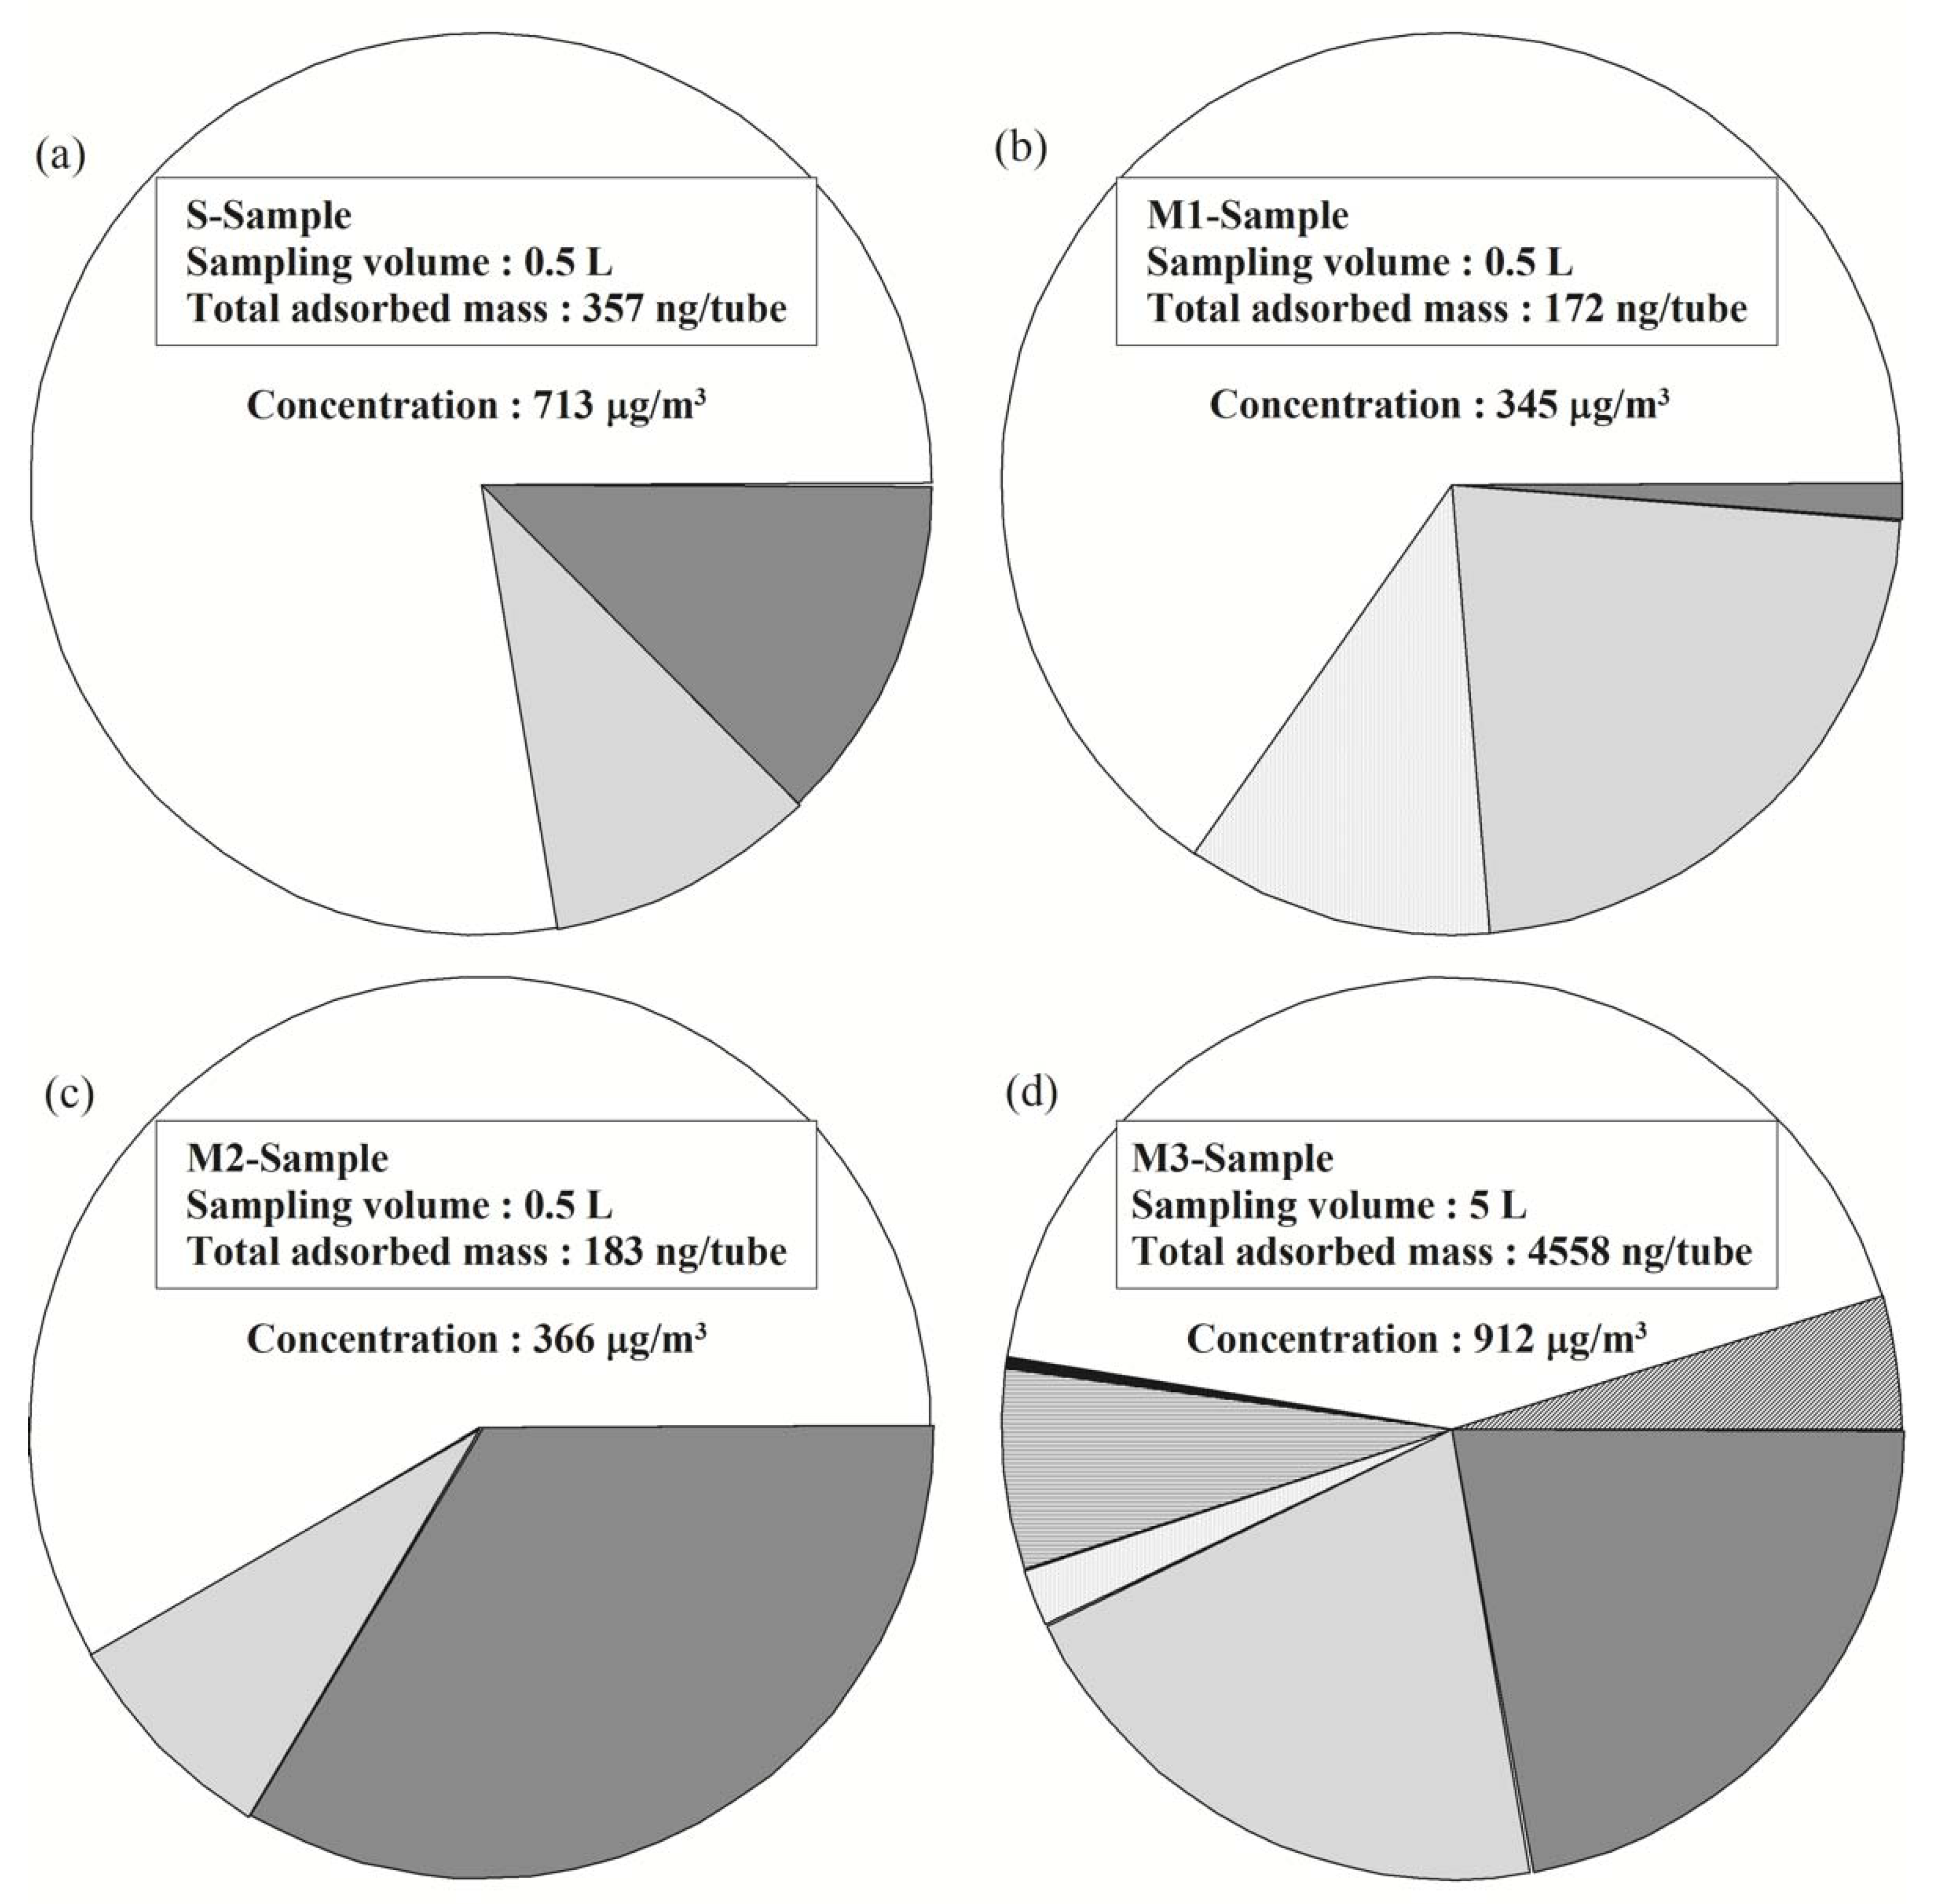
3.3. Field Study
4. Discussion
5. Conclusions
Supplementary Materials
Author Contributions
Funding
Conflicts of Interest
References
- Brattoli, M.; Cisternino, E.; Dambruoso, P.R.; De Gennaro, G.; Giungato, P.; Mazzone, A.; Palmisani, J.; Tutino, M. Gas chromatography analysis with olfactometric detection (GC-O) as a useful methodology for chemical characterization of odorous compounds. Sensors 2013, 13, 16759–16800. [Google Scholar] [PubMed]
- Gostelow, P.; Parsons, S.; Stuetz, R. Odour measurements for sewage treatment works. Water Res. 2001, 35, 579–597. [Google Scholar] [CrossRef]
- Hayes, J.; Stevenson, R.; Stuetz, R. The impact of malodour on communities: A review of assessment techniques. Sci. Total Environ. 2014, 500, 395–407. [Google Scholar] [PubMed]
- Shusterman, D.; Lipscomb, J.; Neutra, R.; Satin, K. Symptom prevalence and odor-worry interaction near hazardous waste sites. Environ. Health Perspect. 1991, 94, 25–30. [Google Scholar] [PubMed]
- Schiffman, S.S.; Walker, J.M.; Dalton, P.; Lorig, T.S.; Raymer, J.H.; Shusterman, D.; Williams, C.M. Potential health effects of odor from animal operations, wastewater treatment, and recycling of byproducts. J. Agromed. 2000, 7, 7–81. [Google Scholar]
- Yang, J.; Jiao, Y.; Yang, W.; Gu, P.; Bai, S.; Liu, L. Review of methods for determination of ammonia volatilization in farmland. In IOP Conference Series: Earth and Environmental Science; IOP Publishing: Bristol, UK, 2018; Volume 113, p. 012022. [Google Scholar]
- Lin, K.; Zhu, Y.; Zhang, Y.; Lin, H. Determination of ammonia nitrogen in natural waters: Recent advances and applications. Trends Environ. Anal. Chem. 2019, 24, e00073. [Google Scholar] [CrossRef]
- Lacey, R.; Mukhtar, S.; Carey, J.; Ullman, J. A review of literature concerning odors, ammonia, and dust from broiler production facilities: 1. Odor concentrations and emissions. J. Appl. Poult. Res. 2004, 13, 500–508. [Google Scholar] [CrossRef]
- Xue, S.; Chen, S.; Hermanson, R. Measuring ammonia and hydrogen sulfide emitted from manure storage facilities. Trans. ASAE 1998, 41, 1125. [Google Scholar] [CrossRef]
- Devai, I.; DeLaune, R.D. Emission of reduced malodorous sulfur gases from wastewater treatment plants. Water Environ. Res. 1999, 71, 203–208. [Google Scholar] [CrossRef]
- Sin, D.W.-M.; Wong, Y.-C.; Sham, W.-C.; Wang, D. Development of an analytical technique and stability evaluation of 143 C3–C12 volatile organic compounds in Summa® canisters by gas chromatography–mass spectrometry. Analyst 2001, 126, 310–321. [Google Scholar]
- Brancaleoni, E.; Scovaventi, M.; Frattoni, M.; Mabilia, R.; Ciccioli, P. Novel family of multi-layer cartridges filled with a new carbon adsorbent for the quantitative determination of volatile organic compounds in the atmosphere. J. Chromatogr. A 1999, 845, 317–328. [Google Scholar] [CrossRef]
- Belgiorno, V.; Naddeo, V.; Zarra, T. Odour Impact Assessment Handbook; John Wiley & Sons: Hoboken, NJ, USA, 2012. [Google Scholar]
- Król, S.; Zabiegała, B.; Namieśnik, J. Monitoring VOCs in atmospheric air II. Sample collection and preparation. TrAC Trends Anal. Chem. 2010, 29, 1101–1112. [Google Scholar] [CrossRef]
- Brattoli, M.; De Gennaro, G.; De Pinto, V.; Demarinis Loiotile, A.; Lovascio, S.; Penza, M. Odour detection methods: Olfactometry and chemical sensors. Sensors 2011, 11, 5290–5322. [Google Scholar] [CrossRef]
- Maceira, A.; Vallecillos, L.; Borrull, F.; Marcé, R.M. New approach to resolve the humidity problem in VOC determination in outdoor air samples using solid adsorbent tubes followed by TD-GC–MS. Sci. Total Environ. 2017, 599, 1718–1727. [Google Scholar] [CrossRef]
- Harper, M. Sorbent trapping of volatile organic compounds from air. J. Chromatogr. A 2000, 885, 129–151. [Google Scholar]
- Kaser, L.; Peron, A.; Graus, M.; Striednig, M.; Wohlfahrt, G.; Juráň, S.; Karl, T. Interannual variability of terpenoid emissions in an alpine city. Atmos. Chem. Phys. 2022, 22, 5603–5618. [Google Scholar]
- Capozzi, V.; Lonzarich, V.; Khomenko, I.; Cappellin, L.; Navarini, L.; Biasioli, F. Unveiling the molecular basis of mascarpone cheese aroma: VOCs analysis by SPME-GC/MS and PTR-ToF-MS. Molecules 2020, 25, 1242. [Google Scholar] [CrossRef]
- Hernández-Fernández, J.; Lopez-Martinez, J.; Barceló, D. Quantification and elimination of substituted synthetic phenols and volatile organic compounds in the wastewater treatment plant during the production of industrial scale polypropylene. Chemosphere 2021, 263, 128027. [Google Scholar] [CrossRef]
- Moufid, M.; Hofmann, M.; El Bari, N.; Tiebe, C.; Bartholmai, M.; Bouchikhi, B. Wastewater monitoring by means of e-nose, VE-tongue, TD-GC-MS, and SPME-GC-MS. Talanta 2021, 221, 121450. [Google Scholar] [CrossRef]
- Kaikiti, C.; Stylianou, M.; Agapiou, A. TD-GC/MS analysis of indoor air pollutants (VOCs, PM) in hair salons. Chemosphere 2022, 294, 133691. [Google Scholar] [CrossRef]
- Moufid, M.; Bouchikhi, B.; Tiebe, C.; Bartholmai, M.; El Bari, N. Assessment of outdoor odor emissions from polluted sites using simultaneous thermal desorption-gas chromatography-mass spectrometry (TD-GC-MS), electronic nose in conjunction with advanced multivariate statistical approaches. Atmos. Environ. 2021, 256, 118449. [Google Scholar] [CrossRef]
- Kalus, K.; Opaliński, S.; Maurer, D.; Rice, S.; Koziel, J.A.; Korczyński, M.; Dobrzański, Z.; Kołacz, R.; Gutarowska, B. Odour reducing microbial-mineral additive for poultry manure treatment. Front. Environ. Sci. Eng. 2017, 11, 7. [Google Scholar] [CrossRef]
- Young Jeong, J.; Atikul Islam, M.; Khan, N.; Jamila, N.; Hong, J.H.; Kim, K.S. Simultaneous Distillation Extraction (SDE) and Headspace Solid-Phase Microextraction (HS-SPME) for the Determination of Volatile Organic Compounds (VOCs) by Gas Chromatography–Mass Spectrometry (GC-MS) in Perilla Frutescens Foliage from South Korea. Anal. Lett. 2022, 55, 1605–1622. [Google Scholar] [CrossRef]
- Monedeiro, F.; Milanowski, M.; Ratiu, I.-A.; Zmysłowski, H.; Ligor, T.; Buszewski, B. VOC profiles of saliva in assessment of halitosis and submandibular abscesses using HS-SPME-GC/MS technique. Molecules 2019, 24, 2977. [Google Scholar] [CrossRef] [Green Version]
- Burgeon, C.; Markey, A.; Debliquy, M.; Lahem, D.; Rodriguez, J.; Ly, A.; Fauconnier, M.-L. Comprehensive SPME-GC-MS analysis of voc profiles obtained following high-temperature heating of pork back fat with varying boar taint intensities. Foods 2021, 10, 1311. [Google Scholar] [CrossRef]
- Brown, V.M.; Crump, D.R. An investigation into the performance of a multi-sorbent sampling tube for the measurement of VVOC and VOC emissions from products used indoors. Anal. Methods 2013, 5, 2746–2756. [Google Scholar] [CrossRef]
- Environmental Protection Agency. Compendium of Methods for the Determination of Toxic Organic Compounds in Ambient Air. In Method TO-17 Determination of Volatile Organic Compounds in Ambient Air Using Active Sampling Onto Sorbent Tubes; Environmental Protection Agency: Cincinnati, OH, USA, 1999; p. 45268. [Google Scholar]
- Parker, D.B.; Gilley, J.; Woodbury, B.; Kim, K.-H.; Galvin, G.; Bartelt-Hunt, S.L.; Li, X.; Snow, D.D. Odorous VOC emission following land application of swine manure slurry. Atmos. Environ. 2013, 66, 91–100. [Google Scholar] [CrossRef]
- Gómez, J.S.; Lohmann, H.; Krassowski, J. Determination of volatile organic compounds from biowaste and co-fermentation biogas plants by single-sorbent adsorption. Chemosphere 2016, 153, 48–57. [Google Scholar] [CrossRef]
- Dettmer, K.; Engewald, W. Adsorbent materials commonly used in air analysis for adsorptive enrichment and thermal desorption of volatile organic compounds. Anal. Bioanal. Chem. 2002, 373, 490–500. [Google Scholar] [CrossRef]
- Borusiewicz, R.; Zięba-Palus, J. Comparison of the effectiveness of Tenax TA® and Carbotrap 300® in concentration of flammable liquids compounds. J. Forensic Sci. 2007, 52, 70–74. [Google Scholar] [CrossRef]
- Ho, S.S.H.; Wang, L.; Chow, J.C.; Watson, J.G.; Xue, Y.; Huang, Y.; Qu, L.; Li, B.; Dai, W.; Li, L. Optimization and evaluation of multi-bed adsorbent tube method in collection of volatile organic compounds. Atmos. Res. 2018, 202, 187–195. [Google Scholar] [CrossRef]
- Ho, S.S.H.; Chow, J.C.; Watson, J.G.; Wang, L.; Qu, L.; Dai, W.; Huang, Y.; Cao, J. Influences of relative humidities and temperatures on the collection of C2-C5 aliphatic hydrocarbons with multi-bed (Tenax TA, Carbograph 1TD, Carboxen 1003) sorbent tube method. Atmos. Environ. 2017, 151, 45–51. [Google Scholar] [CrossRef]
- Kim, Y.-H.; Kim, K.-H. A novel quantitation approach for maximizing detectable targets for offensive/volatile odorants with diverse functional groups by thermal desorption-gas chromatography-mass spectrometry. Sci. Rep. 2016, 6, 29248. [Google Scholar] [CrossRef] [PubMed]
- Dutta, T.; Kim, K.-H.; Brown, R.J.; Kim, Y.-H.; Boukhvalov, D. Metal-organic framework and Tenax-TA as optimal sorbent mixture for concurrent GC-MS analysis of C1 to C5 carbonyl compounds. Sci. Rep. 2018, 8, 5033. [Google Scholar] [CrossRef] [PubMed] [Green Version]
- Wang, B.; Zhao, Y.; Lan, Z.; Yao, Y.; Wang, L.; Sun, H. Sampling methods of emerging organic contaminants in indoor air. Trends Environ. Anal. Chem. 2016, 12, 13–22. [Google Scholar] [CrossRef]
- Ullah, M.A.; Kim, K.-H. Performance test of a sorbent tube sampler with respect to analyte loss in collecting biogenic volatile organic compounds. Anal. Bioanal. Chem. 2015, 407, 415–426. [Google Scholar] [CrossRef]
- Brown, V.M.; Crump, D.R.; Plant, N.T.; Pengelly, I. Evaluation of the stability of a mixture of volatile organic compounds on sorbents for the determination of emissions from indoor materials and products using thermal desorption/gas chromatography/mass spectrometry. J. Chromatogr. A 2014, 1350, 1–9. [Google Scholar] [CrossRef]
- Kim, K.-H.; Lee, M.-H.; Szulejko, J.E. Simulation of the breakthrough behavior of volatile organic compounds against sorbent tube sampler as a function of concentration level and sampling volume. Anal. Chim. Acta 2014, 835, 46–55. [Google Scholar] [CrossRef]
- Salthammer, T. Very volatile organic compounds: An understudied class of indoor air pollutants. Indoor Air 2016, 26, 25–38. [Google Scholar] [CrossRef]
- Woolfenden, E. Monitoring VOCs in air using sorbent tubes followed by thermal desorption-capillary GC analysis: Summary of data and practical guidelines. J. Air Waste Manag. Assoc. 1997, 47, 20–36. [Google Scholar] [CrossRef]
- Choi, Y.L.; Lee, S.; Kim, D. Determination of volatile organic compounds and sulfur-based odorous substances from sewage treatment plants. J. Odor Indoor Environ. 2018, 17, 161–167. [Google Scholar] [CrossRef]
- Woolfenden, E. Sorbent-based sampling methods for volatile and semi-volatile organic compounds in air. Part 2. Sorbent selection and other aspects of optimizing air monitoring methods. J. Chromatogr. A 2010, 1217, 2685–2694. [Google Scholar] [CrossRef] [PubMed]
- Bingham, E.; Cohrssen, B.; Powell, C.H. Patty’s Toxicology. Volume 1: Toxicology Issues, Inorganic Particulates, Dusts, Products of Biological Origin and Pathogens; John Wiley and Sons: Hoboken, NJ, USA, 2001. [Google Scholar]
- Leonardos, G.; Kendall, D.; Barnard, N. Odor threshold determination of 53 odorant chemicals. J. Environ. Conserv. Eng. 1974, 3, 579–585. [Google Scholar] [CrossRef]
- Amoore, J.E.; Hautala, E. Odor as an ald to chemical safety: Odor thresholds compared with threshold limit values and volatilities for 214 industrial chemicals in air and water dilution. J. Appl. Toxicol. 1983, 3, 272–290. [Google Scholar] [CrossRef]
- Kim, K.-H.; Park, S.-Y. A comparative analysis of malodor samples between direct (olfactometry) and indirect (instrumental) methods. Atmos. Environ. 2008, 42, 5061–5070. [Google Scholar] [CrossRef]
- Sui, H.; Liu, J.; He, L.; Li, X.; Jani, A. Adsorption and desorption of binary mixture of acetone and ethyl acetate on silica gel. Chem. Eng. Sci. 2019, 197, 185–194. [Google Scholar] [CrossRef]
- Sui, H.; Liu, H.; An, P.; He, L.; Li, X.; Cong, S. Application of silica gel in removing high concentrations toluene vapor by adsorption and desorption process. J. Taiwan Inst. Chem. Eng. 2017, 74, 218–224. [Google Scholar] [CrossRef]
- Huang, W.; Xu, J.; Tang, B.; Wang, H.; Tan, X.; Lv, A. Adsorption performance of hydrophobically modified silica gel for the vapors of n-hexane and water. Adsorpt. Sci. Technol. 2018, 36, 888–903. [Google Scholar] [CrossRef]
- Kutluay, S.; Temel, F. Silica gel based new adsorbent having enhanced VOC dynamic adsorption/desorption performance. Colloids Surf. A Physicochem. Eng. Asp. 2021, 609, 125848. [Google Scholar] [CrossRef]
- Liu, Y.; Lu, W.; Wang, H.; Huang, Q.; Gao, X. Odor impact assessment of trace sulfur compounds from working faces of landfills in Beijing, China. J. Environ. Manag. 2018, 220, 136–141. [Google Scholar] [CrossRef]
- Capelli, L.; Sironi, S.; Del Rosso, R.; Guillot, J.-M. Measuring odours in the environment vs. dispersion modelling: A review. Atmos. Env. 2013, 79, 731–743. [Google Scholar] [CrossRef]
- United States Environmental Protection Agency. Definition and Procedure for the Determination of the Method Detection Limit, Revision 2; United States Environmental Protection Agency: Washington, DC, USA, 2016; p. 20460.


| Sample | Materials Used for Humidity Control | Sampling Volume (mL) | Flow Rate (mL/min) | Sampling Time (min) |
|---|---|---|---|---|
| S | - 1 | 500 | 100 | 5 |
| M1 | Silica gel | 500 | 100 | 5 |
| M2 | CaCl2 + Diatomaceous earth | 500 | 100 | 5 |
| M3 | CaCl2 + Diatomaceous earth | 5000 | 100 | 50 |
Publisher’s Note: MDPI stays neutral with regard to jurisdictional claims in published maps and institutional affiliations. |
© 2022 by the authors. Licensee MDPI, Basel, Switzerland. This article is an open access article distributed under the terms and conditions of the Creative Commons Attribution (CC BY) license (https://creativecommons.org/licenses/by/4.0/).
Share and Cite
Choi, Y.; Kim, K.; Lee, T.; Kim, D. Practical Application of a Multi-Bed Adsorbent Tube Coupled with GC-MS for Low-Level VOCs Identification to Achieve Comprehensive Odor Management. Atmosphere 2022, 13, 1457. https://doi.org/10.3390/atmos13091457
Choi Y, Kim K, Lee T, Kim D. Practical Application of a Multi-Bed Adsorbent Tube Coupled with GC-MS for Low-Level VOCs Identification to Achieve Comprehensive Odor Management. Atmosphere. 2022; 13(9):1457. https://doi.org/10.3390/atmos13091457
Chicago/Turabian StyleChoi, Yelim, Kyunghoon Kim, Taeho Lee, and Daekeun Kim. 2022. "Practical Application of a Multi-Bed Adsorbent Tube Coupled with GC-MS for Low-Level VOCs Identification to Achieve Comprehensive Odor Management" Atmosphere 13, no. 9: 1457. https://doi.org/10.3390/atmos13091457
APA StyleChoi, Y., Kim, K., Lee, T., & Kim, D. (2022). Practical Application of a Multi-Bed Adsorbent Tube Coupled with GC-MS for Low-Level VOCs Identification to Achieve Comprehensive Odor Management. Atmosphere, 13(9), 1457. https://doi.org/10.3390/atmos13091457