Abstract
Phenylalanine, tyrosine, and tryptophan are aromatic amino acids, and they are of high interest in both health science and biotechnology. These amino acids form organized structures, like fibrils and nanotubes. Although these amino acids belong to the same family, they still differ from each other with respect to polarity, hydrophobicity as well as internal structures. In this work, we performed extensive molecular dynamics simulations to investigate the dynamics of the self-aggregations of these amino acids and studied the details of the formed structures. The amino acid monomers placed in water were simulated at a constant temperature. It has been observed that they compose nanostructures with similarities and differences.
1. Introduction
Self-assembly or self-aggregation is a very common event in biological systems, and it is of very high importance. A few examples can be listed as folding/unfolding of DNA, forming nanotubes, and membranes [1]. Amino acid molecules, peptides, and proteins form into self-assemblies. This self-assembly occurs through the minimization of the very complex interaction energies of the molecules in the system. These interactions are non-covalent bonds, hydrogen bonds, ionic bonds, van der Waals forces, and hydrophobic interactions [2].
In the last decades, self-assembly has been intensively investigated both in experimental and theoretical ways. There are many causes altering the self-assembly processes of the amino acids and peptides, and among these factors temperature, concentration, pH, chirality, chemical degradation, chemical factors, and excipients play big roles [3]. The presence of these factors may cause to alter the presence of hydrogen bonds, stacking, electrostatic interactions, hydrophobic effects, and so on inside the system. Controlling these parameters allows us to manufacture many important nano-materials, like solar cells [4]. Zhang et al. [5] found that oligopeptide aggregations are the core of those aggregations.Further to this work, it was understood that this kind of structure could be practiced as a pattern in tissue engineering and as carriers in medicine distribution systems [6]. As mentioned above, because of the complexities in governing the self-assembly formations, it is very difficult to predict the structures which will be self-assembled [7,8]. The self-assembly can yield nebulous or very organized structures [9,10]. In the review work of Ren et al., it was mentioned that the self-assembled structures and morphologies could be easily tuned by modifying the building blocks, building rates, and concentrations. Furthermore, they emphasized that we still need to do lots of work in this field, especially the self-assembly processes of amino acids that must be investigated strategically to conduct research on biomedical applications. Ren et al. [11] present that the self-assembled structures and morphologies can easily be tuned by modifying the building blocks, building rates, and concentrations. The work also points to the self-assembly processes of amino acids as a field that demands further research on biomedical applications.
The aromatic amino acids, phenylalanine (Phe), tyrosine (Tyr), and tryptophan (Trp), consist of similar ring structures but they have different polarity features. The aromatic ring consists of a six-link carbon-hydrogen ring with three conjugated double bonds. This ring’s substituents regulate whether the side chain of amino acids employs in polar or hydrophobic interactions. The ring of Phe does not enclose any substituent, and the electrons are eventually distributed among the carbons in the ring so that the rings can pile on each other due to the highly nonpolar hydrophobic structure. In the case of Tyr, a hydroxyl group on the phenyl ring participates in hydrogen bonds; that is, the side chain of Tyr is more polar and hydrophilic. In other words, Tyr is less hydrophobic and more reactive due to its aromatic ring with a hydroxyl group. Trp is a more complex structure, it has an indole ring with nitrogen, which can participate in hydrogen bonds, and Trp is more polar than Phe. Essentially there are many factors affecting the metabolism of compounds of aromatic amino acids [12]. In the current work, we focus on the details of the self-assembly mechanism under which the aromatic amino acids undergo. We investigate the structural differences and similarities of the self-assembled structures of these amino acids by using Molecular Dynamics simulations.
2. Materials and Methods
Three separate systems of Phe, Tyr, and Trp molecules were simulated in this work. In each system, 27 molecules of one type of amino acid were randomly positioned in a cubic box, in which the solution concentration was kept at (Figure 1). The length of the cubic boxes was 5 nm. The systems have a neutral pH, that is to say, that every molecule is an uncapped zwitterion. The termini of each molecule are positive () and negative ().
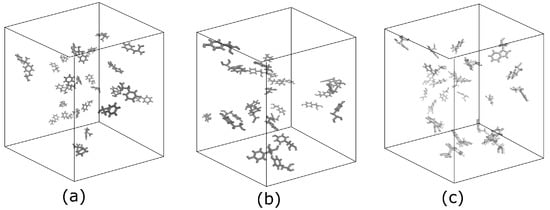
Figure 1.
Typical initial cases of the systems in a cubic box filled by amino acid molecules and water molecules, (not shown), kept at 360 mM concentrations: (a) 27 Phe molecules, (b) 27 Tyr molecules, and (c) 27 Trp molecules.
The systems of different amino acids were simulated by using Gromacs simulation package [13]. We selected the force field OPLS-AA, which gives good results for simulating biomolecules [14,15] and is in agreement with experiments [16]. We used TIP3P explicit water molecules. The Particle Mesh Ewald (PME) algorithm was chosen to calculate the electrostatic interactions [17,18]. The cut-off distance for nonbonded interactions was implemented as 1 nm. Velocities were obtained using the Maxwell distribution. After the system installation was completed, energy minimization was carried out. Equilibrium was then reached in the NVT and NPT ensembles. Once all these steps were fulfilled, we moved on to the main simulations and made sure that each system was simulated up to 500 ns, with integration step 2 ps. We applied constraints on hydrogen bonds.
We chose the temperature as 350 K, using a Berendsen thermostat because this was the temperature at which we saw ordered nanostructures in our previous works [19] We chose this temperature because we had seen ordered nanostructures at this temperature in our previous works [20,21]. The pressure was maintained constant at 1 bar as per the Parrinello–Rahman algorithm. Periodic boundary conditions (PBC) were implemented to approximate an infinite system by using a unit cell.
Analysis
We tested the reliability of the simulations by starting from different initial states and verifying that they reached the same mean values. Namely, we studied the evolution of the observable quantities from at least two completely different initial configurations and how the runs converged to one average value over time. In addition to the analysis of the simulation data using the analysis tools of the Gromacs package, we wrote our own codes for some analyzes, as mentioned in the results section. The details of the analyzing tools used are given at the relevant points of the next section.
3. Results and Discussion
We calculate the RMSD, which is the root mean squared distance as a function of time. It shows the similarity in three-dimensional structures [22]. RMSD values become very large when the compared structures are very different than each other, and it is zero for identical structures. On the other hand, the similarity of the structures can be discussed if intermediate values are seen. Using gmx rmsdist from the Gromacs package, we display this quantity for the amino acids in Figure 2, where we calculated the backbone root mean square deviation with respect to the reference conformation reached at the end of the simulation (t = 500 ns). In the case of Phe molecules, the backbone RMSD fluctuated robustly in the first 300 ns, but stabilized around 1.98 nm with smaller deviations from 300 ns to the end of the simulation. This kind of fluctuation was seen only in the first 150 ns at the simulation of Tyr molecules, and RMSD stabilized around 1.57 nm in the rest of the simulation. On the one hand, in the case of Trp molecules, this kind of high fluctuations disappeared after the first 50 ns, but, on the other hand, RMSD stabilization was found around 2.18 nm. On the other hand, Figure 2 gives us the impression that Phe molecules need a longer simulation time to reach an equilibrium.
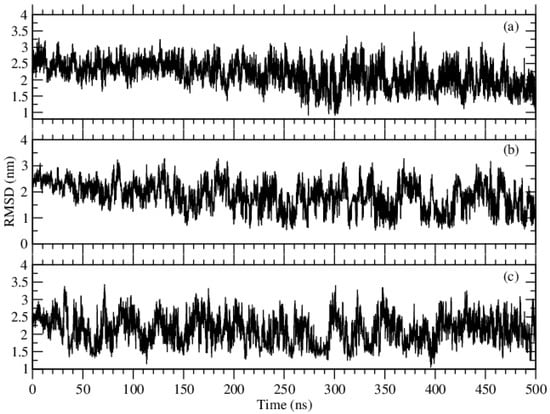
Figure 2.
RMSD of the backbone atoms of the amino acids, (a) Phe, (b) Tyr and (c) Trp molecules.
We further check the convergence of the simulations towards equilibrium from the relaxation of the structures, namely, the relaxations towards the averages structures. We capture, via the root mean square fluctuations (RMSF), the fluctuations in the average positions for each residue. This gives insight into the flexibility of the regions of the structures. Figure 3 shows the residues of high flexibility as peaks. The RMSF values were calculated by using gmx rmsf. As it compares the current position of an atom with a reference position over time and averages the fluctuated distance for each atom, we see that Phe molecules make the greatest fluctuation, while Tyr molecules make the smallest. Trp molecules show a different behavior, as each molecule contributes to the overall fluctuation, but the overall fluctuation of the structure is a bit smaller than the structure of Phe molecules.
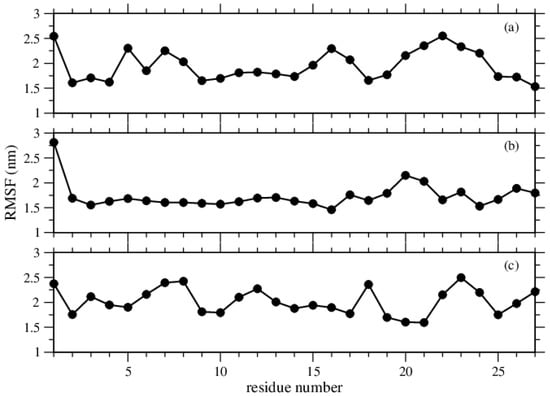
Figure 3.
RMSF per residue of the amino acids, (a) Phe, (b) Tyr, and (c) Trp molecules.
The snapshots taken at 500 ns of the systems are shown in Figure 4. In all cases, we observed self-assembled structures. However, in detail, the structures formed by Tyr molecules are more ordered compared to the structures of the other two molecules. The number of isolated monomers, which are found at least 6 nm apart from an aggregation, is also just a few in the case of Tyr molecules (as given in our previous work [21]).
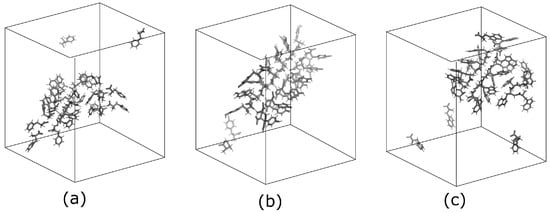
Figure 4.
Typical snapshots of the systems taken at the simulation time 500 ns. (a) 27 Phe molecules, (b) 27 Tyr molecules, and (c) 27 Trp molecules.
To get a measure of the compactness of the structures, we calculate the radii of gyration for the systems. As being, an attribute of the compactness of the structures, the radius of gyration (), is lower for tighter packing and vice versa [23]. Applying gmx gyrate, we calculated the radii of gyration and displayed them in Figure 5. Although the values are so close to each other, the averaged values of over the states of equilibrium are 2.03 nm for Phe, 2.00 nm for Tyr, and 2.08 nm for Trp. These averaged values are in full agreement with our visual experience of the structures; that is, the self-assembled structures of Tyr molecules are visible to be more stable and tighter, whereas the structures by Phe molecules are less tight. The structures formed by Trp molecules seem tight enough, but they look less ordered compared to the structures of Tyr molecules.
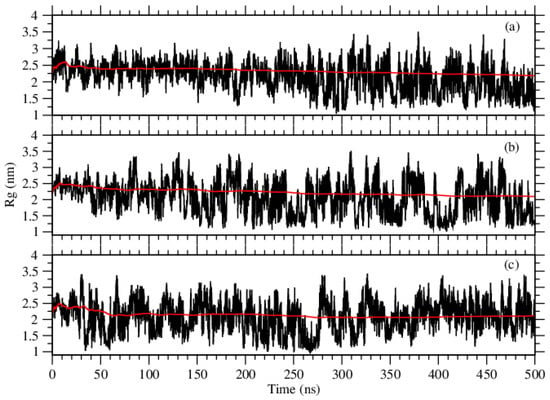
Figure 5.
The values of radius of gyration calculated over the trajectories for the molecules of (a) Phe, (b) Tyr, and (c) Trp. Red curves show the moving averages.
Calculations of the number of contacts between two ionized atoms, that is, between one oxygen atom of the carboxyl group of a residue and one hydrogen atom of the amino group of another residue were performed by a home written code. At the formed structures, we measured that the distance between these two atoms is nm. The calculated numbers of close contacts versus time are shown in Figure 6. The cut-off distance to make a close contact was set at 1.9 nm.
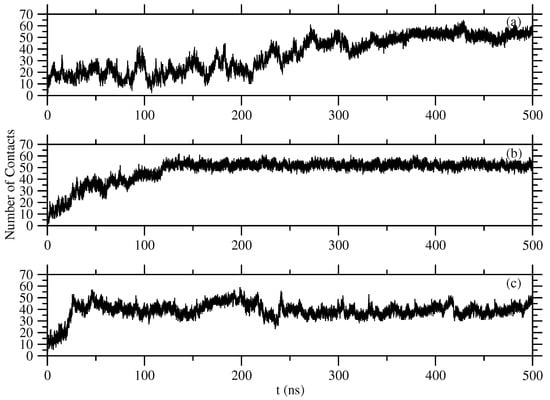
Figure 6.
Number of close contacts between two ionized atoms of (a) Phe, (b) Tyr, and (c) Trp molecules.
The contact distance between C atoms are determined as nm (see Figure 7). The time evolution of the number of this kind of contacts is shown in Figure 8. This figure shows a very clear picture of fluctuations in the number of monomers included in the formed structures, that is, Tyr molecules are seen much more continuously included in the formed structures, and the structures are obtained after around 120 ns. The case of Trp molecules shows more fluctuations compared to Tyr molecules, but less fluctuations compared to Phe molecules. The time to reach equilibrium is around 80 ns. Phe molecules are harder to be found in equilibrium, which is after 330 ns. The average equilibrium values of these close contacts are shown in Table 1.
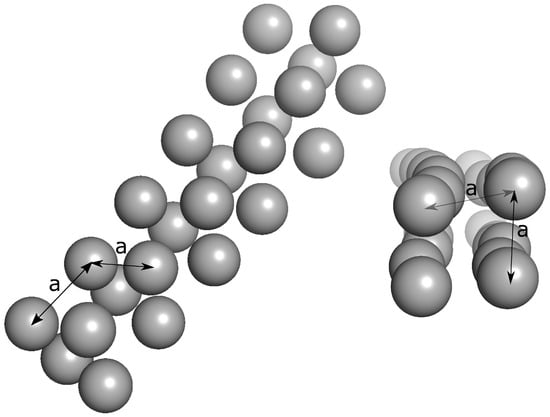
Figure 7.
Simulation snapshots of the self-assembled tubular structures by the aromatic amino acids. The length a between atoms is measured as .
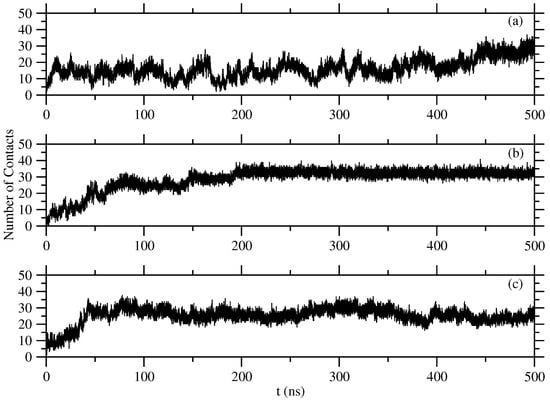
Figure 8.
Number of close contacts between C atoms of (a) Phe, (b) Tyr, and (c) Trp molecules.

Table 1.
The approximate equilibration times of the simulations in ns (), the average number of close contacts between the two ionized atoms () and the average number of close contacts between the C atoms of the different amino acid systems ().
For a more detailed examination of the structures at all length scales, we calculate the spherical structure factor
where is the position vector of the atoms of the molecules and q is the modulus of a scattering wave vector [24,25,26]. In Figure 9, we display the calculated structure factors for atoms of the formed structures. Typical structure pictures taken for the positions of atoms are inserted in the same figure. Taking into account the measured distance between two atoms is (Figure 7), we display in Figure 10 the calculated structure factors for tubular structures with varying sizes, and drawn by hand, that is, for ideal tubular structures. Intentionally we draw tubular structures with nm, nm, which are the measurements we read in the simulation (see Figure 7), and the length of the tubes H comes out accordingly as . The structure factor calculated for Tyr molecules perfectly fits the structure factor with and , and 7 layers of 4-fold monomers. The structure factors obtained from the simulations for Phe and Trp molecules significantly differ from a perfect tubular structure. Moreover, the shoulder in the structure factor seen for Tyr molecules gives also features of the structure in detail. The asymptotic behavior, , seen as is found both in the tubular structures obtained from the simulations of Tyr molecules and also in the perfectly drawn tubular structures drawn by hand [27,28].
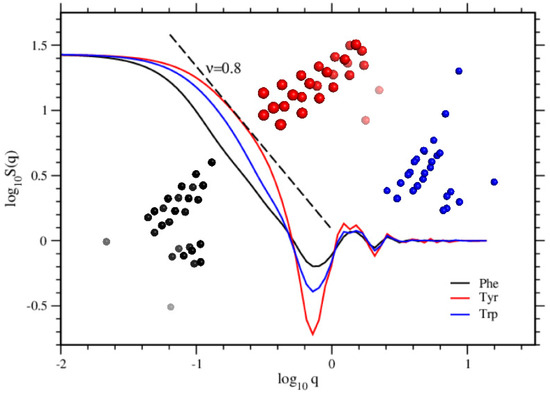
Figure 9.
Structure factors are plotted for the self-assembled structures by Phe, Tyr, and Trp molecules. The snapshots of the structures are shown in the same colors as the corresponding curves. The straight dashed line shows the asymptotic scale, which is .
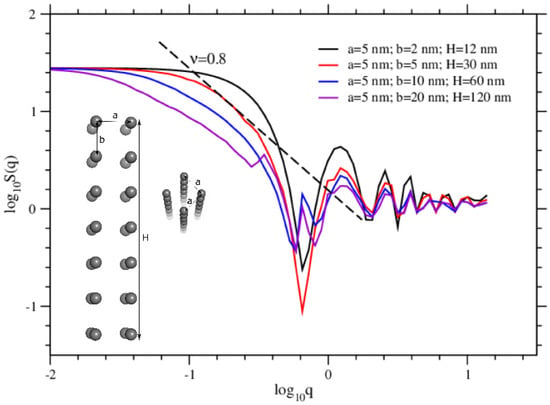
Figure 10.
Structure factors are calculated for hand-drawn tubular structures of various sizes. The sizes are shown inside the figure. The sizes of the curve in red correspond to the structures obtained from the simulations. The straight dashed line shows the asymptotic scale, which is .
We calculate the histogram method of Lee and Kosterlitz [29] to see the energy distribution functions P(E). The normalized distribution function P(E) is related to the free energy F via
where is the Boltzmann constant and T is the temperature. The minima seen for the curves in Figure 11 are related to the formation of the ordered structures. The minimum at the smallest energy value was obtained at the simulation of Tyr molecules, whereas the minimum at the biggest one was seen in the case of Trp molecules. For Phe molecules, a similar minimum was observed at an energy value in between the other two. These funnel-shaped figures confirm that the systems reach one ordered structure. Conformational distributions around the free energy minima are related to the structural functions [30]. Therefore these funnel-shaped figures give us important details about the structures. In agreement with the results given above, the structures of Tyr molecules must be the most stable and the most ordered structure, as occurring at the lowest energy value.
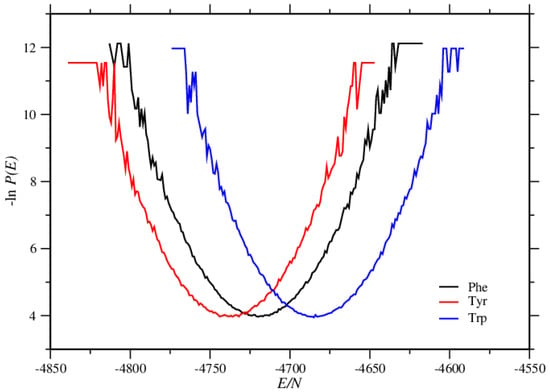
Figure 11.
Energy distribution functions for the simulations of Phe, Tyr, and Trp molecules, is the number of molecules in the systems.
We used principal component analysis (PCA) to reduce the dimensionality of the simulation data so that we could focus on the configuration space with fewer degrees of freedom, that is, the data set was projected onto a lower-dimensional subspace, as retaining most of the information while increasing computational efficiency. PCA analysis is used for predicting the dynamic behaviors of a system. This method analyzes the trajectories and excerpts effective modes in the long-term passage [31]. The motions of the structures in a multidimensional space were analyzed by the most vital eigenvectors projection in cartesian trajectory coordinates. We built up the covariance matrices of atoms, in which the rotation and translational movements were removed. Moreover, we calculated the eigenvectors and eigenvalues of the covariance matrices and the projection of the first two principal components. Each of those eigenvectors is associated with an eigenvalue which can be interpreted as the length or magnitude of the corresponding eigenvector. If some eigenvalues have a significantly larger magnitude than others, then the reduction of the dataset onto a smaller dimensional subspace by dropping the less informative eigenpairs is reasonable. These analyzes were done by using Gromacs’s tools, gmx covar, and gmx anaeig. The eigenvalues of the systems were plotted against the corresponding eigenvector index for the first 100 modes of the motion Figure 12. These eigenvalues show the fluctuations of the eigenvectors in the hyperspace; we see that only a restricted number of eigenvalues have significant effects on the throughout motions. In all three systems, the first ten eigenvectors had much more effective motions. Furthermore, we selected the first two principal components (PC1 and PC2) to analyze the projections of the trajectories during the simulations in phase space, see Figure 13. During these three simulations, Tyr molecules covered the smallest region of the phase space, and Phe molecules covered the largest region of the phase space. Trp molecules covered a region between the other two. It means that if large conformational changes occur, the distribution is scattered in the conformational space [32]. In short, the PCA results are in good agreement with the results given above, by several quantities like RMSD, RMSF, Rg, S(q).
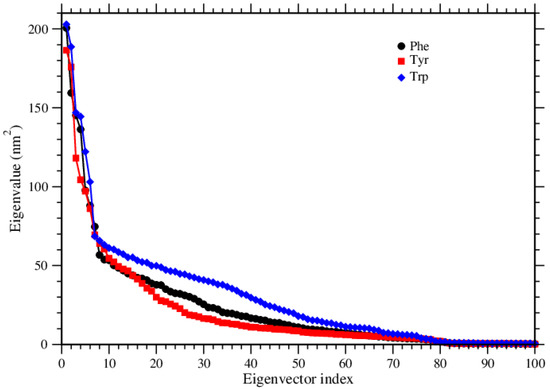
Figure 12.
Eigenvalues of the covarience matrix are shown for the three amino acids.
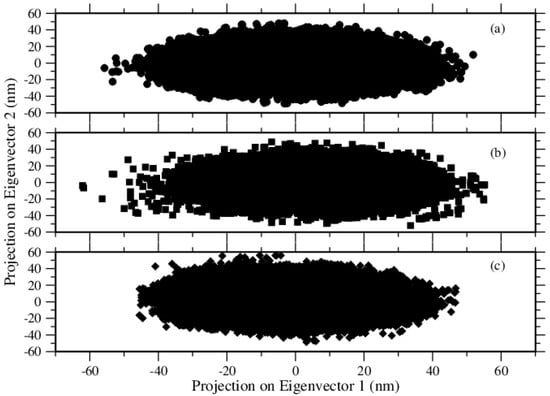
Figure 13.
2D projection of trajectories for (a) Phe, (b) Tyr, and (c) Trp molecules.
Over the equilibrium configurations, we present the averages of the temporal fluctuations of the molecules around their mean positions. We perform it by calculating the quantity
where T means the temporal averaging, or, over the number of the configurations, and
This quantity is shown in Figure 14. In agreement with the previous data presented above, this quantity shows that each Phe molecule travels longer distances around its average position than Tyr and Trp molecules. Generally, in the structures of Tyr or Trp molecules, the molecules travel much shorter distances around their average positions, except for one to three molecules in the case of Tyr structures.
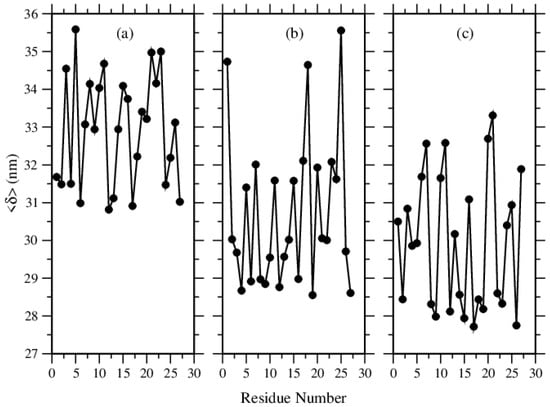
Figure 14.
Time averaging deviations of the molecules around their own average locations, for (a) Phe, (b) Tyr, and (c) Trp molecules.
The results of this work show that there are differences between the self-assembled structures formed by the three aromatic amino acids, although they look in a similar manner overall. The hydrophobic effects and polarity effects matter for the kinetics of the assembly processes and the formed structures. In the case of tryptophan molecules, the structural uniqueness with its indole side chain comes into play as well.
The self-assembly process still needs to be understood in more detail. Therefore, one can extend the work by changing, for instance, solvent, and electrostatics inside the system. Therefore, the reasons for the dissimilarities can be explained from different perspectives.
4. Conclusions
Aromatic amino acids are very important in health science because they are strongly connected to many severe diseases and on the other hand, they are also very important in biotechnology as offering the options to manufacture nanotechnological items and drug-delivery systems. The metabolism of the aromatic amino acids is sophisticated, and the roles and functions of the involving units are hard to figure out. In this study, we investigated the kinetics and the equilibrium states of the self-assembly or self-aggregation processes of the three aromatic amino acids, phenylalanine, tyrosine, and tryptophan. As a further expansion of the work in the literature [21], where it was observed that these amino acids formed into self-ordered structures like tubular ones at some temperatures and concentrations, we focused on the structural differences and similarities of these structures as well as the formation of the structures. We observed that Tyr molecules form into self-organized structures in a considerably shorter time duration. Furthermore, the structures formed by these molecules are tighter, leaving less isolated monomers out of the formed structures. Polarity features of these amino acids have a very big effect at these different levels of stackings of the molecules since the polar amino acids make hydrogen bonds with other suitable groups when in an aqueous environment [33].
As being in agreement with the literature [21,34], we also confirmed that Tyr’s and Trp’s aromatic group constituents tend to make hydrogen bonds: where Tyr makes it via … via OHO, while Trp forms it through the NHO channel, and the condition our research reveals is that Tyr’s bonding is higher than Trp’s bonding. In the case of Phe, however, it is found that other stabilizing interactions come into action.
Funding
This research received no external funding.
Acknowledgments
The numerical calculations reported in this paper were performed at TUBITAK ULAKBIM, High Performance and Grid Computing Center (TRUBA resources) and TAU-SANCAR, System and Nodes of Computational Applications and Research.
Conflicts of Interest
The author declares no conflict of interest.
Abbreviations
The following abbreviations are used in this manuscript:
| Phe | Phenylalanine |
| Trp | Tryptophan |
| Tyr | Tyrosine |
References
- Rajagopal, K.; Schneider, J.P. Self-assembling peptides and proteins for nanotechnological applications. Curr. Opin. Struct. Biol. 2004, 14, 480–486. [Google Scholar] [CrossRef]
- Zhang, S.; Altman, M. Peptide self-assembly in functional polymer science and engineering. React. Funct. Polym. 1999, 41, 91–102. [Google Scholar] [CrossRef]
- Zapadka, K.L.; Becher, F.J.; Gomes dos Santos, A.L.; Jackson, S.E. Factors affecting the physical stability (aggregation) of peptide therapeutics. Interface Focus 2017, 7, 20170030. [Google Scholar] [CrossRef]
- Würthner, F. Perylene bisimide dyes as versatile building blocks for functional supramolecular architectures. Chem. Commun. 2004, 14, 1564–1579. [Google Scholar] [CrossRef] [PubMed]
- Zhang, S.; Holmes, T.; Lockshin, C.; Rich, A. Spontaneous assembly of a self-complementary oligopeptide to form a stable macroscopic membrane. Proc. Natl. Acad. Sci. USA 1993, 90, 3334–3338. [Google Scholar] [CrossRef] [PubMed]
- Panda, J.J.; Chauhan, V.S. Short peptide based self-assembled nanostructures: Implications in drug delivery and tissue engineering. Polym. Chem. 2014, 5, 4418–4436. [Google Scholar] [CrossRef]
- Ahmadabadi, H.N.; Masoudi, A.A.; Uyaver, S. Concentration effects on the self-assembly of tyrosine molecules. Phys. Chem. Chem. Phys. 2021, 23, 22620–22628. [Google Scholar] [CrossRef] [PubMed]
- Boccia, A.C.; Lukeš, V.; Eckstein-Andicsová, A.; Kozma, E. Solvent- and concentration-induced self-assembly of an amphiphilic perylene dye. New J. Chem. 2020, 44, 892–899. [Google Scholar] [CrossRef]
- Riek, R.; Eisenberg, D.S. The activities of amyloids from a structural perspective. Nature 2016, 539, 227–235. [Google Scholar] [CrossRef]
- Ozboyaci, M.; Kokh, D.B.; Corni, S.; Wade, R.C. Modeling and simulation of protein-surface interactions: Achievements and challenges. Q. Rev. Biophys. 2016, 49, 1–45. [Google Scholar] [CrossRef] [PubMed] [Green Version]
- Ren, H.; Wu, L.; Tan, L.; Bao, Y.; Ma, Y.; Jin, Y.; Zou, Q. Self-assembly of amino acids toward functional biomaterials. Beilstein J. Nanotechnol. 2021, 12, 1140–1150. [Google Scholar] [CrossRef] [PubMed]
- Parthasarathy, A.; Cross, P.J.; Dobson, R.C.; Adams, L.E.; Savka, M.A.; Hudson, A.O. A Three-Ring Circus: Metabolism of the Three Proteogenic Aromatic Amino Acids and Their Role in the Health of Plants and Animals. Front. Mol. Biosci. 2018, 5, 1–30. [Google Scholar] [CrossRef]
- Pronk, S.; Pall, S.; Schulz, R.; Larsson, P.; Bjelkmar, P.; Apostolov, R.; Shirts, M.R.; Smith, J.C.; Kasson, P.M.; van der Spoel, D.; et al. GROMACS 4.5: A high-throughput and highly parallel open source molecular simulation toolkit. Bioinformatics 2013, 29, 845–854. [Google Scholar] [CrossRef] [PubMed]
- Jorgensen, W.L.; Tirado-Rives, J. The OPLS Potential Functions for Proteins. Energy Minimizations for Crystals of Cyclic Peptides and Crambin. J. Am. Chem. Soc. 1988, 110, 1657–1666. [Google Scholar] [CrossRef] [PubMed]
- Hess, B.; van der Vegt, N.F.A. Hydration Thermodynamic Properties of Amino Acid Analogues: A Systematic Comparison of Biomolecular Force Fields and Water Models. J. Phys. Chem. B 2006, 110, 17616–17626. [Google Scholar] [CrossRef]
- Shirts, M.R.; Pitera, J.W.; Swope, W.C.; Pande, V.S. Extremely Precise Free Energy Calculations of Amino Acid Side Chain Analogs: Comparison of Common Molecular Mechanics Force Fields for Proteins. J. Chem. Phys. 2003, 119, 5740–5761. [Google Scholar] [CrossRef]
- Darden, T.; York, D.; Pedersen, L. Particle mesh Ewald: An N log(N) method for Ewald sums in large systems. J. Chem. Phys. 1993, 98, 10089–10092. [Google Scholar] [CrossRef]
- Essmann, U.; Perera, L.; Berkowitz, M.L. A smooth particle mesh Ewald method. J. Chem. Phys. 1995, 103, 8577–8593. [Google Scholar] [CrossRef]
- Bussia, P.; Donadio, D.; Parrinello, M. Canonical sampling through velocity rescaling. J. Chem. Phys. 2007, 126, 014101. [Google Scholar] [CrossRef]
- German, H.W.; Uyaver, S.; Hansmann, U.H.E. Self-Assembly of Phenylalanine-Based Molecules. J. Phys. Chem. A 2015, 119, 1609–1615. [Google Scholar] [CrossRef] [PubMed]
- Uyaver, S.; Hernandez, H.W.; Habiboglu, M.G. Self-assembly of aromatic amino acids: A molecular dynamics study. Phys. Chem. Chem. Phys. 2018, 20, 30525–30536. [Google Scholar] [CrossRef]
- Maiorov, V.N.; Crippen, G.M. Significance of root-mean-square deviation in comparing three-dimensional structures of globular proteins. J. Mol. Biol. 1994, 235, 625–634. [Google Scholar] [CrossRef]
- Lobanov, M.Y.; Bogatyreva, N.S.; Galzitskaya, O.V. Radius of gyration as an indicator of protein structure compactness. Mol. Biol. 2008, 42, 623–628. [Google Scholar] [CrossRef]
- Pecora, R. Dynamic Light Scattering—Applications of Photon Correlation Spectroscopy; Plenum Press: New York, NY, USA; London, UK, 1985. [Google Scholar]
- Marshal, W.; Lovesey, S.W. Theory of Thermal Neutran Scatterig; Oxford University Press: Oxford, UK, 1971. [Google Scholar]
- Pedersen, J.S. Analysis of small-angle scattering data from colloids and polymer solutions: Modeling and least-squares fitting. Adv. Colloid Interface Sci. 1997, 70, 171–210. [Google Scholar] [CrossRef]
- Glatter, O.; Kratky, O. Small Angle X-ray Scattering; Academic Press Inc.: London, UK, 1985. [Google Scholar]
- Sinha, S.K.; Sirota, E.B.; Garoff, S. X-ray and neutron scattering from rough surfaces. Phys. Rev. B 1988, 38, 2297–2312. [Google Scholar] [CrossRef] [PubMed]
- Lee, J.; Kosterlitz, J.M. New Numerical Method to Study Phase Transitions. Phys. Rev. Lett. 1990, 65, 137–140. [Google Scholar] [CrossRef] [PubMed]
- Nussionov, R.; Tsai, C. Free Energy Diagrams for Protein Function. Chem. Biol. 2014, 21, 311–318. [Google Scholar] [CrossRef] [PubMed]
- Wang, Q.; Mehmood, A.; Wand, H.; Xu, Q.; Xiong, Y.; Wei, D.Q. Computational Screening and Analysis of Lung Cancer Related Non-Synonymous Single Nucleotide Polymorphisms on the Human Kirsten Rat Sarcoma Gene. Molecules 2019, 24, 1951. [Google Scholar] [CrossRef]
- Basith, S.; Manavalan, B.; Shin, T.H.; Lee, G. Mapping the Intramolecular Communications among Different Glutamate Dehydrogenase States Using Molecular Dynamics. Biomolecules 2021, 11, 798. [Google Scholar] [CrossRef] [PubMed]
- Alberts, B.; Johnson, A.; Lewis, J.; Raff, M.; Roberts, K.; Walter, P. Molecular Biology of the Cell, 5th ed.; Garland Science: New York, NY, USA, 2008. [Google Scholar]
- Scheiner, S.; Kar, T.; Pattanak, J. Comparison of Various Types of Hydrogen Bonds Involving Aromatic Amino Acids. J. Am. Chem. Soc. 2002, 124, 13257–13264. [Google Scholar] [CrossRef] [PubMed]
Publisher’s Note: MDPI stays neutral with regard to jurisdictional claims in published maps and institutional affiliations. |
© 2022 by the author. Licensee MDPI, Basel, Switzerland. This article is an open access article distributed under the terms and conditions of the Creative Commons Attribution (CC BY) license (https://creativecommons.org/licenses/by/4.0/).