Abstract
The concentration of ice nucleating particles (INPs) in the cloud layer affects cloud processes more importantly than at the ground level. To make up for deficiencies in the observation of the vertical distribution of INPs over different background regions of China, airborne sampling of INPs was carried out at the altitudes of 2000–5500 m over Turpan, Xinjiang, northwest China on 29 December 2019, and the samples were analyzed in a static vacuum water vapor diffusion chamber. The sources and relationships of the INPs with meteorological conditions and the variation of the concentrations of aerosol particles of different sizes were explored. The results indicate that the concentration of INPs varies from 0.25 to 15.7 L when the nucleation temperature changes from −17 to −26 °C and the relative humidity with respect to water (RH) varies from 95 to 105%. The existence of an inversion layer near the planetary boundary layer (PBL) inhibits the vertical transport of aerosols, thus affecting the vertical distribution of INP concentration. INPs in the free atmosphere mainly originate from fine-mode aerosol particles transported from long distances by westerly winds and do not change significantly with height. The air mass in the PBL is short-range transported, and the INP concentration reaches 15.7 L at T =−26 °C and RH = 105%, which is obviously higher than that above the PBL. The analyses provide evidence that the meteorological conditions played an important part in regulating the vertical distribution of INPs.
1. Introduction
Ice nucleating particles (INPs) refer to aerosol particles that cause water vapor deposition or supercooled droplets to freeze to form ice crystals in the atmosphere. The classical nucleation theory holds that, during the formation of ice crystals, the INPs can provide a heterogeneous interface to reduce the energy barrier that the water molecule clusters need to overcome beyond the critical size, so that the ice formation process occurs at relatively high temperatures (T > −38 °C) and low relative humidity with respect to ice (RH < 150%) []. The process of forming ice crystals involving INPs is referred to as heterogeneous ice nucleation, which is generally divided into four modes: immersion-freezing, contact nucleation, condensation-freezing and deposition nucleation. INP concentration can affect the macroscopic and microscopic properties of cloud, thereby indirectly affecting the radiation balance and energy budget of Earth system. Variations of INP concentration can cause changes in the concentration and size of ice crystals within the cloud [], affecting the properties of the cloud and leading to biases in radiation balance estimates [].
In nature, the height of a cloud base is generally above 2000 m, therefore, compared with the INPs on the ground, the INPs in the free troposphere have a more important influence on cloud formation and development [,]. The vertical trend of INP concentration is not fixed [,]. Studies at high altitudes in the Arctic have shown the greatest values of INP concentration near the surface []. Similarly, Twohy et al. (2016) [] found that the INP concentration decreases with height, which is consistent with the trend of local biological aerosol particles and larger particles (0.8–1.2 μm). Affected by the aerosols produced by biomass burning from long-range transport from Asia, the maximum concentration of INPs appeared above 1500 m [].
Obviously, the vertical variation trend of high-altitude INPs has great uncertainty, which is affected by various factors such as the source and type of INPs, aerosol particle distribution characteristics and size []. Patade et al. (2014) [] showed that in India the INPs above the PBL mainly come from short range diffusion, so the concentration of INPs is much lower than that below the PBL. Conen et al. (2015) [] found that the aging process of dust transported over long distances can increase ice nucleating activity on Jungfraujoch. However, whether long-range transport changes the activation capacity of INPs is controversial []. Based on automated Horizontal Ice Nucleation Chamber, Brunner et al. (2021) [] found that mineral dust transported from the Sahara in the free troposphere leads to a greater concentration of INPs when falling into the low altitude due to the pre-activation. Bioaerosols from the ground can be activated at the higher temperature spectrum [,]. Meteorological factors are also important in affecting the concentration of INPs. Ardon-Dryer et al. (2011) [] showed that the stronger winds enhanced the mixing of air near the surface, bringing more INPs to the South Pole. Vertical changes in humidity affected the concentration of INPs at different altitudes in the North China Plain; large particles (>0.5 m in diameter) formed by hygroscopic growth are not conducive to the INP concentrations []. Chen et al. (2021) [] found that the circadian variations in PBL heights altered the distribution of different types of aerosols on the top of Mount Tai, thus causing the change of INP concentration. The elevated INP concentration at Jungfraujoch may be influenced by air from the marine boundary layer [,]. Observations of INPs in the free troposphere have been carried out, but less so than observations of INPs on the ground. The cognition of the concentration and influencing factors of high-altitude INPs is still limited.
In this study, INPs and aerosol particles were collected by airborne instruments and were analyzed in a static vacuum water vapor diffusion chamber, aiming to reveal the characteristics and influencing factors of the vertical distribution of INPs in Xinjiang, northwest China, and fill in the gaps or shortages of INPs at different altitudes in China. Section 2 contains the instrument introduction, sampling details and experimental design. The distribution characteristics of INPs and the influencing factors are given in Section 3. Section 4 presents a brief summary and the conclusions drawn from this study.
2. Method
The measurements were conducted at Turpan, which is located in Xinjiang, northwest China (Figure 1a). At 3:54 (UTC) on 29 December 2019, a Kingair aircraft equipped with a high-voltage electrostatic aerosol collector (HVEAC), Aircraft Integrated Meteorological Measurement System (AIMMS), passive cavity aerosol spectrometer probe 200 (PCASP-200×) and other instruments took off from Jiaohe Airport in Turpan, Xinjiang. At 6:23 (UTC), the aircraft landed at Jiaohe Airport. A total of 18 samples were collected within two and a half hours. The flight process was divided into two stages: ascent and descent (Figure 1b). The ascent stage was from 3:54 to 5:16 (UTC), and nine samples were collected at different heights over Jiaohe Airport (89.10° E, 43.02° N). From 5:24 to 6:18, the aircraft circled and descended over Toksun County (88.81° E, 42.83° N), and eight samples were obtained. One extra sample was taken during the aircraft flight from Toksun County to Jiaohe Airport at 5500 m.
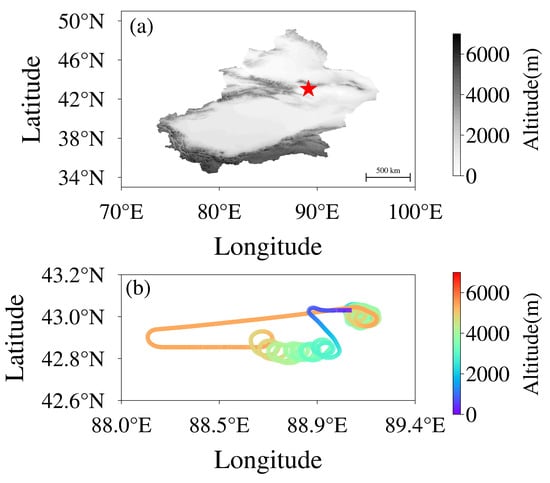
Figure 1.
(a) The map of the observation site. (b) The flight trajectory of Kingair aircraft. The red stars represent the location of Turpan. (“Altitude” in this study all represent the altitude above mean sea level).
The circulation patterns of 500 hPa and the surface at 00 UTC on 29 December 2019 were drawn using Final Operational Global Analysis (FNL) data and are shown in Figure 2. There were two cyclones located in the northeast and northwest directions of the observation site, respectively. The observation site was situated downstream of the upper level ridge, between the two upper level troughs, and was influenced by strong northwesterly flow at upper levels. At the surface, the wind was determined by the topography resulting in weak surface winds. During the observation period, the sky was dusty and the pollution was severe, mainly with floating dust and anthropogenic particulates (Section 3.4), which was a typical winter weather situation in Xinjiang [].
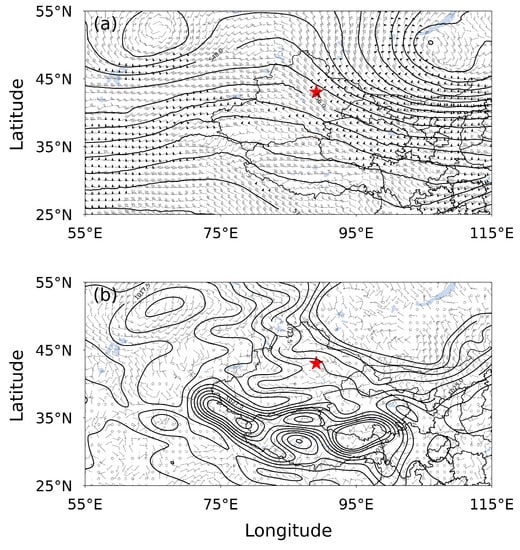
Figure 2.
(a) The geopotential heights (plotted every ten geopotential meters) and wind field (m s) at 500 hPa, and (b) the pressure (hPa) and wind field at the surface, at 0:00 AM (UTC) on 29 December 2019. The red stars represent the location of Turpan.
During sampling, the sampling air entered the aircraft through an isokinetic inlet and was distributed to all instruments. Isokinetic sampling avoids the physical and chemical changes in ambient aerosol due to compression or expansion of the flow, and ensures the quality of samples []. AIMMS is a standalone, fully functional aircraft integrated meteorological measurement system that provides highly accurate measurements of the aircraft’s position and ambient meteorological parameters. The PCASP-200× has 30 bins, and measures aerosol particles with a size in the range of 0.1–3.0 m. The INP samples described in this study were collected by an HVEAC installed in the aircraft. A suction pump on the HVEAC pumps 20 L of air through the silicon substrate from the inlet. Under the high voltage electrostatic field, INPs were attached to the 45 mm silicon substrate with a standard flow rate of 5 L min for 4 min. Based on the measurement with a Wide-Range Particle Spectrometer (WPS) by Klein et al. (2010) [], the collection efficiency of HVEAC can reach more than 90%. This is much higher than that reported by Schrod et al. (2016) [], who measured collection efficiency of approximately 60%, utilizing fluorescein tagged aerosol particles. Whatever the efficiency is, it will not affect the trend of the vertical variation of the INPs.
A static vacuum water vapor diffusion chamber (FRIDGE-NUIST) based on FRIDGE (Frankfurt Ice Nuclei Deposition Freezing Experiment) is used for INPs analysis [,,]. By precisely controlling meteorological parameters such as temperature, humidity and pressure, the chamber simulates the process of atmospheric INPs activating and growing into ice crystals. A CCD camera was installed on the top of the cloud chamber to record the growth of ice crystals, which can clearly distinguish ice crystals from water droplets. A computer system connected to the instrument counts the ice crystals automatically. When the air is not saturated with respect to water, the transformation of water droplets into ice crystals is not observed. The formation mechanism of ice crystals is deposition nucleation. When the air is supersaturated with respect to water, condensation of water vapor can be observed. Ice crystals are formed by deposition nucleation and/or condensation freezing. The uncertainty of supersaturation of the cloud chamber is between ±0.5%. When the RH is 100%, in the critical state of water surface saturation, condensation nucleation may occur []. It is still controversial whether deposition nucleation can be included in pore condensation-freezing [,]. Due to the limitations of the experimental conditions, we cannot exclude the possibility of pore condensation and freezing. In the experiment, the temperature of the vacuum water vapor diffusion cloud chamber was fixed first. Then, the valve between the water vapor tanks connected to the cloud chamber was opened. In a short period of time, a large amount of water vapor filled the cloud chamber and formed ice crystals on the silicon substrate. Since the time for the water vapor to fill the chamber is very short and a small amount of water vapor is sufficient, the probability of competing for water vapor is very low. More details about these instruments can be found in He et al. (2021) [].
In this study, INPs were measured at the temperature of −17 °C, −20 °C, −23 °C and −26 °C and relative humidity with respect to water (RH) of 95%, 100%, 105%, namely 112.2% to 135.4% with respect to ice (RH). The details are listed in Table 1. In order to eliminate the experimental error caused by the silicon substrate, a blank control was made under the same conditions before the experiment. INPs were absent on blank silicon substrates, which was consistent with the results obtained by Schrod et al. (2016) [] for the uncertainty test of FRIDGE.

Table 1.
Thermodynamic conditions under which INPs are analyzed in the cloud chamber.
3. Results and Analysis
3.1. The General Characteristics of INP Concentration
Temperature and humidity are the two main parameters that determine the activation of INPs. Figure 3a presents the changes of INP concentration under different humidities and temperatures. As expected from previous observations [,], the INP concentration increases with the decrease of temperature and the increase of relative humidity. Under all activation conditions, the mean INP concentration is 4.7 L and the maximum INP concentration reached 15.7 L .
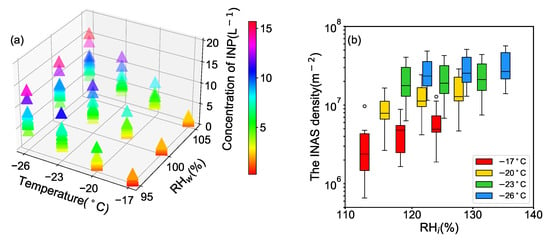
Figure 3.
The INP concentrations (a) and ice nucleation active surface site density (b) under different activation conditions. The boxes represent the interquartile range. The upper and lower edges of the vertical lines represent the maximum and minimum values respectively. Circles represent outliers.
Ice nucleation active surface site (INAS) density (n) represents the number of active sites on the aerosol surface, which reflects the activation capacity of the aerosol. As with the activation fraction, the larger the value is, the better the nucleation ability of aerosol. Compared with the activation fraction of dust on the desert surface of Xinjiang measured in the laboratory by Field et al. (2006) [], the nucleation ability of the aerosols in this paper is weaker than theirs, probably because the large particle size aerosols they obtained had better nucleation energy. However, the INPs in this study mainly come from small particles. Figure 3b shows the n (calculated from the total aerosol) under different conditions. With the decrease of temperature and the increase of humidity, n increases exponentially (Figure 3b). Under all activation conditions, the range of n is between 6 × 10 and 6 × 10 (m). Table 2 provides a comparison of INP concentrations obtained in different campaigns. Our results are within the range of previous studies [,,] but lower than reported by Paramonov et al. (2018) [] in China (dust for 0.2 m particles). Probably because the particle surface they obtained contains more INP active material such bacteria or active minerals. Due to the lack of chemical composition of the aerosols in this experiment, it cannot be discussed in depth.

Table 2.
Summary of INAS observed in different campaigns.
Many studies have been carried out on the dependence of INP concentration on temperature and humidity. Figure 4 compares the results of this work with experimental data reported by other scholars. López and Ávila (2013) [] measured the properties of INPs under deposition nucleation using a cloud chamber cooled by sudden expansion of air. INPs measurements by Al-Naimi and Saunders (1985) [] were obtained from a continuous flow diffusion chamber. The parametrization formulas fitted by Fletcher et al. (1962) [] and Demott et al. (2010) [] are widely used.
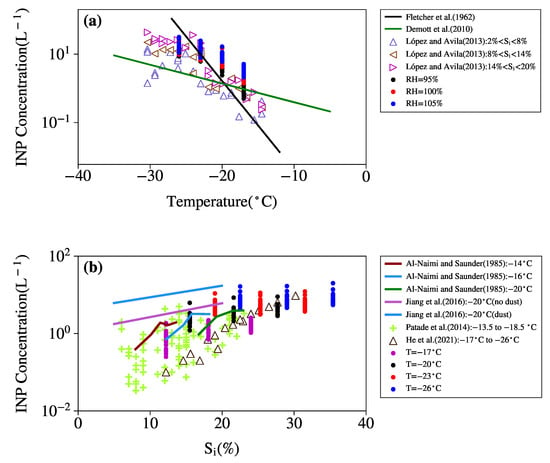
Figure 4.
(a) The variations of INP concentration with temperature at different relative humidity. (b) The variations of INP concentration with relative humidity at different temperature. Some of the results obtained in previous studies are also shown for comparison [,,,,,,].
Compared with the measurement data during a dust event at Xinjiang, which was reported by Jiang et al. (2016) [] (Figure 4b), the concentration of INPs obtained in this experiment is less. It is generally believed that particles with size larger than 0.5 m in diameter have a good correlation with the number concentration of INPs [,], while there are few larger aerosol particles measured in this observation (Section 3.3). He et al. (2021) [] observed many large particles that could act as effective INPs over the Northern China Plain. However, the weather was relatively polluted during the observation period in this study, and the total aerosol particle concentration was as high as 10,000 cm (Section 3.3), which was much larger than in their study. This may account for the higher INP concentrations measured than those reported by He et al. (2021) []. Although these experimental data were carried out at different locations with different instruments, all the results show that the concentration of INPs increases exponentially with decreasing temperature and increasing humidity. The INPs data obtained in this experiment are within the range of previous research.
3.2. The Vertical Distribution of INPs Concentration
Compared with ground-based observations, few measurements focused on the vertical distribution of INP concentration. Figure 5 shows the change of the INP concentration with altitude. Due to different activation conditions, the concentration of INPs varies greatly with height. During the ascent of the aircraft, the maximum value is found at 2300 m, reaching 13.8 L at T = −26 °C, RH = 105% (Figure 5d). Except for 4000 to 5000 m, the vertical change of INPs concentration above 2300 m is not obvious, and the variation range is from 4.3 to 8.7 L at −26 °C. Under the activation conditions of lower temperature (−23 and −26 °C), INP concentration during aircraft descent stage is consistent with that of ascent stage. The maximum value reached 15.7 L, around 2000 m (Figure 5h). Similarly, above 2300 m, there are high values at 4000 to 5000 m compared with other altitudes.
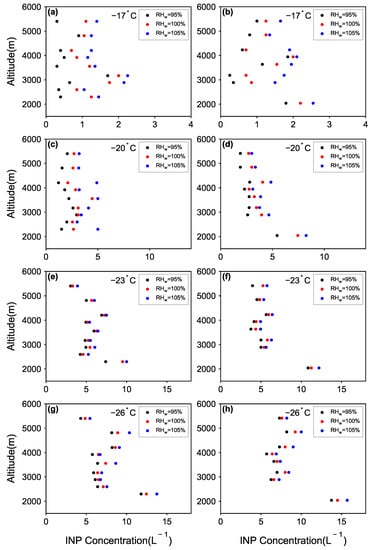
Figure 5.
Vertical distribution of INP concentrations during the ascent stage (a,c,e,g) and the descent stage (b,d,f,h).
Within the flight altitude, the concentrations of INPs above and below 2300 m differ by a maximum of 10 L at T = −26 °C, RH = 105%. However, at higher temperatures (−17 and −20 °C), the INPs concentration above 2300 m varies little, especially during the ascent stage. It may be that the INPs at this height have low activation ability at high temperature, so some INPs fail to activate. Studies have shown that some mineral dusts and organic aerosols have lower activation temperatures []. However, the chemical composition of aerosol was not obtained in this study, so it could not be verified. Overall, the concentration of INPs below 2300 m is significantly larger than that above in this study. Previous studies also show that the concentration of INPs in the lower altitude is generally higher than that in the high altitude [,,]. The specific reasons will be analyzed in the following sections.
3.3. Meteorological Conditions and Aerosol Distribution
The concentration of INPs is affected by many factors, including the source of air mass, physical and chemical properties of aerosols and meteorological conditions [,]. Figure 6 shows the vertical distribution of various meteorological factors. During the experimental period, the relative humidity varied from 50% to 70%, and there was no cloud encountered during the ascent stage. There was an inversion layer around 1300–2300 m (Figure 6a). The inversion layer can inhibit the vertical mixing and diffusion of atmospheric momentum, and reflected the stability of the atmosphere [,]. At about 2300 m, the wind shifts from northeast to west, and the wind speed increased sharply from about 2 m s to more than 10 m s (Figure 6b). It can be judged that the height of the PBL is about 2300 m. During the ascent of the aircraft, a total of 9 samples were collected from 2300 to 5500 m. The lowest height samples were collected at 2300 m near the PBL, and the rest of the samples were collected above the PBL. Figure 6c shows the aerosols concentration at the corresponding altitude at the time of sampling. In general, between 2300 m to 5500 m, the total concentration of aerosol particles is much larger than the concentration of aerosol particles large than 0.5 m in diameter.
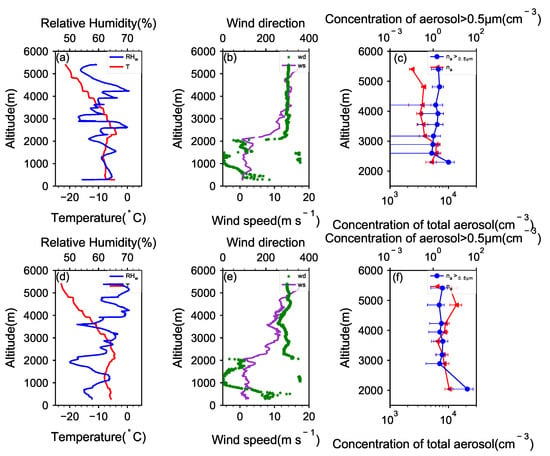
Figure 6.
Vertical distributions of the meteorological parameters during the ascent stage (a–c) and the descent stage (d–f).
During the descent stage, from 1300 to 2300 m, the temperature increases with height (Figure 6d). The turning point of wind direction was 2100 m; below 2300 m was mainly easterly, and above 2300 m was westerly (Figure 6e). The lowest sampling height during the aircraft descent was 2040 m, similar to that during the ascent stage. At this height, the total aerosol concentration was relatively large, and the concentration of aerosol particles with a size larger than 0.5 m reached 20 cm, which is significantly larger than that above the PBL (Figure 6f).
Figure 7 depicts the aerosol size distribution. Because the distance between the two phases of flight is relatively close, the changes of the spectral distribution of aerosol with altitude have a certain similarity. The concentration of fine-mode aerosol particles is very large. This is consistent with the investigation of Zheng et al. (2022) [] in winter in Xinjiang. Similar to the report of He et al. (2021), the aerosol concentration is higher in the low altitude. The aerosol concentration below 2300 m decreases with the increase of altitude, and particles larger than 0.5 m reached as high as 100 cm. Between 2300 m and 5500 m, aerosol concentration varies little with altitude, and is mainly composed of small particles (0.1–0.2 m). The concentration of aerosols larger than 0.5 m is less than 5 cm, and even have not been observed at some heights. Some aerosol larger than 0.5 m reported by He et al. (2021) [] were caused by the hygroscopic growth of aerosols near clouds. However, in this study, there were no clouds at all, and the relative humidity in the upper air is relatively low (RH < 71%) (Figure 6a,d). There are no larger aerosol particles caused by hygroscopic growth. The total aerosol concentration at high altitude during the descending phase of flight is higher than that in the ascent stage, especially the concentration of aerosol particles with small sizes. It may be because the descending phases is on the west side, and closer to Urumqi, a megacity. The pollution in this area is relatively serious [], and the westerly wind brings more aerosol particles to the sampling site.
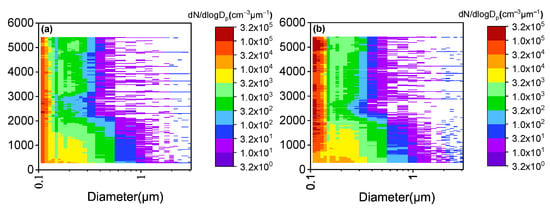
Figure 7.
Vertical variation of the average aerosol size distribution during the ascent stage (a) and during the descent stage (b).
The formation of aerosol layers is related to the PBL []. The existence of inversion layer also affected the diffusion of aerosols []. The top of the inversion layer observed in this study was around 2300 m, which could lead to the obvious stratification of aerosols around 2300 m. At present, it is generally believed that larger aerosol particles are more likely to serve as INPs; aerosols with a size larger than 0.5 m are especially more closely related to INPs [,]. Fine-mode aerosol particles with better activation ability or large particles (>0.5 m) may lead to a markedly larger INP concentration below the PBL. The PBL affects the distribution of INPs in the upper air. A number of studies in recent years have reached similar conclusions. Influenced by biological INPs near the PBL where the cloud is formed, the high value of INP concentration was not at ground level [].
3.4. Origin of the Air Masses
Affected by the northwest and northeast cyclones (Figure 2), westerly wind was dominant at the sampling height and in the descent stage (Figure 6). The source of air mass was calculated by the Hybrid Single-Particle Lagrangian Integrated Trajectory model (HYSPLIT) []. From the backward track of 36 and 72 h (Figure 8), the origin of air masses at the two sites is relatively consistent. The air masses at 2300 m and below (within the PBL) are transported from short distances and originate from the closer areas around the observation site. Under the action of westerly winds at high altitude, air masses above 2300 originate from long distance through the deserts of Central Asia. The air mass track also passes through Urumqi. In winter, due to coal and natural gas burning for heating in Urumqi, the secondary formation of fine particles occurs [,,]. Previous studies have shown that pollution aerosols are not good INPs [,]. However, other studies reported that pollution aerosols can act as INPs to increase the number of ice crystals in cirrus [,,]. Since the type of aerosols was not obtained in this experiment, it cannot be judged.
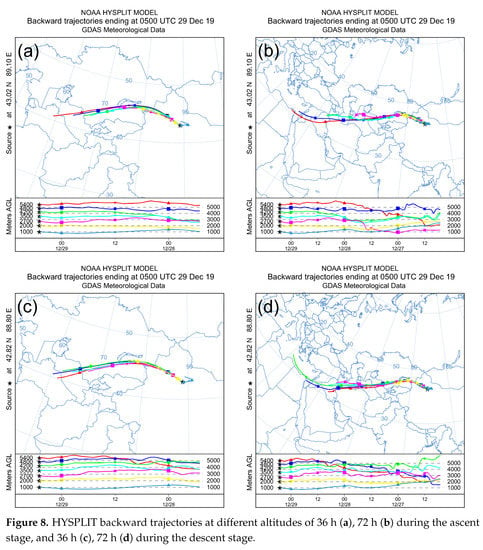
Figure 8.
HYSPLIT backward trajectories at different altitudes of 36 h (a), 72 h (b) during the ascent stage, and 36 h (c), 72 h (d) during the descent stage.
The sources of INPs above and below the PBL are different, which is consistent with the observation of Chen et al. (2021) []. In addition, the existence of the inversion layer inhibits the upward and downward diffusion of aerosol (Section 3.3). These factors might lead to the significant differences in INPs concentrations between the upper and lower levels of PBL. The trajectories of air masses between 4000 m and 5000 m are very similar, and they all originate from a greater distance. This may be the reason why more INPs are activated at this height.
4. Discussion and Conclusions
Based on the Ice nucleating particles (INPs) collected by aircraft, meteorological parameters and aerosol data obtained by various airborne instruments in Xinjiang on 29 December 2019, the vertical distribution of INPs under typical winter weather conditions in Xinjiang were discussed, and the effects of various meteorological parameters (T, RH, etc.) and aerosols were analyzed. When the temperature is −17 °C, −20 °C, −23 °C, −26 °C and RH of 95%, 100%, 105% or equivalently RH of 110 to 140%, the concentration of INPs varies from 0.25 L to 15.7 L.
The location of this study is positioned below the northeast and northwest cyclones for the sampling period. There is an obvious inversion layer near 1300–2300 m, and the height of the PBL is about 2300 m. Near the PBL, there is obvious stratification of the aerosol. The INP concentration varies nonlinearly with the height. The concentration of INPs below the PBL is significantly larger than that above the PBL, reaching 15.7 L at −26 °C and RH of 105%. Perhaps due to the influence of the inversion layer near the PBL, the stratification is relatively stable, which inhibits the vertical mixing of aerosols. Above the PBL, it is mainly controlled by the northwest airflow, and the INPs are derived from the aerosols transported from a long distance. Aerosols below the PBL come from a relatively close area. Some fine-mode aerosol particles with better activation ability or large particles (>0.5 m) may be activated.
This work fills in the gap of the high-altitude observation of the INPs under typical winter weather in Xinjiang, and it is found that the existence of the inversion layer near the PBL has an important influence on the vertical distribution of the INP concentration. The parameterization formulas used in the model are almost fitted with the INPs observed on the ground, and consider few parameters (temperature, concentration and size of aerosol), ignoring meteorological factors, aerosol types and other factors. Observations of INPs in the free atmosphere can more accurately reflect the characteristics of INPs near the cloud layer and contribute to the improvement of parameterizations. The chemical composition of the INPs was not analyzed. Moreover, this study is only based on data from one flight. More general conclusions need more observational data to support them.
Author Contributions
Conceptualization and methodology, J.W., Y.Y., C.H.; formal analysis, J.W.; investigation, J.W., K.C., C.H.; resources, K.C., B.Z., B.L., Y.L. (Yuanyuan Li), Y.L. (Yijing Lv); data curation, J.W., K.C., C.H.; writing original draft preparation, J.W.; writing review and editing, Y.Y., C.H., K.C., H.J.; Project administration and supervision, Y.Y. All authors have read and agreed to the published version of the manuscript.
Funding
This study was supported by the Weather Modification Ability Construction Project of Northwest China (ZQCR18211); the Weather Modification Construction Research and Test Project in northwest China of China Meteorological Administration (RYSY201902); the National Natural Science Foundation of China (41590873); the Ningbo Meteorological Science and Technology Planning Project (NBQX2020015B).
Institutional Review Board Statement
Not applicable.
Informed Consent Statement
Not applicable.
Data Availability Statement
The data are available from the corresponding author by request.
Acknowledgments
We acknowledge the Xinjiang Weather Modification Office for providing flight support and the data of airborne instruments.
Conflicts of Interest
The authors declare no conflict of interest.
References
- Cziczo, D.J.; Froyd, K.D.; Hoose, C.; Jensen, E.J.; Diao, M.; Zondlo, M.A.; Smith, J.B.; Twohy, C.H.; Murphy, D.M. Clarifying the Dominant Sources and Mechanisms of Cirrus Cloud Formation. Science 2013, 340, 1320–1324. [Google Scholar] [CrossRef]
- Zhao, B.; Wang, Y.; Gu, Y.; Liou, K.-N.; Jiang, J.H.; Fan, J.; Liu, X.; Huang, L.; Yung, Y.L. Ice Nucleation by Aerosols from Anthropogenic Pollution. Nat. Geosci. 2019, 12, 602–607. [Google Scholar] [CrossRef] [PubMed]
- Vergara-Temprado, J.; Miltenberger, A.K.; Furtado, K.; Grosvenor, D.P.; Shipway, B.J.; Hill, A.A.; Wilkinson, J.M.; Field, P.R.; Murray, B.J.; Carslaw, K.S. Strong Control of Southern Ocean Cloud Reflectivity by Ice-Nucleating Particles. Proc. Natl. Acad. Sci. USA 2018, 115, 2687–2692. [Google Scholar] [CrossRef] [PubMed]
- Bruintjes, R.T. A Review of Cloud Seeding Experiments to Enhance Precipitation and Some New Prospects. Bull. Am. Meteorol. Soc. 1999, 80, 805–820. [Google Scholar] [CrossRef]
- Guo, X.; Zheng, G.; Jin, D. A Numerical Comparison Study of Cloud Seeding by Silver Iodide and Liquid Carbon Dioxide. Atmos. Res. 2006, 79, 183–226. [Google Scholar] [CrossRef]
- Bigg, E.K. Natural Atmospheric Ice Nuclei. Sci. Prog. 1961, 49, 458. [Google Scholar]
- Paul, S.K.; Sharma, S.K.; Selvam, A.M.; Murty, A.S.R. The title of the cited article. J. Rech. Atmos. 1985, 19, 323–327. [Google Scholar]
- Rogers, D.C.; DeMott, P.J.; Kreidenweis, S.M.; Chen, Y. A Continuous-Flow Diffusion Chamber for Airborne Measurements of Ice Nuclei. J. Atmos. Oceanic Technol. 2001, 18, 725–741. [Google Scholar] [CrossRef]
- Twohy, C.H.; McMeeking, G.R.; DeMott, P.J.; McCluskey, C.S.; Hill, T.C.J.; Burrows, S.M.; Kulkarni, G.R.; Tanarhte, M.; Kafle, D.N.; Toohey, D.W. Abundance of Fluorescent Biological Aerosol Particles at Temperaturesconducive to the Formation of Mixed-Phase and Cirrus Clouds. Atmos. Chem. Phys. 2016, 16, 8205–8225. [Google Scholar] [CrossRef]
- Prenni, A.J.; DeMott, P.J.; Twohy, C.; Poellot, M.R.; Kreidenweis, S.M.; Rogers, D.C.; Brooks, S.D.; Richardson, M.S.; Heymsfield, A.J. Examinations of Ice Formation Processes in Florida Cumuli Using Ice Nuclei Measurements of Anvil Ice Crystal Particle Residues: Examinations of ice formation processes. J. Geophys. Res. 2007, 112, D10221. [Google Scholar] [CrossRef]
- Anderson, T.L.; Charlson, R.J.; Winker, D.M.; Ogren, J.A.; Holmén, K. Mesoscale Variations of Tropospheric Aerosols*. J. Atmos. Sci. 2003, 60, 119–136. [Google Scholar] [CrossRef]
- Patade, S.; Nagare, B.; Wagh, S.; Maheskumar, R.S.; Prabha, T.V.; Pradeep Kumar, P. Deposition Ice Nuclei Observations over the Indian Region during CAIPEEX. Atmos. Res. 2014, 149, 300–314. [Google Scholar] [CrossRef]
- Conen, F.; Rodríguez, S.; Hülin, C.; Henne, S.; Herrmann, E.; Bukowiecki, N.; Alewell, C. Atmospheric Ice Nuclei at the High-Altitude Observatory Jungfraujoch, Switzerland. Tellus Chem. Phys. Meteorol. 2015, 67, 25014. [Google Scholar] [CrossRef]
- Boose, Y.; Sierau, B.; Garcí, M.I.; Rodríguez, S.; Alastuey, A.; Linke, C.; Schnaiter, M.; Kupiszewski, P.; Kanji, Z.A.; Lohmann, U. Ice nucleating particles in the Saharan Air Layer. Atmos. Chem. Phys. 2016, 16, 9067–9087. [Google Scholar] [CrossRef]
- Brunner, C.; Brem, B.T.; Collaud Coen, M.; Conen, F.; Hervo, M.; Henne, S.; Steinbacher, M.; Gysel-Beer, M.; Kanji, Z.A. The contribution of Saharan dust to the ice-nucleating particle concentrations at the High Altitude Station Jungfraujoch (3580 m a.s.l.). Atmosphere 2021, 21, 18029–18053. [Google Scholar] [CrossRef]
- Hartmann, M.; Adachi, K.; Eppers, O.; Haas, C.; Herber, A.; Holzinger, R.; Hünerbein, A.; Jäkel, E.; Jentzsch, C.; Pinxteren, M.; et al. Wintertime Airborne Measurements of Ice Nucleating Particles in the High Arctic: A Hint to a Marine, Biogenic Source for Ice Nucleating Particles. Geophys. Res. Lett. 2020, 47, e2020GL087770. [Google Scholar] [CrossRef]
- Sanchez-Marroquin, A.; West, J.S.; Burke, I.T.; McQuaid, J.B.; Murray, B.J. Mineral and Biological Ice-Nucleating Particles above the South East of the British Isles. Environ. Sci. Atmos. 2021, 1, 176–191. [Google Scholar] [CrossRef] [PubMed]
- Ardon-Dryer, K.; Levin, Z.; Lawson, R.P. Characteristics of Immersion Freezing Nuclei at the South Pole Station in Antarctica. Atmos. Chem. Phys. 2011, 11, 4015–4024. [Google Scholar] [CrossRef]
- He, C.; Yin, Y.; Wang, W.; Chen, K.; Mai, R.; Jiang, H.; Zhang, X.; Fang, C. Aircraft Observations of Ice Nucleating Particles over the Northern China Plain: Two Cases Studies. Atmos. Res. 2021, 248, 105242. [Google Scholar] [CrossRef]
- Chen, K.; Yin, Y.; Liu, S.; Liu, C.; Wang, H.; He, C.; Jiang, H.; Chen, J. Concentration and Variability of Deposition-Mode Ice Nucleating Particles from Mt. Tai of China in the Early Summer. Atmos. Res. 2021, 253, 105426. [Google Scholar] [CrossRef]
- Lacher, L.; Steinbacher, M.; Bukowiecki, N.; Herrmann, E.; Zipori, A.; Kanji, Z. Impact of Air Mass Conditions and Aerosol Properties on Ice Nucleating Particle Concentrations at the High Altitude Research Station Jungfraujoch. Atmosphere 2018, 9, 363. [Google Scholar] [CrossRef]
- Lacher, L.; DeMott, P.J.; Levin, E.J.T.; Suski, K.J.; Boose, Y.; Zipori, A.; Herrmann, E.; Bukowiecki, N.; Steinbacher, M.; Gute, E.; et al. Background Free-Tropospheric Ice Nucleating Particle Concentrations at Mixed-Phase Cloud Conditions. J. Geophys. Res. Atmos. 2018, 123, 10506–10525. [Google Scholar] [CrossRef] [Green Version]
- Yin, Z.; Cui, K.; Chen, S.; Zhao, Y.; Chao, H.-R.; Chang-Chien, G.-P. Characterization of the Air Quality Index for Urumqi and Turfan Cities, China. Aerosol Air Qual. Res. 2019, 19, 282–306. [Google Scholar] [CrossRef]
- Klein, H.; Haunold, W.; Bundke, U.; Nillius, B.; Wetter, T.; Schallenberg, S.; Bingemer, H. A new method for sampling of atmospheric ice nuclei with subsequent analysis in a static diffusion chamber. Atmos. Res. 2010, 96, 218–224. [Google Scholar] [CrossRef]
- Schrod, J.; Danielczok, A.; Weber, D.; Ebert, M.; Thomson, E.S.; Bingemer, H.G. Re-evaluating the Frankfurt isothermal static diffusion chamber for ice nucleation. Atmos. Meas. Tech. 2016, 9, 386–398. [Google Scholar] [CrossRef]
- Su, H.; Yin, Y.; Lu, C.; Jiang, H.; Yang, L. Development of new diffusion cloud chamber type and its observation study of ice nuclei in the Huangshan area. Chin. J. Atmos. Sci. 2014, 38, 386–398. [Google Scholar]
- Tang, M.; Chen, J.; Wu, Z. Ice nucleating particles in the troposphere: Progresses, challenges and opportunities. Atmos. Environ. 2018, 192, 206–208. [Google Scholar] [CrossRef]
- Marcolli, C. Deposition nucleation viewed as homogeneous or immersion freezing in pores and cavities. Atmos. Chem. Phys. 2014, 14, 2071–2104. [Google Scholar] [CrossRef]
- Wex, H.; DeMott, P.J.; Tobo, Y.; Hartmann, S.; Rösch, M.; Clauss, T.; Tomsche, L.; Niedermeier, D.; Stratmann, F. Kaolinite particles as ice nuclei: Learning from the use of different kaolinite samples and different coatings. Atmos. Chem. Phys. 2014, 14, 5529–5546. [Google Scholar] [CrossRef]
- Fletcher, N.H. The Physics of Rainclouds; Cambridge University Press: Cambridge, UK, 2007; p. 408. [Google Scholar]
- DeMott, P.J.; Prenni, A.J.; Liu, X.; Kreidenweis, S.M.; Petters, M.D.; Twohy, C.H.; Richardson, M.S.; Eidhammer, T.; Rogers, D.C. Predicting Global Atmospheric Ice Nuclei Distributions and Their Impacts on Climate. Proc. Natl. Acad. Sci. USA 2010, 107, 11217–11222. [Google Scholar] [CrossRef]
- Field, P.R.; Möhler, O.; Connolly, P.; Krämer, M.; Cotton, R.; Heymsfield, A.J.; Saathoff, H.; Schnaiter, M. Some ice nucleation characteristics of Asian and Saharan desert dust. Atmos. Chem. Phys. 2006, 6, 2991–3006. [Google Scholar] [CrossRef]
- Schrod, J.; Weber, D.; Drücke, J.; Keleshis, C.; Pikridas, M.; Ebert, M.; Cvetković, B.; Nickovic, S.; Marinou, E.; Baars, H.; et al. Ice nucleating particles over the Eastern Mediterranean measured by unmanned aircraft systems Atmos. Chem. Phys. 2017, 17, 4817–4835. [Google Scholar]
- Price, H.C.; Baustian, K.J.; McQuaid, J.B.; Blyth, A.; Bower, K.N.; Choularton, T.; Cotton, R.J.; Cui, Z.; Field, P.R.; Gallagher, M.; et al. Atmospheric Ice-Nucleating Particles in the Dusty Tropical Atlantic. J. Geophys. Res. Atmos. 2018, 17, 2175–2193. [Google Scholar] [CrossRef]
- Porter, G.C.E.; Adams, M.P.; Brooks, I.M.; Ickes, L.; Karlsson, L.; Leck, C.; Salter, M.E.; Schmale, J.; Siegel, K.; Sikora, S.N.F.; et al. Highly Active Ice-Nucleating Particles at the Summer North Pole. JGR Atmos. 2022, 127, e2021JD036059. [Google Scholar] [CrossRef]
- Paramonov, M.; David, R.O.; Kretzschmar, R.; Kanji, Z.A. A laboratory investigation of the ice nucleation efficiency of three types of mineral and soil dust. Atmos. Chem. Phys. 2018, 18, 16515–16536. [Google Scholar] [CrossRef]
- López, M.L.; Ávila, E.E. Measurements of Natural Deposition Ice Nuclei in Córdoba, Argentina. Atmos. Chem. Phys. 2013, 13, 3111–3119. [Google Scholar] [CrossRef]
- Al-Naimi, R.; Saunders, C.P.R. Measurements of Natural Deposition and Condensation-Freezing Ice Nuclei with a Continuous Flow Chamber. Atmos. Environ. 1985, 19, 1871–1882. [Google Scholar] [CrossRef]
- Jiang, H.; Yin, Y.; Wang, X.; Gao, R.; Yuan, L.; Chen, K.; Shan, Y. The Measurement and Parameterization of Ice Nucleating Particles in Different Backgrounds of China. Atmos. Res. 2016, 181, 72–80. [Google Scholar] [CrossRef]
- Jiang, H.; Yin, Y.; Chen, K.; Chen, Q.; He, C.; Sun, L. The Measurement of Ice Nucleating Particles at Tai’an City in East China. Atmos. Res. 2020, 232, 104684. [Google Scholar] [CrossRef]
- Hoose, C.; Möhler, O. Heterogeneous Ice Nucleation on Atmospheric Aerosols: A Review of Results from Laboratory Experiments. Atmos. Chem. Phys. 2012, 12, 9817–9854. [Google Scholar] [CrossRef]
- Rogers, D.C.; DeMott, P.J.; Kreidenweis, S.M. Airborne measurements of tropospheric ice-nucleating aerosol particles in the Arctic spring. J. Geophys. Res. Atmos. 2001, 106, 15053–15063. [Google Scholar] [CrossRef]
- Niu, S.; Chen, Y.; An, X.; Huang, S. Measurements and analysis of concentrations of atmospheric ice nuclei in the Helanshan area. J. Nanjing Inst. Meteorol. 2000, 6, 294–298, (In Chinese with English Abstract). [Google Scholar]
- Haikin, N.; Galanti, E.; Reisin, T.G.; Mahrer, Y.; Alpert, P. Inner Structure of Atmospheric Inversion Layers over Haifa Bay in the Eastern Mediterranean. Boundary-Layer Meteorol. 2015, 156, 471–487. [Google Scholar] [CrossRef]
- Xiang, Y.; Zhang, T.; Liu, J.; Lv, L.; Dong, Y.; Chen, Z. Atmosphere Boundary Layer Height and Its Effect on Air Pollutants in Beijing during Winter Heavy Pollution. Atmos. Res. 2019, 215, 305–316. [Google Scholar] [CrossRef]
- Zheng, B.; Chen, S.; Li, Y.; Fan, R.; Kong, L.; Hao, L. Aircraft observation and analysis of vertical distribution of aerosols in Turpan and Ruoqiang in winter. Arid. Land Geogr. 2022, 1–15, (In Chinese with English Abstract). [Google Scholar]
- Li, J.; Zhuang, G.; Huang, K.; Lin, Y.; Xu, C.; Yu, S. Characteristics and Sources of Air-Borne Particulate in Urumqi, China, the Upstream Area of Asia Dust. Atmos. Environ. 2008, 42, 776–787. [Google Scholar] [CrossRef]
- Miao, Y.; Guo, J.; Liu, S.; Liu, H.; Zhang, G.; Yan, Y.; He, J. Relay Transport of Aerosols to Beijing-Tianjin-Hebei Region by Multi-Scale Atmospheric Circulations. Atmos. Environ. 2017, 165, 35–45. [Google Scholar] [CrossRef]
- Liu, D.; Yan, W.; Kang, Z.; Liu, A.; Zhu, Y. Boundary-Layer Features and Regional Transport Process of an Extreme Haze Pollution Event in Nanjing, China. Atmos. Pollut. Res. 2018, 9, 1088–1099. [Google Scholar] [CrossRef]
- Stith, J.L.; Ramanathan, V.; Cooper, W.A.; Roberts, G.C.; DeMott, P.J.; Carmichael, G.; Hatch, C.D.; Adhikary, B.; Twohy, C.H.; Rogers, D.C.; et al. An Overview of Aircraft Observations from the Pacific Dust Experiment Campaign. J. Geophys. Res. 2009, 114, D05207. [Google Scholar] [CrossRef]
- Stein, A.F.; Draxler, R.R.; Rolph, G.D.; Stunder, B.J.B.; Cohen, M.D.; Ngan, F. NOAA’s HYSPLIT Atmospheric Transport and Dispersion Modeling System. Bull. Am. Meteorol. Soc. 2015, 96, 2059–2077. [Google Scholar] [CrossRef]
- Turap, Y.; Rekefu, S.; Wang, G.; Talifu, D.; Gao, B.; Aierken, T.; Hao, S.; Wang, X.; Tursun, Y.; Maihemuti, M.; et al. Chemical Characteristics and Source Apportionment of PM2.5 during Winter in the Southern Part of Urumqi, China. Aerosol Air Qual. Res. 2019, 19, 1325–1337. [Google Scholar] [CrossRef]
- Li, H.; He, Q.; Liu, X. Identification of Long-Range Transport Pathways and Potential Source Regions of PM2.5 and PM10 at Akedala Station, Central Asia. Atmosphere 2020, 11, 1183. [Google Scholar] [CrossRef]
- Tobo, Y.; Uetake, J.; Matsui, H.; Moteki, N.; Uji, Y.; Iwamoto, Y.; Miura, K.; Misumi, R. Seasonal Trends of Atmospheric Ice Nucleating Particles Over Tokyo. J. Geophys. Res. Atmos. 2020, 125, e2020JD033658. [Google Scholar] [CrossRef]
- Adams, M.P.; Tarn, M.D.; Sanchez-Marroquin, A.; Porter, G.C.E.; O’Sullivan, D.; Harrison, A.D.; Cui, Z.; Vergara-Temprado, J.; Carotenuto, F.; Holden, M.A.; et al. A Major Combustion Aerosol Event Had a Negligible Impact on the Atmospheric Ice-Nucleating Particle Population. J. Geophys. Res. Atmos. 2020, 125, e2020JD032938. [Google Scholar] [CrossRef]
- Knopf, D.A.; Wang, B.; Laskin, A.; Moffet, R.C.; Gilles, M.K. Heterogeneous nucleation of ice on anthropogenic organic particles collected in Mexico City: Ice nucleation on anthropogenic aerosol. Geophys. Res. Lett. 2010, 37. [Google Scholar] [CrossRef]
- Wang, B.; Lambe, A.T.; Massoli, P.; Onasch, T.B.; Davidovits, P.; Worsnop, D.R.; Knopf, D.A. The deposition ice nucleation and immersion freezing potential of amorphous secondary organic aerosol: Pathways for ice and mixed-phase cloud formation. J. Geophys. Res. Atmos. 2012, 117. [Google Scholar] [CrossRef]
- Zhu, J.; Penner, J.E. Radiative forcing of anthropogenic aerosols on cirrus clouds using a hybrid ice nucleation scheme. Atmos. Chem. Phys. 2020, 20, 7801–7827. [Google Scholar] [CrossRef]
Publisher’s Note: MDPI stays neutral with regard to jurisdictional claims in published maps and institutional affiliations. |
© 2022 by the authors. Licensee MDPI, Basel, Switzerland. This article is an open access article distributed under the terms and conditions of the Creative Commons Attribution (CC BY) license (https://creativecommons.org/licenses/by/4.0/).