1. Introduction
Weather forecasting and services are becoming more precise due to meteorological advancements; consequently, data quality control requirements are increasing. Real-time quality control for automatic weather stations (AWSs) in China is operated on the Meteorological Data Operating System (MDOS), which includes a set of typical quality control methods. Except for precipitation in the tropics, the MDOS performed well across most of China and for the majority of weather factors. There is a need for better quality control than the MDOS due to the small, rapidly changing convective precipitation in the tropics, the large number of regional-level AWSs compared to national-level AWSs, the dearth of observers, the incomplete observational weather components and low instrument maintenance, and the numerous possibilities of precipitation anomalies [
1]. Many studies have been conducted on quality control for hourly surface precipitation [
2,
3,
4]. Furthermore, there are numerous potential causes and effects of precipitation anomalies [
5]. Research shows that radar quantitative precipitation estimation (QPE) has some effect on the quality control of local, thermal convective, and weak precipitation [
6,
7,
8]. The network of radar sites, however, is not uniformly dispersed, making it impossible to cover all the AWSs completely. As a result, there is currently a need for a lot of manual quality control of precipitation [
9]; however, the necessity for real-time numerical weather forecasting and weather services cannot be met by manual quality control, which has a time lag of several hours to several days after the time of observation. In addition, real-time precipitation quality control is so difficult for AWSs in the tropics.
The multicomponent integrated consistency analysis method, which is based on the idea that precipitation is frequently accompanied by a number of features including a drop in temperature, a rise in relative humidity, a loss of visibility, and an increase in wind speed, is frequently used by the data quality control operations at AWSs. For precipitation judged to be suspicious by the MDOS, meteorologists use the multicomponent integrated consistency analysis method to subjectively judge whether the precipitation information is correct or not. This method is only applicable to stations with complete observational weather components; it can only be used to make qualitative judgments about precipitation, and is largely subject to auditor subjectivity.
Many studies have made improvements to the multicomponent integrated consistency analysis method. Estévez et al. [
10] designed quality control (QC) procedures to distinguish spurious precipitation caused by irrigation systems by studying the relationship between solar radiation attenuation (atmospheric transmission coefficient), relative humidity, and cloudiness of rainfall measurements. Wu Hong et al. [
11] proposed a QC method based on the correlation between precipitation and visibility. Li Juan [
12] proposed two basic data quality control methods based on time correlation and weather component correlation. Zhang Lejian et al. [
13] proposed a multicomponent integrated quality control method for hourly rainfall observed at national-level AWSs, based on an analysis of temperature variations, wind speed variations, relative humidities, dew point depressions, and rainfall differences between radar stations and AWSs. Based on correlations between different weather components and with each other, Huang Xiangbing [
14], initially used grey correlation analysis to screen correlating weather components as the input neurons of the limit learning machine, and then used it to output the predicted values of the target component. For quality control of weak AWS precipitation data, Zhang Delong [
15] used satellite Fengyun 2E and 2G cloud classification products to establish radar–ground station precipitation statistical relationships under different precipitation intensities by adopting a multi-source data quality control method. Hou Biao [
16] proposed a weather-detection data quality control algorithm based on data mining methods and techniques. This method is based on the correlation between weather components and the potential patterns of variability in weather components (e.g., air pressure or rainfall) over a period of time.
All of these studies, however, are based on AWSs using observations of numerous weather components, and thus are not appropriate for regional-level AWSs with fewer of these observations (or even rain gauge stations with only precipitation observations). As a result, we developed gridded fusion products as part of an integrated strategy for multicomponent consistency, in order to complete the weather component observations that are lacking from regional-level AWSs. Additionally, we suggested a scoring system to assess how well precipitation-related weather components “match” the precipitation process, and make a qualitative determination as to whether the precipitation data are accurate or not.
The article is organized as follows. We will first review the reference weather components we chose, the gridded fusion products we used, and the scoring method. The QC outcomes from the scoring method are then shown, including a study of a specific case and an analysis of all suspicious precipitation reports for the summer of 2021 in Hainan Province, China. Finally, the conclusions and discussion are included.
2. Materials and Methods
2.1. Selection of Reference Related Weather Components
The first step was to choose the reference weather components that were most closely related to the precipitation process. The correlation coefficients between precipitation and the reference weather components were calculated using AWS observational data from the Chinese province of Hainan, from September 2020 to August 2021, with MDOS quality control. Equation (1) was used to determine correlation coefficients. Significance tests were carried out as shown in Equation (2), in order to examine whether the association between each reference weather component and precipitation was statistically significant. The correlation was considered significant if the estimated t-absolute value exceeded the t-value at
p 0.05 (n–2 level of freedom); otherwise, it was considered not significant.
While dew point depression (T–D), atmospheric pressure (P), 10-minute mean visibility (10 Vis), minimum hourly visibility (MinVis), horizontal artificial visibility (Vis), and precipitation were negatively correlated, the following variables were positively correlated: temperature (Tem), 2-minute mean wind speed (2 minWin), extreme wind speed (ExtWin), maximum hourly wind speed (MaxWin), relative humidity (RH), and precipitation (Pre) (
Table 1).
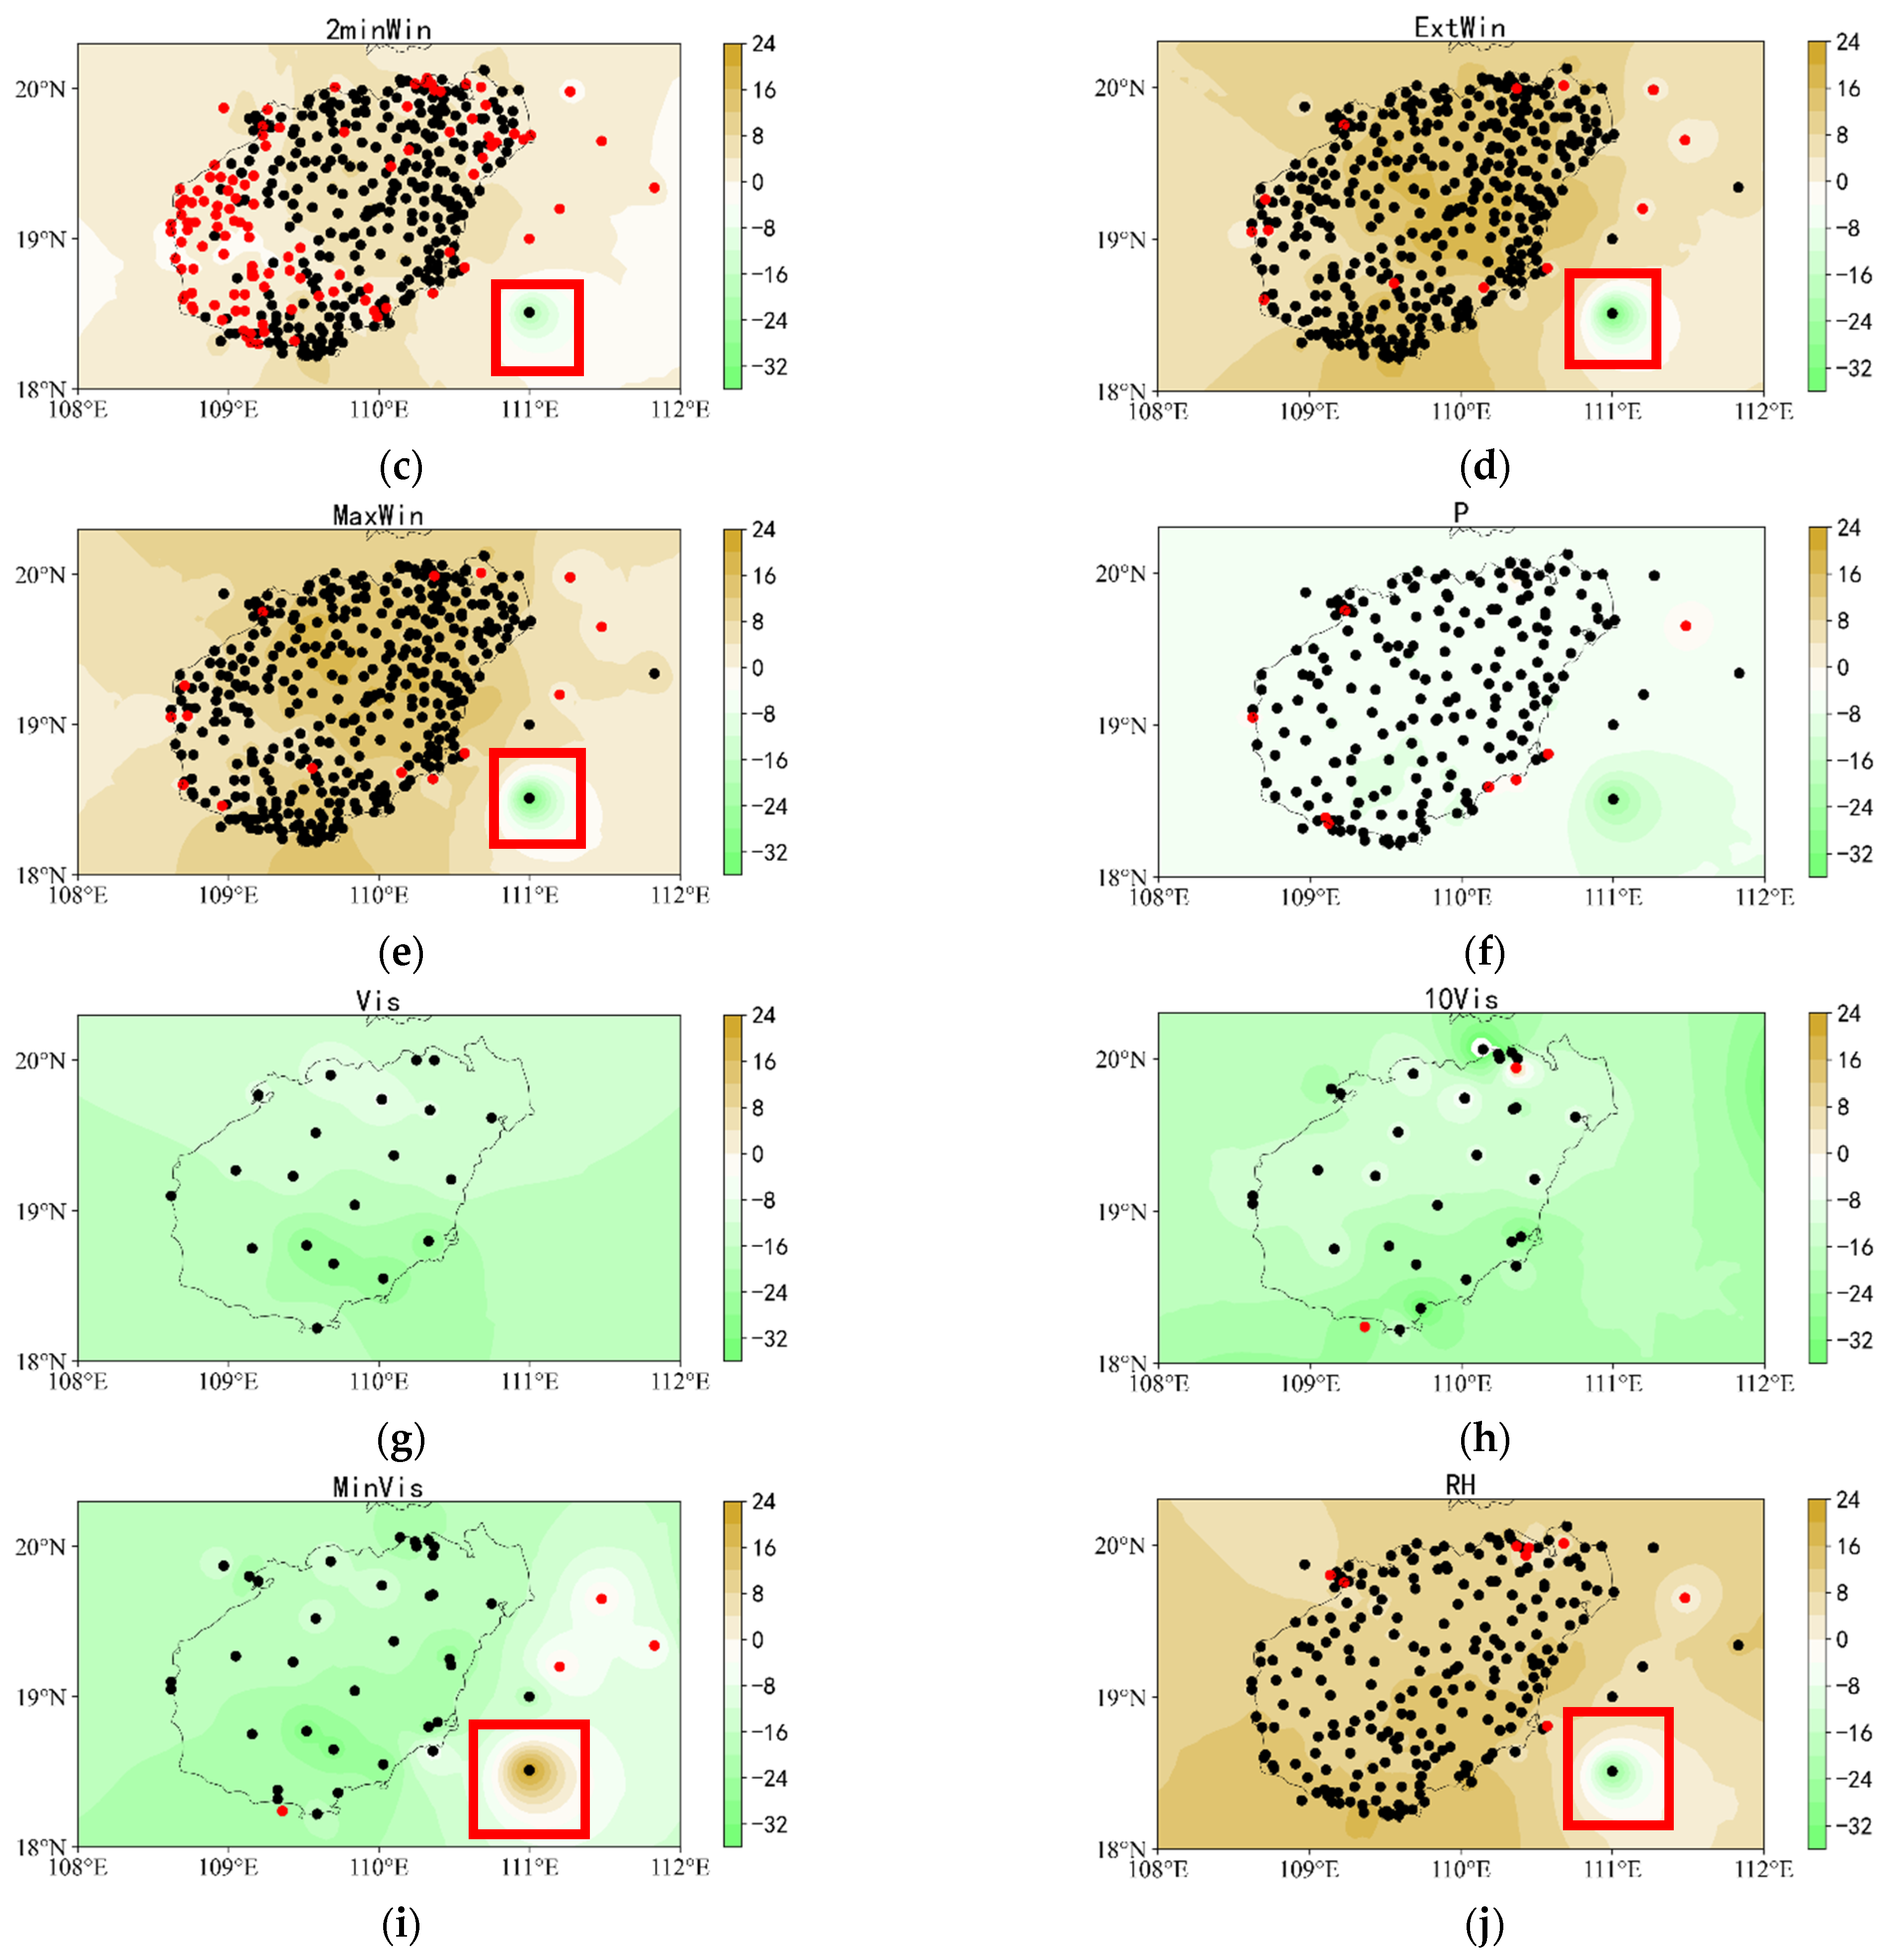
Figure 1 displays the correlation coefficients, and whether the stations passed the significance tests for each reference weather component in Hainan Province, China. The color scale in
Figure 1 shows that green represents a negative correlation coefficient between the weather component and precipitation, and brown represents a positive correlation coefficient between the weather component and precipitation. The 2-minute mean wind speed correlation was the second lowest, probably because the wind is a rapidly changing weather component, and a positive 2-minute mean wind speed is not representative of the hourly wind response to precipitation.
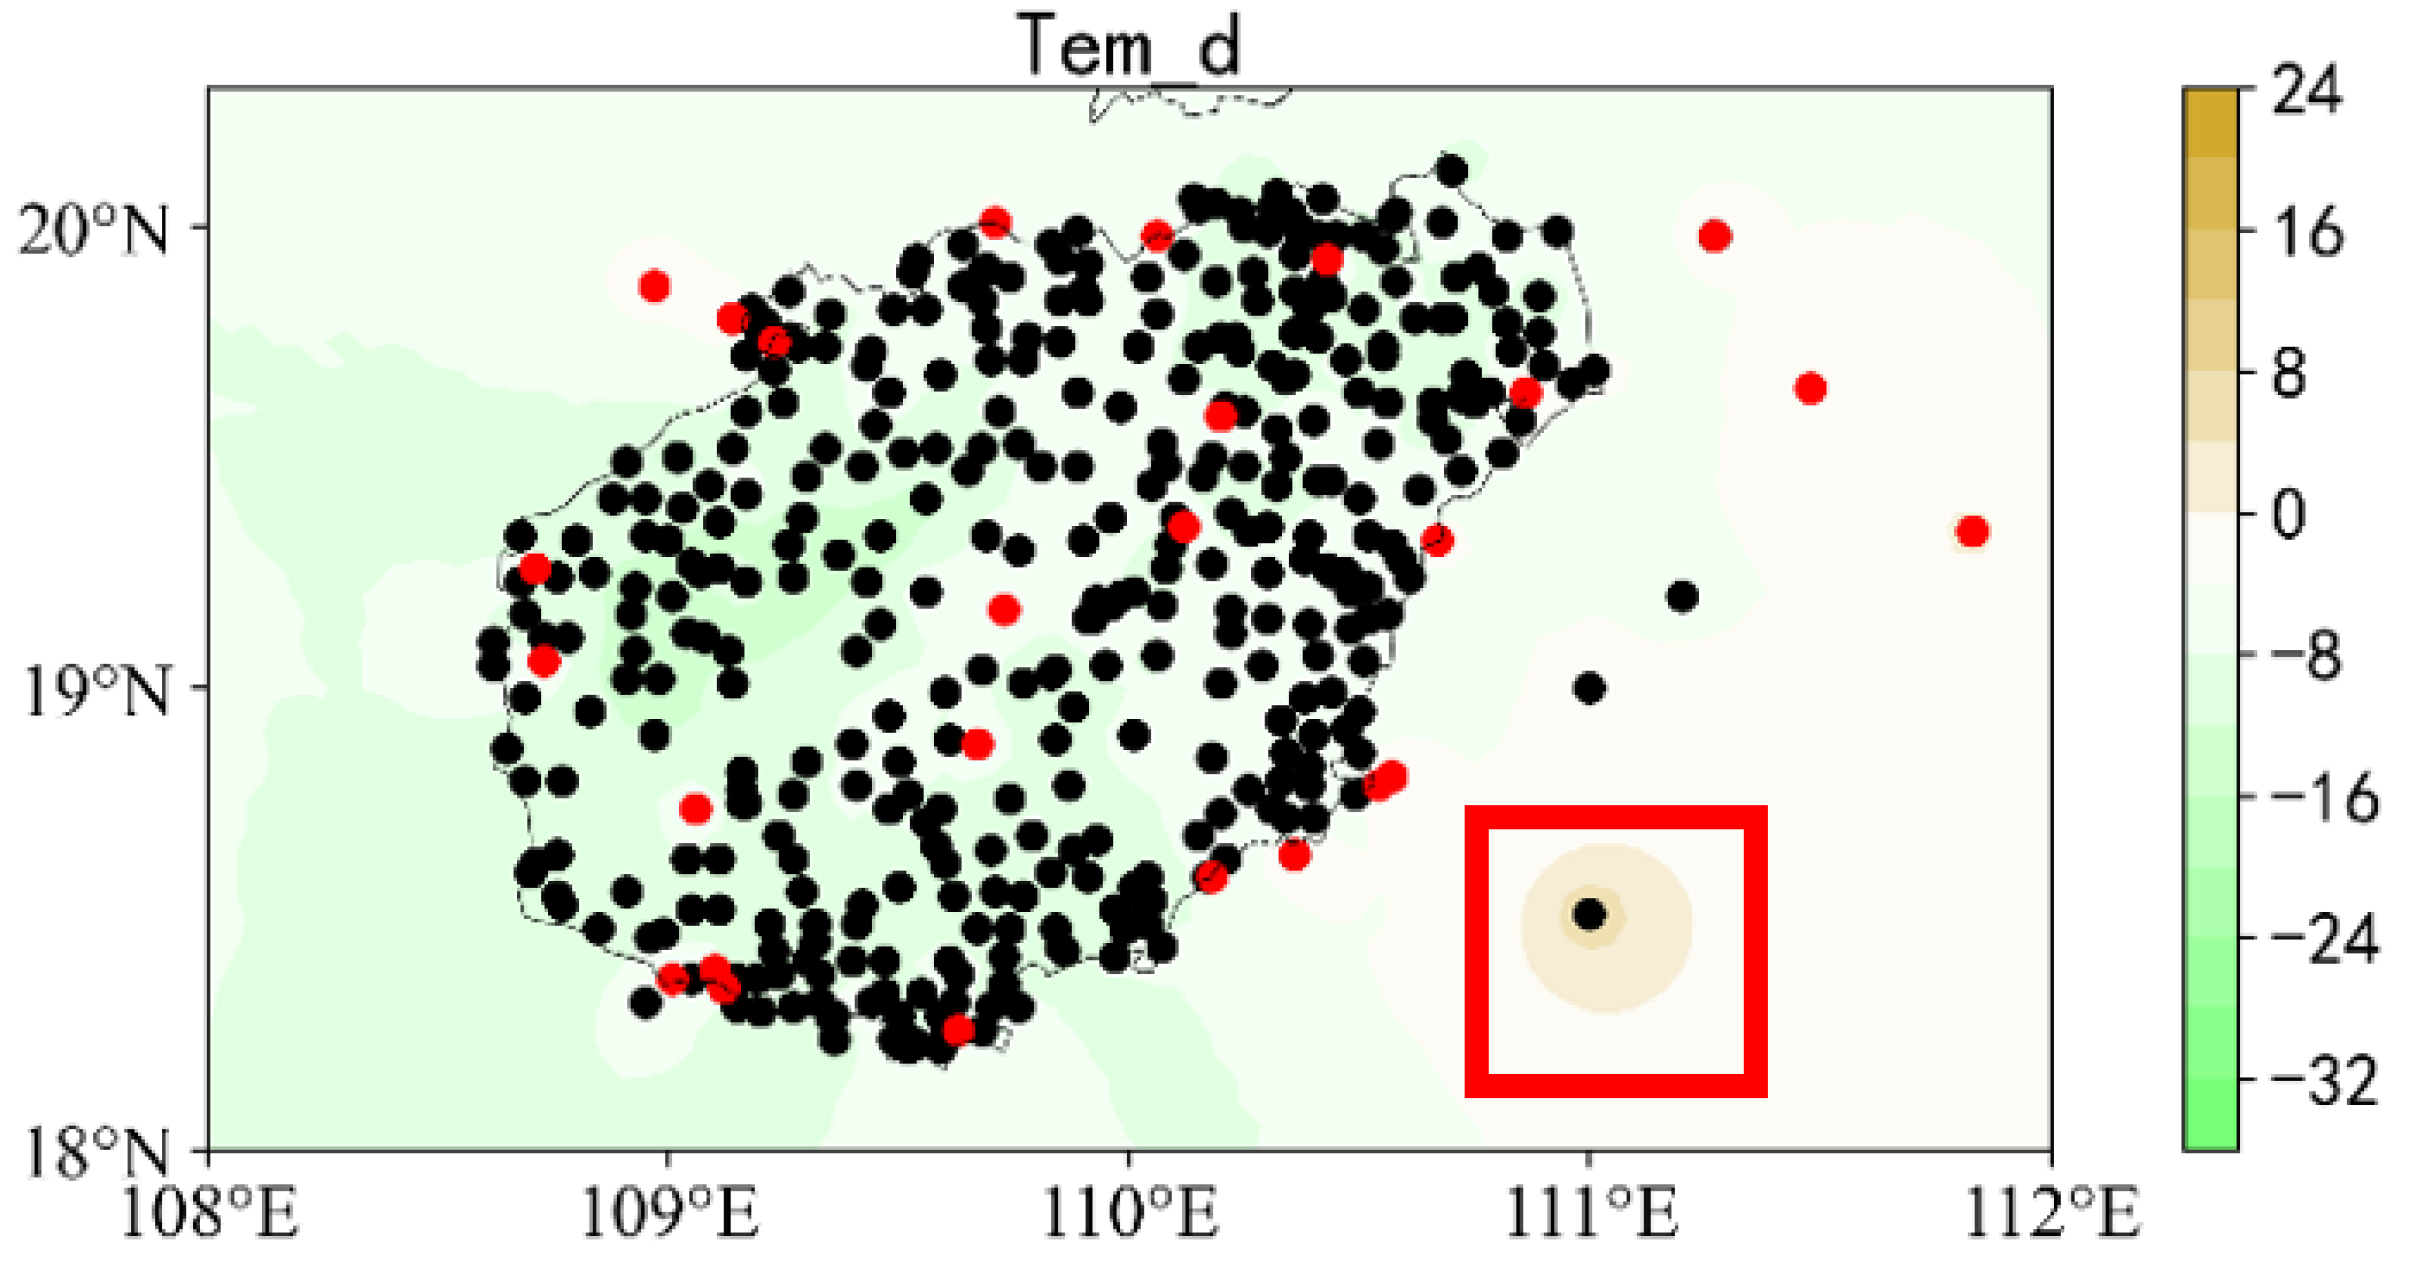
The AWSs whose correlations between temperature and precipitation failed the significance test were much more unexpected, and we believe the large diurnal variation in temperature may be the reason. We next estimated the temperature difference (Tem_d) variable without accounting for diurnal variation by using the difference approach (Equation (3)). Most of the AWSs passed the significance checks, and the correlation coefficients between temperature difference and hourly precipitation were mostly negative (
Figure 2). The annual average correlation coefficient was found to be −0.078 (91.9% of the stations passed the significance test with 95% reliability). As a result, Tem_d was selected as the reference weather component, rather than Tem.
Based on the above, we chose atmospheric pressure, relative humidity, temperature difference, artificial horizontal visibility, and extreme wind speed as reference weather components for hourly precipitation.
2.2. Analysis of AWS Examples
2.2.1. AWSs That Did Not Pass the Significance Test
We examined several stations that failed the significance tests and discovered that these could be categorized into four primary groups. Categorization allowed us to evaluate further the relationship between each weather component and hourly precipitation. Firstly, there were oil platform stations whose quality could not be assured because they were not connected to the MDOS, and were not regulated by the system. Secondly, there were island, port, ship, and wharf stations, all of which were susceptible to harm from high temperatures, high humidity levels, and high salt levels. They are, therefore, of poor quality as a result of damage and neglect brought on by their isolated locations. Thirdly, there were stations with limited observation time series due to instrument failure or withdrawal of a weather component; and fourthly, there were buoy- and vehicle-mounted mobile stations, which are not connected to the MDOS, and are not fixed in location.
Furthermore, more than half of the stations (outside of the first four categories) that failed the significance test for temperature differences were those that were located nearby water bodies, whose moderating effect on temperature may have diminished the magnitude of the temperature response to precipitation processes.
Therefore, the integrated strategy for multicomponent consistency has limited effectiveness for the stations mentioned above.
2.2.2. Anomalous Stations That Passed the Significance Test
One offshore station, No. 59964 (buoy off the town of Dong’ao, Wanning), had an opposite correlation between extreme wind speed, relative humidity, minimum hourly visibility, and hourly precipitation, compared to the other stations; however, it also passed the significance tests (in the red box of
Figure 1). Upon review, it was discovered that this station’s data had major flaws, with just three to five months’ worth of weather components information that was accessible.
2.3. Monthly Correlation Coefficients and Significance Tests
Based on the strongest relationships, five weather components were chosen as “surrogates” for precipitation in
Section 2.1. The percentage of stations with monthly average correlation coefficients and significance tests between the weather components and hourly precipitation was calculated, in order to investigate further the indicative nature of the weather components for precipitation (
Figure 3 and
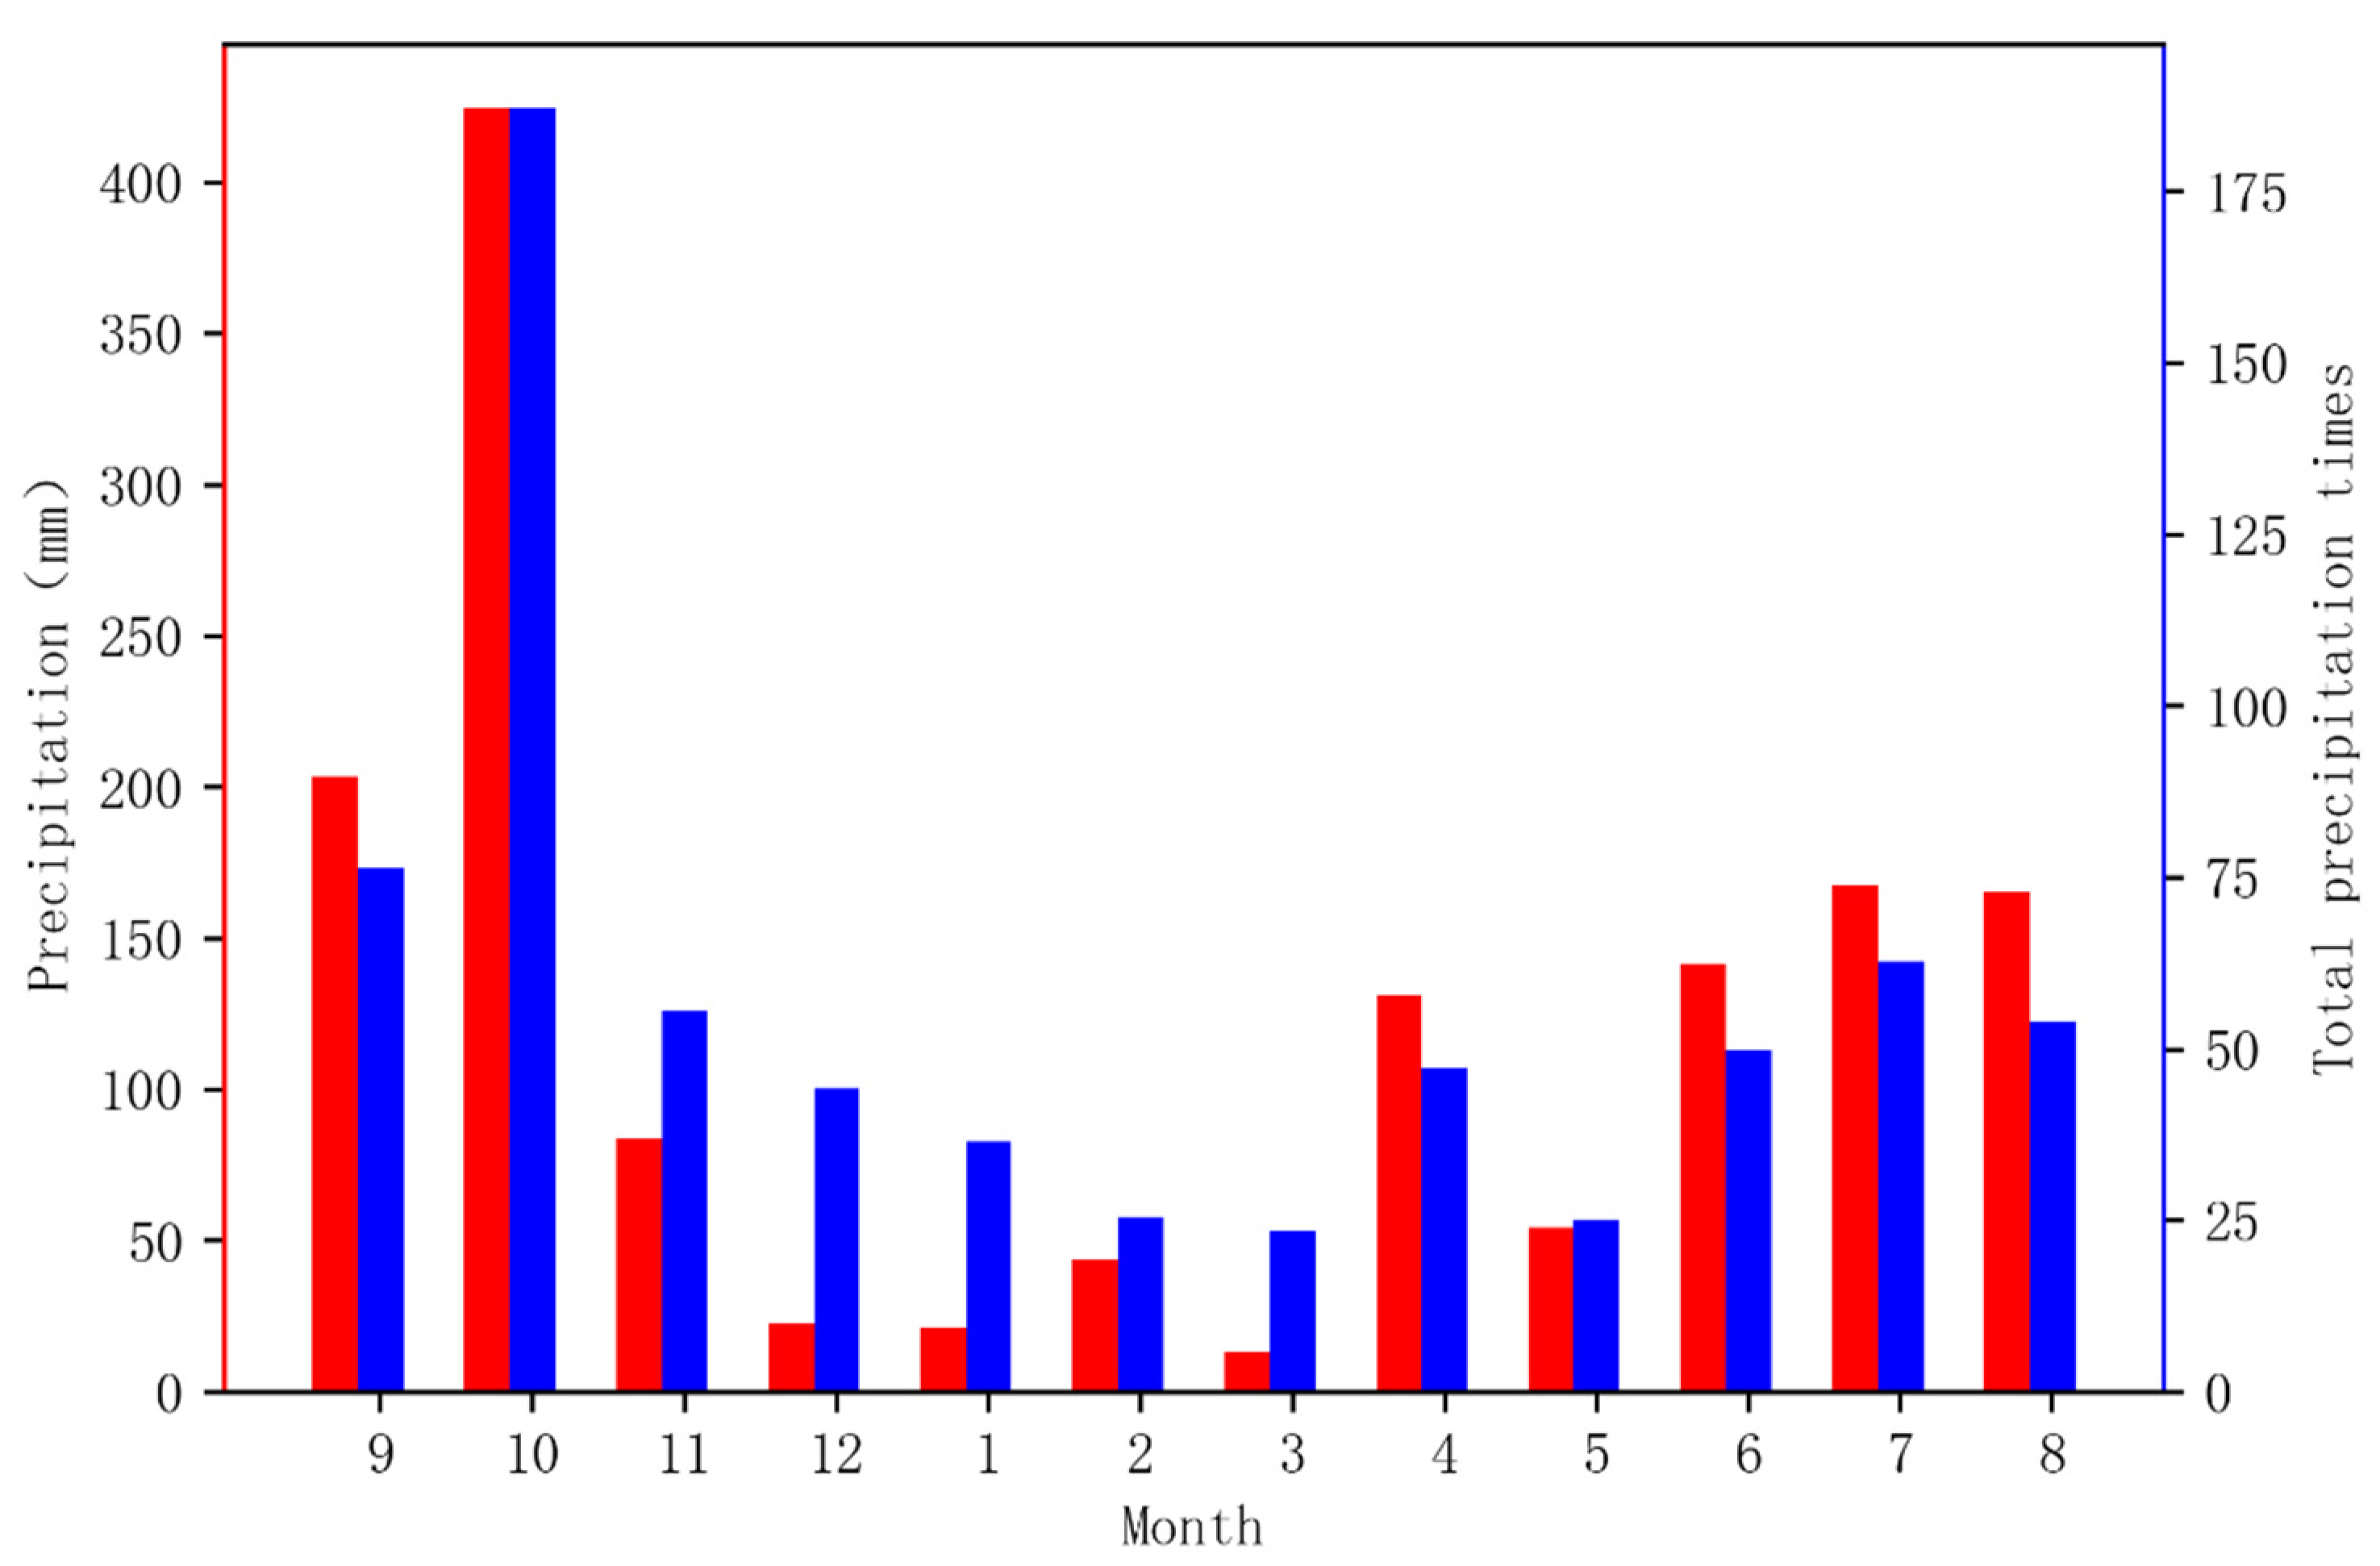
Figure 4). Overall, from June to November, there were better relationships and significance between weather components and precipitation (i.e., summer and autumn). The heavy precipitation between June and November could be the cause of this (
Figure 5).
Additionally, 2-minute-averaged wind speed, extreme wind speed, and maximum hourly wind speed correlations were better in February. Why is February the month with the best wind–precipitation correlation? The precipitation from April to May is obviously more than that in February, but the winter precipitation in Hainan is primarily frontal precipitation, and because of the large pressure gradient force and the pressure difference between the two sides of the frontal surface, the windy weather is closely related to the frontal precipitation process. However, in spring, the strong convective precipitation where cold and warm air meet, and the local heavy precipitation that is controlled by warm and humid air, have strong vertical movements and weak horizontal movements (i.e., horizontal wind) in the atmosphere.
The overall correlation performance of the 2-minute-averaged wind was not as good as that of the extreme wind and the maximum hourly wind, because the precipitation process often occurred in the middle of the hour; thus, the 2-minute-averaged wind before the hour cannot well reflect the response of the wind to the precipitation process. For example, from April to August, the performance of the 2-minute-averaged wind is very different from that of the extreme wind and the maximum hourly wind, probably because of the short-term convective precipitation in Hainan Province during this period. The 2-minute-averaged wind cannot reflect the feedback of the wind to the hourly precipitation. However, from September to March, most of the precipitation that occurs in Hainan Province is stratiform-cloud precipitation, which lasts for several hours; thus, the 2-minute-averaged wind on the hour can reflect the feedback of the wind to the precipitation process to a certain extent, making the difference between the 2-minute-averaged wind and the extreme wind and the maximum hourly wind not too large.
According to
Figure 3 and
Figure 4, the overall performance of the correlation coefficient for air pressure is weaker than that of other weather components. Only from September to November does the correlation coefficient continue to be negative, and the proportion that passes the significance test exceeds 50%. Why is the correlation coefficient poor when there is a lot of precipitation from April to August? We think the reason for this is because the air pressure is a weather component with a strong diurnal variation. Within a day’s time, the air pressure begins to drop at 00:00 local time and reaches its lowest point between 05:00 and 06:00 local time. As the sun rises, the air pressure begins to rise, reaching a high point between 11:00 and 12:00 local time; then, it begins to drop, and reaches a low point between 16:00 and 17:00 local time, before it begins to rise again. However, a lot of precipitation from April to August is hot convective precipitation, which usually occurs between 12:00 and 17:00 in the afternoon. The decrease in air pressure caused by the precipitation process is just consistent with the diurnal variation in air pressure, thus it is impossible to distinguish the feedback effect of air pressure from diurnal variation. Therefore, although the precipitation from April to August is very large and there are many hours of precipitation, the correlation between air pressure and precipitation is not significant from April to August.
2.4. Introduction of Gridded Fusion Products
We introduced gridded fusion products from the National Meteorological Information Center to replace the reference weather components that many regional-level AWSs were missing. These comprised the cloud cover products of the 3DCloudA system, the visibility product of the China Meteorological Administration (CMA) Land Data Analysis System (CLDAS), and specific humidity and temperature products of the High-Resolution CMA Land Data Analysis System (HRCLDAS). When an AWS includes barometric observations, we employ pressure as a reference weather component, as gridded fusion products lack barometric pressure.
Due to the poor correlations between 2-minute-averaged wind and hourly precipitation, the HRCLDAS wind product with 2-minute-averaged wind data was not introduced. Furthermore, hourly extreme wind speeds were used as a reference weather component only when wind observations were available at the station.
The following is a brief overview of the gridded fusion products introduced.
2.4.1. CLDAS Visibility Product
The CLDAS visibility product incorporates manual horizontal visibility from AWS, and is of better quality in the Chinese region than comparable international gridded fusion products; therefore, it can be used as a replacement [
17].
2.4.2. HRCLDAS Specific Humidity Product
HRCLDAS specific humidity (sh) products can be converted to relative humidity (rh) by Equations (4)–(6), using pressure (p) and temperature (T), with 98.5% of HRCLDAS relative humidity differing from station relative humidity by less than 5%; thus, the HRCLDAS humidity product can be used to some extent in place of AWS relative humidity data.
2.4.3. HRCLDAS Temperature Product
HRCLDAS air temperature incorporates hourly air temperatures from AWSs, and with 97.6% of HRCLDAS air temperatures differing from AWS air temperatures by less than 1 °C, the HRCLDAS product is of high quality [
18].
2.4.4. 3DCloudA Cloud Cover Product
3DCloudA is a 0.05° × 0.05°, hour-by-hour, vertical 43-layer isobaric cloud cover gridded fusion product obtained by fusing numerical forecast products, geostationary meteorological satellite imager primary data, cloud-detection products, and radar-based data. Its overall quality is close to the leading international standard.
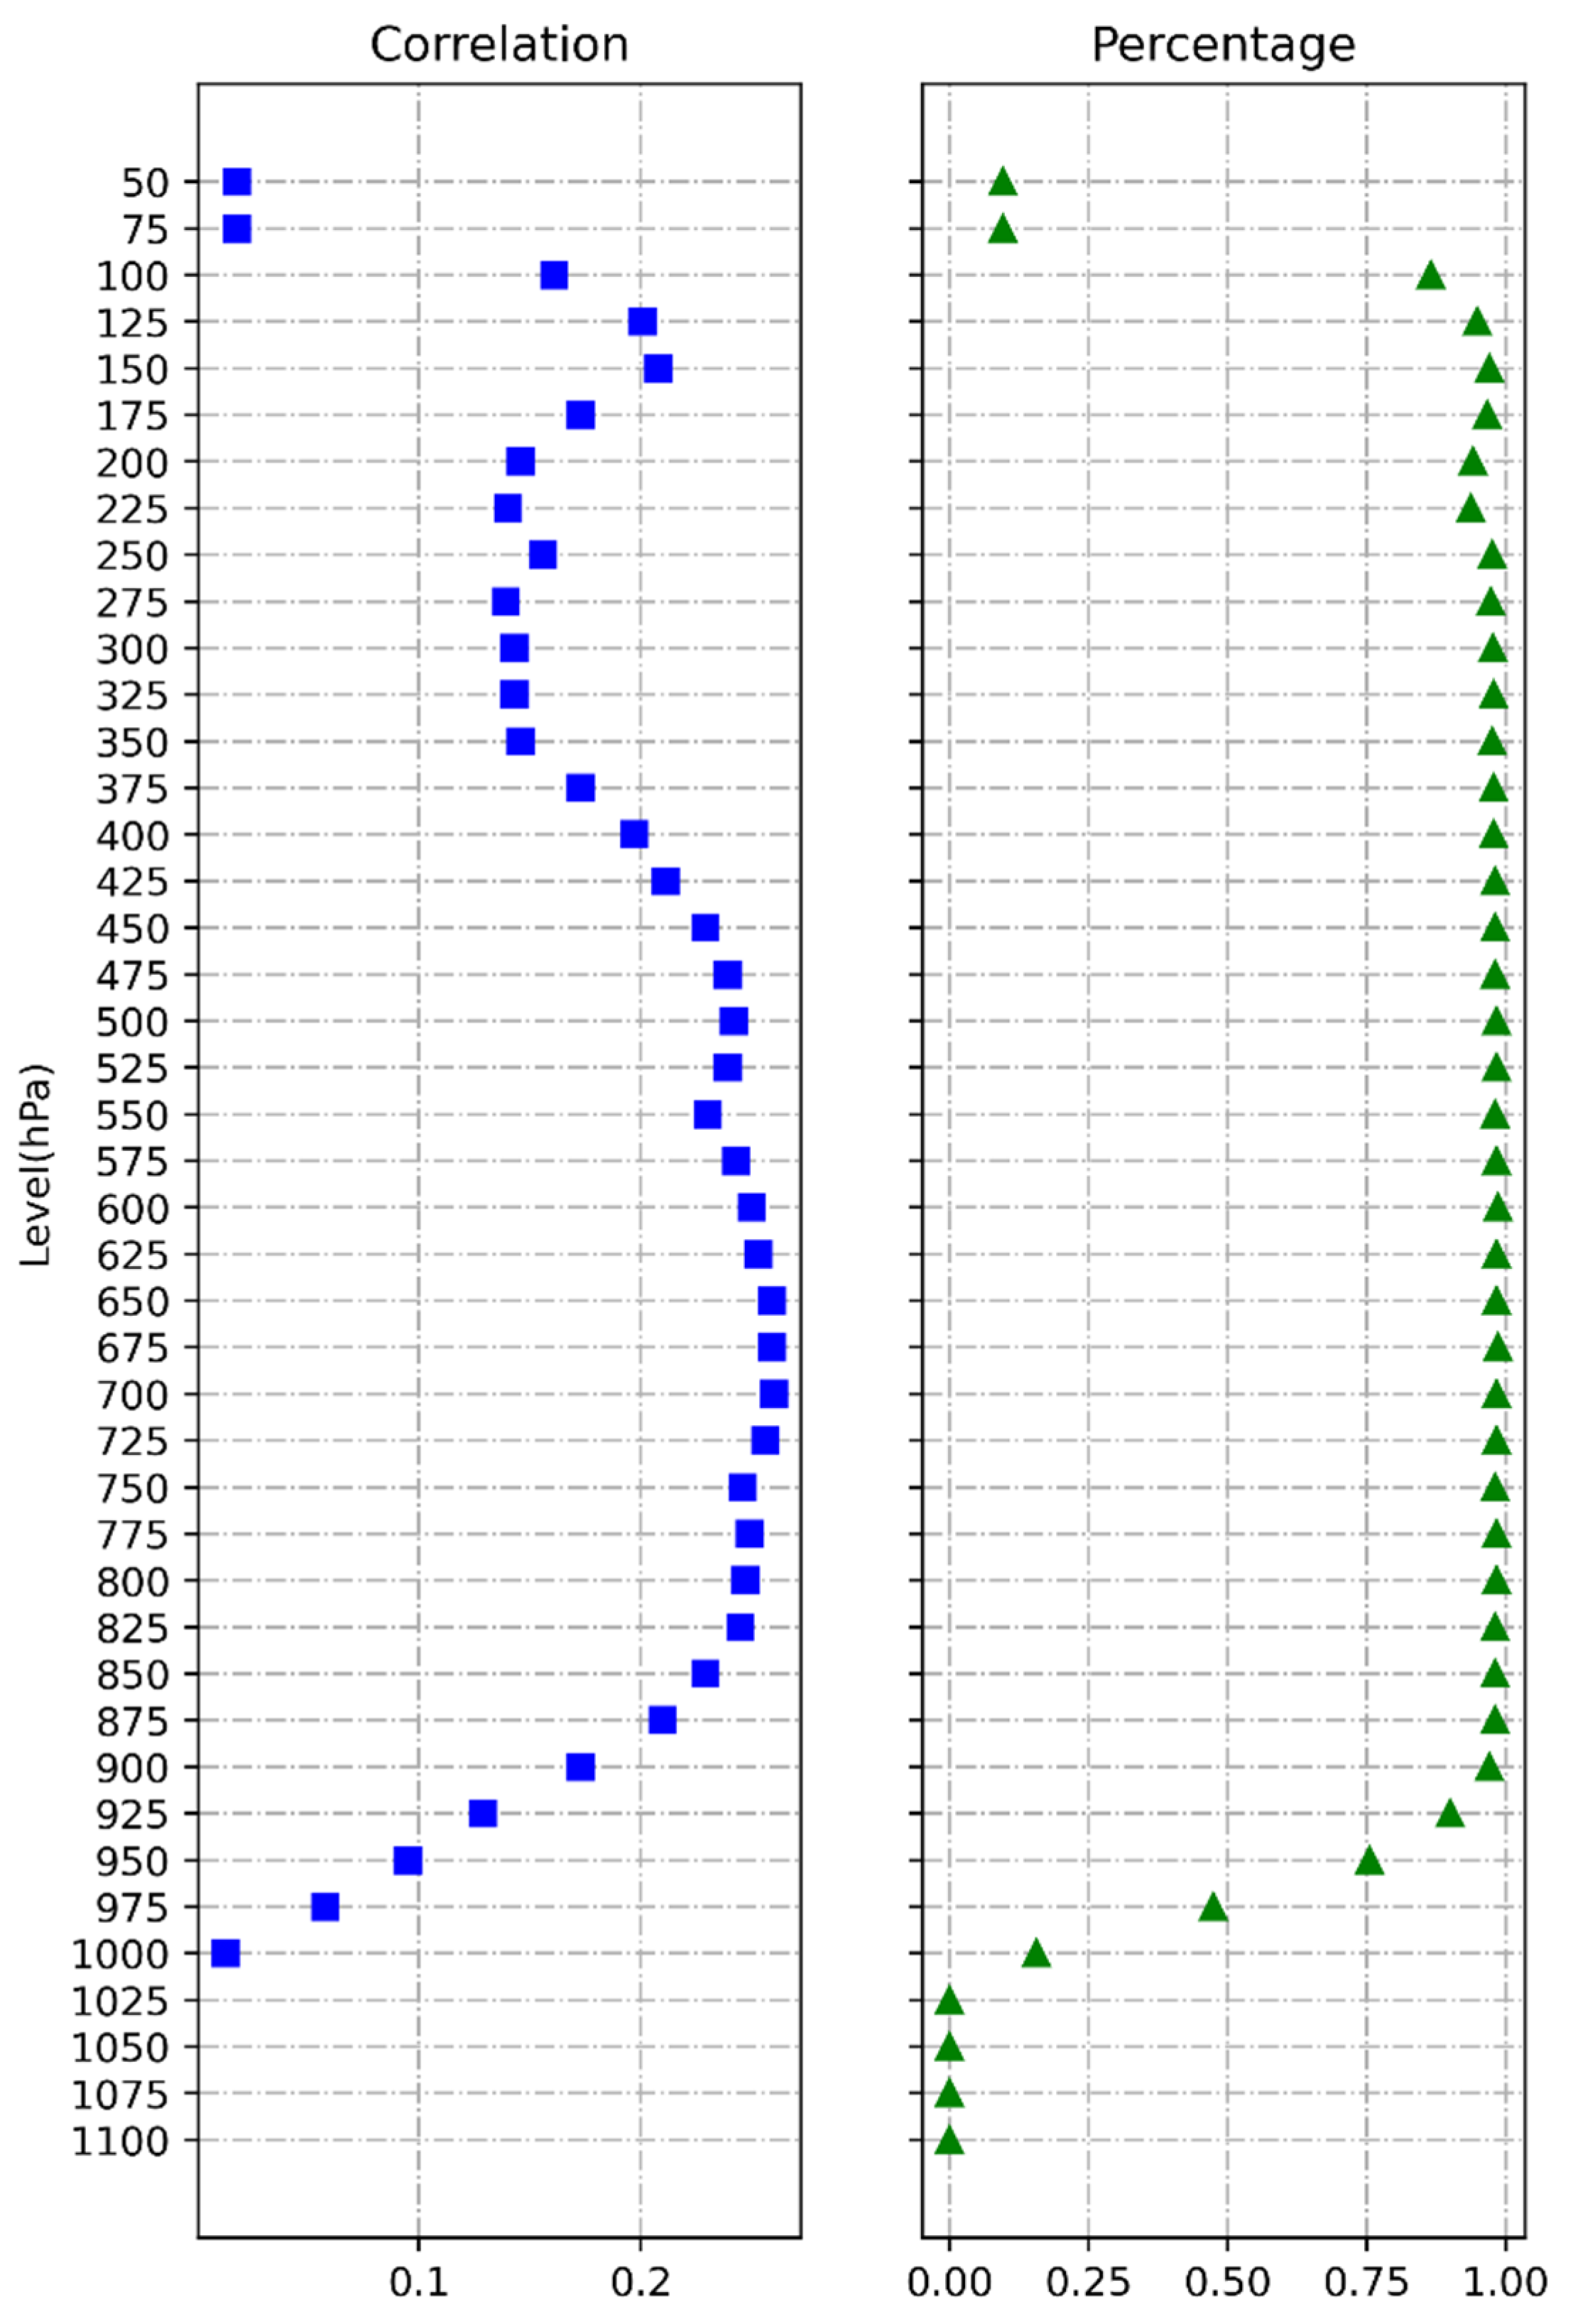
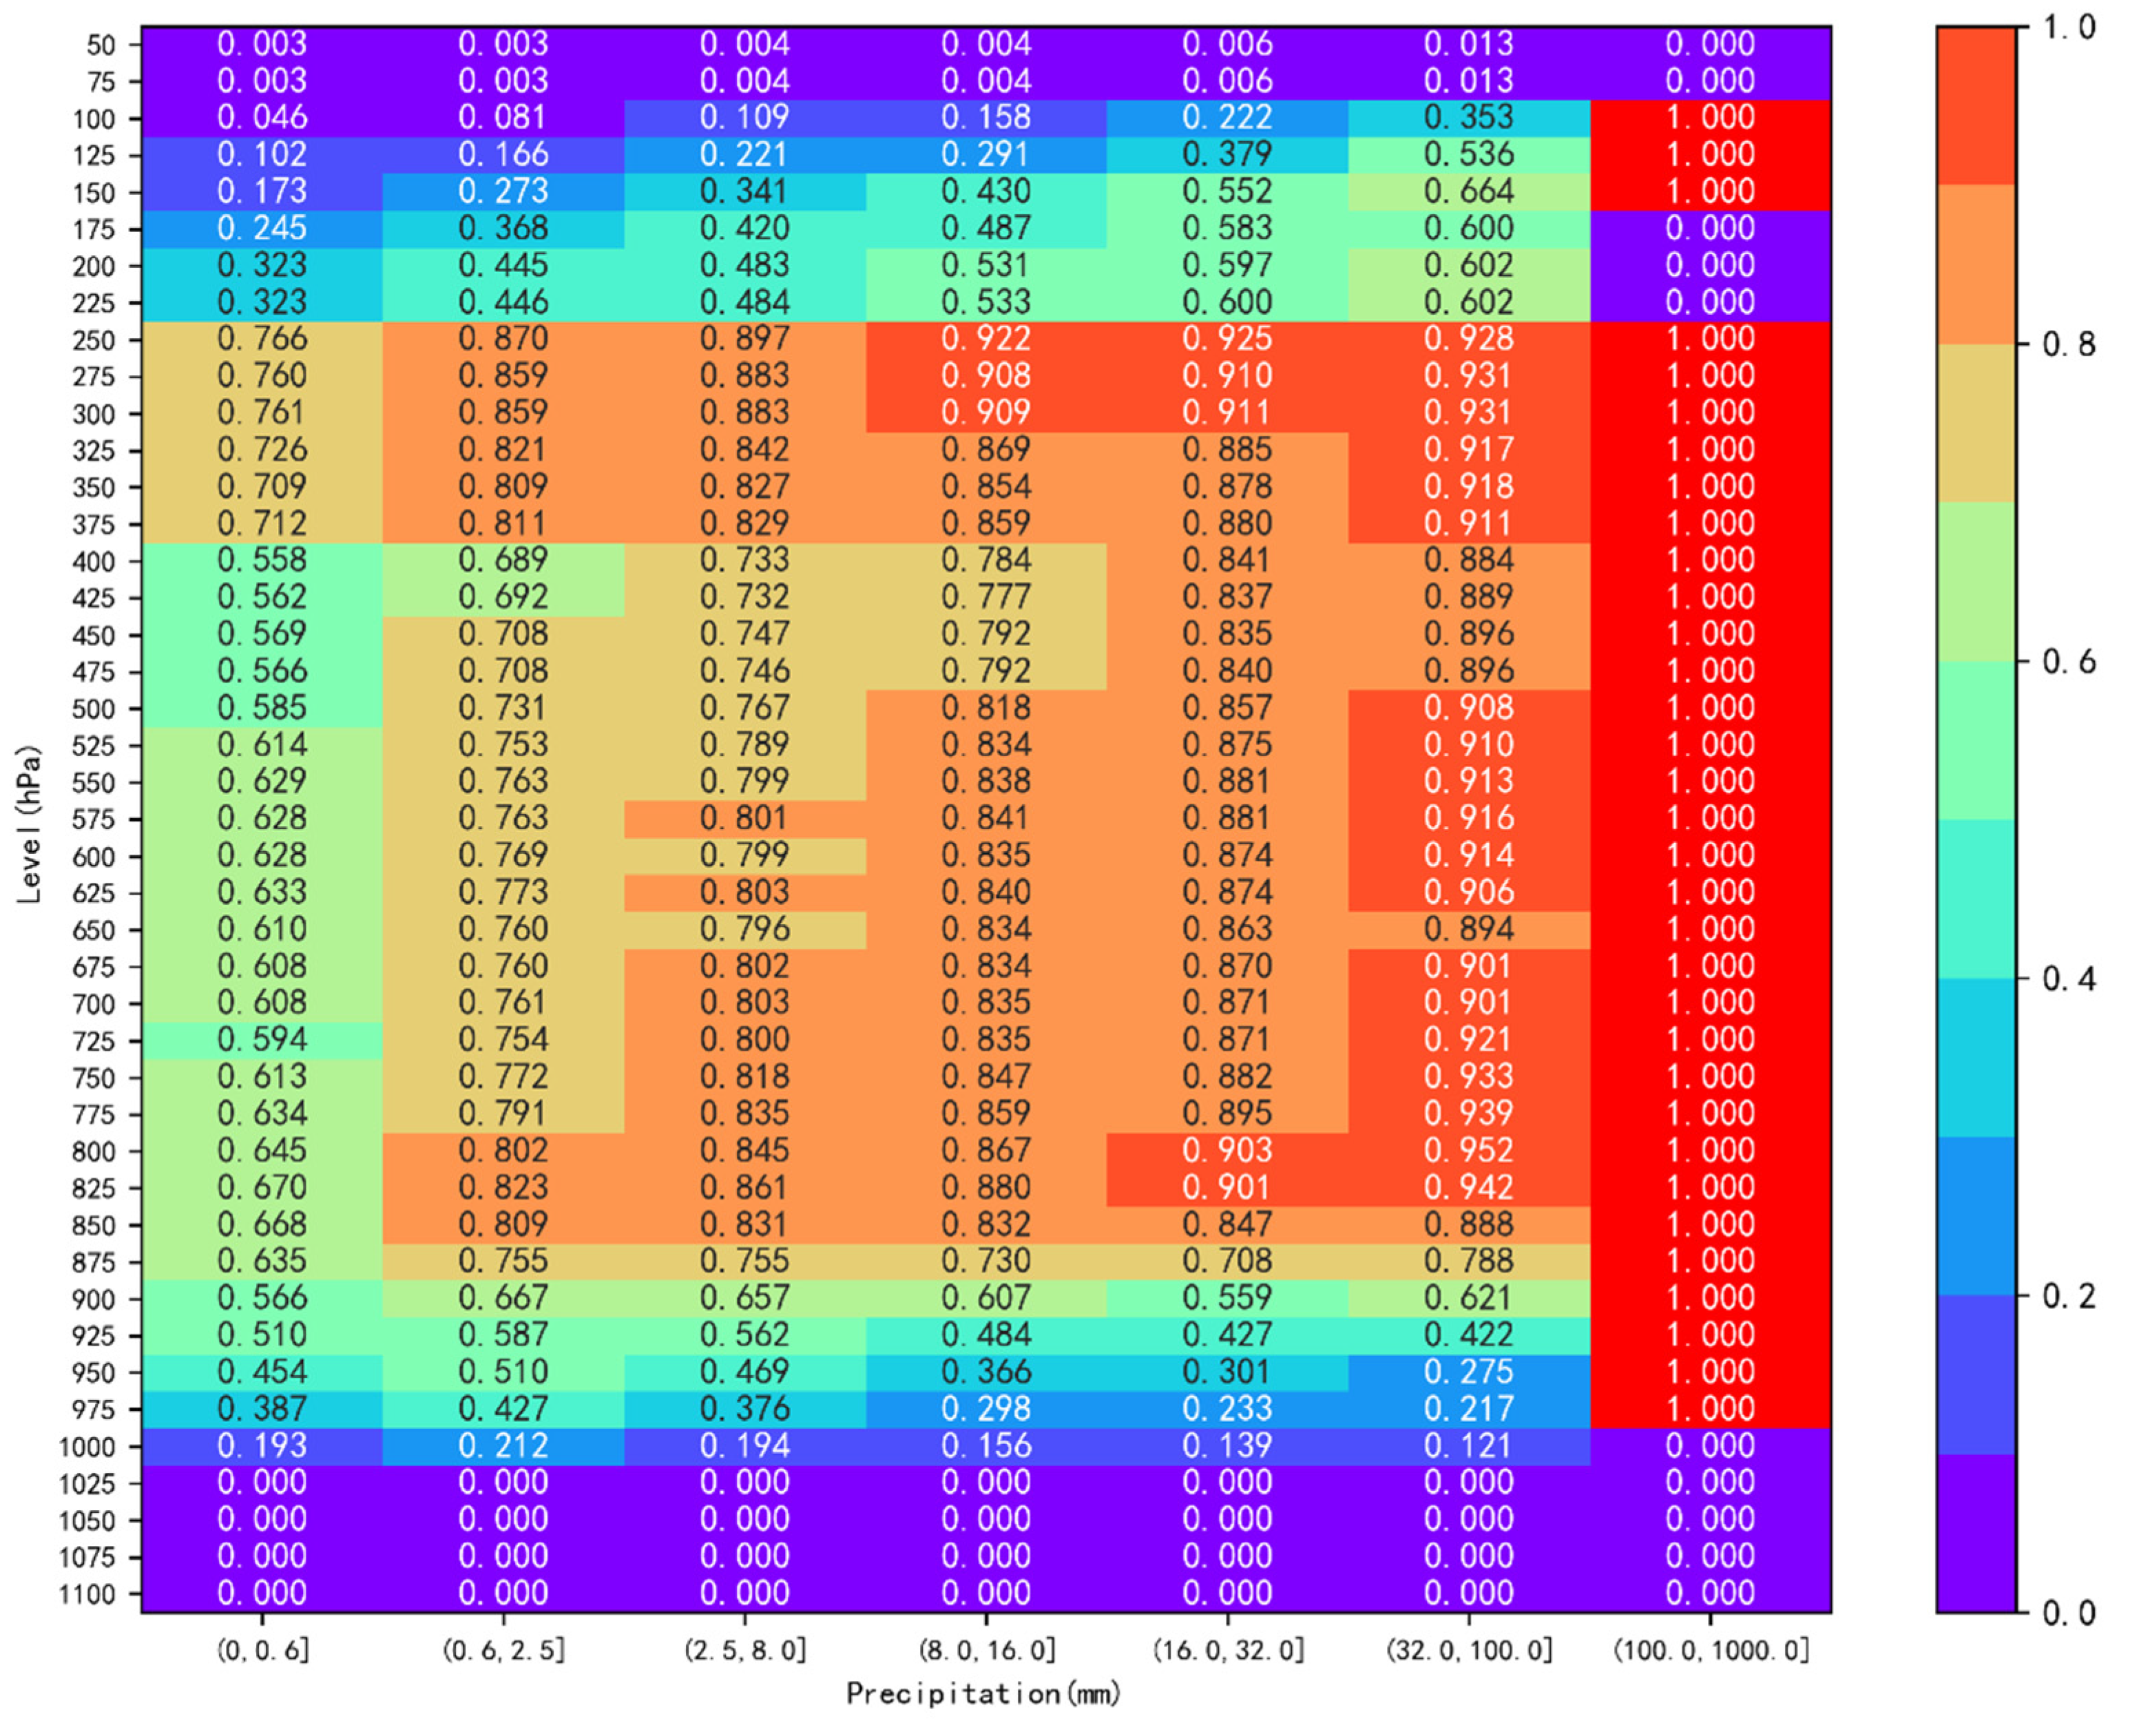
The correlation coefficients and significance tests between precipitation and 43 layers of cloud cover for all AWSs in Hainan Province, from June to August 2021, are shown in
Figure 6. All levels were positively correlated with surface precipitation, and the correlation coefficients and proportions passing the significance tests were superior when levels were between 125 hPa and 875 hPa. Therefore, we chose the sum of cloud covers between 125 hPa and 875 hPa as the reference weather component.
Figure 7 provides an additional analysis of the percentages of cloud coverage stations that match surface precipitation at each level during the sub-precipitation time frame. The (0, 32] interval’s precipitation corresponds to two high cloudiness values in the ranges of 375–200 hPa and 875–800 hPa, indicating that precipitation in this interval is a combination of low-cloud and high-cloud precipitation. The absence of a strong bimodal pattern in the percentage of cloud cover corresponding to precipitation above 32 mm, on the other hand, may suggest that the precipitation in this area is the result of the development of deep, low- to high-level cumulus precipitation.
2.5. Scoring Methodology
Due to the variable number of reference weather components, it was not possible to use the parametric method or machine learning method; thus, we proposed a scoring method for qualitative quality control of precipitation at AWSs.
A score of 1 is given if a weather component exhibits the corresponding characteristics of the precipitation process at the time of suspected precipitation, and 0 points for exhibiting opposing characteristics (0.5 points were given for exhibiting characteristics relative to the previous time, and 0.5 points for exhibiting characteristics close to the later time); a score of 0.5 points was given for not exhibiting the relevant characteristics. Therefore, the higher the score, the more likely the precipitation is correct. Under the circumstances that relative humidity is already at a very high level, and that there is no room for it to rise further, any relative humidity of 95 or higher during a precipitation event is considered to be a characteristic of the precipitation process. The daily behavior from 14:00 to 07:00 local time is generally characterized by falling temperatures and rising relative humidity, which are consistent with the characteristics of precipitation. In order to avoid confusion, only when the temperature (relative humidity) at the precipitation time is an extreme value compared with values at the times before and after, is it considered to be a characteristic of the precipitation process. Temperature, relative humidity, and visibility are available from both station observations and gridded fusion products; thus, to avoid one weather component having too much influence on the scoring, station observations of a reference weather component are allowed to share one point with the gridded fusion product. The calculation of the scoring method is shown in Equation (7).
Set a threshold value, and when the score is greater than or equal to the threshold, confirm the precipitation as being correct; otherwise, it is considered to be an error.
3. Results
One hundred sixty-eight hourly precipitation reports in Hainan Province judged as being suspicious by the MDOS in summer 2021 were used as a test sample, which was quality controlled using the scoring method and then compared with the manual QC results. Then, the scoring method’s effectiveness was assessed by calculating TS scores, and false alarm, miss, hit, and accuracy rates (see
Appendix A for the definitions and equations).
The ideal QC solution is to have the highest possible hit rate and the lowest possible false alarm rate and miss rate. However, if the hit rate is too low, the QC method cannot effectively identify false precipitation. On the other hand, if the false alarm rate is too high, it detects too much false alarm precipitation and requires manual QC to screen it, which would consume human resources. If the miss rate is too high, it misses too much false precipitation for good QC to be effective.
3.1. Analysis of an Individual Case
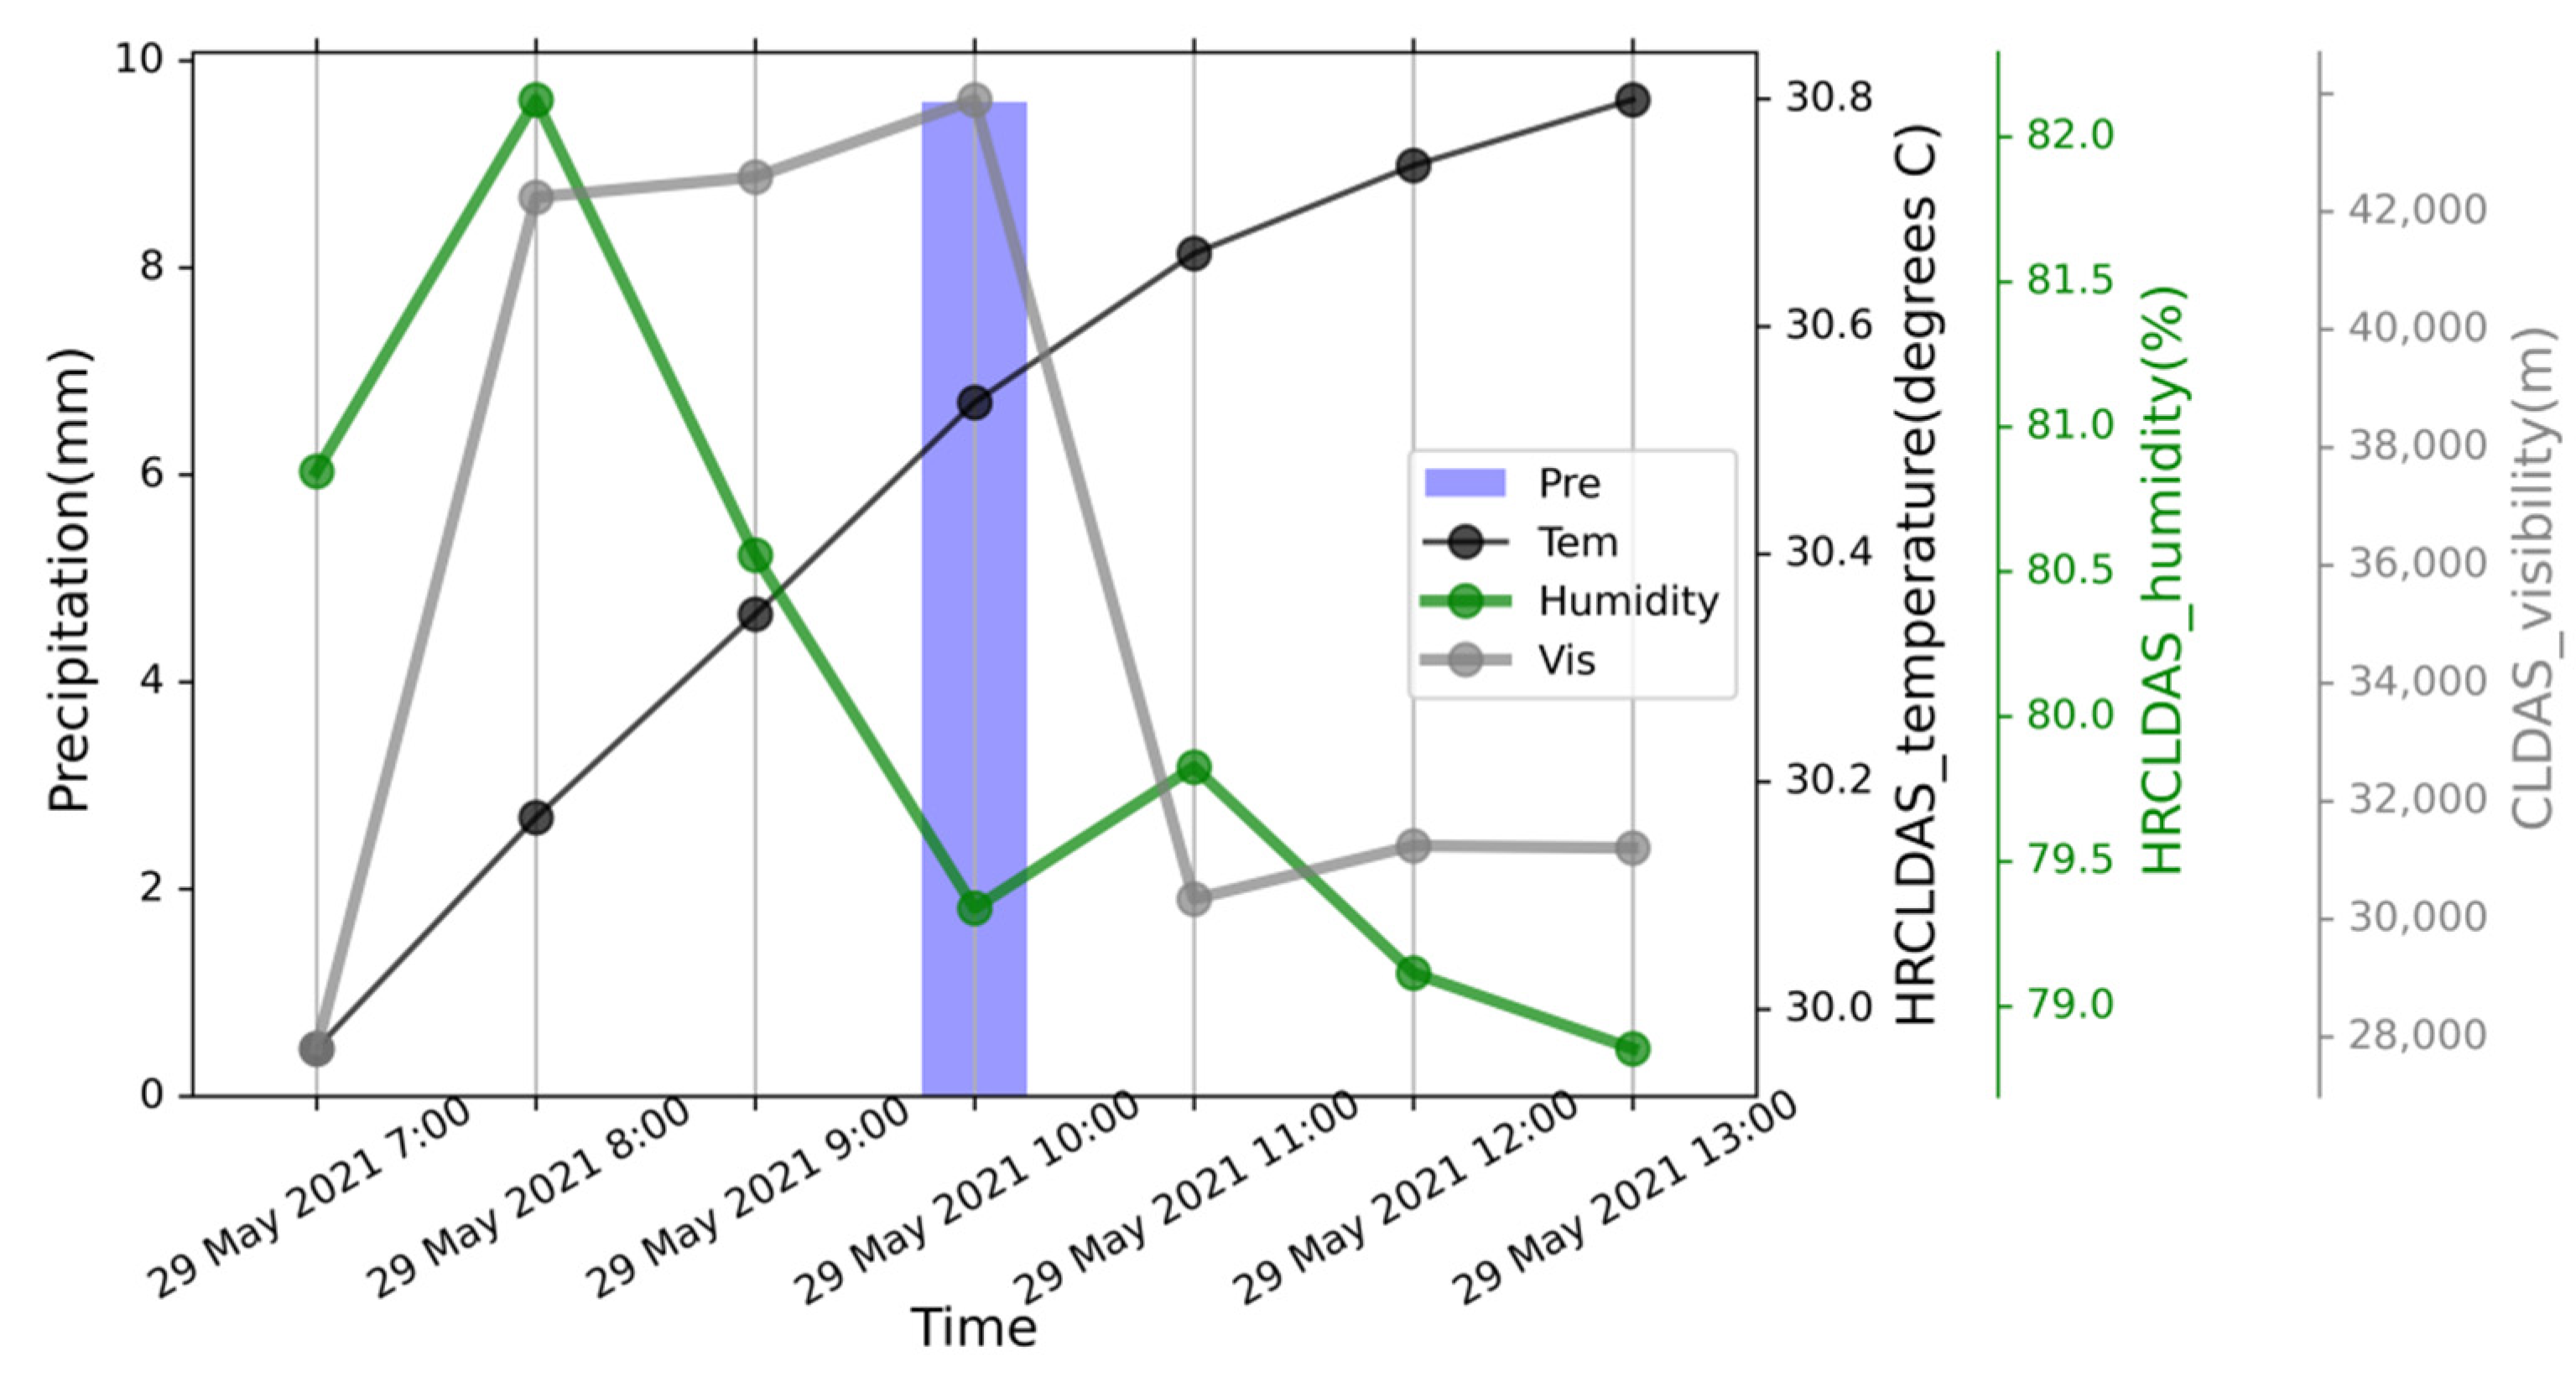
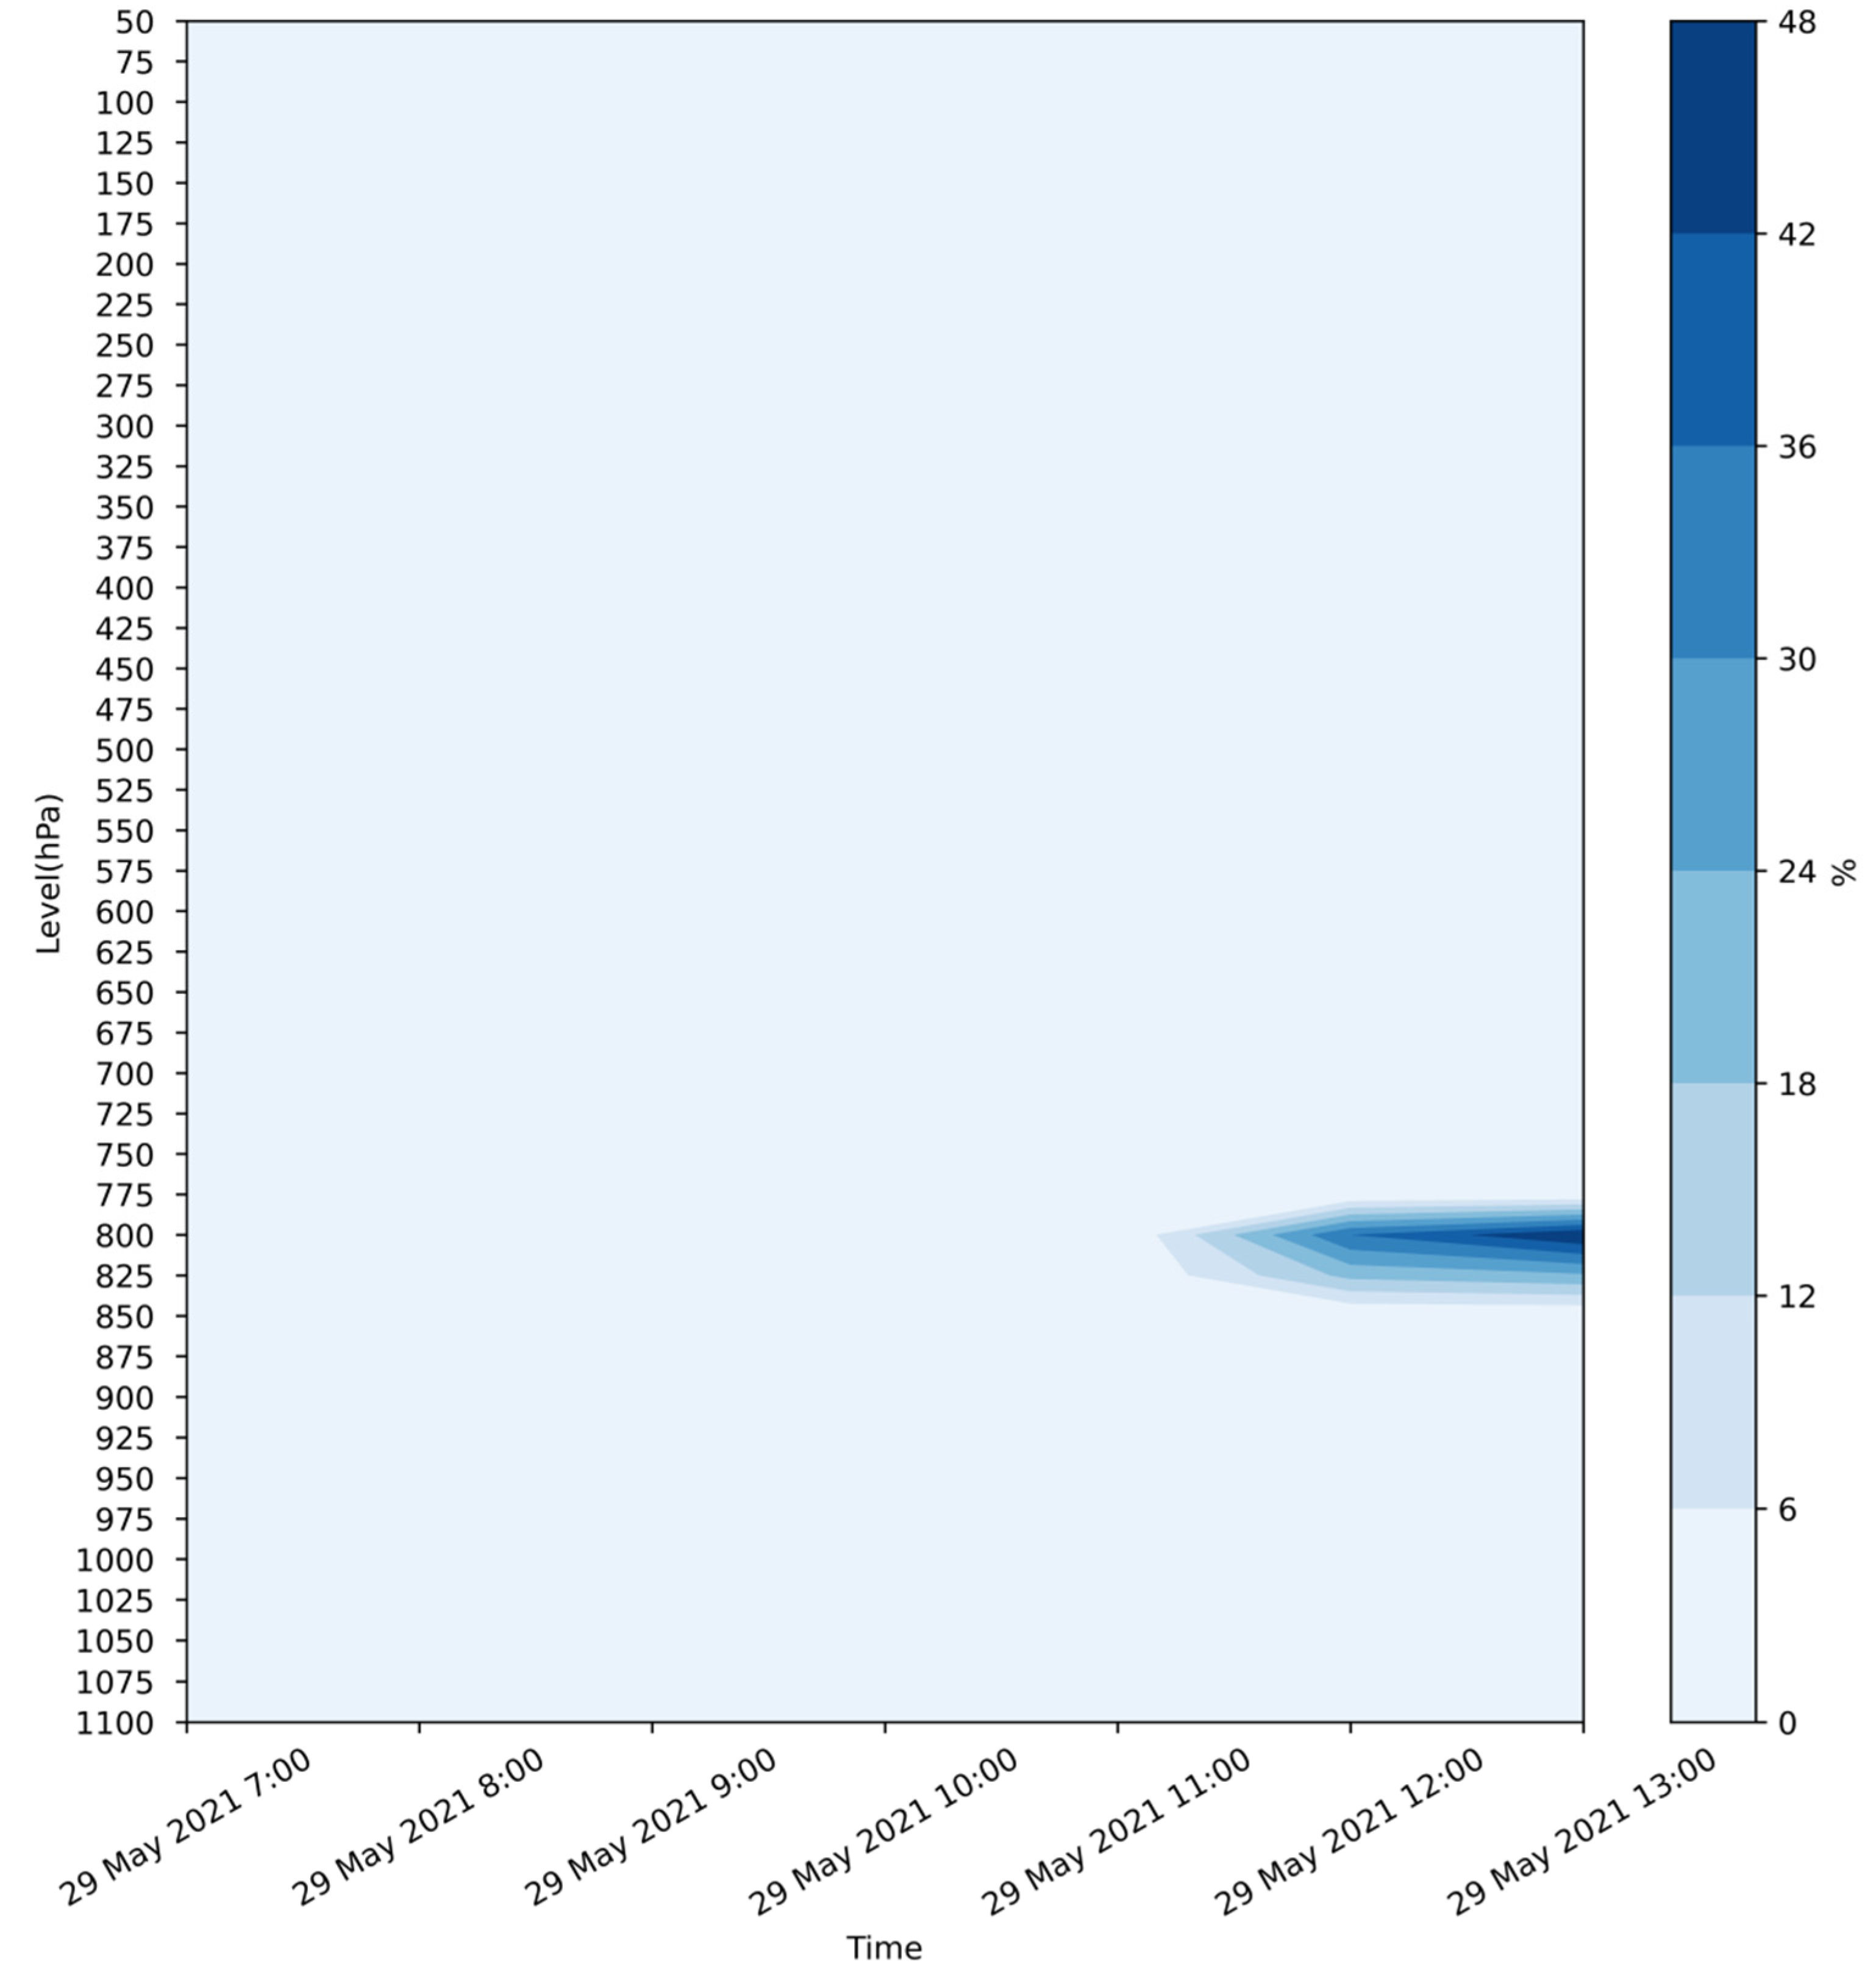
The regional-level AWS M0307 is an AWS where there is only precipitation observation at the station that cannot be quality controlled using the conventional multicomponent synthesis method. Hourly rainfall at the station at 10:00 (Beijing time) on 29 May 2021 was 9.6 mm, and was judged as suspicious by the MDOS. Therefore, we introduced the temperature and relative humidity products of HRCLDAS, the visibility products of CLDAS, and the cloud cover products of 3Dcloud as the reference weather components of the precipitation process. During the precipitation period, the temperature increased, the relative humidity decreased, and visibility increased (
Figure 8). The cloud cover time–barometric profile of the AWS showed no clouds above the station during precipitation times (
Figure 9). Thus, by introducing gridded fusion products, we were able to use the multicomponent synthesis method to conclude that this precipitation was wrong.
Next, we used the scoring method to calculate the precipitation score, and the result was as low as 0.5. The result of the scoring method was to judge the precipitation as an error, a result that was consistent with that of multicomponent synthesis.
3.2. Results of Quality Control
The threshold for the scoring method was determined to be 4.25, and the results of the scoring method were used to calculate TS scores as well as miss, false alarm, and accuracy rates (
Table 2). The accuracy rates in all intervals were above 0.75, with those in intervals (2.5, 8.0] and (8.0, 16.0] being lower than the others. Further analysis revealed that the low accuracy rate is due to the high false alarm rate, so the already determined 4.25 threshold was on the high side for these two intervals.
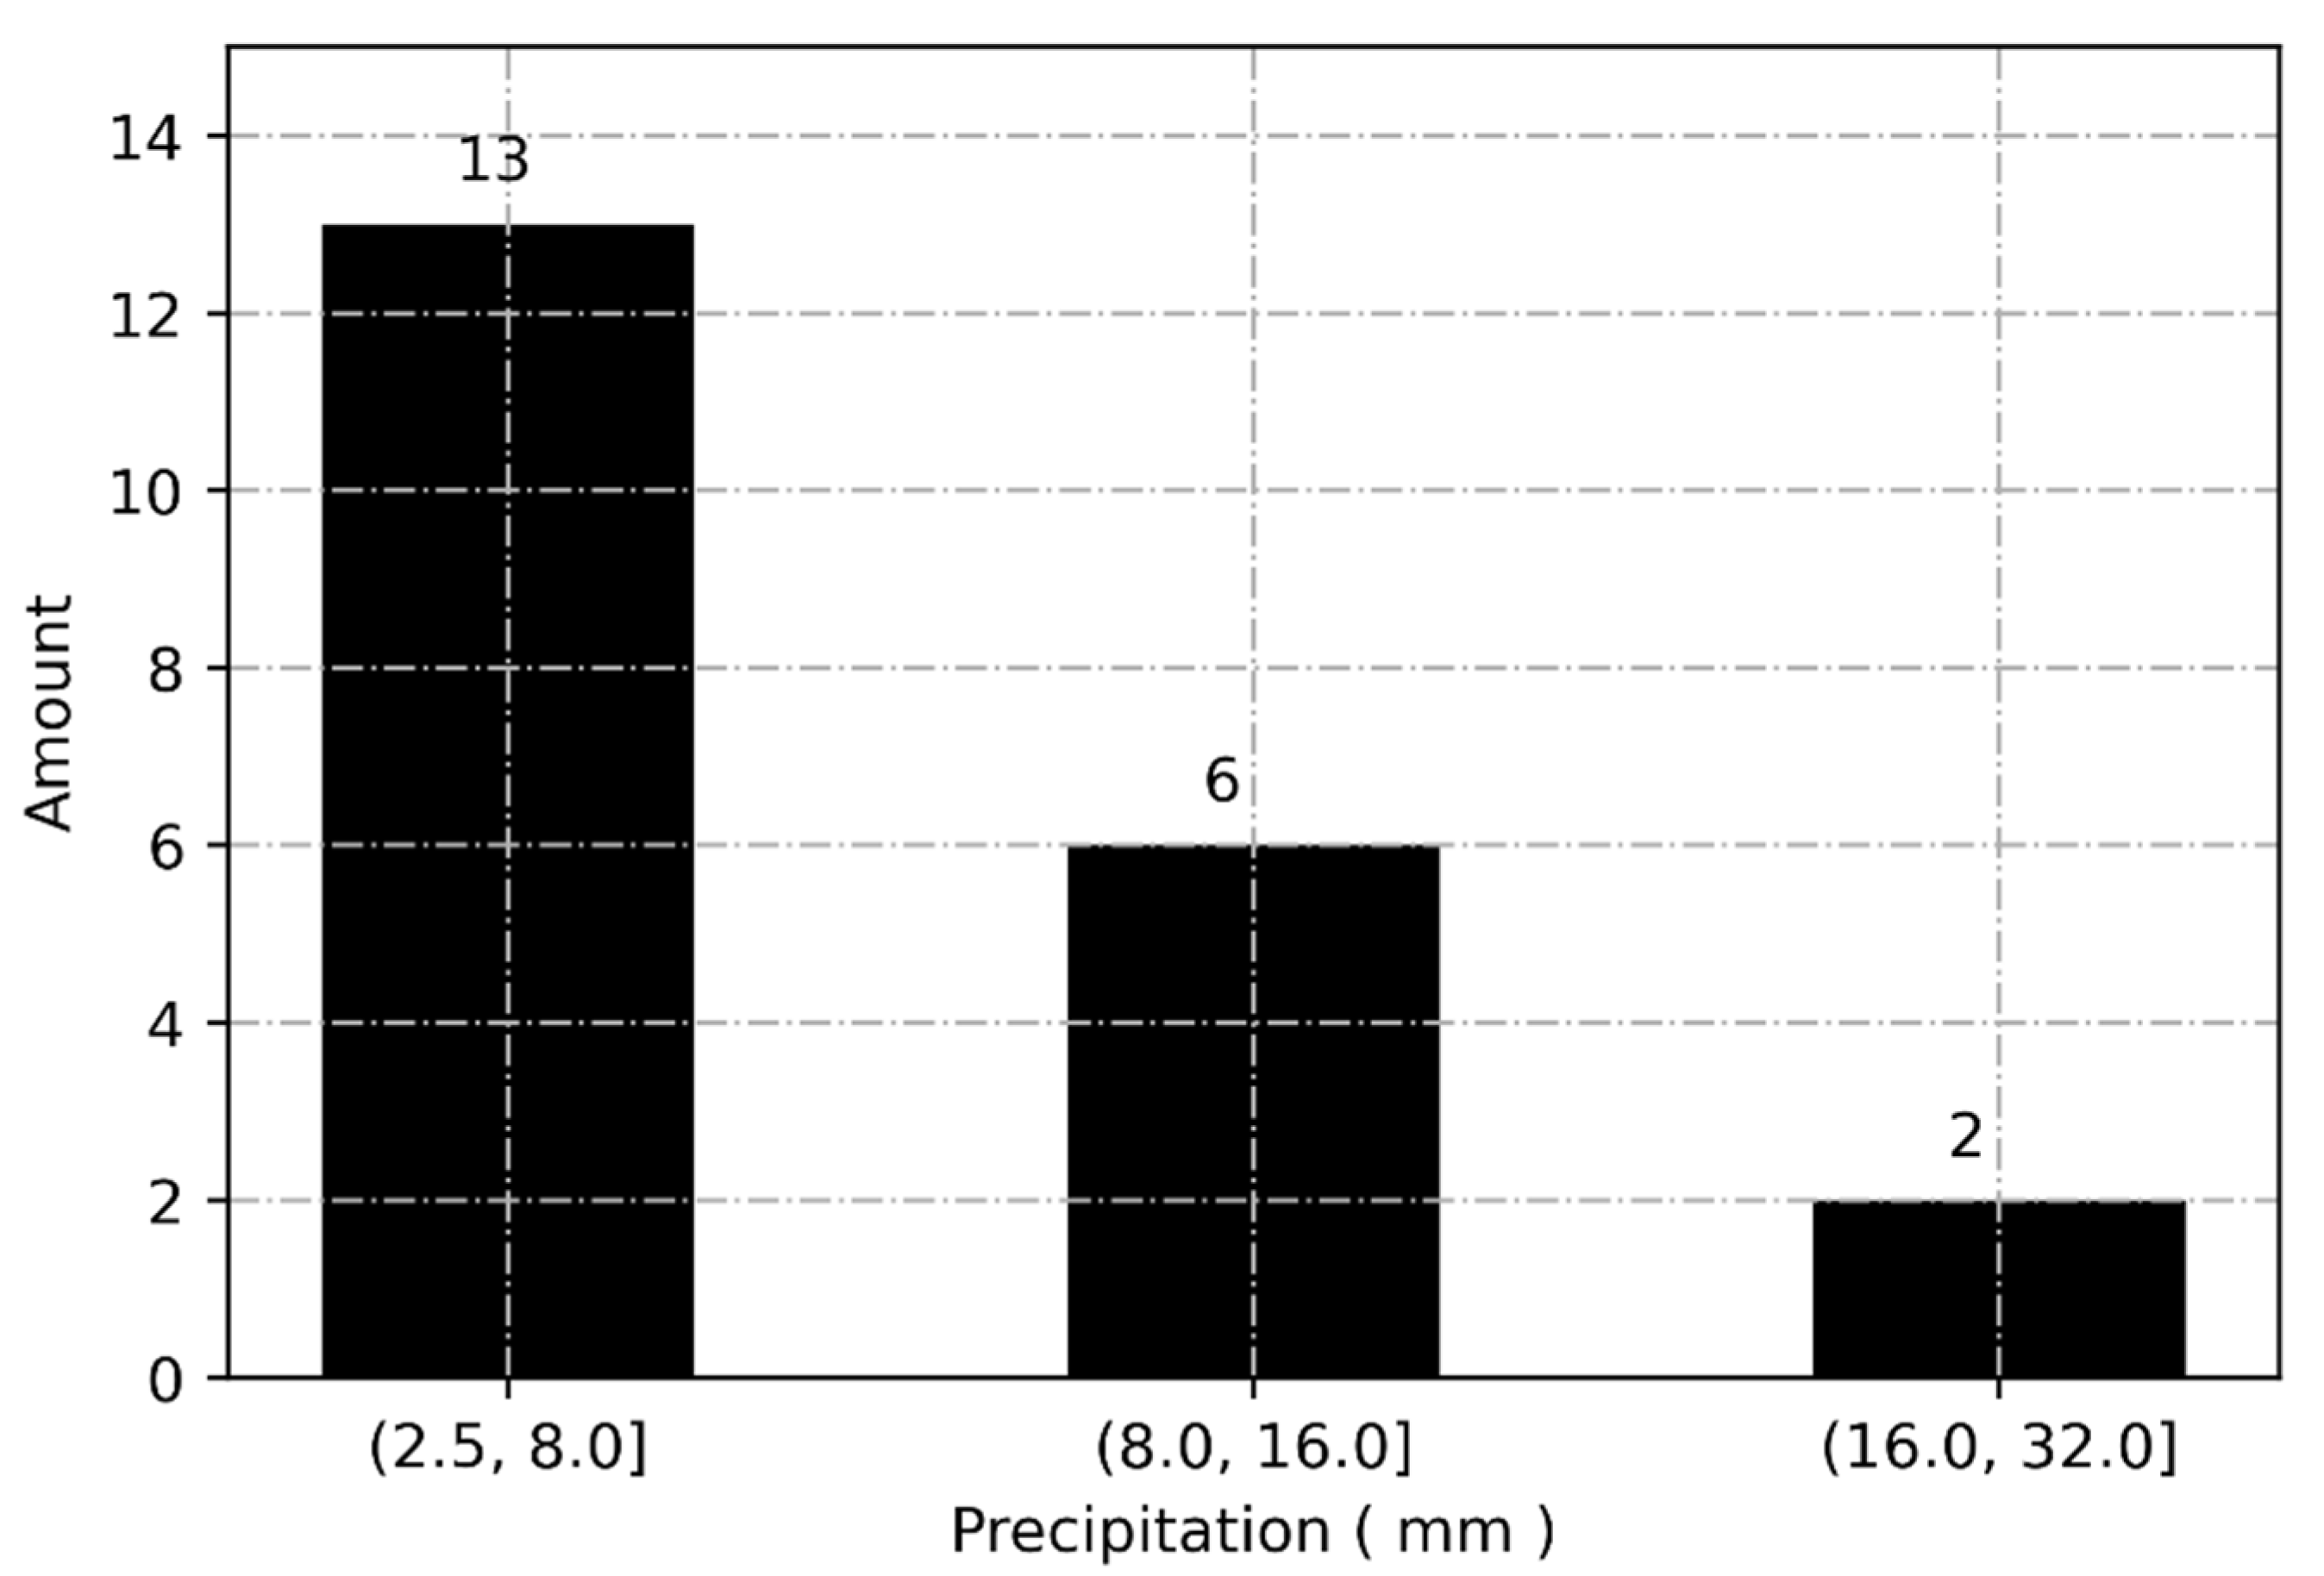
In
Figure 10, there were three missed precipitation reports, one of which was rated high because there was precipitation later; the other precipitation reports were confirmed to be misjudged erroneous precipitations by asking local meteorologists and local residents at the station by telephone.
We analyzed the distribution of false alarm precipitation, and the data are shown in
Figure 11. The false alarm precipitation reports were all above 2.5 mm, which may indicate that the scoring method is very effective for precipitation below 2.5 mm; however, there was another reason that most suspicious precipitation reports below 2.5 mm were wrong precipitation reports, and not false alarms (see
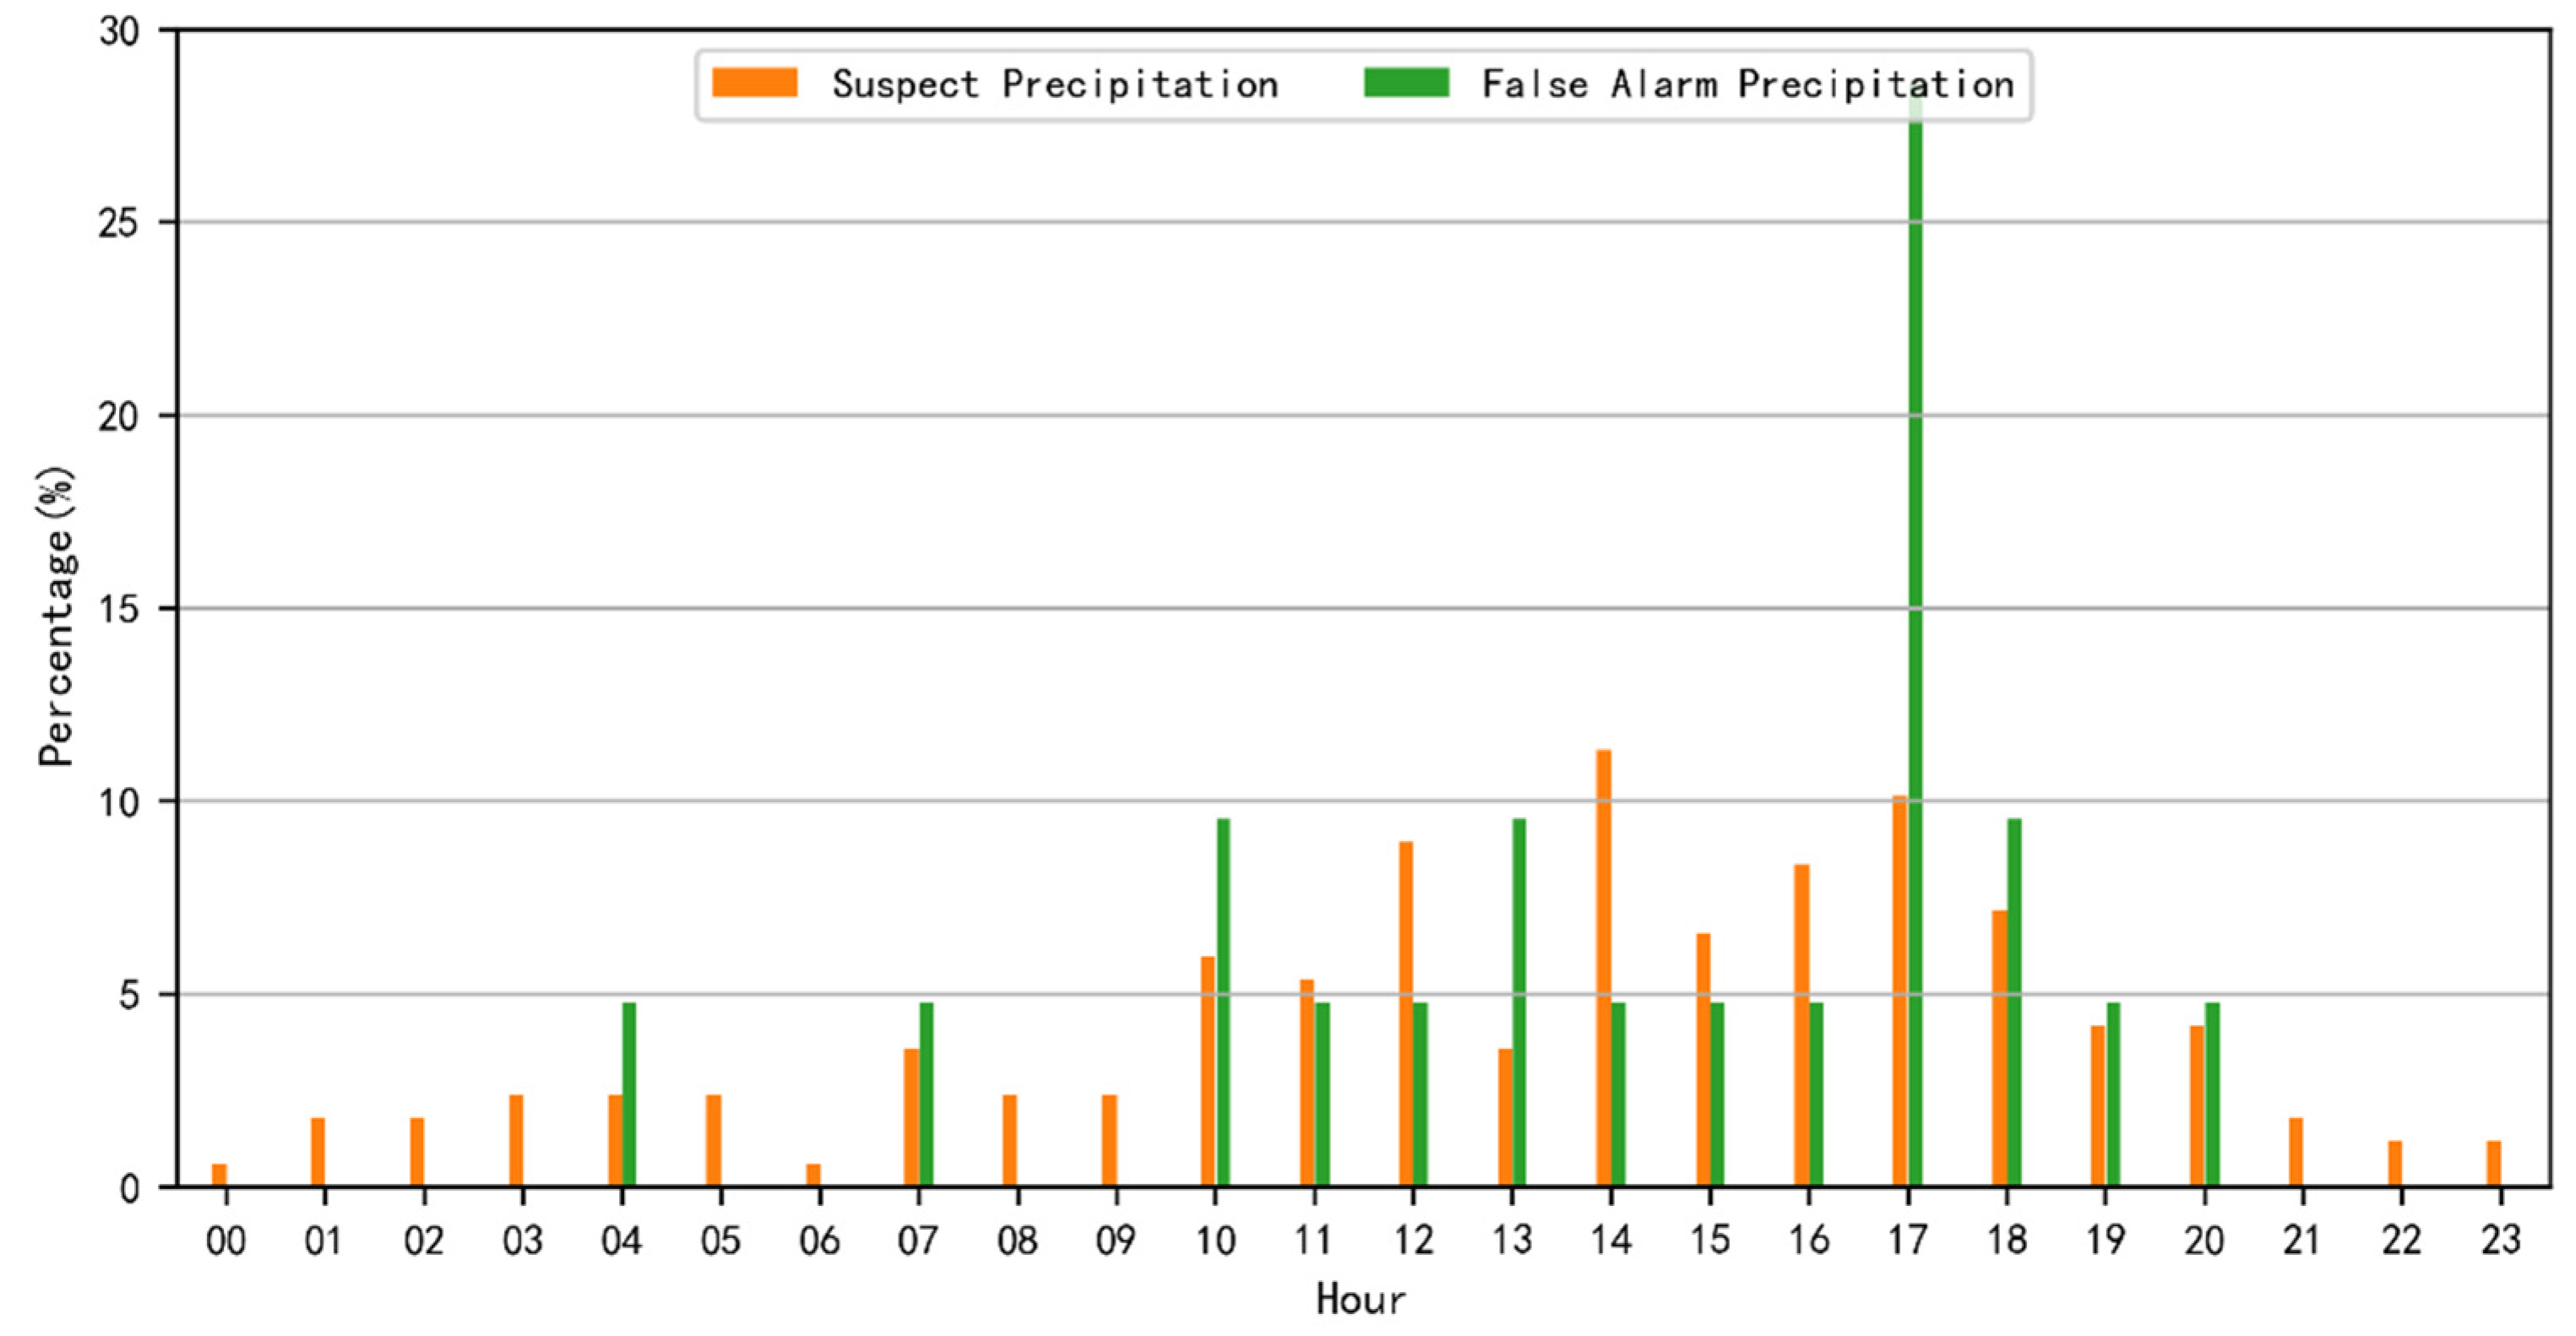
Figure 10). Notably, in the timing of the false alarm precipitation reports (see
Figure 12), the proportion of 17:00 to 20:00 local time in the false alarm precipitation category is higher than in the suspicious precipitation category, especially 17:00 local time; thus, it appears that the scoring method tends to misjudge the correct precipitation during 17:00 to 20:00 local time. The reason for this phenomenon may be that the characteristics of meteorological elements caused by sunset are basically the same as those caused by precipitation (temperature drop, visibility drop, humidity rise, etc.). Therefore, the scoring method will misjudge sunset characteristics as precipitation characteristics. Therefore, our previous method of using the difference method to remove air temperature diurnal variation is not completely effective. A means of effectively removing weather components from diurnal variation is an important issue to be solved for this scoring method. By searching the literature [
19], it was found that follow-up research used the anomaly values instead of the measured value to eliminate the diurnal variation. The calculation of the average value was carried out as follows: make statistics of the average value of a certain month and hour over the years, and subtract the average value of that hour from the measured value to obtain the deviation.
4. Discussion and Conclusions
We expected this scoring method to be very effective because it was based on the response characteristics of various weather components to the precipitation process. Its principle is universal and simple. Moreover, the artificial subjective analysis method with multiple weather components at AWSs has been applied in daily work for many years, and has a deep foundation. However, we found that the correlations between some weather components and the precipitation process are not significant, such as the temperatures from water-adjacent AWSs and the 2-minute average wind; thus, it is unreasonable to use the changes in these weather components as quality control measures for the precipitation. Additionally, it has been discovered that this approach is significantly impacted by the diurnal variation of weather components, particularly temperature, humidity, and visibility. Moreover, traditional techniques such as the difference method are ineffective in removing this diurnal variation effect.
The multicomponent comprehensive consistency method in national-level AWSs has already been applied in some literature. By incorporating a lot of gridded fusion products, our study has expanded this method’s use to include all AWSs, including rain gauge AWSs that have only precipitation observation. In addition, by converting subjective judgments into an objective method through a scoring system, the departure of human subjectivity from the outcomes of quality control is reduced.
Our ultimate objective is to efficiently and accurately automate real-time AWS precipitation data quality control. The suggested method can make an accurate determination for the majority of suspicious precipitation, according to test findings, but it still has limits for some stations with unique geographic environments and periods with significant daily change. We think that this method can be extended to the whole country as a supplement to the conventional quality control methods used for the quality control of precipitation information from AWSs.

