Article

Volatile Organic Compound Sampling through Rotor Unmanned Aerial Vehicle Technique for Environmental Monitoring

1
Chengdu Ecological Environment Monitoring Center Station, Chengdu 610066, China
2
College of Architecture and Environment, Sichuan University, Chengdu 610065, China
3
College of Environmental Sciences, Sichuan Agricultural University, Chengdu 611134, China
4
Key Laboratory of Green Chemistry & Technology of Ministry of Education, College of Chemistry, Sichuan University, Chengdu 610065, China
*
Authors to whom correspondence should be addressed.
Atmosphere 2022, 13(9), 1442; https://doi.org/10.3390/atmos13091442
Submission received: 30 July 2022 / Revised: 24 August 2022 / Accepted: 2 September 2022 / Published: 6 September 2022

Abstract

:
To improve the capacity to probe volatile chemical substances in the atmosphere, we designed an unmanned aerial vehicle system for volatile organic compound (VOC) monitoring and sampling. This environmental monitoring unmanned aerial vehicle (EMUAV) platform was equipped with a photoionization detector for continuous VOC monitoring and searching in a pollution air mass. Furthermore, a multifunction airborne microVOC sampler was loaded for sampling. An airbag and absorption tube were applied to collect air samples for further analyzing in the laboratory by GC-FID/MS or TD-GC/MS. By comparing the aerial samples derived from the microVOC sampler with the samples collected at a similar height to a building roof for chemical compositions, the sampling conditions, such as the sampling port location and sampling method, were optimized to ensure the representativeness of the air samples. The results of the sample comparison experiment showed that both the airbag method and the adsorption method could recover 70–130% for most VOC species. Through the aerial measurements, the advantages of this EMUAV system were demonstrated. Therefore, the developed EMUAV system would have immeasurable potential in the field of environment monitoring.

1. Introduction

Volatile organic compounds (VOCs) are important precursors of ozone and secondary organic aerosols (SOA), which together with PM2.5, are the main causes of haze and reduce visibility in the atmosphere [1,2,3]. VOCs include many kinds of compounds, which show quite different mixing ratios and compound properties in the troposphere. These variations can have significant effects on air quality and humans [4,5,6]. With the rapid development of the economy and urbanization, environmental problems caused by VOC emissions have become increasingly prominent. Thus, VOCs have become one of the most concerning atmospheric monitoring indicators. At present, most VOC monitoring sites are located at ground level. However, the distribution of gaseous pollutants in the atmosphere is not uniform, and it is difficult to guarantee the representativeness of the samples when the near-surface atmospheric environment is complex [7,8,9,10]. Thus, there is an urgent need to obtain reliable observations of aerial VOCs in the atmosphere to better investigate the features and formation mechanisms of regional atmospheric pollution.
To characterize the spatiotemporal variability of VOCs in the atmospheric boundary layer, some field observations have started to focus on the spatial distribution of VOCs [11]. Most of these works depended on tower-based measurements or tethered balloons [7,8,12,13,14,15,16,17]. These platforms used in previous studies have their respective advantages [17], but they only worked in a vertical direction and could not flexibly characterize a large spatial scale. Aircraft can provide platforms for VOC measurements over large spatial scales, but aircraft are not suitable for routine observations because of their high operating cost. With the rapid advancement in unmanned aerial vehicle (UAV) technology, UAVs coupled with a multipollutant sensor system or sampling apparatus with the ability to provide multilevel three-dimensional data have become more flexible and helpful monitoring tools in environmental studies [18,19,20,21,22,23,24]. Furthermore, airborne sampling through UAVs can realize the sampling of pollution sources by remote control, which is an efficient and low-risk operation mode. For aerial VOC studies, whole air sampling with advanced UAV control techniques have been refined and are commonly applied. In several recent studies, Chang et al. exploited this technology to sample aerial air over an exhaust shaft of a roadway tunnel and costal site [25,26]. Vo et al. investigated the vertical stratification of VOCs and their photochemical product formation potential in an industrial urban area [27]. Lan et al. sampled ambient air around both an ecosystem–atmosphere station and a farm in Finland [28]. With the help of UAV technology, vertical profiles of VOCs in suburban Shanghai [29] and biogenic VOC distributions over tropical forests in central Amazonia [30], subtropical forests in China [31], and even during the camp fire in Northern California [32] were achieved. However, previous studies were conducted to establish the vertical profiles of ambient VOCs by sampling ambient air with UVAs first and then analyzing VOCs later [33]. Offline VOC measurements could provide detailed VOC characteristics, but for environmental monitoring, without a real-time sensor, it was difficult to sample polluted air mass purposely, and some vital plumes were easily left out.
To solve this issue and realize the effective utilization of UAVs for VOC monitoring, an environmental monitoring unmanned aerial vehicle (EMUAV) was developed in this work. This EMUAV was equipped with a photoionization detector (PID) for the real-time and semiquantitative monitoring of the total VOCs, and an airborne microVOC sampler was used for offline analysis. Coupling the advantages of both offline and online VOC measurements, this system would be helpful for the assessment and monitoring of environmental VOC contamination. In the current study, the accuracy and representativeness of VOC sampling in the air through this EMUAV were discussed carefully.

2. Materials and Methods

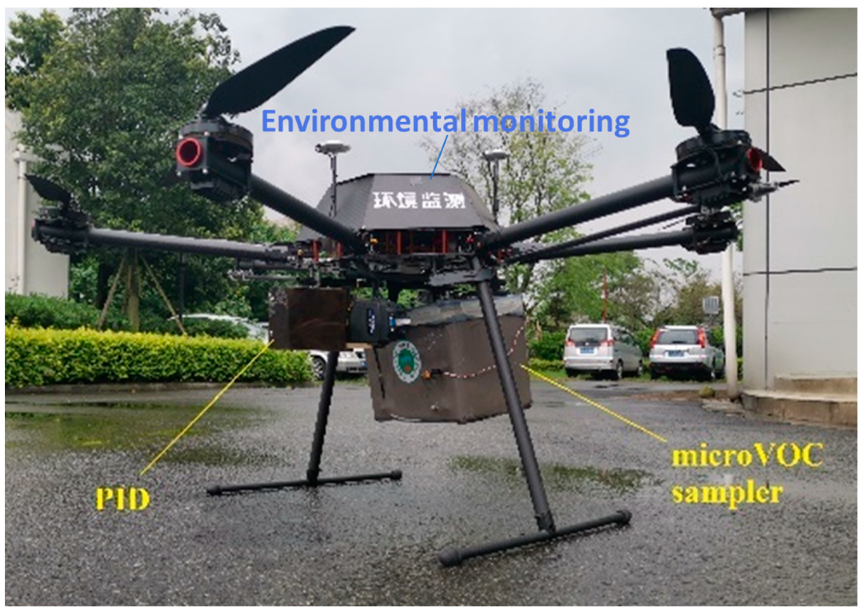
2.1. The EMUAV Platform

Compared to other types of UAVs, rotary-wing UAVs have several dominant advantages for environmental monitoring, such as a simple structure, being lightweight, and the ability to hover in a specific position [30]. As shown in Figure 1, our flight platform was a hexacopter UAV (customized by Chengdu Fufeng Technology Co., Ltd., Chengdu, China). Its main structure was carbon fiber, with an arm span of 1.25 m, 0.27 m high, and a maximum load of 6.0 kg. The maximum working altitude of this UAV was 150 m. This UAV was powered by two lithium batteries (TATTU 22000 mA, 2.4 kg, Gripp) and weighed 7.0 kg without another payload. It could hover for 20 ± 3 min at an altitude of 50 m with a full load. The maximum ascent rate was 5 m/s, and the maximum descent rate was 4 m/s. To obtain the real-time air parameters during sampling, this EMUAV platform was equipped with a range of devices, including a camera (Model 720P, SONY, Tokyo, Japan), a GPS unit (Model A3, DJI, Shenzhen, China), and an altimeter. The camera was employed to read the value on the PID in real time. The GPS provided positioning information and communicated through the DJI program on the ground. Its accuracy was ±0.5 m vertically and ±2.5 m horizontally.

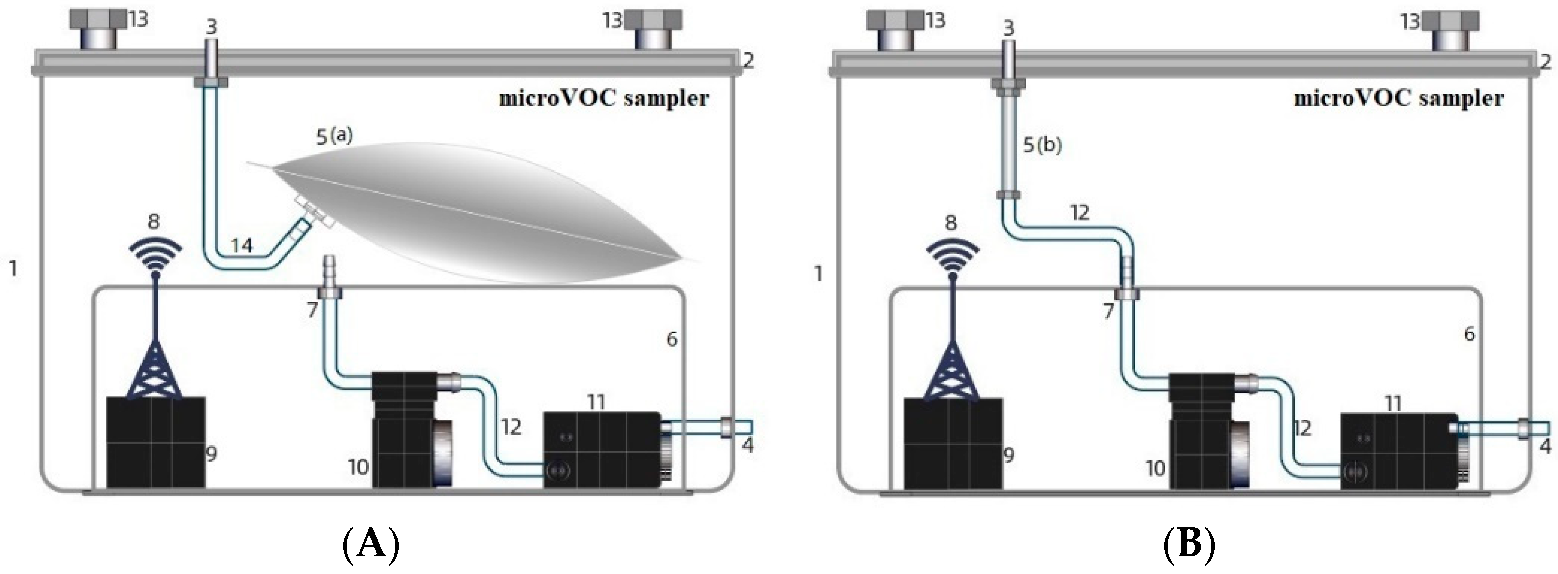
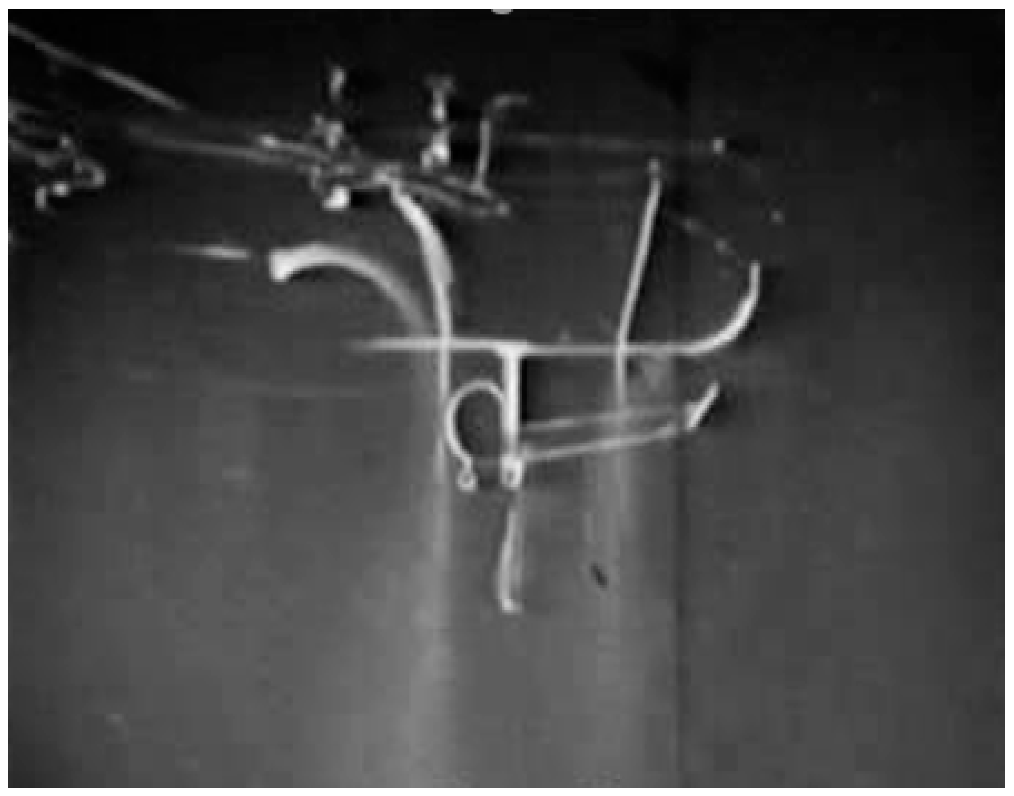
2.2. Equipment for VOC Monitoring and Sampling

The devices for VOC monitoring and sampling were a PID (PGM-7340 PPBRAE 3000, RAE, San Francisco, CA, USA) and a microVOC sampler (self-developed). The former was used to search for pollution air mass and preliminary determination, while the latter was used for sample collection. The sampler pipeline (Φ6 mm × 1.5 m) was composed of polytetrafluoroethylene (PTFE) tubes and joints to reduce the adsorption of VOCs.
PIDs are commonly compact size and effective in detecting numerous VOC substances. Moreover, they can provide a fast response and find pollution air mass sensitively. The basic parameters of the PID used in our system are listed in Table 1. Isobutylene was selected to calibrate this detector, and the detection accuracy for isobutylene was ±3%.
Because the PID could only give a total quantitative signal and could not identify the substances, as illustrated in Figure 2, we developed a microsampler for VOC collection. The sampling system resided in a polyethylene sealed box (30 cm × 22 cm × 22 cm). This box remained closed and attached to the chassis of the UAV platform. The sample flow of this system was drawn by a miniature pump and controlled via a mass flow controller with a flow rate range from 0 to 200 sccm. Air samples could be collected using a Teflon airbag or a cartridge absorption tube. Since the flight of UAV would cause disturbance to the surrounding atmosphere, the distribution of pollutants around the UAV would have been affected to some extent. Therefore, the sampling tube from the box could be fixed on the top or side of the UAV platform. Experiments were carried out to determine which sampling port position could collect more representative samples, and the results and discussion are given in the following section. Autonomous sampler operation and data collection in flight is accomplished with a microcontroller. The microcontroller coordinated the activation and operation of the pump and MFC using a pre-programmed algorithm based on the elapsed time, flow rate, run time, and sample volume.

2.3. VOC Sampling and Analysis

2.3.1. Airbag VOC Sampling and Analysis

Before use, the airbag (Tedlar, 5 L, RESTEK, Philadelphia, PA, USA) was repeatedly cleaned by high-purity nitrogen (≥99.999%) and finally evacuated, and the vacuum box method was used to collect samples. When sampling, an airbag was installed into the sampler, as shown in Figure 2A. The exhaust flow and sampling time were 200 mL/min and 10 min, respectively. Then, the airbag samples were concentrated in a preconcentrator (Entech-7200, Entech, Simi Valley, CA, USA) and sent to offline by GC-FID/MS (7890B GC, 5977B MS, equipped with an FID and a Dean’s switch, Agilent, Wilmington, California, USA). Ethane, ethylene, and acetylene were separated on one column (HP-Plot/Q + PT, 30 m × 0.32 mm × 20 μm, Agilent, J&W, Santa Clara, CA, USA) and detected by FID through the quantification of the external standard method. The remaining compounds were separated on another column (DB-1, 60 m × 0.25 mm × 1.0 μm, Agilent J&W, Santa Clara, CA, USA) and analyzed by MS, which quantified by the internal standard method for the analysis of 118 compounds.

2.3.2. Adsorption Tube VOC Sampling and Analysis

Adsorption tubes packed with 1/3 Carbopack C, 1/3 Carbopack B, and 1/3 Carboxen 1000 (Φ0.25 × 3.5 inches, CAMSCO, Houston, TX, USA) were purified by an adsorption aging instrument (TDS-3410) before use to ensure that there were no residual VOCs. After purification, the tube was installed into the sampler to proceed with sampling, as shown in Figure 2B, with a 100 mL/min flow rate. The samples were analyzed by TD-GM/MS (TD: TurboMatrix350, PerkinElmer; GC/MS: TRACE1310-ISQ, Thermo Fisher, Waltham, MA, USA) and quantified by the external standard method. Because the GC-MS was not equipped with a Dean switch, it was unable to separate and detect ethane, ethylene, and acetylene. In addition, propylene and propane were also undetectable because they were difficult to separate. Therefore, a total of 114 components were analyzed by the adsorption tube method.

2.3.3. Calibration

The standard gases used were PAMS mixed standard gas, TO-15 mixed standard gas, aldehyde, and ketone mixed standard gas (1.0 ppbv, China National Institute of Testing Technology, Sichuan, Chengdu, China). In addition, methylene chlorobromide, 1,4-difluorobenzene, and chlorobenzen-D5 were treated as an internal standard gas (0.1 ppbv, China Institute of Testing Technology). The calibrated VOC species are given in Table S1. The standard gas was diluted by zero air and prepared in clean SUMMA canisters through a standard gas preparation unit (Model 4700, Entech, Simi Valley, CA, USA) at concentrations of 0.5, 1.0, 2.0, 5.0, and 10.0 ppbv. For calibration, standard gas was sampled by a microflow sampler with an air bag or adsorption tube, and then the samples were measured by the detection system. The sampling and analytical conditions were the same. The TD-GC/MS method could not analyze ethylene, acetylene, ethane, or propylene. The linearity of the pre-GC-MS/FID method for most components was slightly better than that of the TD-GC/MS method, and the linear correlation of all compounds was greater than 0.995, which shows good linearity.

3. Results and Discussion
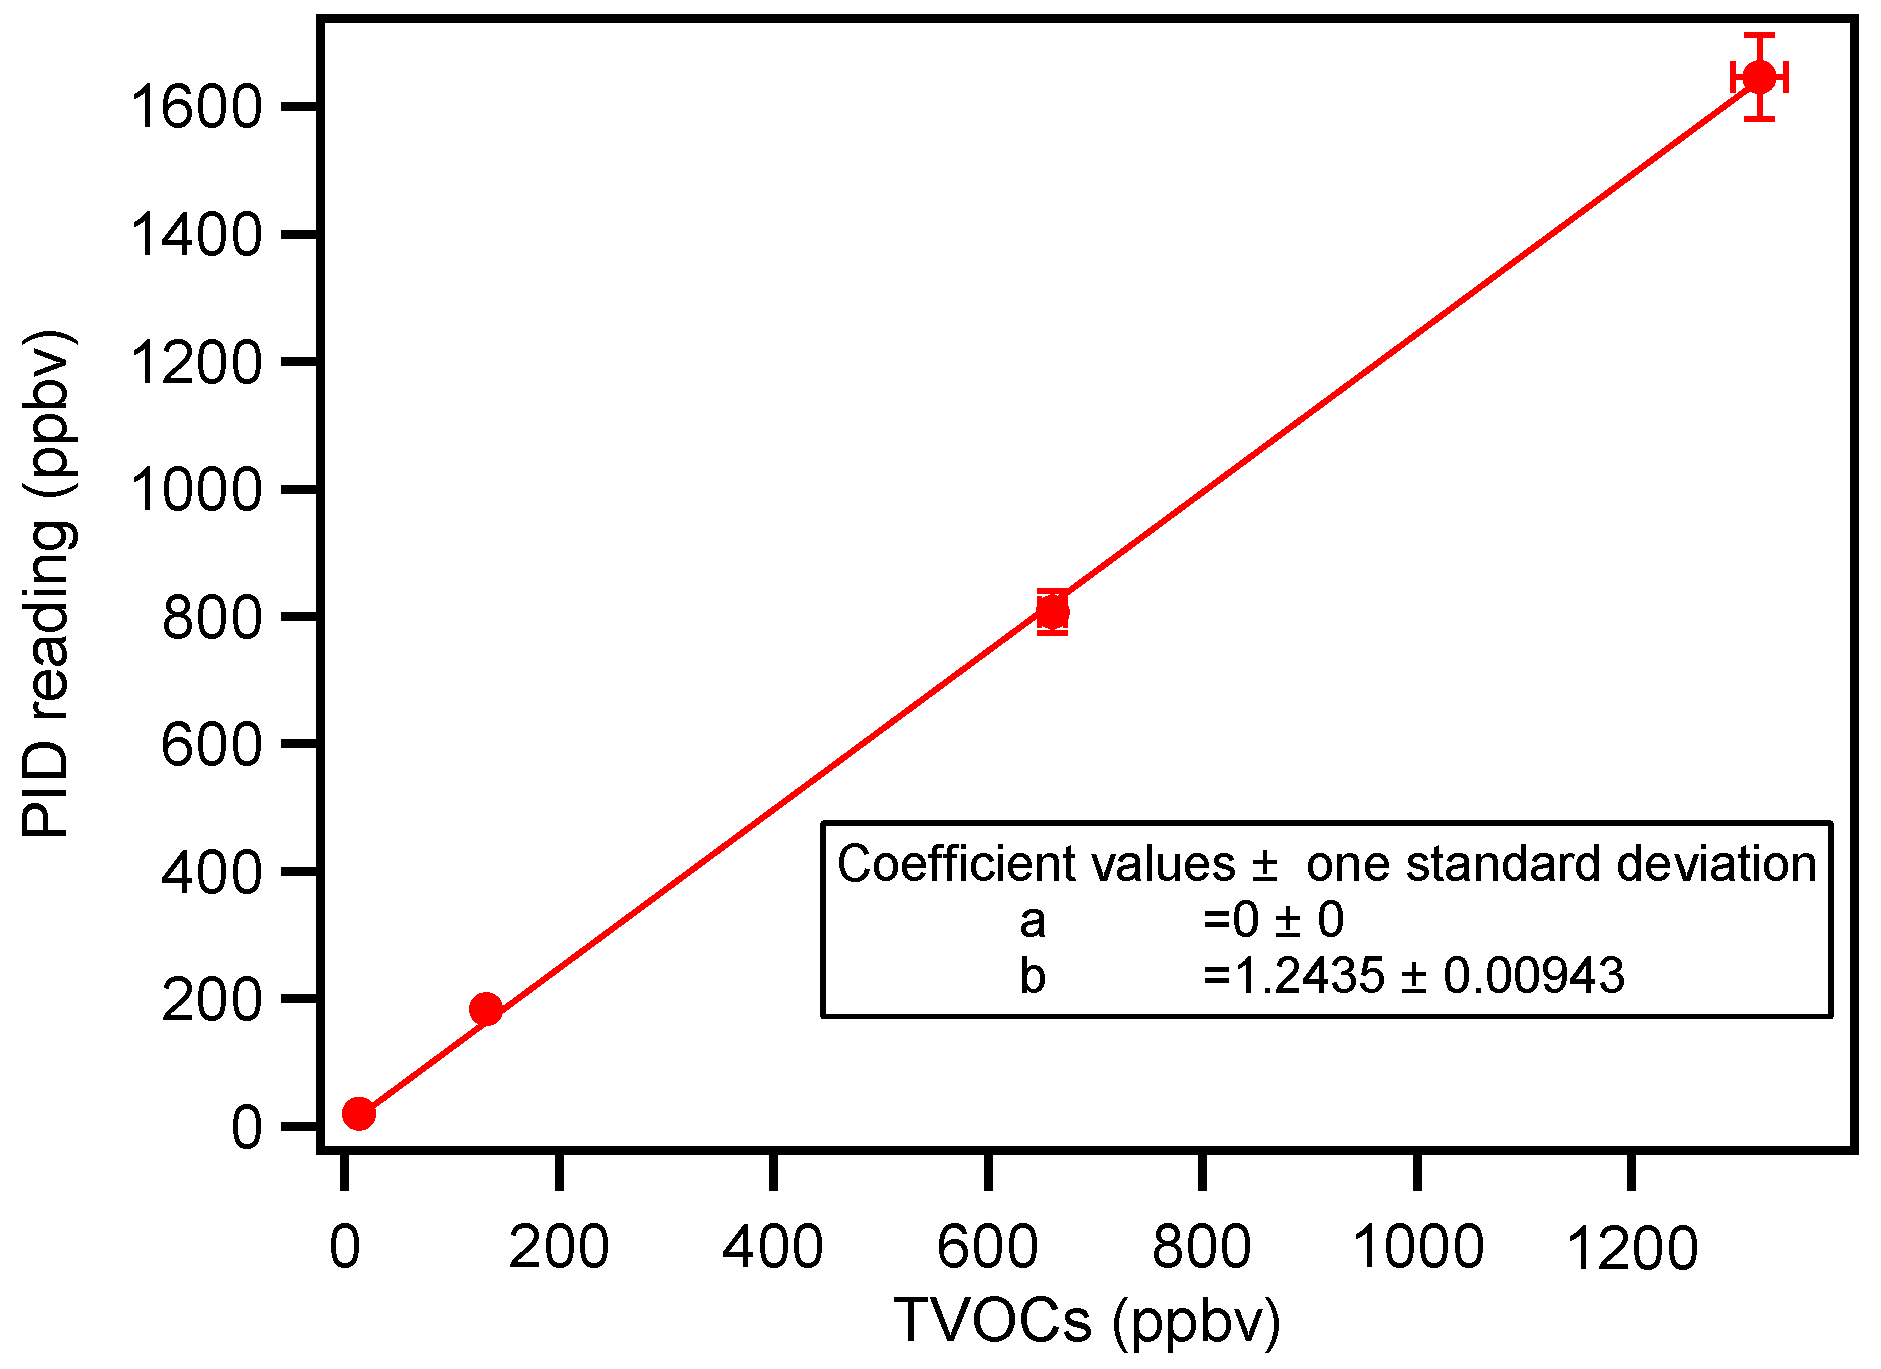
3.1. PID Accuracy

Most VOC substances can absorb energy and be ionized by the PID lamp, some more easily than others. Generally, in the same condition, the sensitivities of the PID to VOCs depends on the ease of ionization, normally in the order of aromatic, iodide > ketones, ethers, amines, sulfides > esters, aldehydes, alcohols > long-chain alkenes > long-chain alkanes > short-chain alkanes and alkenes (low response). [34]. The PID detector could measure most of the organic compounds, and we detected the total VOC response signals by exposing it to a specific concentration of a standard mixture of gases in a SUMMA canister. Verified by these experimental tests the accuracy and linearity of the PID response signals were evaluated. There was a good linear relationship between the standard concentrations and the measured results, from 13.2 ppbv to 1320 ppbv in Figure 3 (R2 = 0.9998). It was confirmed that the PID was suitable for semi-quantitative detection and could be used to estimate the concentration trends in the air.

3.2. Accuracy of Sampling by microVOC Sampler on UAV

In this work, the accuracy of the developed UAV sampling technique was investigated by measuring the recovery of standard gas through this sampler. The airbag and adsorption tube methods required the sampling of the standard gas in the SUMMA canister by the sampler on the EMUAV. The calculation formula of recovery is as follows:
  η mn = A m n s ¯ A m n c ¯ × 100 %
where ηmn represents the average recovery of compound m, determined by the n method (airbag or adsorption tube), %; Amns represents the peak area of compound m in a practical sampler and collected by the n method (airbag or adsorption tube), dimensionless; Amnc represents the peak area of compound m derived from the standard sample in the SUMMA canister, dimensionless. The mixing ratio of each VOC compound in the SUMMA canister was 2 ppbv. The recovery results are presented in Table 2.
The standard addition test results suggested that the recoveries of VOC compounds with high boiling points, high chemical activity, and strong volatility were unsatisfactory when sampled with the airbag and injected at room temperature (about 20 °C). When the airbag was heated at 60 °C or 80 °C and introduced to the injector, most of the VOCs could be recovered well. For the adsorption tube method, only four compounds with high boiling points, such as n-dodecane, had low recovery, which may be due to the adsorption of VOCs to the PTFE tube in the EMUAV sampler.
In view of the above results, both the airbag method and the adsorption tube method were efficient to collect atmospheric VOC samples for detection. When sampling with an airbag, the results of 1,2,4-trichlorobenzene, naphthalene, and m-methylbenzaldehyde were only qualitative and semiquantitative, which was also true for n-dodecane when sampling with the adsorption tube.

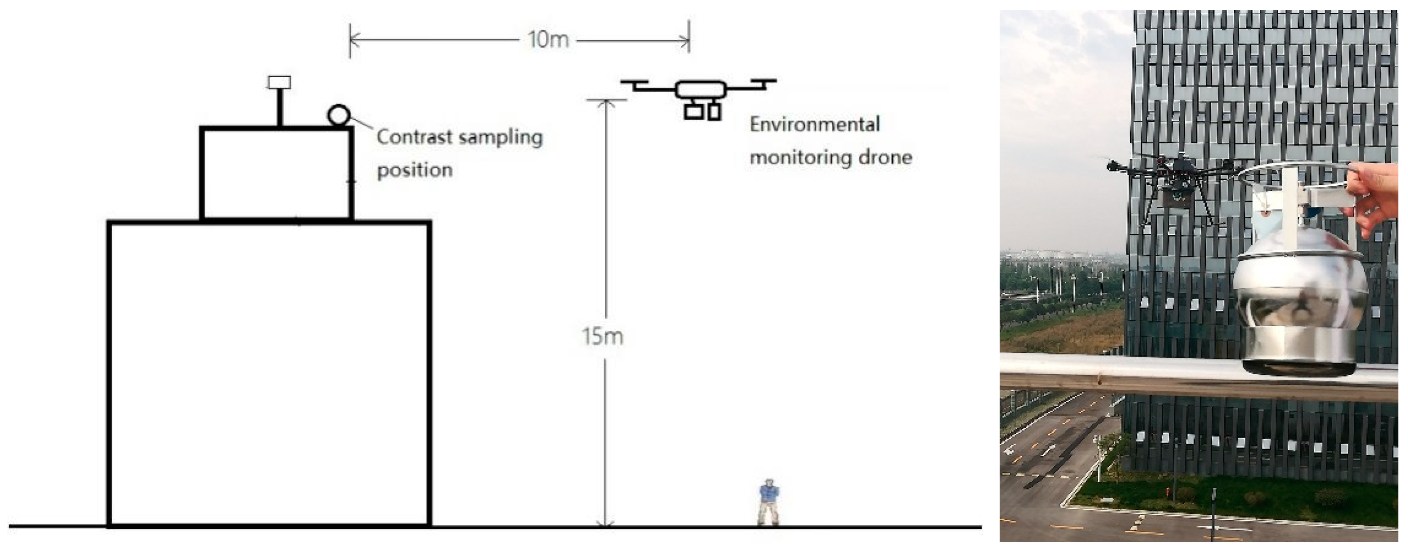
3.3. Representativeness of UAV Sampling

The representativeness of sampling is the basis of detection, and it is also the most important index requiring investigation in UAV sampling. The disturbance caused by UAV flight to the surrounding atmosphere changes the distribution of pollutants around the UAV, which may affect the representativeness of sampling. Therefore, the airflow disturbance at the sampling site must be minimal. Therefore, computational fluid dynamics (CFD) simulations [30,35] and dry-ice vaporization experiments (Figure 4) were preformed, and the results suggested that the minimal airflow disturbance positions were above and to the side of the UAV. Subsequently, this research investigated the airflow disturbance at two positions, 10 cm above the UAV fuselage and 10 cm from the outermost end of the wing, to find the optimal position for sampling.
The representativeness of UAV sampling was investigated through comparison experiments of direct ambient air sampling on the roof of a building. As shown in Figure 5, the UAV hovered at the same height as the control sampling position on the building, approximately 10 m away from the roof. This distance could ensure a similar VOC mixing ratio around the two sampling positions and ignore the airflow interference caused by the UAV flight. Then, the sampling on the EAUAV and control sampling started at the same time.
In the adsorption tube method, the sampling rate was constant throughout the whole process, and the control sample was collected with a microflow sampler in the same condition. However, the sampling with the airbag method used the principle of differential pressure, and the air flow rate gradually increased from zero to a plateau, so the control samples were instantaneous samples collected at the 3rd min and 7th min during the sampling process by SUMMA canisters, and the results were expressed as the averaged value from these two samples.
The VOC mixing ratios of EAUAV samples were compared with those of control samples, paired t-tests were utilized to confirm whether the differences were significant, and a correlation coefficient algorithm was used to assess the correlation of each VOC species mixing ratio between the two sampling groups. The results are given in Table 3.
The quantitative limit of this GC-FID/MS detection method was 0.4 ppbv. When the VOC mixing ratio was below 0.4 ppbv, the quantitative results were inaccurate, and large relative deviations were likely to occur. In addition, when the mixing ratios of some VOC species were near the detection limit, large relative deviations were observed in some cases. These two conditions resulted in R ≤ 0.5 for nearly 10% of the VOC components in Table 3. Comparatively, the results were better when the sampling position was located above the UAV, and the R values of both the airbag and adsorption tube methods were greater than 0.5. Therefore, the optimal UAV sampling position was determined to be 10 cm above the fuselage.
Furthermore, when the sampling position was located above the UAV and the sampling was conducted with an adsorption tube, there was no significant difference in the comparison results of all the components. Even with the airbag method, only acetaldehyde, isoprene, acetone, carbon disulfide, n-decane, and n-undecane had significant differences, and their R values were greater than 0.5.

4. Conclusions

In this work, a UAV platform carrying a PID, microVOC sampler, and some other sensors was developed to perform environmental VOC monitoring. The EMUAV system could efficiently search for pollution air mass using a PID and collect representative air samples with a self-made microVOC sampler. The microVOC sampler was simple in configuration, lightweight, highly maneuverable, and could be easily built and readily deployed for aerial studies.
The adsorption tube and airbag sampling modes had their advantages and disadvantages. Generally, adsorption tubes cannot collect CO, NOx, SO2, and other inorganic compounds because of their selective adsorption but can accurately quantify trace VOC components. Due to adsorption and background effects, airbags have an impact on the quantification of some VOC components and short storage times, but they can capture all components. In addition, the flight tests optimized the sampling port location, investigated the representativeness of a microVOC sampler and UAV sampling, and applied the technique to collect VOC samples for environmental monitoring. The analysis data for VOC measurements from the EMUAV were proven to be accurate and reliable by the comparisons with the reference method on the roof of a building.
This EMUAV system was flexible and mobile, hardly affected by the ground environment, and could monitor a large range of air and overcome the shortcomings of traditional atmospheric monitoring. In future plans, the EMUAV will further combine with other devices and sensors to enhance its versatility in applications.

Supplementary Materials

The following supporting information can be downloaded at: https://www.mdpi.com/article/10.3390/atmos13091442/s1, Table S1: Calibration of each VOC species.

Author Contributions

Conceptualization, F.Y. and Y.C.; methodology, Y.C.; software, Y.Q. and Z.C.; validation, X.Z., X.W., J.L. and H.W.; formal analysis, Y.C.; writing—original draft preparation, Y.C.; writing—review and editing, F.Y. and C.Z.; supervision, F.Y.; funding acquisition, F.Y. All authors have read and agreed to the published version of the manuscript.

Funding

This research was funded by the Chengdu Science and Technology Bureau, grant number No. 2020-YF09-00051-SN.

Informed Consent Statement

Not applicable.

Data Availability Statement

Data are available upon request on the official website of the Chengdu Ecological and Environmental Monitoring Center.

Acknowledgments

This research was supported by the Chengdu Ecological Environment Bureau and the Chengdu Science and Technology Bureau.

Conflicts of Interest

The authors declare no conflict of interest.

References

  1. Wang, T.; Xue, L.; Brimblecombe, P.; Lam, Y.F.; Li, L.; Zhang, L. Ozone pollution in China: A review of concentrations, meteorological influences, chemical precursors, and effects. Sci. Total Environ. 2017, 575, 1582–1596. [Google Scholar] [CrossRef]
  2. Guo, H.; Ling, Z.H.; Cheng, H.R.; Simpson, I.J.; Lyu, X.P.; Wang, X.M.; Shao, M.; Lu, H.X.; Ayoko, G.; Zhang, Y.L.; et al. Tropospheric volatile organic compounds in China. Sci. Total Environ. 2017, 574, 1021–1043. [Google Scholar] [CrossRef]
  3. Xiong, C.; Wang, N.; Zhou, L.; Yang, F.; Qiu, Y.; Chen, J.; Han, L.; Li, J. Component characteristics and source apportionment of volatile organic compounds during summer and winter in downtown Chengdu, southwest China. Atmos. Environ. 2021, 258, 118485. [Google Scholar] [CrossRef]
  4. Hsu, C.-Y.; Chiang, H.-C.; Shie, R.-H.; Ku, C.-H.; Lin, T.-Y.; Chen, M.-J.; Chen, N.-T.; Chen, Y.-C. Ambient VOCs in residential areas near a large-scale petrochemical complex: Spatiotemporal variation, source apportionment and health risk. Environ. Pollut. 2018, 240, 95–104. [Google Scholar] [CrossRef]
  5. Huang, R.-J.; Zhang, Y.; Bozzetti, C.; Ho, K.-F.; Cao, J.-J.; Han, Y.; Daellenbach, K.R.; Slowik, J.G.; Platt, S.M.; Canonaco, F.; et al. High secondary aerosol contribution to particulate pollution during haze events in China. Nature 2014, 514, 218–222. [Google Scholar] [CrossRef] [PubMed]
  6. Jimenez, J.L.; Canagaratna, M.R.; Donahue, N.M.; Prevot, A.S.H.; Zhang, Q.; Kroll, J.H.; DeCarlo, P.F.; Allan, J.D.; Coe, H.; Ng, N.L.; et al. Evolution of Organic Aerosols in the Atmosphere. Science 2009, 326, 1525–1529. [Google Scholar] [CrossRef]
  7. Sun, J.; Wang, Y.S.; Wu, F.K.; Tang, G.Q.; Wang, L.L.; Wang, Y.H.; Yang, Y. Vertical characteristics of VOCs in the lower troposphere over the North China Plain during pollution periods. Environ. Pollut. 2018, 236, 907–915. [Google Scholar] [CrossRef]
  8. Sangiorgi, G.; Ferrero, L.; Perrone, M.G.; Bolzacchini, E.; Duane, M.; Larsen, B.R. Vertical distribution of hydrocarbons in the low troposphere below and above the mixing height: Tethered balloon measurements in Milan, Italy. Environ. Pollut. 2011, 159, 3545–3552. [Google Scholar] [CrossRef] [PubMed]
  9. Zhang, K.; Zhou, L.; Fu, Q.Y.; Yan, L.; Bian, Q.G.; Wang, D.F.; Xiu, G.L. Vertical distribution of ozone over Shanghai during late spring: A balloon-borne observation. Atmos. Environ. 2019, 208, 48–60. [Google Scholar] [CrossRef]
  10. Xue, L.K.; Wang, T.; Simpson, I.J.; Ding, A.J.; Gao, J.; Blake, D.R.; Wang, X.Z.; Wang, W.X.; Lei, H.C.; Jing, D.Z. Vertical distributions of non-methane hydrocarbons and halocarbons in the lower troposphere over northeast China. Atmos. Environ. 2011, 45, 6501–6509. [Google Scholar] [CrossRef] [Green Version]
  11. Tan, Q.; Liu, H.; Xie, S.; Zhou, L.; Song, T.; Shi, G.; Jiang, W.; Yang, F.; Wei, F. Temporal and spatial distribution characteristics and source origins of volatile organic compounds in a megacity of Sichuan Basin, China. Environ. Res. 2020, 185, 109478. [Google Scholar] [CrossRef] [PubMed]
  12. Velasco, E.; Márquez, C.; Bueno, E.; Bernabé, R.M.; Sánchez, A.; Fentanes, O.; Wöhrnschimmel, H.; Cárdenas, B.; Kamilla, A.; Wakamatsu, S.; et al. Vertical distribution of ozone and VOCs in the low boundary layer of Mexico City. Atmos. Chem. Phys. 2008, 8, 3061–3079. [Google Scholar] [CrossRef]
  13. Mo, Z.; Huang, S.; Yuan, B.; Pei, C.; Song, Q.; Qi, J.; Wang, M.; Wang, B.; Wang, C.; Shao, M. Tower-based measurements of NMHCs and OVOCs in the Pearl River Delta: Vertical distribution, source analysis and chemical reactivity. Environ. Pollut. 2022, 292, 118454. [Google Scholar] [CrossRef]
  14. Geng, C.; Wang, J.; Yin, B.; Zhao, R.; Li, P.; Yang, W.; Xiao, Z.; Li, S.; Li, K.; Bai, Z. Vertical distribution of volatile organic compounds conducted by tethered balloon in the Beijing-Tianjin-Hebei region of China. J. Environ. Sci. 2020, 95, 121–129. [Google Scholar] [CrossRef]
  15. Ting, M.; Yue-Si, W.; Jie, J.; Fang-kun, W.; Mingxing, W. The vertical distributions of VOCs in the atmosphere of Beijing in autumn. Sci. Total Environ. 2008, 390, 97–108. [Google Scholar] [CrossRef] [PubMed]
  16. Zhang, K.; Xiu, G.; Zhou, L.; Bian, Q.; Duan, Y.; Fei, D.; Wang, D.; Fu, Q. Vertical distribution of volatile organic compounds within the lower troposphere in late spring of Shanghai. Atmos. Environ. 2018, 186, 150–157. [Google Scholar] [CrossRef]
  17. Liu, Z.; Li, X.; Yuan, B.; Mo, Z.; Tan, X.; Zhou, J.; Wang, S.; He, X.; Shao, M. Progress on the vertical observation methods of volatile organic compounds and their applications within the atmospheric boundary layer. Chin. Sci. Bull. 2021, 66, 4098–4111. [Google Scholar] [CrossRef]
  18. Zhou, X.; Aurell, J.; Mitchell, W.; Tabor, D.; Gullett, B. A small, lightweight multipollutant sensor system for ground-mobile and aerial emission sampling from open area sources. Atmos. Environ. 2017, 154, 31–41. [Google Scholar] [CrossRef] [PubMed]
  19. Chang, C.-C.; Chang, C.-Y.; Wang, J.-L.; Pan, X.-X.; Chen, Y.-C.; Ho, Y.-J. An optimized multicopter UAV sounding technique (MUST) for probing comprehensive atmospheric variables. Chemosphere 2020, 254, 126867. [Google Scholar] [CrossRef] [PubMed]
  20. Fumian, F.; Di Giovanni, D.; Martellucci, L.; Rossi, R.; Gaudio, P. Application of Miniaturized Sensors to Unmanned Aerial Systems, A New Pathway for the Survey of Polluted Areas: Preliminary Results. Atmosphere 2020, 11, 471. [Google Scholar] [CrossRef]
  21. Li, X.-B.; Peng, Z.-R.; Wang, D.; Li, B.; Huangfu, Y.; Fan, G.; Wang, H.; Lou, S. Vertical distributions of boundary-layer ozone and fine aerosol particles during the emission control period of the G20 summit in Shanghai, China. Atmos. Pollut. Res. 2021, 12, 352–364. [Google Scholar] [CrossRef]
  22. Ma, Y.; Ye, J.; Ribeiro, I.O.; de Arellano, J.V.-G.; Xin, J.; Zhang, W.; Ferreira de Souza, R.A.; Martin, S.T. Optimization and Representativeness of Atmospheric Chemical Sampling by Hovering Unmanned Aerial Vehicles Over Tropical Forests. Earth Space Sci. 2021, 8, e2020EA001335. [Google Scholar] [CrossRef]
  23. Aurell, J.; Mitchell, W.; Chirayath, V.; Jonsson, J.; Tabor, D.; Gullett, B. Field determination of multipollutant, open area combustion source emission factors with a hexacopter unmanned aerial vehicle. Atmos. Environ. 2017, 166, 433–440. [Google Scholar] [CrossRef]
  24. Pang, X.; Chen, L.; Shi, K.; Wu, F.; Chen, J.; Fang, S.; Wang, J.; Xu, M. A lightweight low-cost and multipollutant sensor package for aerial observations of air pollutants in atmospheric boundary layer. Sci. Total Environ. 2021, 764, 142828. [Google Scholar] [CrossRef] [PubMed]
  25. Chang, C.-C.; Wang, J.-L.; Chang, C.-Y.; Liang, M.-C.; Lin, M.-R. Development of a multicopter-carried whole air sampling apparatus and its applications in environmental studies. Chemosphere 2016, 144, 484–492. [Google Scholar] [CrossRef] [PubMed]
  26. Chang, C.-C.; Chang, C.-Y.; Wang, J.-L.; Lin, M.-R.; Ou-Yang, C.-F.; Pan, H.-H.; Chen, Y.-C. A study of atmospheric mixing of trace gases by aerial sampling with a multi-rotor drone. Atmos. Environ. 2018, 184, 254–261. [Google Scholar] [CrossRef]
  27. Vo Thi Dieu, H.; Lin, C.; Vu Chi, T.; Nguyen Thi Kim, O.; Bui Xuan, T.; Weng, C.-E.; Yuan, C.-S.; Rene, E.R. An overview of the development of vertical sampling technologies for ambient volatile organic compounds (VOCs). J. Environ. Manag. 2019, 247, 401–412. [Google Scholar] [CrossRef]
  28. Lan, H.; Ruiz-Jimenez, J.; Leleev, Y.; Demaria, G.; Jussila, M.; Hartonen, K.; Riekkola, M.-L. Quantitative analysis and spatial and temporal distribution of volatile organic compounds in atmospheric air by utilizing drone with miniaturized samplers. Chemosphere 2021, 282, 131024. [Google Scholar] [CrossRef]
  29. Liu, Y.; Wang, H.; Jing, S.; Zhou, M.; Lou, S.; Qu, K.; Qiu, W.; Wang, Q.; Li, S.; Gao, Y.; et al. Vertical Profiles of Volatile Organic Compounds in Suburban Shanghai. Adv. Atmos. Sci. 2021, 38, 1177–1187. [Google Scholar] [CrossRef]
  30. McKinney, K.A.; Wang, D.; Ye, J.; de Fouchier, J.B.; Guimarães, P.C.; Batista, C.E.; Souza, R.A.F.; Alves, E.G.; Gu, D.; Guenther, A.B.; et al. A sampler for atmospheric volatile organic compounds by copter unmanned aerial vehicles. Atmos. Meas. Tech. 2019, 12, 3123–3135. [Google Scholar] [CrossRef] [Green Version]
  31. Li, Y.; Liu, B.; Ye, J.; Jia, T.; Khuzestani, R.B.; Jia Yin, S.; Cheng, X.; Zheng, Y.; Li, X.; Wu, C.; et al. Unmanned Aerial Vehicle Measurements of Volatile Organic Compounds over a Subtropical Forest in China and Implications for Emission Heterogeneity. ACS Earth Space Chem. 2021, 5, 247–256. [Google Scholar] [CrossRef]
  32. Simms, L.A.; Borras, E.; Chew, B.S.; Matsui, B.; McCartney, M.M.; Robinson, S.K.; Kenyon, N.; Davis, C.E. Environmental sampling of volatile organic compounds during the 2018 Camp Fire in Northern California. J. Environ. Sci. 2021, 103, 135–147. [Google Scholar] [CrossRef]
  33. Batista, C.E.; Ye, J.; Ribeiro, I.O.; Guimaraes, P.C.; Medeiros, A.S.S.; Barbosa, R.G.; Oliveira, R.L.; Duvoisin, S., Jr.; Jardine, K.J.; Gu, D.; et al. Intermediate-scale horizontal isoprene concentrations in the near-canopy forest atmosphere and implications for emission heterogeneity. Proc. Natl. Acad. Sci. USA 2019, 116, 19318–19323. [Google Scholar] [CrossRef] [PubMed]
  34. Jalali-Heravi, M.; Garkani-Nejad, Z. Prediction of relative response factors for flame ionization and photoionization detection using self-training artificial neural networks. J. Chromatogr. A 2002, 950, 183–194. [Google Scholar] [CrossRef]
  35. Zhi-Qiang, L.I.; Zhang, X.X.; Liu, L.; Zhou, Y.; Zhang, L.N.; Yue, W.U.; Bai, W.J.; Yu, M. Research on UAV Platform for Atmospheric Environmental Monitoring. Environ. Monit. Manag. Technol. 2017, 1, 69–72. [Google Scholar]
Figure 1. The environmental monitoring UAV with attached PID and microVOC sampler.
Atmosphere 13 01442 g001
Figure 2. Schematic diagram of microVOC sampler (1: Polyethylene sealed box; 2: Polyethylene box cover; 3: PTFE connector (connected with PTFE sampling pipeline); 4: Outlet; 5: Sampling air bag (A) or adsorption tube (B); 6: Control integration unit; 7: Connector containing dust filter net; 8: Antenna; 9: Control circuit; 10: Electronic mass flow controller (MFC); 11: Miniature pump; 12: Silica gel pipeline; 13: Airborne connector; 14: Teflon tubes).
Atmosphere 13 01442 g002
Figure 3. Linear relationship between the total mixing ratios of standard gases and PID-measured results.
Atmosphere 13 01442 g003
Figure 4. Disturbance diagram of dry-ice airflow around the UAV flight while hovering.
Atmosphere 13 01442 g004
Figure 5. Schematic diagram and photo of the comparison experiment.
Atmosphere 13 01442 g005
Table 1. PID parameters.
IndexParameters
Ultraviolet (UV) lamp energy10.6 Ev
Detection range1 ppbv–100 ppmv
Detection limit1 ppbv
Response time2 s
Operating temperature−20 °C–50 °C
Operating humidity0–95%
Table 2. The recovery percentage of standard samples of VOCs.
ηnm (%)Air Bag MethodAdsorption Tube Method
20 °C Injection60 °C Injection80 °C Injection
30~50Chlorotoluene, 1,3-dichlorobenzene,
1,2-dichlorobenzene, 1,4-dichlorobenzene,
1,2,4-trichlorobenzene, n-dodecane, naphthalene, hexachlorobutadiene, benzaldehyde, m-methylbenzaldehyde
1,2,4-trichlorobenzene, naphthalene, m-methylbenzaldehyde/N-dodecane
50~70Dibromochloromethane, 1,2-dibromoethane, chlorobenzene, tribromomethane, 1,1,2,2-tetrachloroethane, o-xylene, isopropyl benzene, n-propyl benzene, m-ethyltoluene, p-ethyltoluene, o-ethyltoluene, 1,3,5-trimethylbenzene, 1,2,4-trimethylbenzene, 1,2,3-trimethylbenzene, n-decane, m-diethylbenzene, p-diethylbenzene, n-undecaneChlorotoluene, 1,3-dichlorobenzene,
1,2-dichlorobenzene, 1,4-dichlorobenzene, p-diethylbenzene, n-dodecane, hexachlorobutadiene
Chlorotoluene, 1,3-dichlorobenzene,
1,2-dichlorobenzene, 1,4-dichlorobenzene, 1,2,4-trichlorobenzene, n-dodecane, naphthalene, hexachlorobutadiene
undecane, m-methylbenzaldehyde,
1,2,4-trichlorobenzene
70~130The remaining 87 componentsThe remaining 107 componentsThe remaining 108 componentsThe remaining 110 components
130~160Acetone, carbon tetrachloride, 1-hexene1-hexene1-hexene, 2-hexanone/
Table 3. The results of the comparison experiment (n = 5).
NO.Chemical NameAir BagAdsorption TubeNO.Chemical NameAir BagAdsorption Tube
LateralTopLateralTopLateralTopLateralTop
1Ethane 603-methylhexane
2Ethylene 61benzene
3Acetylene 621,2-dichloroethane
4Propane 632,2,4-trimethylpentane
5Propylene 64N-heptane
6Difluorodichloromethane 65Crotonaldehyde
7tetrafluorodichloroethane 66Trichloroethylene
8Isobutane 671,2-dichloropropane
9Methyl chloride 68Amyl aldehyde
101-butylene 69Methylcyclohexane
11N-butane 70Methyl methacrylate
12Vinyl chloride 711,4-dioxane
131,3-butadiene 72Monobromodichloromethane
14Trans-but-2-ene 732,3,4-trimethylpentane
15acetaldehyde 742-methylheptane
16cis-but-2-ene 75Cis-1, 3-dichloro-1-propene
17Methyl bromide 763-methylheptane
18chloroethane 771,1-dibromoethane
19isopentane 784-methyl-2-pentanone
20Trichlorofluoromethane 79Toluene
211-amylene 80Isoctane
22Ispentane 81Tran-1,3-dichloro-1-propene
23Ethanol 821,1,2-trichloroethane
24Tr-2-pentene 83tetrachloroethylene
25isoprene 842-hexanone
26cis-2-pentene 85hexanal
27acrolein 86Dibromochloromethane
28propanal 871,2-dibromoethane
291,1-dichloroethylene 88Chlorobenzene
30Trifluorotrichloroethane 89Ethyl benzene
312,2-dimethylbutane 90, 91m&p-xylene
32acetone 92N-nonane
33Carbon disulfide 93o-xylene
34Isopropyl alcohol 94Styrene
35Methylene chloride 95Bromoform
362,3-Dimethylbutane 96Isopropyl benzene
372-methylpentane 97tetrachloroethane
38cyclopentane 98Normal propyl benzene
39Tra-1,2-dichloroethylene 99Para-ethyl toluene
40Methyl tert-butyl ether 100M-ethyl toluene
413-methylpentane 1011,3,5-trimethylbenzene
421-hexene 102N-decane
43n-hexane 103O-ethyl toluene
44Methylacrolein 1041,2,4-trimethylbenzene
451,1-dichloroethane 105Benzaldehyde
46Vinyl acetate 1061,3-dichlorobenzene
472,4-dimethylpentane 1071,4-dichlorobenzene
48N-butyl aldehyde 1081,2,3-trimethylbenzene
49Methylcyclopentane 109Chlorinated toluene
50Cis-1,2-dichloroethylene 110M-diethylbenzene
512-butanone 111P-diethylbenzene
52Ethyl acetate 1121,2-dichlorobenzene
53tetrahydrofuran 113N-undecane
54chloroform 114M-methylbenzaldehyde
551,1,1 trichloroethane 115N-dodecane
562-methylhexane 1161,2,4- trichlorobenzene
57Cyclohexane 117Hexachlorobutadiene
582,3-dimethylpentane 118Naphthalene
59Carbon tetrachloride
Annotation: Values below the detection limit were input as 0, and the detection limit was 0.1 nmol/mol; Atmosphere 13 01442 i001 the component could not be analyzed or the results were difficult to accurately quantify and the data were not used; Atmosphere 13 01442 i002 there was no significant difference between the two data groups, and the correlation coefficient was R > 0.5; Atmosphere 13 01442 i003 there was no significant difference between the two data groups, but the correlation coefficient was R ≤ 0.5; Atmosphere 13 01442 i004 there was a significant difference between the two data groups, but the correlation coefficient was R > 0.5; Atmosphere 13 01442 i005 indicates that there was a significant difference between the two data groups, and the correlation coefficient was R ≤ 0.5.
Publisher’s Note: MDPI stays neutral with regard to jurisdictional claims in published maps and institutional affiliations.

