
Research on the Planning Method and Strategy of Urban Wind and Heat Environment Optimization—Taking Shenzhen, a Sub-Tropical Megacity in Southern China, as an Example


 and
and
Abstract
:1. Introduction
2. Data and Methods
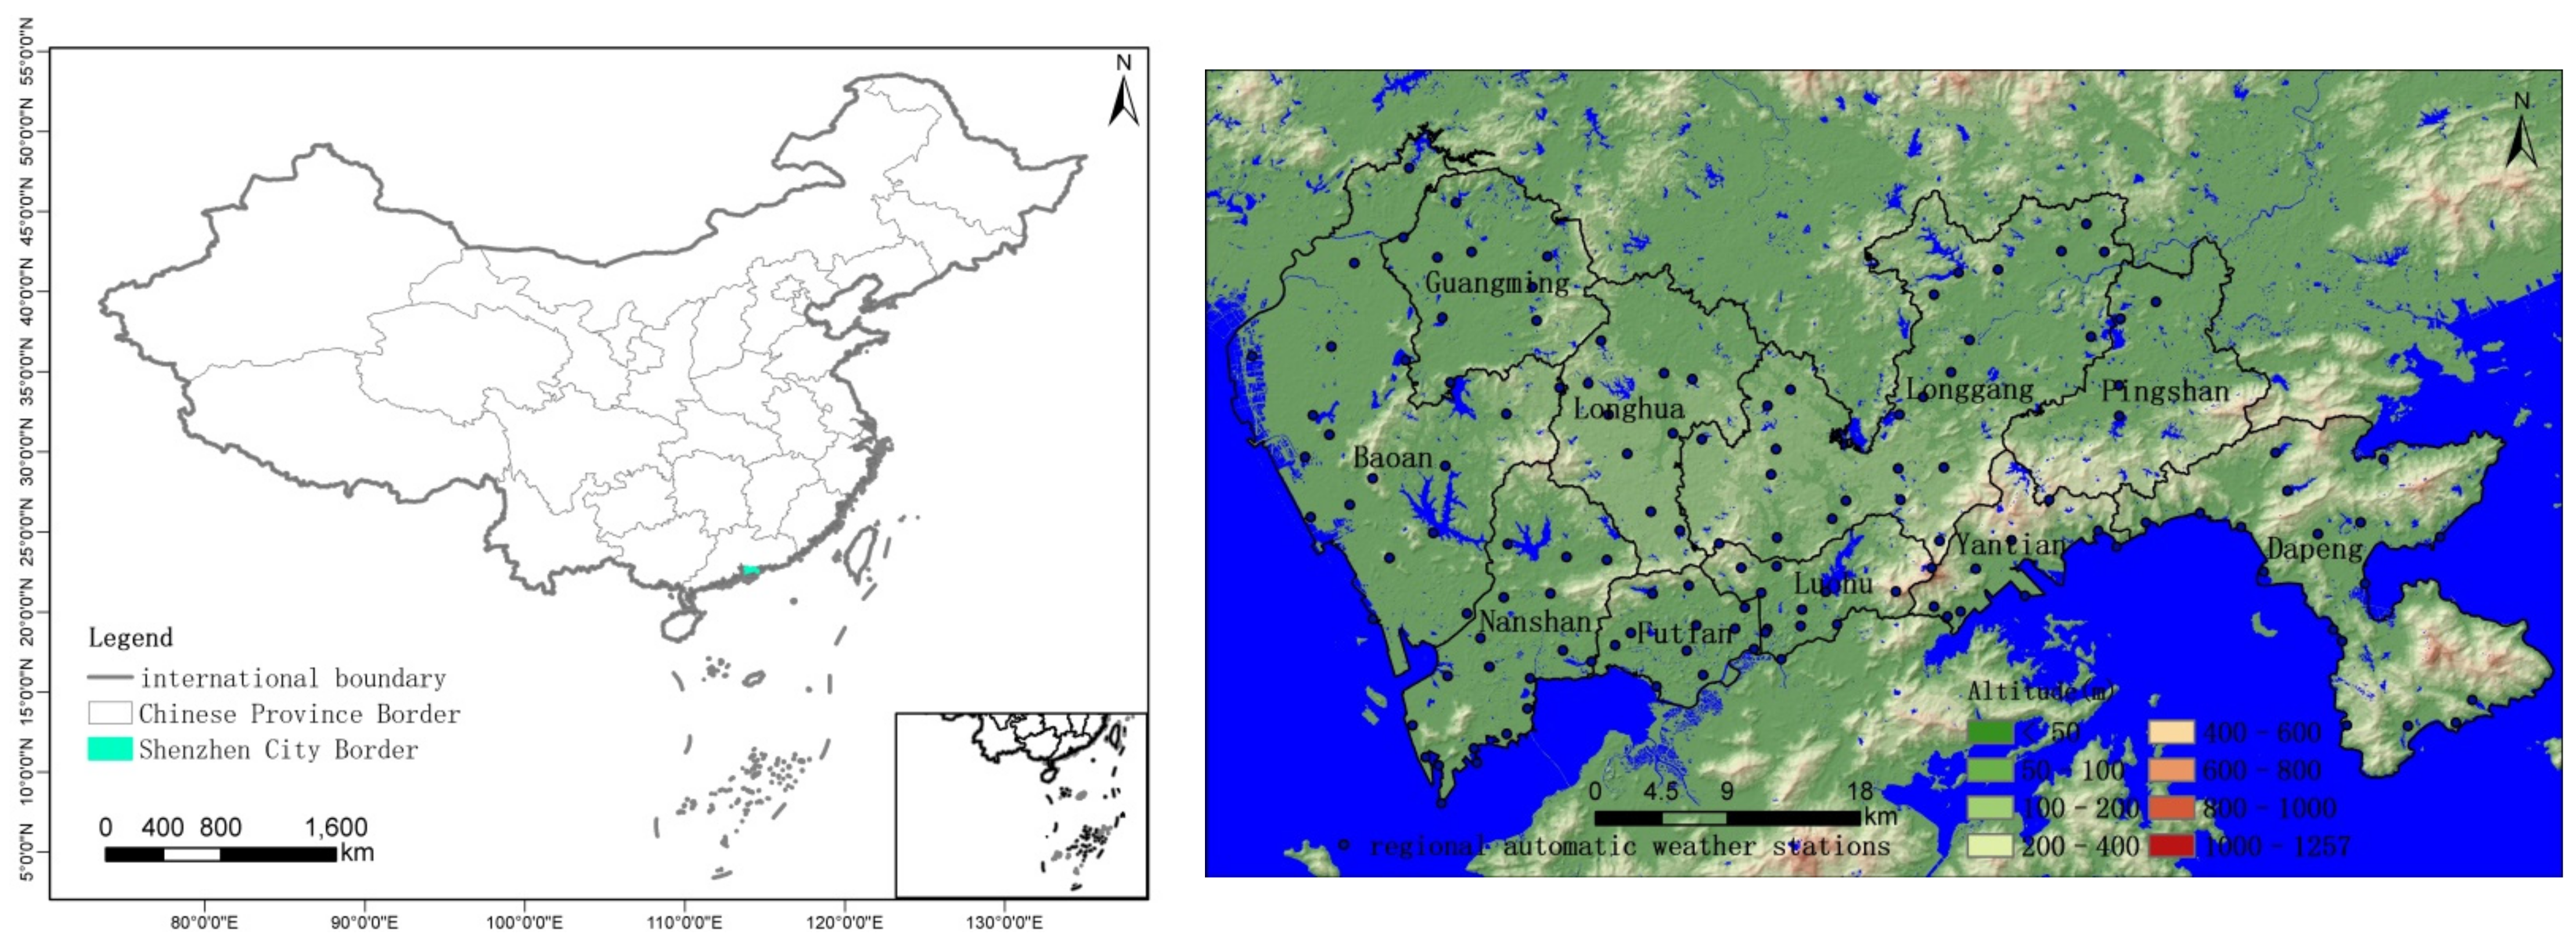
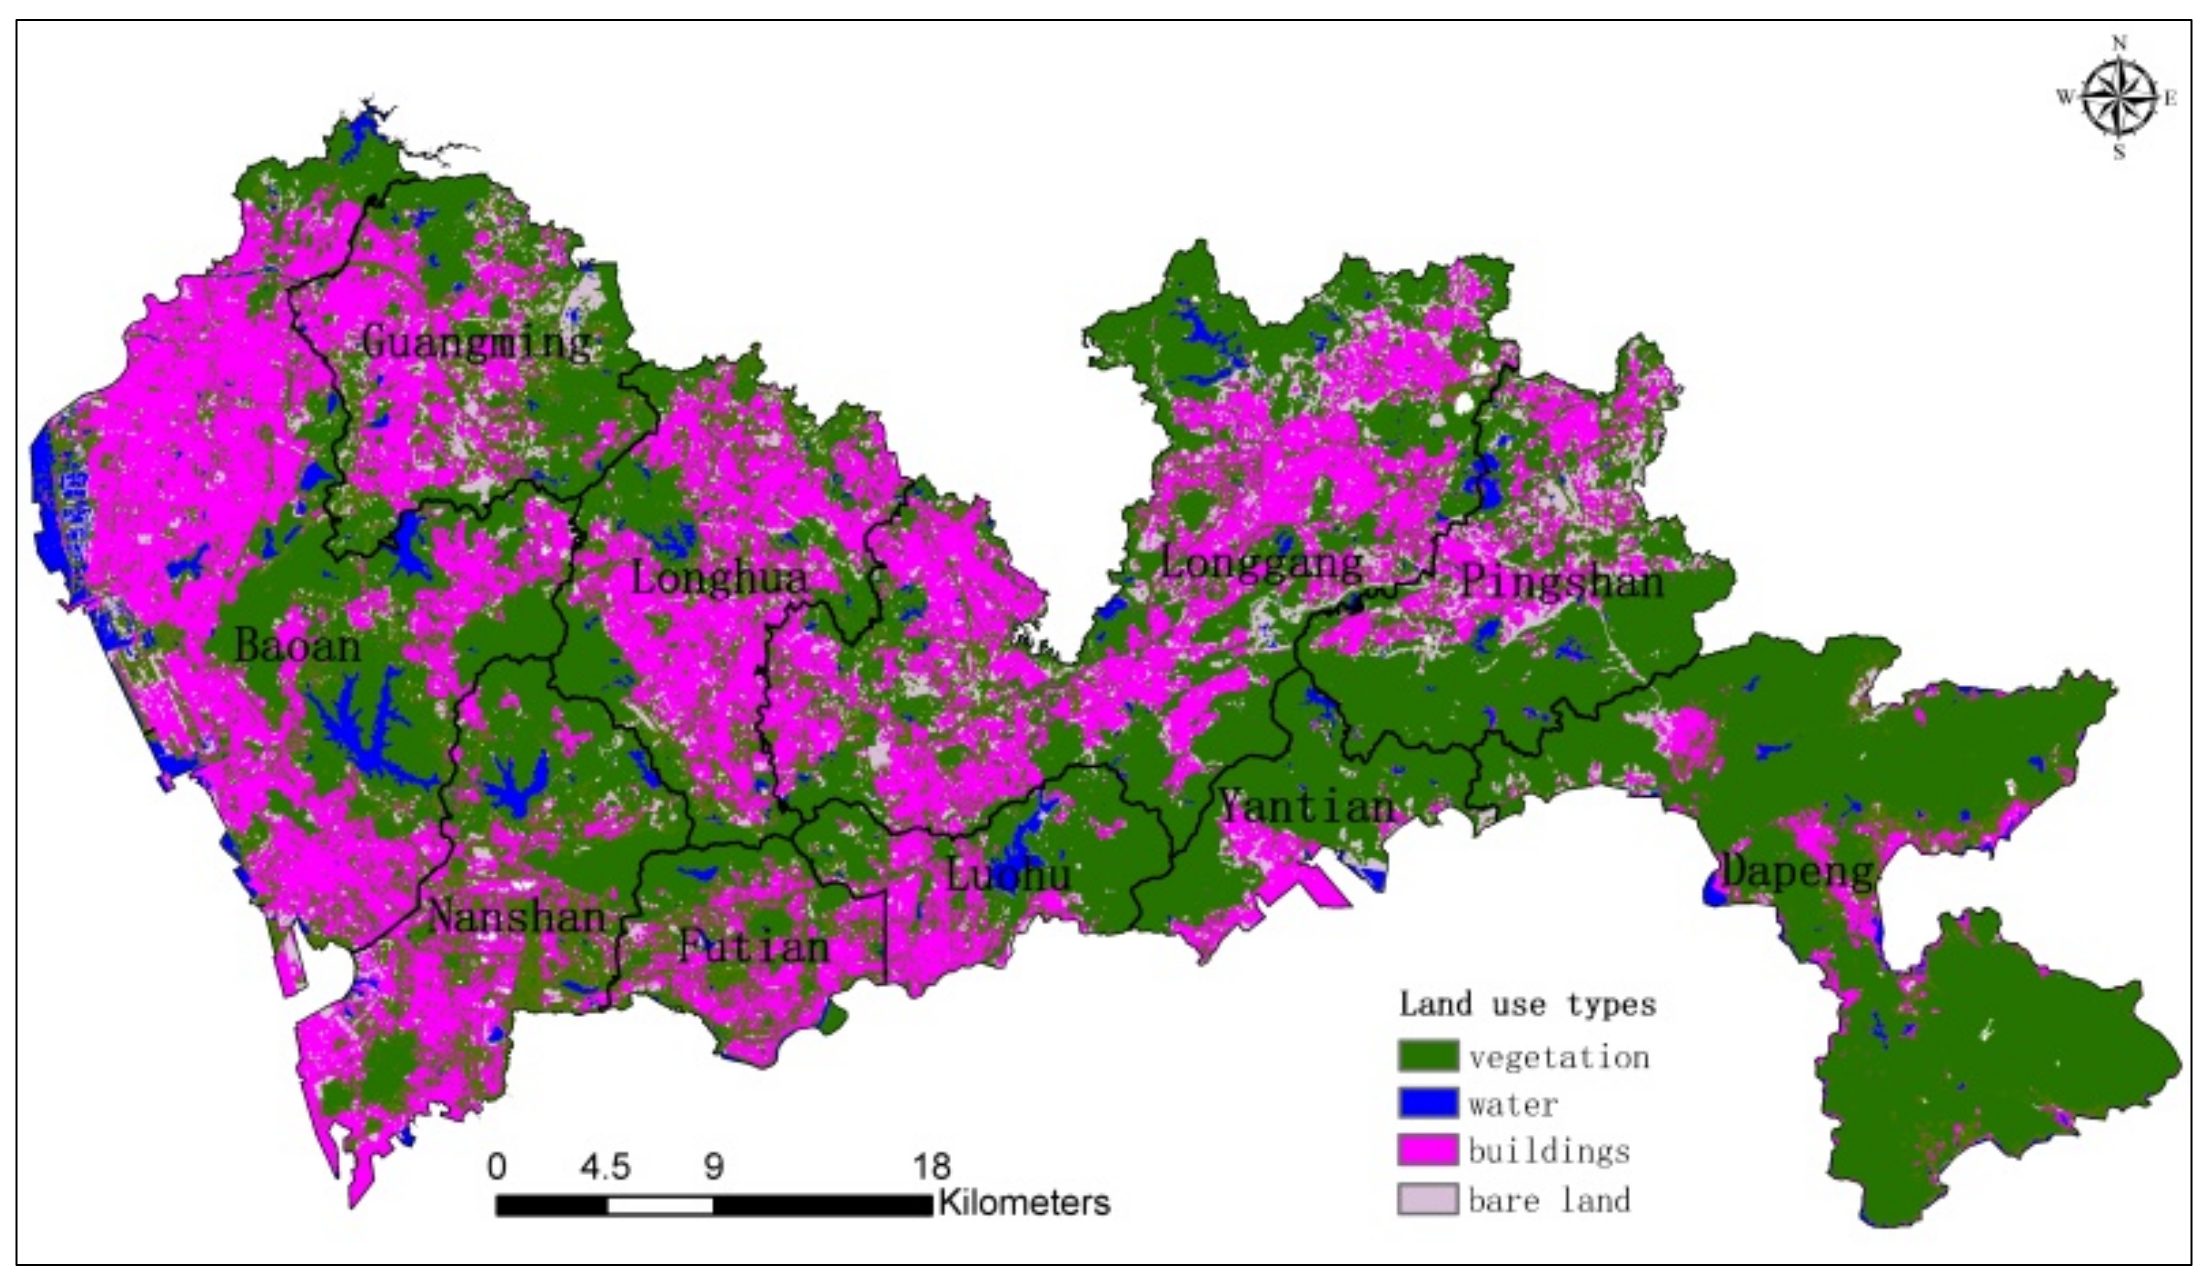
2.1. Study Area
2.2. Data Acquisition
2.3. Methods
2.3.1. Climate Statistics and Spatial Analysis
2.3.2. Heat Island Intensity Calculation
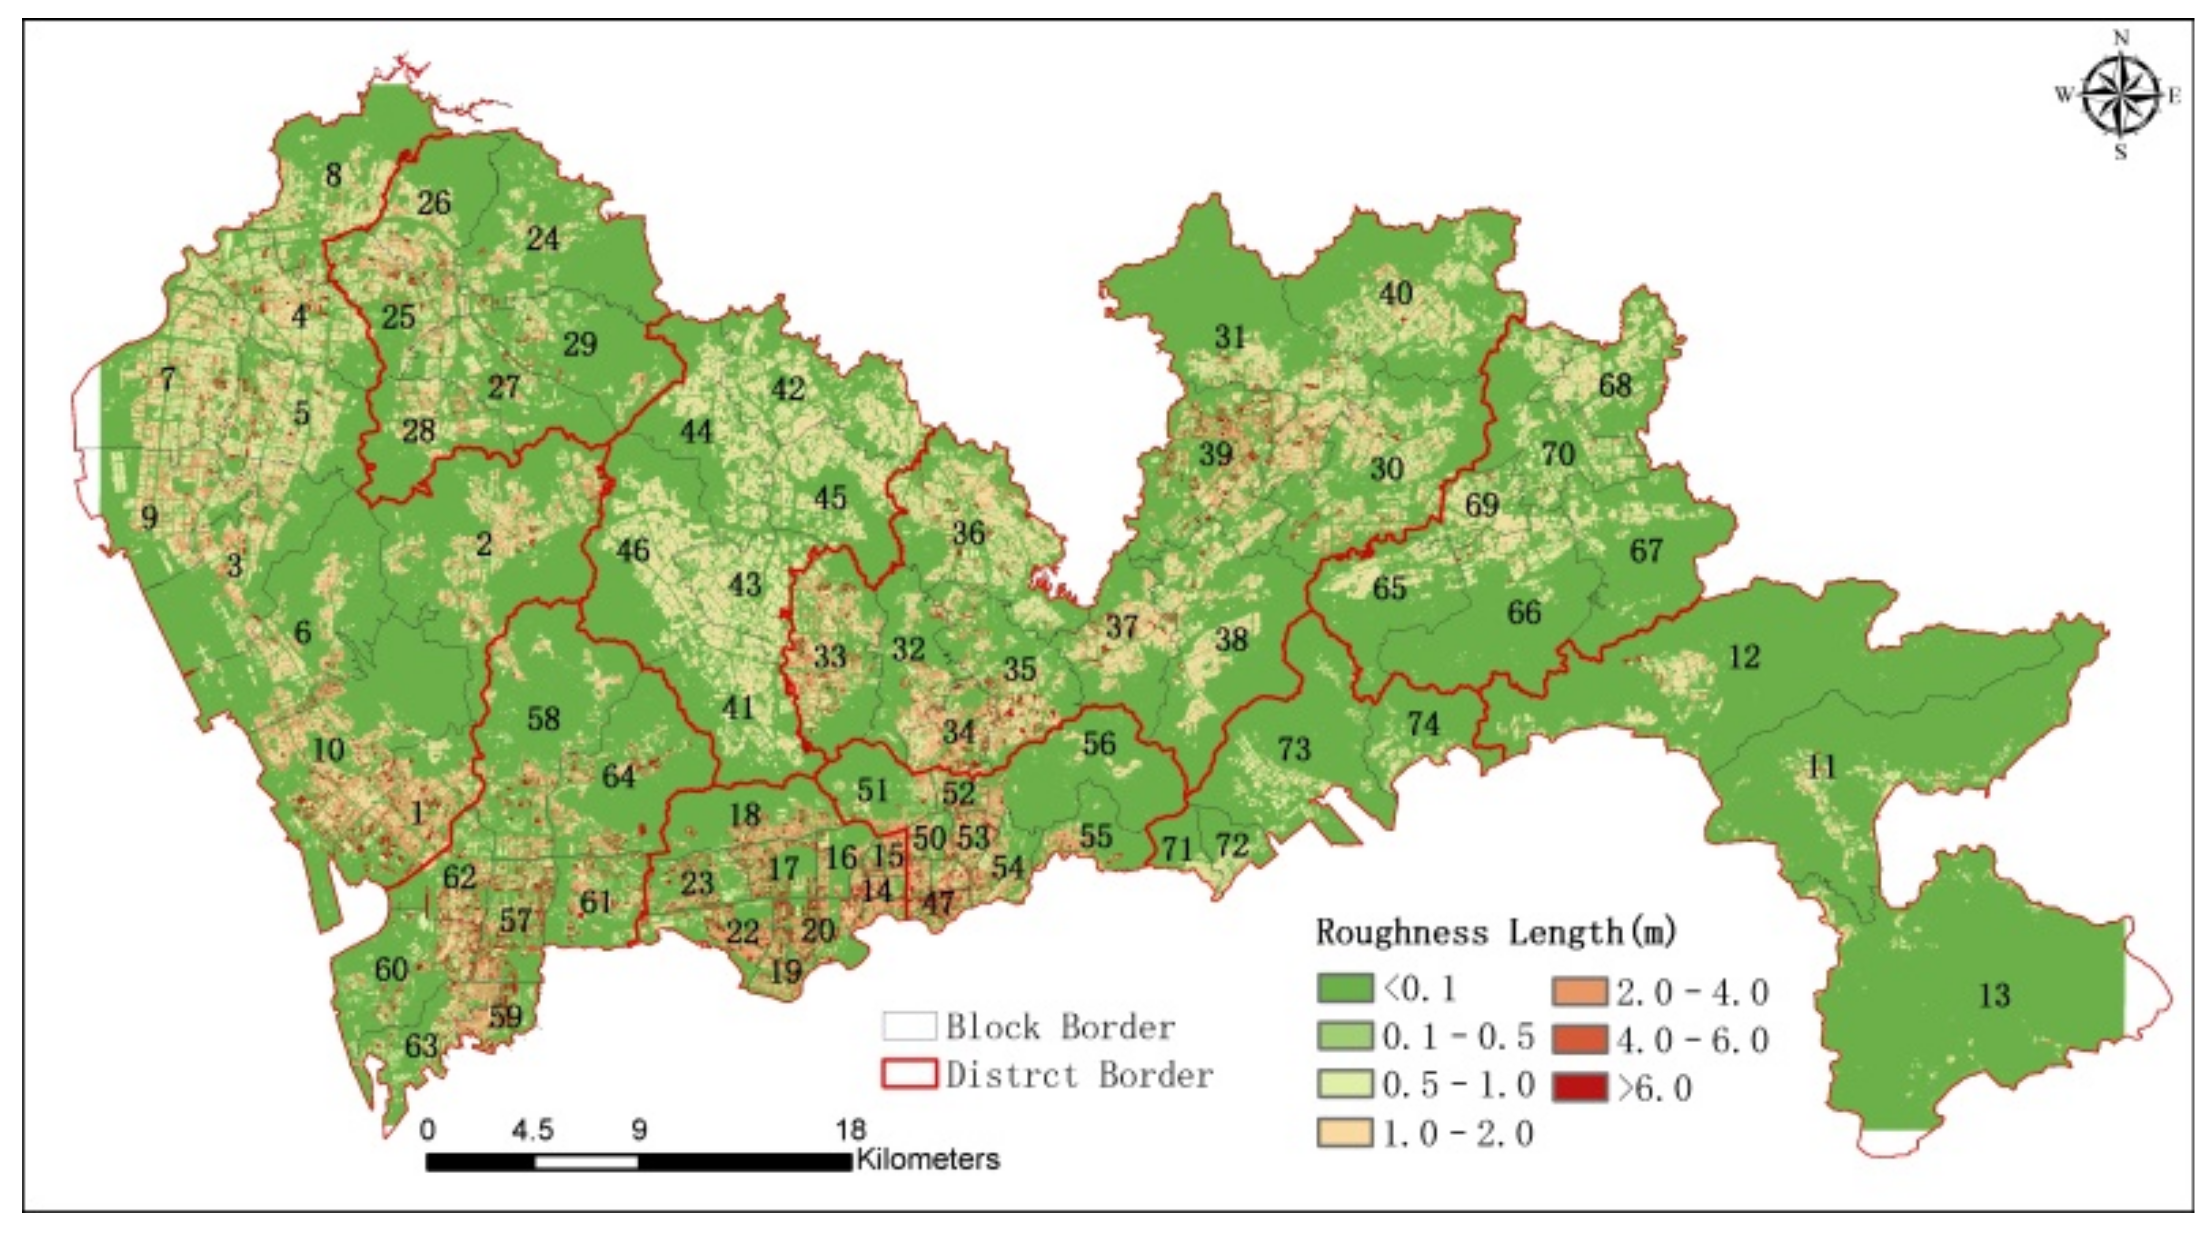
2.3.3. Calculation of Urban Form Parameters
2.3.4. Correlation Analysis between Urban Form and Wind and Thermal Environment
3. Results and Analysis
3.1. Climatic Environmental Analysis
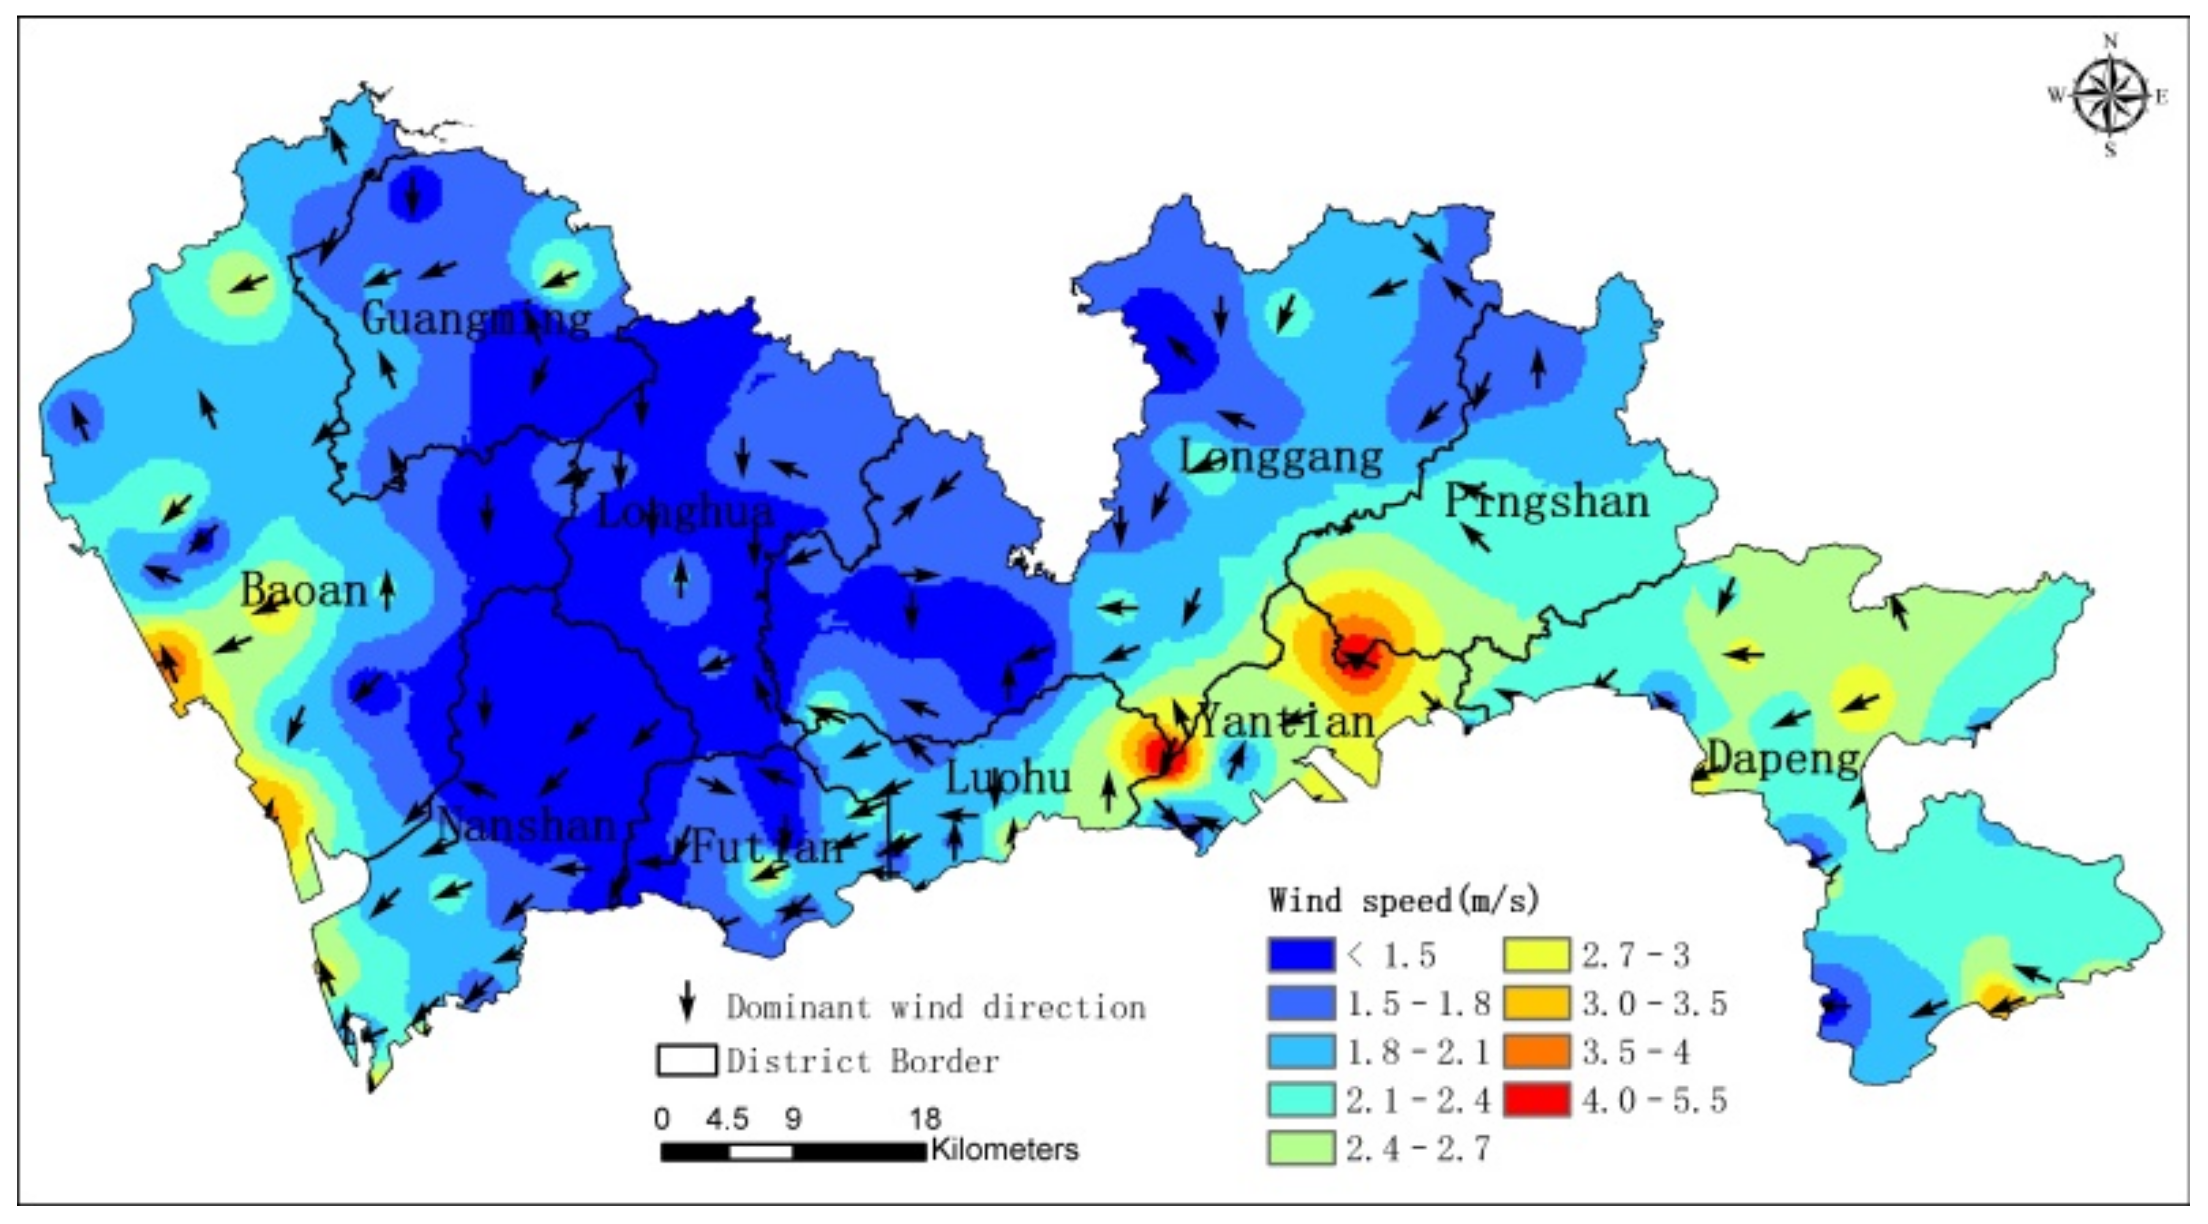
3.1.1. Wind Environment Analysis
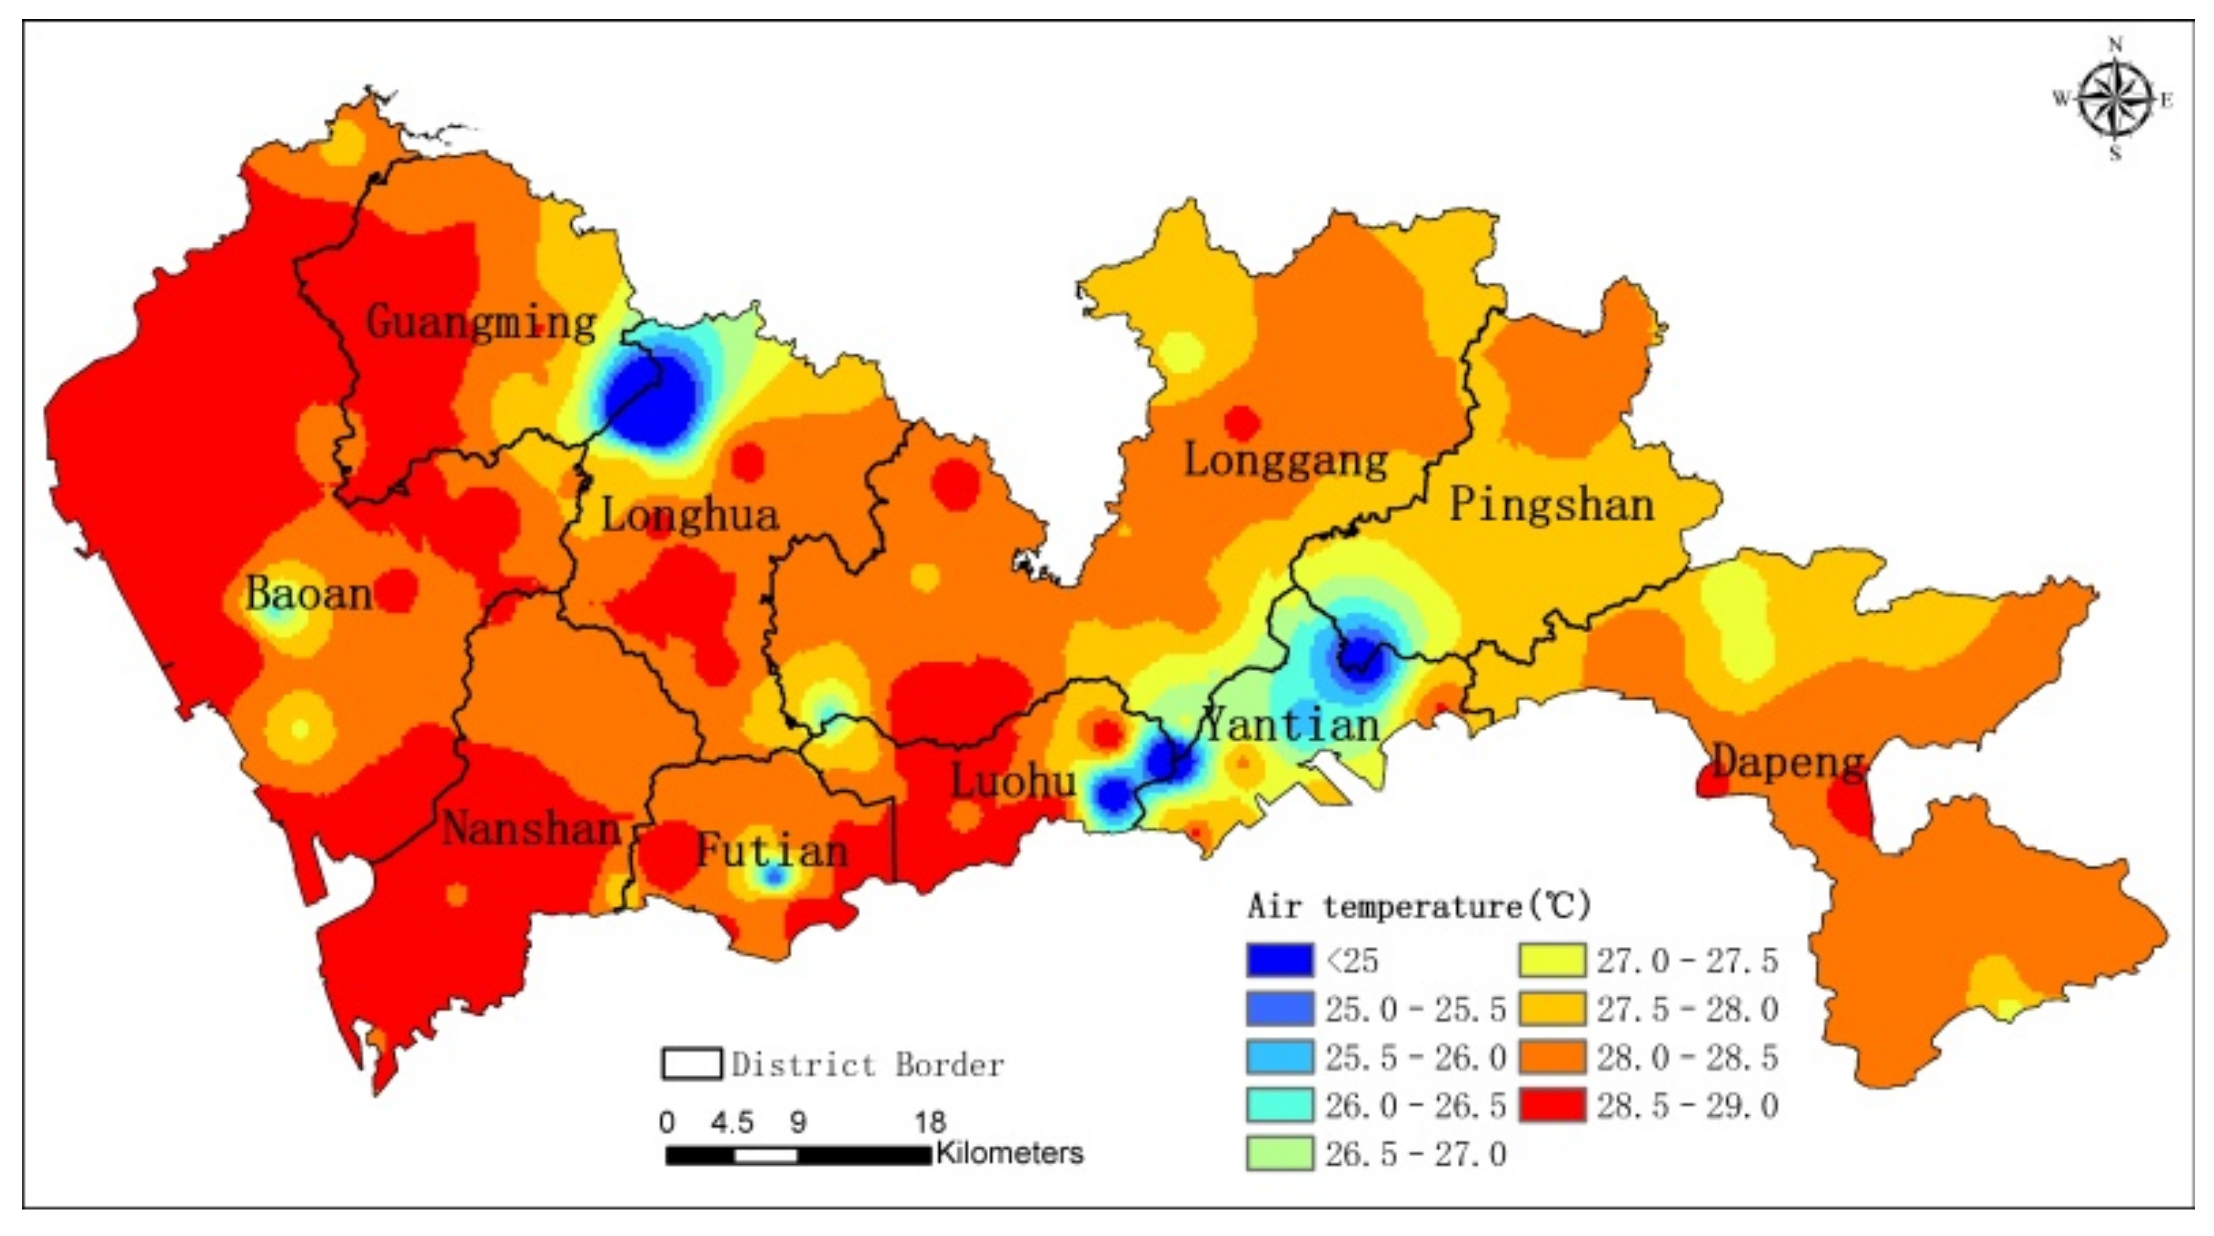
3.1.2. Thermal Environment Analysis
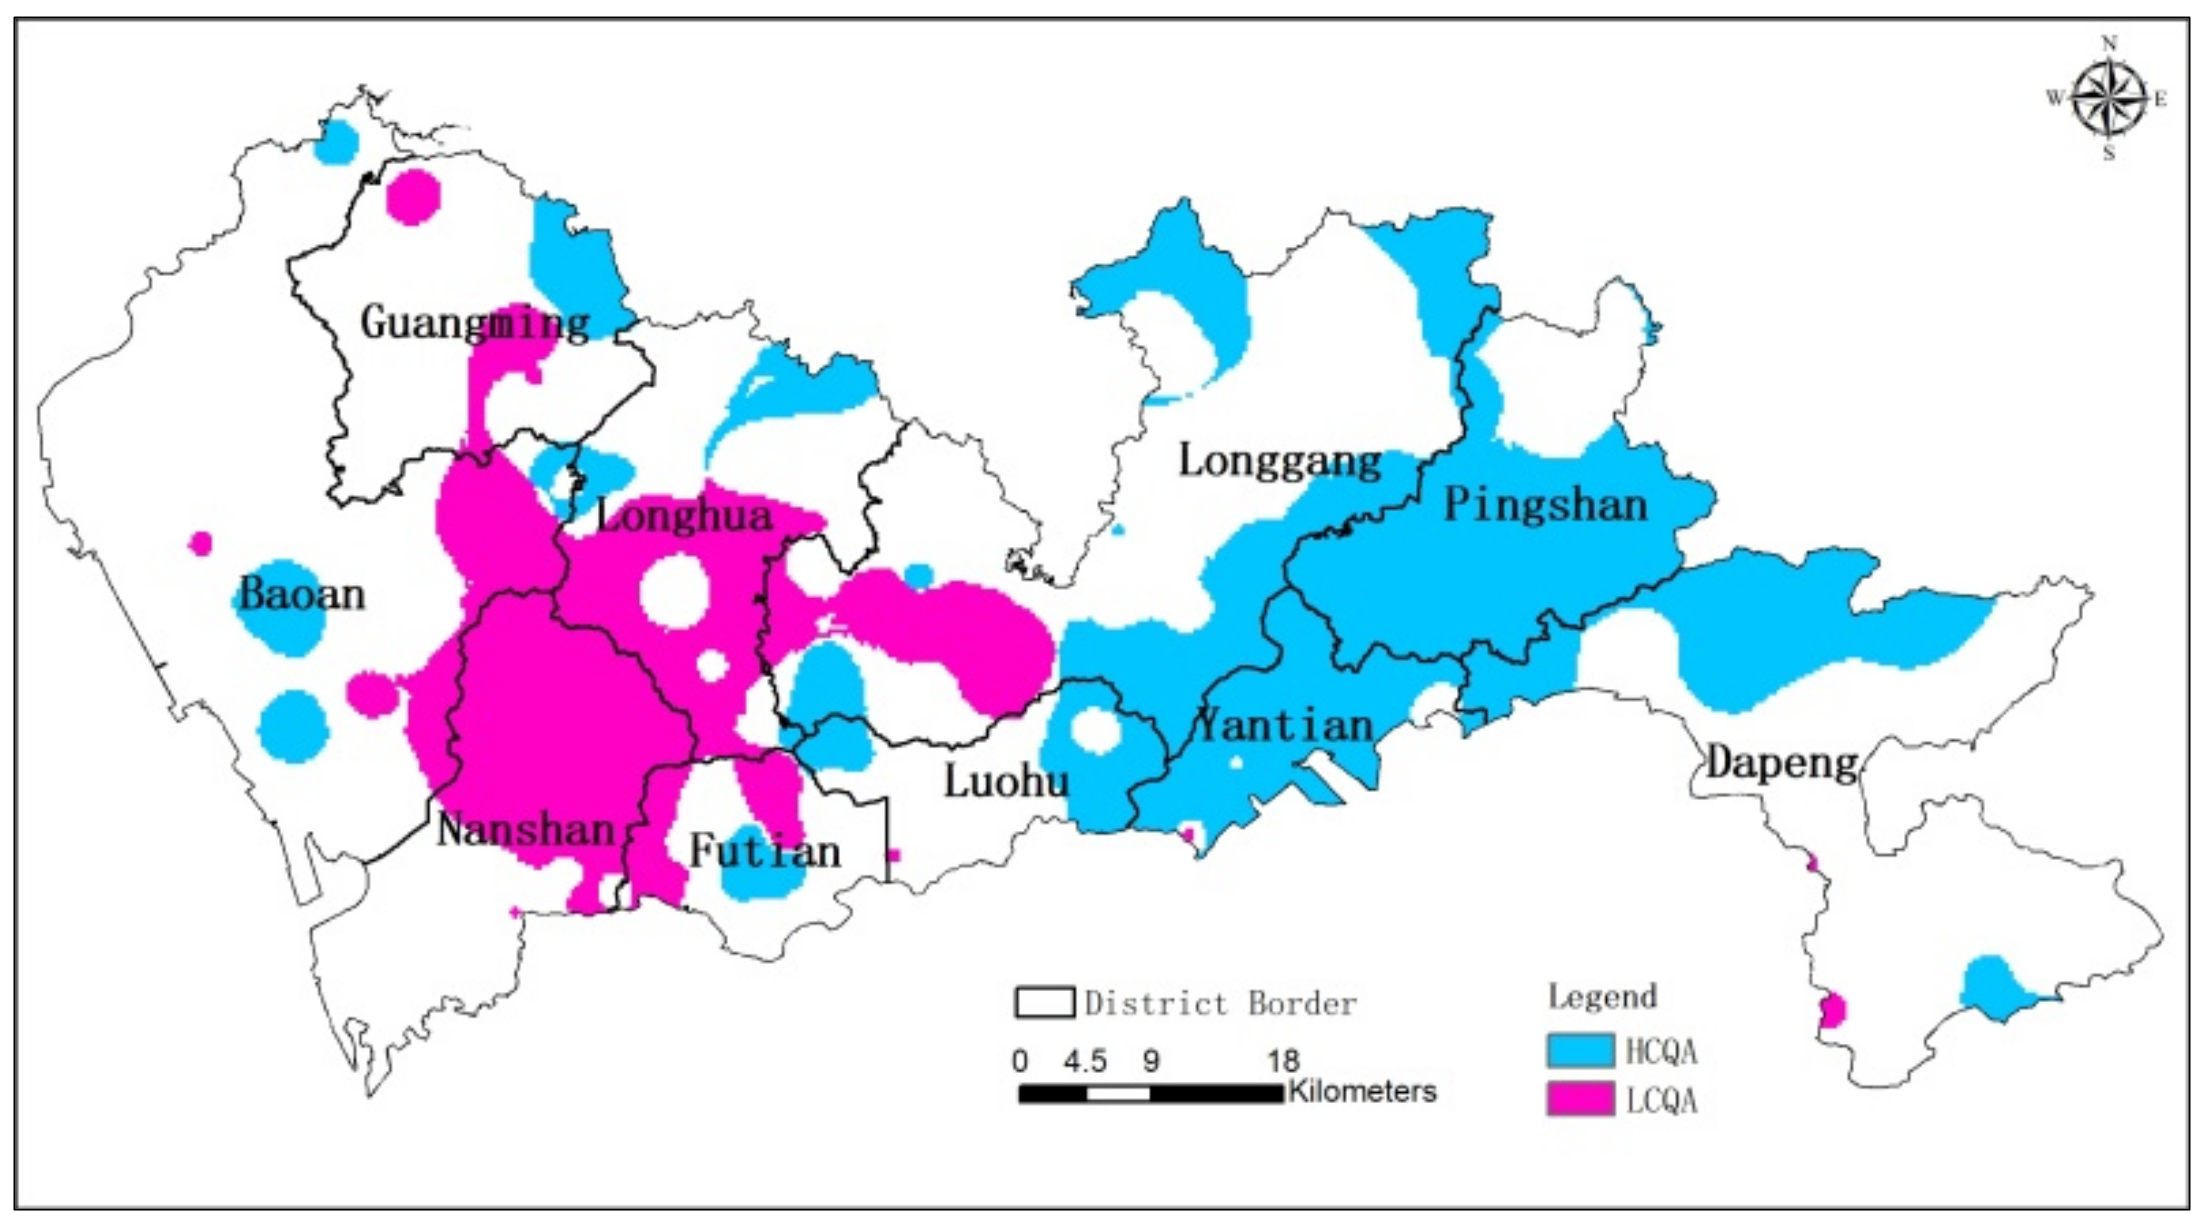
3.1.3. Spatial Distribution of Climate Quality
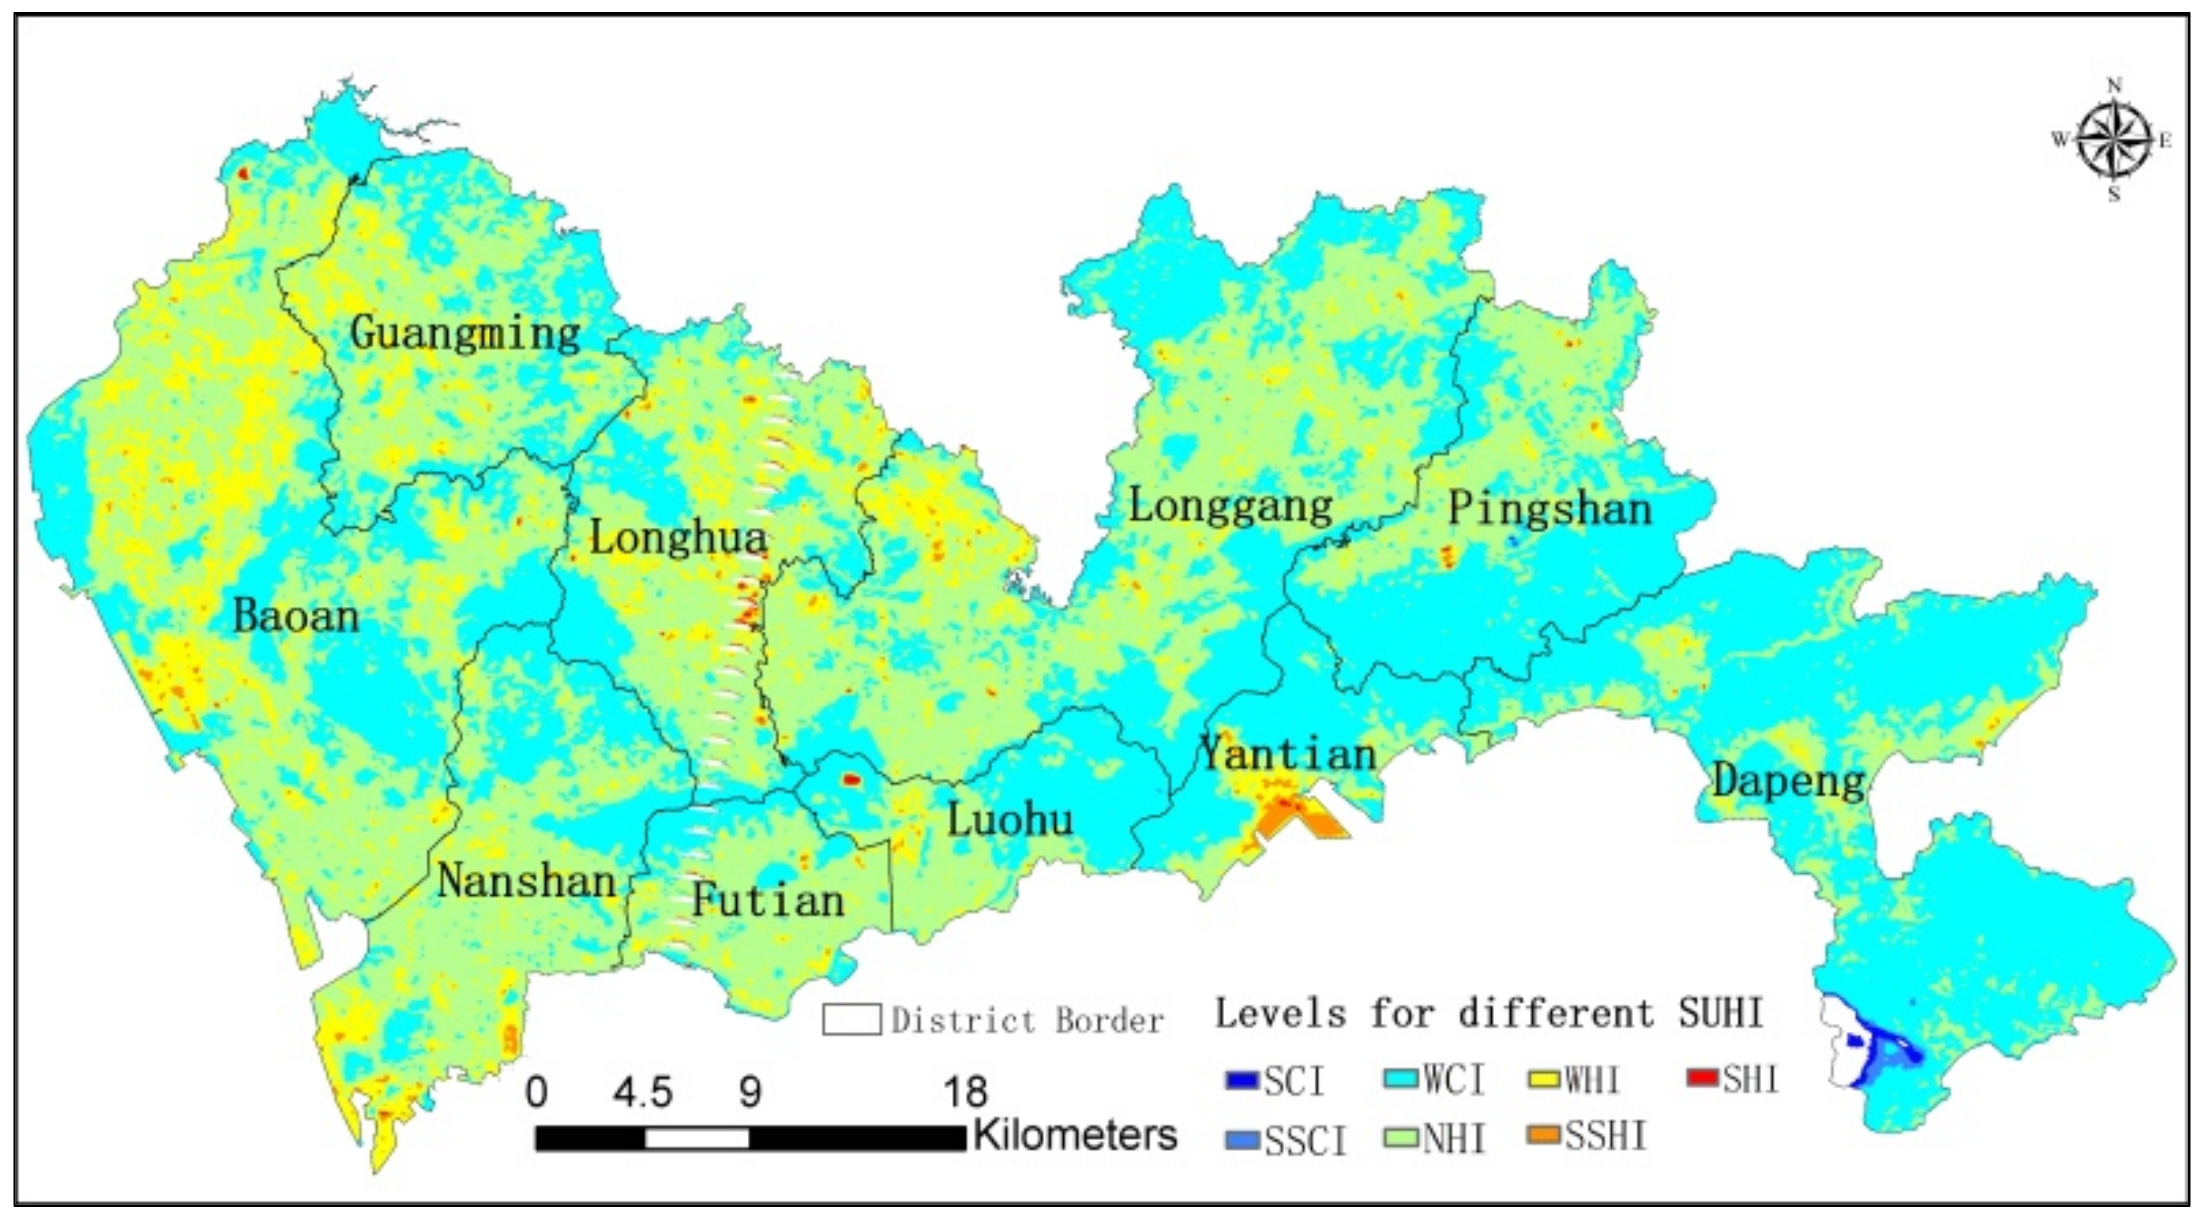
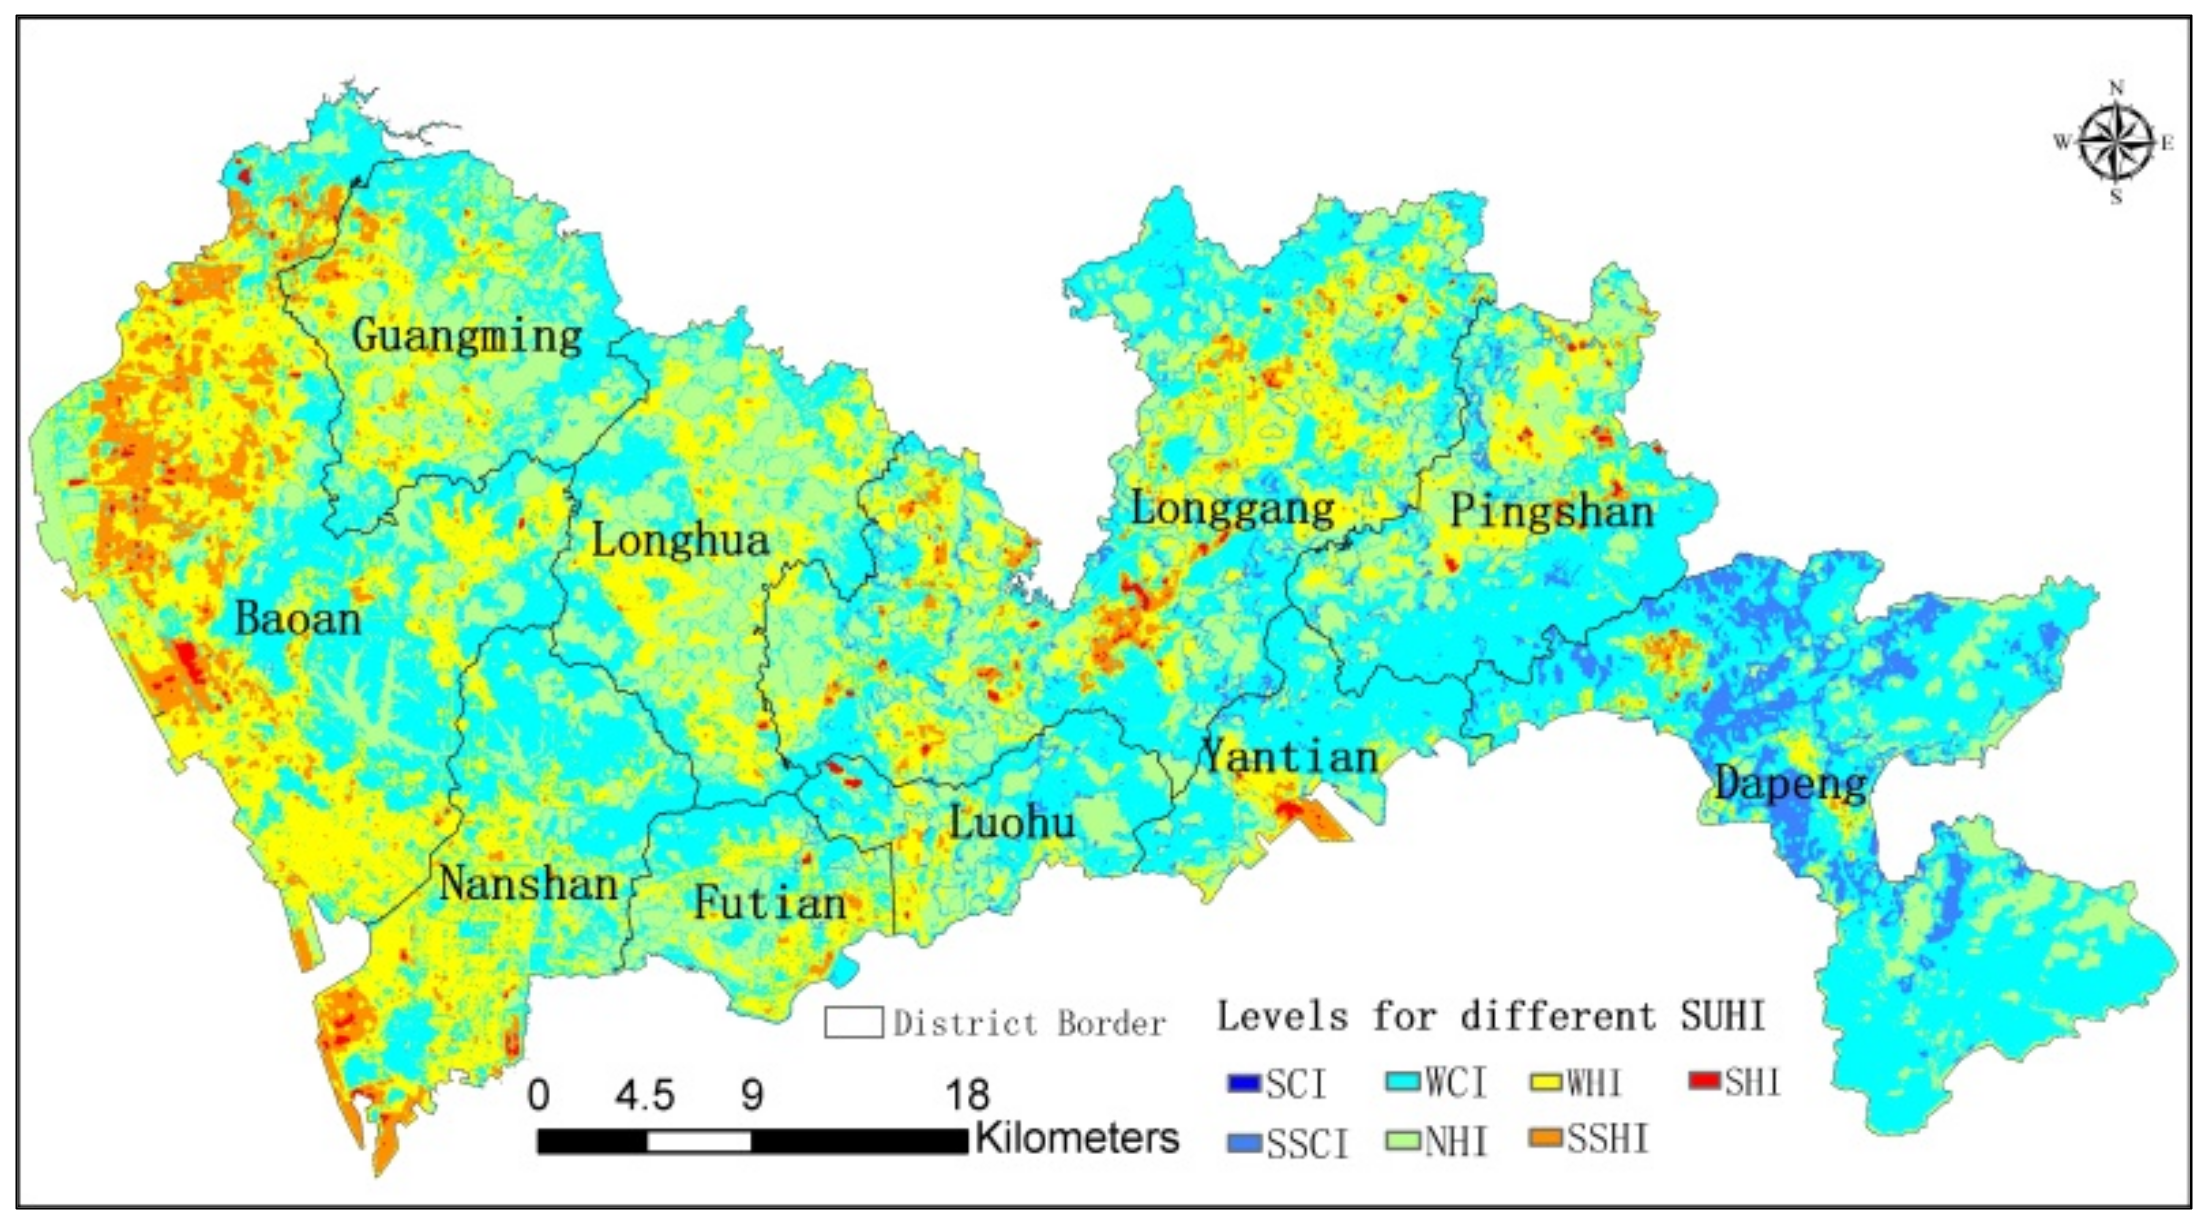
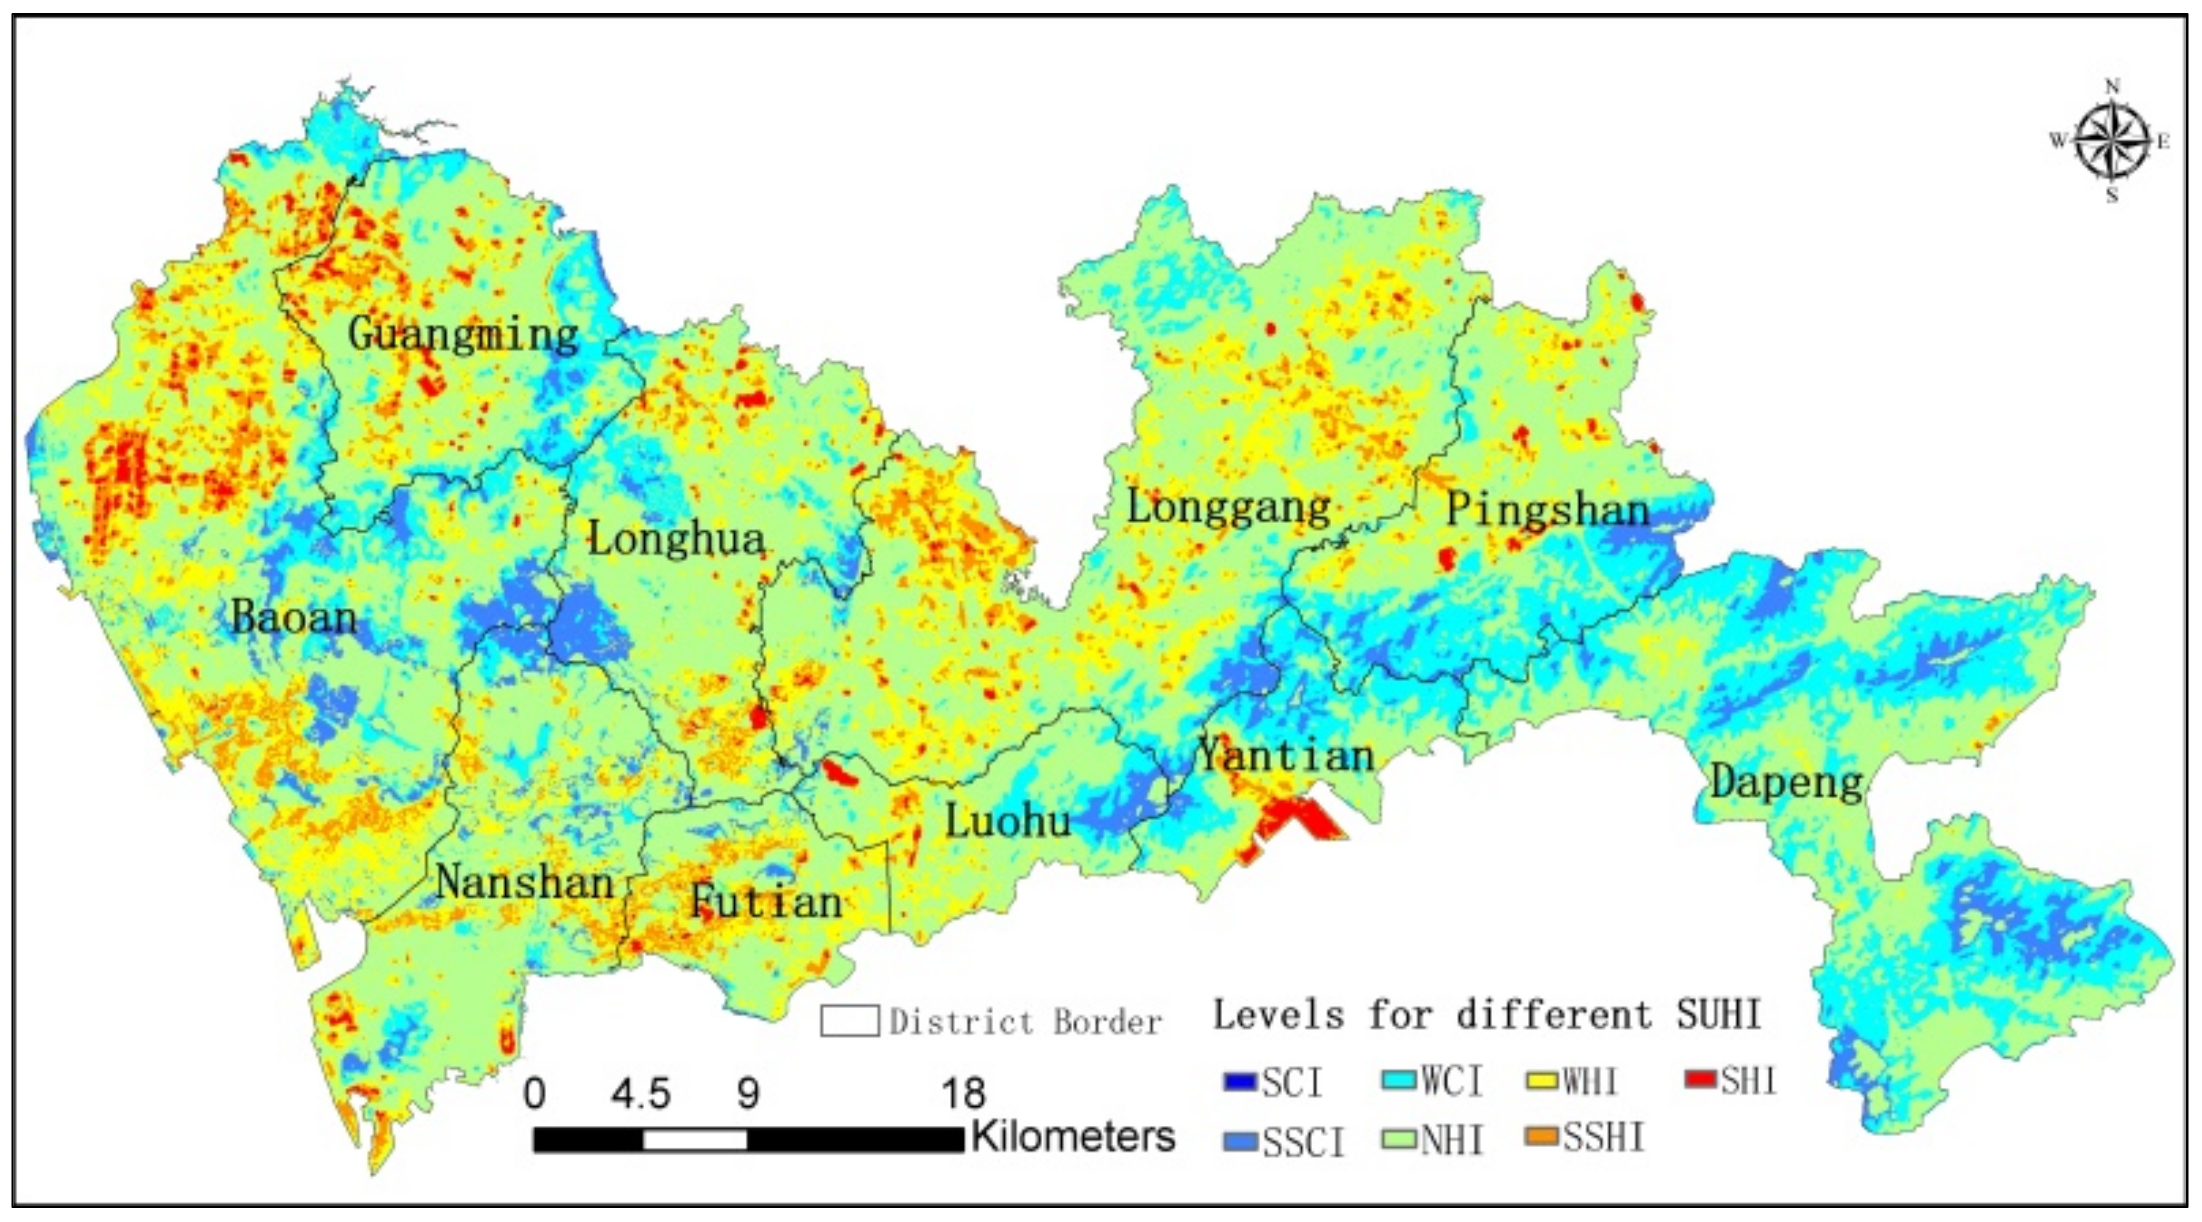
3.2. Urban Heat Island Intensity Distribution
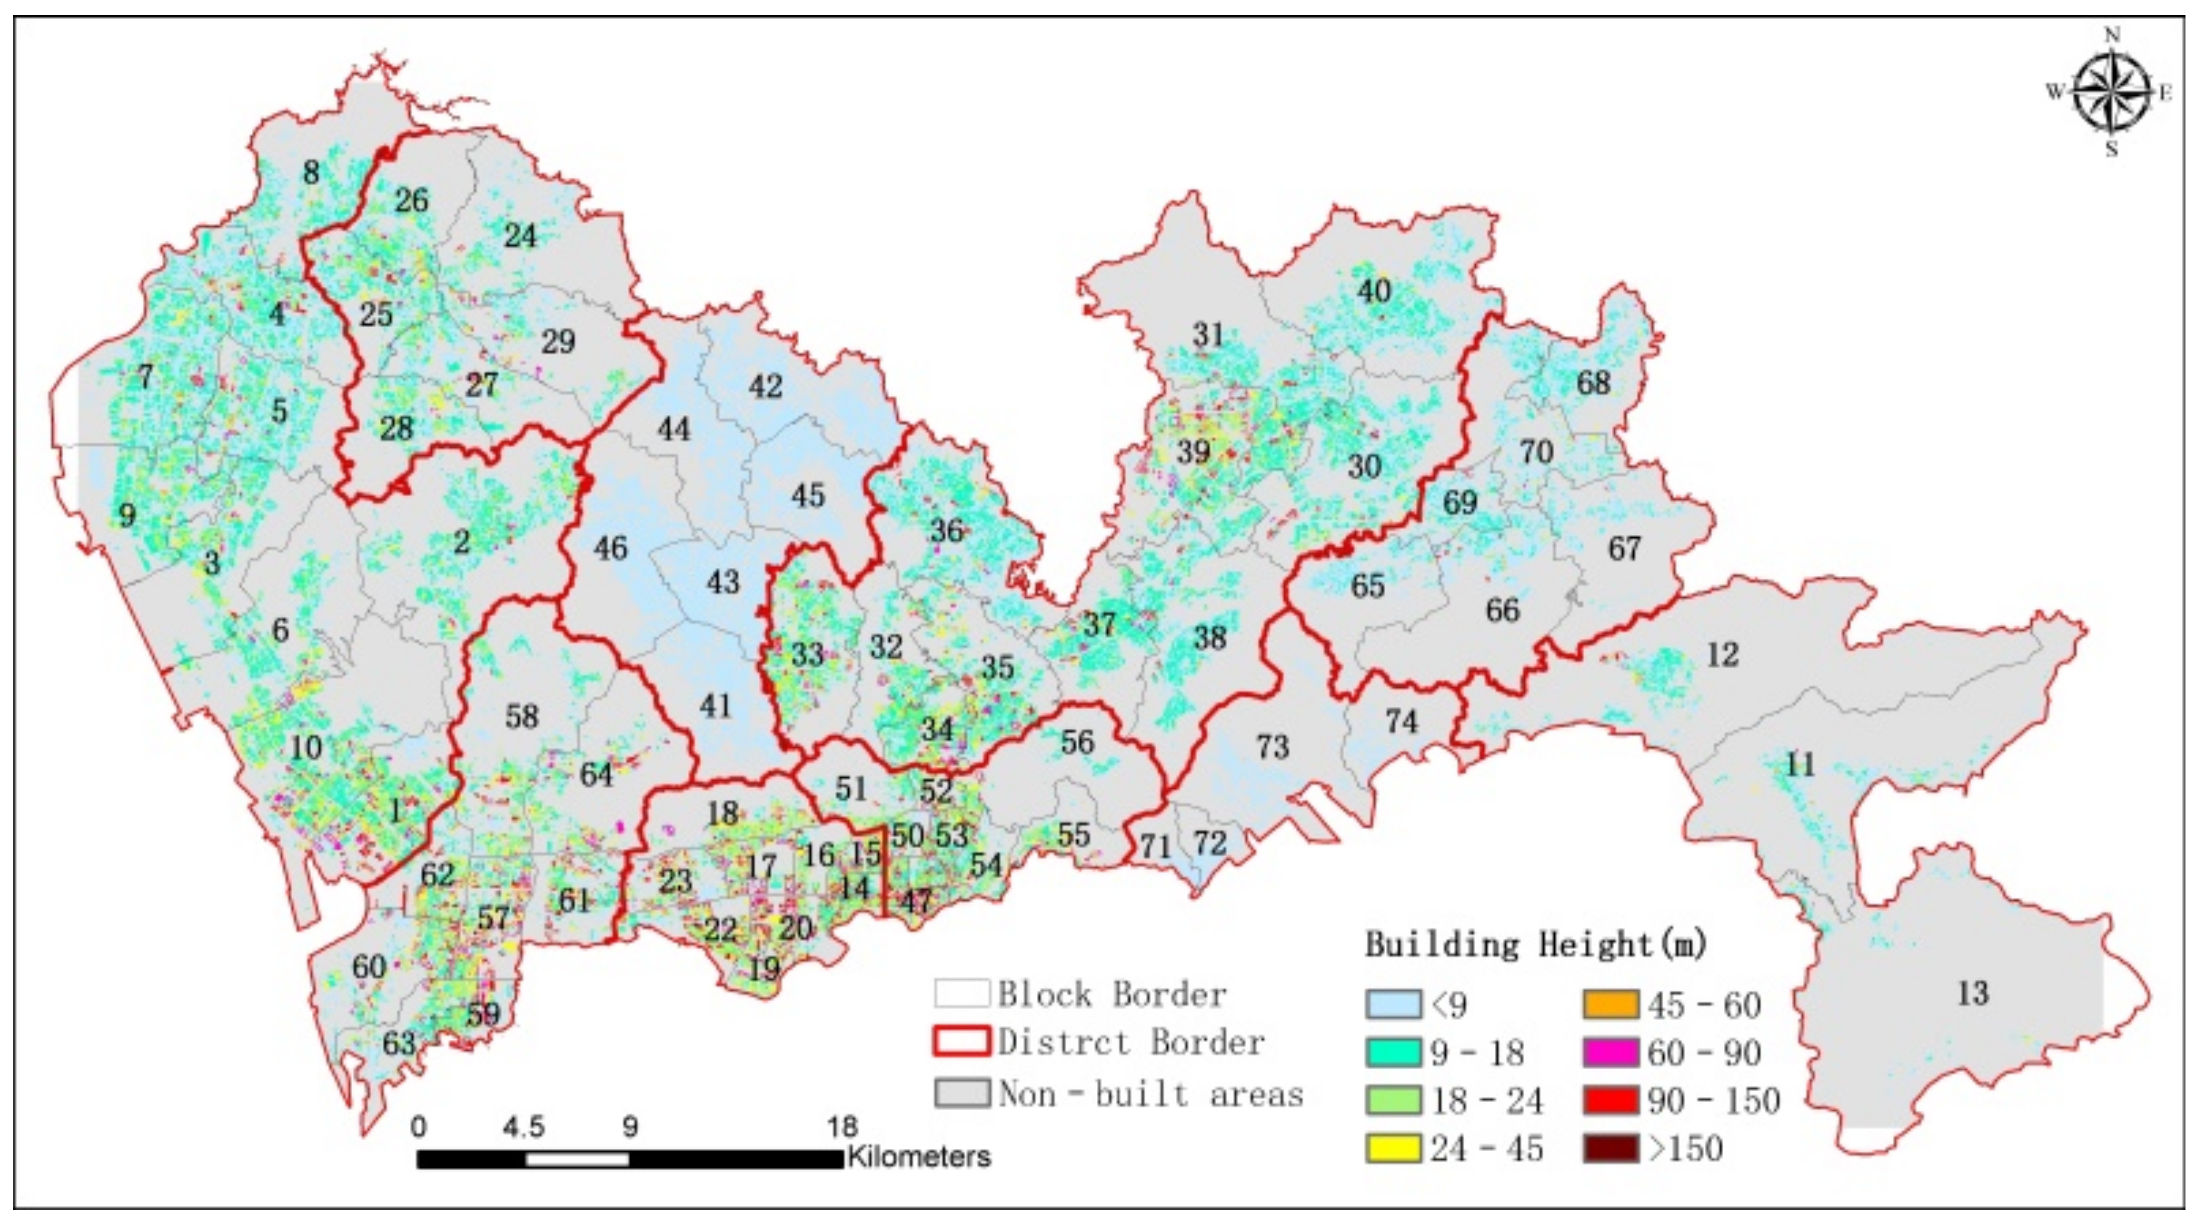
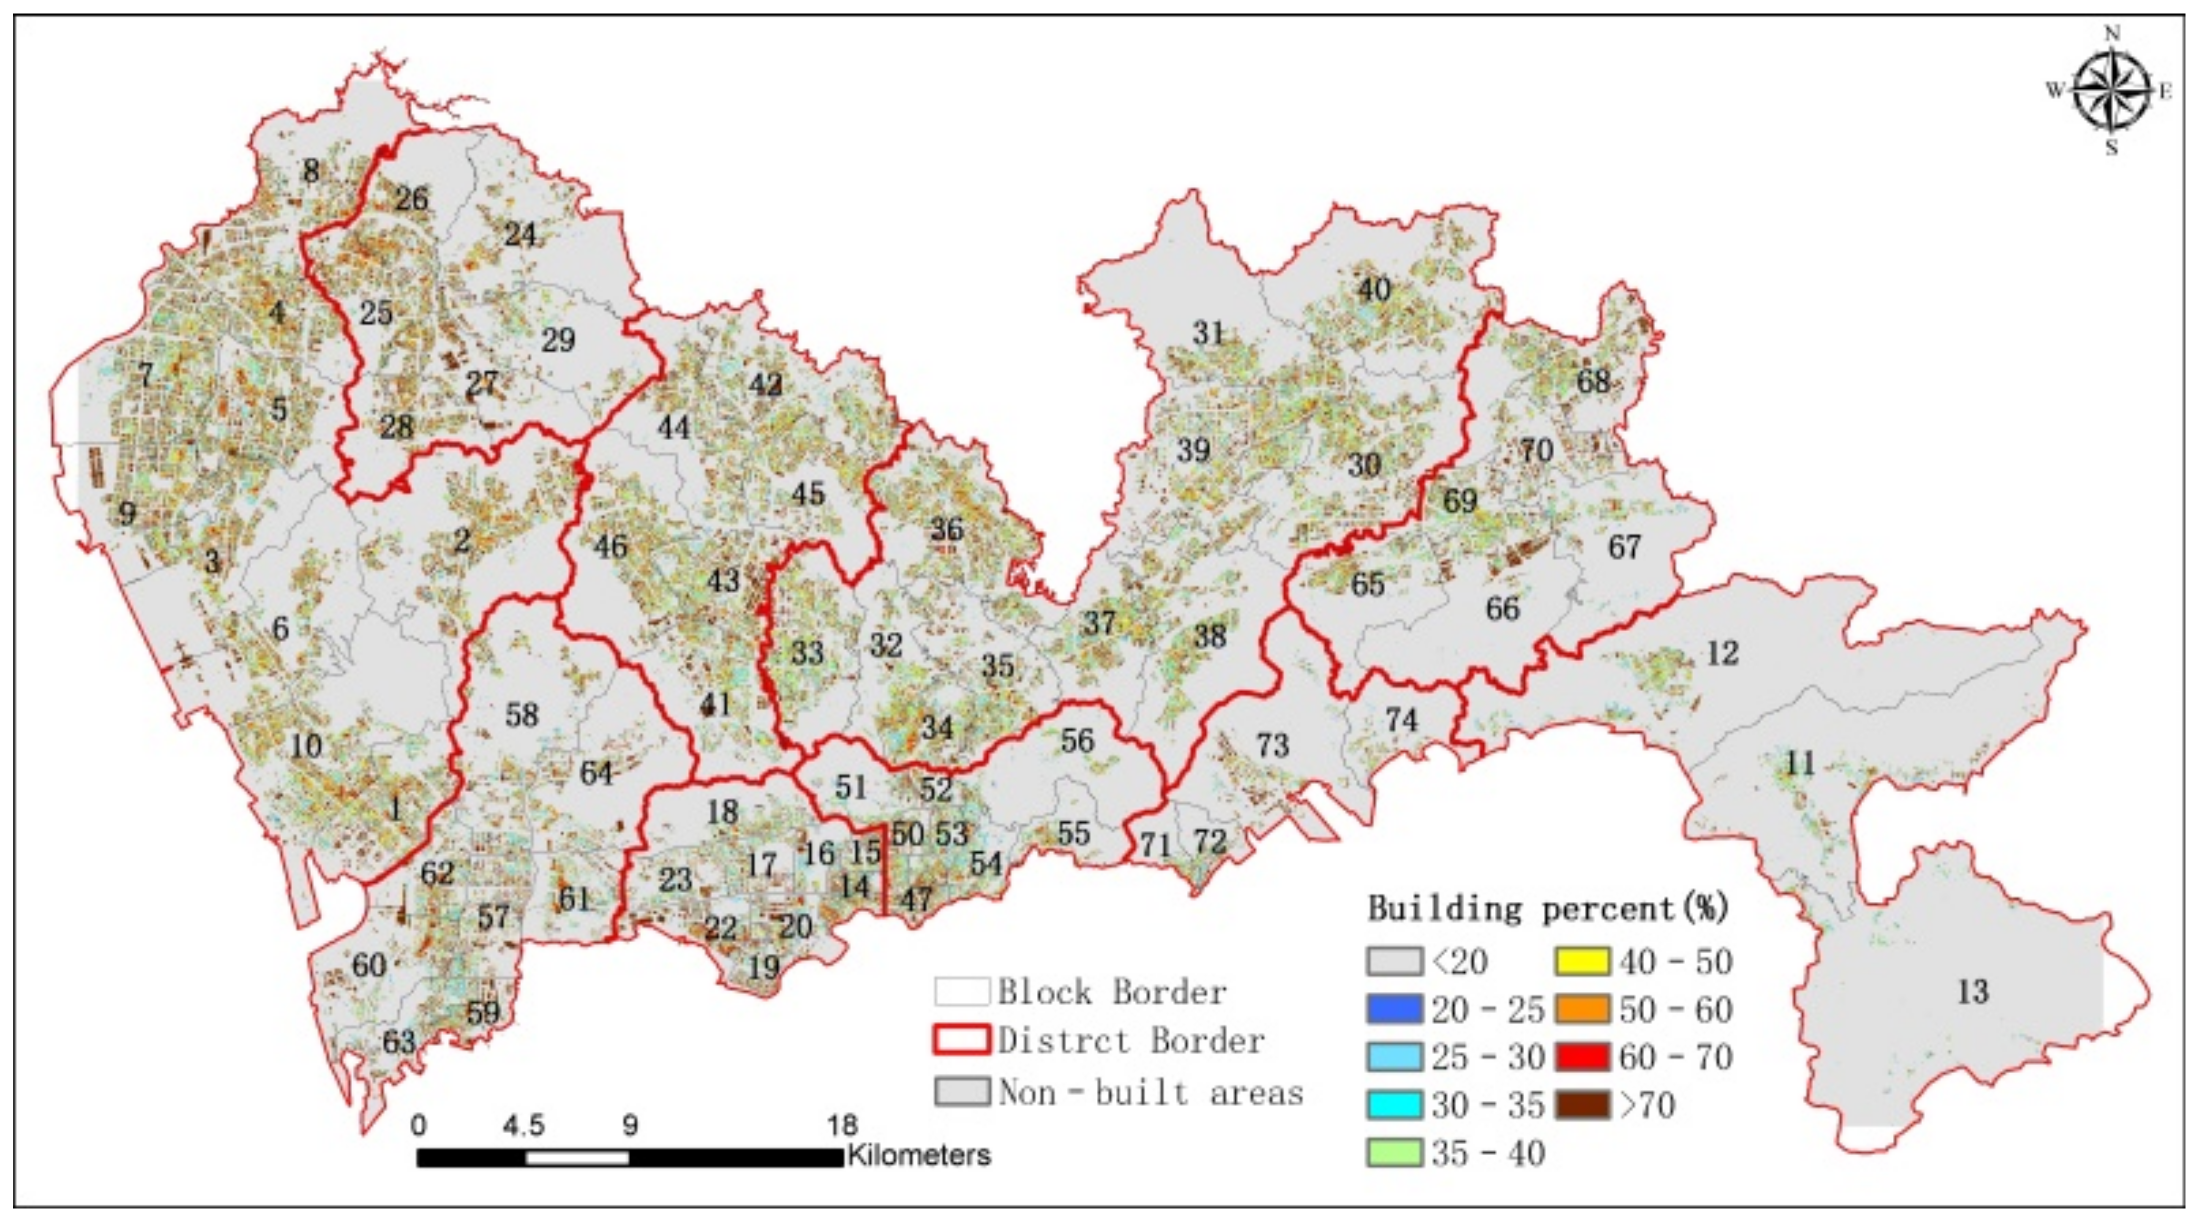
3.3. Analysis of Urban Spatial Morphological Characteristics
3.4. Analysis of the Relationship between Urban Form and Heat Island
3.5. Analysis of the Relationship between Urban Space Form and Ventilation
4. Urban Spatial Wind and Thermal Environment Optimization Strategy
4.1. Thermal Environment Optimization Strategy
4.2. Wind Environment Optimization Strategy
5. Conclusions and Limitation
5.1. Conclusions
- (1)
- The Yantian, Pingshan, and Dapeng Districts have high wind speed and low temperature, which makes these areas more comfortable and easily ventilated. The climate quality is high. The southern part of Longhua District, the western part of Longgang District, and the northern part of Nanshan District have low wind speed and high temperature, and the climate quality is low. Judging from the spatial distribution of heat island intensity over the years, we saw that the heat island effect of Shenzhen has increased and expanded. The overall shape of the urban layout in Shenzhen is long and narrow in the east–west direction and short in the north–south direction, which can easily hinder the dominant wind, and is not conducive to the downstream transport of climate resources.
- (2)
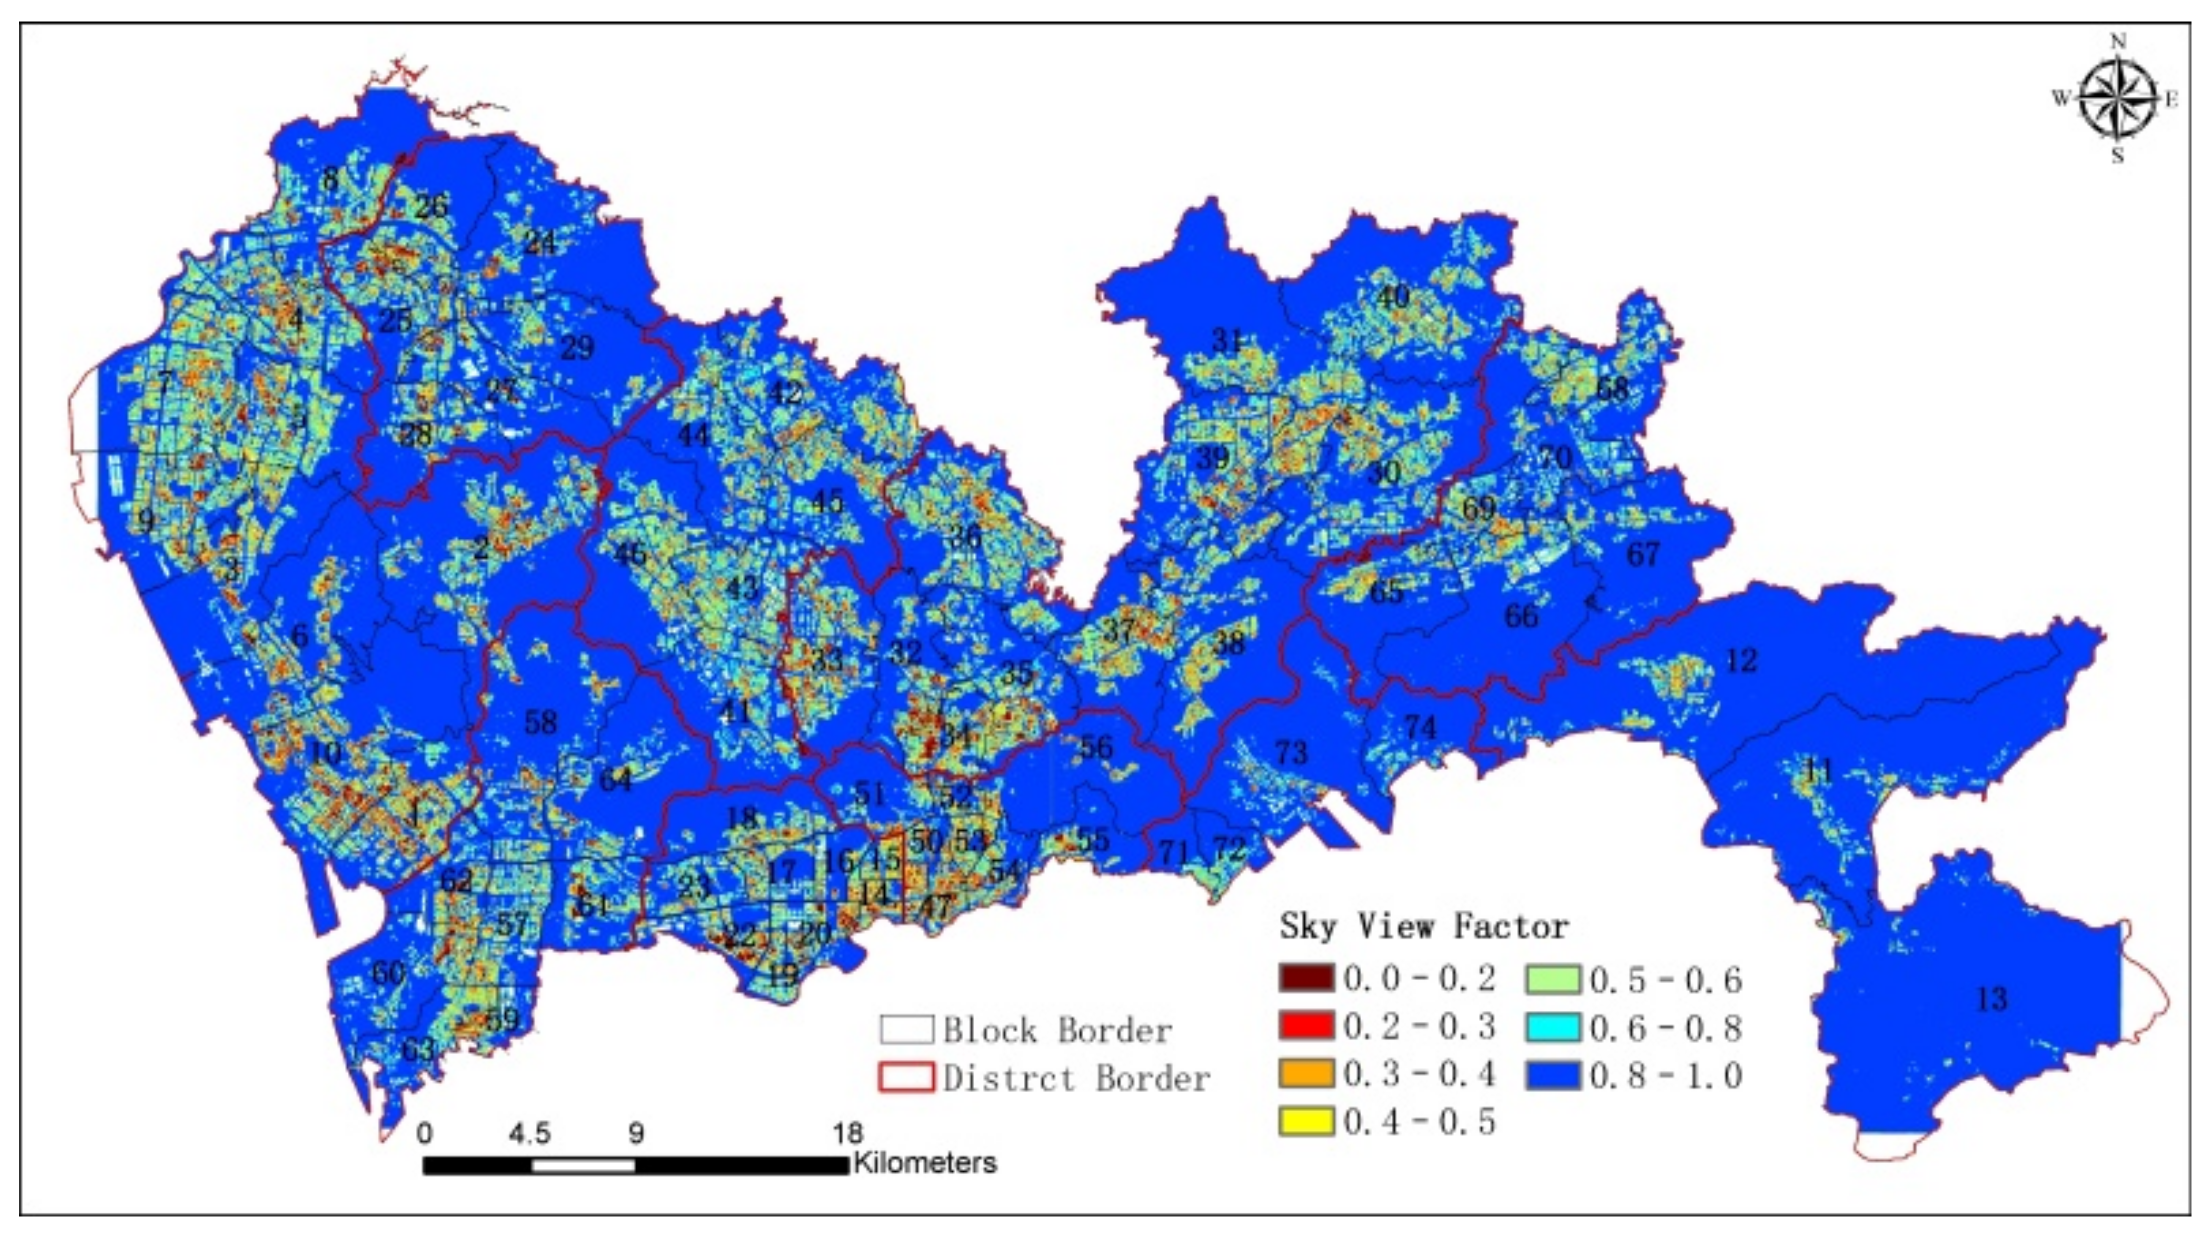
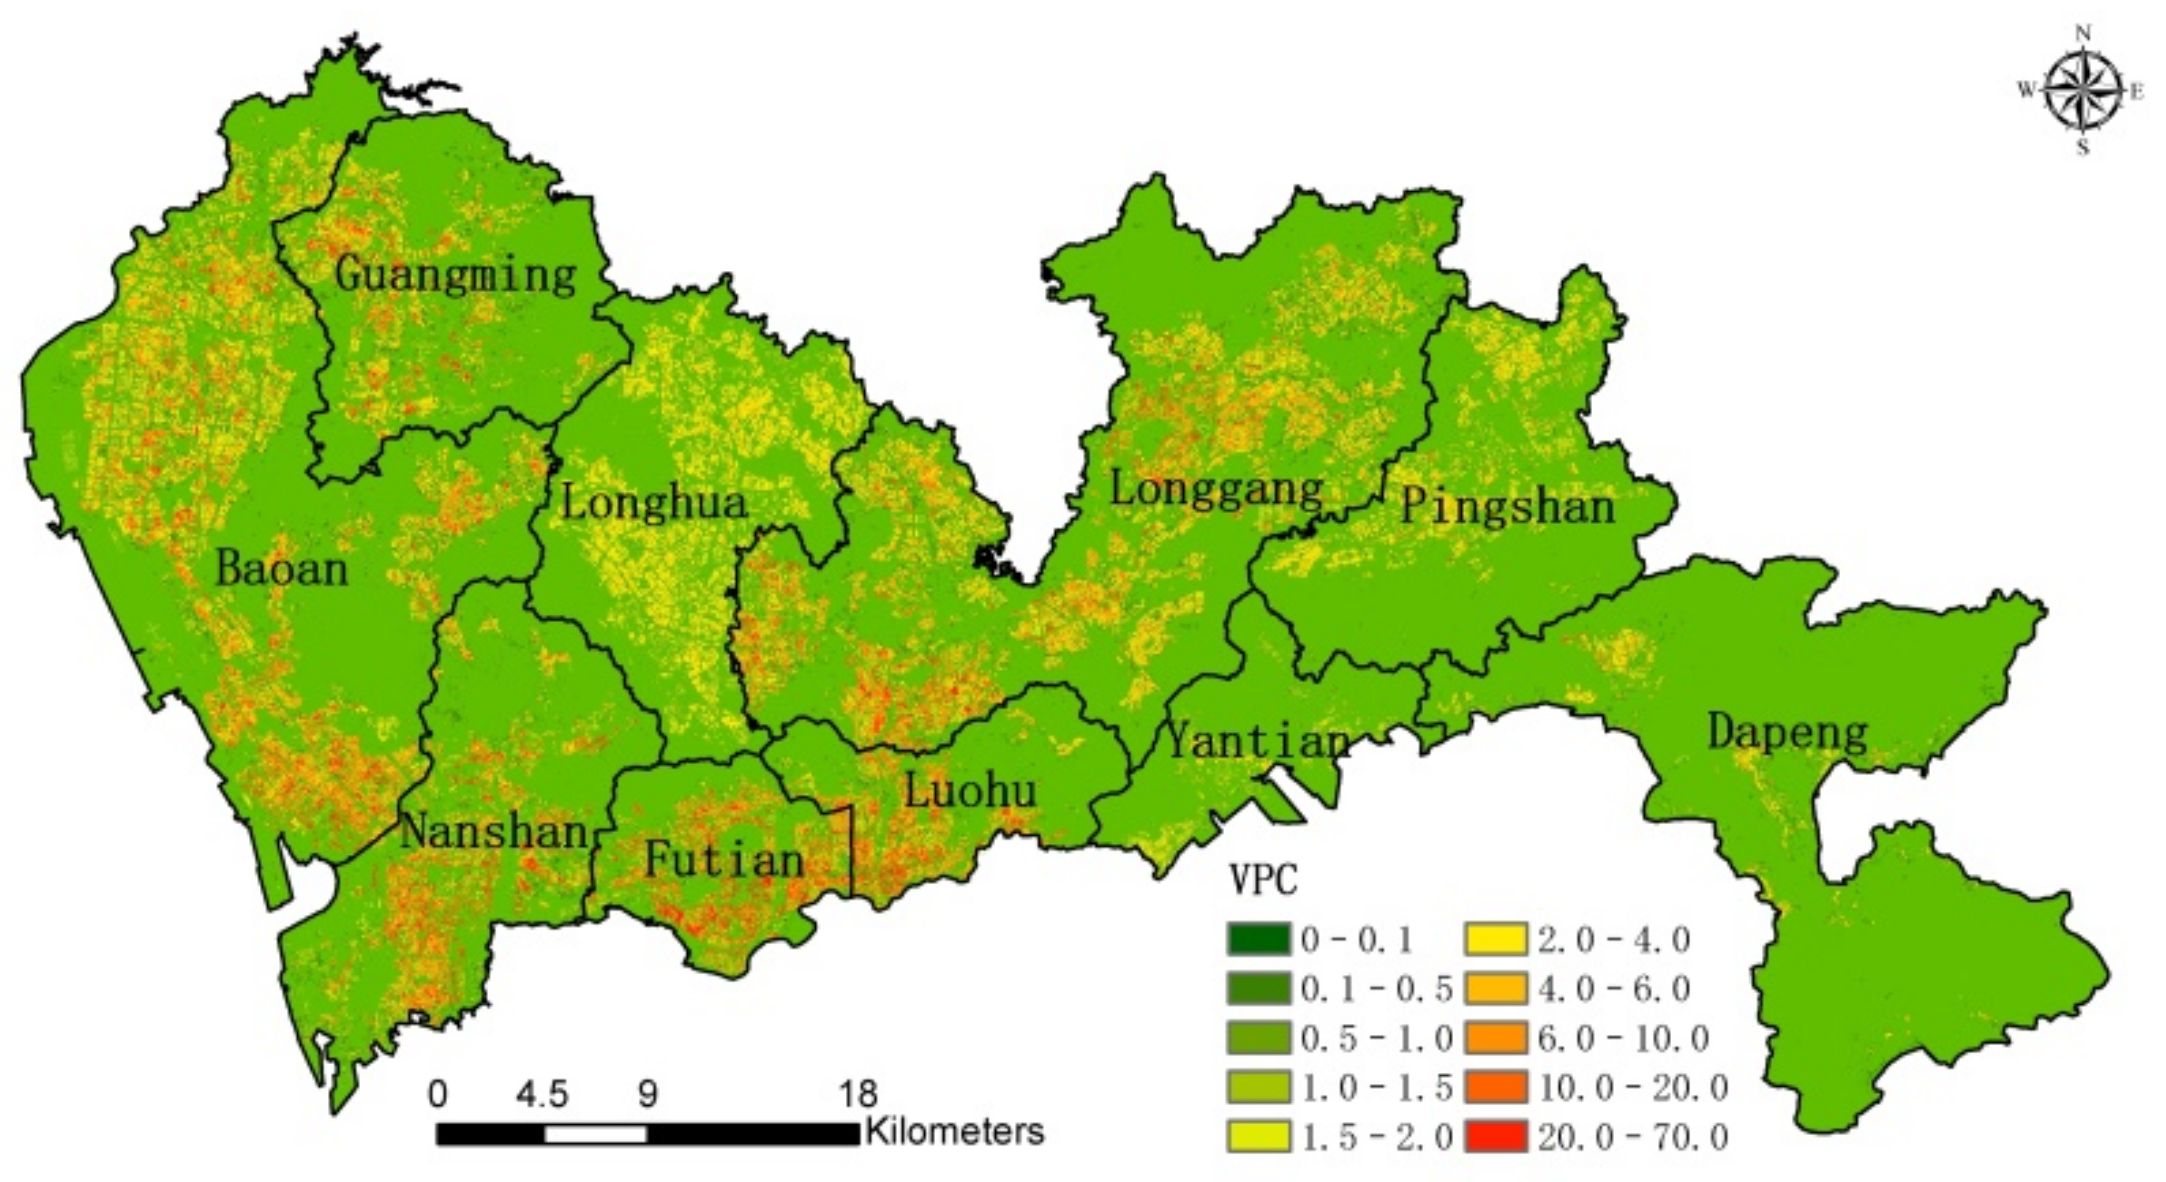
- Research on the correlation between urban form and SUHI in Shenzhen shows that the building density parameter has a significant positive correlation with SUHI, with a correlation coefficient of 0.446. In addition, SVF has a significant negative correlation with SUHI, with a correlation coefficient of −0.553, and BH and RL have correlation coefficients of 0.535 and 0.545, respectively, with VPC.
- (3)
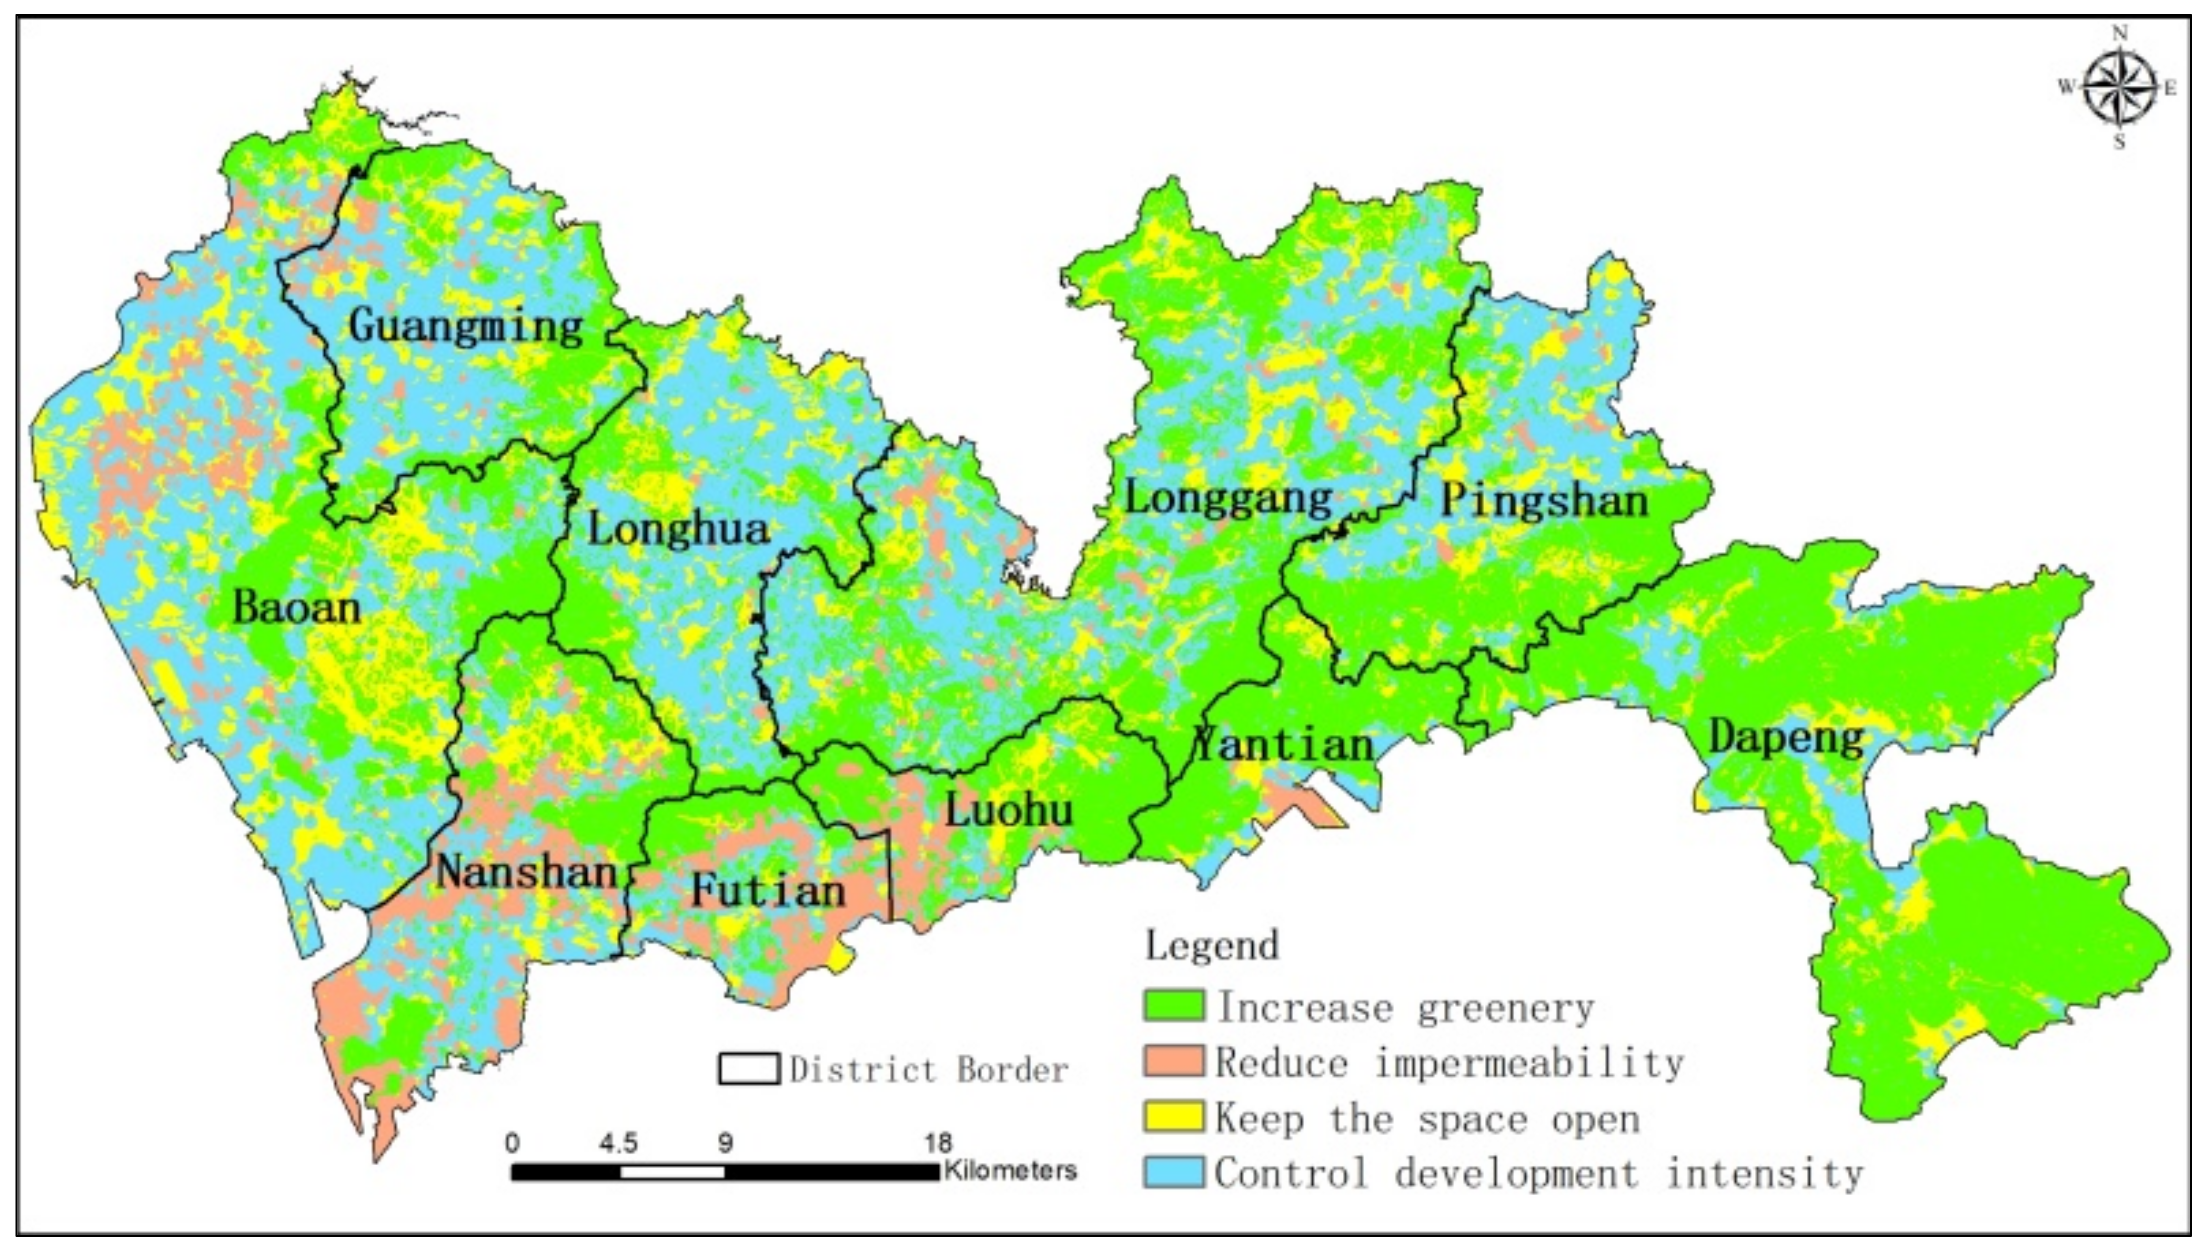
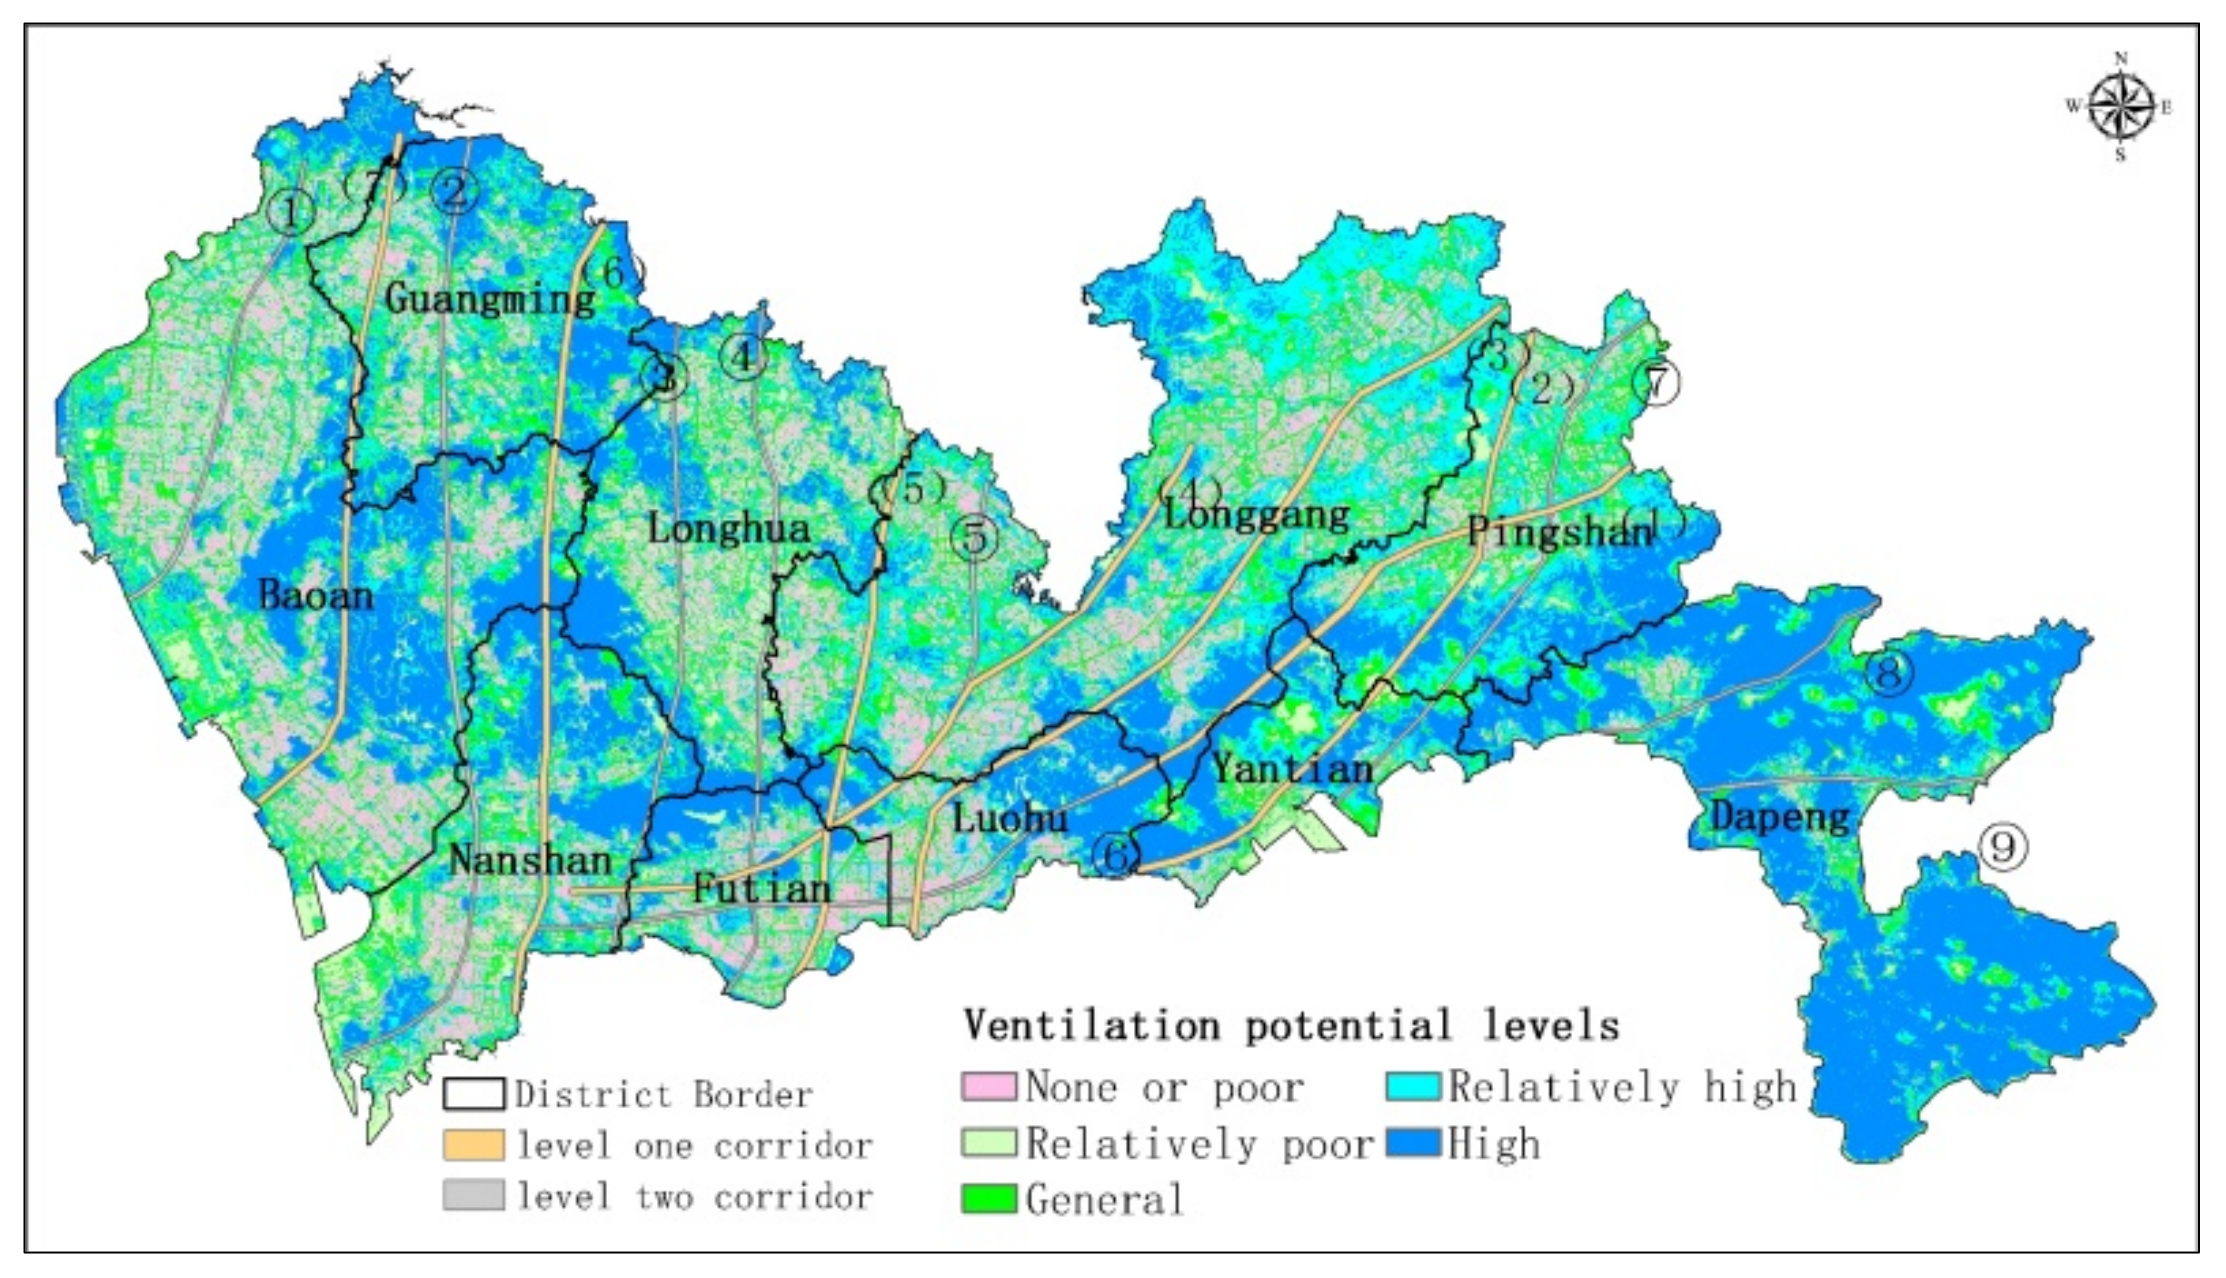
- Combining the background wind environment, surface ventilation potential distribution, and heat island intensity assessment, we provided strategies and suggestions for optimizing the thermal and ventilation environment. Seven level one corridors and nine level two corridors will help mitigate the heat island effect and enhance air circulation.
5.2. Limitation
- (1)
- The wind and heat environment of high-density cities is affected by the urban climate, urban space form, greening environment, and other factors. This study only discussed the planning method and strategy of urban wind and heat environment optimization from the perspective of urban space form, which has certain limitations.
- (2)
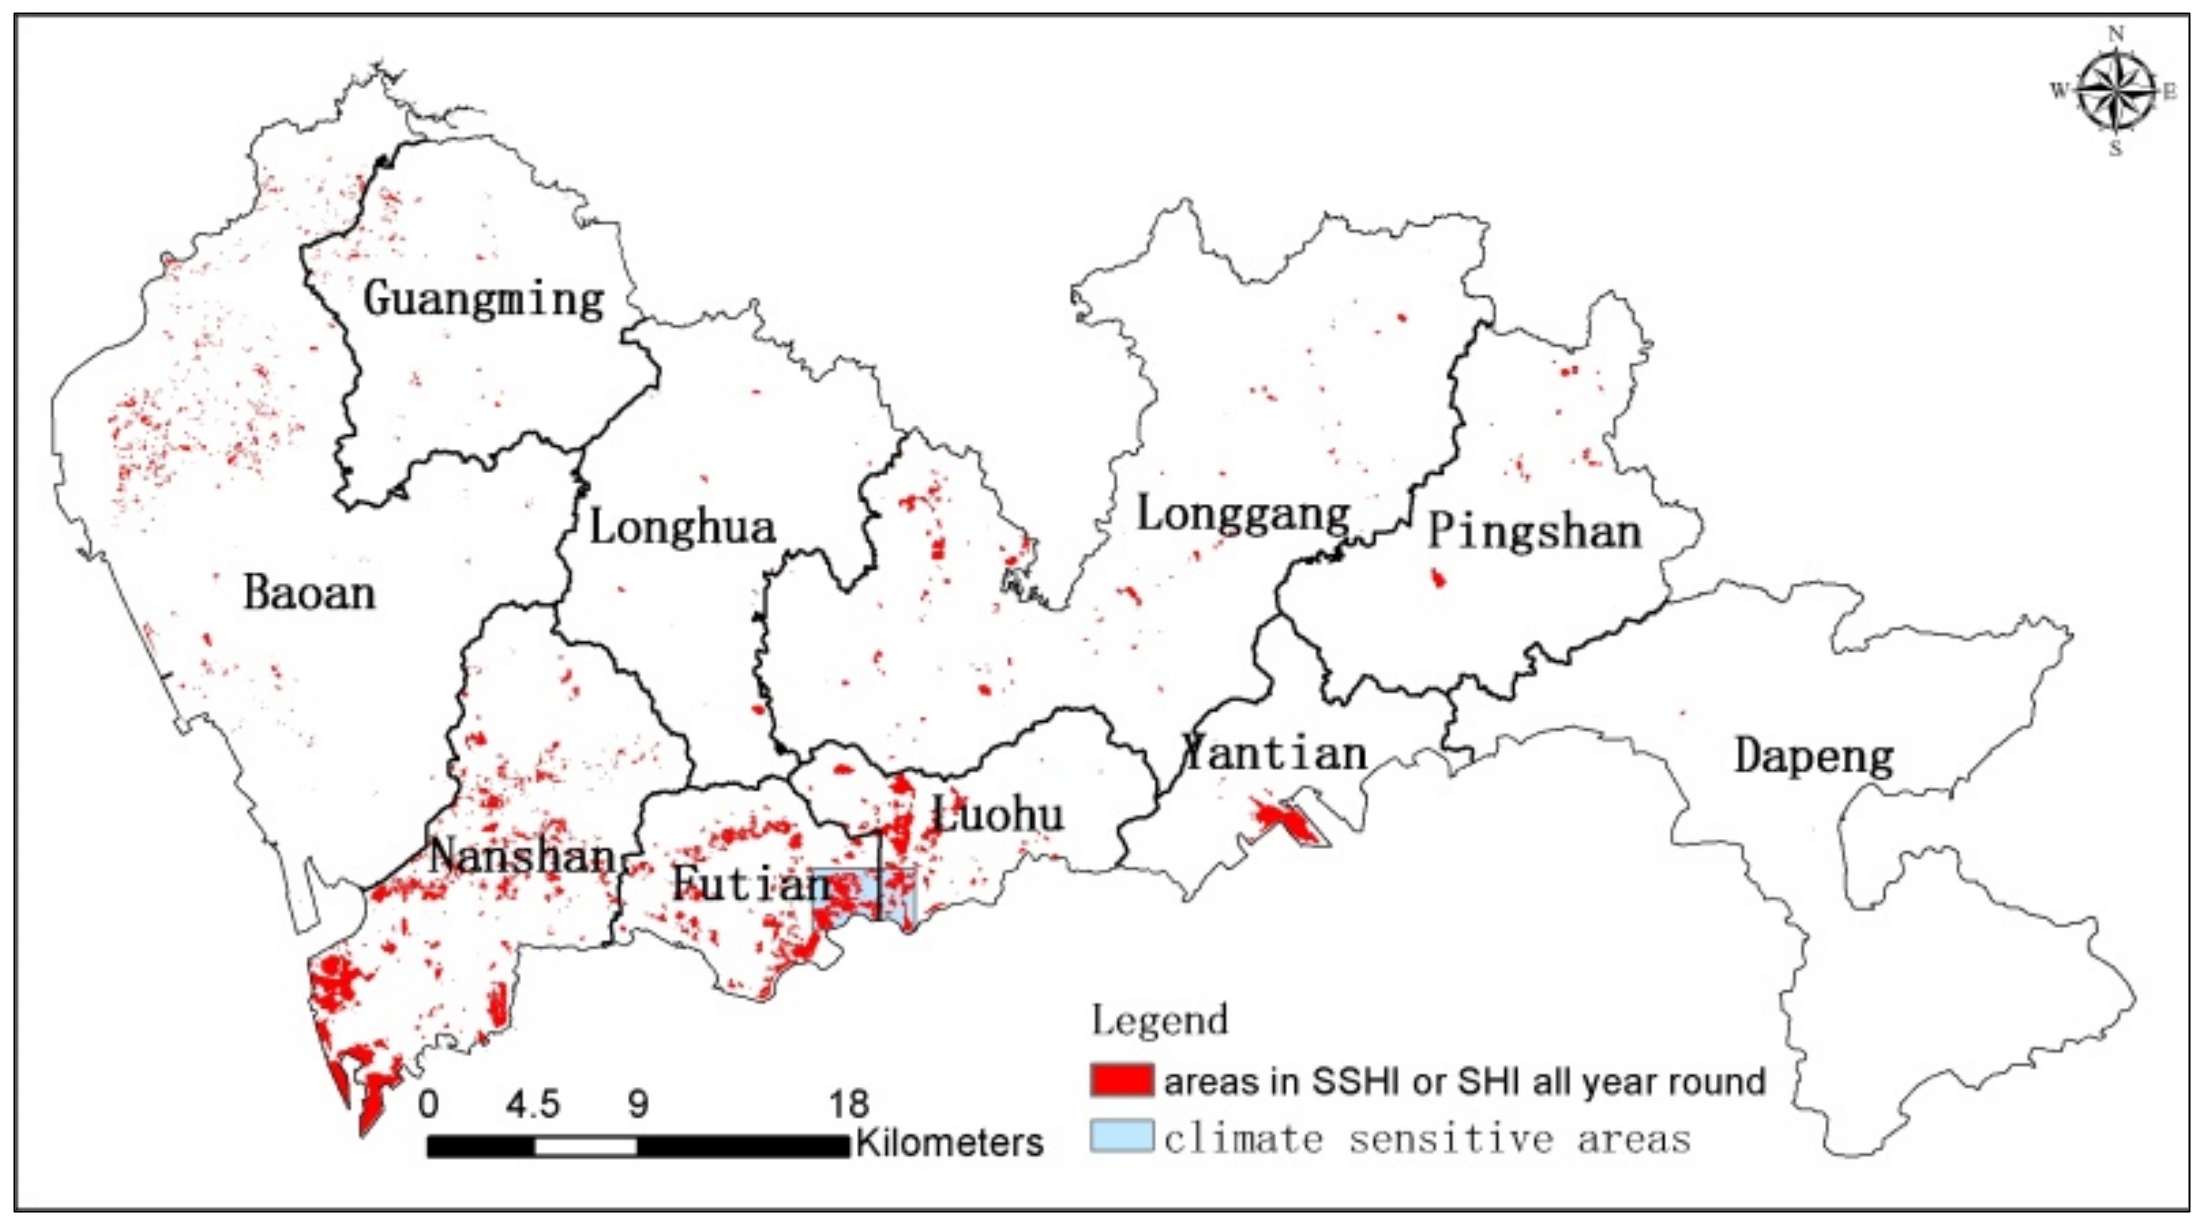
- For studying the relationship between urban space form and heat island, we selected a climate-sensitive area, and we used the linear regression method to analyze the relationship between several spatial morphological parameters and SUHI. The results only show the qualitative relationship and lack a quantification study, which is an issue that needs to be further discussed in follow-up research.
- (3)
- Since the urban spatial wind and thermal environment optimization strategy proposed in this study is mainly a guidance strategy, lacking quantitative control indicators, more in-depth research and exploration are still needed.
Author Contributions
Funding
Institutional Review Board Statement
Informed Consent Statement
Conflicts of Interest
References
- Li, L.; Wu, D.; Zhang, L.J.; Yuan, L. Ventilation assessment on urban-block detailed planning based on numerical simulation. Acta Sci. Circumst. 2012, 32, 946–953. [Google Scholar]
- Hu, Y.; White, M.; Ding, W. An Urban Form Experiment on Urban Heat Island Effect in High Density Area. Procedia Eng. 2016, 169, 166–174. [Google Scholar] [CrossRef]
- Wang, P.; Luo, M.; Liao, W.; Xu, Y.; Wu, S.; Tong, X.; Han, Y. Urbanization contribution to human perceived temperature changes in major urban agglomerations of China. Urban Clim. 2021, 38, 100910. [Google Scholar] [CrossRef]
- Liu, Y.H.; Xu, Y.M.; Zhang, F.M.; Shu, W.J. Influence of Beijing spatial morphology on the distribution of urban heat island. Acta Geogr. Sin. 2021, 76, 1662–1679. [Google Scholar]
- Li, L.; Chan, P.W.; Wang, D.; Tan, M. Rapid urbanization effect on local climate: Intercomparison of climate trends in Shenzhen and Hong Kong, 1968–2013. Clim. Res. 2015, 63, 145–155. [Google Scholar] [CrossRef]
- Giridharan, R.; Ganesan, S.; Lau, S.S.Y. Daytime urban heat island effect in high-rise and high-density residential developments in Hong Kong. Energy Build. 2004, 36, 525–534. [Google Scholar] [CrossRef]
- Giridharan, R.; Lau, S.S.Y.; Ganesan, S.; Givoni, B. Lowering the outdoor temperature in high-rise high-density residential developments of coastal Hong Kong: The vegetation influence. Build. Environ. 2008, 43, 1583–1595. [Google Scholar] [CrossRef]
- Kubota, T.; Miura, M.; Tominaga, Y.; Mochida, A. Wind tunnel tests on the relationship between building density and pedestrian-level wind velocity: Development of guidelines for realizing acceptable wind environment in residential neighborhoods. Build. Environ. 2008, 43, 1699–1708. [Google Scholar] [CrossRef]
- Yuan, L.; Zhang, Y.; Guo, Y.; Xu, X. Research on planning and design strategies for improving urban micro-climate: Natural ventilation assessment in Shenzhen. City Plan. Rev. 2017, 41, 87–91. [Google Scholar]
- Zheng, Y.; Shi, Y.; Ren, C.; Ng, E. Urban Ventilation Strategies for Micro Climate Improvement in Subtropical High-Density Cities: A Case Study of Tai Po Market in Hong Kong. Urban Plan. Int. 2016, 31, 68–75. [Google Scholar] [CrossRef]
- QX/T 437-2018; Specifications for Climatic Feasibility Demonstration—Urban Ventilation Corridor. China Meteorological Administration: Beijing, China, 2018.
- Marçal, N.A.; da Silva, R.M.; Santos CA, G.; dos Santos, J.S. Analysis of the environmental thermal comfort conditions in public squares in the semiarid region of northeastern Brazil. Build. Environ. 2019, 152, 145–159. [Google Scholar] [CrossRef]
- Liu, L.; Lin, Y.; Wang, D.; Liu, J. Quantitative Analysis of the Outdoor Thermal Comfort in the Hot and Humid Summertime of Shenzhen, China. J. Harbin Inst. Technol. 2017, 24, 30–38. [Google Scholar]
- Jiménez-Muñoz, J.C.; Sobrino, J.A. A generalized single-channel method for retrieving land surface temperature from remote sensing data. J. Geophys. Res. 2003, 108, 2015–2023. [Google Scholar] [CrossRef]
- Liu, Y.; Fang, X.; Xu, Y.; Zhang, S.; Luan, Q. Assessment of surface urban heat island across China’s three main urban agglomerations. Theor. Appl. Climatol. 2018, 133, 473–488. [Google Scholar] [CrossRef]
- Liu, Y.; Fang, X.; Cheng, C.; Luan, Q.; Du, W.; Xiao, X.; Wang, H. Research and application of city ventilation assessments based on satellite data and GIS technology—A case study of Yanqi Lake Eco-city in Huairou District, Beijing. Meteorol. Appl. 2016, 23, 320–327. [Google Scholar] [CrossRef]
- Liu, Y.; Cheng, P.; Chen, P.; Zhang, S. Detection of wind corridors based on “Climatopes”: A study in central Ji’nan. Theor. Appl. Climatol. 2020, 142, 869–884. [Google Scholar] [CrossRef]
- Gao, C.; Zhang, F.; Chen, X.; Chen, Y.; Xing, L.; Yao, J. The impact of urbanization on urban heat-island effect in Haikou City. Meteorol. Disaster Reduct. 2019, 42, 277–284. [Google Scholar]
- Grimmond, C.S.B.; Oke, T.R. Aerodynamic properties of urban areas derived from analysis of surface form. J. Appl. Meteorol. 1999, 38, 1262–1291. [Google Scholar] [CrossRef]
- Liu, Y.; Xu, F.; Zhang, F.; Cheng, C. Research and Application of Urban Surface Ventilation Potential: Cases of Beijing and Guangzhou. Planners 2019, 35, 32–40. [Google Scholar]
- Zakšek, K.; Oštir, K.; Kokalj, Ž. Sky-View Factor as a Relief Visualization Technique. Remote Sens. 2011, 3, 398–415. [Google Scholar] [CrossRef]
- Chen, L.; Ng, E.; An, X.; Ren, C.; Lee, M.; Wang, U.; He, Z. Sky view factor analysis of street canyons and its implications for daytime intra-urban air temperature differentials in high-rise, high-density urban areas of Hong Kong: A GIS-based simulation approach. Int. J. Climatol. 2012, 32, 121–136. [Google Scholar] [CrossRef]
- Chao, Y. Mitigating urban heat island effects of high density cities: A Study at Hong Kong. Archit. J. 2010, 1, 120–123. [Google Scholar]
- Sun, Z. Impact of Urban Morphology Factors on Thermal Environment in High Density Urban Areas: A Case of Beijing within 5th Ring Road. Ecol. Environ. Sci. 2020, 29, 2020–2027. [Google Scholar]
- Yang, F.; Lau, S.S.; Qian, F. Urban design to lower summertime outdoor temperatures: An empirical study on high-rise housing in Shanghai. Build. Environ. 2011, 46, 769–785. [Google Scholar] [CrossRef]
- Matzarakis, A.; Mayer, H. Mapping of urban air paths for planning in Munch. Wiss Ber. Inst. Meteorol. Klimafor. Univ. Karlsr. 1992, 16, 13–22. [Google Scholar]
- Chen, L.; Ng, E. Quantitative urban climate mapping based on a geographical database: A simulation approach using Hong Kong as a case study. Int. J. Appl. Earth Obs. Geoinf. 2011, 13, 586–594. [Google Scholar] [CrossRef]
- Lai, X.; Lu, C.; Li, L.; Chunyang, Z.; Li, Z.; Shuting, Z.; Qunfeng, Z. Analysis of climatic comfort characteristics in areas with different development levels in Shenzhen. J. Trop. Meteorol. 2020, 36, 180–188. [Google Scholar]
- Li, H.; Chen, J.; Han, Y.; Zhang, Y. Micro-scale Research of the Impact Factors on Urban Thermal Environment: A Case Study of Luohu District, Shenzhen. Ecol. Environ. Sci. 2019, 28, 1622–1631. [Google Scholar]


| Levels | SUHI (°C) | Significance |
|---|---|---|
| 1 | ≤−7.0 | SCI |
| 2 | −7.0 to −5.0 | SSCI |
| 3 | −5.0 to −3.0 | WCI |
| 4 | −3.0 to 3.0 | NHI |
| 5 | 3.0 to 5.0 | WHI |
| 6 | 5.0 to 7.0 | SSHI |
| 7 | >7.0 | SHI |
| Block Number | Block Name | Jurisdiction | Block Number | Block Name | Jurisdiction |
|---|---|---|---|---|---|
| 1 | Xinan | Baoan district | 38 | Yuanshan | Longgang district |
| 2 | Shiyan | Baoan district | 39 | Longcheng | Longgang district |
| 3 | Fuyong | Baoan district | 40 | Pingdi | Longgang district |
| 4 | Songgang | Baoan district | 41 | Minzhi | Longhua district |
| 5 | Xinqiao | Baoan district | 42 | Guanlan | Longhua district |
| 6 | Hangcheng | Baoan district | 43 | Longhua | Longhua district |
| 7 | Shajing | Baoan district | 44 | Fucheng | Longhua district |
| 8 | Yanluo | Baoan district | 45 | Guanhu | Longhua district |
| 9 | Fuhai | Baoan district | 46 | Dalang | Longhua district |
| 10 | Xixiang | Baoan district | 47 | Nanhu | Luohu district |
| 11 | Dapeng | Dapeng district | 48 | Dongmen | Luohu district |
| 12 | Kuiyong | Dapeng district | 49 | Guiyuan | Luohu district |
| 13 | Nanao | Dapeng district | 50 | Sungang | Luohu district |
| 14 | Huaqiangbei | Futian district | 51 | Qingshuihe | Luohu district |
| 15 | Yuanling | Futian district | 52 | Dongxiao | Luohu district |
| 16 | Huafu | Futian district | 53 | Cuizhu | Luohu district |
| 17 | Lianhua | Futian district | 54 | Huangbei | Luohu district |
| 18 | Meilin | Futian district | 55 | Liantang | Luohu district |
| 19 | Fubao | Futian district | 56 | Donghu | Luohu district |
| 20 | Futian | Futian district | 57 | Yuehai | Nanshan district |
| 21 | Nanyuan | Futian district | 58 | Xili | Nanshan district |
| 22 | Shatou | Futian district | 59 | Shekou | Nanshan district |
| 23 | Xiangmihu | Futian district | 60 | Nanshan | Nanshan district |
| 24 | Xinhu | Guangming district | 61 | Shahe | Nanshan district |
| 25 | Matian | Guangming district | 62 | Nantou | Nanshan district |
| 26 | Gongming | Guangming district | 63 | Zhaoshang | Nanshan district |
| 27 | Fenghuang | Guangming district | 64 | Taoyuan | Nanshan district |
| 28 | Yutang | Guangming district | 65 | Biling | Pingshan district |
| 29 | Guangming | Guangming district | 66 | Maluan | Pingshan district |
| 30 | Baolong | Longgang district | 67 | Shijing | Pingshan district |
| 31 | Longgang | Longgang district | 68 | Kengzi | Pingshan district |
| 32 | Jihua | Longgang district | 69 | Pingshan | Pingshan district |
| 33 | Bantian | Longgang district | 70 | Longtian | Pingshan district |
| 34 | Buji | Longgang district | 71 | Shatoujiao | Yantian district |
| 35 | Nanwan | Longgang district | 72 | Haishan | Yantian district |
| 36 | Pinghu | Longgang district | 73 | Yantian | Yantian district |
| 37 | Henggang | Longgang district | 74 | Meisha | Yantian district |
| Level | Significance | Roughness Length (Z0) | SVF (F) |
|---|---|---|---|
| 1 | None or poor | Z0 > 1.0 | — |
| 2 | Relatively poor | 0.5 < Z0 ≤ 1.0 | F < 0.75 |
| 3 | General | 0.5 < Z0 ≤ 1.0 | F ≥ 0.75 |
| 4 | Relatively high | Z0 ≤ 0.5 | F < 0.75 |
| 5 | High | Z0 ≤ 0.5 | F ≥ 0.75 |
| Level | VPC | Significance |
|---|---|---|
| 1 | >1.5 | None or poor |
| 2 | 1.0–1.5 | Relatively poor |
| 3 | 0.5–1.0 | General |
| 4 | 0.1–0.5 | Relatively high |
| 5 | <0.1 | High |
| Spatial Morphological Parameters | R Value | p Value |
|---|---|---|
| BD | 0.646 | 4.397 × 10⁻¹⁴ |
| BH | 0.06 | 2.567 × 10⁻¹⁵ |
| RL | −0.113 | 1.106 × 10⁻¹⁶ |
| SVF | −0.553 | 6.17 × 10⁻¹⁸ |
| Spatial Morphological Parameters | R Value | p Value |
|---|---|---|
| BD | 0.343 | 3.149 × 10⁻¹⁷ |
| BH | 0.535 | 5.668 × 10⁻¹³ |
| RL | 0.545 | 0.026761822 |
| SVF | −0.325 | 6.732 × 10⁻¹⁷ |
Publisher’s Note: MDPI stays neutral with regard to jurisdictional claims in published maps and institutional affiliations. |
© 2022 by the authors. Licensee MDPI, Basel, Switzerland. This article is an open access article distributed under the terms and conditions of the Creative Commons Attribution (CC BY) license (https://creativecommons.org/licenses/by/4.0/).
Share and Cite
Zhang, S.; Fang, X.; Cheng, C.; Chen, L.; Zhang, L.; Yu, Y.; Li, L.; Luo, H. Research on the Planning Method and Strategy of Urban Wind and Heat Environment Optimization—Taking Shenzhen, a Sub-Tropical Megacity in Southern China, as an Example. Atmosphere 2022, 13, 1395. https://doi.org/10.3390/atmos13091395
Zhang S, Fang X, Cheng C, Chen L, Zhang L, Yu Y, Li L, Luo H. Research on the Planning Method and Strategy of Urban Wind and Heat Environment Optimization—Taking Shenzhen, a Sub-Tropical Megacity in Southern China, as an Example. Atmosphere. 2022; 13(9):1395. https://doi.org/10.3390/atmos13091395
Chicago/Turabian StyleZhang, Shuo, Xiaoyi Fang, Chen Cheng, Liuxin Chen, Li Zhang, Ying Yu, Lei Li, and Hongyan Luo. 2022. "Research on the Planning Method and Strategy of Urban Wind and Heat Environment Optimization—Taking Shenzhen, a Sub-Tropical Megacity in Southern China, as an Example" Atmosphere 13, no. 9: 1395. https://doi.org/10.3390/atmos13091395
APA StyleZhang, S., Fang, X., Cheng, C., Chen, L., Zhang, L., Yu, Y., Li, L., & Luo, H. (2022). Research on the Planning Method and Strategy of Urban Wind and Heat Environment Optimization—Taking Shenzhen, a Sub-Tropical Megacity in Southern China, as an Example. Atmosphere, 13(9), 1395. https://doi.org/10.3390/atmos13091395