Article

Application of Ion-Mobility Spectrometry to Chemical Analysis at High Concentrations

National Institute of Occupational Safety and Health, 6-21-1 Nagao, Tama-ku, Kawasaki 214-8585, Japan
*
Author to whom correspondence should be addressed.
Atmosphere 2022, 13(9), 1380; https://doi.org/10.3390/atmos13091380
Submission received: 14 July 2022 / Revised: 17 August 2022 / Accepted: 25 August 2022 / Published: 28 August 2022
(This article belongs to the Section Atmospheric Techniques, Instruments, and Modeling)

Abstract

:
Ion-mobility spectrometry (IMS) can perform qualitative and quantitative analysis of multicomponent chemical mixtures in real time, which is difficult for commonly used instruments such as gas chromatography–mass spectrometry and photo-ionization detectors. IMS is commonly applied in microanalytical (ppb) sensing of toxic gases. Thus, its application to quantitative analyses of chemical substances with a high proton affinity is generally not possible at high concentrations (~1000 ppm) because multimeric complexes are generated. In a previous study, we found that calibration curves derived from shifts in nominal arrival-time spectra of chemical substances overlapping with water clusters enable quantitative analysis at high concentrations. This study investigated the applicability of high-concentration quantitative analysis using IMS, including the lower and upper limits of quantification and their chemical dependence on methyl ethyl ketone and ethanol. We found that the magnitude of the shift in the nominal arrival-time spectrum at low concentrations is different from that at high concentrations, and that the concentration of a chemical substance can be determined with high precision from the shift in the arrival-time spectrum, even at low concentrations. Proton affinity has a significant effect on spectral shift and quantification limits. Our results indicate that shifts in nominal arrival-time spectra allow accurate quantitative analysis at both low and high concentrations. Our calibration technique is derived from the shift in nominal peaks including multimeric complexes at high concentrations, which resultantly recognized the highest dynamic range ever. We could measure the dynamic range of chemical substances over three orders using this method.

1. Introduction

Gas chromatography–mass spectroscopy (GC–MS) has been a general method for the determination of concentrations of chemical substances in the air environment [1,2,3,4,5]. On the other hand, Ion-mobility spectrometry (IMS) was originally developed for the detection and microanalysis (ppb) of toxic gases such as sarin and VX, explosives, and drugs. For the atmospheric environment, regulations concerning industrial pollutant emissions are becoming stricter in many countries [6], and real-time monitoring of such emissions is essential. In indoor air, real-time monitoring is required to control the concentrations of substances causing health-related issues [7]. Short-term exposure to a specific substance may induce poor physical conditions, such as in “sick building” syndrome. Concentrations of substances in the environment may vary by the minute, depending on temperature, wind volume and direction, and environmental conditions at their source [8,9], with some substances having transient high concentrations under certain conditions [10].
Although real-time monitoring of chemical substances at high concentrations (~1000 ppm) has been required in work environments, the application of the conventional IMS to quantitative analysis at higher concentrations and for multimeric complexes has not been straightforward. The limitation of the conventional IMS is mainly attributed to two reasons; the dynamic range of the conventional IMS is limited to less than two orders [11], and the ion signal is saturated at high concentrations [12].
A previous study performed by Tabrizchi et al. reported that a peak shift occurs with a change in the concentration of a chemical substance (methyl iso-butyl ketone was used as a sample gas) [13]. Focusing on this peak shift phenomenon, we proposed a quantitative analysis technique based on a calibration curve obtained from the arrival-time shift in the nominal spectrum of a chemical substance overlapping that of water clusters [14,15]. This IMS technique could achieve a qualitative and quantitative analysis of chemical substances at atmospheric pressure, which enabled the IMS device portable without any vacuum equipment.
This study investigated the applicability of the IMS developed by the authors to high-concentration quantitative analysis by using methyl ethyl ketone (MEK) and ethanol as sample gases because they are widely used in factories: the lower and upper limits of its quantification and their chemical dependence of the accuracy in high-concentration quantitative analysis.

2. Materials and Methods

In the IMS system, sample ions produced by corona discharge move in a drift tube filled with a buffer gas (air in this study) having the role of target particles under a uniform electric field. Chemical substances are identified on the basis of ion velocity. Sample ions moving in a weak uniform electric field are decelerated by collision with buffer gas molecules and accelerated by the electric field, finally moving in a direction normal to the equipotential surface of the electric field [16,17]. If the sample ions are of complex shape or large size, their drift velocity decreases owing to the increased frequency of collisions with buffer gas molecules, with a reduction in sample ion velocity. Information on the shape and size of molecules of a substance can thus be obtained from the ion velocity, enabling substance identification [18,19,20].
The IMS system used here is depicted in Figure 1. The device comprises 11 guard ring electrodes D1–D11, with D1 and D2 forming an ionization chamber, D3 a gate electrode, and D4–D11 a drift tube with a total length = 11 cm. High voltages set by a resistor chain are applied to each guard ring to produce an electric field gradient (upper left, Figure 1). Spaces between guard rings are insulated with 2 mm thick Teflon plates. Sample vapor with a concentration adjusted by a calibration-gas generation system PD-1B (Gastec Corporation, Ayase, Kanagawa, Japan) is continuously injected into the IMS. The sample vapor is ionized by a corona discharge induced by applying a high voltage (4.7 kV and 2.6 kV; 1 mA) to the two discharge needles in the ionization chamber D2 (Figure 1).
The ionization mechanism is described by the following processes [21]:
e + N2 → N2+ + 2e,
N2+ + H2O → N2 + H2O+,
H2O+ + H2O → H3O+ + OH,
H3O+ + H2O + M → (H2O)2H+ + M,
(H2O)n−1H+ + H2O + M → M + (H2O)nH+,
(H2O)nH+ + M → MH+ +(H2O)n,
First, nitrogen molecules in the air are ionized by corona discharge (reaction (1)) followed by an electron transfer reaction (2). The sample ion, MH+, with the addition of a proton, is generated through a proton transfer reaction (3), three-body reactions (4) and (5), and a proton transfer reaction (6). The water cluster ion (H2O)nH+ in (6) is termed the reactant ion and has a very important role in ionization.
The continuous incident sample ion, MH+, ionized in the ionization chamber, is pulsed with a function generator DG1022U (RIGOL Inc., Suzhou, China) by a blocking voltage applied to two meshes installed in D3, typically of duration 3 ms and frequency 10 Hz. The ions cannot overcome the potential barrier in the gate (D3). The ion flight time is measured using this electrical gate pulse as the start signal, and the signal from the detector is used as the stop signal. The ion signal detected by the detector is amplified by a current amplifier DLPCS-200 (FEMTO Messtechnik GmbH, Berlin, Germany), and its size is measured by the oscilloscope. A drift gas (N2, 50 mL·min−1) flows constantly up the stream of the drift tube to prevent neutral samples from infiltrating into the drift tube. Therefore, ion-molecule reactions do not occur in the drift region.
Application of the conventional IMS to quantitative analyses of chemical substances with a high proton affinity is generally not possible at high concentrations (~1000 ppm) because multimeric complexes are generated. Therefore, we suggested a quantitative analysis technique in which a calibration curve was obtained from the shift in the arrival-time spectrum of chemical substances overlapped with that of water clusters by increasing the pulse width (the low resolution) [14,15]. The chemical substance peak overlaps the water-cluster peak (reactant ion peak (RIP), Figure 2), with the peak observed being a “nominal” peak. The arrival time of a substance is calculated from the position of the nominal peak, based on Gaussian fitting. If the concentration of a substance increases, the concentration of water cluster ions will correspondingly decrease, with the nominal peak position shifting from the RIP peak position. Here, MEK and ethanol were used to investigate a relationship between arrival time and concentration. Experimental parameters used in this study are compared with those in other studies in Table 1.

3. Results and Discussion

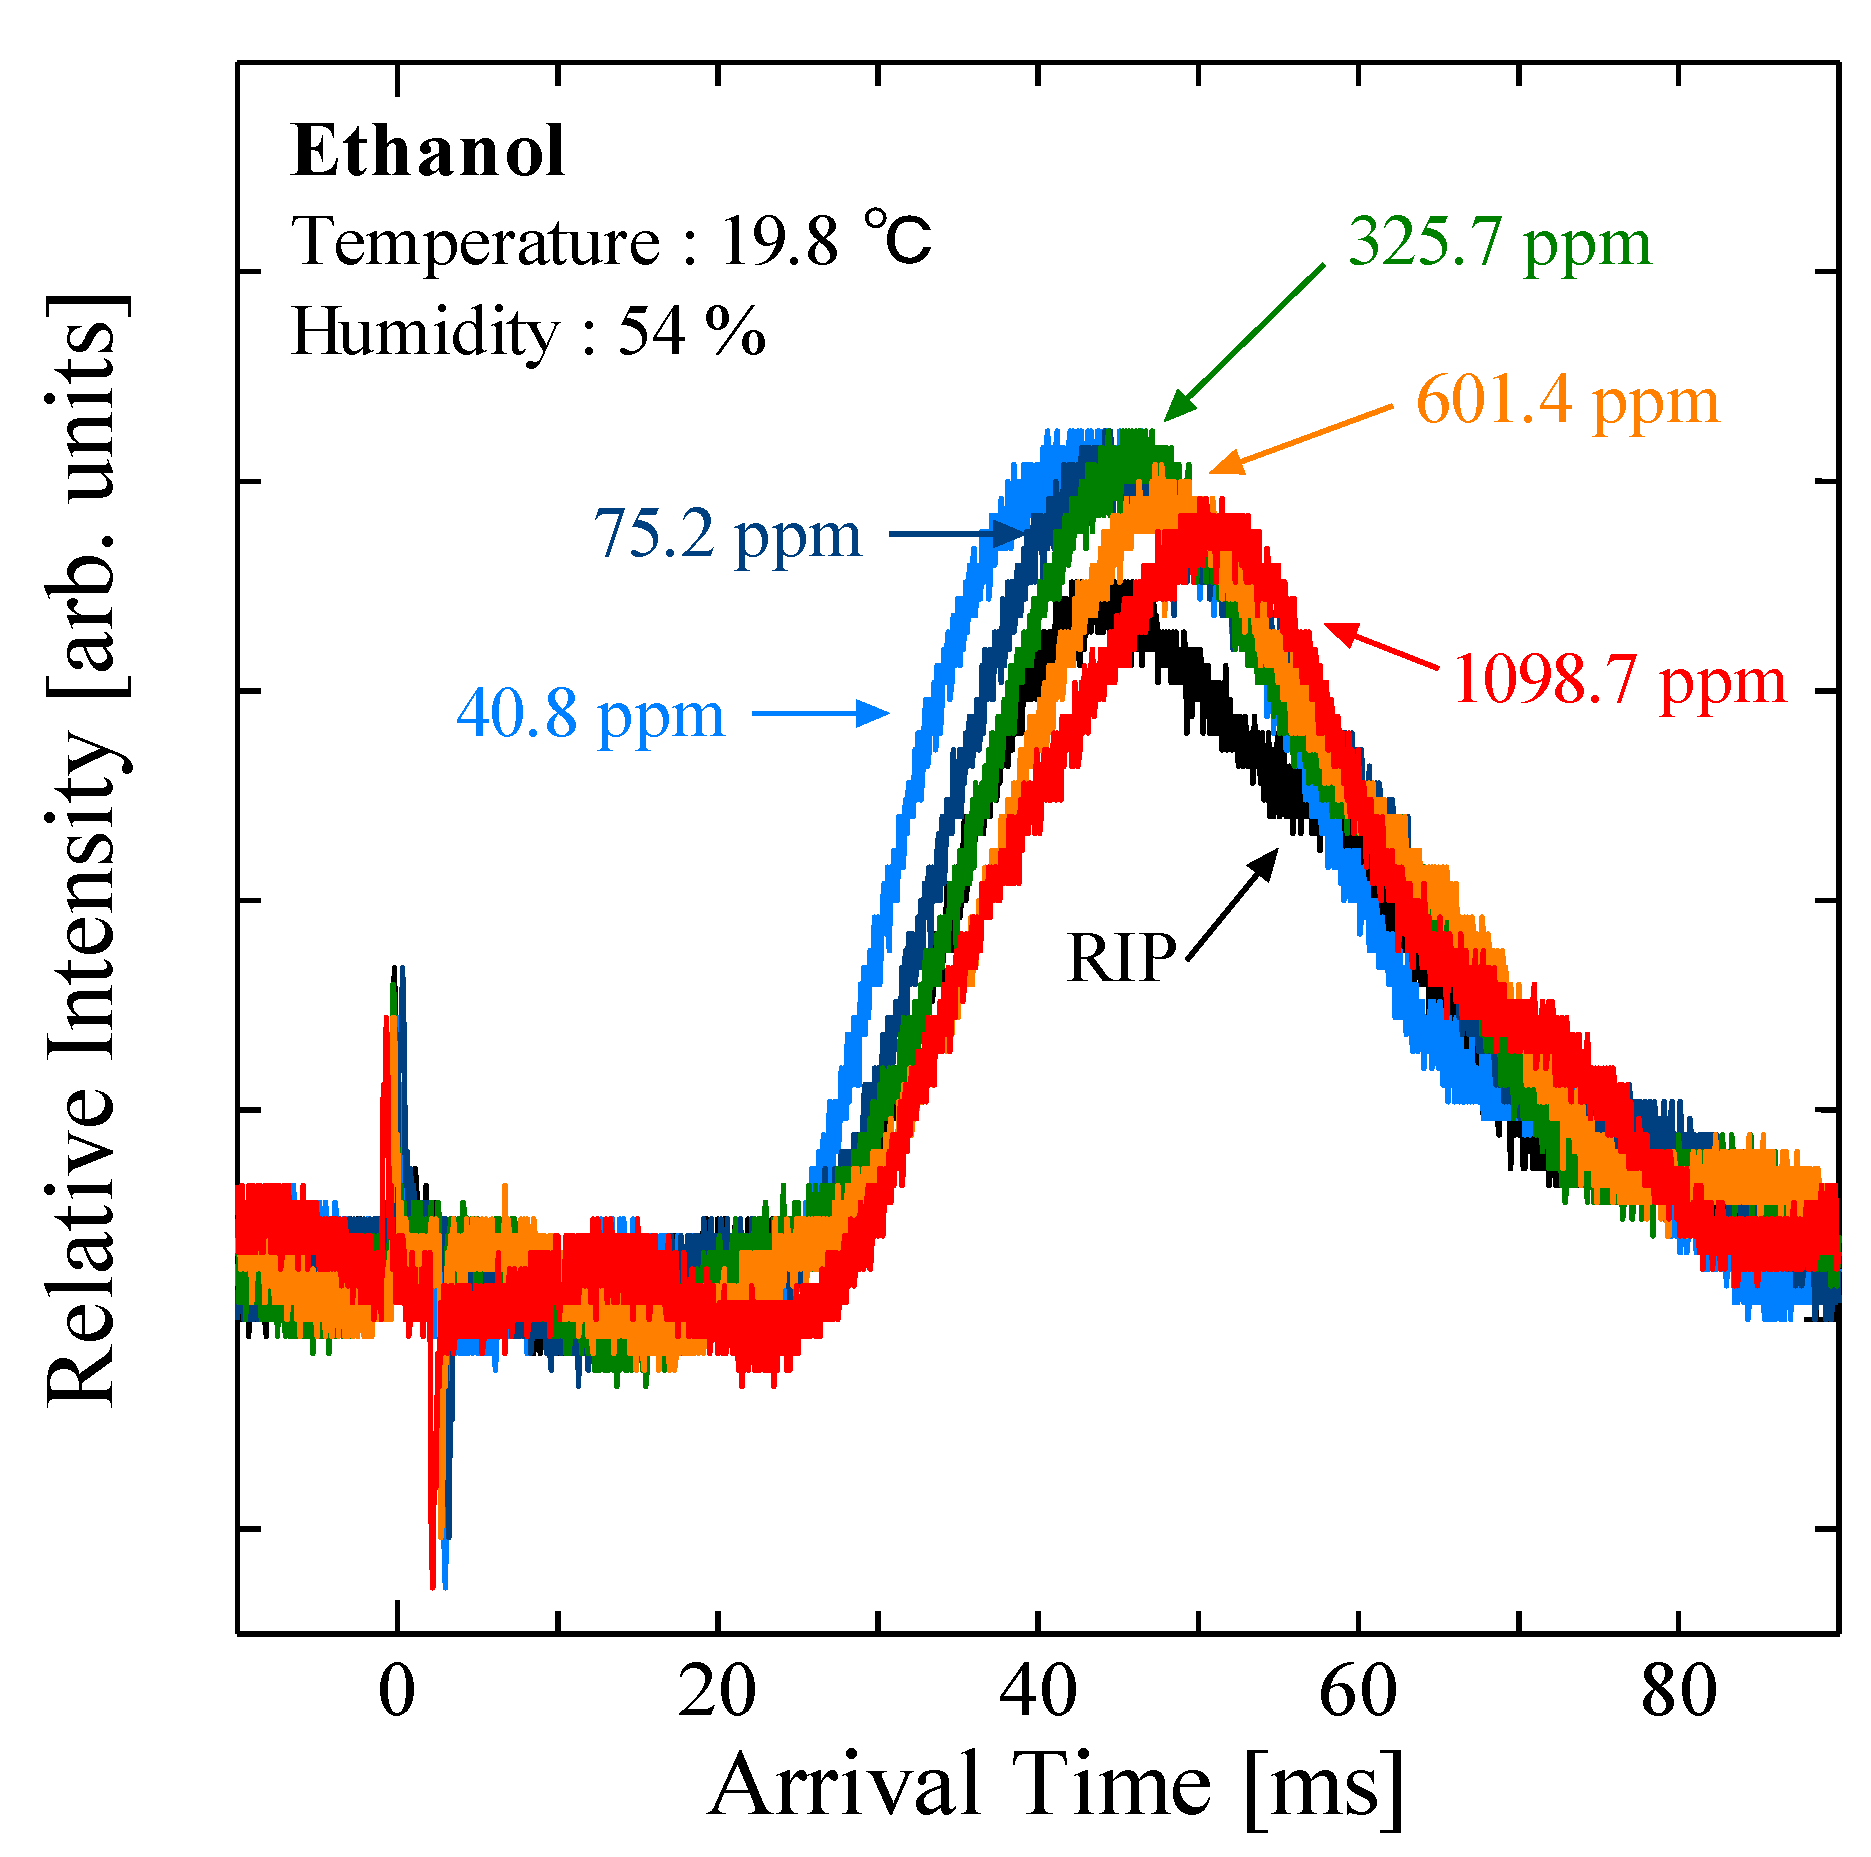
The arrival-time spectra of ethanol at concentrations of 40.8, 75.2, 325.7, 601.4, and 1098.7 ppm are shown in Figure 2, measured under identical conditions of temperature, humidity, and device setup. The vertical axis shows the relative intensity, and Table 2 summarizes the relationship between concentration and nominal arrival time obtained by Gaussian fitting. Peaks observed at around 0 ms for all concentrations were derived from electrical noise generated when a pulse voltage is applied to the gate electrode.
The RIP arrival time at a temperature of 19.8 °C and humidity of 54% was 44.4 ms. RIP is the background spectrum obtained from water cluster ions present in the air. The arrival time may be greatly affected by temperature and humidity because the arrival time of the RIP varies if the water cluster size changes with humidity and temperature, and the intensity of the RIP changes as the total number of clusters changes.
The arrival-time spectra shown in Figure 2 are the nominal spectra of ethanol overlapped with that of the water cluster. The nominal arrival time increases as the sample substance concentration increases. The nominal peak shifts to a longer arrival time as the concentration of ethanol increases, with the intensity of the ethanol spectrum increasing relative to that of the water cluster.
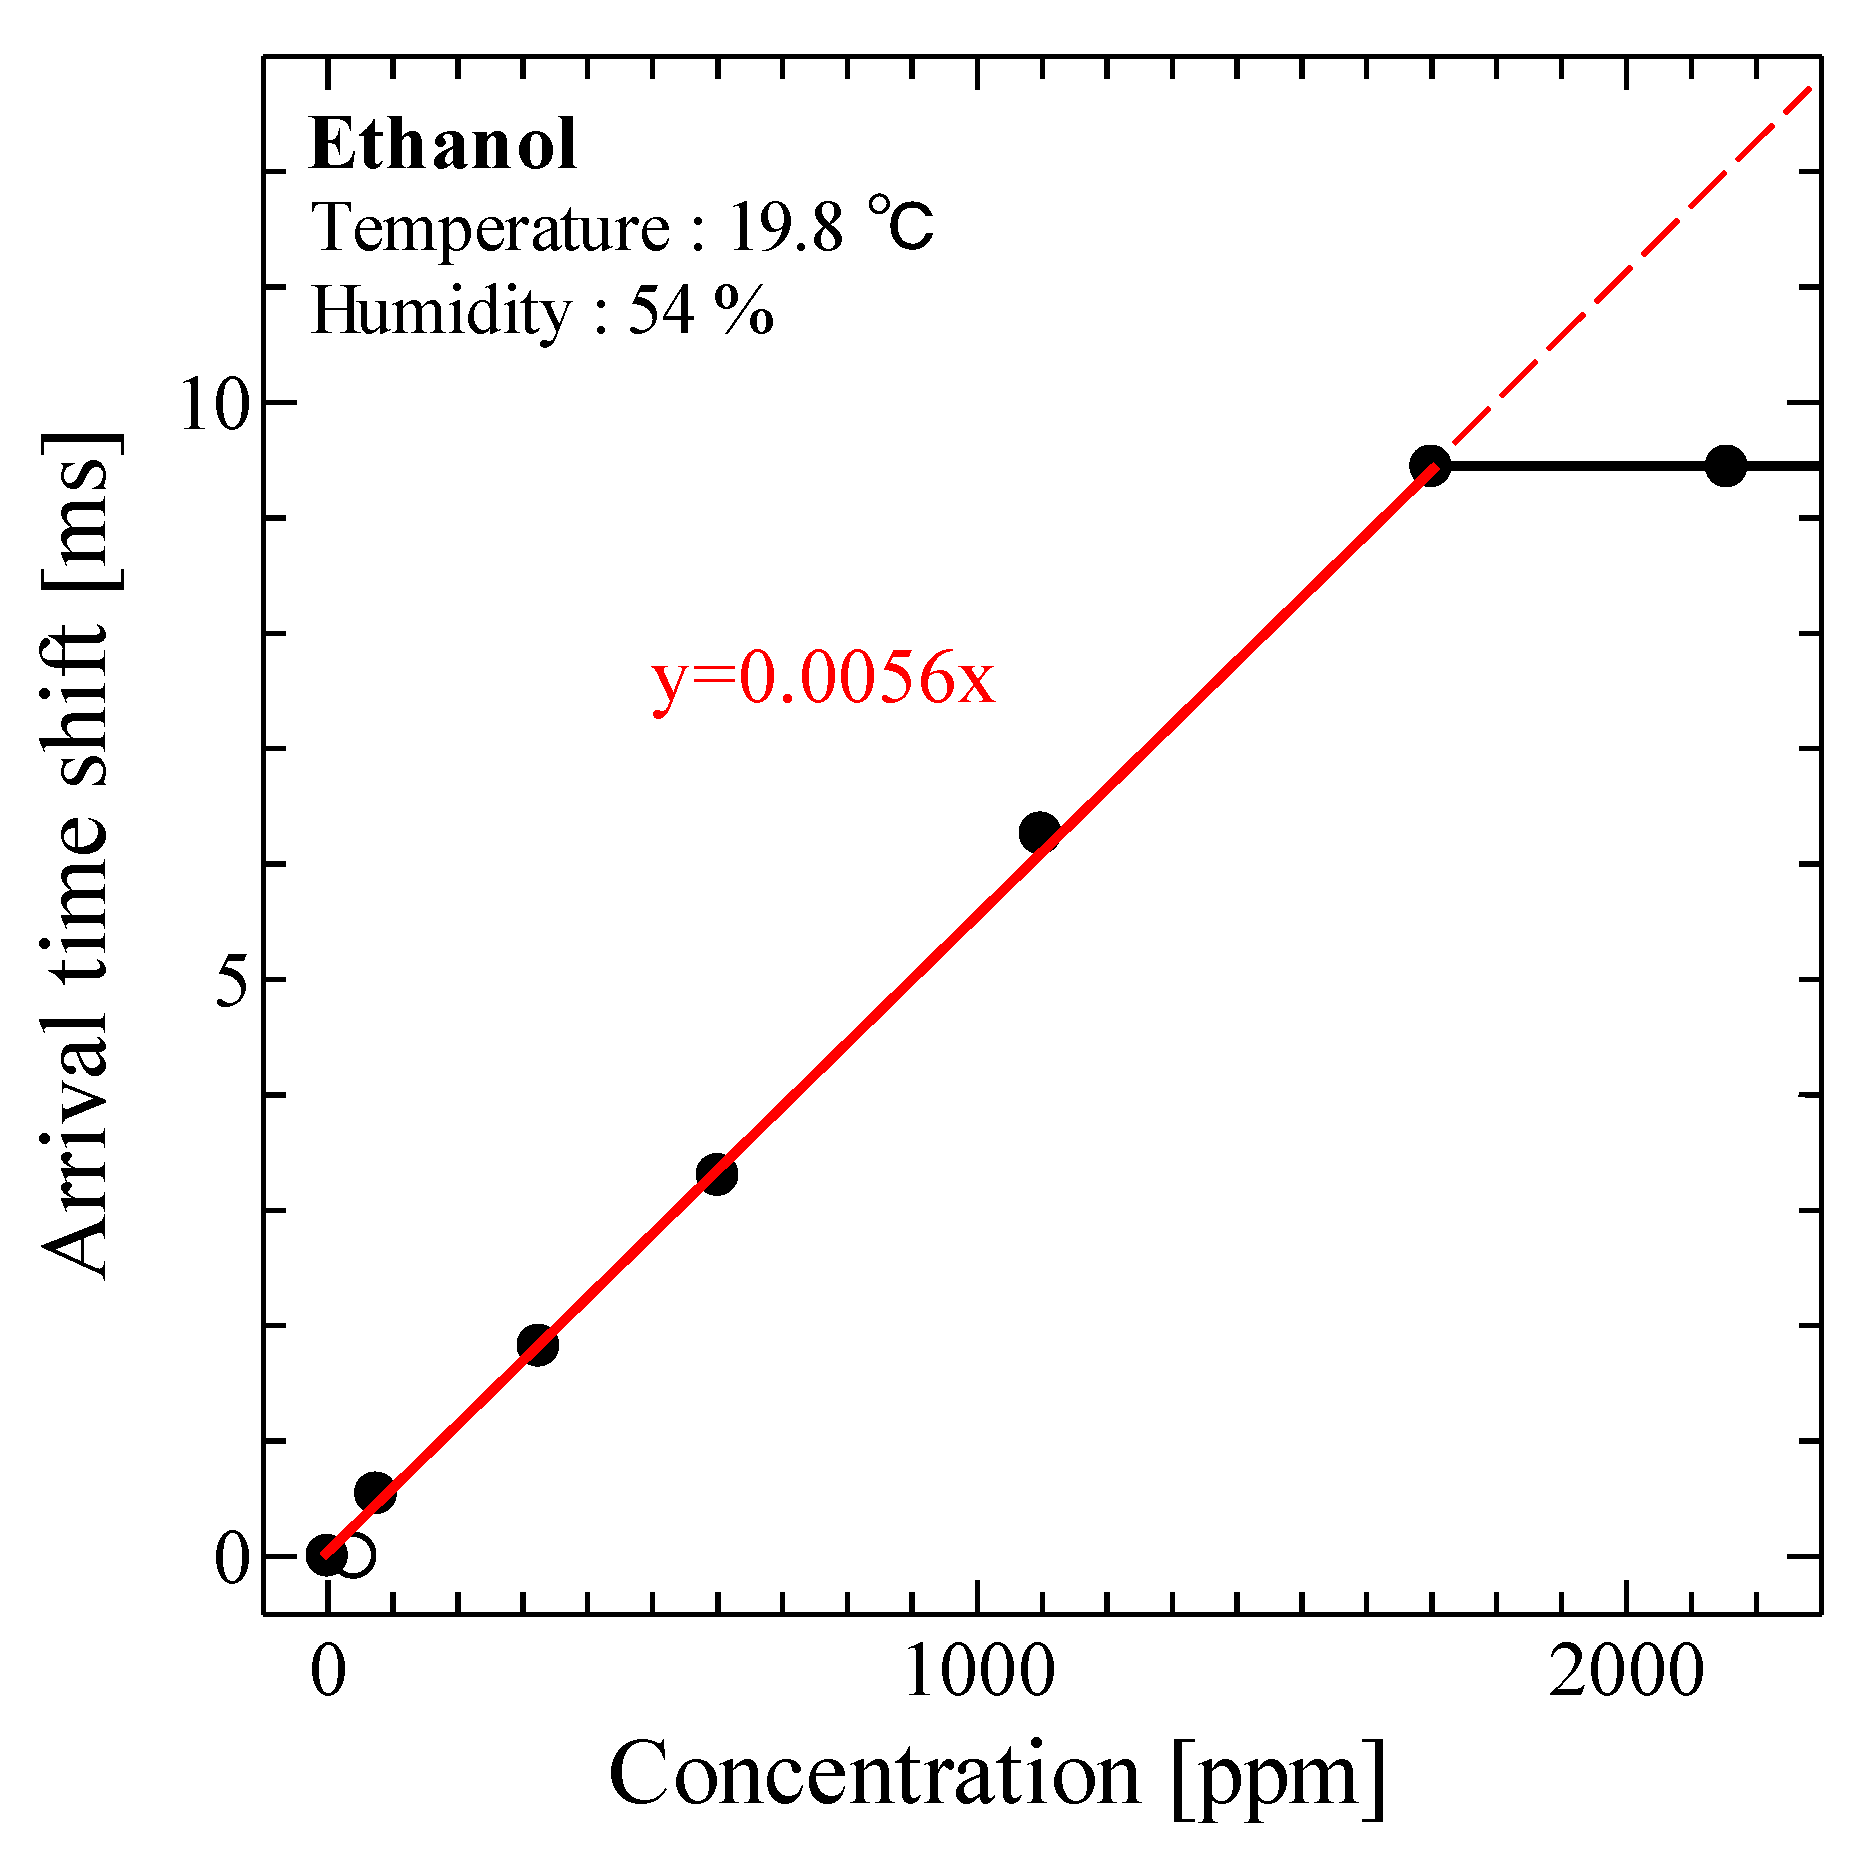
As shown in Figure 3, a calibration curve was obtained by calculating the shift in the arrival time of the RIP relative to the nominal arrival time of the ethanol peak overlapped with that of water clusters. The vertical axis indicates the shift in the nominal arrival time from that of the RIP and the horizontal axis concentration. The flow-rate measurement error of the calibration-gas generation system was estimated to be ~3%. The slope of the calibration curve shows the shift in the arrival time with respect to the increment in sample concentration. According to our previous study, the shift in the arrival time with respect to the increment in concentration is not affected by temperature and humidity [14].
A calibration curve for ethanol was obtained for the range of 75.2 to 2155.4 ppm. No nominal arrival-time shift was observed at concentrations greater than ~1700 ppm likely because the concentration of ethanol reaches the limit of ionizability. The upper limit of the quantification of ethanol under these environmental conditions (19.8 °C, 54% relative humidity) is thus around 1700 ppm. In contrast, no arrival-time shift was observed at concentrations less than 75.2 ppm, so that is the lower limit of quantification for ethanol under these conditions.
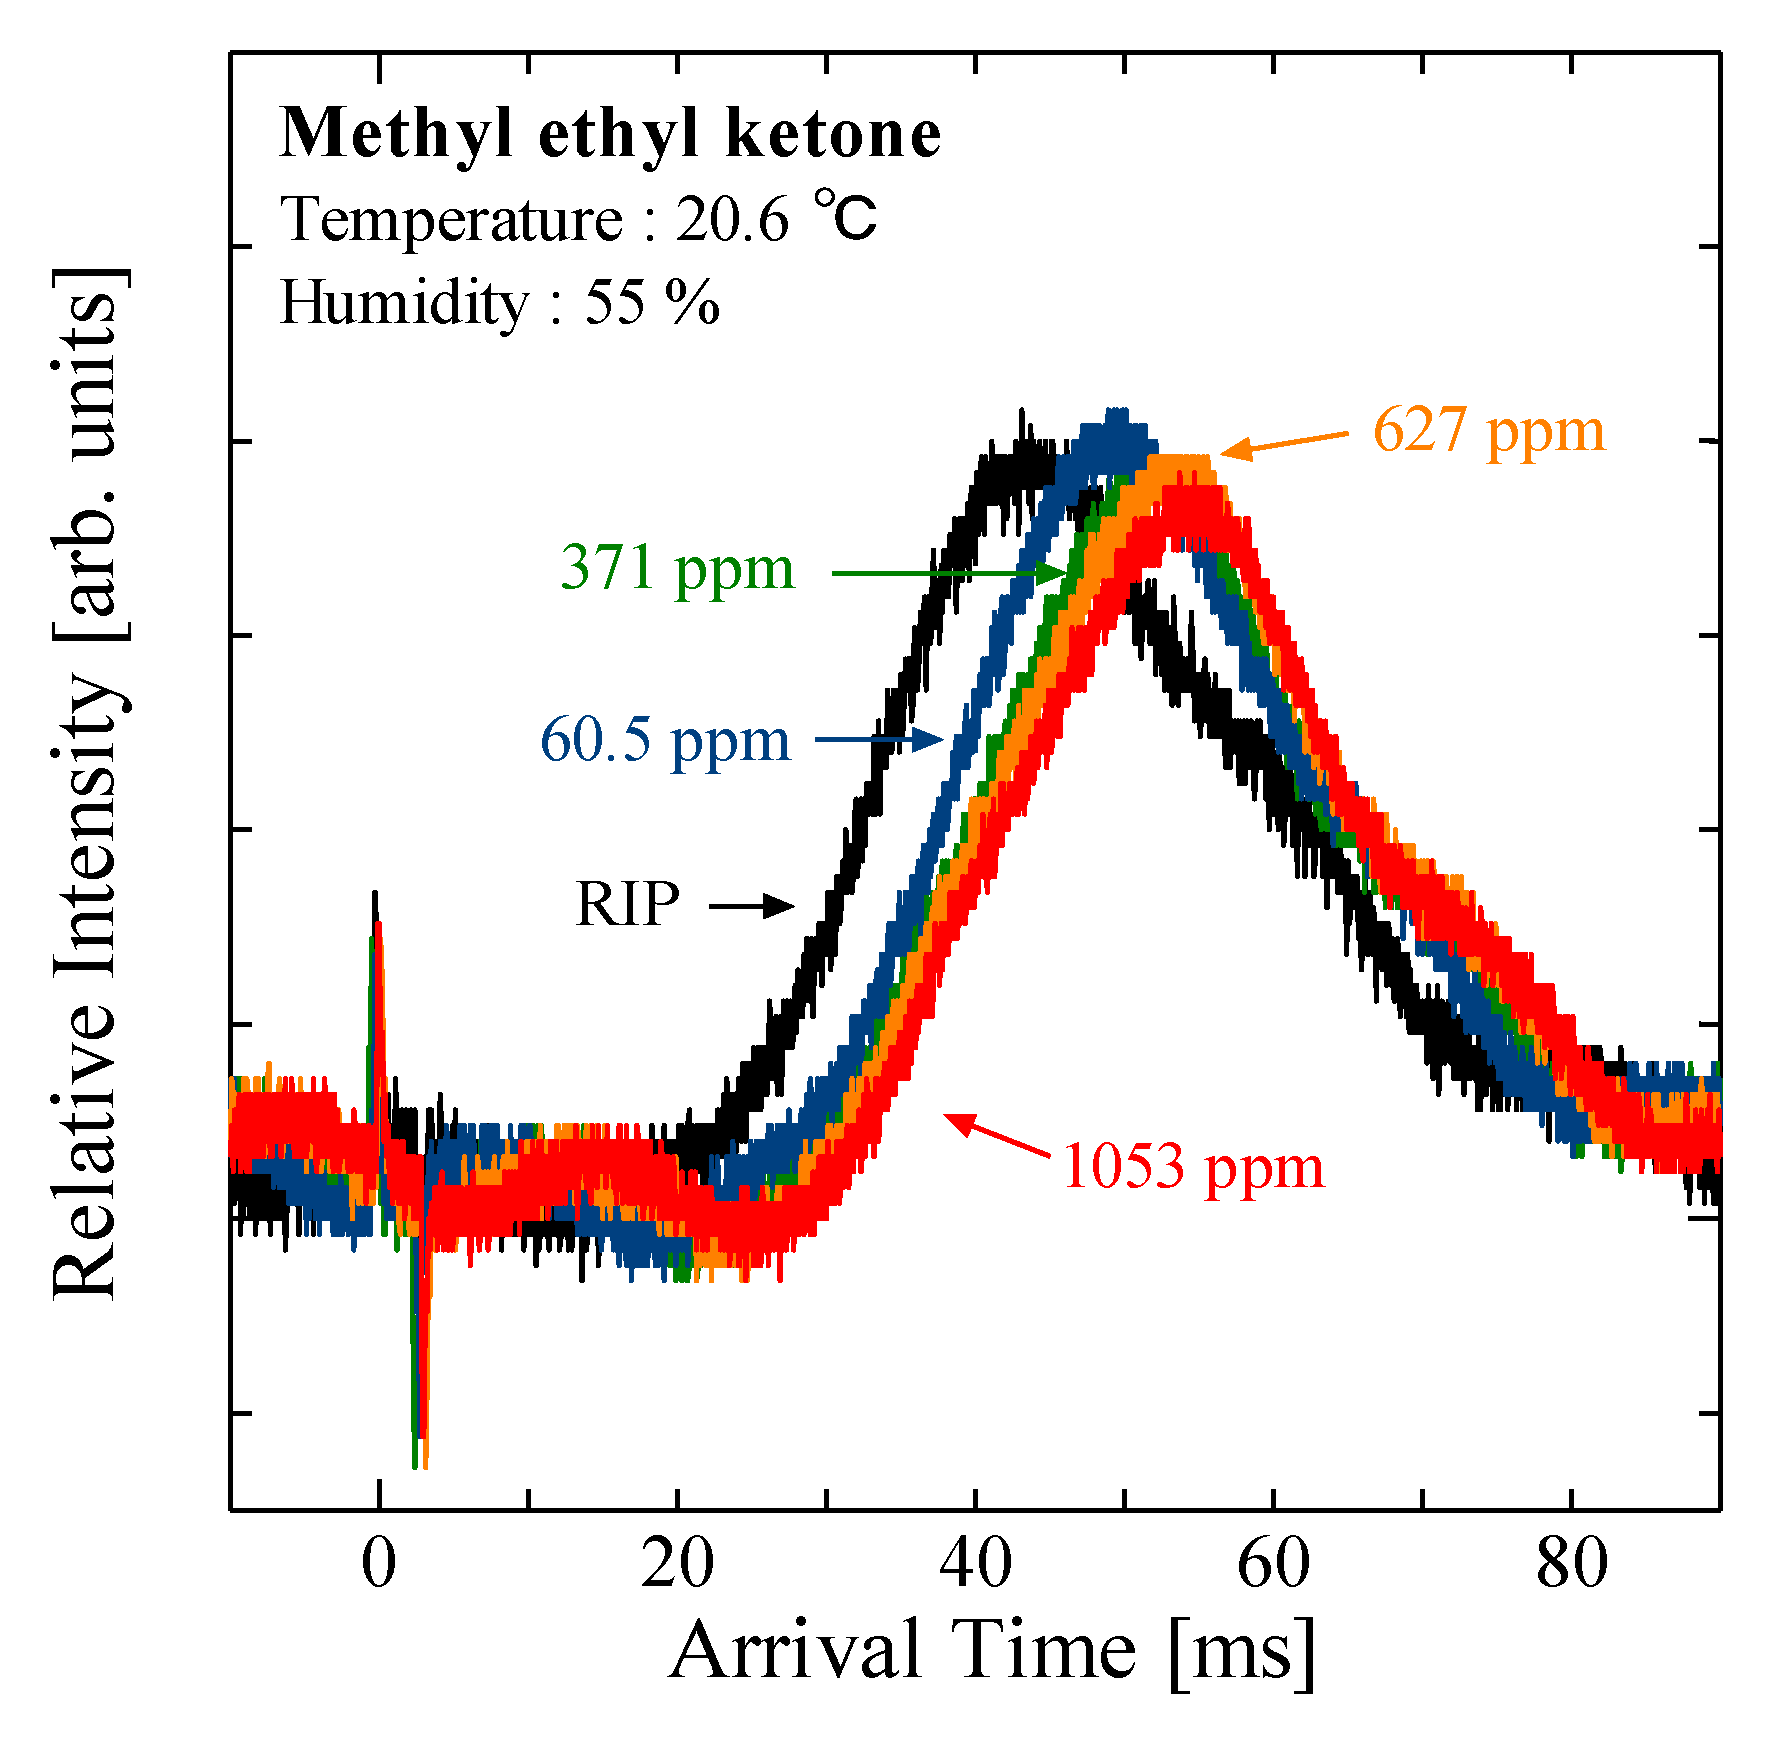
The arrival-time spectra of MEK at concentrations of 60.5, 371, 627, and 1053 ppm are shown in Figure 4, for the same ambient conditions. Table 3 summarizes the relationship between MEK concentration and nominal arrival time, based on Gaussian fitting. The RIP arrival time was 43.4 ms with a temperature of 20.6 °C and humidity of 55%. As for the nominal ethanol peak, the nominal peak of MEK was observed to shift to a longer arrival time as the concentration of MEK increased, likely owing to the spectral intensity of MEK increasing relative to that of the water cluster. The arrival time of MEK is greater than that of ethanol at the same concentration because of the larger molecular size of MEK.
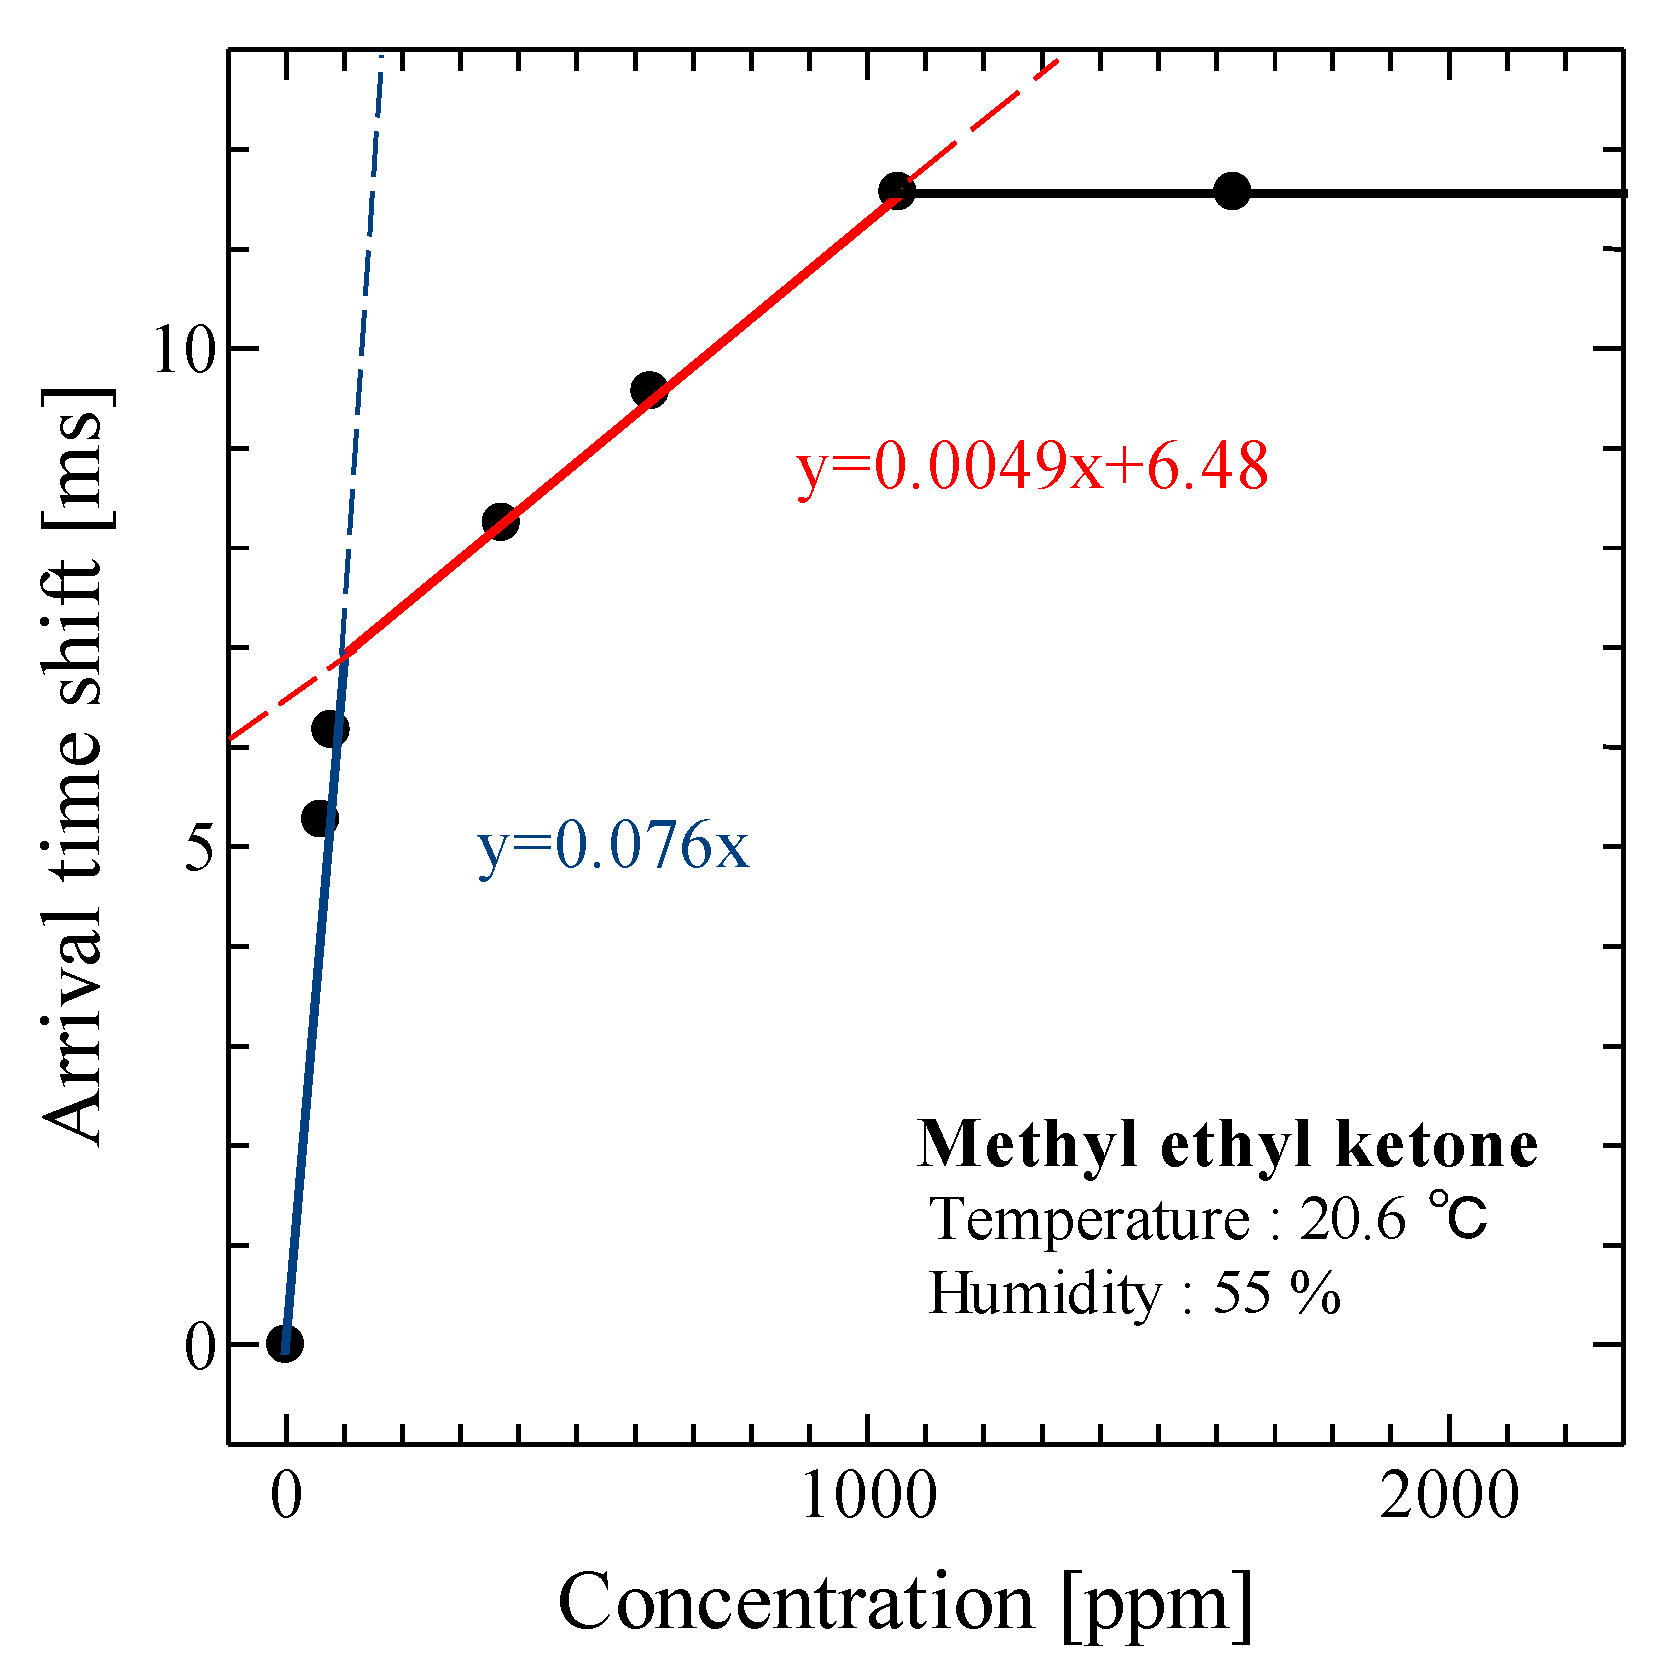
A calibration curve for MEK at concentrations of 60.5–1629 ppm is shown in Figure 5. We could not create a calibration gas for MEK at concentrations of <60.5 ppm because of the limitations of the calibration-gas generator. The slope of the calibration curve decreased in two steps at around 70 and 1000 ppm. At high concentrations, the shift in the nominal arrival time decreased as the ion production saturated and the MEK concentration approached the limit of ionizability. No shift was observed as the MEK concentration approached the limit of ionizability at ~1000 ppm. This trend was not observed with the calibration curve of ethanol.
These experiments were performed under similar environmental conditions (19.8 °C and 54% RH for ethanol, 20.6 °C and 55% RH for MEK). This suggests that MEK may have a larger ionizable quantity than ethanol at the same concentration due to its higher proton affinity (ethanol, 779.4 kJ·mol−1 [22]; MEK, 827.3 kJ·mol−1 [23]). The nominal arrival-time shift of MEK at up to 70 ppm is therefore greater than that of ethanol. Furthermore, MEK displays a significant decrease in the slope of the calibration curve at high concentrations. The lower limit of quantification for MEK (60.5 ppm) is lower than that of ethanol (75.2 ppm), with MEK being ionizable because of its higher proton affinity, even at low concentrations.
At high concentrations, MEK reaches the limit of ionizability at ~1000 ppm, with no nominal arrival-time shift being observed above this concentration. MEK reaches the limit of ionizability at a lower concentration than ethanol because of its higher proton affinity.
The nominal peak of a chemical substance overlapped with that of the water cluster and thus shifts with changes in concentration, shifting more at low concentrations and less at high concentrations. No nominal peak shift occurs when the sample concentration reaches the limit of ionizability. The higher the proton affinity, the greater the arrival-time shift at low concentrations because a substance with a high proton affinity can be easily ionized. Although the lower limit of quantification is lower for a substance with a higher proton affinity, the upper limit of quantification is also lower because the concentration at which the limit of ionizability is reached is also lower. In general, the dynamic range of IMS is often limited to less than two orders. Ahrens et al. obtained the calibration curve of ethanol monomer for the range of 50 to 530 ppt [2]. In contrast, we can measure the dynamic range of chemical substances over three orders using the method proposed by the authors (Ethanol: 75.2–2155.4 ppm).
Future studies will examine measurement accuracy and the high-concentration limit of quantitative analysis under different temperature and humidity conditions. °Calibration data for other substances are also required to extend the range of measurements possible.

4. Conclusions

The range of concentrations measurable by IMS was extended using an analysis technique based on a calibration curve obtained from the arrival-time shift in the nominal spectrum of a substance overlapped with that of water clusters. Quantitative analysis of chemical substances with a high proton affinity was possible at high concentrations (~1000 ppm).
MEK and ethanol were used to investigate the lower and upper limits of quantification and their dependence on the substance was analyzed. The following observations were made.
  • At high concentrations, the arrival-time shift decreases as ion production saturates and the concentration of the substance approaches the limit of ionizability; no shift occurs when that limit is reached.
  • The higher the proton affinity, the greater the arrival time shift at low concentrations, and the lower limit of quantification.
  • The higher the proton affinity, the lower the upper limit of quantification, with the concentration at which a substance reaches the limit of ionizability at high concentrations decreasing.
In general, the dynamic range of IMS is often limited to less than two orders. We can measure the dynamic range of chemical substances over three orders using the method proposed by the authors. A calibration curve obtained in this study is derived from the shift in nominal peaks including multimeric complexes at high concentrations. This method is effective in work environments where concentrations of chemical substances change in a wide range.
We conclude that the concentration estimation method based on the nominal arrival-time shift could be applied accurately in quantitative analyses at both low and high concentrations.

Author Contributions

Conceptualization, K.T.; methodology, K.T.; validation, K.T. and N.S.; resources, K.T. and N.S.; data curation, K.T.; writing—original draft preparation, K.T. and N.S.; writing—review and editing, K.T. and N.S.; supervision, K.T.; project administration, K.T. All authors have read and agreed to the published version of the manuscript.

Funding

This research received no external funding.

Institutional Review Board Statement

Not applicable.

Informed Consent Statement

Not applicable.

Data Availability Statement

Experimental data are available from the corresponding author upon reasonable request.

Conflicts of Interest

The authors declare no conflict of interest.

References

  1. Shi, J.; Bao, Y.; Xiang, F.; Wang, Z.; Ren, L.; Pang, X.; Wang, X.; Han, X.; Ning, P. Pollution Characteristics and Health Risk Assessment of VOCs in Jinghong. Atmosphere 2022, 13, 613. [Google Scholar] [CrossRef]
  2. Han, L.; Chen, L.; Li, K.; Bao, Z.; Zhao, Y.; Zhang, X.; Cen, K. Source Apportionment of Volatile Organic Compounds (VOCs) during Ozone Polluted Days in Hangzhou, China. Atmosphere 2019, 10, 780. [Google Scholar] [CrossRef]
  3. Zhang, L.; Wang, X.; Li, H.; Cheng, N.; Zhang, Y.; Zhang, K.; Li, L. Variations in Levels and Sources of Atmospheric VOCs during the Continuous Haze and Non-Haze Episodes in the Urban Area of Beijing: A Case Study in Spring of 2019. Atmosphere 2021, 12, 171. [Google Scholar]
  4. Mokalled, T.; Adjizian Gérard, J.; Abboud, M.; Liaud, C.; Nasreddine, R.; Le Calvé, S. An Assessment of Indoor Air Quality in the Arrivals Hall of Beirut–Rafic Hariri International Airport: Monitoring of VOCs and NO2. Atmosphere 2021, 12, 400. [Google Scholar]
  5. Sakunkoo, P.; Phonphinyo, S.; Maneenin, N.; Jirapornkul, C.; Limmongkon, Y.; Rayubkul, J.; Thongtip, S.; Sangkham, S. Comparison of Volatile Organic Compound Concentrations in Ambient Air among Different Source Areas around Khon Kaen, Thailand. Atmosphere 2021, 12, 1694. [Google Scholar]
  6. Konar, S. Information as regulation: The effect of community right to know laws on toxic emissions. J. Environ. Econ. Manag. 1997, 32, 109–127. [Google Scholar] [CrossRef]
  7. Takaya, K.; Nakaoka, H.; Suzuki, N.; Nakayama, Y.; Shimoda, M.; Todaka, E.; Mori, C. Prospects for development of portable real-time VOC analyzer. Jpn. J. Clin. Ecol. 2017, 26, 92–97. [Google Scholar]
  8. Vehviläinen, T.; Lindholm, H.; Rintamäki, H.; Pääkkönen, R.; Hirvone, A.; Niemi, O.; Vinha, J. High indoor CO2 concentrations in an office environment increases the transcutaneous CO2 level and sleepiness during cognitive work. J. Occup. Environ. Hyg. 2016, 13, 19–29. [Google Scholar] [CrossRef] [PubMed]
  9. Ahmadpour, E.; Halle, S.; Valois, I.; Ryan, P.E.; Haddad, S.; Rodriguez, M.; Aroussi, B.E.; Simard, S.; Delpla, I.; Proulx, F.; et al. Temporal and spatial variations in the levels of prominent airborne disinfection by-products at four indoor swimming pools. J. Occup. Environ. Hyg. 2022, 4, 185–196. [Google Scholar] [CrossRef] [PubMed]
  10. Wilson, M.P.; Hammond, S.K.; Nicas, M.; Hubbard, A.E. Worker Exposure to Volatile Organic Compounds in the Vehicle Repair Industry. J. Occup. Environ. Hyg. 2007, 4, 301–310. [Google Scholar] [CrossRef] [PubMed]
  11. Ahrens, A.; Möhle, J.; Hitzemann, M.; Zimmermann, S. Novel ion drift tube for high-performance ion mobility spectrometers based on a composite material. Int. J. Ion Mobil. Spectrom. 2020, 23, 75–81. [Google Scholar] [CrossRef]
  12. Borsdorf, H.; Schelhorn, H.; Flachowsky, J.; Döring, H.-R.; Stach, J. Determination of n-alkanes and branched chain alkanes by corona discharge ion mobility spectrometry. Int. J. Ion Mobil. Spectrom. 1999, 2, 9–14. [Google Scholar]
  13. Tabrizchi, M.; Khezri, E. The effect of ion molecule reactions on peaks. Int. J. Ion Mobil. Spectrom. 2008, 11, 19–25. [Google Scholar] [CrossRef]
  14. Takaya, K.; Hagiwara, M.; Matoba, S.; Takaya, M.; Shibata, N. A real-time gas monitoring system based on ion mobility spectrometry for workplace environmental measurements. Ind. Health 2022, 60, 40–46. [Google Scholar] [CrossRef]
  15. Takaya, K.; Hagiwara, M.; Matoba, S.; Takaya, M.; Shibata, N. Development of Real-Time Gas Monitor Using an Ion Mobility Spectrometer for Work Environment Measurement. J. Occup. Saf. Health 2021, 14, 141–147. [Google Scholar] [CrossRef]
  16. McDaniel, R.W.; Mason, E.A. The Mobility and Diffusion of Ions in Gases; John Wiley & Sons: New York, NY, USA, 1973. [Google Scholar]
  17. Mason, E.A.; McDaniel, R.W. Transport Properties of Ions in Gases; John Wiley & Sons: New York, NY, USA, 1988. [Google Scholar]
  18. Takaya, K.; Hasegawa, Y.; Koizumi, T.; Tanuma, H. Mobilities of polyatomic molecular ions in He gas. Int. J. Ion Mobil. Spectrom. 2016, 19, 183–187. [Google Scholar] [CrossRef]
  19. Takaya, K.; Hasegawa, Y.; Koizumi, T. Mobilities of CH3O+, C2H5O+ and C3H7O+ ions in He gas. Chem. Phys. Lett. 2017, 679, 21–24. [Google Scholar] [CrossRef]
  20. Takaya, K.; Hasegawa, Y.; Koizumi, T. Comparison of isomeric C3H7O+ ion mobilities using fragment ions from 2-butanol and tert-butanol in He and Ne. Chem. Phys. Lett. 2020, 739, 137045. [Google Scholar] [CrossRef]
  21. Eiceman, G.A.; Karpas, Z. Ion Mobility Spectrometry, 2nd ed.; CRC Press: Boca Raton, FL, USA, 2005. [Google Scholar]
  22. Tabrizchi, M.; Shooshtari, S. Proton affinity measurements using ion mobility spectrometry. J. Chem. Thermodyn. 2003, 35, 863–870. [Google Scholar] [CrossRef]
  23. Hunter, E.P.L.; Lias, S.G. Evaluated Gas Phase Basicities and Proton Affinities of Molecules: An Update. J. Phys. Chem. Ref. Data 1998, 27, 413–656. [Google Scholar] [CrossRef]
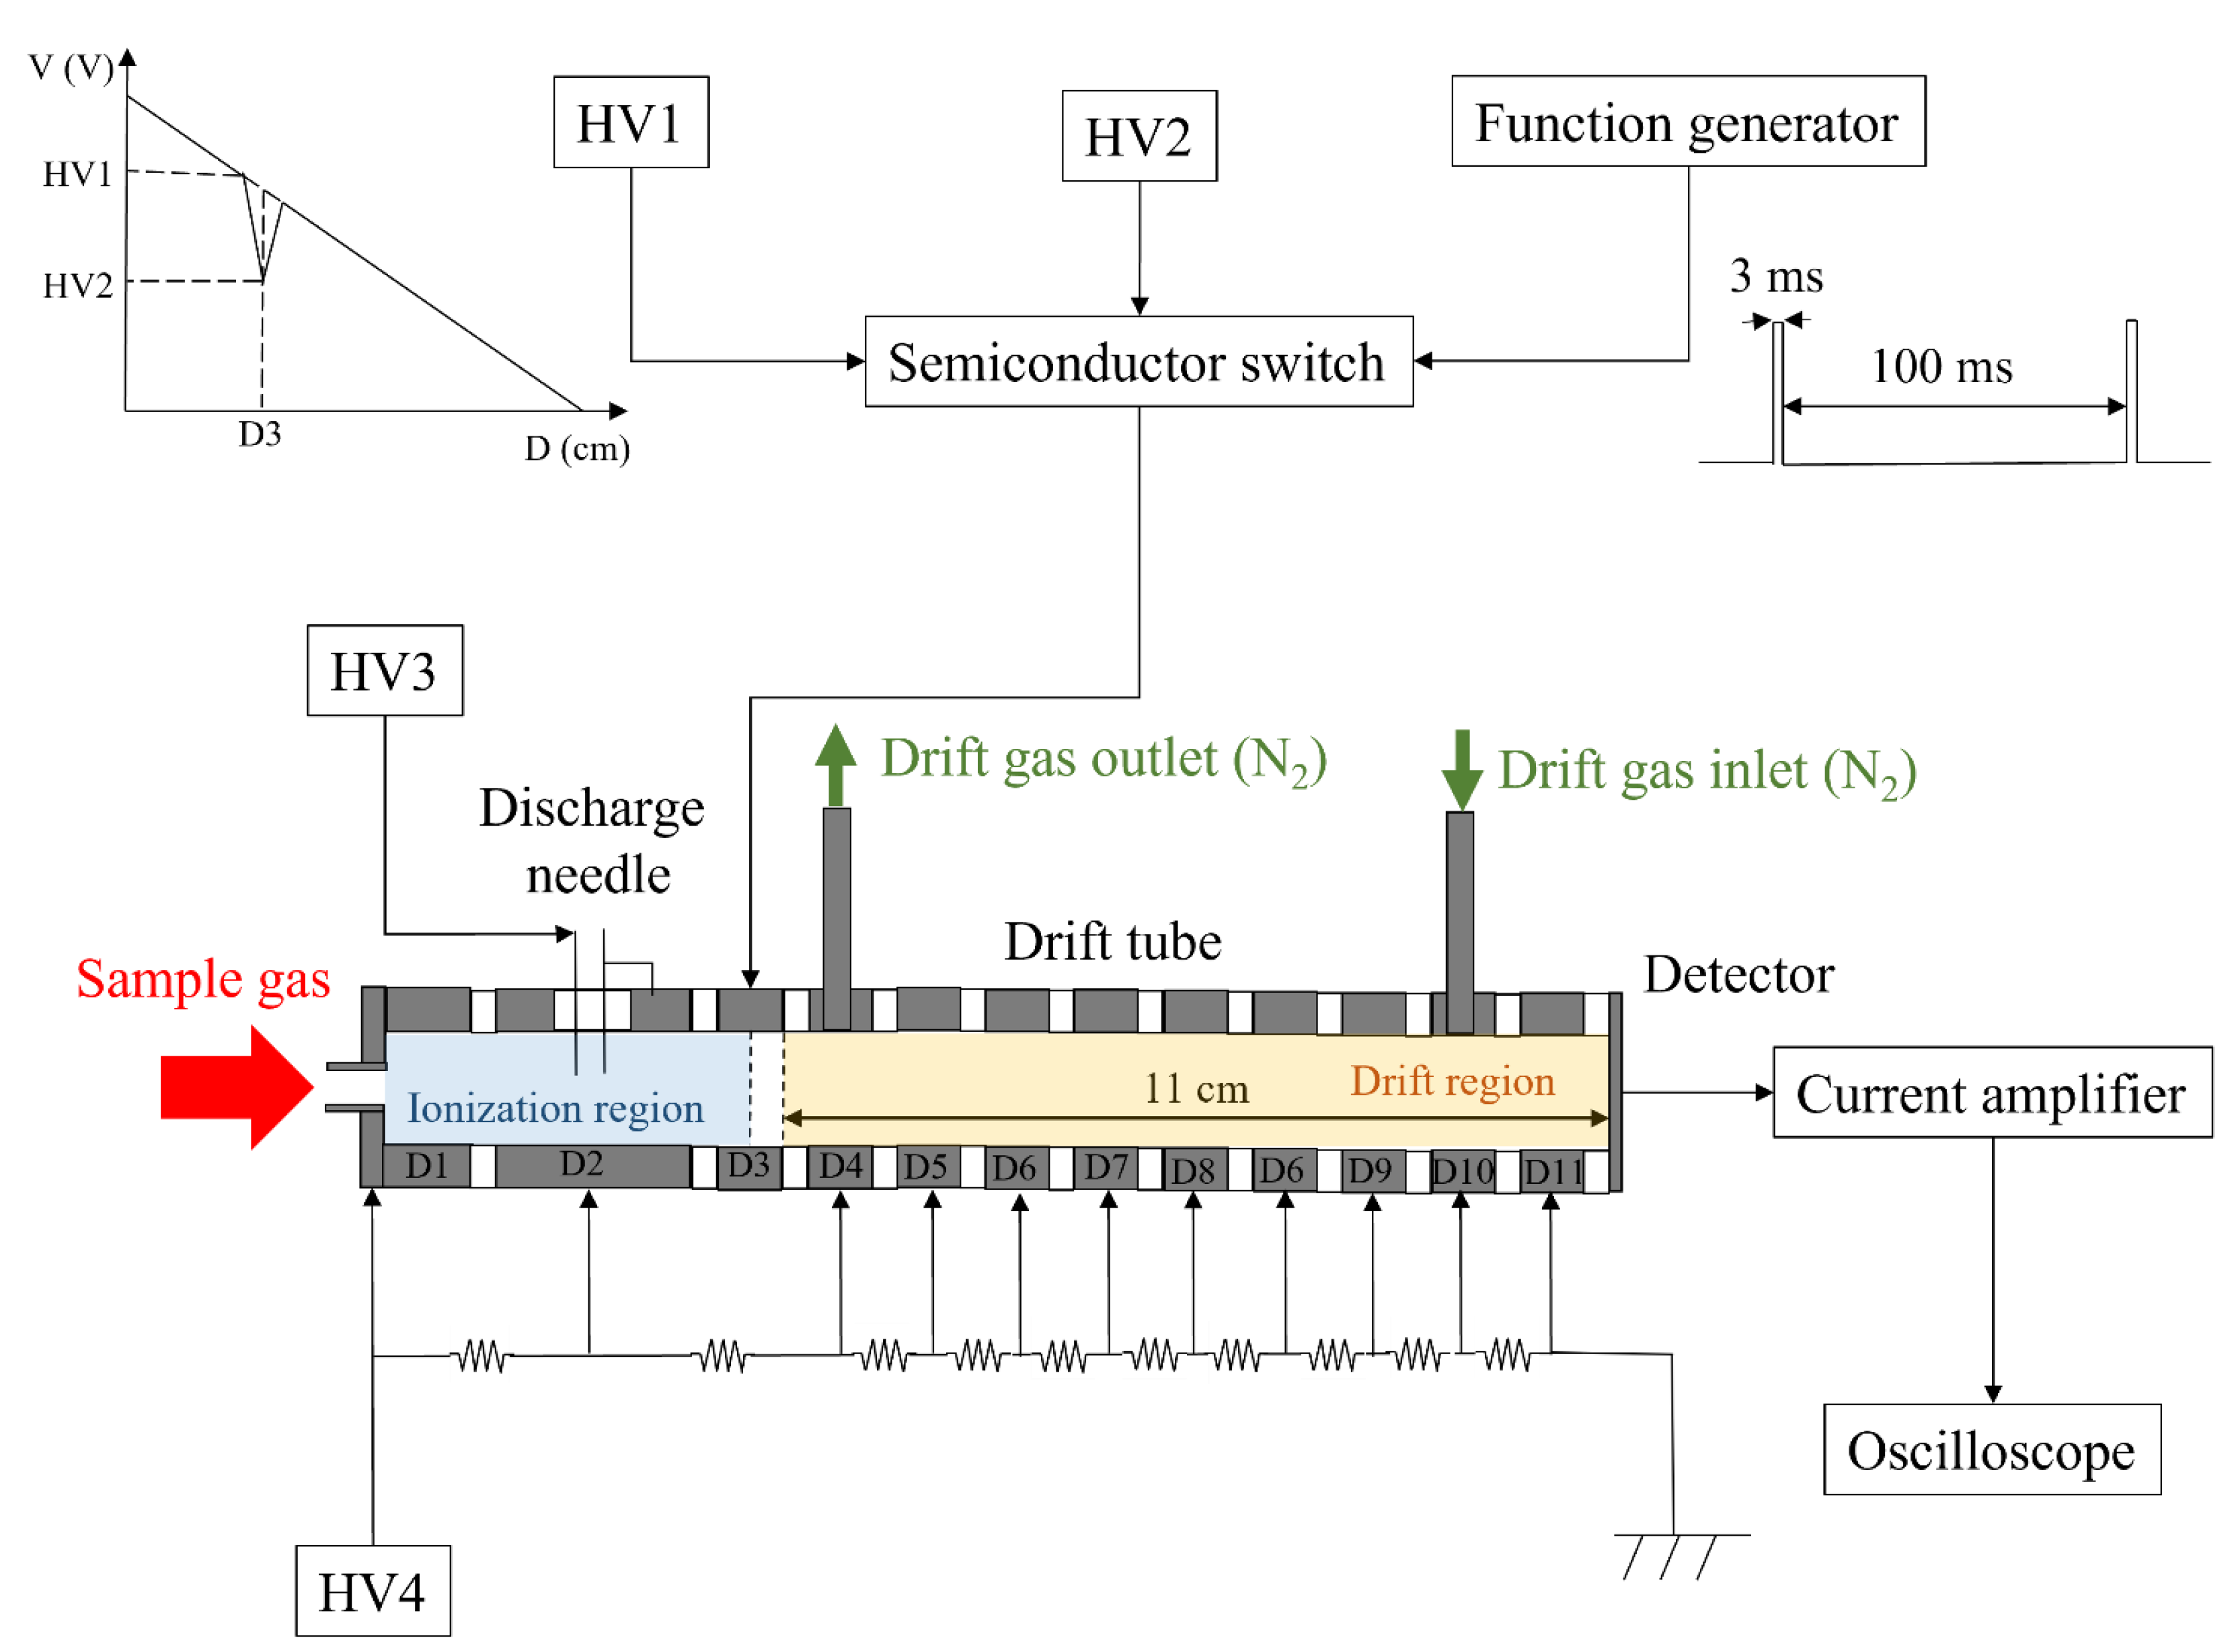
Figure 1. Schematic diagram of the experimental apparatus. Sample vapor is ionized by corona discharge from a high-voltage (HV) supply (discharge needle = 4.7 kV and 2.6 kV).
Atmosphere 13 01380 g001
Figure 2. Arrival-time spectra of ethanol (75.2, 325.7, 601.4, and 1098.7 ppm). These spectra were measured with an electric field, E, of 186 V cm−1. The reactant ion peak (RIP) is the background spectrum obtained from water cluster ions.
Atmosphere 13 01380 g002
Figure 3. Relationship between concentration and arrival-time shift of ethanol. The open circle was not included in the calibration curve because 40.8 ppm is not a shift from the RIP. The measurement error of the flow rate was estimated to be ~3%.
Atmosphere 13 01380 g003
Figure 4. Arrival-time spectra of MEK (60.5, 371, 627, and 1053 ppm), measured with an electric field, E, of 186 V cm−1. The reactant ion peak (RIP) is the background spectrum obtained from water cluster ions.
Atmosphere 13 01380 g004
Figure 5. Relationship between concentration and arrival-time shift for MEK. The measurement error of the flow rate was estimated to be ~3%.
Atmosphere 13 01380 g005
Table 1. Dimensions and operating parameters of IMS.
ParameterThis StudyAhrens et al. [11]Tabrizchi et al. [13]
Ionization region 4.2 cm1 cm4 cm
Drift region11 cm3.1 cm11 cm
Corona discharge voltage 4.7 kV, 2.6 kV Electrospray
ionization
7 kV
Drift field186 V·cm−1282.5 V·cm−1466 V·cm−1
TemperatureRoom temperatureRoom temperatureRoom temperature
~270 °C
Shutter grid interval100 ms25 ms20 ms
Flow rate of sample gas200 mL·min−110 mL·min−1500 mL·min−1
Flow rate of drift gas50 mL·min−1120 mL·min−1700 mL·min−1
Table 2. Relationship between ethanol concentration and arrival time.
Concentration (ppm)Arrival Time (ms)
75.244.9
325.746.2
601.447.7
1098.750.6
Table 3. Relationship between MEK concentration and arrival time.
Concentration (ppm)Arrival Time (ms)
60.548.7
37151.7
62753.0
105355.0
Publisher’s Note: MDPI stays neutral with regard to jurisdictional claims in published maps and institutional affiliations.