Article

A Southern Portuguese Margin Perspective of Marine Isotope Stage 47—An Interglacial in the 41 kyr World

1
Instituto Português do Mar e da Atmosfera, Divisão de Geologia e Georecursos Marinhos, 1495-165 Alges, Portugal
2
Centro de Ciências do Mar (CCMAR), Universidade do Algarve, Campus de Gambelas, 8005-139 Faro, Portugal
3
Dipartimento di Scienze della Terra e Geoambientali, Università degli Studi di Bari Aldo Moro, 70125 Bari, Italy
4
MARUM, Universität Bremen, 28359 Bremen, Germany
*
Author to whom correspondence should be addressed.
Atmosphere 2022, 13(9), 1378; https://doi.org/10.3390/atmos13091378
Submission received: 5 July 2022 / Revised: 4 August 2022 / Accepted: 23 August 2022 / Published: 28 August 2022
(This article belongs to the Section Climatology)

Abstract

:
In order to better understand interglacial climate variability within the 41 kyr world, we produced high-resolution climate records for interglacial Marine Isotope Stage (MIS) 47 (1424–1452 ka) at IODP Site U1387 (36°48′ N, 7°43′ W) on the southern Portuguese margin. Using benthic and planktonic foraminifera stable isotope records, Uk’37 sea-surface temperature (SST), and plankton assemblage data we investigated Mediterranean Outflow Water (MOW) and surface water conditions. The MOW-level records indicate a poorly ventilated and sluggish bottom current during the MIS 48/MIS 47 transition in association with the insolation maximum, whereas a well-ventilated MOW formed a contourite layer during the second insolation maximum. The benthic δ18O record shows a fairly abrupt change during the deglaciation of MIS 48, while the surface waters experienced a terminal stadial event that was associated with initial cooling and freshening followed by stepwise warming until interglacial SST was reached at 1450 ka. Interglacial conditions with SST of 24 °C or higher persisted until 1427 ka, although warm SST prevailed into MIS 46. The persistent and prolonged warmth is attributed to a northward expansion of the subtropical gyre during MIS 47 as reflected by the dominance of subtropical-tropical planktonic foraminifera species and the presence of warm water coccolithophores taxa.

Graphical Abstract

1. Introduction

Earth’s climate system has varied across multiple timescales in the past due to orbital forcing and internal feedback. Prior to the Mid-Pleistocene Transition (ca. 1250–650 ka; e.g., [1]), glacial/interglacial cycles of the Early Pleistocene (780–2580 ka) were more symmetric and dominantly driven by the 41 kyr cycle of Earth’s obliquity [2] (following [3] we use ka when referring to fixed dates in time and kyr when discussing duration and rates). Precession still played an important role [4,5], but its signal in the ice volume (benthic δ18O) record was canceled out due to the partially out-of-phase waxing and waning of the northern and southern hemispheres ice sheets [6,7]. Although the number of high-resolution records that extend into the early Pleistocene prior to the Mid-Pleistocene Transition is still limited [4,8,9,10,11,12] were able to show that millennial-scale variability was also a feature of early Pleistocene climate variability. Understanding the drivers and impacts of millennial-scale variability during the Pleistocene is highly important because those abrupt events are associated with tipping points in the Earth’s climate system [13], which might occur again in the future. Major systems showing tipping behavior include the Atlantic Meridional Overturning Circulation (AMOC), Greenland ice-sheet melting and shifts in the West African Monsoon. A change in one can provoke a tipping cascade. For example, increased meltwater run-off from Greenland leads to freshening in the North Atlantic’s areas where deep-water is formed, causing a slowdown of the AMOC, which, through its effect on sea-surface temperatures, can destabilize the West African Monsoon causing drought. Abrupt transitions in northern hemisphere ice-sheet melting and associated AMOC slowdown have been a persistent feature during the past 3200 ka [10,14] and include the terminal stadial events that mark the deglaciations of at least the last 1450 ka [15].
On the southwestern and southern Portuguese margin those terminal stadial events were associated with extreme cooling in the surface waters, in particular during the Mid-Pleistocene Transition [16,17], and a southward displacement of the Polar front into the lower mid-latitudes of the North Atlantic [18]. Prior to the Mid-Pleistocene Transition, coldest sea-surface temperatures (SST) on the southern Portuguese margin did, however, not necessarily occur during the terminal stadial event [19]. In addition, the planktonic foraminifera δ18O records of Integrated Ocean Drilling Program (IODP) Sites U1385 [15] and U1387 [19,20] (Figure 1) point to more gradual glacial/interglacial transitions for Marine Isotope Stages (MIS) 29 to 45 [21], i.e., prior to and during the early phase of the Mid-Pleistocene Transition, with warmest surface water conditions not being reached until later within the interglacial [19]. For the deglaciation of MIS 48, however, planktonic and benthic foraminifera isotope records from the North Atlantic [10,20,21] indicate an abrupt transition into MIS 47 that mimics those observed during the Mid-Pleistocene Transition period of MIS 21 to MIS 25 [16,17]. Reconstructing the exact nature of this transition at IODP Site U1387 is therefore one of the aims of the current study.
The study’s second aim is to understand the interglacial climate evolution and the potential variability of MIS 47, which, similar to MIS 31, is sometimes referred to as a “super-interglacial”. MIS 47 encompasses two insolation maxima and is therefore identified as a continued interglacial by [28]. On a global scale, the sea level during MIS 47 was slightly lower than today [29], although a reconstruction based on a Mediterranean Sea isotope record indicates that the sea level in that region might have been up to 20 m higher [30]. So far, no information on atmospheric greenhouse gas concentrations exists for MIS 47, but evidence for periods prior to (“MIS 50”) and after (MIS 33 to MIS 37) indicate atmospheric carbon dioxide concentrations in the same range or not significantly higher than during many of the middle and late Pleistocene interglacial periods [31,32]. We, therefore, work with the hypothesis that climate forcing during MIS 47 was basically not much different than during other early Pleistocene glacial/interglacial cycles, although local climate response might have been much different.
Using southern Portuguese margin IODP Site U1387 (36°48′ N, 7°43′ W) (Figure 1) as target for our multi proxy, high-resolution study on the climatic evolution during late MIS 48 and interglacial MIS 47 allows us to directly link high-latitude ice-sheet melting and AMOC tipping elements to the low-latitude process of the North African monsoon. The link to the North African monsoon is provided by the signal exported from the (eastern) Mediterranean Sea into the Mediterranean Outflow Water (MOW) that forms the bottom water current at the location of IODP Site U1387. Following, or based on the recent study of [33] during, insolation maxima, increased monsoonal precipitation led to increased runoff from the Nile River and the formation of sapropel layers in the eastern Mediterranean Sea. The related hydrographic changes subsequently affected the MOW, which became less well ventilated and a more sluggish current in the Gulf of Cadiz as evidenced by various paleoceanographic studies e.g., [19,34,35].
For reconstructing the climatic evolution during the deglaciation of MIS 48 and during interglacial MIS 47 and the subsequent return to glacial conditions during MIS 46, we produced centennial-scale proxy records that allow us to trace changes at the level of the MOW and in the surface waters. Benthic foraminifera stable isotope data and the identification of contourite layers in the sediments indicate MOW changes. Surface water conditions are reconstructed using the stable isotope records for planktonic foraminifera Globigerina bulloides and Globigerinoides ruber white, SST estimated from lipid biomarker concentrations, and evidence from the plankton foraminifera and calcareous nannofossil assemblages to infer the presence of subtropical or subpolar surface waters.

2. Materials and Methods

2.1. Regional Setting and Material

IODP Site U1387 was drilled into the Faro Drift on the southern Portuguese margin (Gulf of Cadiz) at a water depth of 559 m during IODP Expedition 339–Mediterranean Outflow Water [36]. The contourite depositional system on the middle slope offshore Faro consists of the Faro-Albufeira mounded drift, short Faro drift, the Faro-Cadiz sheeted drift and the Bartolomeu Dias sheeted drift [25,26,27] (Figure 1). The contourite depositional system expands laterally from the Gulf of Cadiz to the western Iberian margin [25] and reaches a thickness of 730 m at Site U1387 [36]. It was built by the upper MOW branch since the early Pliocene [25,36].
Nowadays the region is influenced by surface waters from the subtropical gyre that are advected into the Gulf of Cadiz by the eastern branch of the Azores Current and by the Gulf of Cadiz Slope Current [37,38]. In addition, the Portugal Current, one of the eastern boundary recirculation currents of the North Atlantic’s subtropical gyre, transports surface and subsurface waters into the latitudes of the Gulf of Cadiz. The Portugal Current’s subsurface component is the Eastern North Atlantic Central Water (ENACW) of subpolar origin [39], which, along the western Iberian margin, is encountered between 250 and 500 m water depth and marked by a salinity minimum between 450 and 500 m [40,41]. The subpolar ENACW is overlain by its subtropical counterpart (ENACWst) that is formed by winter convection along the Azores Front and transported as a subsurface component of the Azores Current [42,43]. In the region of the Gulf of Cadiz and the SW Portuguese margin, the ENACWst occupies depths between 100 and 250 m and is marked by a salinity maximum of around 100 m [40,41]. During the upwelling season (May-October) nutrient-rich waters upwelled off Cape São Vicente (Figure 1b) or more locally restricted off Cape Santa Maria (near Faro) can also temporarily influence surface water conditions near Site U1387 [44,45].
The Gulf Stream, North Atlantic Current, Portugal Current, Canary Current, North Equatorial Current, and Antilles Current represent the circulation loop of the North Atlantic’s subtropical gyre and the subarctic (subpolar) front associated with the northern boundary of the central (“50° N”) branch of the North Atlantic Current e.g., [22] marks the boundary between the subtropical and subpolar gyres (Figure 1a). The North Atlantic’s subtropical gyre has, however, another major current, namely the Azores Current that meanders across the basin and whose origin has been linked to the water mass transformation (MOW) in the Gulf of Cadiz e.g., [46]. The Azores Front (or subtropical front) marks the northern boundary of the Azores Current and movement of this front into more northern latitudes is seen as evidence of an expanded subtropical gyre [47].
Intermediate depths (500–1400 m) along the southern and western Iberian margin and within the NE Atlantic are characterized by MOW [41,48], which is sometimes also called (Atlantic) Mediterranean Water. The MOW is formed east of the Strait of Gibraltar (main sill depth of 280 m) by mixing the warm and saline subsurface outflow from the Mediterranean Sea with the surrounding North Atlantic water masses, whereby ENCAW has the highest contribution, but Antarctic Intermediate Water and upper Northeast Atlantic Deep Water also contribute [49,50]. The varying mixing of the water masses results in the formation of two MOW cores, an upper core between 500 and 800 m and a more saline, denser lower core between 1000 and 1400 m that spread along pathways in the Gulf of Cadiz (Figure 1b) and into the NE Atlantic [48,51,52]. Along the northern slope of the Gulf of Cadiz, a third core is observed at a mean depth of 500 m [52,53] and that core is the one that forms the bottom water current at the position of IODP Site U1387 [19]. The Mediterranean Sea outflow across the Strait of Gibraltar is a mixture of Levantine Intermediate Water and deep-water masses, such as the Western Mediterranean Deep Water and Tyrrhenian Dense Water [54,55]. The Levantine Intermediate Water is formed by deep convection in regions such as the southern Adriatic Sea, the southern Aegean Sea, and the Levantine Basin. Its formation in the eastern Mediterranean Sea, and thus close to the Nile River plume, makes it the primary exporter of the North African monsoon signal into the MOW.
The current study uses IODP Site U1387 sediment samples from the interval between 419.11 and 441.94 corrected meters composite depth (c-mcd) following the revised splice established by [20]. For the interval of MIS 47 and the surrounding transitions (424.8–436.27 c-mcd) the sample resolution was increased from the 12–13 cm spacing in [20] to an average of 3–4 cm.

2.2. Methods

The samples needed to increase the temporal resolution were prepared in the Sedimentology and Micropaleontology Laboratory of the Division for Marine Geology and Georesources of IPMA (Alges, Portugal) following the same procedure as described in [19,20]. Briefly, the sample was weighed before and after freeze-drying to obtain the dry weight and then subsampled for the different analyses. The subsamples for the stable isotope and planktonic foraminifera assemblage analyses were washed with tap water through a 63 μm-mesh and included a final washing with distilled water to separate the fraction < 63 µm and >63 µm. The residue > 63 µm was then dried in filter paper at 40 °C and its weight was determined. The weight of the fraction > 63 μm was used to calculate the weight-percent (wt.%) of the sand fraction in each sample ([weight > 63 μm/dry weight] × 100). In general, maxima in the wt.% sand indicate the presence of contourite layers and thus indicate periods with a higher velocity bottom current at the location of IODP Site U1387 [19]. The presence of gypsum crystals can, however, falsify the wt.% values, which in the study period applies in particular to the interval between 433.87 and 435.09 c-mcd. The gypsum crystals formed when the sediment cores were opened and the pyrite inside the sediment was exposed to oxygen and subsequently oxidized (as confirmed by sulfite isotope analyses of the gypsum; personal communication with M. Boettcher, Leibniz-Institute for Baltic Sea Research Warnemünde, D; in 2019).

2.2.1. Stable Isotope Analyses

For reconstructing physicochemical conditions in the MOW, we produced epibenthic foraminifera based on δ18O and δ13C records. Due to varying abundances, the records are spliced together using data obtained for either Planulina ariminensis or Cibicidoides pachyderma whereby adjustments for the δ13C values of C. pachyderma were made following [19], i.e., 0.3‰ were added to the C. pachyderma δ13C values. For the stable isotope analysis, 2–9 specimens of either species were collected from the fraction > 250 µm, whereby 2–3 specimens were normally analyzed in the mass spectrometer. For the planktonic foraminifera, stable isotope records 5–12 clean specimens of G. bulloides or 12–20 clean specimens of G. ruber white were selected from the fraction > 250 µm and submitted for analysis. For the planktonic foraminifera samples, about 3–6 specimens were analyzed, respectively, depending on sample weight. Analysis of some samples, especially for G. ruber white, was repeated to confirm the isotope values. Similar to the already existing, lower resolution benthic foraminifera and G. bulloides records [19,20,21], the isotope analyses were conducted at MARUM (University Bremen, Germany). The new samples, analyzed to increase the temporal resolution or to generate records for G. ruber white, were analyzed with the Thermo Fisher Scientific 253 plus gas isotope ratio mass spectrometer with a Kiel IV automated carbonate preparation device. During the period of analyses, repeatability was ±0.05‰ for δ13C and ±0.05–0.07‰ for δ18O based on repeated analyses of the in-house carbonate standard (ground Solnhofen limestone). The latter was calibrated against the NBS-19 reference material.

2.2.2. Lipid Biomarker Analyses

The samples for lipid biomarker analyses were prepared in the Biogeochemistry Laboratory of IPMA (Alges, Portugal) following the established procedure [18]. The organic compounds were extracted from freeze-dried and pulverized sediment material by sonication using dichloromethane and the extracts were then hydrolyzed with 6% potassium hydroxide in methanol to eliminate interferences from wax esters. The neutral lipids were extracted with hexane, evaporated to dryness under an N2 stream, and finally, derivatized with bis(trimethylsilyl)trifluoroacetamide. The lipids were analyzed in the Varian Gas chromatograph Model 3800 equipped with a septum programmable injector and a flame ionization detector. For the current study, we focus solely on the alkenone concentrations, namely those used to calculate the alkenone unsaturation index Uk’37. The Uk’37 values were converted into annual mean SST following [56].

2.2.3. Planktonic Foraminifera Assemblage

The planktonic foraminifera assemblage was analyzed using census counts in splits of the fraction > 250 µm and 150–250 µm, whereby about 200 (or more) specimens were identified in the fraction > 250 µm and about 100 specimens in the fraction 150–250 µm, with the aim of reaching a total count of 300 or more specimens. Species identification followed [57] for the extant species. For the interpretation of prevailing surface waters, we grouped the subtropical and tropical species together (see Appendix A for species lists), whereby the subtropical group also includes the extinct species Globigerinoides obliquus. The presence of polar species Neogloboquadrina pachyderma and subpolar species Turborotalita quinqueloba and Neogloboquadrina incompta are used to identify polar to subpolar surface waters incursions to the southern Portuguese margin. In addition, we are using the abundance of G. bulloides, which presence can indicate upwelling-related productivity on the western Iberian margin [58], and of subtropical species G. ruber white as support in the interpretation of their isotopic signals.

2.2.4. Coccolithophore Data

For the analysis of the calcareous nannofossil, flora samples were requested from the Bremen Core Repository at 8 to 13 cm resolution to obtain an average temporal resolution of 300 years. The preparation of the samples followed the established protocol of [59] and was conducted at the Dipartimento di Scienze della Terra e Geoambientali of Bari University Aldo Moro (Bari, Italy). The nannofossil flora was identified in the microscope slides using a polarizing optical microscope and performing a quantitative analysis by counting about 500 coccoliths in a variable number of fields (number of fields defined by the abundance of coccoliths in the respective sample). Further details and the full outcome of the calcareous nannofossil analysis are provided in [60]. For the current study, we focus solely on the percentage abundance of warm water taxa, i.e., species that are known to indicate warm and oligotrophic waters and are abundant in tropical-subtropical waters. For the IODP Site U1387 study, the warm water taxa include Discosphaera tubifera, Calciosolenia spp., Umbilicosphaera sibogae, and Umbilicosphaera foliosa as well as Helicosphaera pavimentum and Calcidiscus leptoporus subsp. small (<5 µm) [60].

2.3. Age Model and Sedimentation Rates

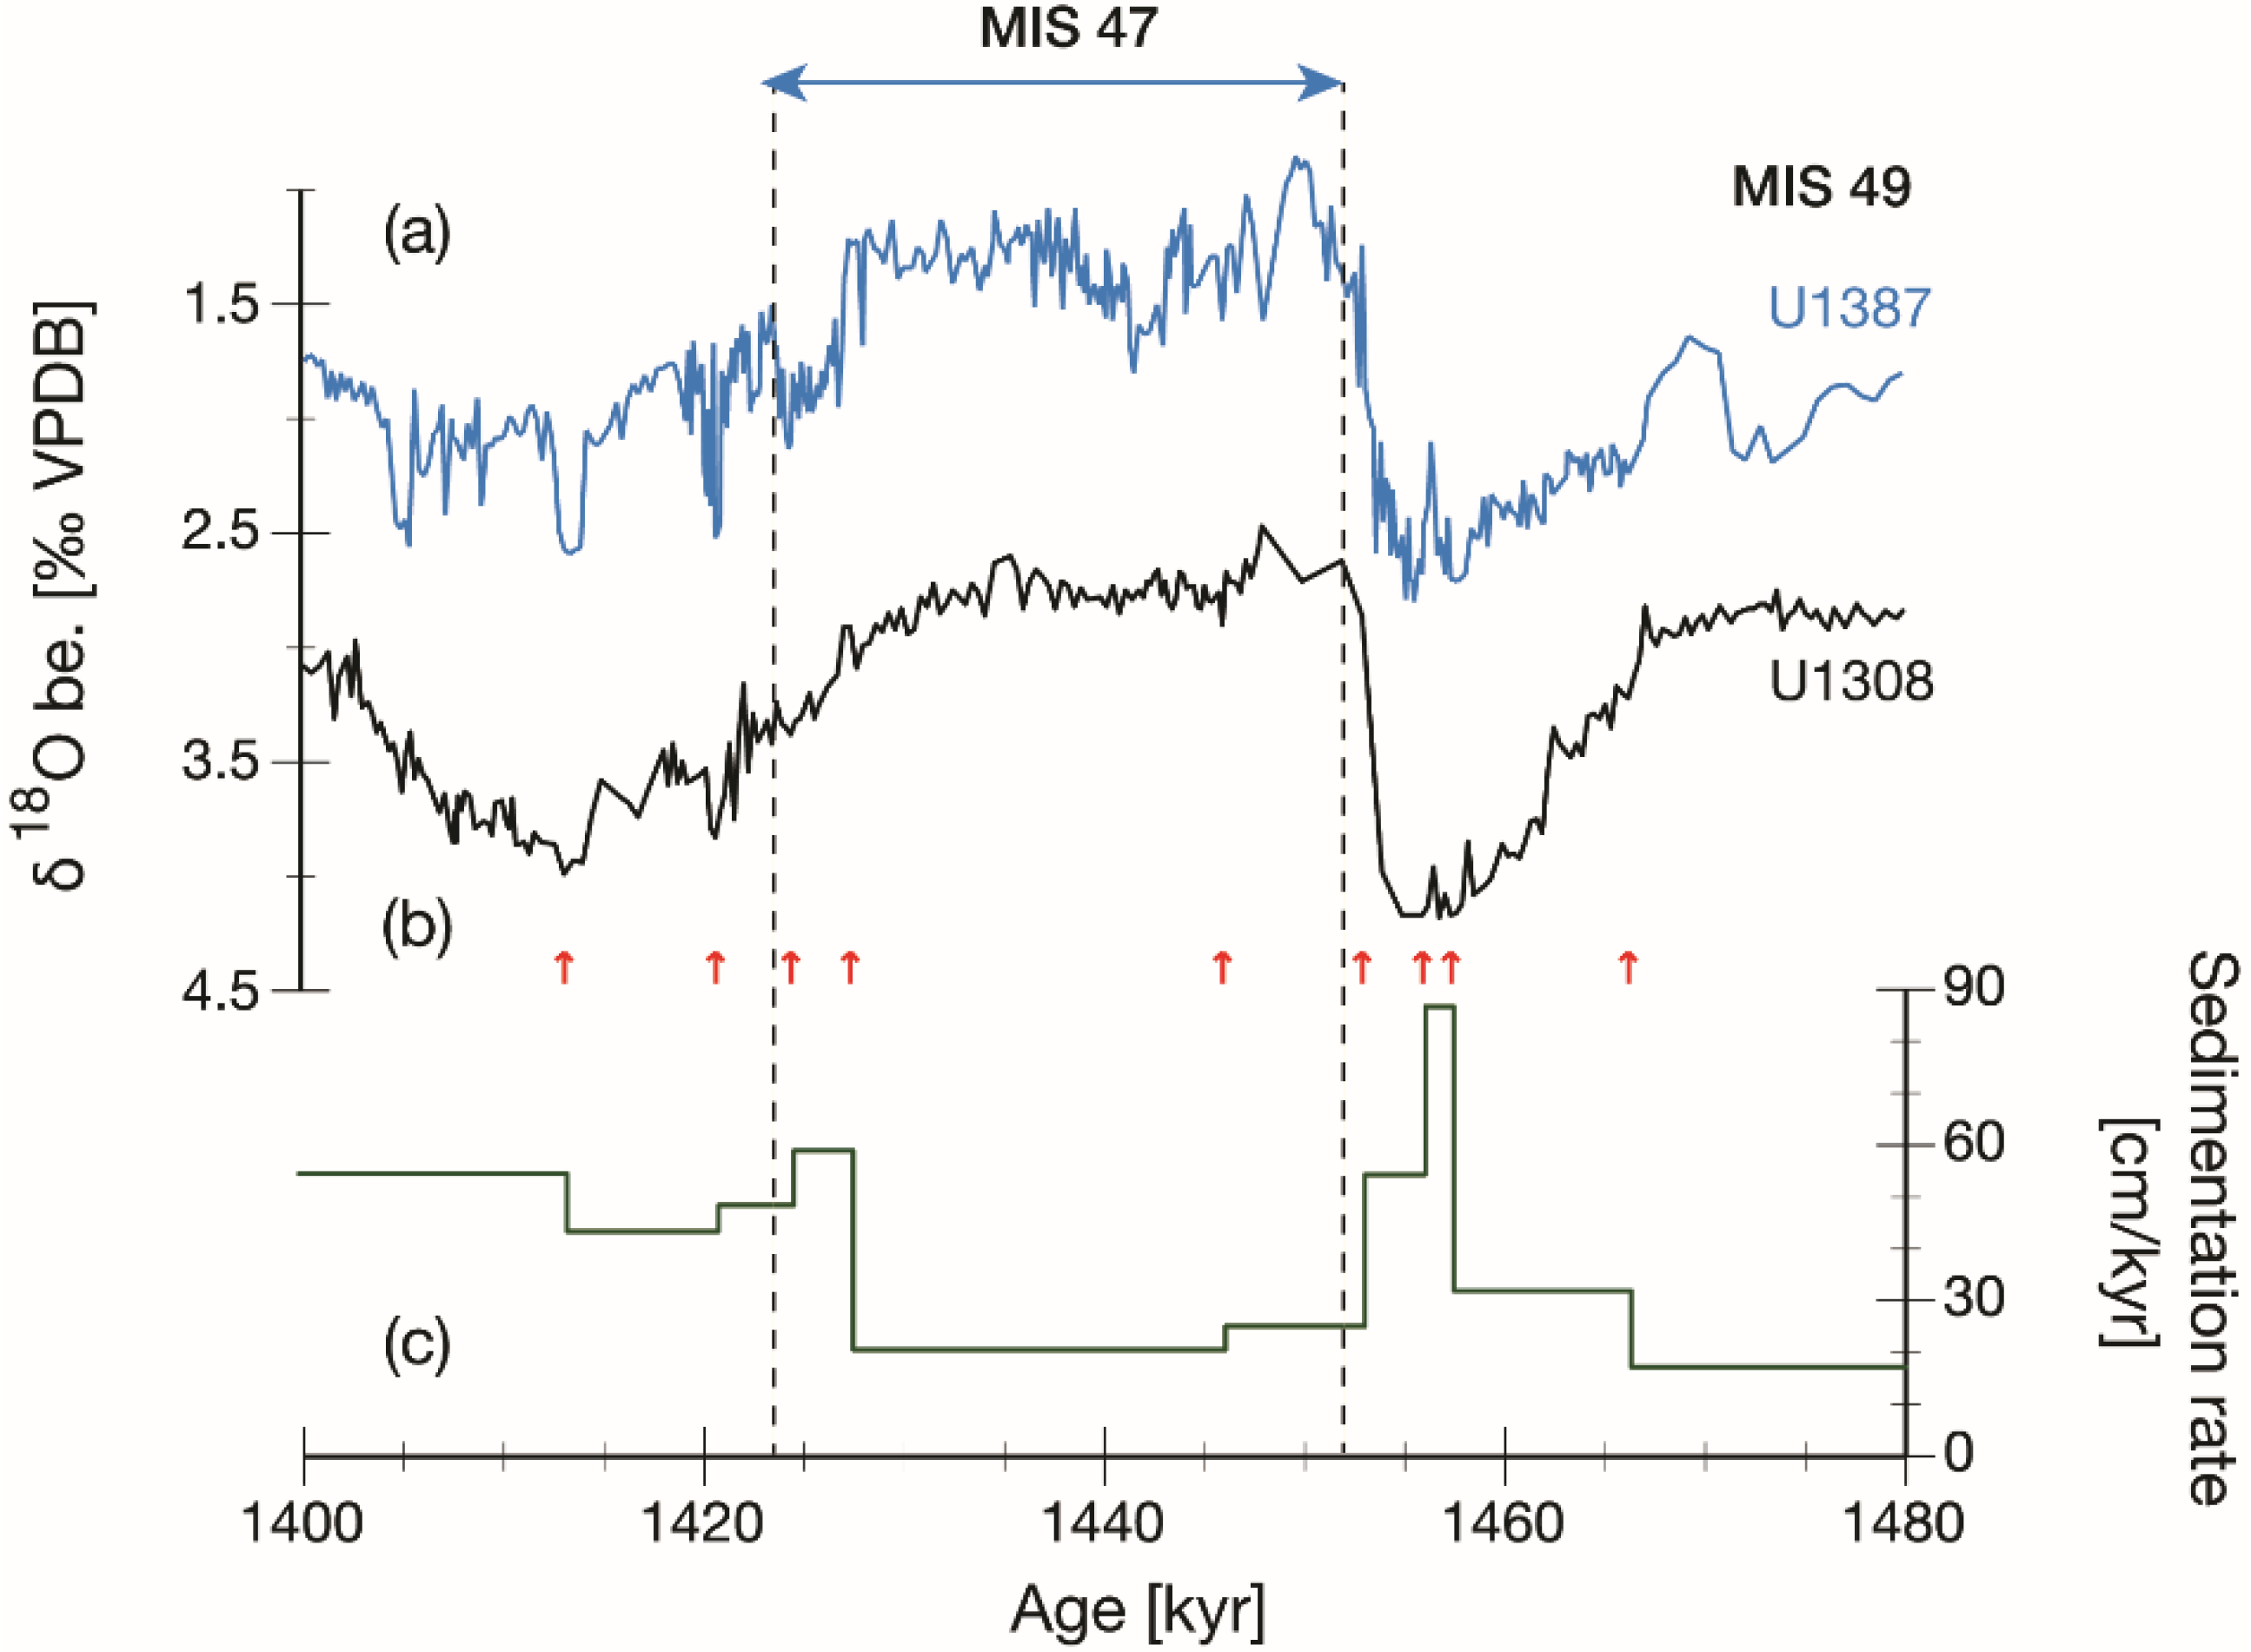
The age model for the MIS 46 to MIS 48 interval at IODP Site U1387 was established by tuning the benthic δ18O record of IODP Site U1387 to the high-resolution benthic δ18O record of IODP Site U1308 using the LR04 [61] related age model for Site U1308 as published by [10] (note that for the MIS 48 to MIS 47 transition that age model differs from the one published previously by [62]). As a first step isotopic minima in MIS 48 and MIS 46 and the termination of MIS 48 were aligned as well as the isotopic maximum of MIS 50 (not shown in Figure 2), forming primary age control points. Additional control points were then set to improve the alignment of signals, while avoiding extreme changes in the sedimentation rates at Site U1387. The levels used for age control are shown in Figure 2 and listed in Table 1.
The resulting sedimentation rates vary between 20.6 cm/kyr and 86.7 cm/kyr with the lower sedimentation rates occurring during interglacial MIS 47 and MIS 49, a pattern already observed for interglacial MIS 31 [19]. Based on the sedimentation rates, the stable isotope and sections of the other proxy records have in general a temporal between 100 and 300 years in the higher resolution section (1419.2–1456 ka).

3. Results

3.1. Stable Isotope Records

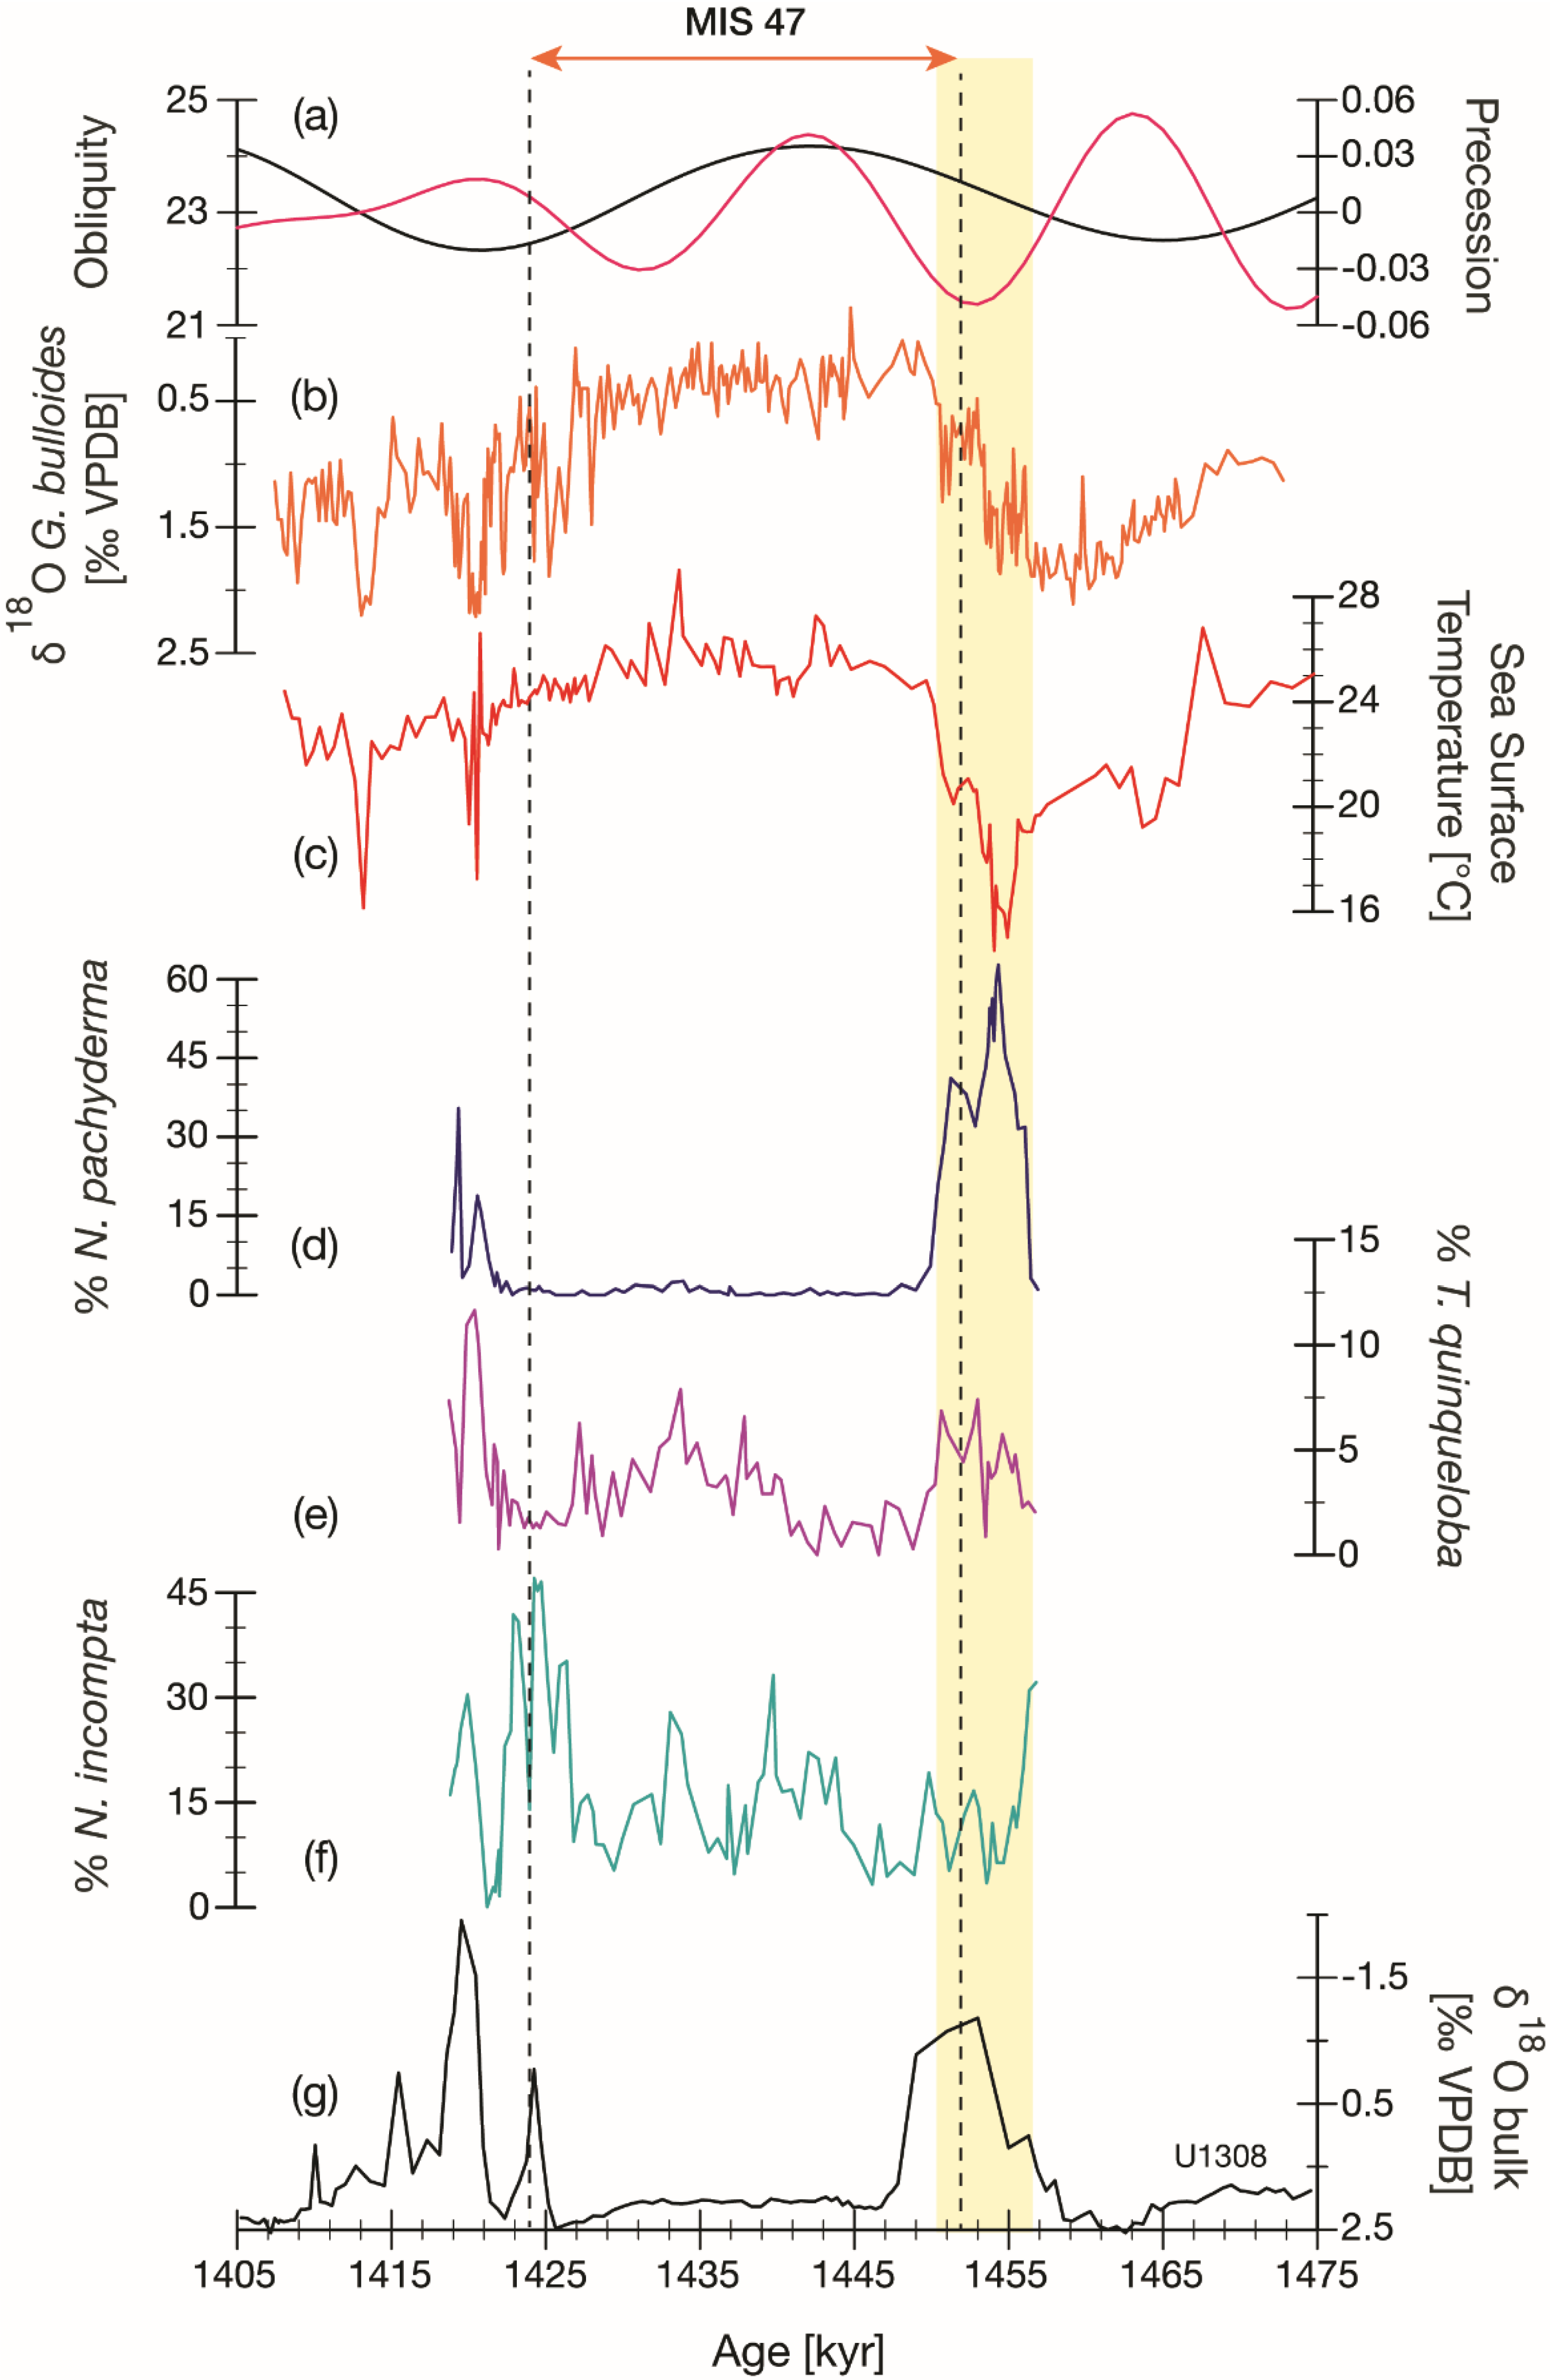
The benthic foraminifera and G. bulloides δ18O records reveal different conditions for glacial MIS 48 and MIS 46 (Figure 3b and Figure 4b). Whereas MIS 48 shows a gradual increase of values towards the glacial maximum, the end of MIS 47 and MIS 46 are marked by millennial-scale variability, i.e., the occurrence of three stadial (cold)/interstadial (warm) cycles, in general agreement with [12]. The benthic δ18O record reveals a fairly abrupt transition from MIS 48 to MIS 47 (Figure 3b), similar to the deep North Atlantic record of Site U1308 (Figure 2). The G. bulloides δ18O record (Figure 4b), on the other hand, exhibits several stages during the deglaciation, reflecting the evolution of hydrographic conditions during the terminal stadial event (1450.6–1456 ka). Between 1454.8 and 1456.2 ka, the G. bulloides δ18O values were slightly lower (mostly in the 0.9–1.3‰ range) than during the preceding glacial maximum (1.65–2.0‰ range), followed by a short return to higher values around 1.8‰ between 1454.4 and 1454.6 ka (Figure 4b). The δ18O values then decreased until 1453.6 ka, when the decline stalled and values remained at a level around 0.8–1.0‰ for 2 kyr (until 1451.5 ka), forming a type of interstadial event during the deglaciation. Subsequently, short oscillations with values down to 1.3‰ occurred before the values finally rose to the interglacial level with 0.5‰ being reached for the first time at 1450.6 ka.
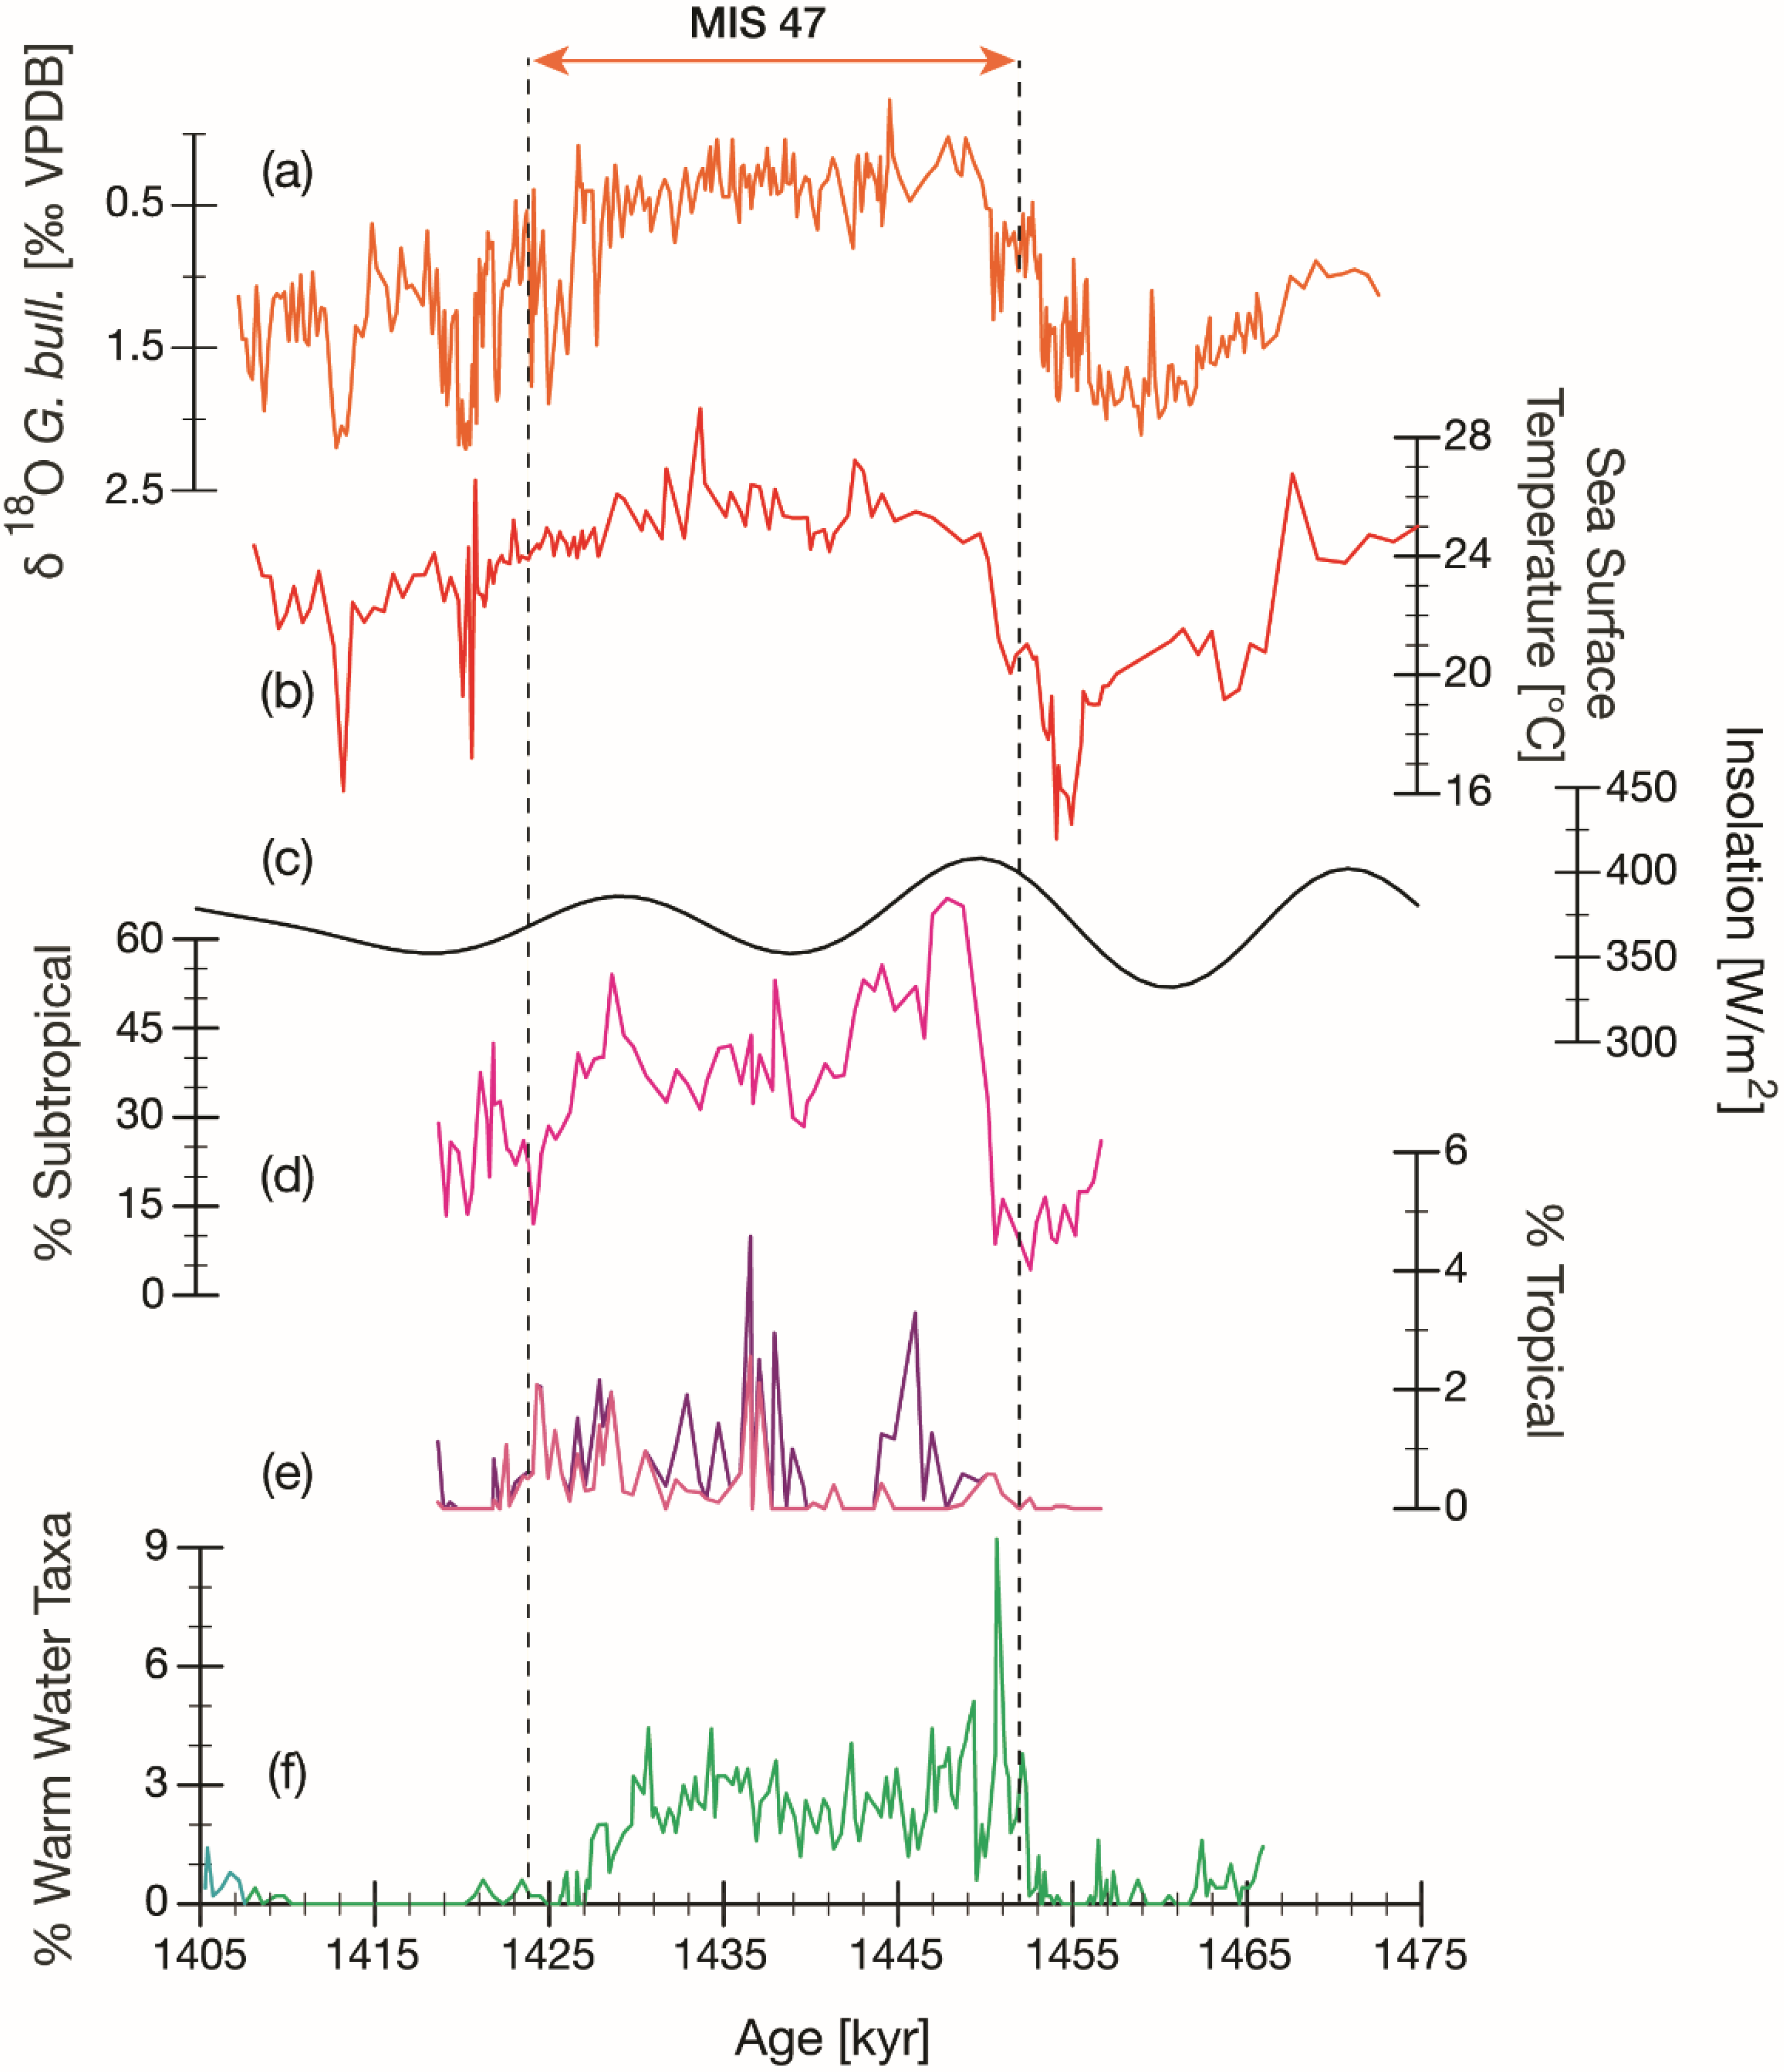
During the interglacial phase of MIS 47 (1427–1450.6 ka) the G. bulloides δ18O record shows a “plateau” with small variations (generally 0–0.8‰ range; Figure 4b). In contrast, the G. ruber white δ18O data (Figure 4a) reveal strong oscillations over a much wider range (−1.20 to 0.96‰), whereby the high variability and trends were confirmed by repeating several of the G. ruber white measurements. The G. ruber white record includes a period with higher values between 1430 and 1434 ka. The benthic δ18O record (Figure 3b), on the other hand, exhibits three phases. The initial phase lasted from 1443.3 to 1451.1 ka and included the lowest values (0.85–1.16‰) between 1447.2 and 1451.1 ka. A period with slightly higher values followed between 1441.1 and 1443.1 ka, and finally a “plateau” with values around 1.31 ± 0.13‰ until 1427.2 ka, after which the values dropped significantly during the stadial event at the end of MIS 47.
The epibenthic δ13C record (Figure 3c) reveals three periods with lower values. The oldest occurred at the beginning of the record during MIS 49 (until 1472.3 ka) when values as low as −0.48‰ were measured. It is followed by an extended period of values above 0.8‰ that lasted until 1460 ka. After 1460 ka, the values gradually declined until the minimum with values as low as –0.28‰ was reached during the MIS 48/MIS 47 transition (1452.5–1454.1 ka), which is also the period when high amounts of gypsum crystals formed from oxidized pyrite are found in the sediments. After this minimum, the values gradually rose again throughout MIS 47 until 1443 ka, when a second maximum started. That maximum with values generally exceeding 1.1‰ lasted until 1427.4 ka, after which the values dropped down to 0.5‰ during the third, but the least pronounced minimum that coincided with the stadial event at the end of MIS 47. Throughout MIS 46 the benthic δ13C values remained high with values around 0.8–1.0‰.
The δ13C values of G. bulloides varied between −1.57 and 0.26‰ and those of G. ruber white between –0.87 and 1.82‰ (Figure 4c). Similar to the evolution of the benthic δ13C data, both records reveal a gradual increase throughout MIS 47 that culminated in a period with higher values after 1437 ka. G. bulloides also shows higher values during the terminal stadial event at the end of MIS 48 and during the beginning of MIS 46.

3.2. Weight Percentage of Sand-Sized Fraction

Excluding the higher wt.% sand values between 1450 and 1453.6 ka, where the presence of gypsum crystals is skewing the sand weight, the wt.% sand is showing a maximum with values up to 25.4% between 1565 and 1469 ka within MIS 49 and another between 1429 and 1436 ka, i.e., within MIS 47, that reaches the highest values observed in the interval of 41% (Figure 3d). Similar to the δ18O records, the wt.% record reveals millennial-scale oscillations within MIS 46, especially in the interval from 1419 to 1423.3 ka, with values reaching 20% or 24%, respectively. Those values are in the same range as observed at Site U1387 during the younger interval of MIS 29 to MIS 34 [19]. Another smaller peak with values around 7–9% is observed during the stadial (cooling) event (evidenced by the high δ18O values) between 1412.5 and 1414.3 ka.

3.3. Sea Surface Temperatures

The SSTs show a range from 14.5 °C to 29 °C (Figure 5c and Figure 6b). The colder SST are recorded during the terminal stadial event of MIS 48 and as short-term oscillations during MIS 46 when SST dropped to 17 °C and 16 °C, respectively. The terminal stadial event included three phases: (1) the initial extreme cooling event from 1454.3 to 1455.3 ka and with SST between 14.5 and 17 °C; (2) an abrupt warming that stalled at an SST level around 20.6 °C between 1452–1453.2 ka; and (3) finally, a short drop to 20 °C at 1451.7 ka followed by a second abrupt warming until interglacial SST of >24 °C were reached at 1450 ka.
During late interglacial MIS 49 (1469–1475 ka) SST ranged between 23.7 and 25 °C. MIS 48 started with a short-term warm event of 26.8 °C near 1468 ka followed by SST between 19 and 21.5 °C until the terminal stadial event. During MIS 47, interglacial level SST persisted from 1450 ka until the MIS boundary at 1424 ka with an average temperature of 25.1 ± 1 °C. Between 1442.8 and 1444.3 ka, SST mostly exceeded 26 °C and during a second warmer period around 1438 ka, the maximum of 29 °C was reached (Figure 5c and Figure 6b). During MIS 46, SST remained warm with an average temperature of 23.1 ± 1 °C. Short-term oscillations when SST dropped to 17.2 °C, 19.3 °C, and 16.1 °C occurred at 1420.8 ka, 1420.3 ka, and 1413.5 ka, respectively.

3.4. Planktonic Foraminifera Assemblage

The planktonic foraminifera assemblage consists of a mixture of tropical, subtropical, transitional, subpolar, and occasionally polar species, similar to the observations from the Mid-Pleistocene transition interval at Site U1387 [17]. The MIS 46-MIS 48 assemblage contains, however, two extinct species, G. obliquus and Neogloboquadrina atlantica dextral. Whereas the rare occurrences of G. obliquus were included in the percentage of subtropical species, the occurrence and abundance changes of N. atlantica dextral will be the topic of another publication and are not further discussed here.
The polar species N. pachyderma shows a prominent peak between 1451 and 1456 ka reaching values above 45% (maximum of 63%) between 1453.7 and 1454.8 ka (Figure 5d). Those are extremely high values for the southern Portuguese margin, although in the range of some of the terminal stadial events of the Mid-Pleistocene Transition [17].
The species T. quinqueloba and N. incompta are grouped into the subpolar species e.g., [64], but in the western Iberian margin upwelling system N. incompta contributes significantly to the assemblage in those regions where the subpolar variant of the ENCAW is being upwelled [58]. Likewise, T. quinqueloba can reach up to 20% in surface sediment samples from the western Iberian margin and shows a minor, but positive affiliation with the upwelling factor, which is dominated by G. bulloides [58]. Thus, the presence of either species can be linked to either cooler, subpolar surface waters or upwelling-related productivity changes. T. quinqueloba shows a broad maximum of up to 7.4% during the terminal stadial event of MIS 48 (Figure 5e). Its abundance, exceeding 10%, already increased during the stadial event between 1420 and 1421 ka. So, those two periods are interpreted as reflecting subpolar surface water incursion to the southern Portuguese margin. In contrast, the increased contributions to the fauna between 1426 and 1440 ka are probably related to productivity conditions, in agreement with the higher percentages of G. bulloides during the same period (Figure 4d). Similar to T. quinqueloba, N. incompta (Figure 5f) is present in the MIS 47 fauna with percentages generally in the 11 to 25% range, especially after 1445 ka; the same range observed in surface sediments from southwestern and southern Portuguese margin [58]. The species shows, however, higher percentages during the interval from 1422.5 to 1426 ka, reaching the maximum of 47% at 1424.4 ka.
The abundance of transitional, but also high productivity/upwelling related species G. bulloides varied between 3.3 and 23% (Figure 4d). Lower contributions occurred during the early interglacial phase of MIS 47, when subtropical species G. ruber white (Figure 4d) and subtropical species in general (Figure 6d) dominated the fauna, and during the transition from MIS 47 to MIS 46, when N. incompta became more abundant. The abundance of G. ruber white started to increase significantly after 1450 ka reaching a maximum of 34% at 1448 ka. While its percentages lingered around 8–15% between 1429 and 1442 ka, it reveals a second increase to values up to 26% between 1428 and 1429 ka. The abundance of the group of subtropical species (Appendix A) started to increase slightly earlier than G. ruber white, i.e., it exceeded 30% already at 1450.4 ka (Figure 6d). It reached a significant maximum of >60% between 1447 and 1449 ka. Mimicking the G. ruber white record that group reveals a four-phased abundance distribution throughout MIS 47: (1) a maximum with >30% between 1440 and 1450.4 ka; (2) a short drop to values below 30% around 1429 ka; (3) a second period with values > 30% between 1426.5 ka and 1438.9 ka, including 54% at 1428.9 ka and 53% at 1438.2 ka; and (4) the gradual decline down to 12% towards the MIS 47/MIS 46 boundary (Figure 6d).
The contribution of the tropical species is only minor, reaching a maximum of 4.6% at 1436.8 ka, with higher abundances during periods when subtropical species dominated (Figure 6e). After 1437.3 ka, the deep-dwelling species Globorotalia crassaformis starts to contribute significantly to the tropical group (Figure 6e) pointing to the presence of subsurface waters of (sub)tropical origin in the vicinity of Site U1387. The observed G. crassaformis percentages are in the same range as those recorded at Site U1387 during the Holocene and interglacial MIS 11c [65]. The regular occurrence of Sphaeroidinella dehiscens, which is not found in modern surface sediments from the western Iberian margin, but has been observed in interglacial MIS 11c samples from the western Iberian margin [66], can also be interpreted as a signal for the advection of subsurface (sub)tropical waters.

3.5. Calcareous Nannofossil Warm Water Taxa Abundance

The warm water taxa were mostly absent during glacial MIS 48 and MIS 46, although the warm water taxa group shows some low occurrences between 1462 and 1465 ka (Figure 6f), concurrent with SST near 21–22 °C. The percentages of the warm water taxa started to increase after 1453 ka, i.e., concurrent with the stalled SST warming during the terminal stadial event (Figure 6c). It reached a maximum value of 9% at 1450.6 ka, although values during MIS 47 were on average 2.5 ± 1%. Despite the warm SST and in contrast to the planktonic foraminifera assemblage (Figure 6), the warm water taxa mostly disappeared from the calcareous nannofossil flora after 1427 ka, although low percentage contributions are observed between 1425 and 1426 ka and 1420 and 1424.5 ka.

4. Discussion

The new results obtained for the MIS 46 to MIS 48 interval at IODP Site U1387 indicate varying climatic conditions that sometimes were similar to those during younger early Pleistocene glacial/interglacial cycles. Unexpected features include the intensity of and climatic evolution during the terminal stadial event of MIS 48 and the contourite layer formed during interglacial MIS 47. In the following, we will discuss the major features and make first inferences on their potential drivers and climatic implications.

4.1. Hydrographic Conditions at the Seafloor–Upper MOW Influence

Nowadays the seafloor at the Faro Drift is influenced by the upper branch of the MOW, although the MOW layer is only about 60 m thick at the location of Site U1387 [19,41]. Contourite layers –and the Faro Drift itself– were formed by that upper branch of the MOW [36], with the higher current velocity at the sea floor driven by the MOW’s higher density. So, we assume that MOW was present at Site U1387 when contourite layers (wt.% sand maxima) were formed. Increased MOW velocity during periods of cooler (stadial) climate periods is a feature that was previously already documented at IODP Site U1387 [19,34] and other IODP Sites in the Gulf of Cadiz e.g., [35]. The presence of colder and less saline surface waters as indicated by the SST and/or planktonic foraminifera fauna (presence of N. pachyderma, T. quinqueloba, N. incompta) in conjunction with the more saline waters exiting from the Mediterranean Sea is assumed to increase the density gradient in the upper water column of the Gulf of Cadiz e.g., [19,35], which, together with changes in the water column structure of the North Atlantic along with a reduced AMOC, led to buoyancy loss [67]. Such a type of contourite layers was formed during MIS 46 (discussed further in Section 4.3) and during the “stadial” event (depicted by a slight cooling in the SST; Figure 5c) at the beginning of MIS 48 (1466–1469 ka; Figure 3d).
Whereas the formation of contourite layers during “stadial” climate periods is common, both in the upper and lower branch of the MOW [19,34,35,68], the occurrence of contourite layers during an interglacial is rare. The list of known examples for interglacial contourite layers, namely during the Holocene [35,68] and during MIS 31 [19], can now be expanded to MIS 47 when a prominent contourite layer was formed between 1429.5 and 1436 ka by a well-ventilated upper MOW branch (Figure 3). The contourite layer developed while insolation was rising, exactly identical to during MIS 31 [19], and the sea level was starting to fall (Figure 3a) [29]. The new record from ODP Site 967 and the revised timing of sapropel formation [33] (Figure 3e) indicates that the MIS 47 contourite layer formed in the Gulf of Cadiz despite a sapropel layer developing in the eastern Mediterranean Sea due to an intensified North African monsoon, contrary to conditions during the first insolation maximum of MIS 48/MIS 47. Studies in the Mediterranean Sea have shown that, whereas the formation of sapropel layer S1 in the early Holocene strongly impacted the water column below 1800 m in the eastern basin e.g., [69], no related organic-rich layer was formed in the western Mediterranean basin e.g., [70]. Furthermore, sediment properties in cores from intermediate depths in the Corsica Trough [71] and the lower slope offshore Minorca [72] revealed flow of Levantine intermediate water and Western Mediterranean deep water, respectively, at least during some intervals while sapropel S1 developed in the eastern basin. So, similar to S1 and conforming with observations by [73] for the last 20 ka, we infer that conditions in the western Mediterranean Sea were the ones impacting the MOW during the time the MIS 47 contourite layer was formed. On the Atlantic side, the two planktonic foraminifera-derived δ13C records (Figure 4c), indicate that the surface waters were better ventilated during that period of MIS 47 (after 1437 ka) and that signal was apparently mixed down into the MOW. We attribute the better ventilation of the surface waters to increased wind mixing as a consequence of decreasing obliquity (Figure 5a) and related strengthening of surface winds in the mid-latitudinal North Atlantic [74] and potentially advection of Portugal Current waters because of percentage abundances of N. incompta (Figure 5f) and G. bulloides (Figure 4d), both of which are positively correlated with the Portugal Current [58], increased during that period. Still, ongoing good ventilation of North Atlantic (deep) waters is also implied by the benthic δ13C record of IODP Site U1308 (Figure 3f) that points to a strong AMOC during that period.
Conditions at Site U1387 were significantly different during the first insolation maximum when extremely low benthic δ13C values were recorded at Site U1387 in conjunction with a sluggish current (low wt.% sand excluding the interval falsified by the presence of gypsum crystals; see Methods and Section 3.2) (Figure 3). The formation of pyrite (source of gypsum crystals; see Methods) in the sediments during or shortly after deposition together with the low benthic δ13C values point to a low oxygen environment. Following the discussion in [19] and assuming strong overprinting by local conditions, such as high organic carbon flux in low oxygen conditions (to be confirmed by future analyses), we interpret the prevailing water mass to be MOW and not Antarctic Intermediate Water (generally encountered below 700 m in the Gulf of Cadiz [41,75]), although some entrainment of Antarctic Intermediate Water cannot be excluded [75]. The extensive δ13C minimum coincided with the formation of a sapropel layer in the eastern Mediterranean Sea and a strongly reduced AMOC as indicated by the Antarctic Bottom Water related δ13C values observed at IODP Site U1308 (Figure 3) and both processes likely affected the intermediate depths and buoyancy in the Gulf of Cadiz [67]. Ventilation at Site U1387 started to decline when insolation and run-off from the Nile River driven by the North African monsoon [33] started to increase, with the lowest δ13C values contemporary with the insolation maximum and peak of sapropel layer formation. So, conforming with previous studies [19,34,35], we relate the signal at Site U1387 to a poorly ventilated water mass exiting the Mediterranean Sea. Poor ventilation in the Mediterranean Sea was caused by reduced overturning/stagnating waters due to increased freshwater supply from the Nile River and other circum-Mediterranean rivers caused by increased rainfall in the circum-Mediterranean region and a strengthened North African monsoon [76]. The signal from the Mediterranean waters dominated the MOW signal because the G. bulloides δ13C data (Figure 4c) indicate fairly well-ventilated surface water during that period, although some of the G. bulloides δ13C signals might be temperature dependent [77].
Ventilation of the upper MOW branch started to recover already at the onset of MIS 47 (1452 ka), preceding the end of sapropel formation in the eastern Mediterranean Sea and return to a strong AMOC (Figure 3). As discussed above for the period of contourite formation, water masses and conditions in the western Mediterranean Sea basin probably played a stronger role for the MOW during early MIS 47 leading to the “decoupling” from the sapropel signal at ODP Site 967 (Figure 3). The resemblance between the benthic foraminifera and G. bulloides δ13C (Figure 4c) records confirms the mixing of the surface/ENACW signal into the MOW. Those surface/ENACW waters were of subtropical origin as revealed by the planktonic foraminifera assemblage data (Figure 6), explaining why the MOW was less well ventilated than waters in the higher latitude North Atlantic as indicated by the Site U1308 benthic δ13C record (Figure 3f). The benthic δ13C values at Site U1387 during MIS 47 until 1437 ka are in the range of δ13C-DIC (DIC = dissolved inorganic carbon) values obtained for the modern MOW in the Gulf of Cadiz and along the western Iberian margin (A. Voelker, unpublished data from Iberia-Forams stations [41]), so that water mass compositions were probably similar to today. Current velocity was, however, weak at Site U1387 (low wt.% sand) during early MIS 47, in agreement with observation for intervals of interglacial MIS 29, MIS 31 and MIS 33 [19] and MIS 5e [34] at Site U1387, but in contrast to late Holocene signals at Sites U1387 and U1386 [34,65].

4.2. The Terminal Stadial Event of MIS 48

Whereas the higher resolution version of the benthic δ18O record (Figure 3b) still shows a fairly abrupt transition from MIS 48 to MIS 47, the surface water records (Figure 5) now clearly exhibit a stepwise evolution during the deglaciation of MIS 48. The terminal stadial event (1451–1456 ka) started with a significant SST drop. Based on the high percentage contributions of N. pachyderma and to a lesser extent of T. quinquiloba we relate this to the advection of subpolar surface waters into the latitudes of the northern Gulf of Cadiz. The coldest SST was in the range of 14.5 to 16 °C and thus a few degrees warmer than during the terminal stadial events of MIS 26, MIS 24, and MIS 22, when SST below 12 °C, even down to 9 °C were recorded at Site U1387 [16]. They were, however, in the same range as obtained for the MIS 48 terminal event at IODP Site U1313 (41° N 33° W) [78] and for Heinrich event 1 in the Gulf of Cadiz [79]. At Site U1387, the abruptness of the SST decline and subsequent recovery (warming) during the MIS 48 event was comparable to the Mid-Pleistocene Transition events at Site U1387 and to the Mid-Pleistocene Transition to late Pleistocene events at Site U1385 [16,18]. At Site U1387, the maximum SST cooling at the end of MIS 48 lasted, however, only 1 kyr versus 2–3 kyr for the Mid-Pleistocene Transition events. The high percentage of N. pachyderma is comparable to the numbers observed for the Mid-Pleistocene Transition terminal stadial events at Sites U1387 and U1385 [17,80], but much lower than recorded during Heinrich event 1 in the Gulf of Cadiz [65,68,81]. Such high percentages are common for last glacial Heinrich events if the core location is within the southern latitudes of the North Atlantic’s ice-rafted debris belt (37–41° N on the western Portuguese margin [81]). The terminal stadial event was associated with ice-rafting within the ice-rafted debris belt and a reduced AMOC, as evidenced at IODP Site U1308 (Figure 3f and Figure 5g) and Site U1313 [78]. Following [18] for the terminal events between 700 and 900 ka, we assume that the subarctic front was displaced as far south as 36.5–37° N. Overall, the terminal stadial event of MIS 48 was more intense than expected for a glacial in the 41 kyr world and a location within the lower mid-latitudes of the North Atlantic. We speculate that the higher intensity might be caused by the absence of millennial-scale oscillations during MIS 48, contrary to MIS 46 (see Section 4.3), which might have allowed more ice (and for a longer period) to be stored on the continents as indicated by the sea level record [29] (Figure 3a). The disintegration of those continental ice shields and associated ice shelves would then have had a much higher impact on the AMOC and thus climatic conditions in the North Atlantic than during the MIS 46 stadial events.
Conditions in the northern Gulf of Cadiz started to ameliorate already around 1454 ka, i.e., prior to the onset of MIS 47, although ice-rafting still occurred at Site U1308 (Figure 5). SST rose into the 18 °C range and subsequently 21 °C range where the warming stalled between 1452 and 1453.2 ka. Such warm SST was contemporary with a still significant contribution of (sub)polar planktonic foraminifera to the assemblage (Figure 5). We interpret this apparent contradiction as a signal of highly variable surface water hydrography at Site U1387, where the sediments combine evidence from transitional to subpolar surface water dominated periods with those of transitional to subtropical water influence, depending on oscillations in the latitudinal position of the subpolar front. Increasing subtropical gyre water influence during the stalled warming interval is also evidenced by the warm water taxa group, which percentage contribution first peaked during the precession minimum at 1453 ka (Figure 6f). In the northern Gulf of Cadiz, the terminal stadial event ended at 1450 ka when interglacial conditions were established at Site U1387, about 3 kyr earlier than in the northern mid-latitudes of the North Atlantic (Site U1308; Figure 3f and Figure 5g).
The G. bulloides δ18O record mostly mimics the SST evolution during the terminal stadial event (Figure 5). There occurred, however, oscillations with lower values during the early phase, which we interpret as reflecting salinity changes (to be confirmed by planned trace element analyses). Lower salinities could be caused either by meltwater contributions to the subpolar surface waters and/or by advection of riverine waters, especially from the Guadalquivir and Guadiana Rivers that drain into the Gulf of Cadiz (see discussion in [19]). The period of the terminal stadial event coincided with the insolation maximum and thus higher precipitation also in the southern Iberian Peninsula [74,76].

4.3. Millennial-Scale Variability during Late MIS 47 and MIS 46

Higher resolution studies of the early Pleistocene climate revealed that millennial-scale variability was a common feature during glacial periods [10,12,82,83]. So, observing it during MIS 46 is not surprising and the pattern with cooler surface waters (e.g., colder SST and/or higher G. bulloides δ18O values) during the stadials (Figure 4 and Figure 5), often in conjunction with the intensification of MOW velocity (Figure 3), is typically observed in records from the Gulf of Cadiz e.g., [19,35,68]. Nevertheless, the three stadials of the stadial/interstadial cycles observed between 1427.2 and 1412.5 ka have different features indicating that the impacts -and potentially some of the drivers- might not have been the same.
The first stadial, which marks the glacial inception of MIS 46, had a much longer duration in the benthic isotope records than in the planktonic foraminifera δ18O records. The benthic δ18O record shows higher values between 1423.8 and 1427 ka, with the values, at least to some extent, also reflecting the falling sea level (Figure 3a). The comparison with the benthic δ13C record of IODP Site U1308 and the eastern Mediterranean Sea sapropel record of ODP Site 967 (Figure 3) reveals that a reduction in AMOC strength and/or depth, as reflected in the lower benthic δ13C values at Site U1308, and not hydrographic changes in the eastern Mediterranean Sea were driving the lower ventilation within the upper MOW branch. However, MOW ventilation started to recover slightly earlier than in the deep North Atlantic where the ice-rafting event recorded at Site U1308 at the MIS 47/MIS 46 boundary (minimum in δ18O bulk carbonate [10]; Figure 5g) led to the strongest AMOC reduction. In contrast, the southern Portuguese margin already experienced interstadial-type conditions during that period, as indicated by the G. bulloides δ18O record (Figure 4 and Figure 5) and the abundance increase of subtropical planktonic foraminifera species (Figure 6d), although the peak of the ice-rafting event resulted in a very brief return to less favorable conditions. Climatic amelioration in the Gulf of Cadiz leading conditions in the northern mid-latitudes was also observed for the MIS 48 terminal stadial event (see Section 4.2) and seems to be a recurrent feature.
The timing and duration of the period with higher δ18O values in the planktonic foraminifera records, generally associated with cooler surface water, differed between the species. G. ruber white recorded a maximum between 1426 and 1426.7 ka and G. bulloides between 1425.3 and 1426.4 ka (Figure 4), whereby the timing in the G. ruber white record fits better with the onset of change in the benthic δ18O data. Within age model error bars, the “cooling” in the surface water at Site U1387 coincided with the millennial-scale variability reconstructed by [12] that shows a maximum of around 1426.6 ka. However, whereas the isotope records point to some “cooling”, such a signal is not seen in the SST data (Figure 5 and Figure 6). There occurred no advection of subpolar surface waters as indicated by the near absence of N. pachyderma and T. quinqueloba (Figure 5). In contrast, the planktonic foraminifera assemblage was dominated by N. incompta (Figure 5f). Small contributions of subtropical and tropical species indicate some influence of subtropical waters, which would explain why the SST showed no strong cooling. The presence of more transitional waters with some advection of subtropical waters could be the reason why no strengthening of MOW velocity was recorded during that stadial, i.e., the density gradient between the surface and MOW level waters might not have been large enough. Overall, that stadial period had some unique features, which might partially be linked to decoupling between conditions in the subtropical gyre and the subpolar gyre, and need to be explored further in the future, including adding data from other mid-latitudinal core locations.
During the second and third stadial events (within MIS 46), conditions were more typical with SST cooling and the presence of polar and subpolar planktonic foraminifera species (Figure 5), i.e., advection of subpolar or very cold transitional waters into the latitudes of the Gulf of Cadiz, similar to the MIS 48 terminal stadial event. Colder surface waters are also implicated by the calcareous nannofossil flora [60]. During both periods the MOW was well ventilated, differing from the AMOC reduction recorded at Site U1308 (Figure 3f), and contourite layers were formed (Figure 3). The formation of a less pronounced contourite layer during the stadial between 1413 and 1414 ka was probably related to a more restricted exchange across the Strait of Gibraltar in consequence of the lower sea level (Figure 3a). Conform with observations from younger periods [19,35], the good ventilation of the MOW during those stadials was likely the result of better ventilated (more recently formed) waters exiting from the Mediterranean Sea and fairly well ventilated ENACW as implied by the G. bulloides δ13C data (Figure 4c).

4.4. Interglacial Climate Variability during MIS 47

Interglacial conditions were established at 1450.4 ka as indicated by SST near or above 24 °C and the planktonic foraminifera fauna starting to be dominated by subtropical species and the start of the G. bulloides δ18O “plateau” (Figure 6). That timing coincides with the summer insolation maximum at 65°N (Figure 6c), but lags the maximum 21st June insolation at 37° N (Figure 3e) and the precession minimum (Figure 5a) by 3 kyr. During MIS 47, the lag of SST and planktonic δ18O maxima to the precession minimum was, therefore, 3–4 kyr shorter than established for the last 420 ka in a southwestern Portuguese margin sediment core [84]. Additional studies are needed to confirm if the shorter lag is representative of early Pleistocene interglacials and for locations other than Site U1387.
Subtropical planktonic foraminifera dominated throughout most of MIS 47 with percentages generally >10% higher than during interglacial and interstadial periods of the Mid-Pleistocene Transition at Site U1387 [17] and >20% higher than at the southwestern margin of Site U1385 [80]. Persistent subtropical water influence is also indicated by the percentage contribution of the warm water taxa to the calcareous nannoplankton flora (Figure 6f), although those percentages were generally in the same range as during the middle Pleistocene interglacial periods [85,86]. The exception is the warm water taxa maximum of 9% at 1450.6 ka that, within the different sample resolution, coincided with the occurrence of subsurface dwelling tropical planktonic foraminifera species G. crassaformis (Figure 6e), but preceded the planktonic foraminifera subtropical fauna maximum by 1.5 kyr (Figure 6). The presence of G. crassaformis suggests that the advected subtropical gyre waters included a subsurface component, e.g., subtropical ENACW, which was admixed into the MOW and contributed to the MOW’s increased ventilation (see Section 4.1).
The high contributions of subtropical and to a lesser extent tropical foraminifera species persevered until 1442.8 ka. Those high percentages imply not only persistent subtropical gyre/Azores Current influence in the Gulf of Cadiz, but also that those waters were warmer than today. Warmer waters are supported by the SST data (Figure 6b), which were >3 °C warmer during MIS 47 than during the Holocene (19–21 °C) [79]. The MIS 47 SST values were also 2–3 °C warmer than observed during “super” interglacial MIS 31 [19] or during Mid-Pleistocene Transition interglacial stages MIS 21g and MIS 25e [16] at Site U1387. Since summer insolation during MIS 47 was either in the same range (MIS 21g) or lower (MIS 25e, MIS 31) [28], insolation alone cannot explain the warmer SST. The subtropical gyre seems to have been expanded northward, including a northward displacement of the Azores Front following modern-day observations [47], but the driver(s) for this expansion and potential intensification of subtropical gyre circulation needs to be explored in the future.
Northward expansion of the subtropical gyre, either still ongoing or reoccurring, is also assumed during the two other intervals with higher subtropical planktonic foraminifera percentages (Figure 6). Interestingly, both of those periods were associated with higher contributions of G. crassaformis and S. dehiscens to the tropical fauna reflecting the presence of a northward subsurface flow. After 1438 ka, G. bulloides started to contribute more significantly to the planktonic foraminifera fauna (Figure 4d). Since that increase is accompanied by higher numbers of N. incompta and T. quinqueloba (Figure 5) we assume that upwelling occurred more frequently and/or persistently around Cape São Vicente and potentially off Cape Santa Maria during the second half of MIS 47, with the upwelled waters probably being replaced by the northward flow of subtropical subsurface waters.
Whereas the G. bulloides δ18O data is fairly stable throughout the interglacial phase of MIS 47, the same cannot be said for the G. ruber white δ18O record (Figure 4). The G. ruber white δ18O data reveals strong oscillations over a much wider isotopic range than G. bulloides. Those oscillations are not linked to changes in the subtropical fauna abundance or the SST (Figure 6). Some of the lower values during the early phase of MIS 47 when insolation was still high and precipitation over the southern Iberian Peninsula was probably high [76], could reflect salinity changes caused by strong river run-off. At the moment, we cannot explain the variations and plan to perform trace element analyses in G. ruber white shells in order to distinguish between temperature and salinity signals.

5. Conclusions

The new, high-resolution records for the MIS 46 to MIS 48 interval at IODP Site U1387 revealed that glacial/interglacial cycles during the early Pleistocene can be highly variable, but encompass features familiar from younger periods, such as the millennial-scale variability observed during MIS 46.
The abruptness and intensity of the terminal stadial event of MIS 48 were similar to terminal stadial events during the Mid-Pleistocene Transition, especially in the MIS 21-MIS 25 interval [16,17,18]. This shows that high insolation can lead to significant changes in the circulation of the North Atlantic Ocean also during the early Pleistocene, when continental ice sheets were not as large as during and after the Mid-Pleistocene Transition. The multiple phases for the terminal stadial event confirm that subarctic front movements played a key role in modifying the oceanographic signals on the southern Portuguese margin. Whereas the surface waters variations were mostly driven by high latitudinal changes, conditions at the seafloor, i.e., the presence of a poorly ventilated, sluggishly MOW flow, recorded conditions prevailing in the Mediterranean Sea, and subsequently influence of North African monsoon intensification.
The interglacial phase of MIS 47 experienced significantly warmer surface waters in regard to absolute SST values and plankton assemblage composition. Subtropical and tropical planktonic foraminifera species dominated the fauna, consistent with contributions of the warm water taxa to the calcareous nannofossil flora. All of this points to a stronger subtropical gyre influence in the region than during younger interglacial periods, despite comparable insolation values and probably also atmospheric carbon dioxide concentrations. The warmer conditions in the Gulf of Cadiz are attributed to a northward expansion and potentially intensification in the circulation of the subtropical gyre. The influence of subtropical waters, through the admixing of less well-ventilated subtropical ENACW, is also driving the evolution of MOW ventilation during the interglacial. Several climate records show three to four phases throughout MIS 47 with less “optimal” conditions during the insolation minimum. A cool stadial event marks the end of MIS 47 and thus the glacial inception of MIS 46. Open questions remain regarding the high variability observed in the δ18O data of G. ruber white, which can probably only be solved by trace element analyses that would allow distinguishing between temperature and salinity signals.
An unexpected result of the study is the apparent decoupling between the eastern Mediterranean Sea and mid-latitudinal North Atlantic hydrographic conditions in association with the second insolation maximum of MIS 47, when a well-ventilated, high-velocity MOW formed a contourite layer, although a sapropel layer was formed in the eastern Mediterranean Sea.
Our data provide first insights into the variability of early Pleistocene climate change at the southern Portuguese margin. For sure, those observations will lead to several follow-up studies to better understand the climatic signals and their drivers and wider impacts.

Author Contributions

Conceptualization, A.H.L.V.; methodology, A.H.L.V., T.R. and M.M.; validation, A.H.L.V., T.R., S.T., M.M. and H.K.; investigation, A.H.L.V., T.R., S.T., M.M. and H.K.; resources, A.H.L.V., T.R., M.M. and H.K.; data curation, A.H.L.V.; writing—original draft preparation, A.H.L.V.; writing—review and editing, A.H.L.V., T.R., S.T., M.M. and H.K.; visualization, A.H.L.V.; supervision, M.M.; project administration, A.H.L.V., T.R. and M.M.; funding acquisition, A.H.L.V., T.R. and M.M. All authors have read and agreed to the published version of the manuscript.

Funding

This research received Portuguese national funds from the Fundação para a Ciência e a Tecnologia (FCT) through projects UIDB/04326/2020, UIDP/04326/2020 and LA/P/0101/2020. TR and AV, furthermore, acknowledge funding from FCT through projects WarmWorld with grant number PTDC/CTA-GEO/29897/2017 and MOWCADYN with grant number PTDC/MAR-PRO/3761/2012 and the EMSO-PT infrastructure project with grant number POCI-01-0145-FEDER-022157. The calcareous nannofossil research was financially supported by Fondi di Ateneo 2018 assigned to Patrizia Maiorano (Bari) and a Geoscience PhD scholarship to S.T. at Bari University (Italy), and benefited from instrumental upgrades through “Potenziamento Strutturale PONa3_00369 dell’Università degli Studi di Bari, Laboratorio per lo Sviluppo Integrato delle Scienze e delle Tecnologie dei Materiali Avanzati e per dispositivi innovativi (SISTEMA)”.

Institutional Review Board Statement

Not applicable.

Informed Consent Statement

Not applicable.

Data Availability Statement

The IODP Site U1387 data will be archived at the World Data Center PANGAEA (www.pangaea.de, accessed on 14 May 2022), to which it was submitted in early August 2022. IODP Site U1308 data shown in Figure 2, Figure 3 and Figure 5 is available from the NOAA National Centers for Environmental Information under https://doi.org/10.25921/hw8a-4c28, accessed on 14 May 2022. The ODP Site 967 data used in Figure 3 is archived at the World Data Center PANGAEA and accessible through https://doi.pangaea.de/10.1594/PANGAEA.939929, accessed on 14 May 2022.

Acknowledgments

This study used samples provided by IODP and A.H.L.V., S.T. and M.M. warmly thank the Bremen Core Repository personnel for fulfilling the various requests for IODP Site U1387 with speed and efficiency. A.H.L.V. and T.R. acknowledge laboratorial support from Warley Soares, Maria Padilha and Aline Mega. In addition, Guilherme Ebbo and Cristiana Machado from the ESTB-IPS Instituto Politécnico Setubal are thanked for their help in obtaining the lipid biomarker data. H.K. thanks Birgit Meyer-Schack, Maike Steinkamp and Wolfgang Bevern for their support in the stable isotope laboratory.

Conflicts of Interest

The authors declare no conflict of interest.

Appendix A. List of Planktonic Foraminifera Species Summed Up as

(a)
Subtropical species
Beella digitata
Globigerina falconensis
Globigerinella calida
Globigerinella siphonifera
Globigerinoides conglobatus
Globigerinoides ruber white
Globigerinoides obliquus
Globoturborotalita tenella
Orbulina universa
Neogloboquadrina dutertrei
Globorotalia truncatulinoides
(b)
Tropical species
Trilobus trilobus
Sphaeroidinella dehiscens
Pulleniatina obliquiloculata
Globorotalia crassaformis

References

  1. Clark, P.U.; Archer, D.; Pollard, D.; Blum, J.D.; Rial, J.A.; Brovkin, V.; Mix, A.C.; Pisias, N.G.; Roy, M. The middle Pleistocene transition: Characteristics, mechanisms, and implications for long-term changes in atmospheric pCO2. Quat. Sci. Rev. 2006, 25, 3150–3184. [Google Scholar] [CrossRef]
  2. Raymo, M.E.; Nisancioglu, K.H. The 41 kyr world: Milankovitch’s other unsolved mystery. Paleoceanography 2003, 18, 11–16. [Google Scholar] [CrossRef]
  3. Aubry, M.-P.; Couvering, J.A.V.; Christie-Blick, N.; Landing, E.; Pratt, B.R.; Owen, D.E.; Ferrusquía-Villafranca, I. Terminology of geological time: Establishment of a community standard. Stratigraphy 2009, 6, 100–105. [Google Scholar]
  4. Barker, S.; Starr, A.; van der Lubbe, J.; Doughty, A.; Knorr, G.; Conn, S.; Lordsmith, S.; Owen, L.; Nederbragt, A.; Hemming, S.; et al. Persistent influence of precession on northern ice sheet variability since the early Pleistocene. Science 2022, 376, 961–967. [Google Scholar] [CrossRef] [PubMed]
  5. Liautaud, P.R.; Hodell, D.A.; Huybers, P.J. Detection of significant climatic precession variability in early Pleistocene glacial cycles. Earth Planet. Sci. Lett. 2020, 536, 116137. [Google Scholar] [CrossRef]
  6. Morée, A.L.; Sun, T.; Bretones, A.; Straume, E.O.; Nisancioglu, K.; Gebbie, G. Cancellation of the Precessional Cycle in δ18O Records During the Early Pleistocene. Geophys. Res. Lett. 2021, 48, e2020GL090035. [Google Scholar] [CrossRef]
  7. Raymo, M.E.; Lisiecki, L.E.; Nisancioglu, K.H. Plio-Pleistocene Ice Volume, Antarctic Climate, and the Global δ18O Record. Science 2006, 313, 492–495. [Google Scholar] [CrossRef]
  8. Billups, K.; Scheinwald, A. Origin of millennial-scale climate signals in the subtropical North Atlantic. Paleoceanography 2014, 29, 612–627. [Google Scholar] [CrossRef]
  9. Donders, T.; Panagiotopoulos, K.; Koutsodendris, A.; Bertini, A.; Mercuri, A.M.; Masi, A.; Combourieu-Nebout, N.; Joannin, S.; Kouli, K.; Kousis, I.; et al. 1.36 million years of Mediterranean forest refugium dynamics in response to glacial–interglacial cycle strength. Proc. Natl. Acad. Sci. USA 2021, 118, e2026111118. [Google Scholar] [CrossRef]
  10. Hodell, D.A.; Channell, J.E.T. Mode transitions in Northern Hemisphere glaciation: Co-evolution of millennial and orbital variability in Quaternary climate. Clim. Past 2016, 12, 1805–1828. [Google Scholar] [CrossRef]
  11. Weber, M.E.; Bailey, I.; Hemming, S.R.; Martos, Y.M.; Reilly, B.T.; Ronge, T.A.; Brachfeld, S.; Williams, T.; Raymo, M.; Belt, S.T.; et al. Antiphased dust deposition and productivity in the Antarctic Zone over 1.5 million years. Nat. Commun. 2022, 13, 2044. [Google Scholar] [CrossRef] [PubMed]
  12. Sun, Y.; McManus, J.F.; Clemens, S.C.; Zhang, X.; Vogel, H.; Hodell, D.A.; Guo, F.; Wang, T.; Liu, X.; An, Z. Persistent orbital influence on millennial climate variability through the Pleistocene. Nat. Geosci. 2021, 14, 812–818. [Google Scholar] [CrossRef]
  13. Lenton, T.M. Early warning of climate tipping points. Nat. Clim. Chang. 2011, 1, 201–209. [Google Scholar] [CrossRef]
  14. Rousseau, D.D.; Bagniewski, W.; Ghil, M. Abrupt climate changes and the astronomical theory: Are they related? Clim. Past 2022, 18, 249–271. [Google Scholar] [CrossRef]
  15. Hodell, D.; Lourens, L.; Crowhurst, S.; Konijnendijk, T.; Tjallingii, R.; Jiménez-Espejo, F.; Skinner, L.; Tzedakis, P.C.; Abrantes, F.; Acton, G.D.; et al. A reference time scale for Site U1385 (Shackleton Site) on the SW Iberian Margin. Glob. Planet. Chang. 2015, 133, 49–64. [Google Scholar] [CrossRef]
  16. Bajo, P.; Drysdale, R.N.; Woodhead, J.D.; Hellstrom, J.C.; Hodell, D.; Ferretti, P.; Voelker, A.H.L.; Zanchetta, G.; Rodrigues, T.; Wolff, E.; et al. Persistent influence of obliquity on ice age terminations since the Middle Pleistocene transition. Science 2020, 367, 1235–1239. [Google Scholar] [CrossRef]
  17. Mega, A.; Salgueiro, E.; Padilha, M.; Rodrigues, T.; Kuhnert, H.; Voelker, A.H.L. Incursions of extremely cold polar surface waters at the Gulf of Cadiz during the Early-to-Middle Pleistocene Transition. Clim. Past, 2022; in preparation. [Google Scholar]
  18. Rodrigues, T.; Alonso-García, M.; Hodell, D.A.; Rufino, M.; Naughton, F.; Grimalt, J.O.; Voelker, A.H.L.; Abrantes, F. A 1-Ma record of sea surface temperature and extreme cooling events in the North Atlantic: A perspective from the Iberian Margin. Quat. Sci. Rev. 2017, 172, 118–130. [Google Scholar] [CrossRef]
  19. Voelker, A.H.L.; Salgueiro, E.; Rodrigues, T.; Jimenez-Espejo, F.J.; Bahr, A.; Alberto, A.; Loureiro, I.; Padilha, M.; Rebotim, A.; Röhl, U. Mediterranean Outflow and surface water variability off southern Portugal during the early Pleistocene: A snapshot at Marine Isotope Stages 29 to 34 (1020–1135 ka). Glob. Planet. Chang. 2015, 133, 223–237. [Google Scholar] [CrossRef]
  20. Voelker, A.H.L.; Jimenez-Espejo, F.J.; Bahr, A.; Rebotim, A.; Cavaleiro, C.; Salgueiro, E.; Röhl, U. Data report: IODP Site U1387: The revised splice between Sections U1387B-18X-3 and U1387C-8R-3 (>171.6 mcd). Proc. Integr. Ocean Drill. Program 2018, 339, 1–11. [Google Scholar] [CrossRef]
  21. Voelker, A.H.L.; Rodrigues, T.; Padilha, M.; Jiménez-Espejo, F.J.J.; Salgueiro, E.; Kuhnert, H. Early to Middle Pleistocene Climate Records off Southern Iberia Reveal two Types of Interglacial Climate Evolution. In Proceedings of the AGU Fall Meeting, San Francisco, CA, USA, 12–16 December 2016; p. PP31B-2274. [Google Scholar]
  22. Daniault, N.; Mercier, H.; Lherminier, P.; Sarafanov, A.; Falina, A.; Zunino, P.; Pérez, F.F.; Ríos, A.F.; Ferron, B.; Huck, T.; et al. The northern North Atlantic Ocean mean circulation in the early 21st century. Prog. Oceanogr. 2016, 146, 142–158. [Google Scholar] [CrossRef]
  23. Boyer, T.P.; Garcia, H.E.; Locarnini, R.A.; Zweng, M.M.; Mishonov, A.V.; Reagan, J.R.; Weathers, K.A.; Baranova, O.K.; Seidov, D.; Smolyar, I.V. World Ocean Atlas 2018 [Temperature]. 2018, NOAA National Centers for Environmental Information. Available online: https://www.ncei.noaa.gov/archive/accession/NCEI-WOA18 (accessed on 3 May 2022).
  24. Schlitzer, R. Ocean Data View. 2021. Available online: https://odv.awi.de (accessed on 14 May 2022).
  25. Hernández-Molina, F.J.; Sierro, F.J.; Llave, E.; Roque, C.; Stow, D.A.V.; Williams, T.; Lofi, J.; Van der Schee, M.; Arnáiz, A.; Ledesma, S.; et al. Evolution of the gulf of Cadiz margin and southwest Portugal contourite depositional system: Tectonic, sedimentary and paleoceanographic implications from IODP expedition 339. Mar. Geol. 2016, 377, 7–39. [Google Scholar] [CrossRef]
  26. Hernández-Molina, F.J.; Llave, E.; Stow, D.A.V.; García, M.; Somoza, L.; Vázquez, J.T.; Lobo, F.J.; Maestro, A.; Díaz del Río, V.; León, R.; et al. The contourite depositional system of the Gulf of Cádiz: A sedimentary model related to the bottom current activity of the Mediterranean outflow water and its interaction with the continental margin. Deep Sea Res. Part II Top. Stud. Oceanogr. 2006, 53, 1420–1463. [Google Scholar] [CrossRef]
  27. Llave, E.; Schönfeld, J.; Hernandez-Molina, F.J.; Mulder, T.; Somoza, L.; Diaz del Rio, V.; Sanchez-Almazo, I. High-resolution stratigraphy of the Mediterranean outflow contourite system in the Gulf of Cadiz during the late Pleistocene: The impact of Heinrich events. Mar. Geol. 2006, 227, 241–262. [Google Scholar] [CrossRef]
  28. Tzedakis, P.C.; Crucifix, M.; Mitsui, T.; Wolff, E.W. A simple rule to determine which insolation cycles lead to interglacials. Nature 2017, 542, 427–432. [Google Scholar] [CrossRef] [PubMed]
  29. Rohling, E.J.; Yu, J.; Heslop, D.; Foster, G.L.; Opdyke, B.; Roberts, A.P. Sea level and deep-sea temperature reconstructions suggest quasi-stable states and critical transitions over the past 40 million years. Sci. Adv. 2021, 7, eabf5326. [Google Scholar] [CrossRef]
  30. Rohling, E.J.; Foster, G.L.; Grant, K.M.; Marino, G.; Roberts, A.P.; Tamisiea, M.E.; Williams, F. Sea-level and deep-sea-temperature variability over the past 5.3 million years. Nature 2014, 508, 477–482. [Google Scholar] [CrossRef]
  31. Chalk, T.B.; Hain, M.P.; Foster, G.L.; Rohling, E.J.; Sexton, P.F.; Badger, M.P.S.; Cherry, S.G.; Hasenfratz, A.P.; Haug, G.H.; Jaccard, S.L.; et al. Causes of ice age intensification across the Mid-Pleistocene Transition. Proc. Natl. Acad. Sci. USA 2017, 114, 13114–13119. [Google Scholar] [CrossRef]
  32. Yan, Y.; Bender, M.L.; Brook, E.J.; Clifford, H.M.; Kemeny, P.C.; Kurbatov, A.V.; Mackay, S.; Mayewski, P.A.; Ng, J.; Severinghaus, J.P.; et al. Two-million-year-old snapshots of atmospheric gases from Antarctic ice. Nature 2019, 574, 663–666. [Google Scholar] [CrossRef]
  33. Grant, K.M.; Amarathunga, U.; Amies, J.D.; Hu, P.; Qian, Y.; Penny, T.; Rodriguez-Sanz, L.; Zhao, X.; Heslop, D.; Liebrand, D.; et al. Organic carbon burial in Mediterranean sapropels intensified during Green Sahara Periods since 3.2 Myr ago. Commun. Earth Environ. 2022, 3, 11. [Google Scholar] [CrossRef]
  34. Bahr, A.; Kaboth, S.; Jiménez-Espejo, F.J.; Sierro, F.J.; Voelker, A.H.L.; Lourens, L.; Röhl, U.; Reichart, G.J.; Escutia, C.; Hernández-Molina, F.J.; et al. Persistent monsoonal forcing of Mediterranean Outflow Water dynamics during the late Pleistocene. Geology 2015, 43, 951–954. [Google Scholar] [CrossRef]
  35. Sierro, F.J.; Hodell, D.A.; Andersen, N.; Azibeiro, L.A.; Jimenez-Espejo, F.J.; Bahr, A.; Flores, J.A.; Ausin, B.; Rogerson, M.; Lozano-Luz, R.; et al. Mediterranean Overflow Over the Last 250 kyr: Freshwater Forcing From the Tropics to the Ice Sheets. Paleoceanogr. Paleoclimatol. 2020, 35, e2020PA003931. [Google Scholar] [CrossRef]
  36. Stow, D.A.V.; Hernández-Molina, F.J.; Alvarez Zarikian, C.A. The Expedition 339 Scientists. Mediterranean Outflow. In Proceedings of the IODP 2013, 16 November 2011–16 January 2012; Volume 339. [Google Scholar] [CrossRef]
  37. Peliz, A.; Dubert, J.; Santos, A.M.P.; Oliveira, P.B.; Le Cann, B. Winter upper ocean circulation in the Western Iberian Basin—Fronts, Eddies and Poleward Flows: An overview. Deep Sea Res. Part I Oceanogr. Res. Pap. 2005, 52, 621–646. [Google Scholar] [CrossRef]
  38. Peliz, A.; Marchesiello, P.; Santos, A.M.P.; Dubert, J.; Teles-Machado, A.; Marta-Almeida, M.; Le Cann, B. Surface circulation in the Gulf of Cadiz: 2. Inflow-outflow coupling and the Gulf of Cadiz slope current. J. Geophys. Res. 2009, 114, C03011. [Google Scholar] [CrossRef]
  39. Brambilla, E.; Talley, L.D.; Robbins, P.E. Subpolar Mode Water in the northeastern Atlantic: 2. Origin and transformation. J. Geophys. Res. 2008, 113, C04026. [Google Scholar] [CrossRef]
  40. Fiuza, A.F.G.; Hamann, M.; Ambar, I.; del Rio, G.D.; Gonzalez, N.; Cabanas, J.M. Water masses and their circulation off western Iberia during May 1993. Deep Sea Res. Part I 1998, 45, 1127–1160. [Google Scholar] [CrossRef]
  41. Voelker, A.H.L.; Colman, A.; Olack, G.; Waniek, J.J.; Hodell, D. Oxygen and hydrogen isotope signatures of Northeast Atlantic water masses. Deep Sea Res. Part II Top. Stud. Oceanogr. 2015, 116, 89–106. [Google Scholar] [CrossRef]
  42. Carracedo Segade, L.I.; Gilcoto, M.; Mercier, H.; Pérez, F.F. Quasi-synoptic transport, budgets and water mass transformation in the Azores–Gibraltar Strait region during summer 2009. Prog. Oceanogr. 2015, 130, 47–64. [Google Scholar] [CrossRef]
  43. Rios, A.F.; Perez, F.F.; Fraga, F. Water Masses in the Upper and Middle North-Atlantic Ocean East of the Azores. Deep Sea Res. Part A-Oceanogr. Res. Pap. 1992, 39, 645–658. [Google Scholar] [CrossRef]
  44. Relvas, P.; Barton, E.D.; Dubert, J.; Oliveira, P.B.; Peliz, A.; da Silva, J.C.B.; Santos, A.M.P. Physical oceanography of the western Iberia ecosystem: Latest views and challenges. Prog. Oceanogr. 2007, 74, 149–173. [Google Scholar] [CrossRef]
  45. Sanchez, R.F.; Relvas, P. Spring-summer climatological circulation in the upper layer in the region of Cape St. Vincent, Southwest Portugal. ICES J. Mar. Sci. 2003, 60, 1232–1250. [Google Scholar] [CrossRef]
  46. Oezgoekmen, T.M.; Chassignet, E.P.; Rooth, C.G.H. On the connection between the Mediterranean Outflow and the Azores Current. J. Phys. Oceanogr. 2001, 31, 461–480. [Google Scholar] [CrossRef]
  47. Fründt, B.; Müller, T.J.; Schulz-Bull, D.E.; Waniek, J.J. Long-term changes in the thermocline of the subtropical Northeast Atlantic (33° N, 22° W). Prog. Oceanogr. 2013, 116, 246–260. [Google Scholar] [CrossRef]
  48. Baringer, M.O.; Price, J.F. Mixing and spreading of the Mediterranean outflow. J. Phys. Oceanogr. 1997, 27, 1654–1677. [Google Scholar] [CrossRef]
  49. Ambar, I.; Howe, M.R. Observations of the Mediterranean Outflow: 1. Mixing in the Mediterranean Outflow. Deep Sea Res. 1979, 26, 535–554. [Google Scholar] [CrossRef]
  50. Carracedo, L.I.; Pardo, P.C.; Flecha, S.; Pérez, F.F. On the Mediterranean Water Composition. J. Phys. Oceanogr. 2015, 46, 1339–1358. [Google Scholar] [CrossRef]
  51. Ambar, I.; Howe, M.R. Observations of the Mediterranean Outflow: 2. Deep Circulation in the Vicinity of the Gulf of Cadiz. Deep Sea Res. Part A-Oceanogr. Res. Pap. 1979, 26, 555–568. [Google Scholar] [CrossRef]
  52. Ambar, I.; Serra, N.; Brogueira, M.J.; Cabecadas, G.; Abrantes, F.; Freitas, P.; Goncalves, C.; Gonzalez, N. Physical, chemical and sedimentological aspects of the Mediterranean outflow off Iberia. Deep Sea Res. Part II Top. Stud. Oceanogr. 2002, 49, 4163–4177. [Google Scholar] [CrossRef]
  53. Ambar, I. A Shallow Core of Mediterranean Water Off Western Portugal. Deep Sea Res. Part A-Oceanogr. Res. Pap. 1983, 30, 677–680. [Google Scholar] [CrossRef]
  54. Kinder, T.H.; Parrilla, G. Yes, Some of the Mediterranean Outflow Does Come from Great Depth. J. Geophys. Res. 1987, 92, 2901–2906. [Google Scholar] [CrossRef]
  55. Millot, C.; Candela, J.; Fuda, J.-L.; Tber, Y. Large warming and salinification of the Mediterranean outflow due to changes in its composition. Deep Sea Res. Part I Oceanogr. Res. Pap. 2006, 53, 656–666. [Google Scholar] [CrossRef]
  56. Müller, P.J.; Kirst, G.; Ruhland, G.; von Storch, I.; Rosell-Melé, A. Calibration of the alkenone paleotemperature index Uk’37 based on core-tops from the eastern South Atlantic and the global ocean (60° N–60° S). Geochim. Cosmochim. Acta 1998, 62, 1757–1772. [Google Scholar] [CrossRef]
  57. Schiebel, R.; Hemleben, C. Planktic Foraminifers in the Modern Ocean; Springer: Berlin/Heidelberg, Germany, 2017; p. 358. [Google Scholar]
  58. Salgueiro, E.; Voelker, A.; Abrantes, F.; Meggers, H.; Pflaumann, U.; Loncaric, N.; Gonzalez-Alvarez, R.; Oliveira, P.; Bartels-Jonsdottir, H.B.; Moreno, J.; et al. Planktonic foraminifera from modern sediments reflect upwelling patterns off Iberia: Insights from a regional transfer function. Mar. Micropaleontol. 2008, 66, 135–164. [Google Scholar] [CrossRef]
  59. Flores, J.A.; Sierro, F.J. Revised technique for calculation of calcareous nannofossil accumulation rates. Micropaleontology 1997, 43, 321–324. [Google Scholar] [CrossRef]
  60. Trotta, S.; Marino, M.; Voelker, A.H.L.; Rodrigues, T.; Maiorano, P.; Flores, J.A.; Girone, A.; Addante, M.; Balestra, B. Paleoenvironmental reconstruction in the Gulf of Cadiz using calcareous nannofossil assemblages during the Early Pleistocene (MIS 48-MIS 45). Palaeogeogr. Palaeoclimatol. Palaeoecol. submitted.
  61. Lisiecki, L.E.; Raymo, M. A Pliocene-Pleistocene stack of 57 globally distributed benthic δ18O records. Paleoceanography 2005, 20, PA1003. [Google Scholar] [CrossRef]
  62. Hodell, D.A.; Channell, J.E.T.; Curtis, J.H.; Romero, O.E.; Röhl, U. Onset of ‘Hudson Strait’ Heinrich Events in the Eastern North Atlantic at the end of the Middle Pleistocene Transition (~640 ka)? Paleoceanography 2008, 23, PA4218. [Google Scholar] [CrossRef]
  63. Laskar, J.; Robutel, P.; Joutel, F.; Gastineau, M.; Correia, A.C.M.; Levrard, B. A long-term numerical solution for the insolation quantities of the Earth. Astron. Astrophys. 2004, 428, 261–285. [Google Scholar] [CrossRef]
  64. Kucera, M. Chapter Six Planktonic Foraminifera as Tracers of Past Oceanic Environments. In Developments in Marine Geology; Hillaire–Marcel, C., De Vernal, A., Eds.; Elsevier: Amsterdam, The Netherlands, 2007; Volume 1, pp. 213–262. [Google Scholar]
  65. Moal-Darrigade, P.; Ducassou, E.; Giraudeau, J.; Bahr, A.; Kaboth-Bahr, S.; Hanquiez, V.; Perello, M.-C. MOW strengthening and contourite development over two analog climate cycles (MIS 12–11 and MIS 2–1) in the Gulf of Cadíz: An impact on North Atlantic climate during deglaciation V and MIS 11? Glob. Planet. Chang. 2022, 208, 103721. [Google Scholar] [CrossRef]
  66. Voelker, A.H.L.; Rodrigues, T.; Billups, K.; Oppo, D.; McManus, J.; Stein, R.; Hefter, J.; Grimalt, J.O. Variations in mid-latitude North Atlantic surface water properties during the mid-Brunhes (MIS 9-14) and their implications for the thermohaline circulation. Clim. Past 2010, 6, 531–552. [Google Scholar] [CrossRef]
  67. Rogerson, M.; Rohling, E.J.; Bigg, G.R.; Ramirez, J. Paleoceanography of the Atlantic-Mediterranean exchange: Overview and first quantitative assessment of climatic forcing. Rev. Geophys. 2012, 50, RG2003. [Google Scholar] [CrossRef]
  68. Voelker, A.H.L.; Lebreiro, S.M.; Schönfeld, J.; Cacho, I.; Erlenkeuser, H.; Abrantes, F. Mediterranean outflow strengthening during northern hemisphere coolings: A salt source for the glacial Atlantic? Earth Planet. Sci. Lett. 2006, 245, 39–55. [Google Scholar] [CrossRef]
  69. De Lange, G.J.; Thomson, J.; Reitz, A.; Slomp, C.P.; Speranza Principato, M.; Erba, E.; Corselli, C. Synchronous basin-wide formation and redox-controlled preservation of a Mediterranean sapropel. Nat. Geosci. 2008, 1, 606–610. [Google Scholar] [CrossRef]
  70. Rogerson, M.; Cacho, I.; Jimenez-Espejo, F.; Reguera, M.I.; Sierro, F.J.; Martinez-Ruiz, F.; Frigola, J.; Canals, M. A dynamic explanation for the origin of the western Mediterranean organic-rich layers. Geochem. Geophys. Geosyst. 2008, 9, Q07U01. [Google Scholar] [CrossRef]
  71. Toucanne, S.; Jouet, G.; Ducassou, E.; Bassetti, M.-A.; Dennielou, B.; Angue Minto’o, C.M.; Lahmi, M.; Touyet, N.; Charlier, K.; Lericolais, G.; et al. A 130,000-year record of Levantine Intermediate Water flow variability in the Corsica Trough, western Mediterranean Sea. Quat. Sci. Rev. 2012, 33, 55–73. [Google Scholar] [CrossRef]
  72. Frigola, J.; Moreno, A.; Cacho, I.; Canals, M.; Sierro, F.J.; Flores, J.A.; Grimalt, J.O.; Hodell, D.A.; Curtis, J.H. Holocene climate variability in the western Mediterranean region from a deepwater sediment record. Paleoceanography 2007, 22, 1–16. [Google Scholar] [CrossRef]
  73. Jiménez-Espejo, F.J.; Pardos-Gené, M.; Martínez-Ruiz, F.; García-Alix, A.; van de Flierdt, T.; Toyofuku, T.; Bahr, A.; Kreissig, K. Geochemical evidence for intermediate water circulation in the westernmost Mediterranean over the last 20kyrBP and its impact on the Mediterranean Outflow. Glob. Planet. Chang. 2015, 135, 38–46. [Google Scholar] [CrossRef]
  74. Bosmans, J.H.C.; Drijfhout, S.S.; Tuenter, E.; Hilgen, F.J.; Lourens, L.J. Response of the North African summer monsoon to precession and obliquity forcings in the EC-Earth GCM. Clim. Dyn. 2015, 44, 279–297. [Google Scholar] [CrossRef]
  75. Louarn, E.; Morin, P. Antarctic Intermediate Water influence on Mediterranean Sea Water outflow. Deep Sea Res. Part I Oceanogr. Res. Pap. 2011, 58, 932–942. [Google Scholar] [CrossRef]
  76. Bosmans, J.H.C.; Drijfhout, S.S.; Tuenter, E.; Hilgen, F.J.; Lourens, L.J.; Rohling, E.J. Precession and obliquity forcing of the freshwater budget over the Mediterranean. Quat. Sci. Rev. 2015, 123, 16–30. [Google Scholar] [CrossRef]
  77. Bemis, B.E.; Spero, H.J.; Lea, D.W.; Bijma, J. Temperature influence on the carbon isotopic composition of Globigerina bulloides and Orbulina universa (planktonic foraminifera). Mar. Micropaleontol. 2000, 38, 213–228. [Google Scholar] [CrossRef]
  78. Naafs, B.D.A.; Hefter, J.; Stein, R. Millennial-scale ice rafting events and Hudson Strait Heinrich(-like) Events during the late Pliocene and Pleistocene: A review. Quat. Sci. Rev. 2013, 80, 1–28. [Google Scholar] [CrossRef]
  79. Cacho, I.; Grimalt, J.O.; Canals, M.; Sbaffi, L.; Shackleton, N.J.; Schoenfeld, J.; Zahn, R. Variability of the western Mediterranean Sea surface temperature during the last 25,000 years and its connection with the Northern Hemisphere climatic changes. Paleoceanography 2001, 16, 40–52. [Google Scholar] [CrossRef]
  80. Martin-Garcia, G.M.; Alonso-Garcia, M.; Sierro, F.J.; Hodell, D.A.; Flores, J.A. Severe cooling episodes at the onset of deglaciations on the Southwestern Iberian margin from MIS 21 to 13 (IODP site U1385). Glob. Planet. Chang. 2015, 135, 159–169. [Google Scholar] [CrossRef]
  81. Salgueiro, E.; Naughton, F.; Voelker, A.H.L.; de Abreu, L.; Alberto, A.; Rossignol, L.; Duprat, J.; Magalhães, V.H.; Vaqueiro, S.; Turon, J.L.; et al. Past circulation along the western Iberian margin: A time slice vision from the Last Glacial to the Holocene. Quat. Sci. Rev. 2014, 106, 316–329. [Google Scholar] [CrossRef]
  82. Birner, B.; Hodell, D.A.; Tzedakis, P.C.; Skinner, L.C. Similar millennial climate variability on the Iberian margin during two early Pleistocene glacials and MIS 3. Paleoceanography 2016, 31, 203–217. [Google Scholar] [CrossRef]
  83. Raymo, M.E.; Ganley, K.; Carter, S.; Oppo, D.W.; McManus, J. Millennial-scale climate instability during the early Pleistocene epoch. Nature 1998, 392, 699–702. [Google Scholar] [CrossRef]
  84. Hodell, D.; Crowhurst, S.; Skinner, L.; Tzedakis, P.C.; Margari, V.; Channell, J.E.T.; Kamenov, G.; Maclachlan, S.; Rothwell, G. Response of Iberian Margin sediments to orbital and suborbital forcing over the past 420 ka. Paleoceanography 2013, 28, 185–199. [Google Scholar] [CrossRef]
  85. Maiorano, P.; Marino, M.; Balestra, B.; Flores, J.A.; Hodell, D.A.; Rodrigues, T. Coccolithophore variability from the Shackleton Site (IODP Site U1385) through MIS 16-10. Glob. Planet. Chang. 2015, 133, 35–48. [Google Scholar] [CrossRef]
  86. Marino, M.; Maiorano, P.; Tarantino, F.; Voelker, A.; Capotondi, L.; Girone, A.; Lirer, F.; Flores, J.-A.; Naafs, B.D.A. Coccolithophores as proxy of sea-water changes at orbital-to-millennial scale during middle Pleistocene Marine Isotope Stages 14-9 in North Atlantic core MD01-2446. Paleoceanography 2014, 29, 518–532. [Google Scholar] [CrossRef]
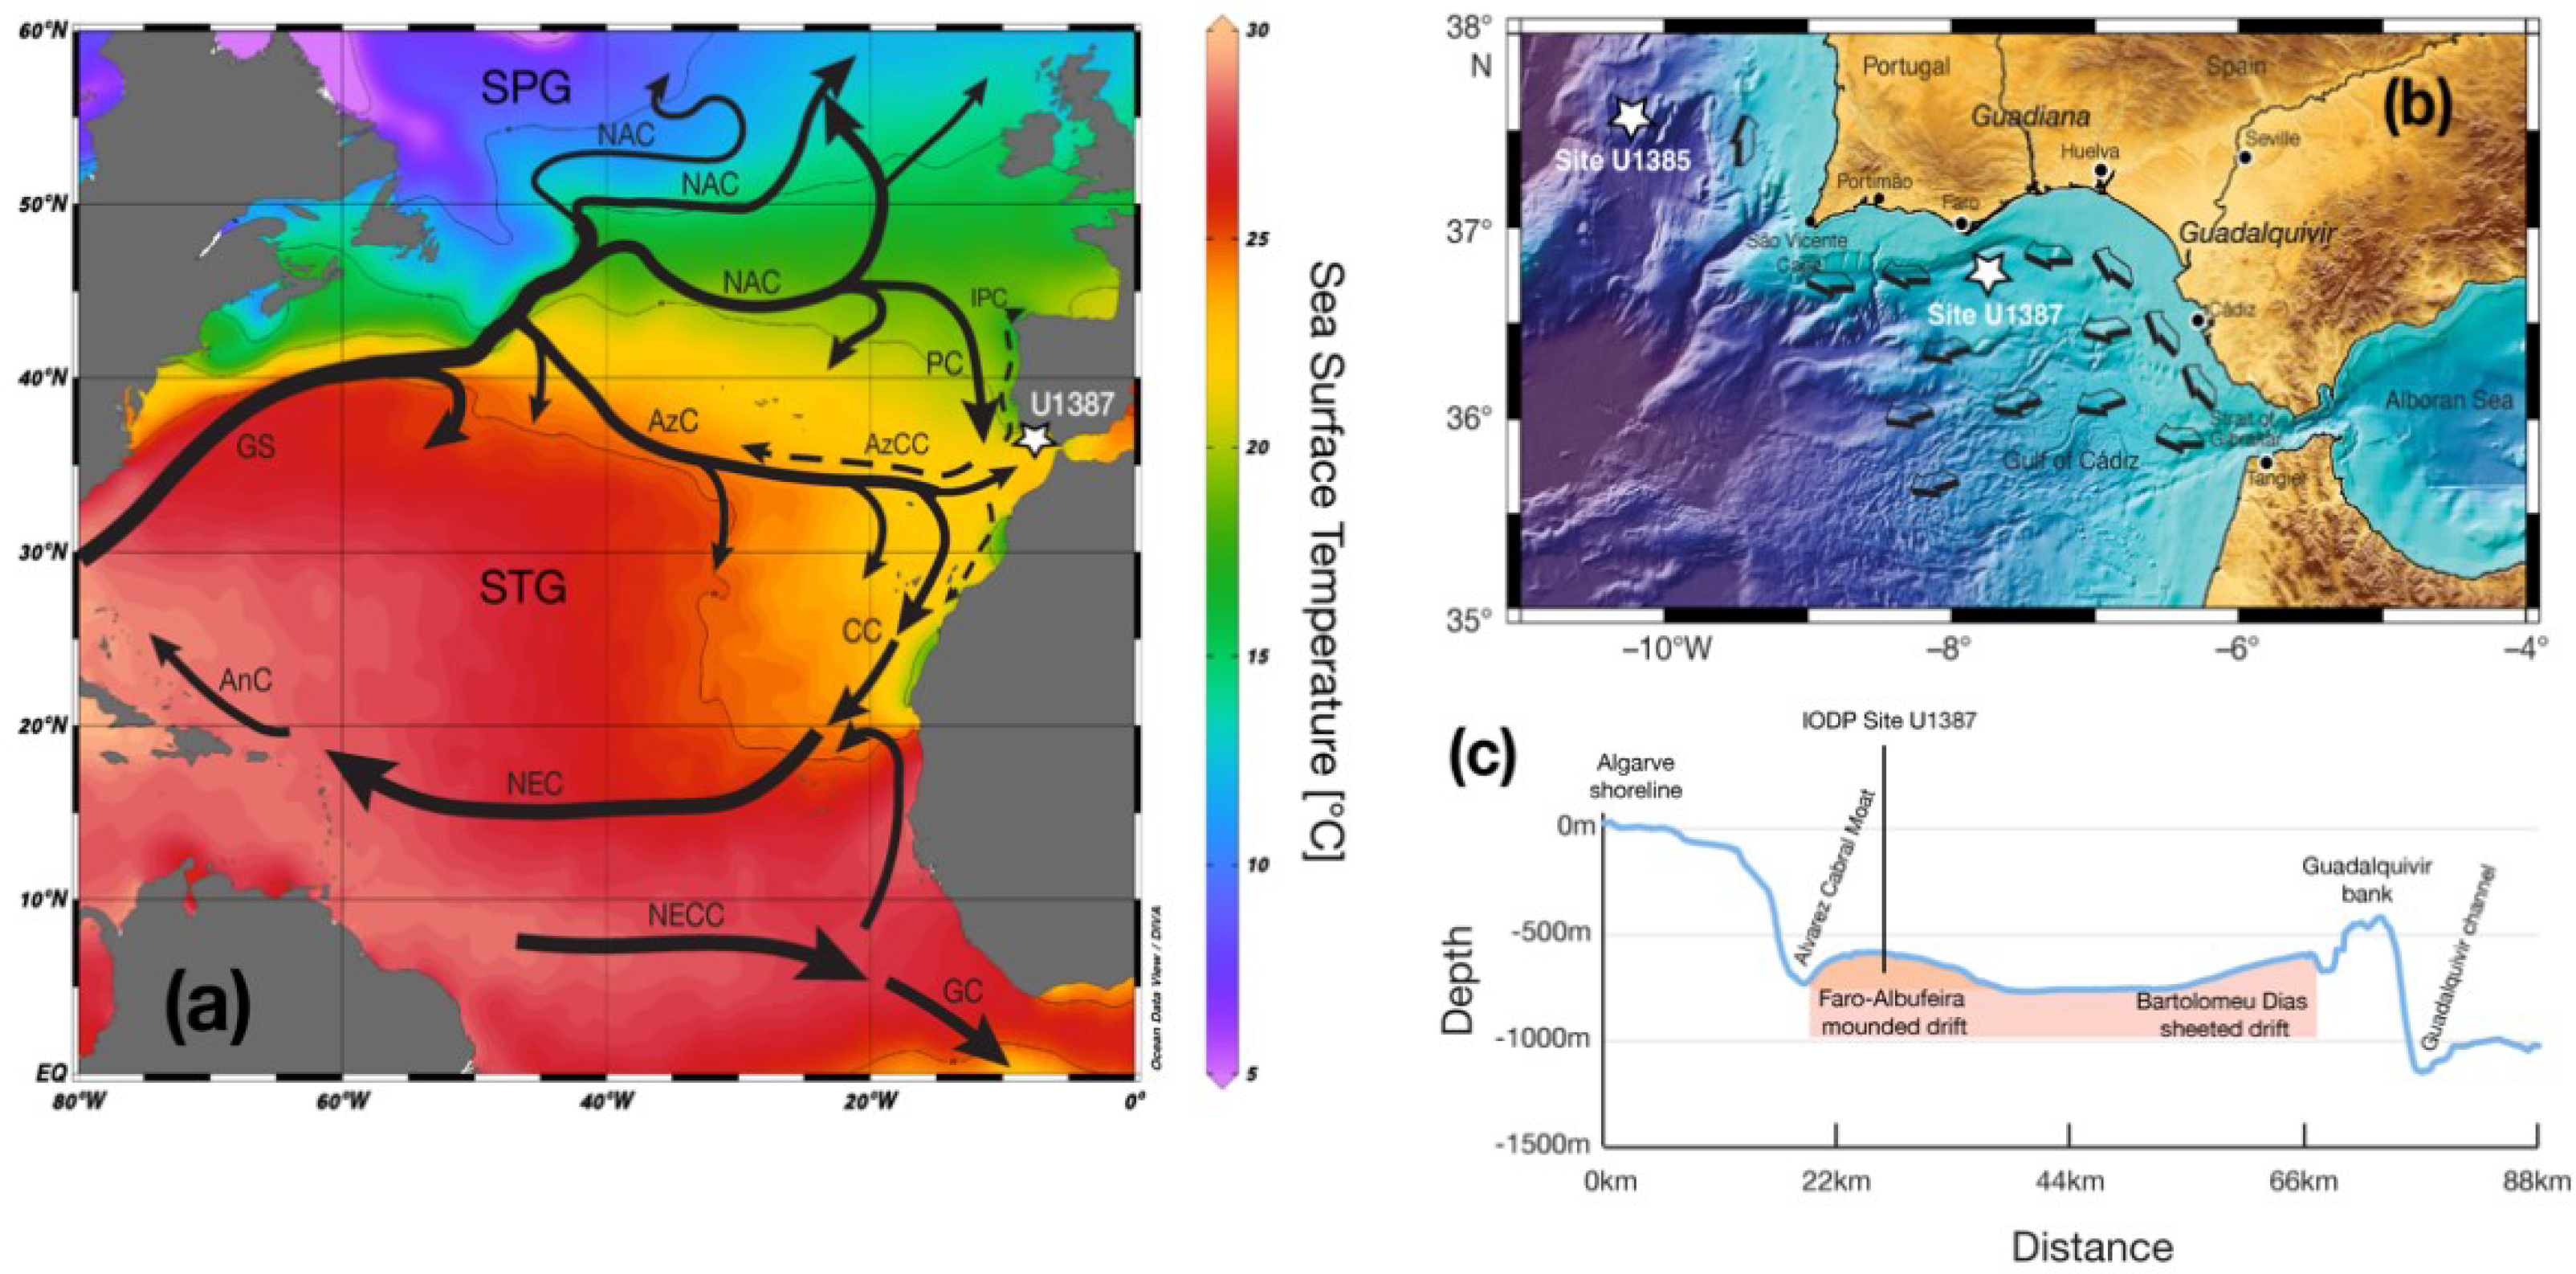
Figure 1. (a) Map of the North Atlantic Ocean showing the major surface water circulation currents with Gulf Stream recirculation and circulation pathways north of 40° N following [22]. Seasonal or dominantly subsurface currents are shown as dashed lines. The subarctic front separating the subtropical gyre (STG) from the subpolar gyre (SPG) is associated with the northern boundary of the central (“50° N”) branch of the North Atlantic Current (NAC). Other currents are abbreviated as follows (in alphabetical order): AnC-Antilles Current; AzC-Azores Current; AzCC-Azores Counter Current; CC-Canary Current; GC-Guinea Current; GS-Gulf Stream; IPC-Iberian Poleward Current; NEC-North Equatorial Current; NECC-North Equatorial Counter Current; and PC-Portugal Current. The background shows the summer (July–Sept.) sea surface temperature at 0.25-degree resolution based on the World Ocean Atlas 2018 [23] (map made with Ocean Data View [24]). (b) Close-up of the Gulf of Cadiz (bathymetry as background) with the locations of IODP Sites U1387 and U1385 and major pathways of the Mediterranean Outflow Water branches indicated by arrows. (c) Depth profile from the upper to the middle slope of the Algarve margin near the longitude of IODP Site U1387 (extracted from https://portal.emodnet-bathymetry.eu/; accessed on 4 July 2022). The colored bar indicates roughly the lateral expansion of the contourite depositional system offshore Faro (but not the vertical expansion!), with the darker colored area highlighting the Faro-Albufeira mounded drift into which IODP Site U1387 was drilled [25]. Lateral expansion and local names follow [26,27].
Atmosphere 13 01378 g001
Figure 2. The age model for IODP Site U1387 was established by tuning its benthic δ18O record (a) to the one of IODP Site U1308 (b) [10]. Tuning points are indicated by red arrows and listed in Table 1. (c) Sedimentation rates for IODP Site U1387.
Atmosphere 13 01378 g002
Figure 3. Focus on Mediterranean Outflow Water history at IODP Site U1387: (a) Sea level relative to today [29]; (b) benthic foraminifera δ18O record; (c) benthic foraminifera δ13C record; (d) weight percentage of the sand-sized fraction (>63 µm) with maxima indicating contourite layers, with the exception of the stippled peak during the deglaciation where the samples contain a large number of gypsum crystals; (e) XRF scanning derived Ba/Ca record (green) of ODP Site 967 [33] with maxima marking sapropel layers in the eastern Mediterranean Sea, in comparison to 21st June insolation at 37° N [63]; (f) comparison between benthic foraminifera δ13C records of IODP Site U1387 (magenta) and IODP Site U1308 (black) [10] with the Site U1308 record reflecting AMOC conditions in the deep North Atlantic.
Atmosphere 13 01378 g003
Figure 4. Planktonic foraminifera stable isotope records of IODP Site U1387. (a) G. ruber white δ18O record; (b) G. bulloides δ18O record; (c) δ13C records of G. ruber white (blue) and G. bulloides (orange); (d) percentage contributions of G. ruber white (blue) and G. bulloides (orange) to the planktonic foraminifera fauna.
Atmosphere 13 01378 g004
Figure 5. Terminal stadial event of MIS 48 (yellow bar) and millennial-scale variability in MIS 46 at IODP Site U1387: (a) Obliquity (black) and Precession (dark magenta) [63]; (b) G. bulloides δ18O record; (c) Uk’37 sea surface temperatures; (d) percentage of polar species N. pachyderma in the planktonic foraminifera assemblage; (e) percentage of subpolar species T. quniqueloba; (f) percentage of subpolar species N. incompta; (g) δ18O bulk carbonate record of IODP Site U1308 [10] with peaks of lower values indicating ice-rafting events in the eastern North Atlantic.
Atmosphere 13 01378 g005
Figure 6. Focus on the warm water sphere during MIS 47: (a) G. bulloides δ18O record; (b) Uk’37 sea surface temperatures; (c) summer (June–September) insolation at 65° N [63]; (d) percentage contribution of subtropical planktonic foraminifera to the assemblage; (e) percentage contribution of tropical planktonic foraminifera (purple) and just of subsurface dwelling, tropical species G. crassaformis (strawberry pink) to the assemblage; (f) Percentage of warm water taxa in the calcareous nannofossil flora.
Atmosphere 13 01378 g006
Table 1. Age model tuning points for IODP Site U1387.
Depth in U1387 [c-mcd] 1LR04 Age in U1308 [ka]Comment
422.161413.15Primary point
425.441420.71Primary point
427.261424.47Secondary point
429.011427.44Primary point
432.831446.03Secondary point
434.581453.00Primary point
436.211456.00Primary point
437.451457.43Secondary point
440.281466.29Primary point
443.361484.14Primary point
1 c-mcd = corrected meters composite depth [20].
Publisher’s Note: MDPI stays neutral with regard to jurisdictional claims in published maps and institutional affiliations.