1. Introduction
Soil moisture as an environmental variable is gaining new significance in terms of the role it plays in the hydrological cycle. It tends to influence rainfall–runoff relationships, constrains infiltration and groundwater recharge, and moreover, controls evapotranspiration as well as photosynthesis. To some extent, it conditions water and energy transfer between the land, vegetation, and the atmosphere [
1,
2,
3,
4] but also embraces multiscale feedback as well. The importance of soil moisture was made evident particularly with respect to the partitioning between the sensible and latent heat fluxes, and consequently for the temperature of the Earth’s surface and the lower atmosphere [
5,
6].
Additionally, soil moisture and related pore space air volume impact physiochemical processes in the soil, such as reduction and oxidation. From the viewpoint of mass and energy exchange, the storage and availability of water tend to be crucial for vegetation growth and shortages of water seem to be a major limitation to agricultural production. In recent years, on-going climate change have involved atmospheric and hydrological droughts and has furthermore provided for the development of soil and physiological droughts affecting harvest yields and water supplies. The observed increase in air temperature along with precipitation shortages occur more frequently all over the world, e.g., in Europe and Poland, and affect the security of water resources as well as crop yields [
7].
The western provinces of Poland have been constrained by droughts and high air temperatures for decades already [
8]. In Europe, the Mediterranean regions are the most affected, but the last decades have shown that all European Union countries can be confronted by drought issues [
9,
10]. Noticeable results of these weather extremes have been evident in light- and medium-mineral soils with a relatively deep ground water table, where the goals of water management still need to be realised or adjusted to actual climatic conditions. Such soils are widespread over the territory of Poland and cover 60% of arable lands, including light sandy or sandy clay deposits. The research on drought mitigation for such soils has been insufficient thus far, but they still deserve attention in the current, on-going scientific works, and therefore, they are the subject of this paper regarding their dryness indices and the possible relationships among them [
11].
The aim of this paper was the quantification of the soil water conditions dependent on climatic indicators (precipitation, evapotranspiration, soil water content) for a 1 m profile of a light soil susceptible to drought. We hypothesised the usefulness of the climatic water balance to distinguish in practical terms the periods of a weak soil water regime (simultaneously associated with lowered groundwater tables and soil water content) [
12]. This is supported by the fact, that the contemporary research on soil droughts in Poland overlooks the relations between the water balance elements and soil moisture conditions within small river valleys covered by light sandy soils.
3. Results
3.1. Basic Soil Properties
Basic properties of characteristic soil layers are given in
Table 1.
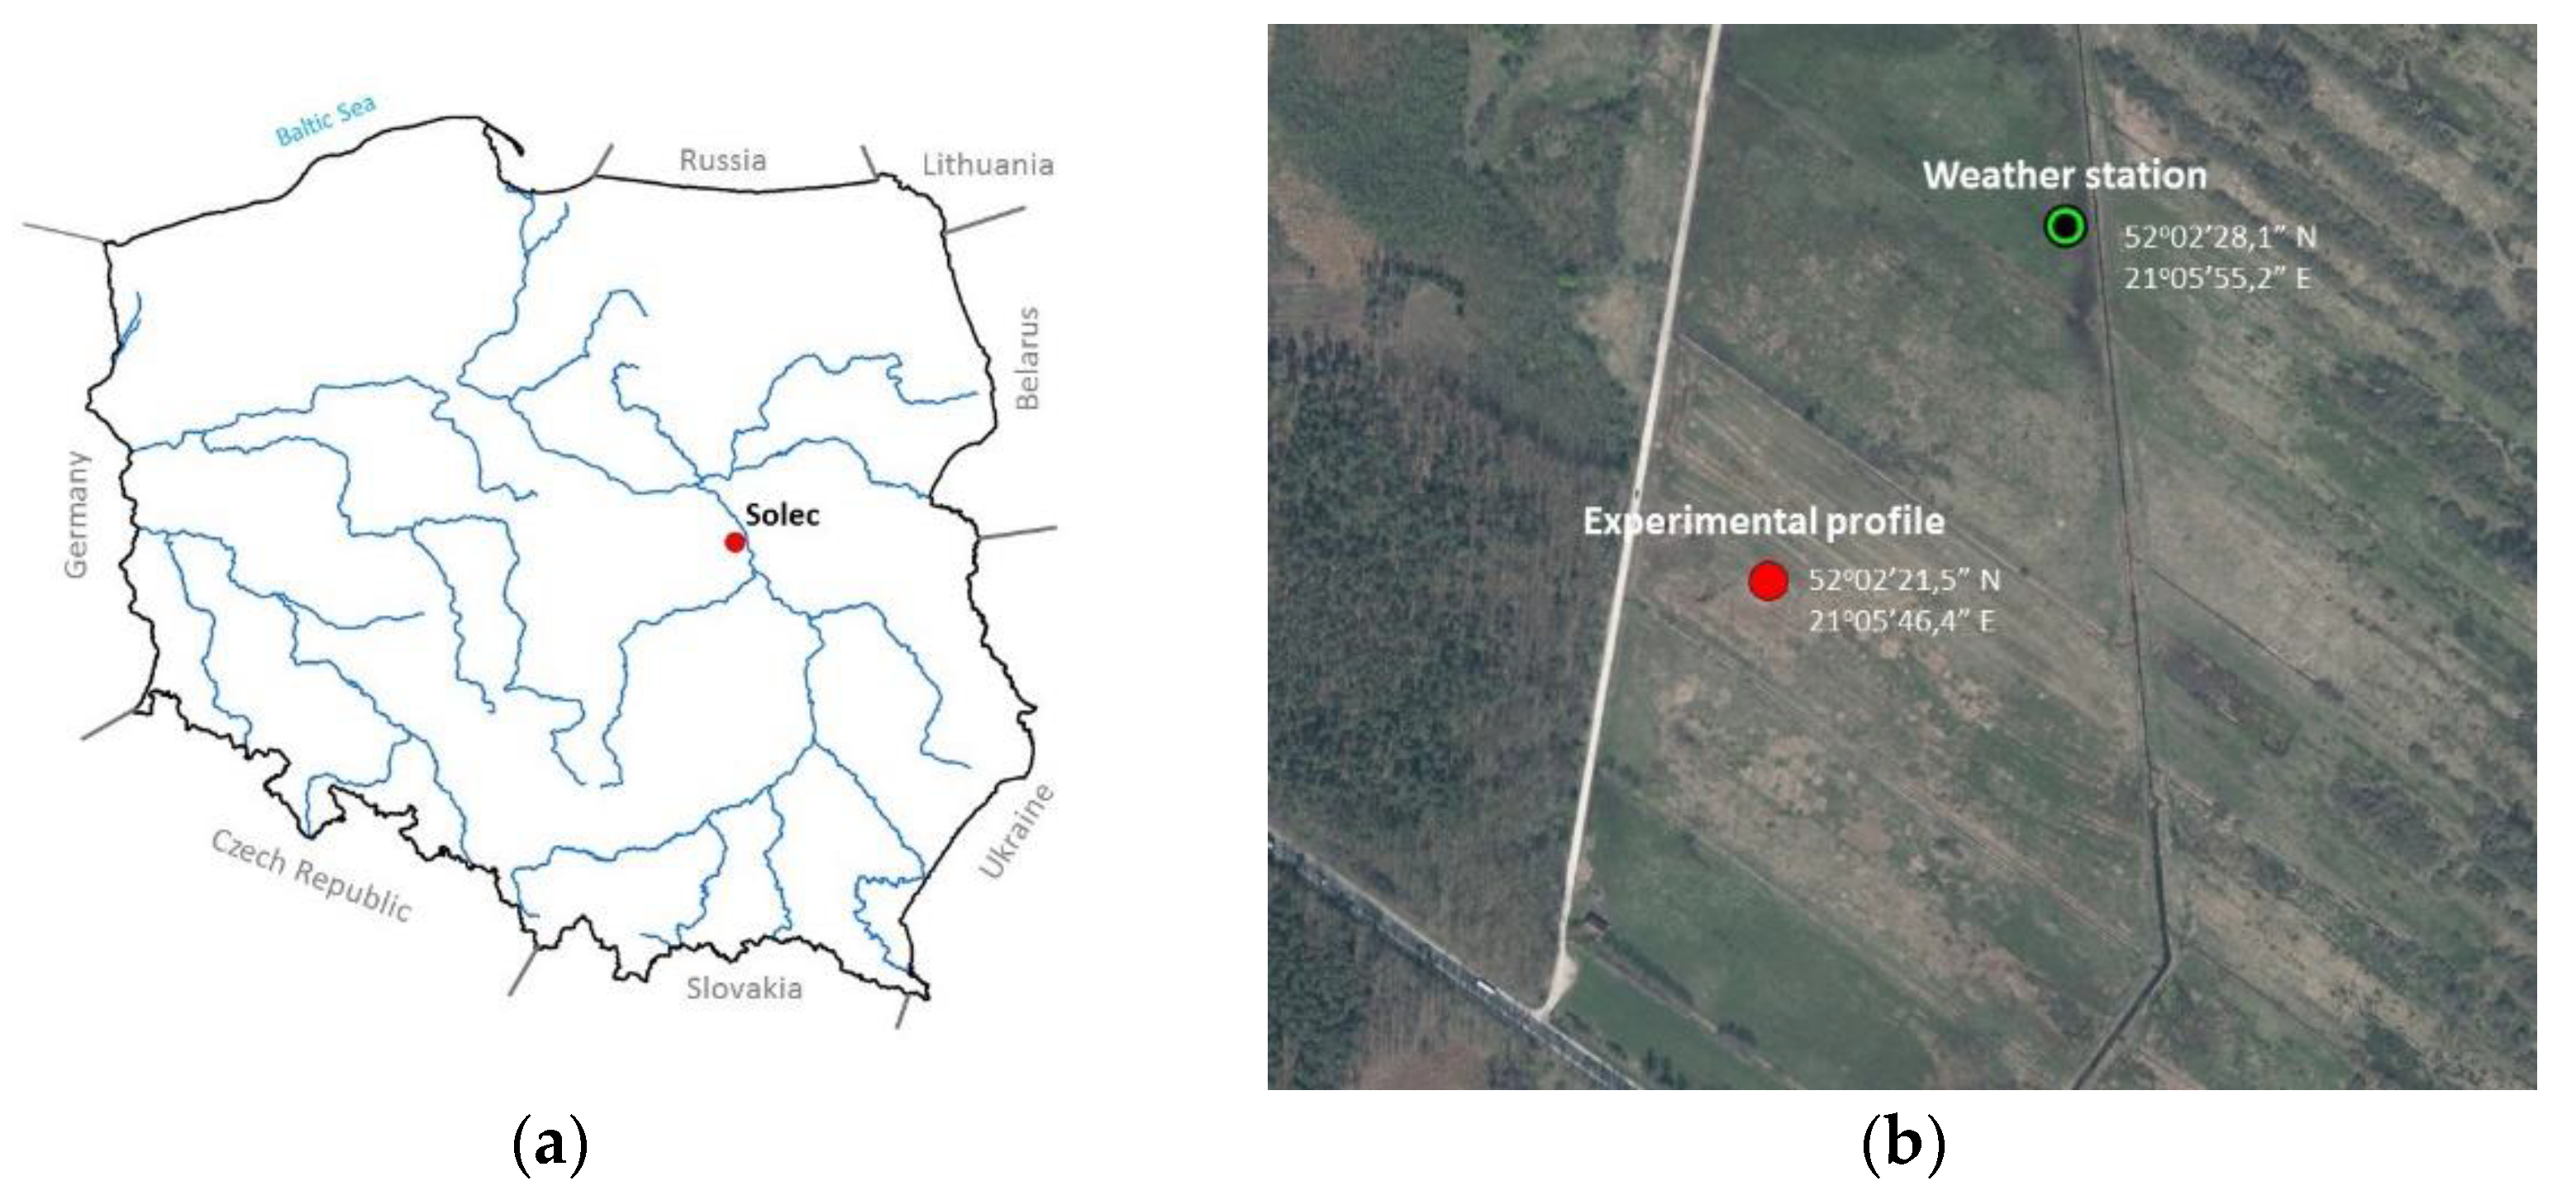
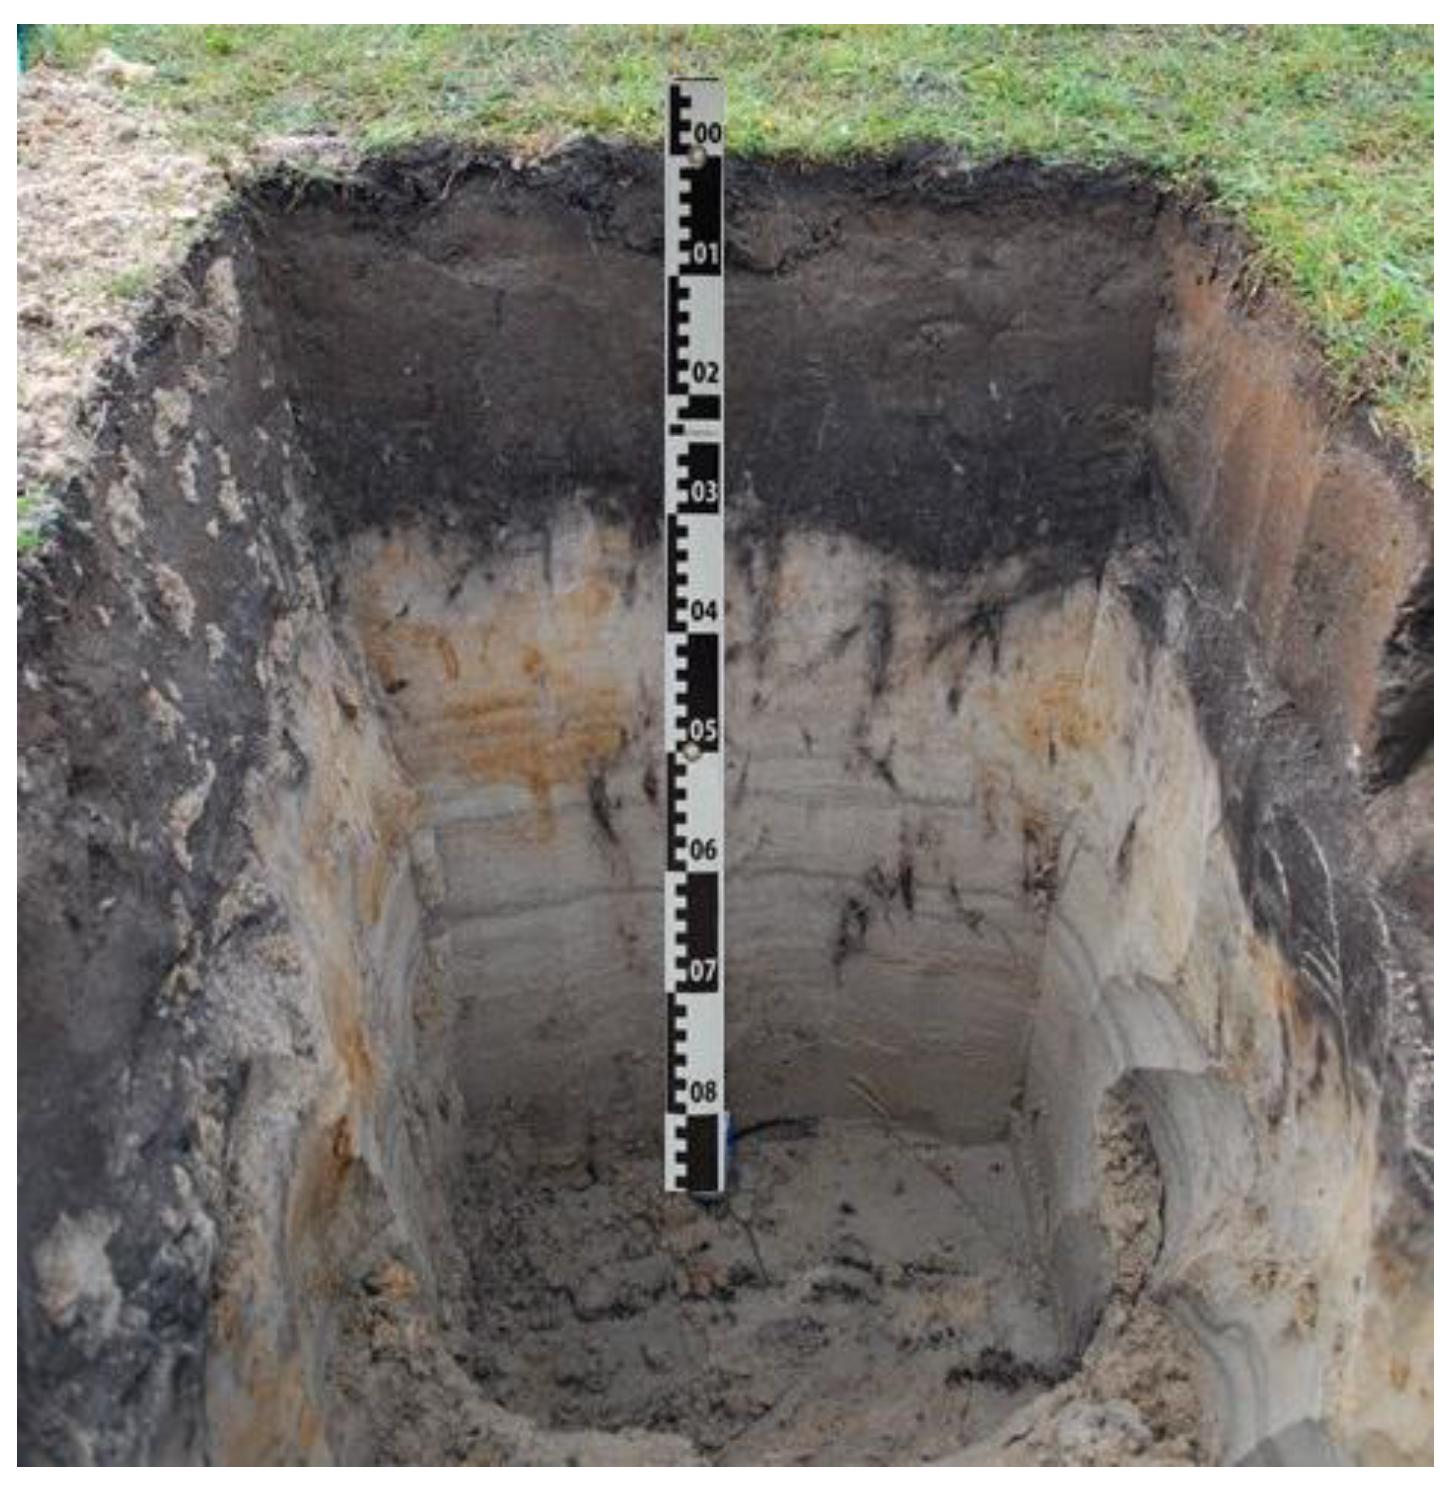
The presented data prove the highest variability of the properties for the topsoil layers, which are characterised by the lowest bulk density and the highest porosity and organic matter content, in comparison to deeper layers. Deeper layers (below 25 cm) were mainly dominated by the occurrence of the specific sand formation, the so-called Vistula sand. The whole soil profile was classified as a gley soil, Stagnic Folic Gleysols–Arenic, according to WRB [
13].
Based on the physical and chemical properties of the investigated soil layers, the soil water retention curve was determined using a pedotransfer function [
26] and was validated based on direct measurement points of pF: 2.0; 3.0 and 4.2 as given in
Table 1. The following data were used for calculation of the van Genuchten [
26] parameters, i.e., the percentage of silt (S) and clay (C) content, organic matter content (OM), and bulk density (D). For the top layers (i.e., 0–15 and 15–25 cm), the quality variable indicated the topsoil was equal to 1. The results of the calculated parameters of the van Genuchten function (θs, α, n) were then used to plot the soil moisture retention curve (pF curve) for the analysed soil layer (
Figure 3).
Below the depth of 25 cm, the pF curves were similar and the main differences only appeared in the saturated moisture content of the selected layers. This part of the soil profile included only the sand formation with a slightly different bulk density and organic matter content. The top layers are also basically formed from sand materialhowever, they were differentiated by soil bulk density and organic matter content. This is especially visible in the saturated moisture content. In the layer 0–15 cm, this parameter value was approximately equal to 50%.
Below this layer, the saturated moisture content was substantially lower (layer 15–25) and equal approximately to 43%. The soil water field capacity of the sand formation (layers from 25 to 100 cm) was approximately equal to 10%, whereas in the top soil layers, it reached 26% (15–25 cm) and 34%. Based on the analysis of the pF curves, it can be concluded that top soil layers were able to retain more water than the sand formation.
The information on the pF curves was used to calculate the spatiotemporal changes of the matric potential in the analysed soil profile (results in
Section 3.6: Soil Matric Potential and Moisture Variability). For this reason, the measured data of soil moisture content (Delta–T) were then transformed using the van Genuchten parameters [
26] into the matric potential. Based on this type of recalculation, we expected to approximate the layers with weak water regime in terms of the prognosis of dryness conditions for this type of soil.
3.2. Analysis of Meteorological Conditions
Mean monthly, long-term precipitation totals (1960–2017) revealed gradual increases from April to July, but then, they decreased, finally reaching the lowest value in October, nearly identical to April. However, the highest precipitation totals occurred in the summer from June to August.
Monthly precipitation distribution in the analysed years, 2015–2017, was different from the long-term precipitation. The observed totals for the period April–October were equal to 309.7 mm in 2015, 334.7 mm in 2016 and 564.9 in 2017, while the long-term mean (1960–2017) equalled 396.7 mm. The highest precipitation totals in the research period were observed for autumn months, October 2016 and September 2017, and they were considerably higher than the long-term ones. At the same time, the observation period in 2017 (except for September) exhibited monthly totals closest to the long-term values.
The exceptionally low precipitation was observed for August 2015 (7.4 mm) in comparison to the long-term precipitation (64.6 mm) however, the highest monthly values occurred in September 2016 and October 2016 and 2017, considerably exceeding the long-term averages.
One of the frequently used indicators of atmospheric drought is the relative precipitation index (RPI) [
27]. Based on the data given in
Table 2, the years 2015–2016 can be estimated as dry, with 2017 as a wet year. This fact is also supported by the aridity index (AI), which for the year 2015, was equal to 0.41 (semi-arid class), for 2016, reached 0.48 (also semi-arid), and for 2017 reached 0.93, which was estimated as humid.
3.3. Climatic Water Balance
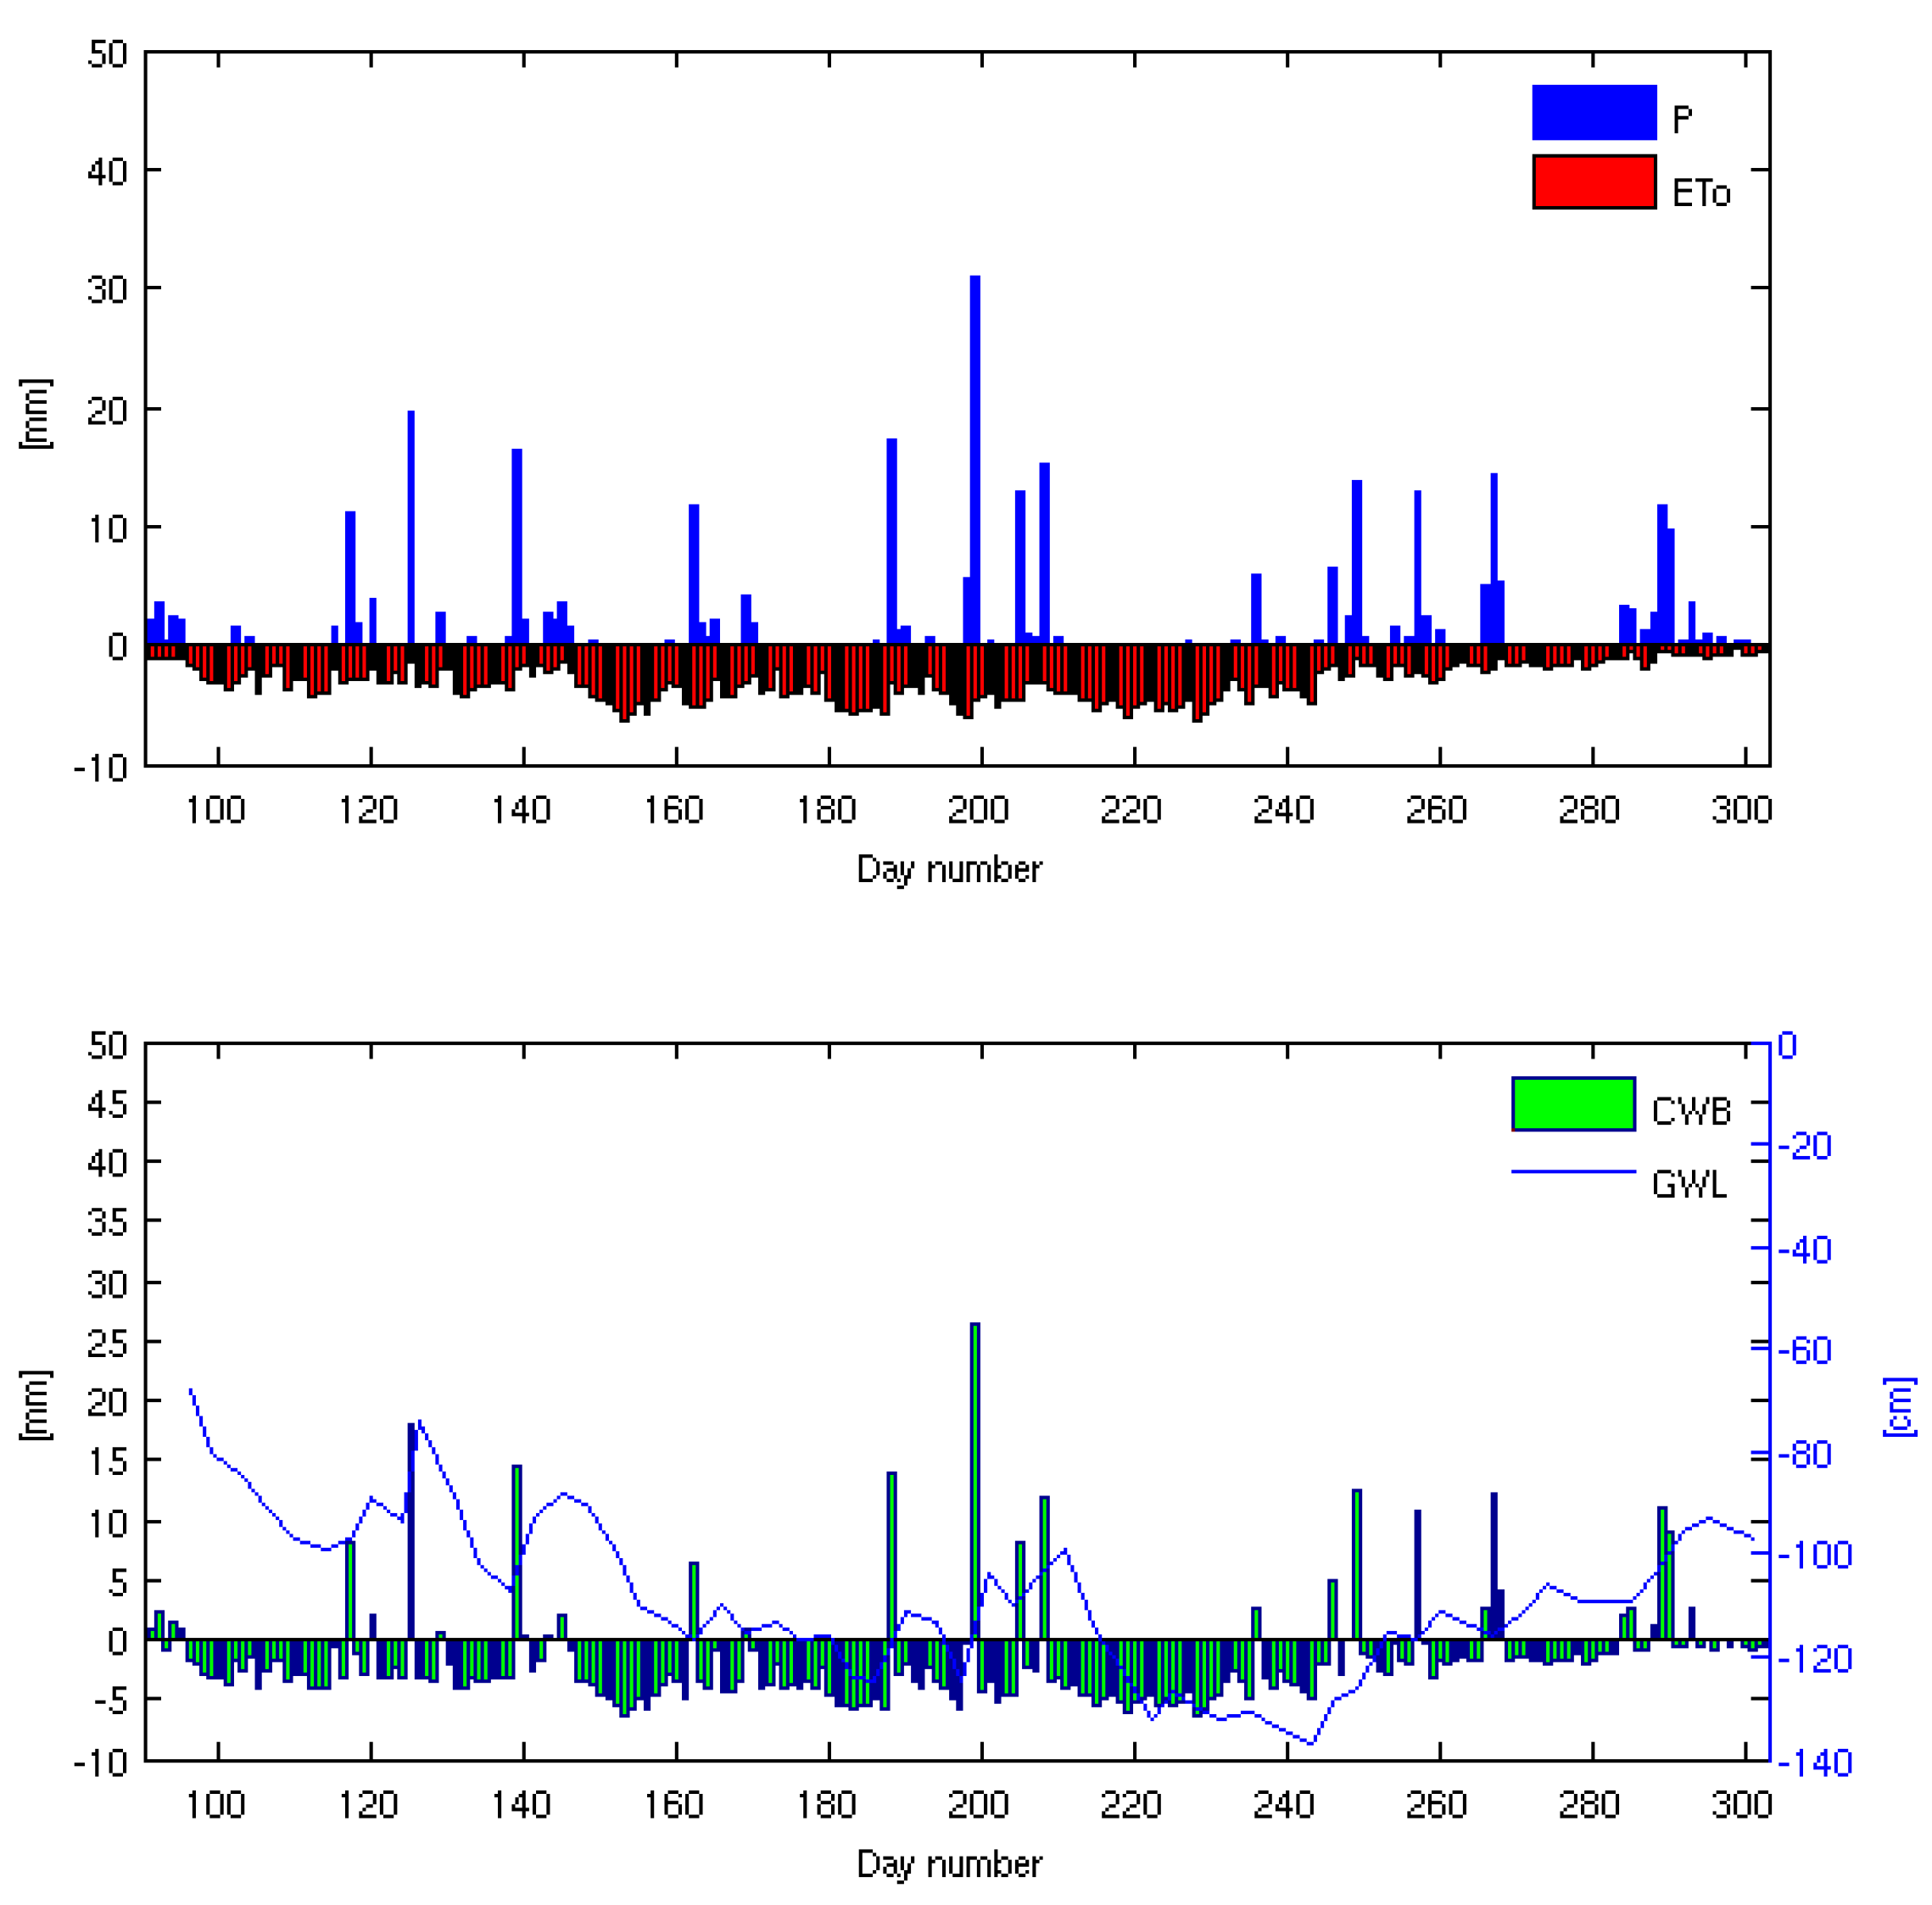
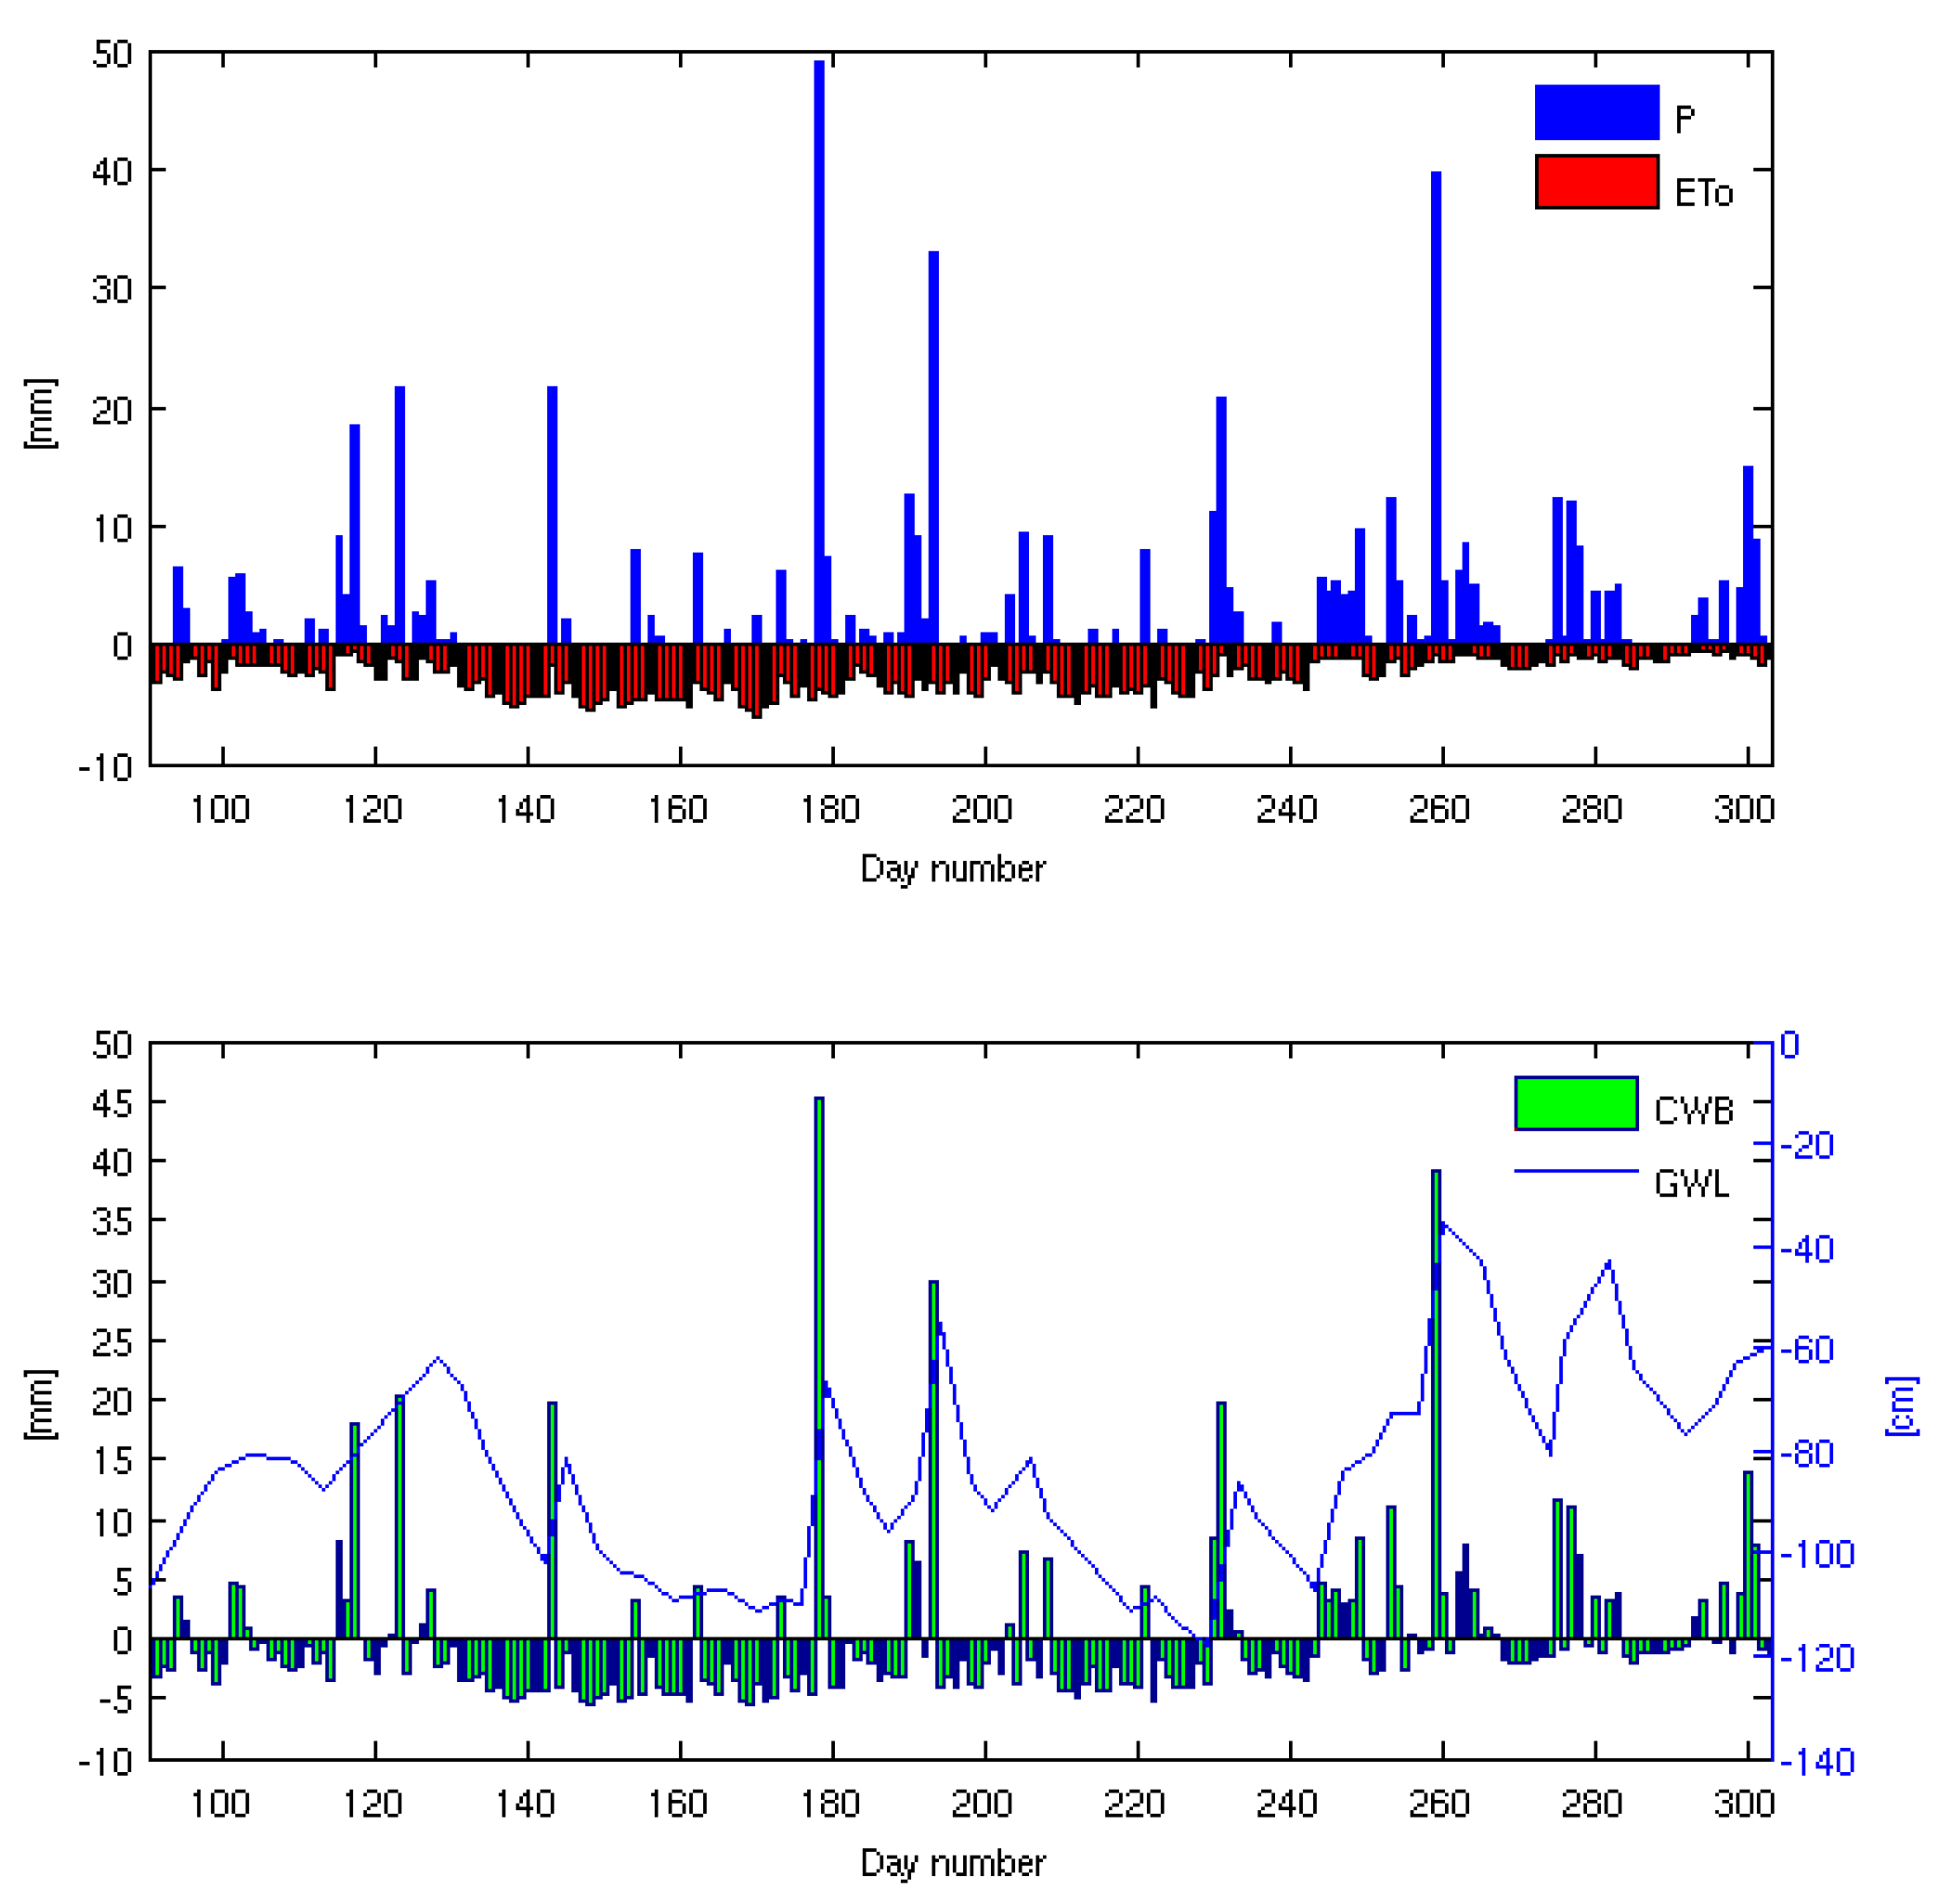
In
Figure 4,
Figure 5 and
Figure 6, the water balance elements and ground water tables are presented so as to distinguish the periods prone to drought occurrence. The highest daily precipitation in 2015 occurred on 19 July (200th day of the year) and totalled 31 mm. A no-precipitation period in the vegetation season of that year was observed in the first and third decade in June and August and during the first decade in October. In 2016, the highest daily total of 36 mm was observed on 1 June (152nd day of the year), while dry spells included: the second and the third weeks of July as well as the third week of August and the first week of September (except for the fourth September). October 2016 was characterised by systematic precipitation, reaching a maximum value of 24 mm on the 276th day of that year (3 October). In 2017, the highest daily precipitation of 49 mm was noted for 28 June (179th day) and for 13 July (194th day), equal to 33 mm, and on 17 September (260th day), reaching 40 mm. Apart from the period between 11 and 23 May, and between the turn of May and June, there were no longer any no-precipitation periods (
Figure 6). Summing up, 2015 exhibited six no-precipitation weeks, 2016 showed three of them, while in 2017, two no-precipitation weeks were observed. This proved the previously made statements that 2015 and 2016 were considered to be dry years and 2017 was a wet one, while dry spells should be further used to indicate resultant drought susceptibility against other easily obtainable indices (
Section 4,
Table 3).
The analysed reference evapotranspiration reached the highest daily values in July and August of 2015 (3–5 mm/day), and in October, they were subject to a decrease of 1–2 mm/day. In 2016, generally lower evapotranspiration values were observed, reaching the maximum ones in August (3–4 mm/day). In 2017, however, daily evapotranspiration values were the lowest in comparison to other observation periods (2015–2016).
Taking into account the above meteorological data, the daily climatic water balance was quantified. It’ lowest values in 2015 were noted from the 147th to the 187th and from the 209th to the 248th day of the year, totalling −4 mm along with the lowest ground water table position, amounting from 110 to 125 cm below ground (
Figure 4,
Table 3).
In the case of 2016, the period from approximately the 152th to the 210th day was characterized by the lowest climatic water balance values (−3.6 mm) corresponding with the lowest ground water table depth, equal to 108 cm. In a later part of the observation period, the climatic water balance reached slightly higher values, approaching positive ones around the 275th day (last days of October,
Figure 5). However, in 2017, the lowest climatic water balance values were approximately equal to −3.5 mm from the 144th to the 177 day, when the ground water table reached about 104 cm in depth (
Figure 6). In the case of the dry years of 2015–2016, insignificant precipitation totals caused no rapid ground water table rise (
Figure 4 and
Figure 5), contrary to the average year 2017 that involved a more rapid water table rise due to occurring precipitation (
Figure 6).
3.4. Temporal Distribution of Soil Moisture
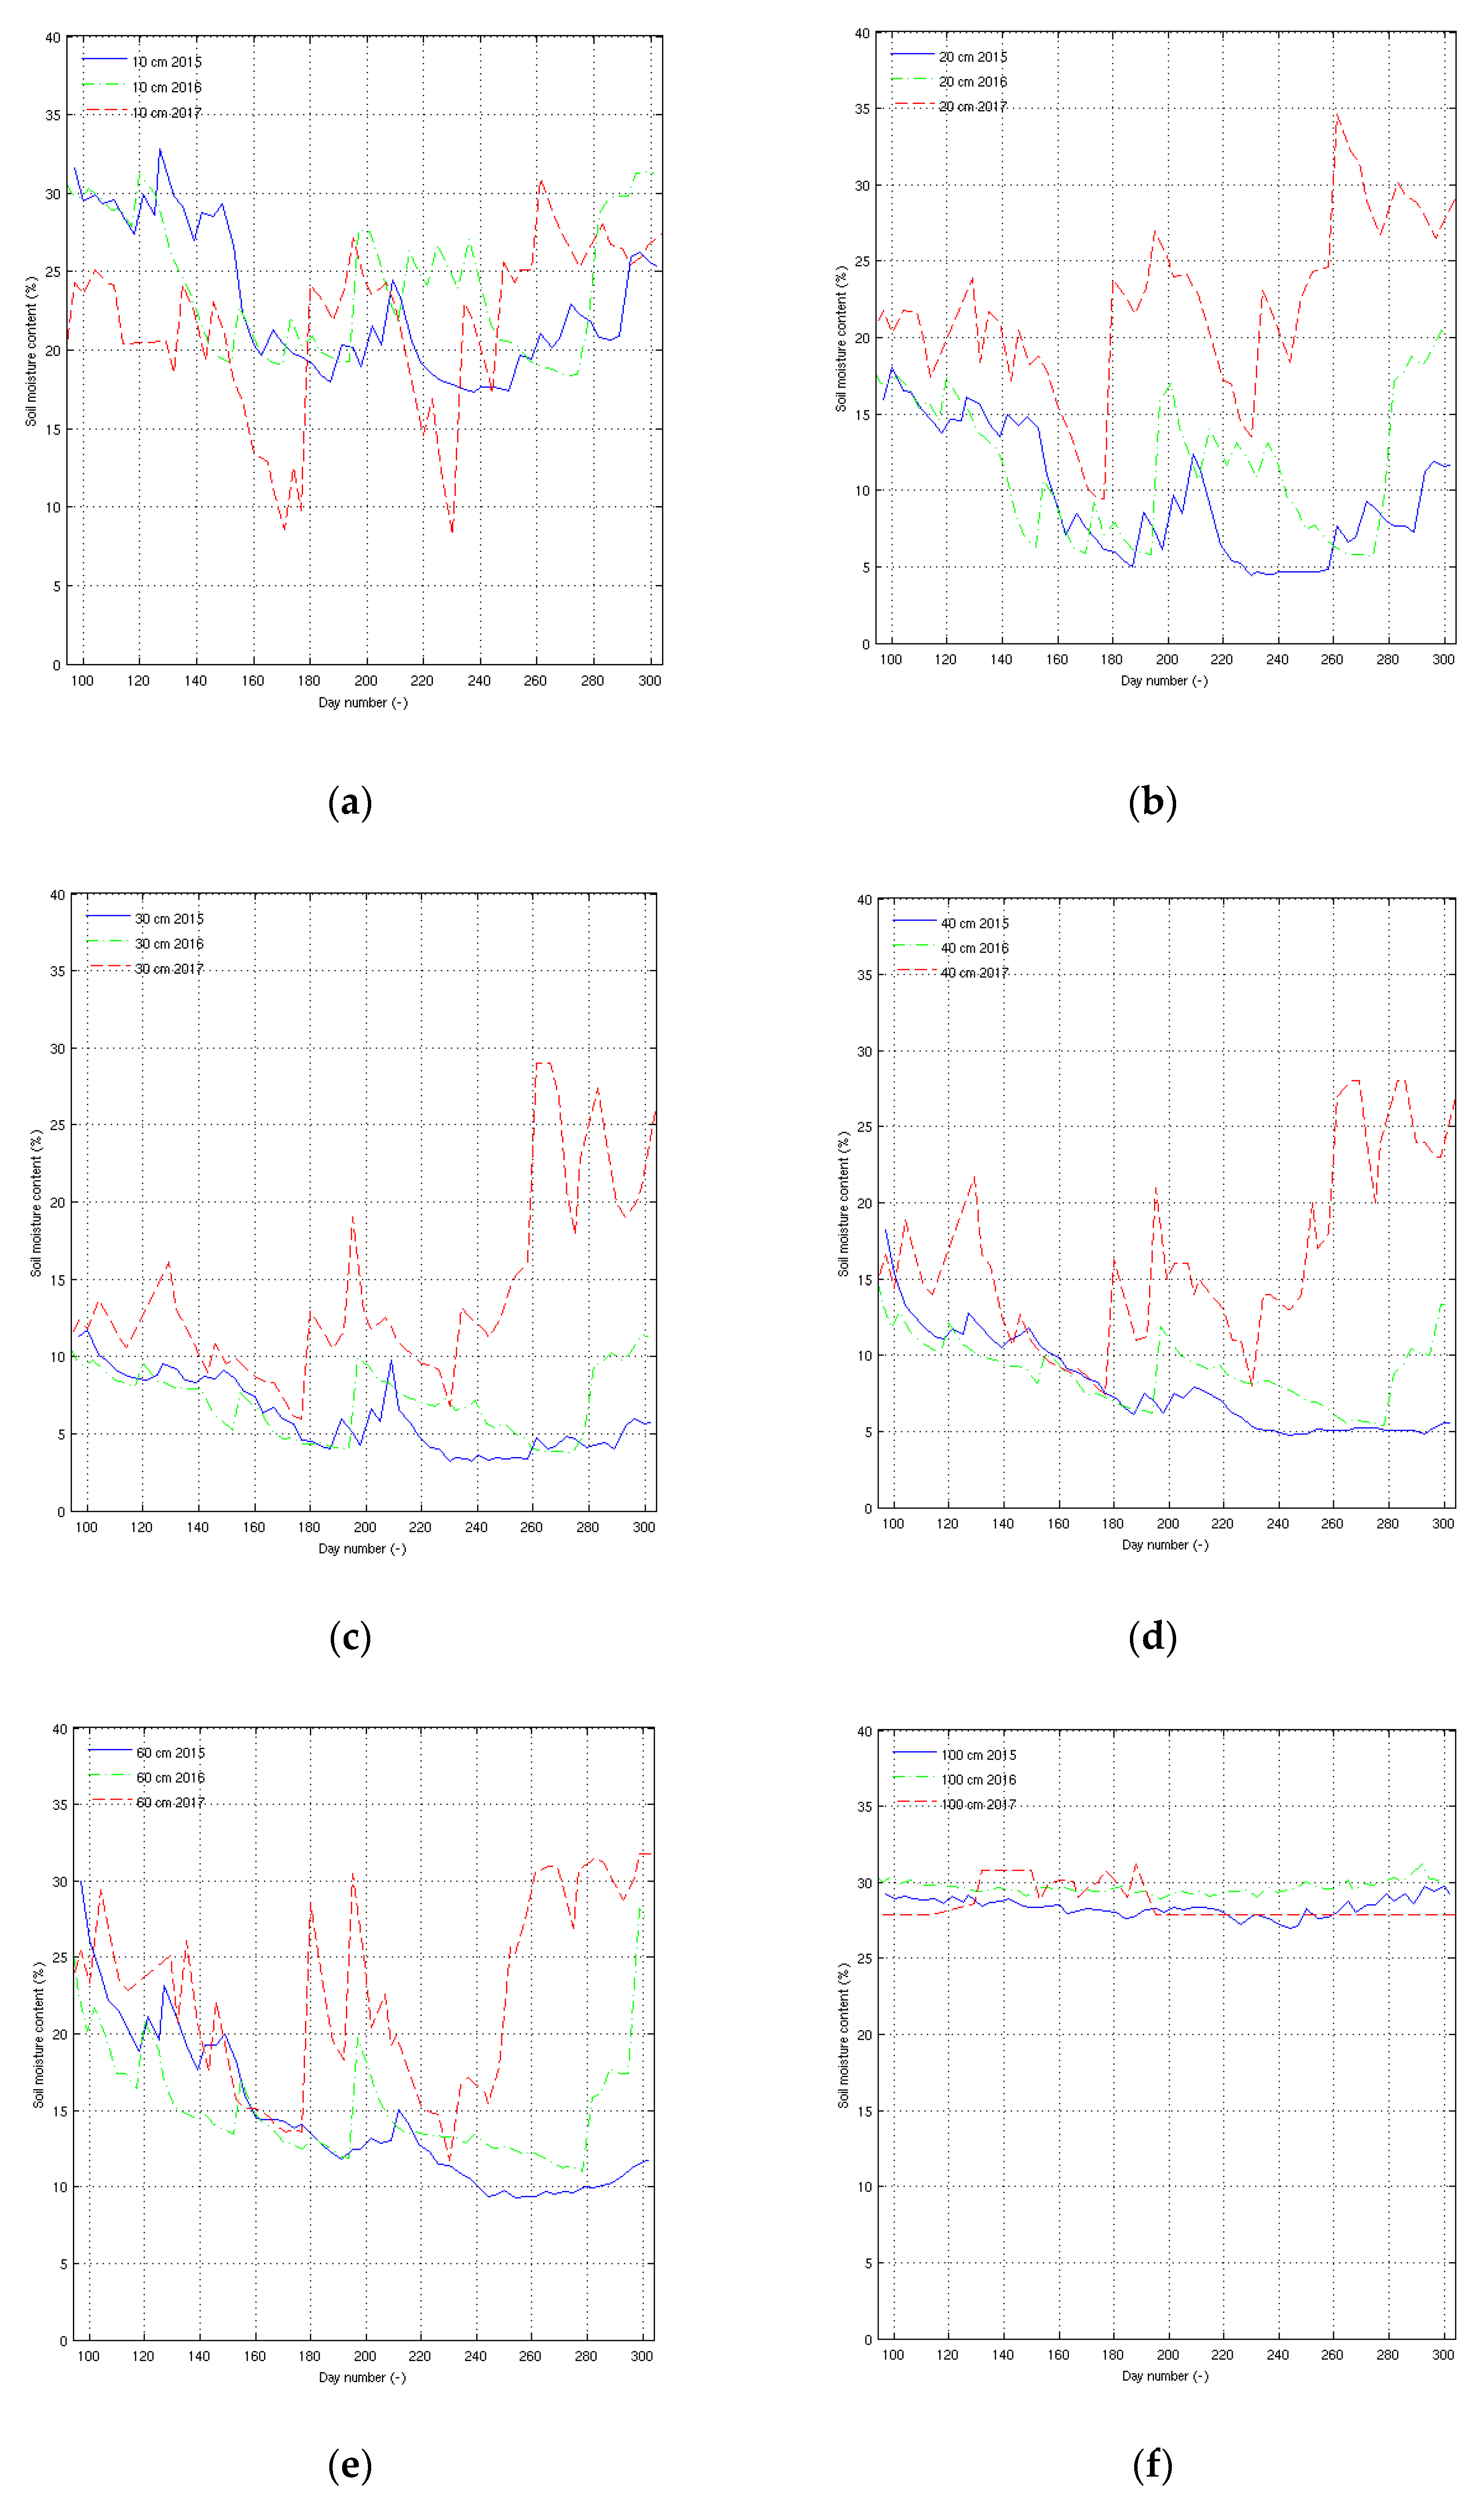
In the next stage of the analyses, the temporal courses of soil moisture were evaluated (
Figure 7a–f). Throughout the observation period of 2015–2016, at a depth of 10 cm, the soil moisture content values reached a similar level. At the beginning of that period, from the 90th day (1 April) to about the 150th day (30 May), the soil moisture gradually decreased from 32% to around 10%, and afterward remained at that level for 30 days (between the 150th and 180th day). Then, owing to the occurrence of precipitation, the soil moisture content values increased during both measurement periods, that is, for 2015 and 2016.
The soil water content at consecutive depths for the years 2015 and 2016 exhibited a comparable course. The beginning of the observation period (e.g., spring season) showed a relatively high moisture level, which gradually decreased until the approximately the 190th day. On account of the subsequent rains (the period from the 210th to the 220th day), slightly higher moisture values were obtained in 2016, in comparison to 2015. In the final phase of both analysed years (October 2015 and 2016), again, a more intense precipitation brought about an increase in the moisture content values, which reached a similar level to the one observed at the beginning of the observation period.
In the case of the vegetation season of 2017, although there were higher precipitation totals (
Figure 6), soil moisture content values at 10 cm depth became clearly lower for the first 3 months than in the previous years (2015–2016). The reason for this situation is the shift in the land-use type from pasture (the years 2015 and 2016) to grassland in 2017.
Moreover, for the first 3 months of the observations in 2017, the soil moisture content at lower depths (20, 30, 40 and 60 cm) reached slightly higher values in reference to the same period of 2015 and 2016. Then, as a result of mainly increased precipitation (from around the 180th day), there occurred a considerable increase in moisture content at those depths as compared to previous years.
Summing up, lower parts of the root zone (20–30 cm) were not influenced by land-use form shifts, as was noted for the depth of 10 cm.
3.5. Relationships between Soil Moisture and Ground Water Table
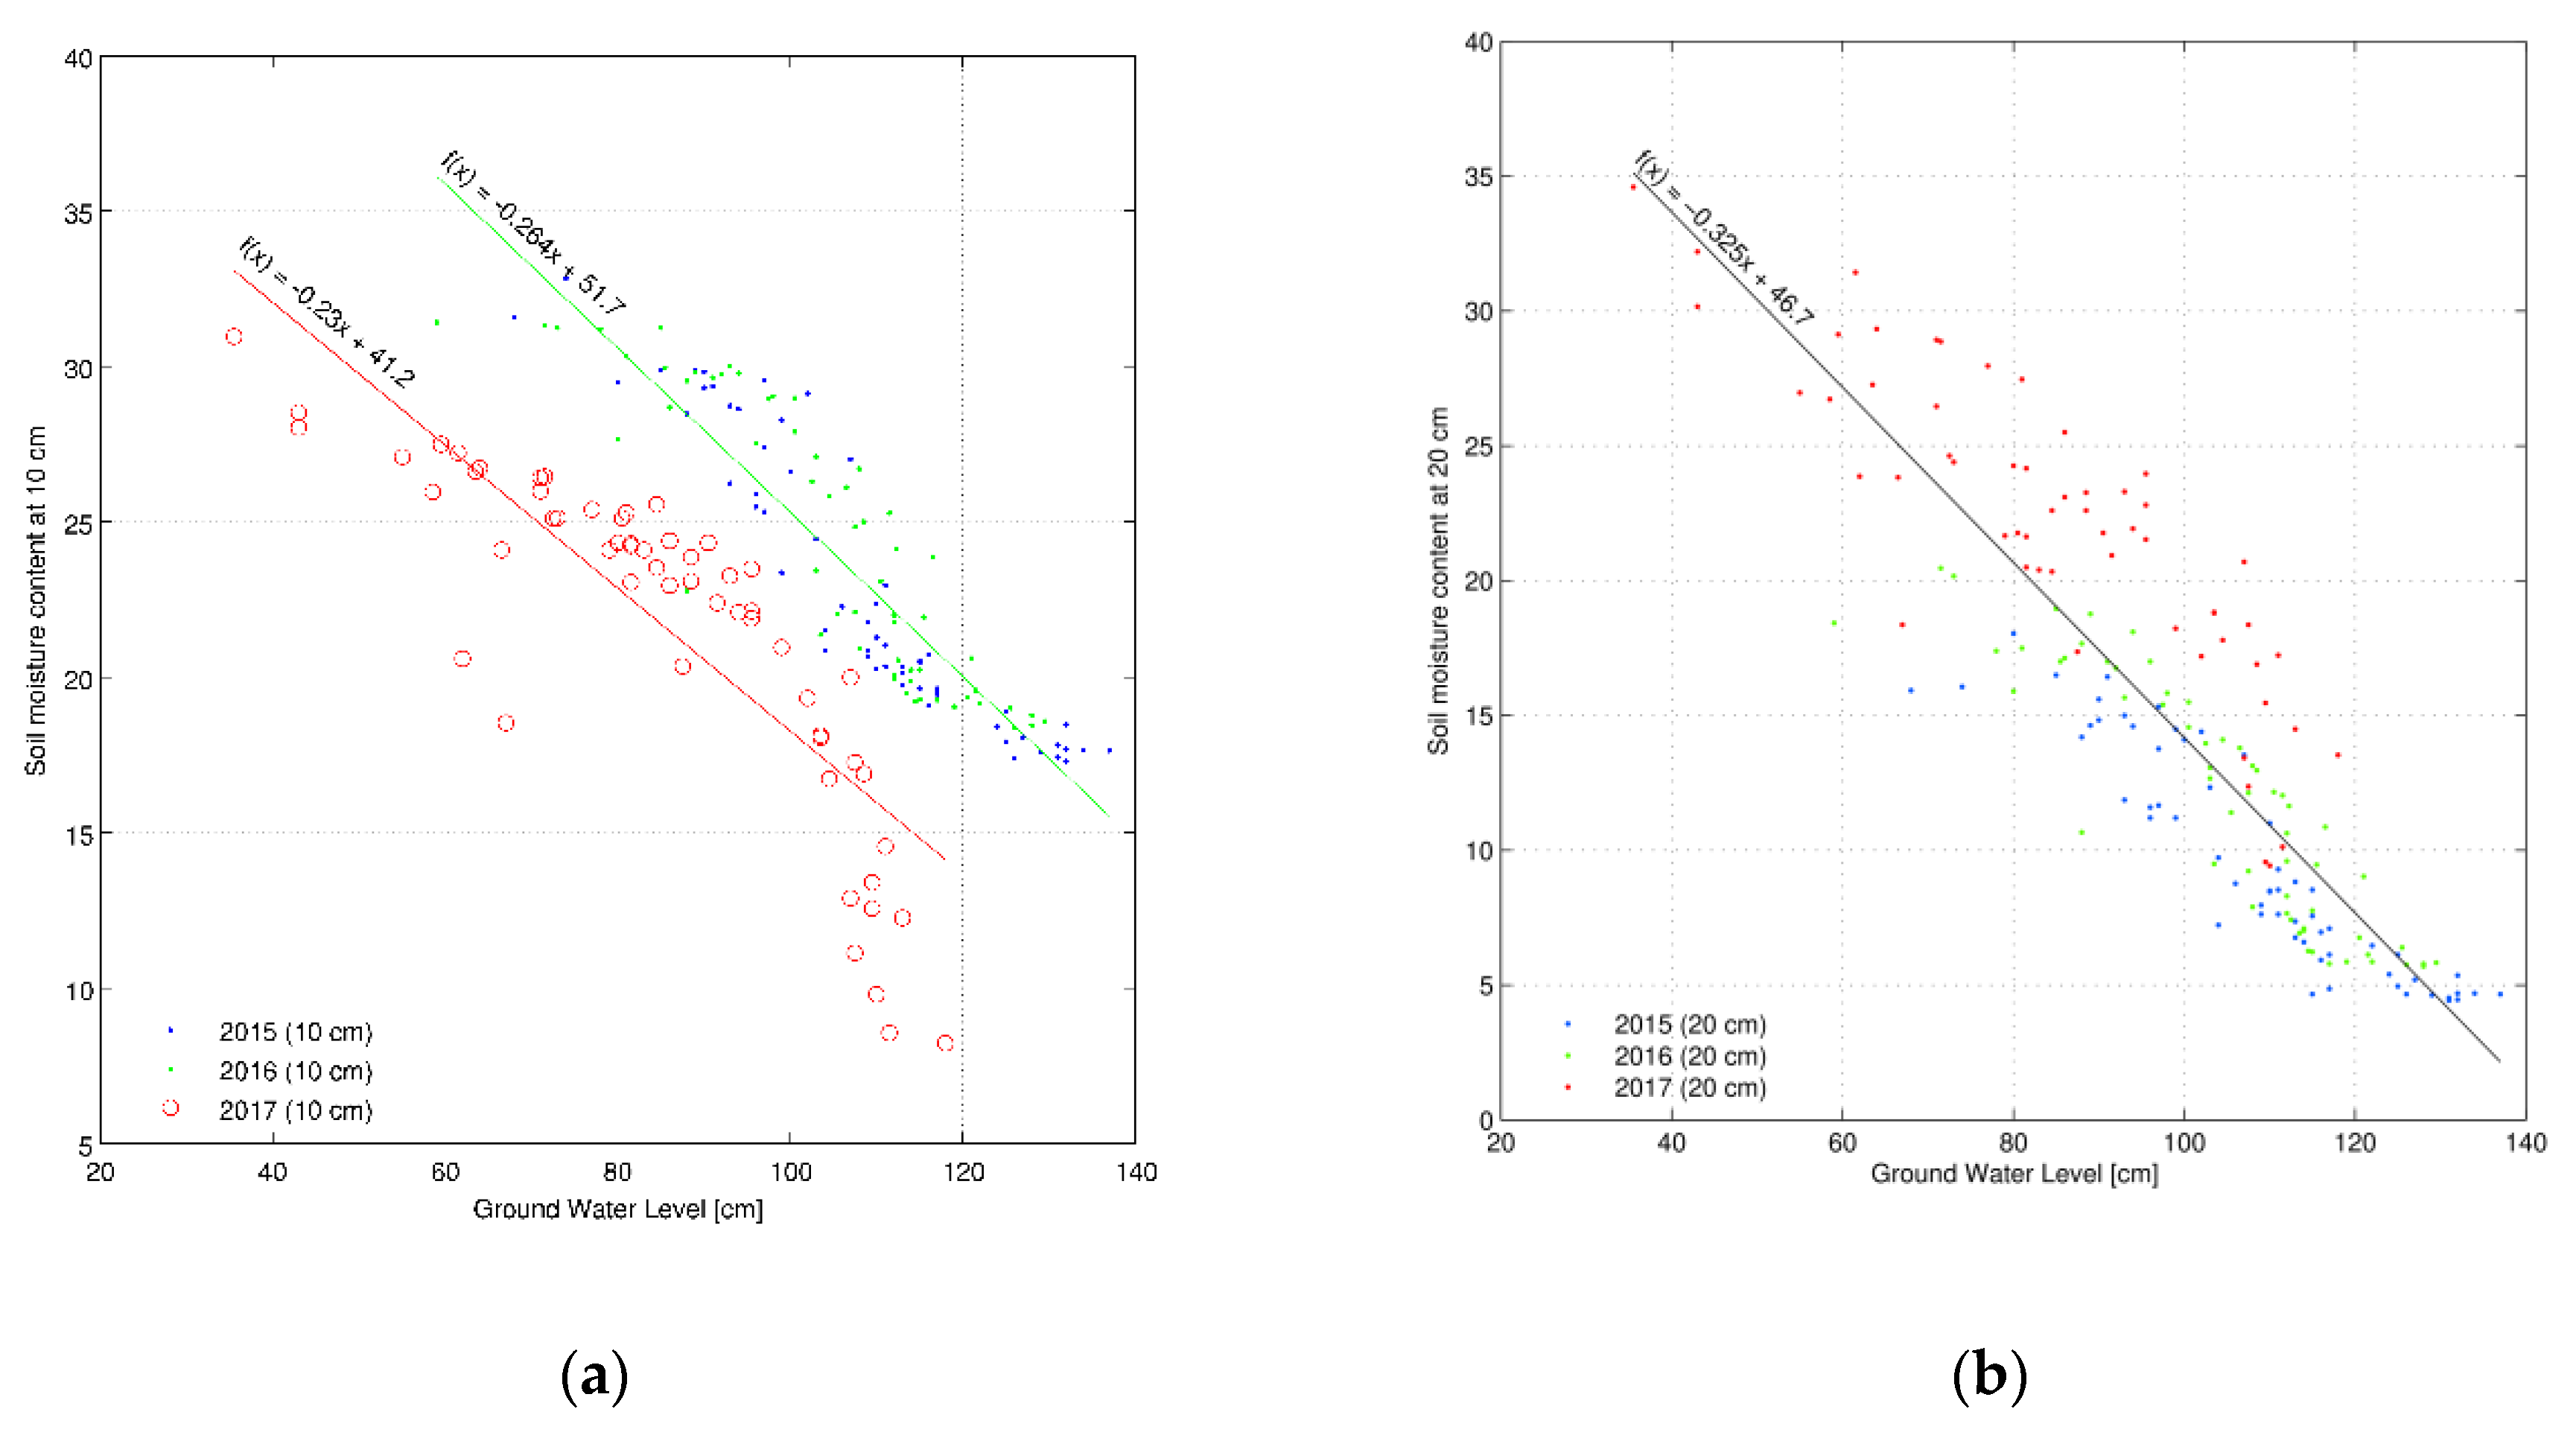
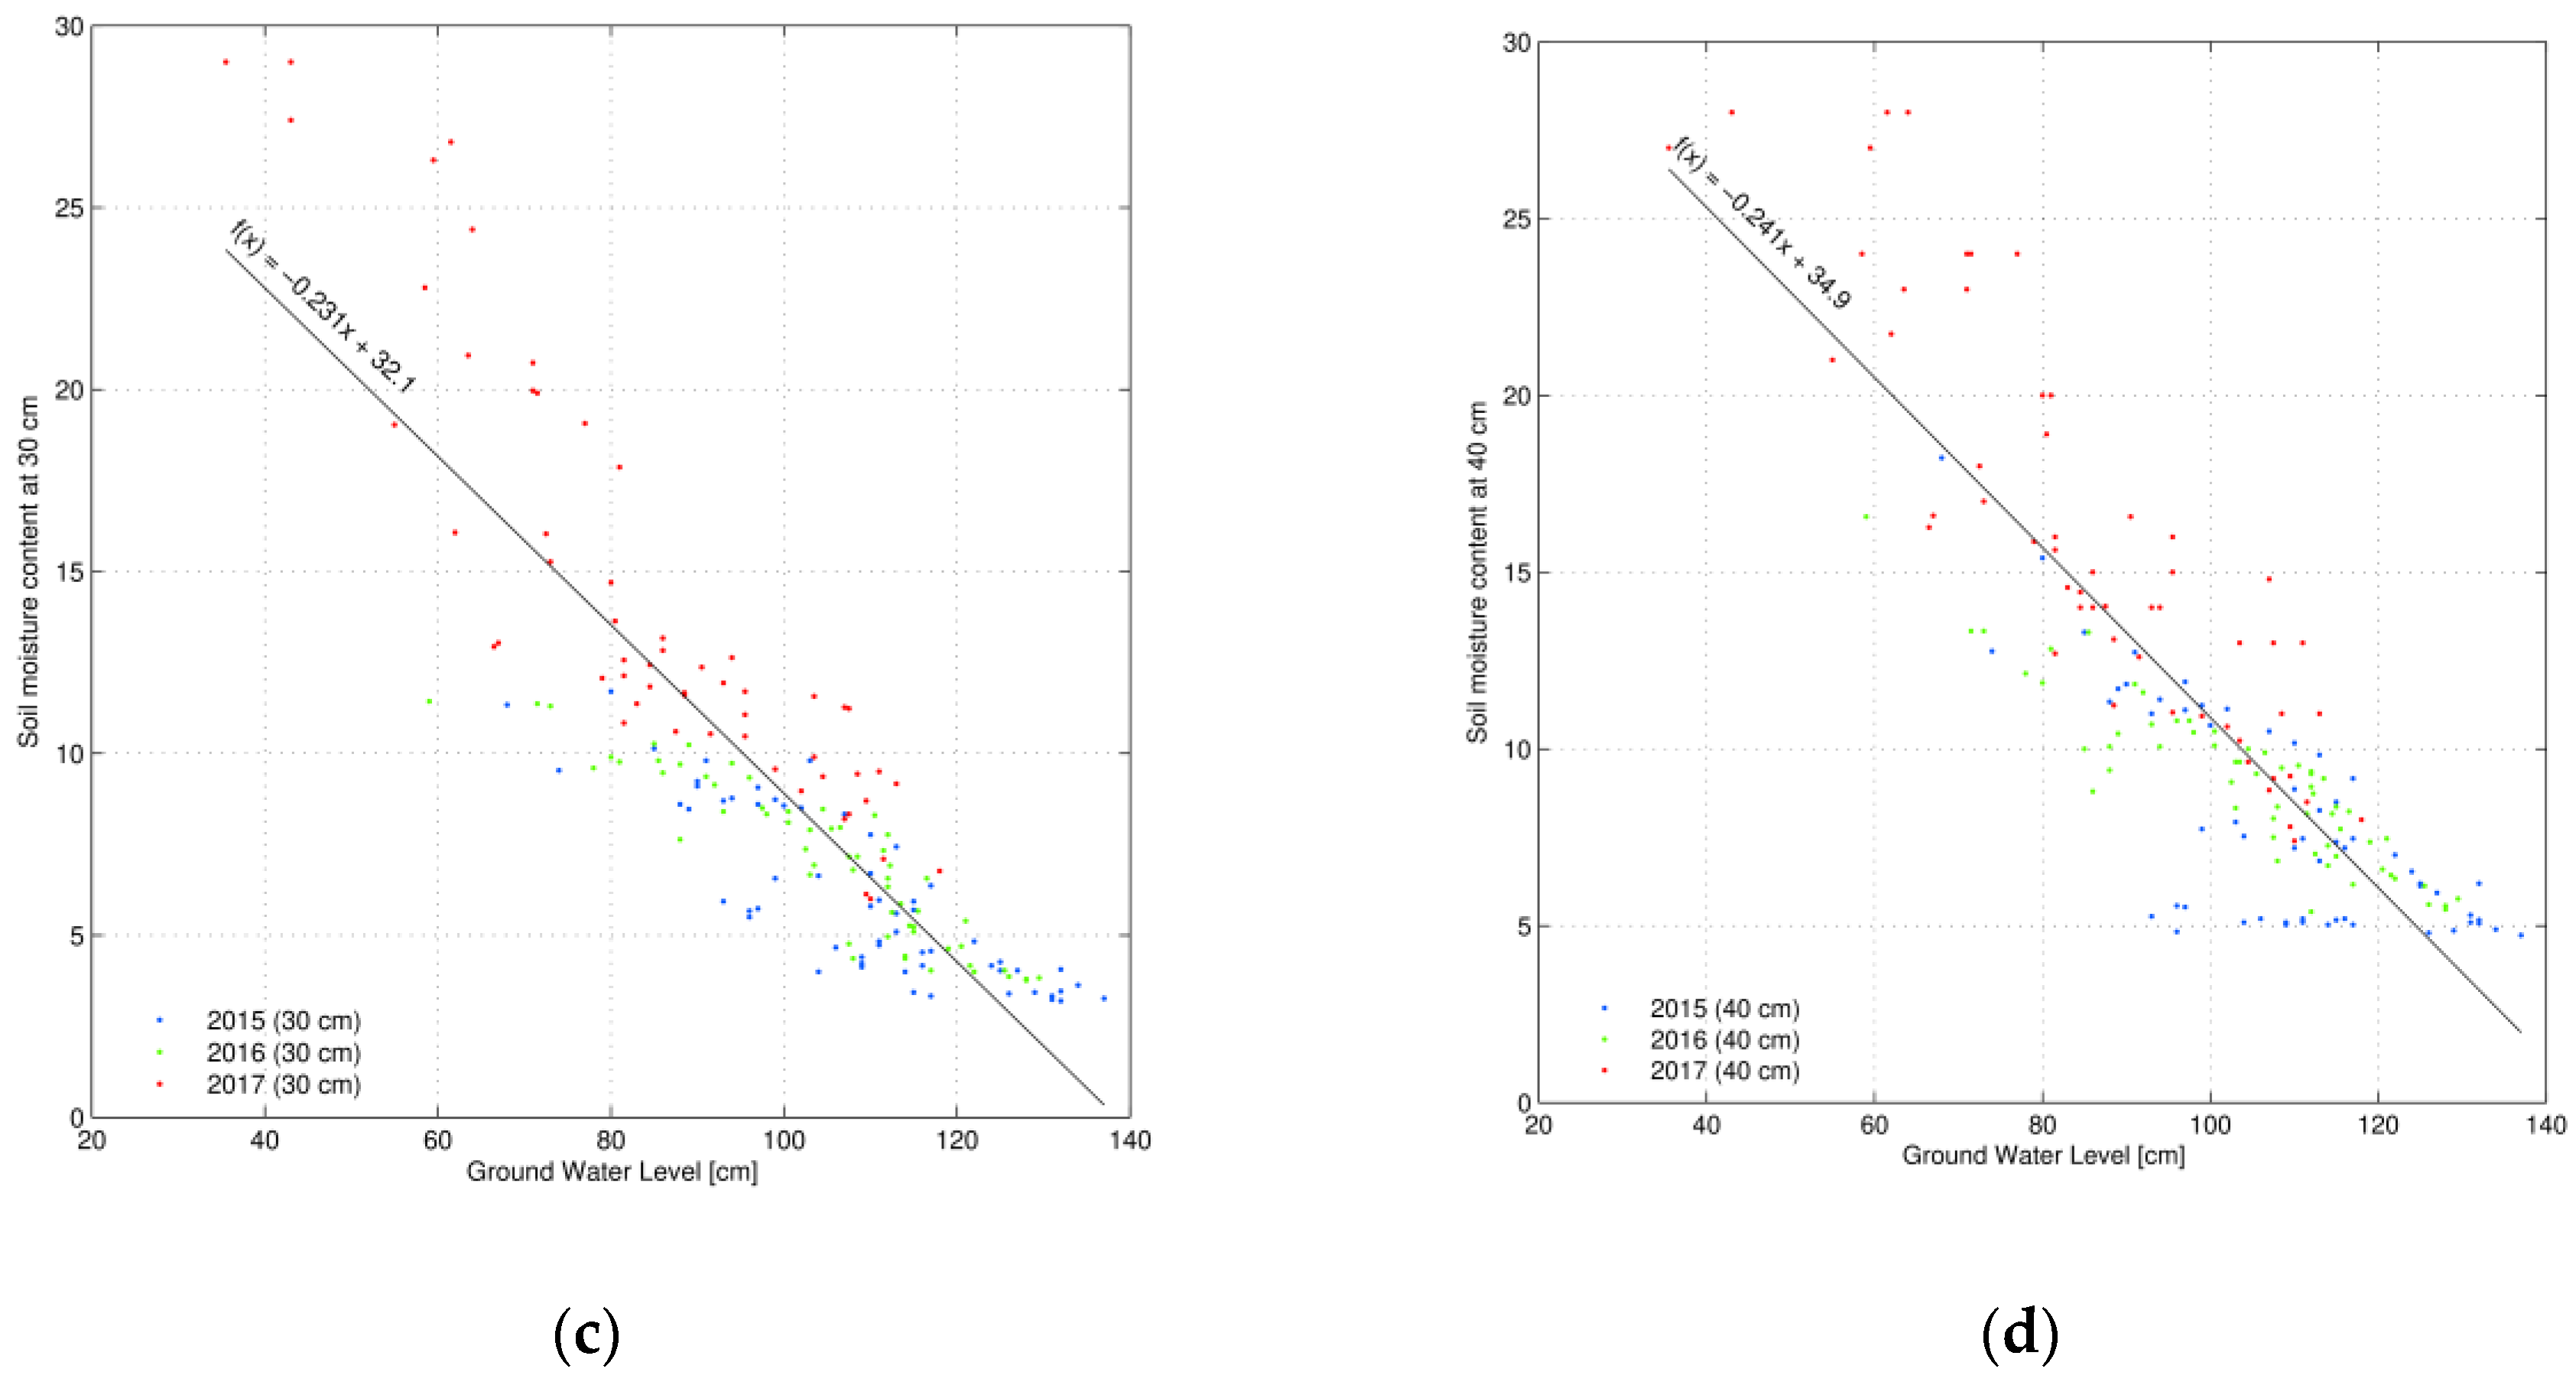
The elaborated soil moisture content measurements at consecutive depths (10, 20, 30 and 40 cm) along with the ground water table observations facilitated in establishing relationships between those parameters (
Figure 8a–d). Taking into account the relationship established for the depth of 10 cm (
Figure 8a) for the years 2015–2016, the range of moisture content and ground water table changes was nearly identical. In the case of 2017, considerably higher precipitation (
Table 2) but similar ground water table depths generated substantially lower (by around 10%) moisture contents at that depth as compared to previous years. In the case of other analysed depths (20, 30 and 40 cm,
Figure 8b–d), the measurement points of 2015 and 2016 were close to one another. The data in 2017 had slightly higher values (on account of the diverse meteorological conditions); nonetheless, they fit in the previous linear trend of established relationships. The advantage of the obtained linear equations is the feasibility to describe average and wet soil water conditions.
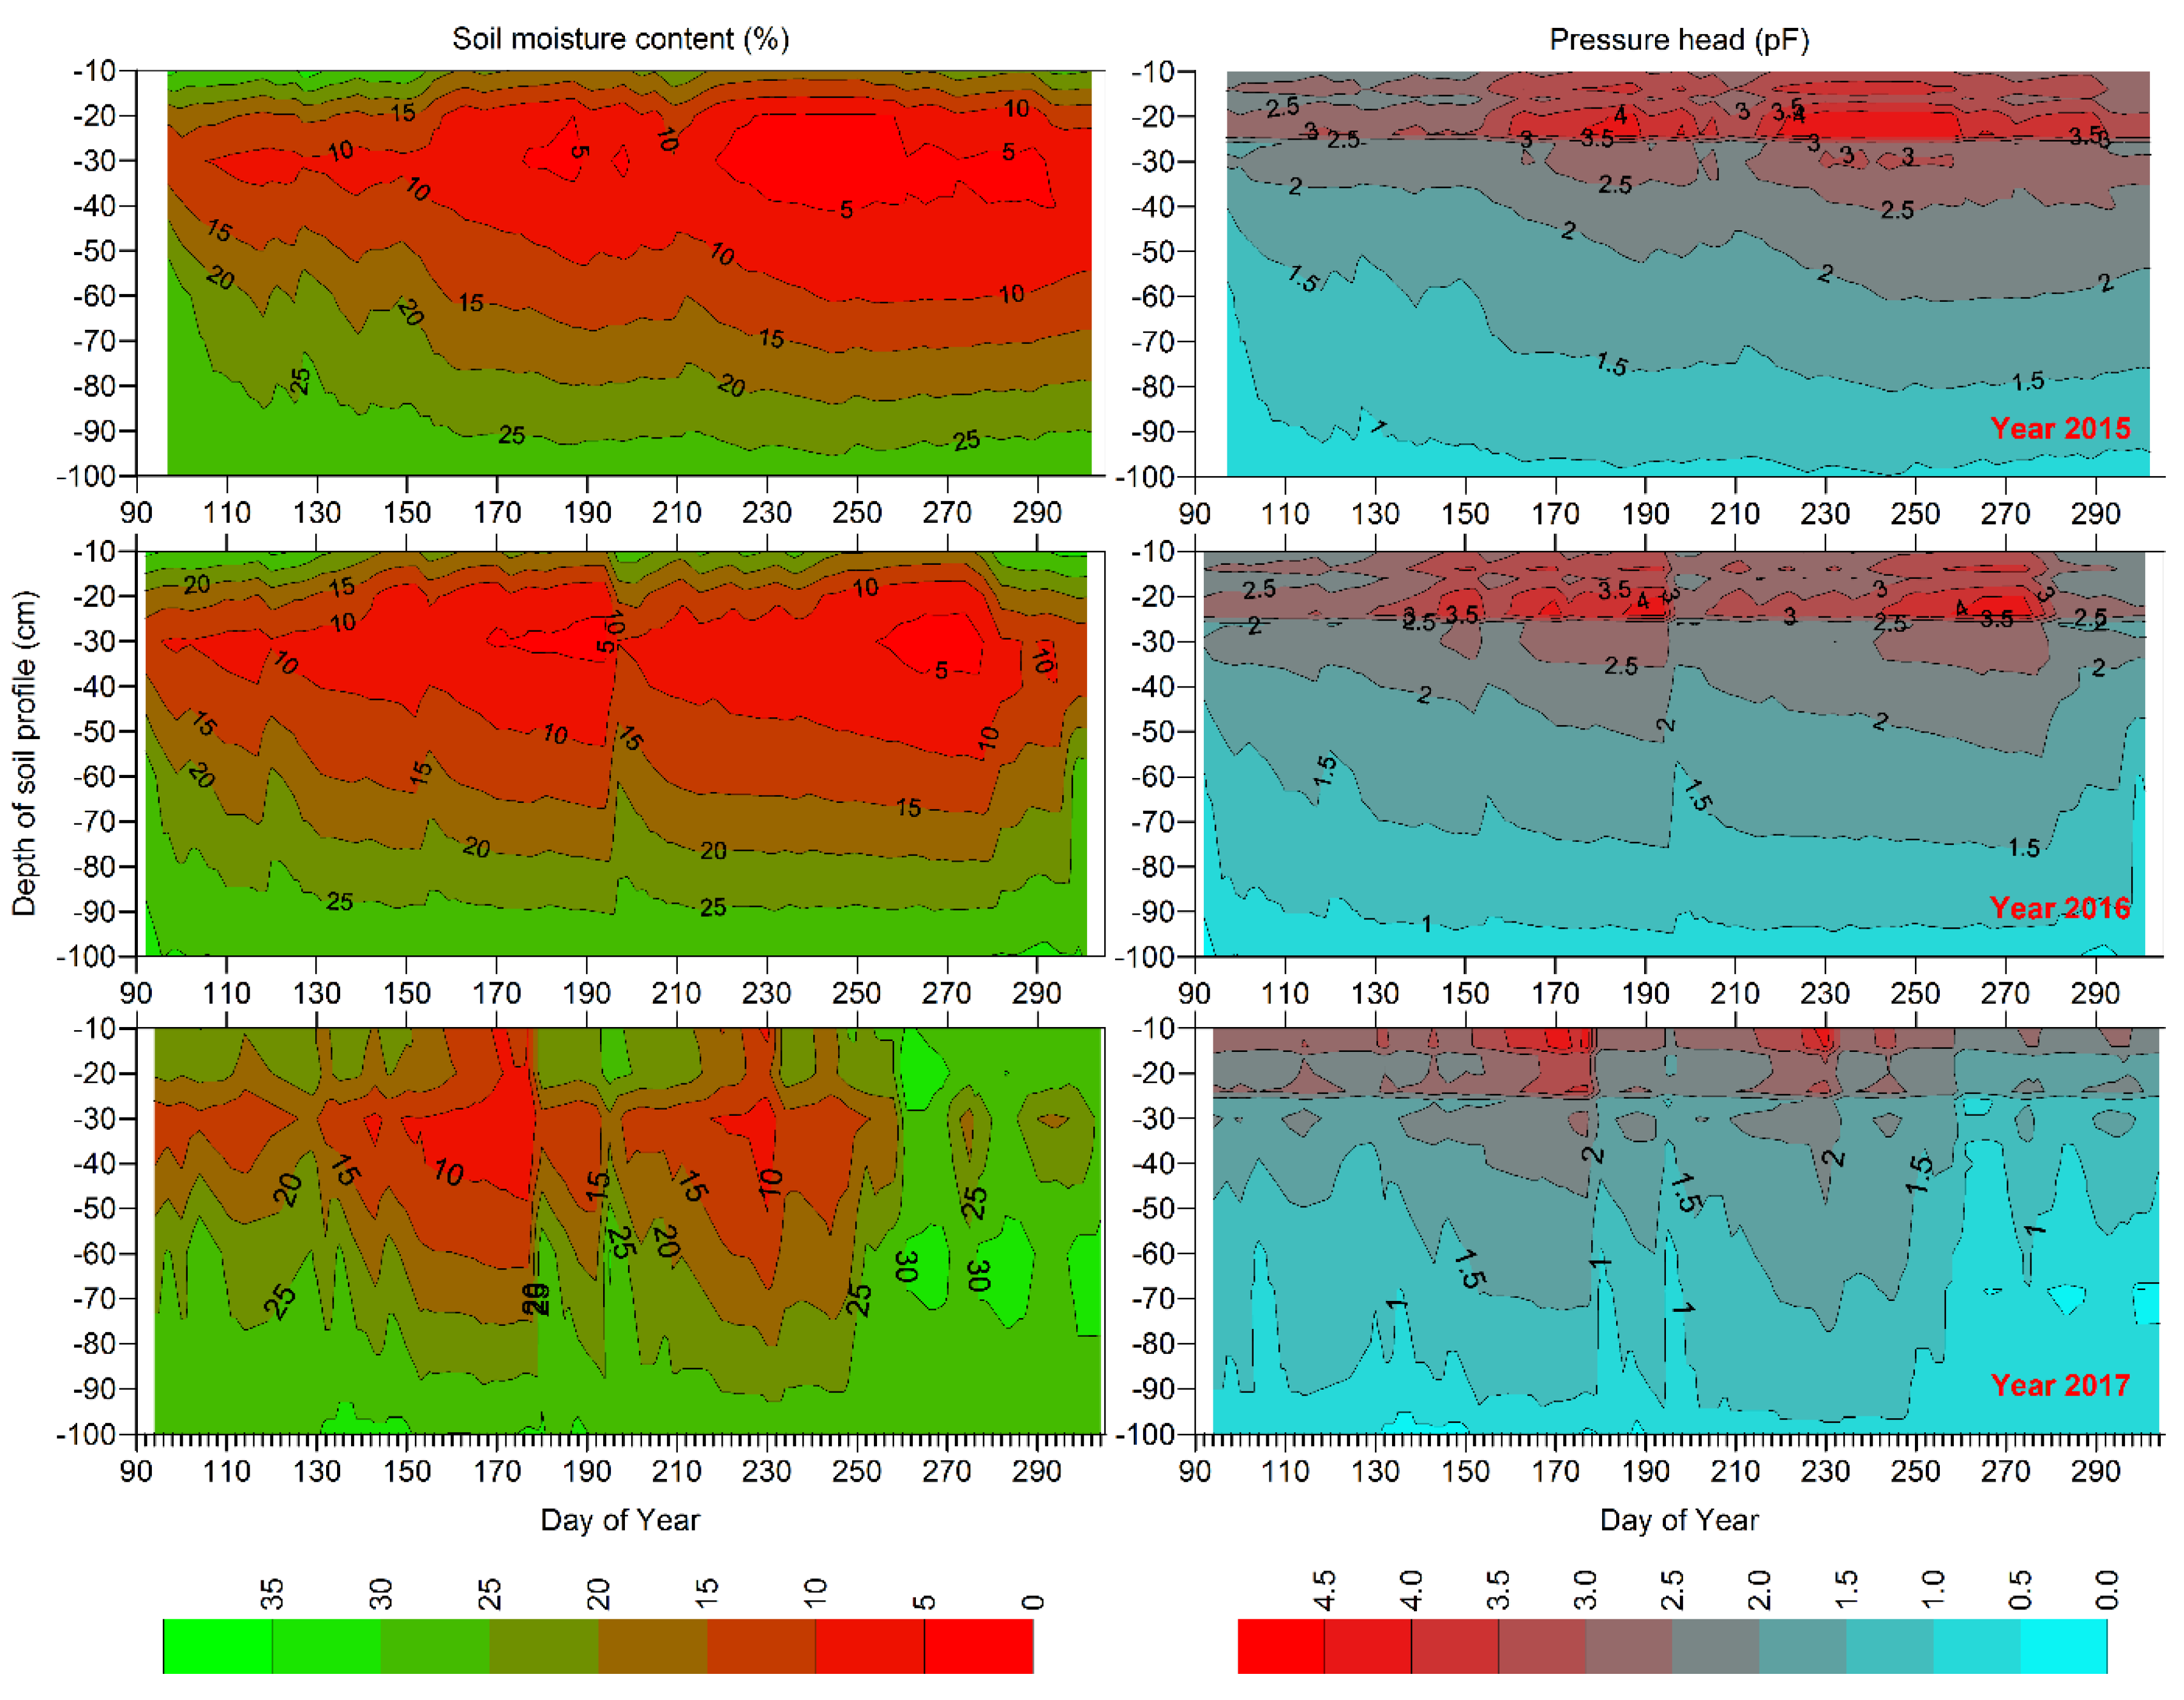
3.6. Soil Matric Potential and Moisture Variability
Soil water content distribution for the vegetation seasons of 2015 and 2016 clearly indicates the zone of the lowered content values, ranging from 5% to about 15% in the layers from 15 to 45 cm below ground. However, pF values ranging from 3.5 to 4.0 were noted for 2015 and 2016 in the layers from 10 to 25 cm, which seems to indicate the beginning of a drought, but involves different layers than indicated by soil water content. In 2015, the increased potential values occurred from the 160th day onward while in 2016, from the 130th day, and they were related with soil moisture content ranging from about 10% to 15% in the layers from 15 to 45 cm in that year. In 2017, due to increased precipitation (wet year), the layer from 20 to 50 cm only periodically exhibited a soil water content lowered to 10–15%. The pF values of the layer 10–25 cm (in comparison to the previous years) were considerably lower (pF range from 2.5 to 3.0 instead of from 3.5 to 4.0). This seems to prove that the available water content persisted, contrary to 2015 and 2016, which exhibited restricted water availability to plants.
4. Discussion and Summary
Light soil, subject to drought in Northern Europe, was the case study of the paper in order to present the relevance of simple, easily obtainable drought indices. At first, dry spells were distinguished, which were associated with the lowest observed values of the climatic water balance and groundwater table. In addition, the relationships of the soil moisture content with the groundwater table depth seem to be variable with regard to the land-use type and climatic conditions, which should also be taken into account for dryness forecast [
27]. The temporal distributions of the measured soil water content indicate considerable fluctuations, even down to a depth of about 50 cm, which initially suggests the drought range in the Stagnic Folic Gleysol. Furthermore, having the intention to verify the usefulness of moisture distributions, as they may not completely reflect a real pattern of water availability to plants, attention was paid to soil water potential. The pF values seem to prove that the most temporarily adverse conditions occurred in 2015 and 2016 in the 10–25 cm layer. In the case of 2017, from the 150th to the 170th day, the highest potential values (pF > 4.2) occurred at the depth of 10–15 cm, while the lowest moisture content values (below 10%) occurred at approximately the 30–50 cm depth. The above considerations make evident that the analyses of soil water conditions only in respect of drought range should not merely be based on soil moisture content at subsequent depths, but rather on potential values [
28,
29].
In the topsoil layer, even if characterised by a large full capacity value (
Table 1) throughout most of the vegetation season, the pF values ranged from 3 to 4 or even exceeded 4. Only in the case of 2017 was there considerable precipitation at the beginning of the vegetation period (
Figure 4,
Figure 5 and
Figure 6), caused every consecutive rainfall event to increase the topsoil moisture content and, at that time the days of pF approximately equal to 2 were noted. The above finding also gives evidence to the soil profile sensitivity to rainfall phenomena.
For the particular analysed soil type, Stagnic Folic Gleysols–Arenic, the water balance evolution is conditioned by topsoil properties. Even in the wet year such as 2017, there occurred days of pF values exceeding 4.2. In 2015 and 2016, the influence of the soil drought was visible through pF values in the deeper layers (until 25 cm) as an effect of persisting meteorological conditions. In 2017, due to the higher precipitation totals, the soil water potential (pF values) in the root zone was considerably lower in comparison to 2015–2016. Only the layer from 10–15 cm exhibited pF values higher than 4.2, from the 150th to the 170th day of that year.
Soil moisture content values may not indicate the real extent of drought in such soil profiles, since the subsequent soil layers are different in respect to the physio-chemical properties; in particular, pertaining to full capacity (
Table 1).
For the needs of this summary, all the analysed indices are given in
Table 3 as an attempt to distinguish periods of a weak water regime and susceptibility to drought.
For the dry years of: 2015 and 2016, coherence was found between dry spells, and climatic water balance showed the lowest value, as well as ground water table with a maximum decline and soil root zone moisture content (0–30 cm layers). Due to the physical properties of the consecutive layers (mainly organic matter content and porosity, as shown in
Table 1), the highest values of the soil water content observed in the dry spells at the depths of 10 and 20 cm, corresponded with the highest pF values at those depths, particularly in 2015. Although there were lower moisture content values at 30 cm, that layer exhibited the lowest potential (pF) values, proving the drought range for the analysed light soil to mainly encompass 10 and 20 cm depths. Then, for longer dry spells, the climatic water balance value (CBW = −ETo) could be used to approach water regime elements (i.e., ground water table depth, soil moisture content and potential in the root zone of meadow vegetation).
In a general sense, however, drought monitoring only through external indices (based on meteorological parameters) may not be complete, for they do not precisely define the nature of this phenomenon. Hence, a systematic monitoring or ability to model such phenomena is required, but one that is strictly based on precise soil data (especially retention properties of subsequent layers).
Similar research conducted by Csáki et al. (2020) [
29] showed the possible impacts of climate change on water resources for agricultural and water management in west Hungary (Zala River Basin). The temperature increase, in particular, and the evapotranspiration in consequence, deepened the water deficit (CWB) considerably for the given crop types [
29,
30].
A detailed monitoring, depicted in this paper, enables not only for precise identification of spatio-temporal drought development, but also facilitates its detailed modelling which sufficiently recognises individual soil layers and their properties (e.g., topsoil influence on water balance due to high organic matter content). Then, more complex models may be adopted for reliable moisture content forecasting, also stressing the need to more deeply elaborate the root zone water balance in such studies or give the basis for proper empirical models in this respect. Finally, the results of the water balance elements prove that with recharge only by its own water, it is not possible to mitigate water shortages. Such actions, as, irrigation, are needed to provide future utilization of the analysed soil.
