Abstract
Indoor microbes are readily transmitted among humans in indoor environments. Therefore, this study employed 16S rRNA gene and ITS amplicon profiling to investigate the dust-associated bacterial and fungal communities in six indoor facilities in Busan, South Korea. The collected samples were categorized into two groups: indoor multiple-use facilities (MUFs), including a public bathing facility, business office, and food court; and public transportation facilities (PTFs), including two subway stations and an airport. The bacterial diversity in the MUF samples was significantly higher than the fungal diversity (p < 0.05). However, no significant differences between bacterial and fungal diversity were observed in PTF samples (p > 0.05). Moreover, the abundances of certain microbial taxa varied, suggesting that the microbial community structure was primarily determined by the source environment. Gram-positive bacterial genera, such as Corynebacterium, Kocuria, and Staphylococcus—all of which originated in the natural environment—were relatively predominant in the MUF samples; the Aspergillus, Penicillium, and Malassezia genera, which are human commensal taxa, were relatively more predominant in the PTF samples. These results suggest that different microbial communities can be formed depending on the purpose of the indoor facility type, level of passenger traffic, and surrounding environment. The findings of this study may help researchers understand indoor microbial communities in multi-use and transportation facilities.
1. Introduction
Airborne microorganisms are microorganisms (i.e., bacteria, fungi, and viruses) that become attached to fine dust or water vapor in the air, resulting in bioaerosols with a 0.02–100 μm particle size range in both indoor and outdoor environments [1,2]. Due to urbanization and industrialization, approximately 90% of people spend most of their time in indoor spaces, and unlike in outdoor environments, they frequently come into close contact with others in enclosed spaces. Furthermore, people tend to travel on public transportation (trains, buses, subway, etc.) for an average of 1.2 h a day during rush hours, when the concentration of fine dust and bioaerosols is two to five times higher than at other times [3,4]. Moreover, the concentration of fine dust in indoor spaces (including public transportation) is more than 2.3 times higher than in the outside atmosphere [5]. Recent studies have demonstrated that bioaerosols are a major cause of respiratory and cardiovascular diseases, and the concentrations of fine dust and harmful microorganisms are highly correlated [6,7,8,9].
Understanding the ecological roles and adverse impacts of indoor microbes is essential for managing indoor air quality in multi-use and transportation facilities [1,10]. However, indoor and transportation microbiomes are still a challenge to understand compared with physical and chemical information on the indoor environment [2,11]. In general, public transportation systems are the means by which millions of passengers and goods are transported every day, and commuters and passengers share the same air and surfaces [12,13]. Although there are some differences across cities, public transportation generally provides an ideal environment for the transmission of microorganisms, while functioning as extensive reservoirs of bacteria [11,14]. Bathing facilities are indoor environments that are vulnerable to moisture, can carry pollution, and require ventilation to remove airborne microbes [15,16]. Restaurants are facilities in which the air quality must be prioritized, and therefore, appropriate ventilation systems must be installed and proper hygiene measures must be followed to avoid food poisoning [17,18,19]. Office workers spend, on average, more than 90% of their time indoors per day, and they are exposed to high levels of toxic substances [3,14,20].
Since suspended microbial particles change fluidly and rapidly depending on the indoor environment, it is difficult to accurately identify the microbial community [21,22]. The dust accumulated on indoor surfaces is a rich mixture of inorganic and organic matter, including microbes [23], and surface microbial communities may be formed by the precipitation of airborne microbes [12,24]. Deposited dust can be resuspended to form airborne microbial particles, following movement of ventilation systems and humans, so a surface microbial community survey is suggested as one method to determine indoor air quality [13,25].
As indicated by the results of the South Korean Indoor Air Quality Inspection Report (2019) [26], indoor facilities exhibited the highest number of Indoor Environment Act violations (46 cases; 59.7%) due to their high levels of airborne bacteria. Other air contaminants included particulate matter ≤10 µm (PM10; 11 cases), carbon dioxide (CO2; 9 cases), formaldehyde (HCHO) (6 cases), and particulate matter ≤2.5 µm (PM2.5; 5 cases). Moreover, many studies have been conducted in South Korea to identify chemical hazards and/or risks in metropolitan areas, such as subways and trains [27,28,29]. These studies reported that PM and volatile organic compounds (VOCs) contaminations were 2–10 times higher than outdoor air quality parameters [29].
However, the microbial communities of indoor facilities have yet to be characterized. Moreover, because most previous studies have focused on the cell concentration for CFU assays and the size distribution of microbes, knowledge of dominant microbes in indoor multi-use facilities is also lacking [12,30,31]. Previous studies have also suggested that indoor microbial communities can be affected by a combination of factors, such as the transient human population and the purpose of the indoor facility, and environmental factors [12,32,33,34]. Therefore, this study sought to investigate the bacterial and fungal populations in various indoor public facilities in Busan, South Korea.
2. Materials and Methods
2.1. Study Sites and Sampling
Busan is the second most populous city in South Korea, only after the capital city of Seoul, and the Busan subway and airport are widely visited by travelers each day. Sampling was conducted from June to August 2021, and the samples were divided into two groups: multiple-use facilities (MUFs) and public transportation facilities (PTFs). The samples were collected from two subway stations (PTF1 and PTF2), the airport (PTF3), a public bathing facility (MUF1), an urban business office (MUF2), and an urban food court (MUF3) (Table 1). PTF1 is a subway station used by approximately 15,000 passengers per day near the train station [35]. PTF2 is the junction of two subway lines, on which approximately 29,000 passengers travel each day [35]. The airport has a large traffic radius and is a major transport hub with a daily floating population of approximately 400,000 people [36]. MUF1 is a bathing facility where 30–100 daily visitors stay for an hour per visit. Like most bathing facilities, the MUF1 facility relies on natural ventilation without the aid of a ventilation system. MUF2 is a business office with approximately 20 workers commuting to and from work at a fixed time each day in a densely populated office area. MUF3 is a food court located in the city center with a large floating population, and it has no separate kitchen and dining area (Table 1).

Table 1.
Characteristics of the sampling site.
The Isohelix DNA/RNA narrow swab (SK-2S, Isohelix) was soaked with 1 mL of sterile phosphate buffer saline to collect samples of indoor microorganisms twice per site, and then the samples were merged. The samples were collected from a surface area of 100 cm² (10 × 10 cm) at each site [37] for three minutes from the surfaces, which are frequently exposed to human activity. Only the swab heads were separated and placed in new, empty 1.5 mL microtubes, and then they were transported in an icebox to the laboratory. The samples were stored at −80 °C until analyzed. A Temtop LKC-1000S + 2nd generation air quality index monitor was used to measure the indoor temperature and humidity, the HCHO, total volatile organic compounds (TVOCs), and PM2.5 and PM10 concentrations. Air environmental factors were measured at a breathing height of 1.5 m from the ground to avoid the influence of passers-by. Atmospheric factors were measured four times each at 5 min intervals before, during, and after sampling.
2.2. DNA Extraction and Amplicon Sequencing
Prior to DNA extraction, two swabs were cut into 2 mm pieces and placed in the bead tube of the extraction kit with a lysis buffer. The tube was then incubated in water at 65 °C for 10 min [38] using a heat block (IKA Dry Block Heater 2 with DB 1.2). Bead beating of the tube was performed with a BIOPRP-24 and a 24 × 2.0 mL tube rotor (10 cycles of 50 s, six speeds at 30 s intervals). DNA was extracted using the DNeasy PowerSoil Pro Kit (QIAGEN), following the manufactural protocol. The extracted DNA was stored at −80 °C. DNA concentration and quality measurements were performed in the laboratory immediately after the experiment using a Nano-300 UV-vis micro-spectrometer (Allsheng, Hangzhou, China).
The surface bacterial and fungal communities were detected based on the 16S rRNA gene and the internal transcribed spacer (ITS) region. The V3–V4 region of the 16S rRNA gene was amplified using the 341F/805R primer set. The ITS1 and ITS2 primers were used to amplify the ITS1 region of the ITS rDNA gene (Table 2). An amplicon library was generated with a 2 × 250 bp paired-end format using the Illumina MiSeq platform and was sequenced by Macrogen (Seoul, Korea).
Table 2.
The primers used for the 16S rRNA gene and ITS region in this study.
2.3. 16S rRNA and ITS rDNA Data Analysis
The quality of the obtained raw amplicon sequences was evaluated using FastQC [39]. Sequences were trimmed to a minimum nucleotide Phred quality score of 20 and a minimum sequence length threshold of 180 bp using trimmomatic (version 0.33) [40]. The clean sequences were analyzed using Mothur v.1.44.3 [41] following the MiSeqSOP [42] standard settings. Only sequences with a maximum of eight homopolymers and lengths of 400–500 bp were selected. The SILVA reference database [43] was used to align the V3–V4 regions with the selected sequences. Chimeric sequences were identified with UCHIME [44] implemented in VSEARCH [45] within Mothur. Non-bacterial sequences, including chloroplasts and mitochondria, were also filtered. Operational taxonomic units (OTUs) with ≥97% similarities were clustered, and classification was performed using the SILVA database [46].
The ITS rDNA was analyzed using the Chunlab in-house program (Chunlab, Inc., Seoul, Korea). Taxonomic assignment was performed using the UNITE database [47]. Chimeric sequences were identified and removed using UCHIME, and sequences with a 97% similarity threshold were identified as described for the 16S rRNA gene analysis process. OTU clustering was conducted using the Chunlab analysis pipeline [48].
2.4. Statistical Analyses
Alpha and beta diversities were calculated using the phyloseq package in R [49]. The OTU-based Bray–Curtis dissimilarity was assessed through principal coordinate analysis (PCoA), after which the results were visualized using the ggplot2 package [50]. The high-throughput amplicon sequences generated in this study are publicly available in MG-RAST with sample IDs mgs860630–mgs860669. All statistical analyses were performed with the vegan package in R. Significance among the environmental factors and microbial communities of MUF and PTF was assessed via the Wilcoxon-signed rank test. Correlations between microorganisms and environmental factors were identified using Pearson’s correlation analysis with further evaluation of the p-values. p-values < 0.05 were deemed to be statistically significant.
3. Results and Discussion
3.1. Indoor Air Parameter Characteristics of the MUFs and PTFs
Data on six indoor air environmental parameters were collected in this study, as shown in Figure 1. Overall, the PM10 and PM2.5 concentrations in the MUF samples were significantly (1.3–1.5 times) higher than in the PTF samples (p < 0.05), whereas HCHO and TVOC concentrations were significantly (1.6–2.3 times) higher in the PTF samples than in the MUF samples (p < 0.05). The temperature and humidity (regarded as critical indoor quality parameters) were not significantly different from the other air parameters (p > 0.05). Moreover, the temperatures in the MUF and PTF samples were not significantly different, as the temperatures of the locations where the samples were collected are currently regulated to 24–27 °C by the Ministry of Environment, South Korea.
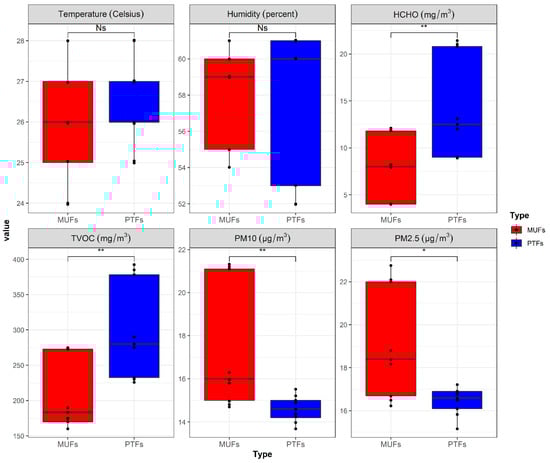
Figure 1.
Collected environmental factors by sample types. Red: MUFs (multi-use facilities), blue: PTFs (public transportation-related multi-use facilities). * Statistically significant difference between the two sample types (p-value < 0.05).
The main sources of PM contamination are cooking, combustion, and vehicle exhaust [51]. Relatively high PM concentration levels were observed in the MUF samples, compared to PTF samples. The PTF samples may undergo relatively high filtration due to central air conditioning and mechanical ventilation systems that effectively manage indoor air quality [52,53], as ventilation requirements are especially strict in South Korea. HCHO and TVOC are major air pollutants caused by human activity in indoor environments and by automobiles, trains, and subway trains in outdoor environments [13,54]. Airplanes are believed to contribute to the indoor TVOC concentration at airports, especially through the opening between the apron and the arrivals hall, which provides a pathway for contaminated air to enter the indoor facilities [55,56,57]. These characteristics may explain the relatively high HCHO and TVOC concentrations in the PTF samples.
3.2. Bacterial and Fungal Community Diversity and Composition
Distinct OTUs were observed between the bacterial and fungal DNA profiles in this study (Table 3). From the bacterial 16S rRNA sequences, 2465–16,374 OTUs were obtained from the MUF samples, and 2130–6297 OTUs were obtained from the PTF samples. However, a relatively small number of OTUs from fungal ITS rDNA sequences were detected in both the MUF (1037–2079) and PTF (2260–2960) samples. Bacterial and fungal diversities were estimated using the Shannon, Simpson, ACE, and Chao1 indices (Table 3). The bacterial diversities of both the MUF and PTF samples were significantly higher than the fungal diversities (average Shannon index values of 6.61 and 1.62 (MUF) and 5.46 and 3.27 (PTF), respectively; p < 0.05). The Simpson index values were similar to the results of the Shannon index. The ACE and Chao1 richness indices also had similar distribution patterns, with the bacterial samples reaching approximately 2–3 times higher values than the fungal samples. Although the MUF samples showed higher bacterial richness and lower fungal richness than the PTF samples, there was no significant difference between the bacterial and fungal samples (p > 0.05).
Table 3.
Alpha diversity of bacterial communities in each sampling site.
The Shannon index values for bacterial diversity were significantly higher than those for fungal diversity; this finding is consistent with the results of previous indoor air studies [58]. Higher levels of PM10 and PM2.5 were observed in the MUF samples than in the PTF samples, suggesting that MUFs may provide a more favorable environment for bacterial colonization [59,60]. Previous studies have also indicated that high PM10 and PM2.5 levels result in high bacterial levels [13,61]. In this study, the PTF samples exhibited a higher Shannon diversity index than the MUF samples, based on fungal OTUs. Although commuters increase bacterial and fungal diversity through their footwear, clothing, hands, hair, etc. [30,62], previous studies have shown that mechanical ventilation systems appear to increase fungal diversity while reducing bacterial diversity [13,30,63]. The mechanisms that drive this phenomenon have not been conclusively determined. However, the microbial diversity in indoor places is likely affected by a combination of factors, such as the transient population, sampling time, ventilation system, and atmospheric environmental factors [64,65].
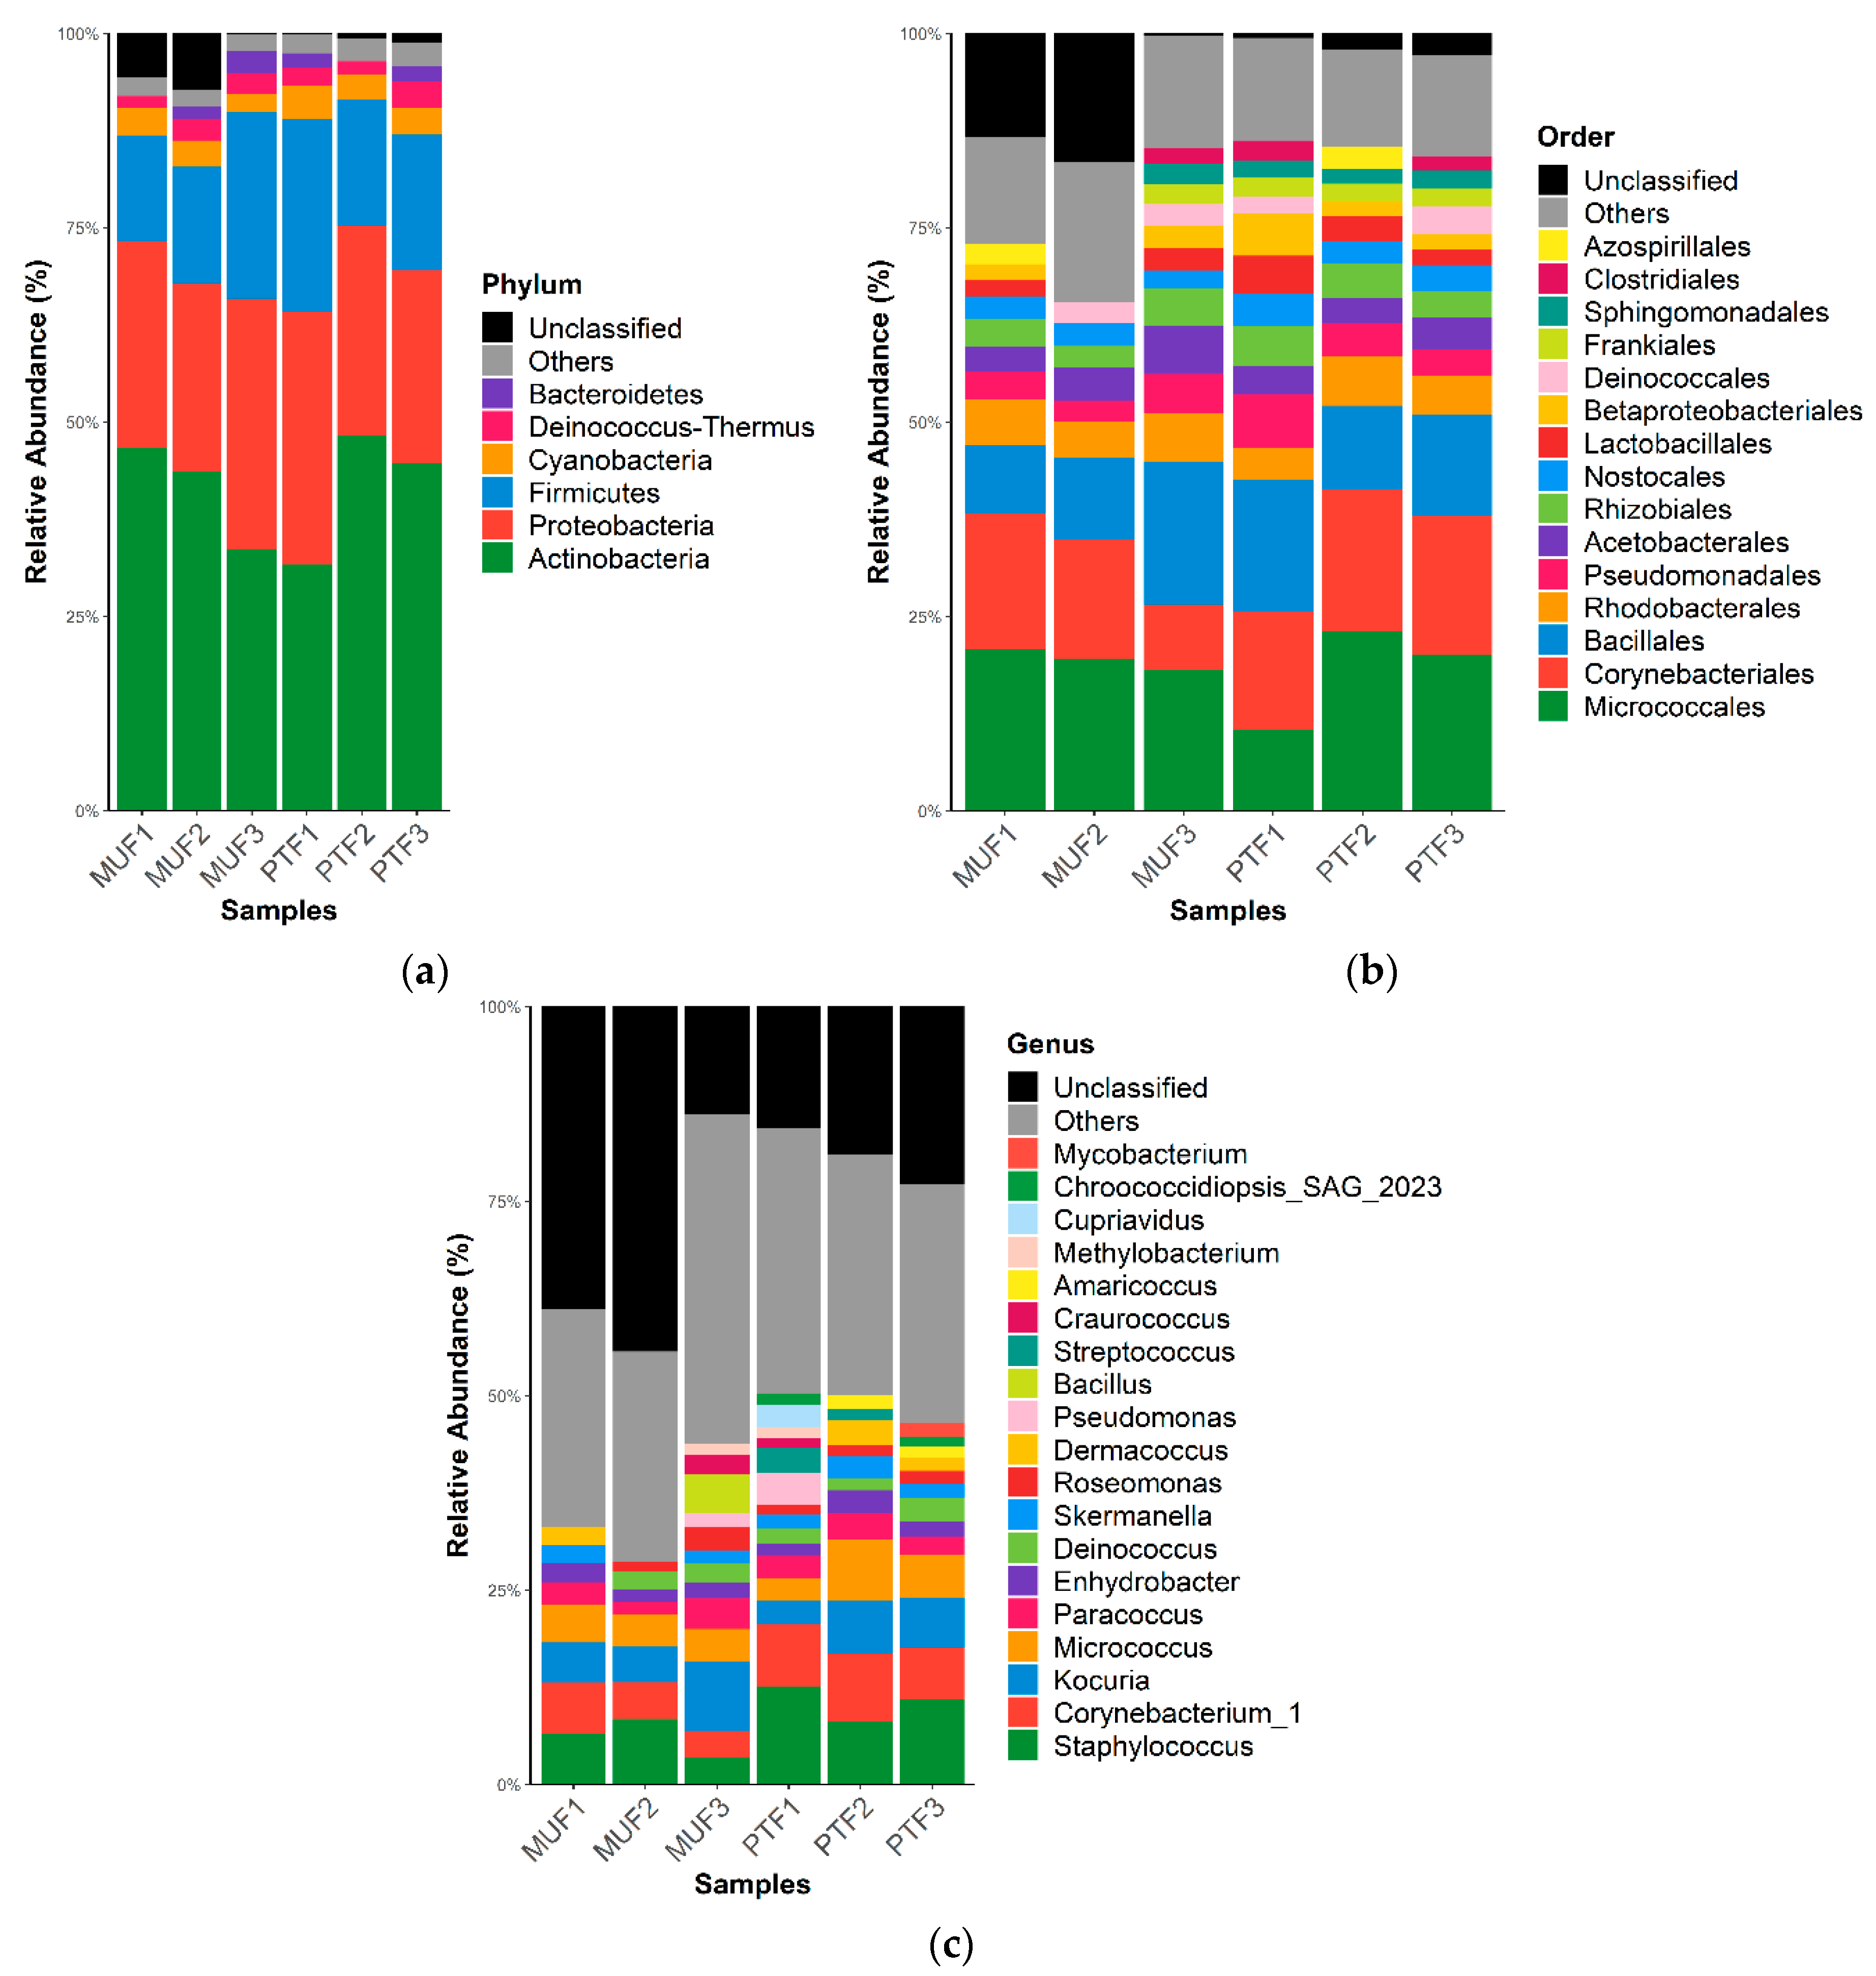
Figure 2 and Figure 3 show the respective bacterial and fungal taxonomic compositions in the MUF and PTF samples at the phylum, order, and genus levels. The bacterial community structures in the MUF and PTF samples were not significantly different at the phylum and order levels, despite the different sampling characteristics. PCoA analysis based on the Bray–Curtis distance also showed that the MUF and PTF samples were clustered together, indicating that there was a high degree of similarity in the bacterial communities (Figure 4). As in previous studies [13,66], analysis of the samples revealed that the top three phyla were Actinobacteria (mean 41.3%), Proteobacteria (mean 27.7%), and Firmicutes (mean 17.5%), accounting for approximately 90% of the total phyla (Figure 2a). At the order level, Micrococcales was the most abundant (means 19.5% and 17.9% in the MUF and PTF samples, respectively), followed by Corynebacteriales (means 13.9% and 17.1%, respectively) and Bacillales (means 12.5% and 13.5%, respectively) (Figure 2b). At the genus level, Staphylococcus was the most abundant in both the MUF (6%) and PTF (10%) samples, followed by Corynebacterium (means 5% and 7.7%, respectively), Kocuria (means 6.1% and 2%, respectively), Micrococcus (means 4.3% and 5.4%, respectively), and Paracoccus (means 2.7% and 2.8%, respectively) (Figure 2c).

Figure 2.
Bacterial relative abundance (%) at the (a) phylum, (b) order, and (c) genus levels in MUF and PTF samples. The data are reported as relative abundances (%) of taxa with abundances of ≥1%.
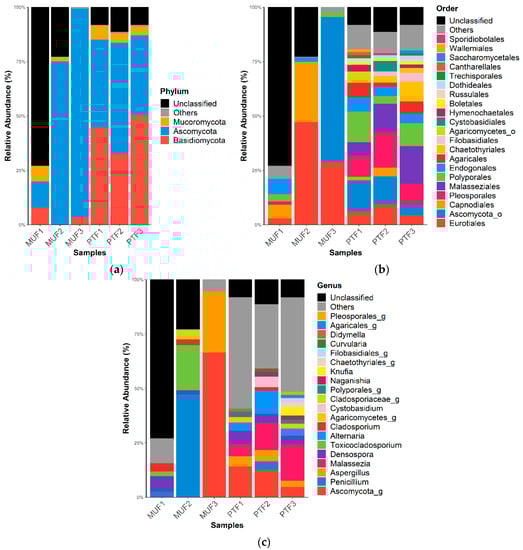
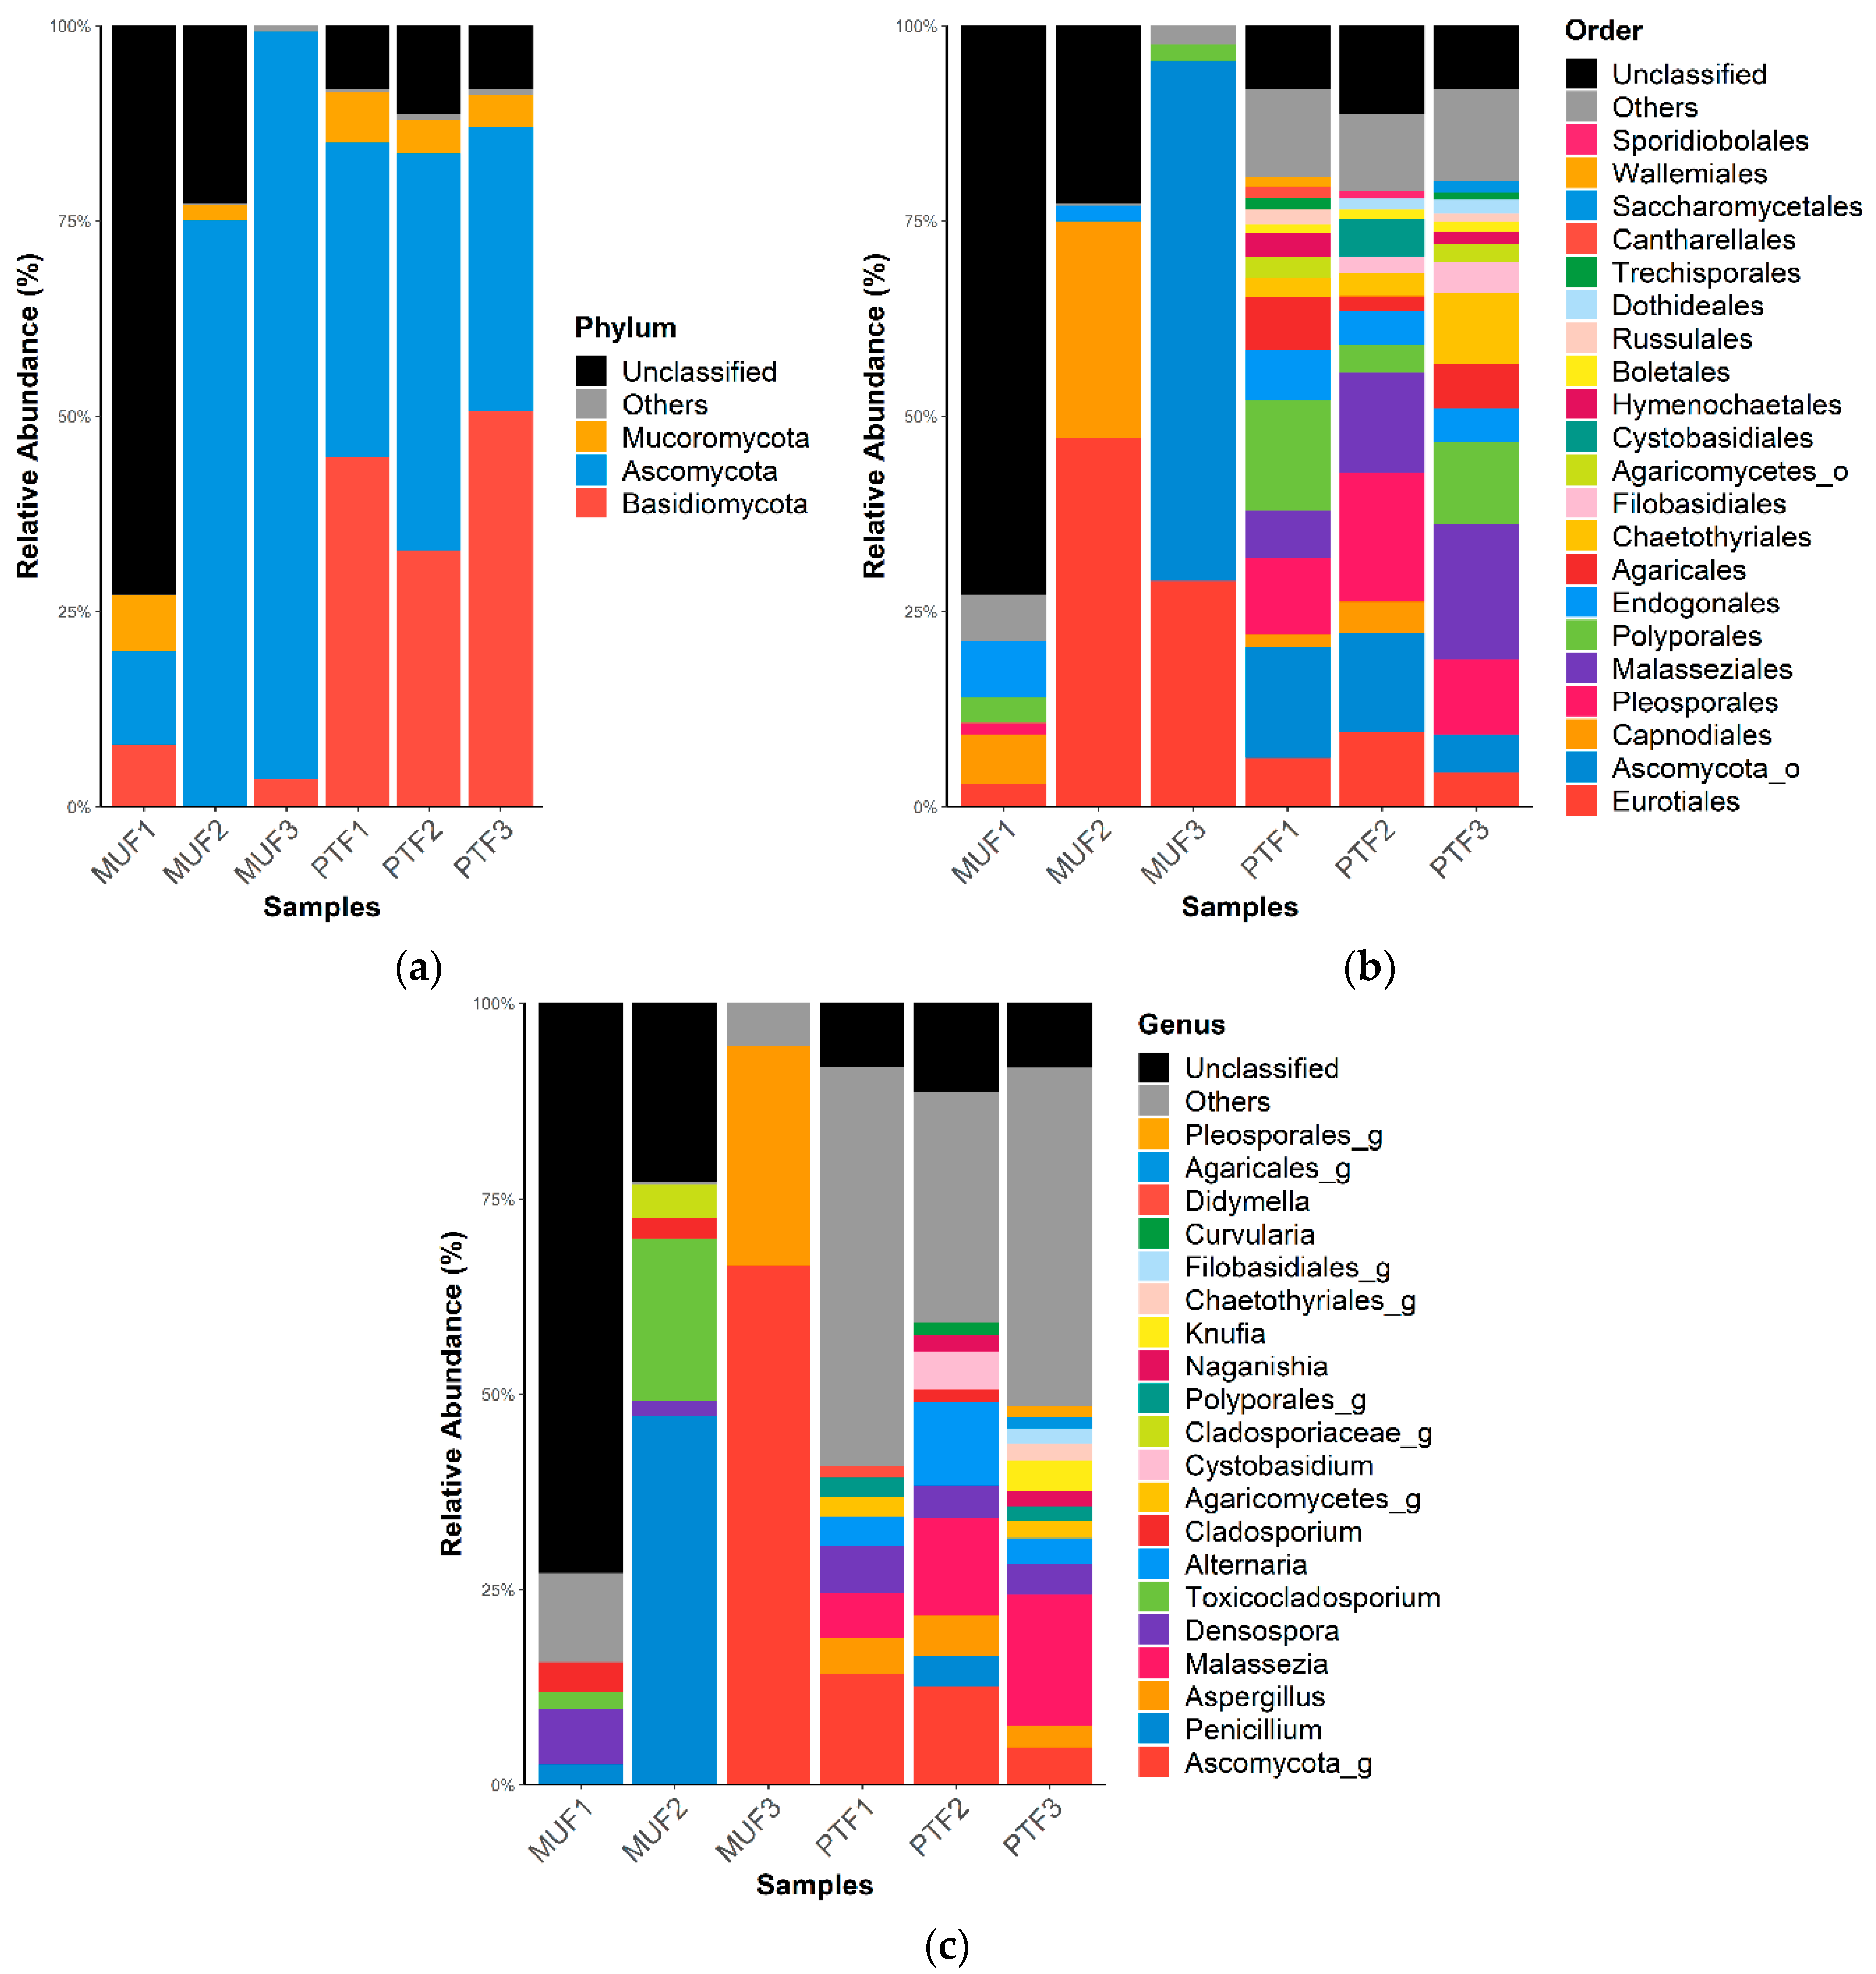
Figure 3.
Fungal relative abundance (%) at the (a) phylum, (b) order, and (c) genus levels in MUF and PTF samples. The data are reported as relative abundances (%) of taxa with abundances of ≥1%.
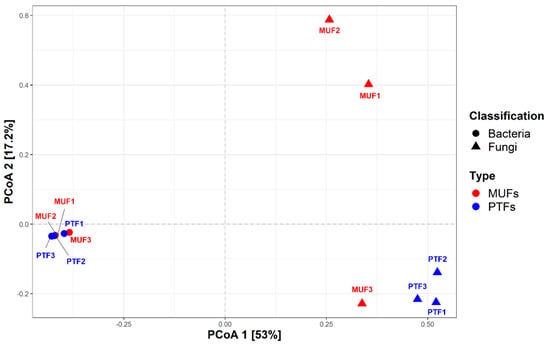
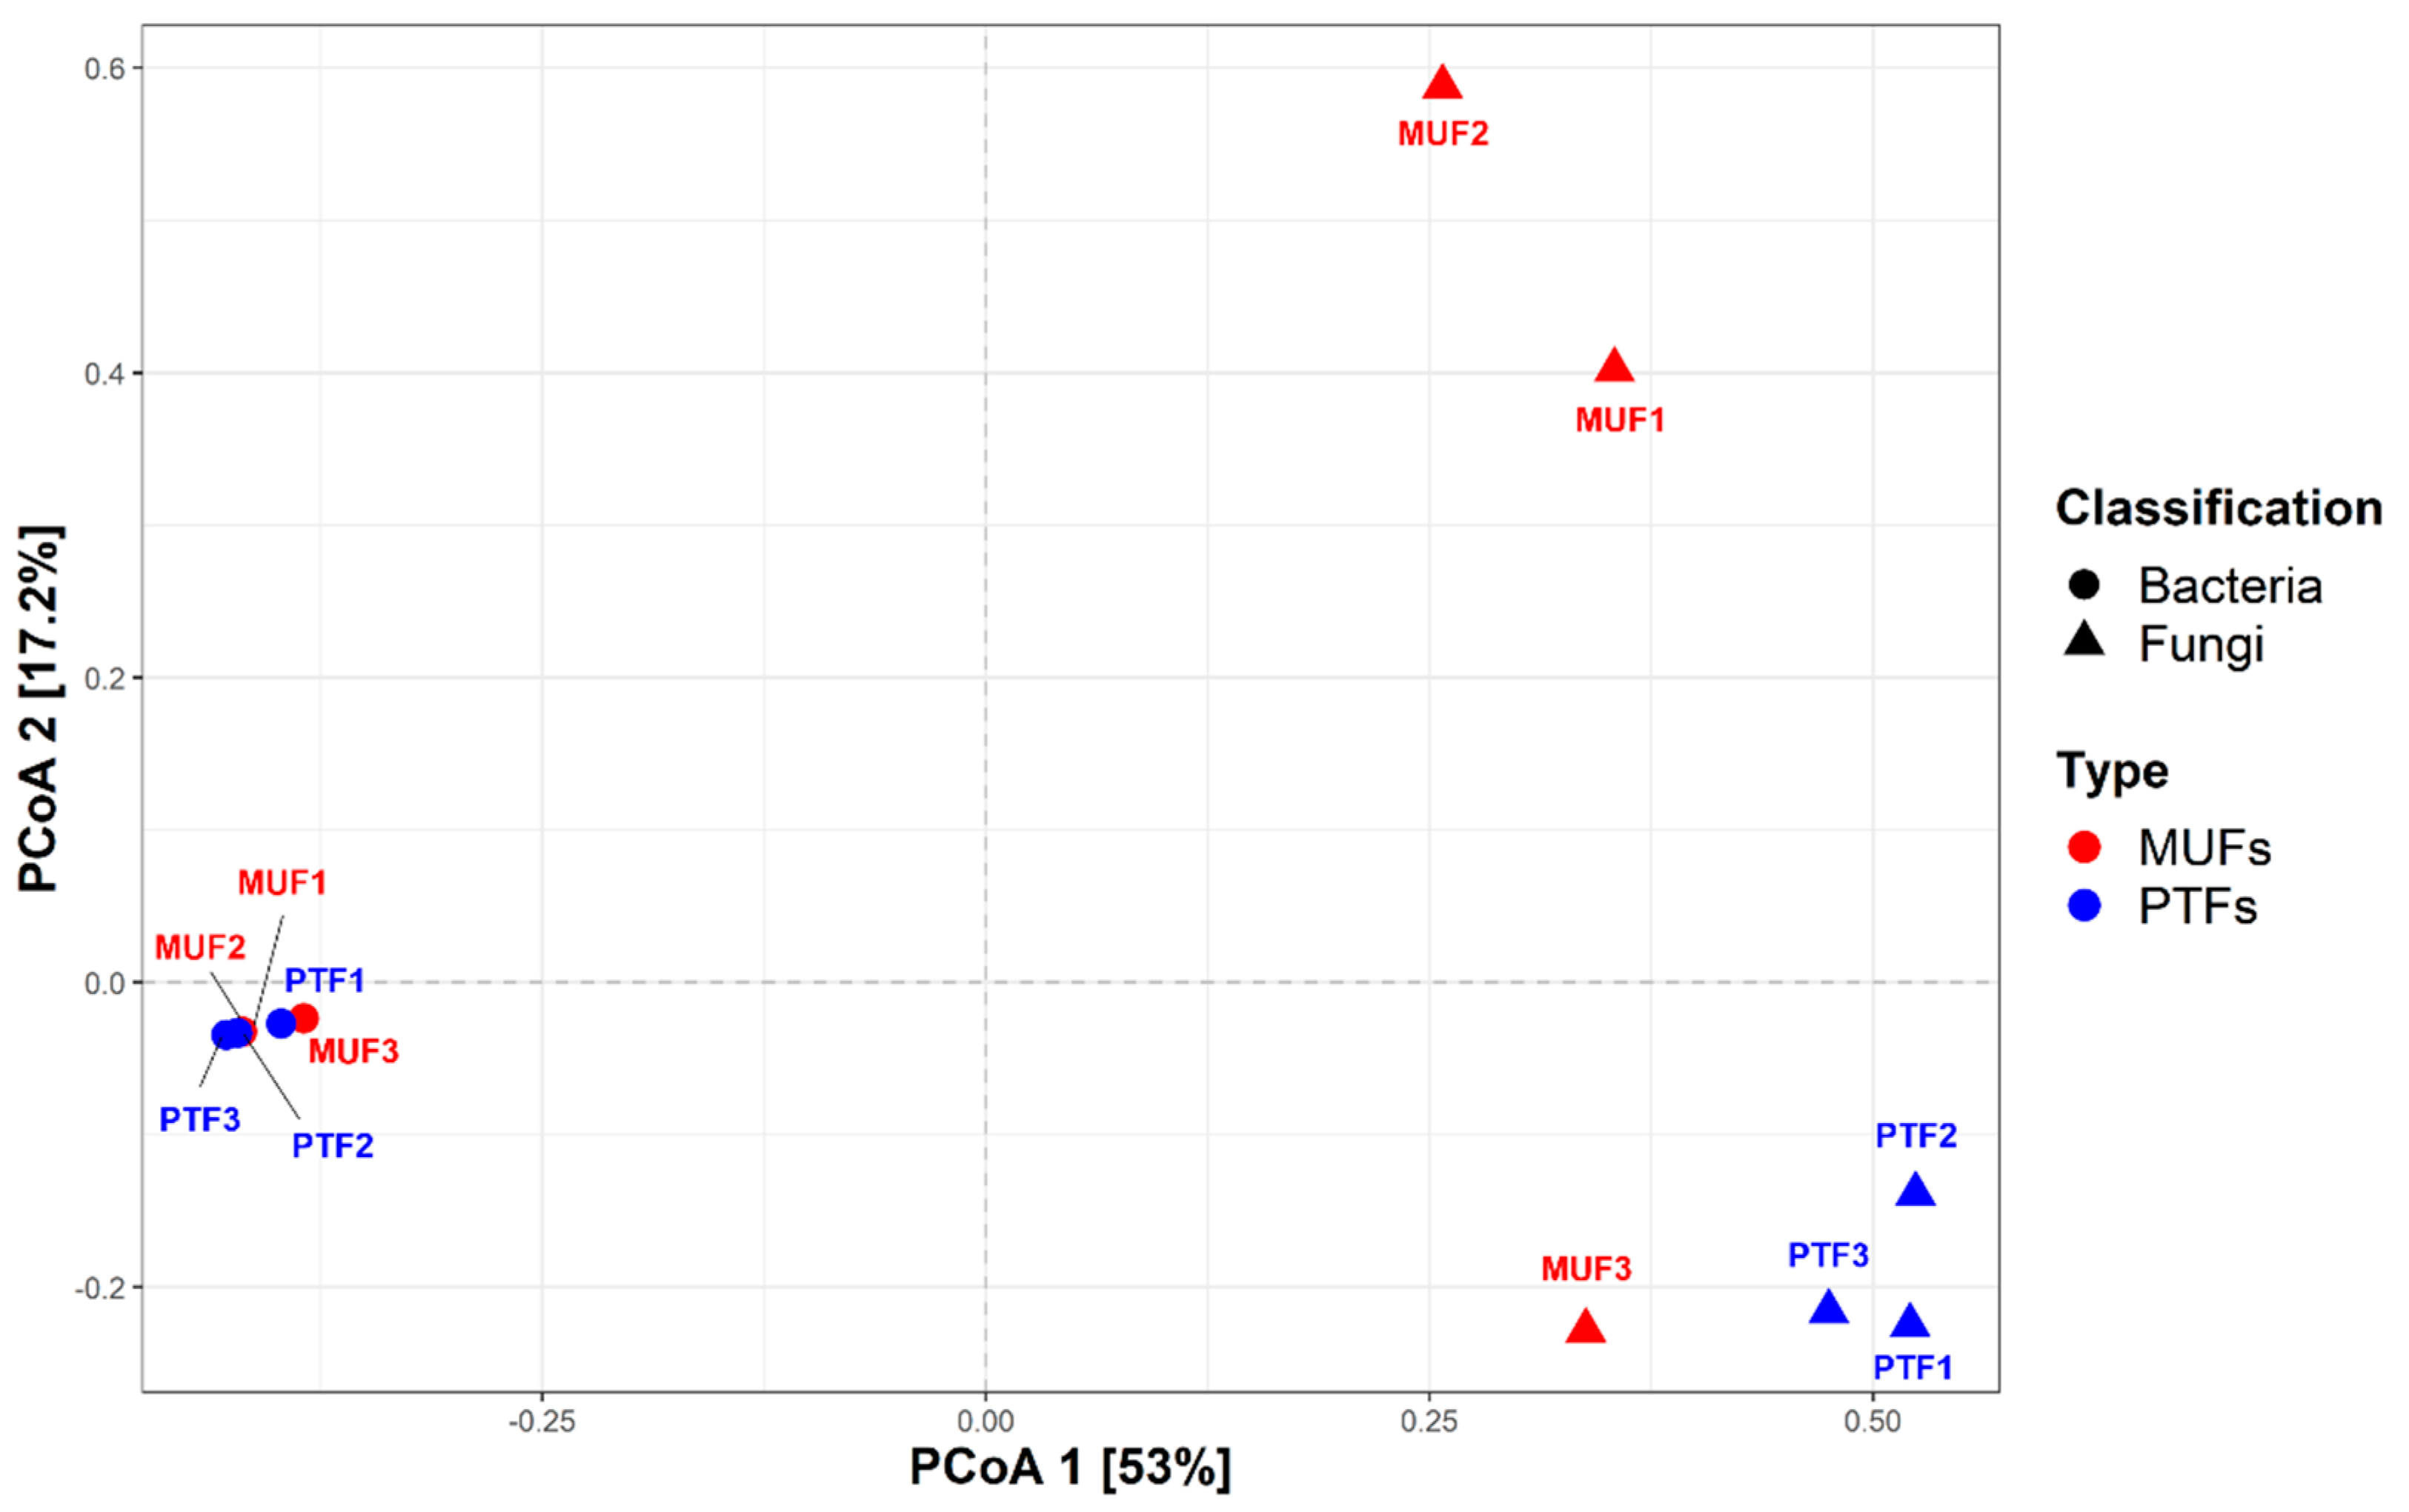
Figure 4.
Principal coordinate analysis (PCoA) plot of the relative abundance at the genus level calculated based on Bray−Curtis dissimilarity. The circles represent bacterial communities, and the triangles represent fungal communities. Red: MUFs (multi−use facilities), blue: PTFs (public transportation−related multi−use facilities).
This study confirmed the high abundances of Firmicutes (Staphylococcus and Bacillus) and Actinobacteria (Corynebacterium and Micrococcus) consistently observed in previous culture-based and non-culture-based studies [13,66]. The indoor samples were dominated by Gram-positive bacteria, including genera known to be associated with human sources, such as Staphylococcus, Streptococcus, and Corynebacterium (Figure 2). Results from previous studies indicate that Gram-positive bacteria were more highly abundant in air and indoor surface samples than Gram-negative bacteria due to Gram-positive bacteria’s superior survivability in these environmental conditions [67,68]. This is because the low peptidoglycan content in the cell walls of Gram-negative bacteria cannot protect them from the stresses of a harsh environment [68].
It has been reported that humans are a major source of populating the bacterial communities in indoor environments [69,70]. Human occupancy in indoor places and/or facilities leads to the resuspension of settled dust, and humans also shed substantial bacterial biomass during normal activity [70,71]. Many bacteria present in indoor air grow on human skin and are directly shed into the air or deposited onto floors and other surfaces, which is followed by subsequent resuspension [70]. Gołofit-Szymczak et al. [72] reported that the most prevalent bacterial species in office buildings are mainly from the Staphylococcus, Micrococcus, Kocuria, and Bacillus genera, which constitute a substantial part of the human microbiome [13,31,32]. These bacteria commonly inhabit many terrestrial and aquatic ecosystems, including soil, fresh and marine water, sand, and vegetation [68,73]. Moreover, in indoor air samples, Micrococcus and Staphylococcus species have been observed together with Paracoccus and Methylobacterium species [63,66], which agrees well with the results of the present study.
Bacterial genera (28.3% of the total relative abundance) known to be associated with human sources were more prevalent in the PTF samples than in the MUF samples (18.6%). PTF samples were generally more favorable environments for the deposition of human-related bacteria due to the large influx and outflow of people in transportation system [32,70]. Although PM levels were significantly associated with the indoor microbial communities, a clear discussion cannot be made based on the limited data in this study. Unfortunately, detailed information on PM10 properties was unmeasurable, as high DNA quality was required for high throughput sequencing within limited MUF and PTF samples due to COVID-19. Therefore, further investigation is quite necessary to interpret the different results between MUF and PTF samples. The major genera identified in this study are consistent with those identified in previous studies on subway/train bioaerosols, such as in Athens [13] and Oslo [12], but they contrast with the results from Barcelona [74]. Thus, the adaptation of the bacterial communities may be affected by the dynamic air and selective pressure conditions in the indoor environment.
The fungal taxonomic profiles show that Ascomycota (mean 51.8%) and Basidiomycota (mean 23.2%) were the top two phyla in all samples (Figure 3). The ratio of Ascomycota to Basidiomycota was similar among the PTF samples but significantly different among the MUF samples (p < 0.05); the latter provided 75% more Ascomycota than Basidiomycota. Mucoromycota (4%) was detected in most samples (except for MUF3) (Figure 3a). At the order level, Eurotiales (mean 26.4%), Capnodiales (mean 11.3%), and Endogonales (mean 3.0%) were prevalent in the MUF samples, whereas Malasseziales (12.3%) and Pelospoales (12.0%) were found in the PTF samples, with slight differences in abundance (Figure 3b). Eurotiales was present in all samples but had particularly high relative abundances in the MUF2 and MUF3 samples (47.2% and 28.9%, respectively). Malasseziales (mean 12.3%) was only found in the PTF samples, along with Agaricales (mean 5%) and Chaetothyriales (mean 5%). PCoA analysis revealed that the MUF and PTF samples were generally separated between types, though not in the MUF3 sample (Figure 4). This result suggests that the number of people can affect the establishment of the fungal community because most of the detected fungal sources were from human activity.
Among the identified genera, Aspergillus was present in the PTF1, PTF2, PTF3, and MUF3 samples, among which the latter showed the highest relative abundance (approximately 28%). Similarly, Penicillium (48%) was at least 10 times more abundant in the MUF2 sample than in the others (Figure 3c). Malassezia was a major genus of fungi present in the PTF samples, while Toxicocladosporium only appeared in the MUF1 and MUF2 samples. Densospora was present in all samples except for MUF3 (overall mean of 3.0% in both the MUFs and PTFs). Business offices and food courts are enclosed areas where fungi can proliferate over a long period of time because of ventilation systems and the dispersion of indoor air; the most common fungal genera found in these places are Penicillium, Aspergillus, and Cladosporium [71,75]. These common genera are consistent with the present study. The Aspergillus genus is a diverse group of fungi that are the most abundant worldwide. For instance, they can grow in a wide range of temperatures (6–55 °C) and at relatively low humidity [76,77]. Spores of the Aspergillus genus are the most predominant in the air and are dispersed over short and long distances [70,78]. The Penicillium genus has been commonly identified in homes at several sites, such as floors and kitchens [70]. Penicillium, Aspergillus, and Cladosporium genera are broadly distributed in nature, and they are found in soil and decomposing and dead organic matter [30].
Most of the fungi detected in the PTF samples are associated with human activity, whereas most in the MUF samples originate from diverse outdoor sources [13,77]. This suggests that fungal spores can easily migrate into indoor places via passengers’ clothes and hair or via the air through open windows, doors, and potential other sources from traffic facilities. Furthermore, when enough water is available in indoor places, fungal spores can easily colonize the indoor environment, and they are readily found in the indoor air and on surfaces [13,32,70,71,78].
As illustrated by PCoA analysis based on the Bray–Curtis distance (Figure 4), the bacterial communities of the MUF and PTF samples were clustered together, indicating a high degree of similarity. Previous studies have consistently shown that Gram-positive bacteria, including human origin genera, predominate in the indoor environment (Figure 2c). Generally, human occupancy in indoor places and/or facilities leads to the resuspension of settled dust, and humans also shed substantial bacterial biomass during normal activity [70,71,78], which may explain why MUF and PTF samples were closely grouped together. In contrast, the analyses of fungal community structures indicated that the MUF and PTF samples were generally separated by sample type (except for the MUF3 samples), and there was a significant difference between each sample in the fungal community, unlike in the bacterial community (Figure 4). Many of the dominant fungal groups are associated with human origins, such as skin, because exposed skin surfaces are passive collectors of environmental fungi [79,80]. As most of our samples were collected from human-touched and moving pathway surfaces, the fungal community may been affected by the bacterial community. In addition, sampling surfaces were generally covered with stainless steel and plastic, which have relatively low amounts of nutrients. For survival, fungi and bacteria can develop a different type of biofilm mechanism depending on the surface type, such as hydrophobic or hydrophilic, and biotic or abiotic [80]. As the results of this study had limitations for a further discussion regarding the differences between bacterial and fungal communities among samples, further study should be conducted to identify how the surface characteristics could affect the bacterial and fungal communities.
In this study, most of the detected fungi in the PTF samples were associated with human activity, whereas most in the MUF samples originated from diverse outdoor sources [13,77]. Previous studies have shown that indoor fungal community composition is predominantly determined by the outdoor fungal diversity and location [69,81]. Fungal spores can easily migrate into indoor environments on passengers’ clothes and hair and in the air through open windows, doors, and other potential sources, such as traffic facilities. Therefore, different types of fungal community structures may be detected in PTF samples, compared to MUF samples.
4. Conclusions
Our study explored the bacterial and fungal communities in indoor public facilities in Busan, South Korea. Our findings indicated that the microbial diversity and composition of the studied indoor environments were quite different for the MUF and PTF samples. The most predominant phylotypes were Firmicutes and Actinobacteria in bacterial communities, and Ascomycota and Basidiomycota were most predominant in fungal communities for both the MUF and PTF samples. These bacterial and fungal communities likely originated from human and outdoor sources. The observed bacterial and fungal communities were dynamic and complex. These results may be attributed to indoor resident activity and density, outdoor factors, sample size, sampling time, COVID-19, and the study design, among other factors.
However, our study design has several limitations. Concretely, the sampling period was limited due to the COVID-19 pandemic, and therefore, seasonal variations and spatio-temporal influences were not investigated because sampling cooperation was very difficult in indoor facilities. Furthermore, the sources of PM, HCHO, and TVOC were not specifically identified. Therefore, more studies are needed to gain insights into the relationships among the microbial community and the indoor environmental parameters in unique indoor facilities. Moreover, future studies should characterize the different sources of microbes in indoor facilities, and they should perform a quantitative assessment of the bacterial and fungal taxa of interest with standard measurement methods and accurate equipment.
Author Contributions
J.K. and S.J.H. equally contributed to this work as first authors. J.K. performed data analysis and visualization, and original draft preparation. S.J.H. performed writing—original draft and review. K.Y. designed and validated the data results, writing—review and editing, supervision, and funding acquisition. All authors have read and agreed to the published version of the manuscript.
Funding
This research was supported by Ministry of Land, Infrastructure, and Transport of Korean government (grant 21CTAP-C164305-01).
Institutional Review Board Statement
Not applicable.
Informed Consent Statement
Not applicable.
Data Availability Statement
The high-throughput amplicon sequences generated in this study are publicly available in MG-RAST with sample IDs mgs860630–mgs860669.
Conflicts of Interest
The authors declare that they have no known competing financial interests or personal relationships that could have appeared to influence the work reported in this paper.
References
- Douwes, J.; Thorne, P.; Pearce, N.; Heederik, D. Bioaerosol health effects and exposure assessment: Progress and prospects. Ann. Occup. Hyg. 2003, 47, 187–200. [Google Scholar]
- Yoo, K.; Lee, T.K.; Choi, E.J.; Yang, J.; Shukla, S.K.; Hwang, S.-I.; Park, J. Molecular approaches for the detection and monitoring of microbial communities in bioaerosols: A review. J. Environ. Sci. 2017, 51, 234–247. [Google Scholar] [CrossRef] [PubMed]
- Klepeis, N.E.; Nelson, W.C.; Ott, W.R.; Robinson, J.P.; Tsang, A.M.; Switzer, P.; Behar, J.V.; Hern, S.C.; Engelmann, W.H. The National Human Activity Pattern Survey (NHAPS): A resource for assessing exposure to environmental pollutants. J. Expo. Sci. Environ. Epidemiol. 2001, 11, 231–252. [Google Scholar] [CrossRef] [PubMed]
- Ott, W.R. Human Activity Patterns: A Review of the Literature for Estimating Time Spent Indoors, Outdoors, and in Transit; US Environmental Protection Agency: Las Vegas, NV, USA, 1988.
- Wallace, L.A. The Total Exposure Assessment Methodology (TEAM) Study: Summary and Analysis; Office of Research and Development, US Environmental Protection Agency: Washington, DC, USA, 1987; Volume 1.
- Karottki, D.G.; Spilak, M.; Frederiksen, M.; Jovanovic Andersen, Z.; Madsen, A.M.; Ketzel, M.; Massling, A.; Gunnarsen, L.; Møller, P.; Loft, S. Indoor and outdoor exposure to ultrafine, fine and microbiologically derived particulate matter related to cardiovascular and respiratory effects in a panel of elderly urban citizens. Int. J. Environ. Res. Public Health 2015, 12, 1667–1686. [Google Scholar] [CrossRef] [PubMed]
- Mack, S.M.; Madl, A.K.; Pinkerton, K.E. Respiratory Health Effects of Exposure to Ambient Particulate Matter and Bioaerosols. Compr. Physiol. 2019, 10, 1–20. [Google Scholar] [CrossRef] [PubMed]
- World Health Organization. Guidelines for Concentration and Exposure-Response Measurement of Fine and Ultra Fine Particulate Matter for Use in Epidemiological Studies; World Health Organization: Geneva, Switzerland, 2002.
- Ross, M.; Curtis, L.; Scheff, P.; Hryhorczuk, D.; Ramakrishnan, V.; Wadden, R.; Persky, V. Association of asthma symptoms and severity with indoor bioaerosols. Allergy 2000, 55, 705–711. [Google Scholar] [CrossRef]
- Walser, S.M.; Gerstner, D.G.; Brenner, B.; Bünger, J.; Eikmann, T.; Janssen, B.; Kolb, S.; Kolk, A.; Nowak, D.; Raulf, M. Evaluation of exposure–response relationships for health effects of microbial bioaerosols–a systematic review. Int. J. Hyg. Environ. Health 2015, 218, 577–589. [Google Scholar] [CrossRef]
- Lee, G.; Yoo, K. A review of the emergence of antibiotic resistance in bioaerosols and its monitoring methods. Rev. Environ. Sci. Bio/Technol. 2022, 21, 799–827. [Google Scholar] [CrossRef]
- Gohli, J.; Bøifot, K.O.; Moen, L.V.; Pastuszek, P.; Skogan, G.; Udekwu, K.I.; Dybwad, M. The subway microbiome: Seasonal dynamics and direct comparison of air and surface bacterial communities. Microbiome 2019, 7, 160. [Google Scholar] [CrossRef]
- Grydaki, N.; Colbeck, I.; Mendes, L.; Eleftheriadis, K.; Whitby, C. Bioaerosols in the Athens Metro: Metagenetic insights into the PM10 microbiome in a naturally ventilated subway station. Environ. Int. 2021, 146, 106186. [Google Scholar] [CrossRef]
- Hernández, A.M.; Vargas-Robles, D.; Alcaraz, L.D.; Peimbert, M. Station and train surface microbiomes of Mexico City’s metro (subway/underground). Sci. Rep. 2020, 10, 8798. [Google Scholar] [CrossRef] [PubMed]
- Kim, M.-S.; Lee, Y.-M.; Kim, S.-K.; Seo, J.-H.; Ji, K.-H.; Oh, J.-Y.; Ko, K.-D.; Ko, G.-P. Investigation of microbial contamination of public bath in Jongno-gu, Seoul. J. Environ. Health Sci. 2009, 35, 162–168. [Google Scholar] [CrossRef]
- Zhang, Z.-F.; Zhang, X.; Zhang, X.-M.; Liu, L.-Y.; Li, Y.-F.; Sun, W. Indoor occurrence and health risk of formaldehyde, toluene, xylene and total volatile organic compounds derived from an extensive monitoring campaign in Harbin, a megacity of China. Chemosphere 2020, 250, 126324. [Google Scholar] [CrossRef]
- El-Sharkawy, M.F.; Javed, W. Study of indoor air quality level in various restaurants in Saudi Arabia. Environ. Prog. Sustain. Energy 2018, 37, 1713–1721. [Google Scholar] [CrossRef]
- Kabir, E.; Kim, K.-H. An investigation on hazardous and odorous pollutant emission during cooking activities. J. Hazard. Mater. 2011, 188, 443–454. [Google Scholar] [CrossRef]
- Lee, S.C.; Li, W.-M.; Chan, L.Y. Indoor air quality at restaurants with different styles of cooking in metropolitan Hong Kong. Sci. Total Environ. 2001, 279, 181–193. [Google Scholar] [CrossRef]
- Vimalanathan, K.; Babu, T.R. The effect of indoor office environment on the work performance, health and well-being of office workers. J. Environ. Health Sci. Eng. 2014, 12, 113. [Google Scholar] [CrossRef]
- Forthomme, A.; Joubert, A.; Andrès, Y.; Simon, X.; Duquenne, P.; Bemer, D.; Le Coq, L. Microbial aerosol filtration: Growth and release of a bacteria–fungi consortium collected by fibrous filters in different operating conditions. J. Aerosol Sci. 2014, 72, 32–46. [Google Scholar] [CrossRef]
- Hyvärinen, A.; Meklin, T.; Vepsäläinen, A.; Nevalainen, A. Fungi and actinobacteria in moisture-damaged building materials—concentrations and diversity. Int. Biodeterior. Biodegrad. 2002, 49, 27–37. [Google Scholar] [CrossRef]
- Rintala, H.; Pitkäranta, M.; Täubel, M. Microbial communities associated with house dust. In Advances in Applied Microbiology; Elsevier: Amsterdam, The Netherlands, 2012; Volume 78, pp. 75–120. [Google Scholar]
- Karbowska-Berent, J.; Górny, R.L.; Strzelczyk, A.B.; Wlazło, A. Airborne and dust borne microorganisms in selected Polish libraries and archives. Build. Environ. 2011, 46, 1872–1879. [Google Scholar] [CrossRef]
- Gangneux, J.-P.; Sassi, M.; Lemire, P.; Le Cann, P. Metagenomic characterization of indoor dust bacterial and fungal microbiota in homes of asthma and non-asthma patients using next generation sequencing. Front. Microbiol. 2020, 11, 1671. [Google Scholar] [CrossRef] [PubMed]
- Ministry of Environment. 2019 Indoor Air Quality Inspection Result Report. Available online: http://www.me.go.kr/home/web/policy_data/read.do?menuId=10276&seq=7601 (accessed on 22 August 2022).
- Heo, S.; Kwoun, Y.; Lee, T.J.; Jo, Y.M. Characterization and source identification of fine dust in Seoul elementary school classrooms. J. Hazard. Mater. 2021, 414, 125531. [Google Scholar] [CrossRef] [PubMed]
- Jung, H.-J.; Kim, B.; Malek, M.A.; Koo, Y.S.; Jung, J.H.; Son, Y.-S.; Kim, J.-C.; Kim, H.; Ro, C.-U. Chemical speciation of size-segregated floor dusts and airborne magnetic particles collected at underground subway stations in Seoul, Korea. J. Hazard. Mater. 2012, 213, 331–340. [Google Scholar] [CrossRef]
- Maskey, S.; Kang, T.; Jung, H.J.; Ro, C.U. Single-particle characterization of indoor aerosol particles collected at an underground shopping area in Seoul, Korea. Indoor Air 2011, 21, 12–24. [Google Scholar] [CrossRef]
- Fan, H.; Li, X.; Deng, J.; Da, G.; Gehin, E.; Yao, M. Time-dependent size-resolved bacterial and fungal aerosols in Beijing subway. Aerosol Air Qual. Res. 2017, 17, 799–809. [Google Scholar] [CrossRef]
- Hwang, S.H.; Park, W.M. Concentrations of PM 10 and airborne bacteria in daycare centers in Seoul relative to indoor environmental factors and daycare center characteristics. Air Qual. Atmos. Health 2017, 10, 139–145. [Google Scholar] [CrossRef]
- Guo, K.; Qian, H.; Zhao, D.; Ye, J.; Zhang, Y.; Kan, H.; Zhao, Z.; Deng, F.; Huang, C.; Zhao, B.; et al. Indoor exposure levels of bacteria and fungi in residences, schools, and offices in China: A systematic review. Indoor Air 2020, 30, 1147–1165. [Google Scholar] [CrossRef]
- Lee, B.G.; Yang, J.I.; Kim, E.; Geum, S.W.; Park, J.H.; Yeo, M.K. Investigation of bacterial and fungal communities in indoor and outdoor air of elementary school classrooms by 16S rRNA gene and ITS region sequencing. Indoor Air 2021, 31, 1553–1562. [Google Scholar] [CrossRef]
- Zhou, W.; Xu, W.; Kim, H.; Zhang, Q.; Fu, P.; Worsnop, D.R.; Sun, Y. A review of aerosol chemistry in Asia: Insights from aerosol mass spectrometer measurements. Environ. Sci. Processes Impacts 2020, 22, 1616–1653. [Google Scholar] [CrossRef]
- Busan Transportation Corporation. Busan Transportation Corporation_Number of Passengers Per Time Slot. Available online: https://www.data.go.kr/data/3057229/fileData.do (accessed on 17 January 2022).
- Korea Airports Corporation. Korea Airports Corporation_Transportation Performance Statistics. Available online: https://www.data.go.kr/data/15002638/fileData.do (accessed on 17 January 2022).
- Jansson, L.; Akel, Y.; Eriksson, R.; Lavander, M.; Hedman, J. Impact of swab material on microbial surface sampling. J. Microbiol. Methods 2020, 176, 106006. [Google Scholar] [CrossRef]
- Flores, G.E.; Bates, S.T.; Knights, D.; Lauber, C.L.; Stombaugh, J.; Knight, R.; Fierer, N. Microbial biogeography of public restroom surfaces. PLoS ONE 2011, 6, e28132. [Google Scholar] [CrossRef] [PubMed]
- Andrews, S.; Krueger, F.; Segonds-Pichon, A.; Biggins, L.; Krueger, C.; Wingett, S. FastQC: A Quality Control Tool for High Throughput Sequence Data. Available online: http://www.bioinformatics.babraham.ac.uk/projects/fastqc/ (accessed on 22 August 2022).
- Bolger, A.M.; Lohse, M.; Usadel, B. Trimmomatic: A flexible trimmer for Illumina sequence data. Bioinformatics 2014, 30, 2114–2120. [Google Scholar] [CrossRef] [PubMed]
- Schloss, P.D.; Westcott, S.L.; Ryabin, T.; Hall, J.R.; Hartmann, M.; Hollister, E.B.; Lesniewski, R.A.; Oakley, B.B.; Parks, D.H.; Robinson, C.J. Introducing mothur: Open-source, platform-independent, community-supported software for describing and comparing microbial communities. Appl. Environ. Microbiol. 2009, 75, 7537–7541. [Google Scholar] [CrossRef] [PubMed]
- Kozich, J.J.; Westcott, S.L.; Baxter, N.T.; Highlander, S.K.; Schloss, P.D. Development of a dual-index sequencing strategy and curation pipeline for analyzing amplicon sequence data on the MiSeq Illumina sequencing platform. Appl. Environ. Microbiol. 2013, 79, 5112–5120. [Google Scholar] [CrossRef]
- Quast, C.; Pruesse, E.; Yilmaz, P.; Gerken, J.; Schweer, T.; Yarza, P.; Peplies, J.; Glöckner, F.O. The SILVA ribosomal RNA gene database project: Improved data processing and web-based tools. Nucleic Acids Res. 2012, 41, D590–D596. [Google Scholar] [CrossRef]
- Edgar, R.C.; Haas, B.J.; Clemente, J.C.; Quince, C.; Knight, R. UCHIME improves sensitivity and speed of chimera detection. Bioinformatics 2011, 27, 2194–2200. [Google Scholar] [CrossRef] [PubMed]
- Rognes, T.; Flouri, T.; Nichols, B.; Quince, C.; Mahé, F. VSEARCH: A versatile open source tool for metagenomics. PeerJ 2016, 4, e2584. [Google Scholar] [CrossRef]
- Yarza, P.; Yilmaz, P.; Pruesse, E.; Glöckner, F.O.; Ludwig, W.; Schleifer, K.-H.; Whitman, W.B.; Euzéby, J.; Amann, R.; Rosselló-Móra, R. Uniting the classification of cultured and uncultured bacteria and archaea using 16S rRNA gene sequences. Nat. Rev. Microbiol. 2014, 12, 635–645. [Google Scholar] [CrossRef]
- Abarenkov, K.; Henrik Nilsson, R.; Larsson, K.H.; Alexander, I.J.; Eberhardt, U.; Erland, S.; Høiland, K.; Kjøller, R.; Larsson, E.; Pennanen, T. The UNITE database for molecular identification of fungi–recent updates and future perspectives. New Phytol. 2010, 186, 281–285. [Google Scholar] [CrossRef]
- Rideout, J.R.; He, Y.; Navas-Molina, J.A.; Walters, W.A.; Ursell, L.K.; Gibbons, S.M.; Chase, J.H.; McDonald, D.; Gonzalez, A.; Robbins-Pianka, A. Consistent, comprehensive and computationally efficient OTU definitions. PeerJ Prepr. 2014, 2, e411v2. [Google Scholar]
- R Core Team. R: A Language and Environment for Statistical Computing, 4.0.3; R Foundation for Statistical Computing: Vienna, Austria, 2020. [Google Scholar]
- Wickham, H. Elegant graphics for data analysis. Media 2009, 35, 10–1007. [Google Scholar]
- Cheng, M.-D.; Gao, N.; Hopke, P.K. Source apportionment study of nitrogen species measured in southern California in 1987. J. Environ. Eng. 1996, 122, 183–190. [Google Scholar] [CrossRef]
- Jung, C.-C.; Wu, P.-C.; Tseng, C.-H.; Su, H.-J. Indoor air quality varies with ventilation types and working areas in hospitals. Build. Environ. 2015, 85, 190–195. [Google Scholar] [CrossRef]
- Zhu, Y.-D.; Li, X.; Fan, L.; Li, L.; Wang, J.; Yang, W.-J.; Wang, L.; Yao, X.-Y.; Wang, X.-L. Indoor air quality in the primary school of China—results from CIEHS 2018 study. Environ. Pollut. 2021, 291, 118094. [Google Scholar] [CrossRef]
- Tao, H.; Fan, Y.; Li, X.; Zhang, Z.; Hou, W. Investigation of formaldehyde and TVOC in underground malls in Xi’an, China: Concentrations, sources, and affecting factors. Build. Environ. 2015, 85, 85–93. [Google Scholar] [CrossRef]
- Mokalled, T. The impact of Beirut Rafic Hariri International Airport’s Activities on the AIR quality of Beirut & Its Suburbs: Measurements and Modelling of VOCs and NO2. Ph.D. Thesis, Université de Strasbourg, Beirut, Lebanon, 2016. [Google Scholar]
- Mokalled, T.; Gérard, J.A.; Abboud, M.; Liaud, C.; Nassreddine, R.; Le Calvé, S. An assessment of indoor air quality in the maintenance room at Beirut-Rafic Hariri International Airport. Atmos. Pollut. Res. 2019, 10, 701–711. [Google Scholar] [CrossRef]
- Mokalled, T.; Le Calvé, S.; Badaro-Saliba, N.; Abboud, M.; Zaarour, R.; Farah, W.; Adjizian-Gérard, J. Identifying the impact of Beirut Airport’s activities on local air quality-Part I: Emissions inventory of NO2 and VOCs. Atmos. Environ. 2018, 187, 435–444. [Google Scholar] [CrossRef]
- Adams, R.I.; Miletto, M.; Lindow, S.E.; Taylor, J.W.; Bruns, T.D. Airborne bacterial communities in residences: Similarities and differences with fungi. PLoS ONE 2014, 9, e91283. [Google Scholar] [CrossRef]
- Gong, J.; Qi, J.; Beibei, E.; Yin, Y.; Gao, D. Concentration, viability and size distribution of bacteria in atmospheric bioaerosols under different types of pollution. Environ. Pollut. 2020, 257, 113485. [Google Scholar] [CrossRef]
- Goudarzi, G.; Shirmardi, M.; Khodarahmi, F.; Hashemi-Shahraki, A.; Alavi, N.; Ankali, K.A.; Babaei, A.A.; Soleimani, Z.; Marzouni, M.B. Particulate matter and bacteria characteristics of the Middle East Dust (MED) storms over Ahvaz, Iran. Aerobiologia 2014, 30, 345–356. [Google Scholar] [CrossRef]
- Martins, V.; Moreno, T.; Mendes, L.; Eleftheriadis, K.; Diapouli, E.; Alves, C.A.; Duarte, M.; de Miguel, E.; Capdevila, M.; Querol, X. Factors controlling air quality in different European subway systems. Environ. Res. 2016, 146, 35–46. [Google Scholar] [CrossRef]
- Prussin, A.J.; Marr, L.C. Sources of airborne microorganisms in the built environment. Microbiome 2015, 3, 78. [Google Scholar] [CrossRef] [PubMed]
- Kembel, S.W.; Meadow, J.F.; O’Connor, T.K.; Mhuireach, G.; Northcutt, D.; Kline, J.; Moriyama, M.; Brown, G.; Bohannan, B.J.; Green, J.L. Architectural design drives the biogeography of indoor bacterial communities. PLoS ONE 2014, 9, e87093. [Google Scholar] [CrossRef] [PubMed]
- Kalogerakis, N.; Paschali, D.; Lekaditis, V.; Pantidou, A.; Eleftheriadis, K.; Lazaridis, M. Indoor air quality—bioaerosol measurements in domestic and office premises. J. Aerosol Sci 2005, 36, 751–761. [Google Scholar] [CrossRef]
- Kulkarni, P.; Baron, P.A.; Willeke, K. Aerosol Measurement: Principles, Techniques, and Applications; John Wiley & Sons: Hoboken, NJ, USA, 2011. [Google Scholar]
- Shin, S.-K.; Kim, J.; Ha, S.-m.; Oh, H.-S.; Chun, J.; Sohn, J.; Yi, H. Metagenomic insights into the bioaerosols in the indoor and outdoor environments of childcare facilities. PLoS ONE 2015, 10, e0126960. [Google Scholar]
- Adhikari, A.; Kettleson, E.M.; Vesper, S.; Kumar, S.; Popham, D.L.; Schaffer, C.; Indugula, R.; Chatterjee, K.; Allam, K.K.; Grinshpun, S.A. Dustborne and airborne Gram-positive and Gram-negative bacteria in high versus low ERMI homes. Sci. Total Environ. 2014, 482, 92–99. [Google Scholar] [CrossRef]
- Yoo, K.; Han, I.; Ko, K.S.; Lee, T.K.; Yoo, H.; Khan, M.I.; Tiedje, J.M.; Park, J. Bacillus-dominant airborne bacterial communities identified during Asian dust events. Microb. Ecol. 2019, 78, 677–687. [Google Scholar] [CrossRef]
- Adams, R.I.; Miletto, M.; Taylor, J.W.; Bruns, T.D. Dispersal in microbes: Fungi in indoor air are dominated by outdoor air and show dispersal limitation at short distances. ISME J. 2013, 7, 1262–1273. [Google Scholar] [CrossRef]
- Hospodsky, D.; Qian, J.; Nazaroff, W.W.; Yamamoto, N.; Bibby, K.; Rismani-Yazdi, H.; Peccia, J. Human occupancy as a source of indoor airborne bacteria. PLoS ONE 2012, 7, e34867. [Google Scholar] [CrossRef]
- Qian, J.; Hospodsky, D.; Yamamoto, N.; Nazaroff, W.W.; Peccia, J. Size-resolved emission rates of airborne bacteria and fungi in an occupied classroom. Indoor Air 2012, 22, 339–351. [Google Scholar] [CrossRef]
- Gołofit-Szymczak, M.; Górny, R.L. Microbiological air quality in office buildings equipped with dventilation systems. Indoor Air 2018, 28, 792–805. [Google Scholar] [CrossRef] [PubMed]
- Zhai, Y.; Li, X.; Wang, T.; Wang, B.; Li, C.; Zeng, G. A review on airborne microorganisms in particulate matters: Composition, characteristics and influence factors. Environ. Int. 2018, 113, 74–90. [Google Scholar] [CrossRef] [PubMed]
- Triadó-Margarit, X.; Veillette, M.; Duchaine, C.; Talbot, M.; Amato, F.; Minguillón, M.C.; Martins, V.; de Miguel, E.; Casamayor, E.O.; Moreno, T. Bioaerosols in the Barcelona subway system. Indoor Air 2017, 27, 564–575. [Google Scholar] [CrossRef] [PubMed]
- Rajasekar, A.; Balasubramanian, R. Assessment of airborne bacteria and fungi in food courts. Build. Environ. 2011, 46, 2081–2087. [Google Scholar] [CrossRef]
- Krijgsheld, P.; Bleichrodt, R.V.; Van Veluw, G.; Wang, F.; Müller, W.; Dijksterhuis, J.; Wösten, H. Development in aspergillus. Stud. Mycol. 2008, 60, 1–66. [Google Scholar] [CrossRef]
- Teertstra, W.R.; Tegelaar, M.; Dijksterhuis, J.; Golovina, E.A.; Ohm, R.A.; Wösten, H.A. Maturation of conidia on conidiophores of Aspergillus niger. Fungal Genet. Biol. 2017, 98, 61–70. [Google Scholar] [CrossRef]
- Barberán, A.; Ladau, J.; Leff, J.W.; Pollard, K.S.; Menninger, H.L.; Dunn, R.R.; Fierer, N. Continental-scale distributions of dust-associated bacteria and fungi. Proc. Natl. Acad. Sci. USA 2015, 112, 5756–5761. [Google Scholar] [CrossRef]
- Adams, R.I.; Miletto, M.; Taylor, J.W.; Bruns, T.D. The diversity and distribution of fungi on residential surfaces. PLoS ONE 2013, 8, e78866. [Google Scholar] [CrossRef]
- Vishwakarma, V. Impact of environmental biofilms: Industrial components and its remediation. J. Basic Microbiol. 2020, 60, 198–206. [Google Scholar] [CrossRef]
- Amend, A.S.; Seifert, K.A.; Samson, R.; Bruns, T.D. Indoor fungal composition is geographically patterned and more diverse in temperate zones than in the tropics. Proc. Natl. Acad. Sci. USA 2010, 107, 13748–13753. [Google Scholar] [CrossRef] [Green Version]

Publisher’s Note: MDPI stays neutral with regard to jurisdictional claims in published maps and institutional affiliations. |
© 2022 by the authors. Licensee MDPI, Basel, Switzerland. This article is an open access article distributed under the terms and conditions of the Creative Commons Attribution (CC BY) license (https://creativecommons.org/licenses/by/4.0/).