Article

Construction of Multipollutant Air Quality Health Index and Susceptibility Analysis Based on Mortality Risk in Beijing, China

1
Institute of Urban Safety and Environmental Science, Beijing Academy of Science and Technology, Beijing 100054, China
2
Center of Excellence for Environmental Safety and Biological Effects, Beijing Key Laboratory for Green Catalysis and Separation, Department of Chemistry and Biology, Beijing University of Technology, Beijing 100124, China
3
School of Energy and Environmental Engineering, University of Science and Technology Beijing, Beijing 100083, China
4
Key Laboratory of Wetland Ecology and Environment, Northeast Institute of Geography and Agroecology, Chinese Academy of Sciences, Changchun 130102, China
*
Authors to whom correspondence should be addressed.
Atmosphere 2022, 13(9), 1370; https://doi.org/10.3390/atmos13091370
Submission received: 12 August 2022 / Revised: 22 August 2022 / Accepted: 24 August 2022 / Published: 26 August 2022
(This article belongs to the Special Issue Contributions of Emission Inventory to Air Quality)

Abstract

:
Air pollution places a considerable disease burden on the public. Compared with the widely applied air quality index (AQI), the air quality health index (AQHI) provides a more comprehensive measure of multiple pollutants. In this study, AQHI was constructed using environmental data, meteorological data, and the daily mortality data of Beijing residents from 2018 to 2020. Factors increasing the susceptibility of the population to the health effects of air pollution were identified to aid the construction of a specific AQHI (S-AQHI) for susceptible populations. The findings indicated that older adults, women, and people with respiratory disease are more susceptible to the short-term health effects of air pollution. The relative deviation in the AQHI and S-AQHI for changes in daily mortality percentage of various specific populations ranged from only 1.4% to 10.3%, indicating the universality of the AQHI in its capacity to predict health risks. The Spearman coefficient of correlation between the AQHI and AQI was 0.78 (p < 0.01). Each increase in the interquartile range of the AQHI and AQI results in an increase of 1.894% and 1.029% in the total daily mortality, respectively, demonstrating the stronger capacity of the AQHI to predict daily mortality compared to the AQI.

1. Introduction

Air pollution has become a major environmental risk to global public health and has considerably increased the world’s disease burden. The World Health Organization (WHO) first reported the negative effects of air pollution on human health in a technical report published in 1958 [1]. According to data released in 2016 based on the WHO’s new air quality model [2], approximately 92% of the world’s population resides in places with air quality below the recommended standards of the WHO [3]. In addition, more than 90% of air pollution-related deaths occur in low- and middle-income countries, most of which are in Asia and Africa [4], highlighting the severity of air pollution in these countries.
Numerous studies have reported the adverse effects of air pollution on human health [5,6,7,8], including an increased mortality risk [9]. According to the WHO, one-third of stroke, lung cancer, and heart disease cases are caused by air pollution. According to the 2017 Global Burden of Disease [10], 4.1 million individuals worldwide die prematurely because of air pollution every year. Air pollution is the fourth leading cause of the disease burden in China [11,12]. Therefore, the public must be made aware of the potential health effects of air pollution. On the basis of health and pollutant toxicity impact assessments and a scientific literature review, the WHO developed a new air quality guideline [13] to limit air pollution levels and protect the public’s health.
In 1999, the US Environmental Protection Agency proposed the first air quality index (AQI) for reporting, on a daily basis, the air cleanliness or pollution level and its impact on health. Many countries have adopted the AQI to report daily air quality data because it is an easy-to-understand indicator of air quality; however, methods used for the evaluation of the AQI differ among countries [14]. Currently, the AQI is widely used to evaluate environmental air quality, release risk information in a timely manner, and recommend certain behavioral measures to mitigate the short-term health risks of air pollution.
The AQI reflects only the level of the individual pollutant with the highest subindex and does not consider the possible synergistic effects of simultaneous exposure to multiple pollutants and differences in the characteristics of the exposure–response relationship among various air pollutants in different countries or regions [14]. Therefore, the AQI does not reflect the no-threshold dose–response relationship between air pollutants and health risks [15,16,17]. To overcome the shortcomings of the AQI, a study conducted in Canada first proposed and developed the air quality health index (AQHI), which is used to estimate the combined health effects of multiple air pollutants and evaluate air quality [18]. Since 30 December 2013, Hong Kong has been officially reporting the AQHI to inform people of the short-term health effects of air pollution. Mason et al. [19] were the first to evaluate the AQHI and its relationships with specific respiratory diseases (respiratory tract infection, asthma, chronic obstructive pulmonary disease, and pneumonia) in Hong Kong. They discovered a 14% decline in hospital admissions for respiratory infection immediately after the Hong Kong government started reporting the AQHI. The findings of an age-specific analysis revealed significant decreases in hospitalizations for respiratory tract infection and pneumonia in children. In contrast to the AQI, the AQHI provides information on the short-term combined health effects of multiple air pollutants. Thus, the AQHI can be used to provide guidance on outdoor activities for the general population and specifically for those susceptible to air pollution [20]. Several time-series or case-crossover studies have provided strong evidences for the short-term health effects of air pollution [21,22]. Different individuals respond differently to air pollution even when exposed to identical levels of pollution. Thus, investigating the adverse health effects of air pollution and identifying factors that increase susceptibility to these health effects are critical for elucidating the mechanisms underlying the adverse health effects of air pollution and lowering health risks in targeted populations.
Because factors, such as season, time, geographical location, and weather changes, affect air quality, determining the environmental air pollution level at a specific time and location and effectively conveying information on the health effects of that air pollution to the public are critical topics in epidemiological research. Because of differences in the relationship between air pollution and health risks among differing regions, the AQHI of one country or city cannot be directly applied to another country or city. To ensure that the AQHI accurately reflects the impact of air quality on public health and can be used to effectively guide the health behavior of local residents, the link between local health and air pollution data should be established. Moreover, these data should be used to develop a local exposure–response model, construct a localized AQHI in response to regionally complex and changeable air pollutants, and accurately and reasonably assess air pollution. These activities can facilitate the construction of a reasonable evaluation index for providing public health recommendations.
Some cities in China (e.g., Hong Kong, Shanghai, Tianjin, and Guangzhou) employ an AQHI [17,19,23,24,25,26]. The air pollution in Beijing, the capital of China, has become severe due to the rapid development of China’s economy, and this pollution has exacerbated citizens’ health problems. Although scholars [27,28,29] have established an AQHI for Beijing, most have considered only two to three pollutants and investigated their health effects; factors increasing the susceptibility of individuals to the health effects of air pollution have not been identified. Because of limitations in monitoring data (prior to 2010), studies have used data on particulate matter (PM) with an aerodynamic diameter of ≤10 μm (PM10), but ignored PM with an aerodynamic diameter of ≤2.5 μm (PM2.5), which is more harmful to humans. Thus, identifying factors that increase the susceptibility of individuals to the health effects of air pollution is crucial in investigating the health risks of air pollution and minimizing these health risks in targeted populations. In the present study, the health and air pollution data of Beijing in recent years were employed to construct an AQHI for Beijing and analyze the susceptibility of various populations.

2. Methodology

2.1. Data Sources

Daily average data on air pollutants (PM10, PM2.5, SO2, CO, NO2, and O3) throughout Beijing from 1 January 2018 to 31 December 2020 were obtained from the China National Environmental Monitoring Center. The daily air pollutant concentrations were calculated by taking the average of the data collected from the 12 monitoring stations in Beijing. Meteorological data of Beijing included the daily maximum temperature (°C), daily minimum temperature (°C), daily average temperature (AVET) (°C), daily average relative humidity (AVEH) (%), and daily average wind velocity (mph), obtained from the Weather Underground website (www.wunderground.com) (accessed on 16 August 2021).
Daily mortality data of Beijing from 2018 to 2020 were collected from the Disease Surveillance Point System of the Chinese Center for Disease Control and Prevention. The mortality was further stratified by the date of mortality, age, gender, and disease. We integrated the aforementioned data to eliminate abnormal values, search for missing data, and perform linear interpolation. Among nonaccidental deaths, we excluded those caused by COVID-19.

2.2. Statistical Analysis

2.2.1. Estimating the Associations of Air Pollutants with Mortality

In this study, we used a generalized additive model (GAM) to perform a traditional time-series analysis for investigating the exposure–response relationship between the concentration of regional air pollutants and daily mortality of residents. Parametric and nonparametric methods were used to fit the GAM to air pollutants and unknown confounding factors, respectively, and smoothing was applied to control for known confounding factors, namely temperature and humidity, and other nonlinear factors related to disease mortality. Subsequently, cross validation was performed to adjust the degree of freedom (ν) of each smooth function, thereby enabling an accurate estimation of the risks posed by pollutants after the removal of confounding factors. In this study, date, temperature, humidity, wind velocity, and day of the week (DOW) were introduced to the GAM as confounding factors to be controlled. The basic modeling strategy is described as follows [30,31]:
  • To control for long-term and seasonal trends in daily deaths, a natural spline (ns) function for dates was incorporated to process nonlinear trends and serial correlations in daily deaths over time.
  • The degree of freedom of the time-smooth function determined the degree to which time trends were excluded. The partial autocorrelation function (PACF) was used to guide the selection of the degree of freedom. Through fitting of the GAM and plotting of the PACF graph with a 30-day lag, when the absolute value of the first 2-day lag in the graph was <0.1, the model was regarded as having favorable control of the serial correlation. When more than one parameter satisfied this condition, the parameter with the smallest sum of the 30-day cumulative absolute values was selected. The annual ν for the final fit was 8.
  • An indicator variable for the DOW was included in the base model to exclude the natural fluctuations in daily mortality within a given week.
  • The mean temperature, relative humidity, and wind velocity were included in the base model to control for the confounding effects of meteorological factors on the association between air pollution and daily mortality. An ns function was adopted to control for the confounding effect of the nonlinear relationship between meteorological factors and mortality; the degree of freedom of the ns function was set to 3 throughout the study. Because of the strong correlation and concurvity of the weather variables between two or more consecutive days, only the confounding effect of the weather on the day of death was controlled [32,33,34].
When acting as the dependent variable, the daily mortality of citizens belonged to the Poisson distribution, relative to the total population or time period. Thus, a quasi-Poisson distribution was used to connect to the GAM to solve the overdispersion of mortality. The following basic function was established:
Log E Y t = β Z t + n s t i m e , ν + D O W + n s X t , ν + α
where E(Yt) is the expected value of the daily mortality of citizens on the observed day t; Zt is the concentration of pollutants on the observed day t (μg/m3); β is the exposure–response relationship coefficient, which is the daily change in mortality caused by a one-unit increase in pollutant concentrations; time is the date variable (choosing a suitable degree of freedom value for the date can effectively control for the long-term and seasonal trends in pollution-death series data). DOW is a dummy variable that excludes the effect of the normal fluctuation trends in death in the short term. The ns function with the degree of freedom is used to evaluate nonlinear trends and the serial correlation of daily deaths on the time axis. The ns function controls for confounding factors, such as long-term trends and meteorological factors, related to long-term variation in time-series data. Finally, Xt represents meteorological factors for day t, namely the daily average temperature (°C), average relative humidity (%), and average wind velocity (mph).
Considering the lag effect of air pollutants on population health, the lag data of 0–7 days and the regression coefficient β of the optimal lag days were selected to construct the Beijing AQHI.

2.2.2. Construction of the Beijing AQHI

The Beijing AQHI was constructed by using the zero concentration of air pollutants as the base point, and the exposure–response relationship coefficient of major air pollutants in relation to health was obtained using the exposure–response relationship model. Excess mortality resulting from the daily level of each pollutant during the study period was calculated using the following formula:
E R k t = 100 × e β × p k t 1
where ERkt is the excess mortality caused by pollutant k on day t; β is the exposure–response relationship coefficient estimated using the regression model, that is, the daily increase in mortality caused by a one-unit increase in pollutants; pkt is the average concentration of the kth pollutant on day t.
The AQHI was marked on a 10-point scale, and the Beijing AQHI was constructed on the basis of the excess mortality rate resulting from a one-unit increase in the pollutant concentration. The calculation formula is expressed as follows:
AQHI = 10 × k = 1 n E R k t / max k = 1 n E R k t

2.2.3. Evaluation of the Validity of the AQHI

We performed a descriptive statistical analysis of the daily AQI and AQHI during the study period. The indicators included the mean, standard deviation, minimum, maximum, lower quartile (P25), median, (P50), upper quartile (P75), and interquartile range (IQR). Subsequently, we determined differences between two indices. The daily values of the AQHI and AQI during the study period were separately included in the time-series model. Because of differences in daily relative changes in the AQHI and AQI, the IQR was used as a measurement scale to examine the ability of the AQHI and AQI to predict health risks and to evaluate the effectiveness of the AQHI.

3. Results and Discussion

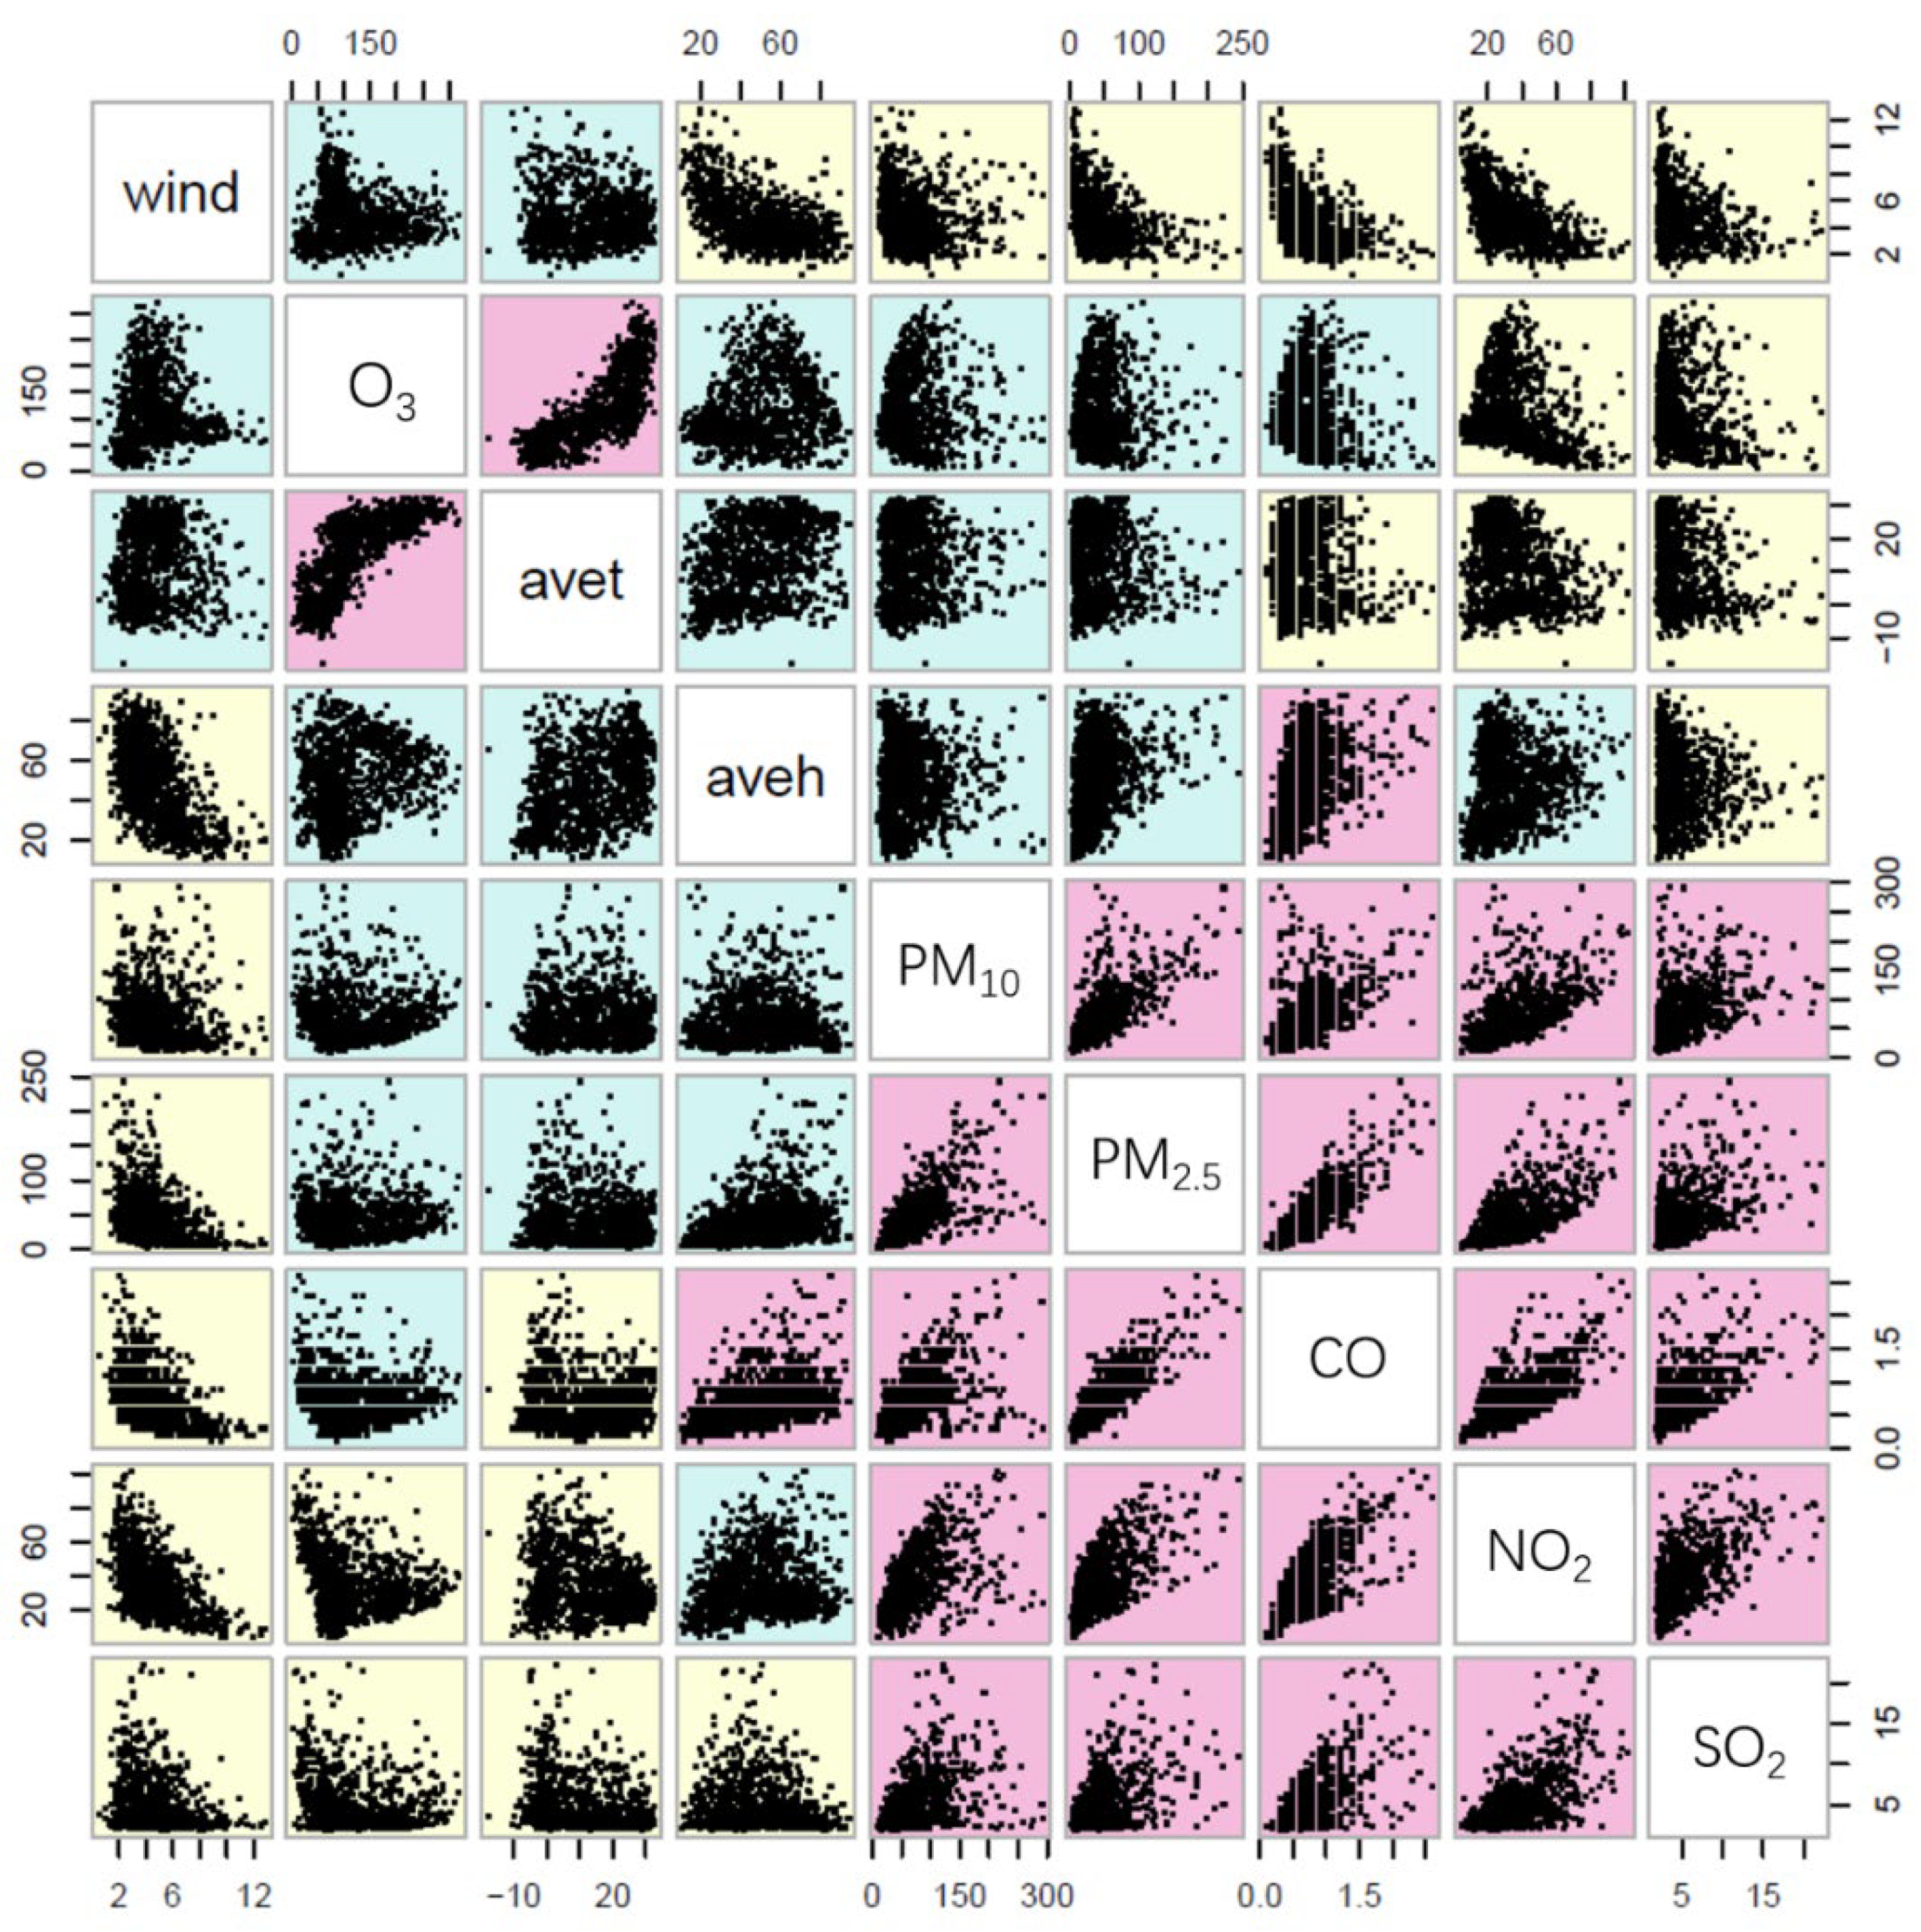
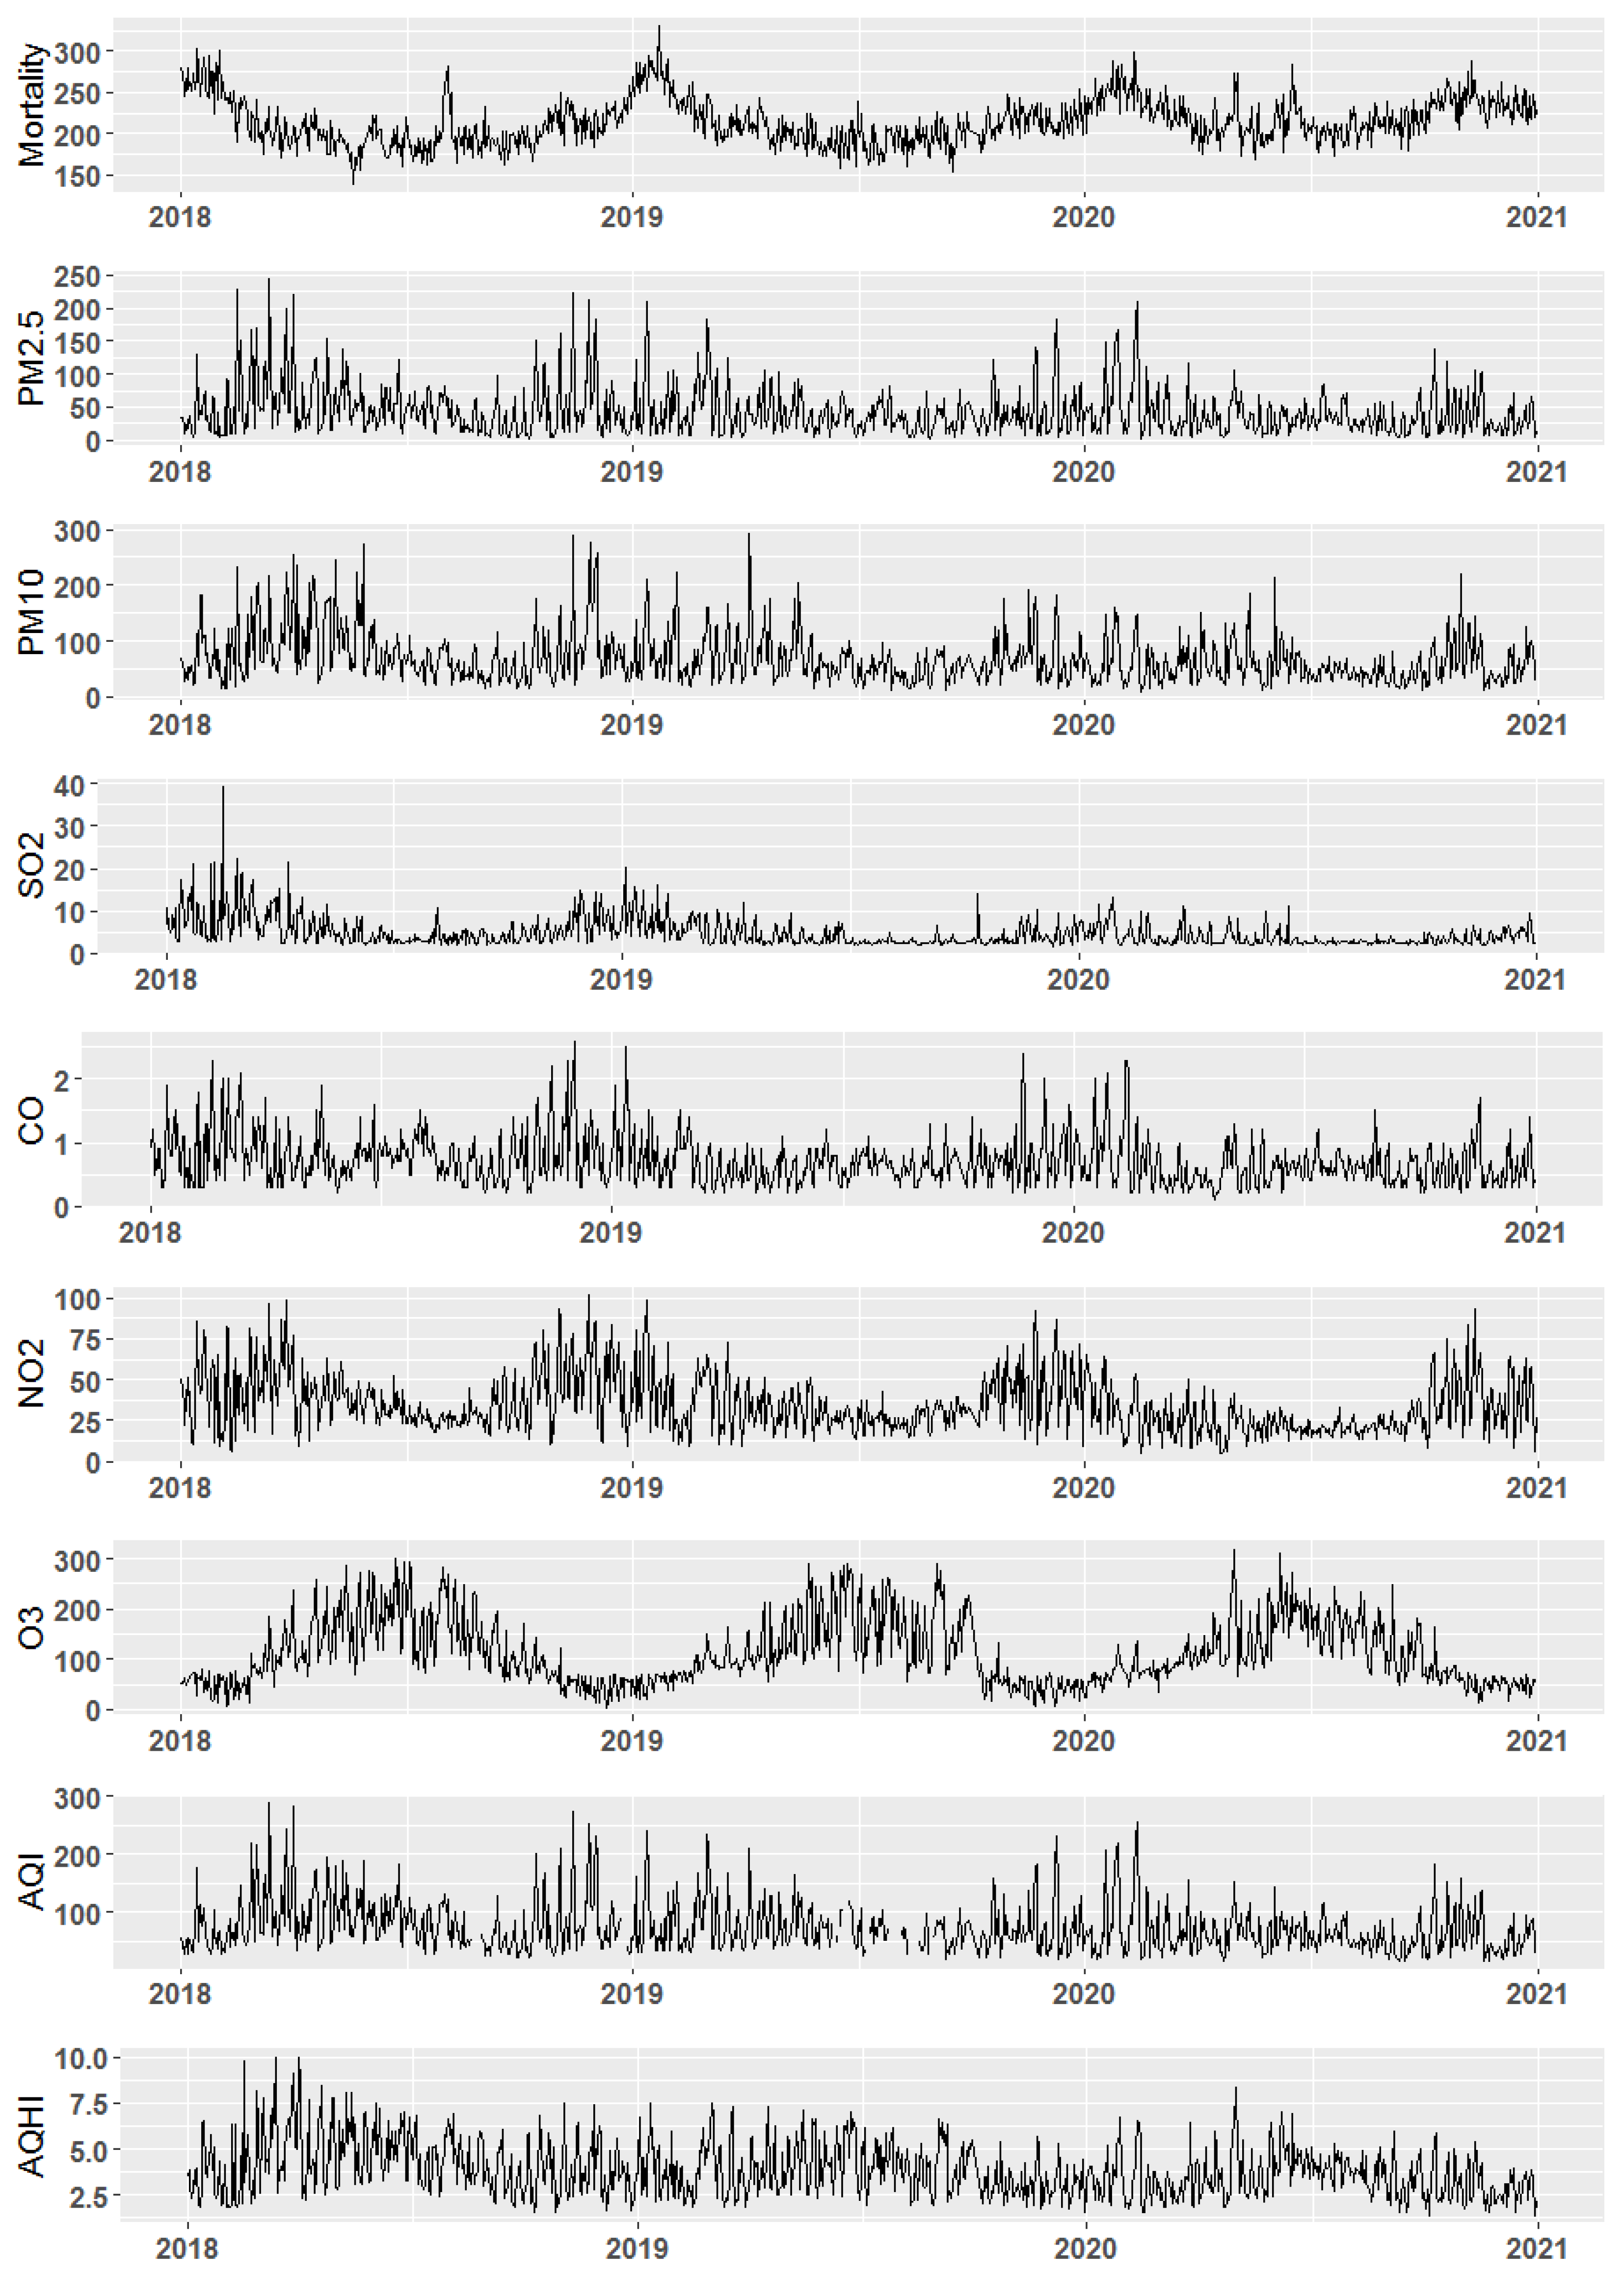
3.1. Analysis of Air Pollution in Beijing

In this study, we examined environmental, meteorological, and health data obtained from the automatic monitoring stations of the national environmental air quality monitoring network between 2018 and 2020. The descriptive statistics are summarized in Table 1. During the 3-year period, the total number of nonaccidental deaths in Beijing was 229,331, with an average daily death toll of 214. The results of the environmental data indicated that the annual average concentrations of PM10, PM2.5, O3, and NO2 were 67.87, 42.55, 112.64, and 34.34 μg/m3, respectively, which considerably exceeded the long-term exposure index values provided by the WHO in the 2021 edition of Global Air Quality Guidelines [13]. The annual average PM2.5 concentration in Beijing exceeded the national secondary standard for the annual average concentration (35 μg/m3); the annual average concentrations of PM10 and NO2 were close to the national secondary standards for their respective annual average concentrations (70 and 40 μg/m3).
Figure 1 illustrates the correlations between air pollutants and meteorological factors in Beijing. The PM10, PM2.5, SO2, CO, and NO2 concentrations were significantly positively correlated (p < 0.05). O3 was positively correlated with PM10 and PM2.5, but negatively correlated with SO2 and NO2. O3 was significantly positively correlated with the daily average temperature. SO2 and NO2 were significantly negatively correlated with the daily average temperature. PM10, PM2.5, SO2, CO, and NO2 were significantly negatively correlated with the daily average wind velocity. PM10, PM2.5, CO, NO2, and O3 were positively correlated with the daily average humidity. The results indicate that air pollution in Beijing is affected by meteorological factors and that the pollution in the city requires immediate attention.

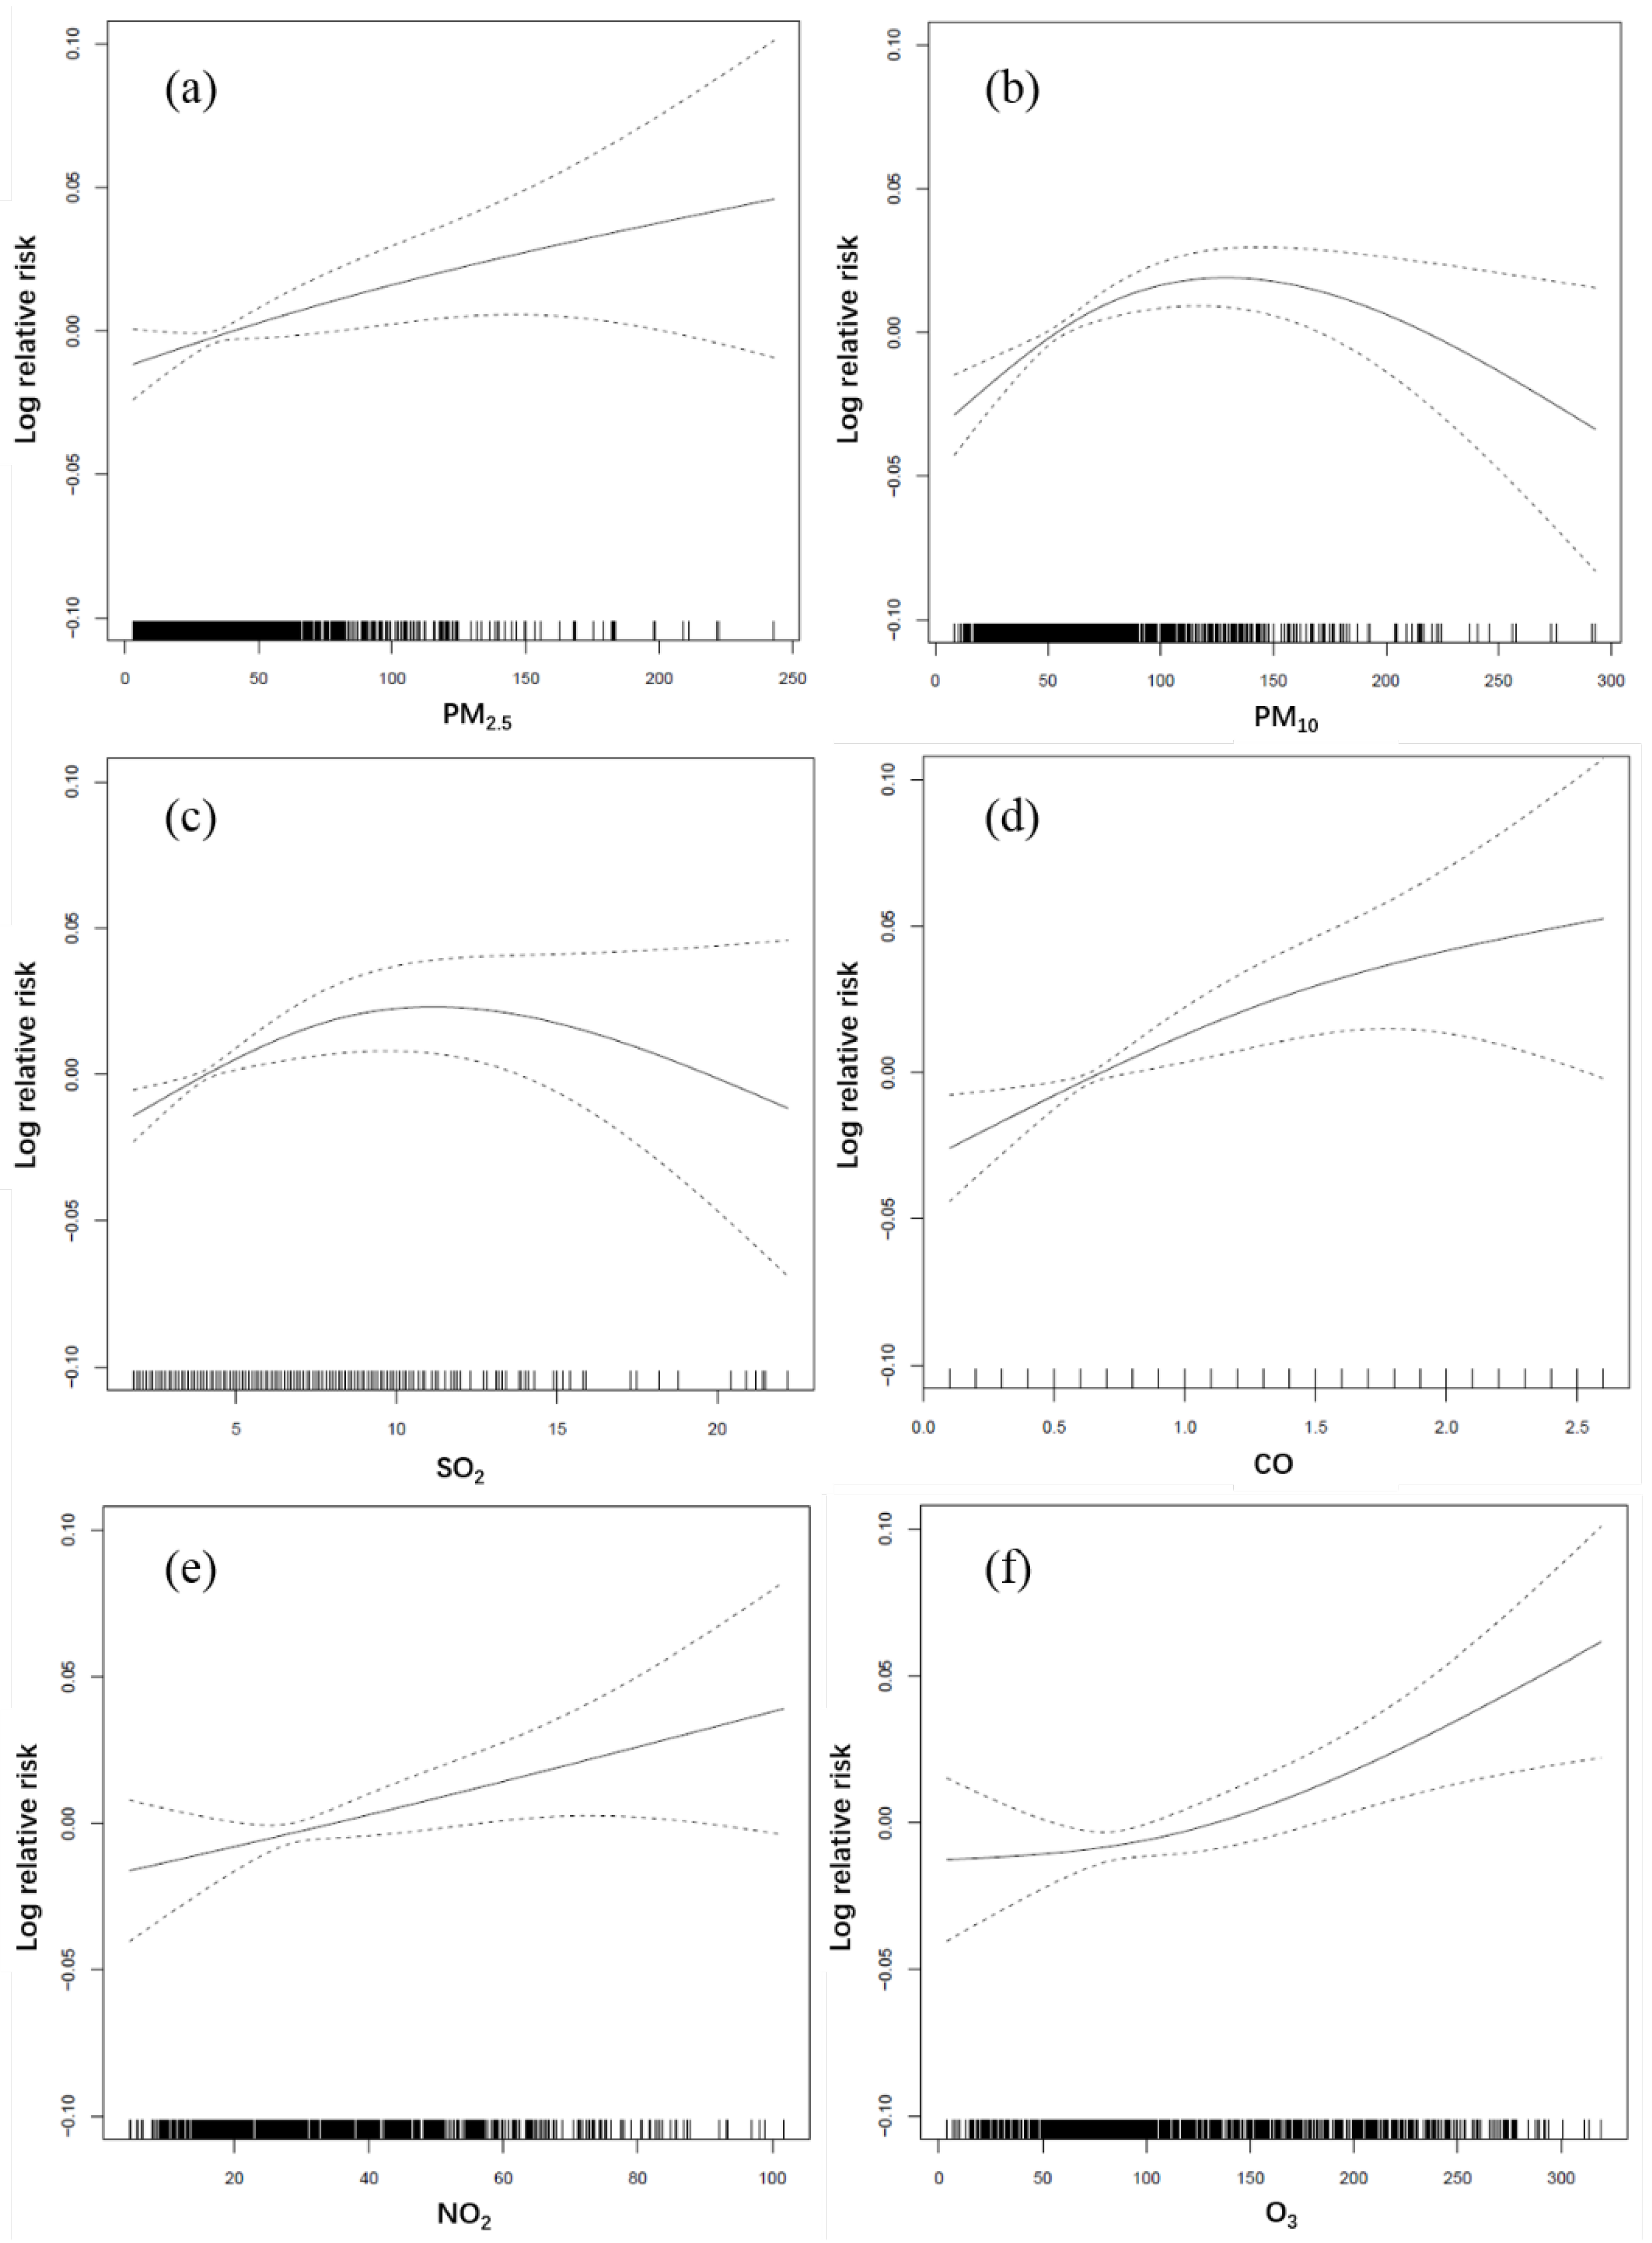
3.2. Health Effects of Air Pollutants in Beijing

To determine the health effects of pollutants in Beijing, the exposure–response relationship between air pollutants and nonaccidental mortality was analyzed in this study (Figure 2).
As depicted in Figure 2, the exposure–response relationship of PM2.5 and NO2 with nonaccidental mortality was linear. CO and O3 were positively correlated with nonaccidental mortality. However, PM10 and SO2 were nonlinear, that is, the relative risk increased at lower concentrations of PM10 and SO2, but decreased at higher concentrations. One of the possible reasons is the saturation mechanism, potential biochemical and cellular processes being saturated with small doses [35]. Another possible reason is that the sample size is small at higher concentrations, which can be presented by the wider confidence intervals. The exposure–response relationship of PM10 and SO2 with nonaccidental mortality in the P75 concentration range (85.05 and 5.65 μg/m3) was a monotonic increase, indicating that PM10 and SO2 were positively correlated with nonaccidental mortality.
PM2.5 was considered in this study. Moreover, CO was not included in the index developed in this study because of its small overall fluctuation and weak impact. Finally, four air pollutants—PM2.5, NO2, SO2, and O3—were used to construct the AQHI.

3.3. Factors Increasing the Susceptibility of the Population to the Health Effects of Air Pollution

The age, gender, education level, and disease susceptibility of the population were analyzed in accordance with the daily mortality data of citizens. The effect of each pollutant on the daily total mortality of various populations (i.e., the percentage increase in the daily total mortality of various populations resulting from a 10 μg/m3 increase in the pollutant concentrations) was calculated using the GAM. The time-series analysis results indicated the effects of the optimal lag data of air pollutants in Beijing on the daily total mortality of different populations (Table 2).
As detailed in Table 2, the effects of PM2.5, SO2, NO2, and O3 on daily total mortality were different in terms of the age, gender, education level, and disease status subgroups. The effects of PM2.5, SO2, NO2, and O3 on those aged >75 years were slightly stronger than those on individuals aged ≤75 years. The effects of PM2.5, SO2, and NO2 were two to three times stronger on women than on men, whereas the effect of O3 was slightly stronger on women than on men. The effects of PM2.5 and O3 were slightly stronger on the population with a low education level (junior high school or below) than on the population with a high education level (above junior high school). SO2 and NO2 exerted slightly stronger effects on the population with a low education level than on the population with a high education level. The effects of PM2.5, SO2, NO2, and O3 were stronger on those with chronic respiratory disease (CRD) and lung cancer (LC) than on the overall population. Many factors influence the short-term health effects of air pollution, and public health prevention measures must be implemented for susceptible groups to minimize air pollution-related health hazards.
This study revealed that women, people aged >75 years, and those with lung cancer and chronic respiratory disease are more susceptible to air pollution. Respiratory disease increases a person’s susceptibility to air pollution. A higher proportion of older adults than younger individuals has underlying chronic cardiopulmonary disease, which means that they have a higher sensitivity to air pollution. Moreover, older adults are more likely to have a lower level of physical fitness and immunity and their respiratory tract cannot remove pollutants effectively, leading to higher susceptibility. Gender differences may be attributable to the following: (1) The smoking rate of women in China is considerably lower than that of men, and some studies have reported that the effect of air pollution on nonsmokers is stronger than that on smokers [36,37]. This is because the mechanism underlying the development of PM-induced health hazards is similar to that of smoking, which leads to substantial oxidative stress and inflammatory responses; thus, additional health-related effects are not caused by air pollution. (2) From a physiological perspective, men are more likely to breathe from the abdomen, whereas women are more likely to breathe from the chest. Compared with abdominal breathing, chest breathing results in a greater deposition of pollutants in the lungs. (3) The respiratory tract reactivity of women is typically higher than that of men, and women’s respiratory tract is thus more sensitive to pollutants.

3.4. Construction of the Beijing AQHI

To ensure an accurate health risk assessment for susceptible populations, we constructed, analyzed, and compared the AQHI and specific AQHI (S-AQHI) for various populations.

3.4.1. Construction of the AQHI

A GAM was used in this study to perform a time-series analysis. In addition, the lag effect of the air pollutants on the health of the population was considered, and the regression coefficient β of the optimal lag days and the concentration of the pollutants on the day were selected. The Beijing AQHI was constructed using the method described in Section 2.2 by using the following formula:
AQHI = 10 / 17.40 × 100 × exp 0.0001945 × PM 2.5 1 + exp 0.0005228 × NO 2 1   + exp 0.000266 × O 3 1 + exp 0.0021108 × SO 2 1
Figure 3 presents the daily trends in various air pollutants, the AQI, and the AQHI in relation to the number of deaths in Beijing from 2018 to 2020. Seasonal differences were observed in the PM2.5, SO2, NO2, O3, and CO concentrations. The trend in the AQHI differed from those in the air pollutant concentrations because the index accounted for the comprehensive health effects of various air pollutants, revealing less prominent seasonal differences.
The Beijing AQHI in this study was constructed using the daily death data of citizens and is thus consistent with the Canadian AQHI, in which the frequency of obtaining an AQHI of >7 was <10%. Therefore, the Canadian classification standard was referenced in this study, wherein air quality was divided into AQHI levels ranging from 1 to 10, with a higher value indicating a higher health risk (Table 3).

3.4.2. Construction of the Specific AQHI

In this study, the S-AQHI was constructed for susceptible populations. By using the method described in Section 3.4.1, we constructed the S-AQHI for various populations in Beijing by using the following equations:
Men:
S-AQHI m a l e = 10 / 14.03 × 100 × exp 0.0001231 × PM 2.5 1 + exp 0.0002646 × NO 2 1 + exp 0.0002978 × O 3 1 + exp 0.0015811 × SO 2 1
Women:
S-AQHI f e m a l e = 10 / 24.36 × 100 × exp 0.0002343 × PM 2.5 1 + exp 0.0007776 × NO 2 1 + exp 0.0003041 × O 3 1 + exp 0.0032515 × SO 2 1
Lung cancer:
S-AQHI L C = 10 / 36.69 × 100 × exp 0.0004604 × PM 2.5 1 + exp 0.0008928 × NO 2 1 + exp 0.0003686 × O 3 1 + exp 0.0075827 × SO 2 1
Chronic respiratory disease:
S-AQHI C R D = 10 / 41.44 × 100 × exp 0.0005897 × PM 2.5 1 + exp 0.0006703 × NO 2 1 + exp 0.0007206 × O 3 1 + exp 0.0041576 × SO 2 1
Aged ≤75 years:
S-AQHI < 75 = 10 / 13.75 × 100 × exp 0.0001009 × PM 2.5 1 + exp 0.0004083 × NO 2 1 + exp 0.0002299 × O 3 1 + exp 0.0020239 × SO 2 1
Aged >75 years:
S-AQHI > 75 = 10 / 20.19 × 100 × exp 0.0002151 × PM 2.5 1 + exp 0.0005353 × NO 2 1 + exp 0.0003411 × O 3 1 + exp 0.0023619 × SO 2 1
The percentage change in the daily mortality rate for each additional unit of the AQHI and S-AQHI was calculated using a GAM. According to the results of the time-series analysis, the effects of the optimal lag data of the AQHI and S-AQHI on the daily mortality of various populations were determined (Table 4). Furthermore, the AQHI and S-AQHI in Beijing from 2018 to 2020 were calculated, and classification statistics were obtained in accordance with the classification standard described in Section 3.4.1. The results are illustrated in Figure 4.
The relative deviation in the AQHI and S-AQHI for changes in the daily mortality percentage of various specific populations ranged from 1.4% to 10.3%, representing only a slight difference (Table 4). Furthermore, as depicted in Figure 4, the classification differences between the AQHI and S-AQHI in Beijing from 2018 to 2020 were small. This finding indicated the universality of the AQHI in its capacity to predict health risks and indicated that the AQHIs of different populations in terms of age, gender, and disease status were consistent.

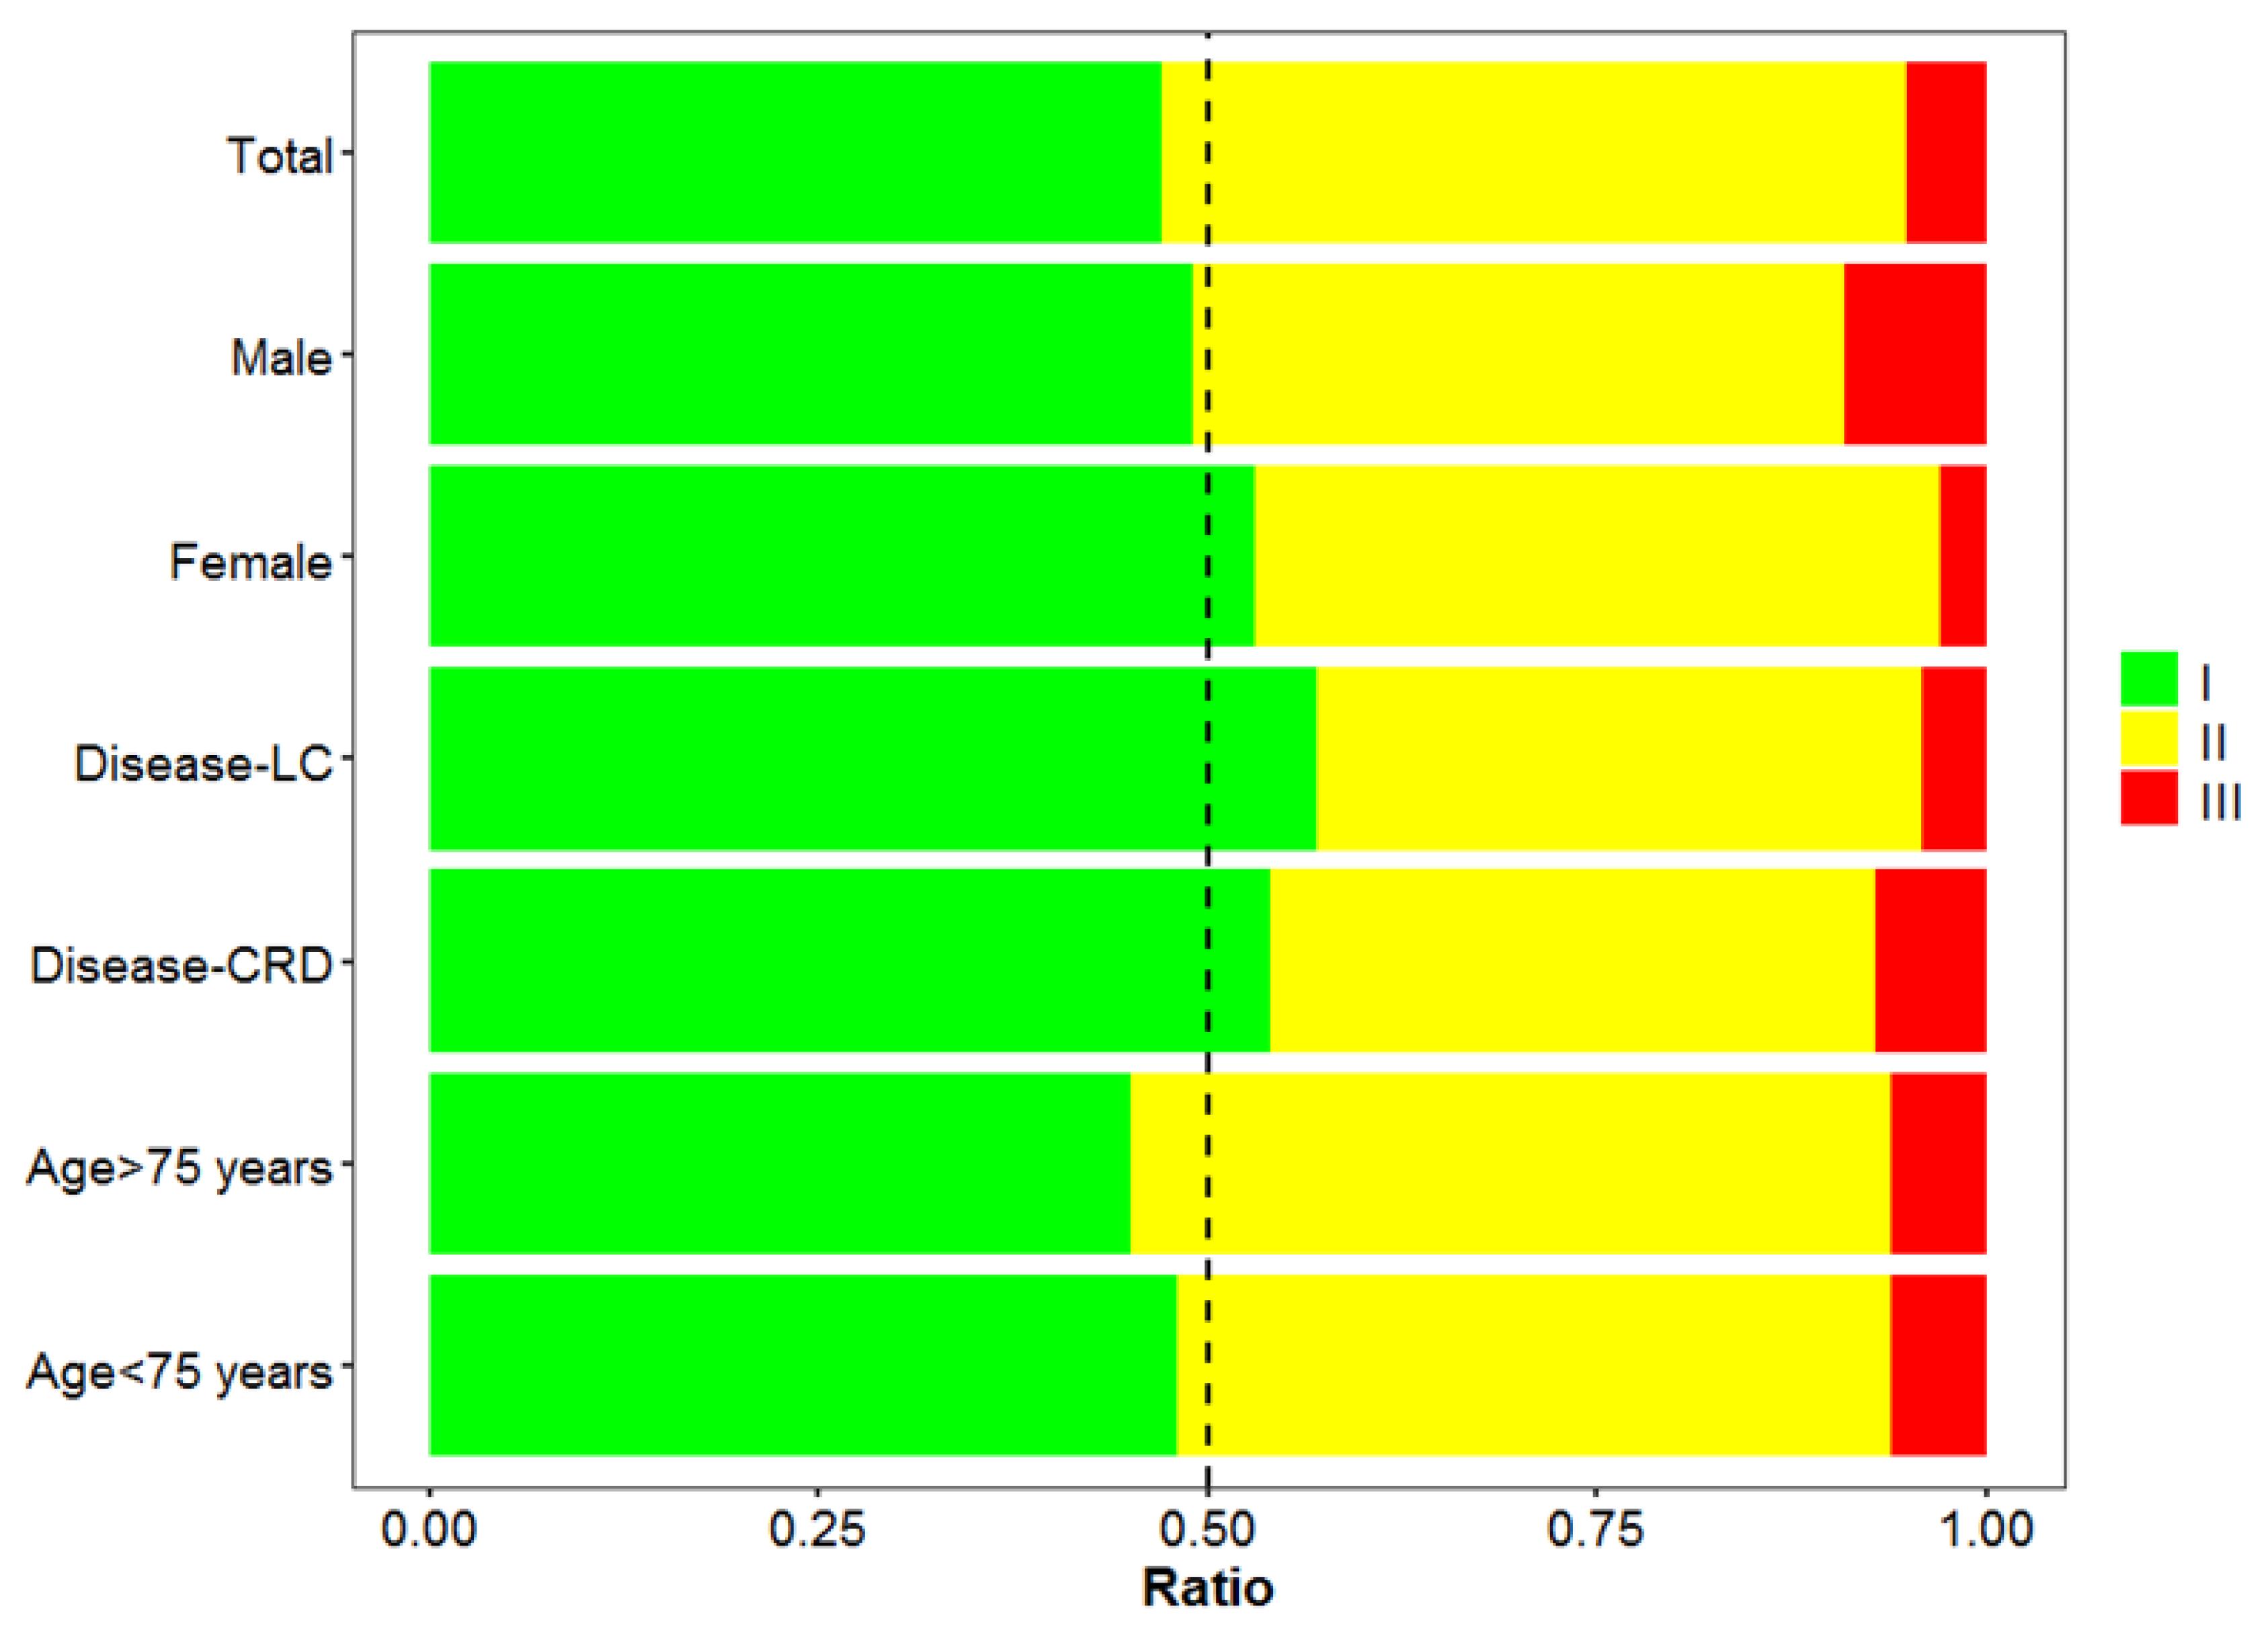
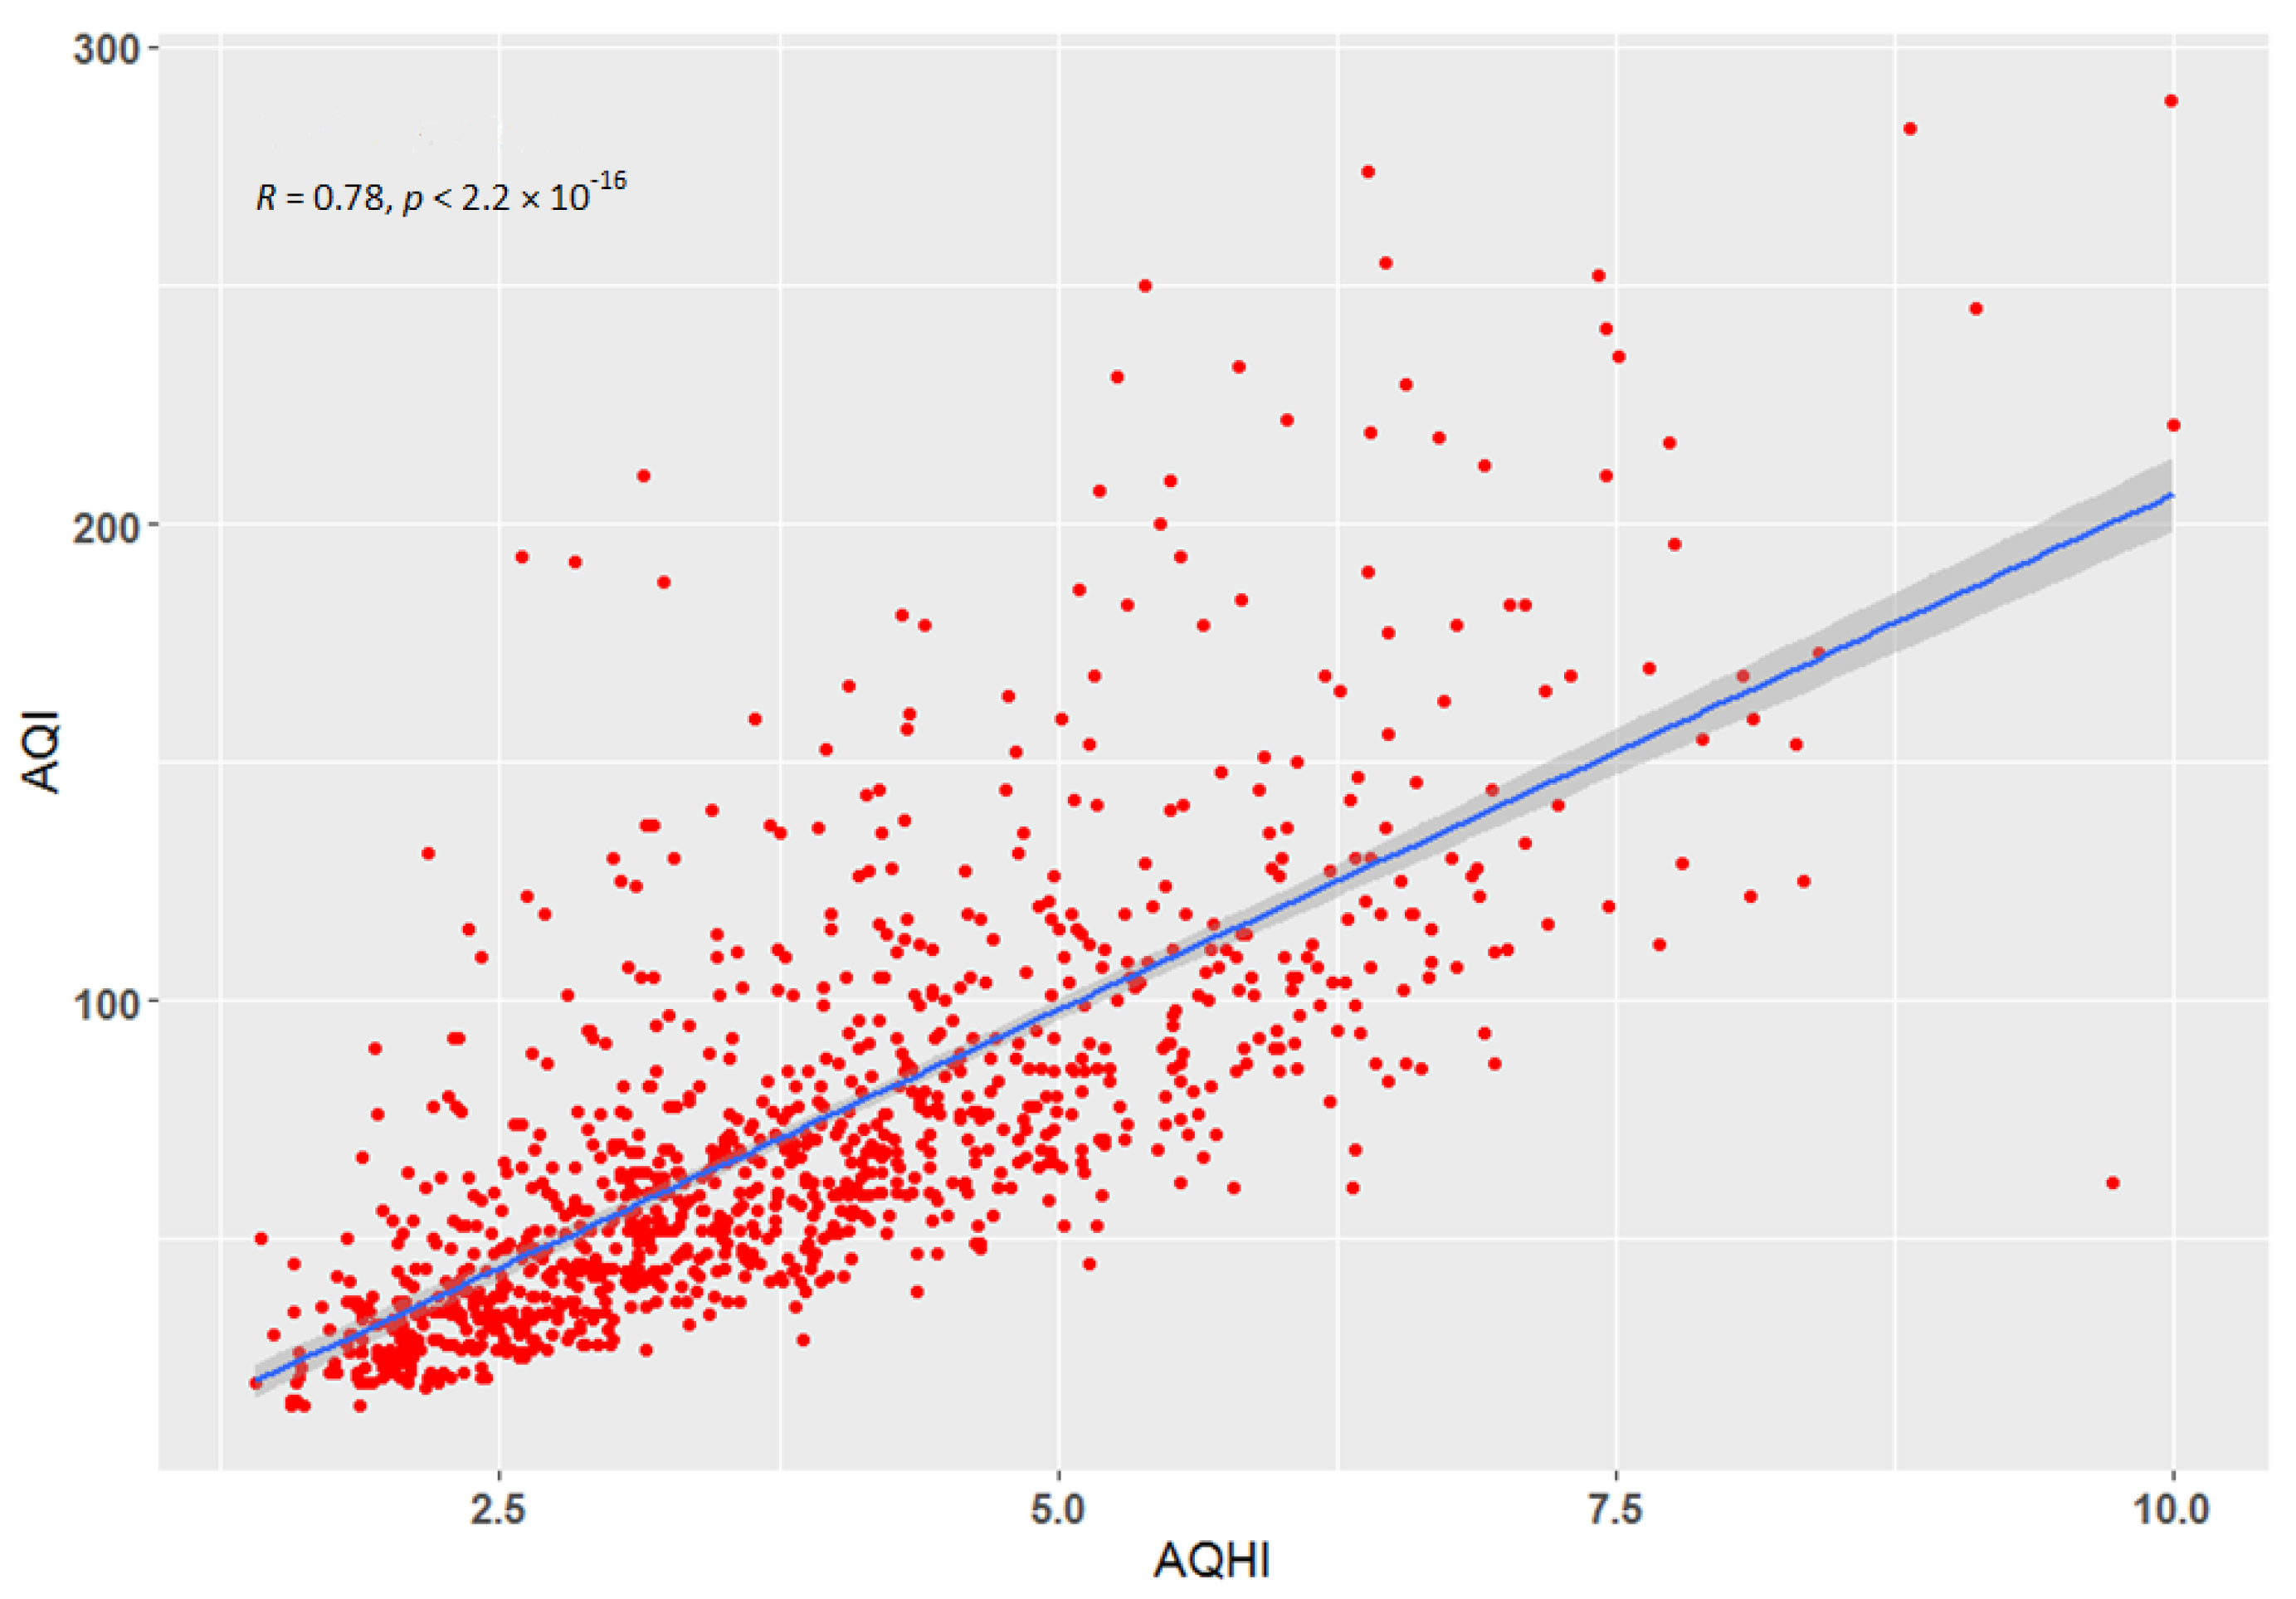
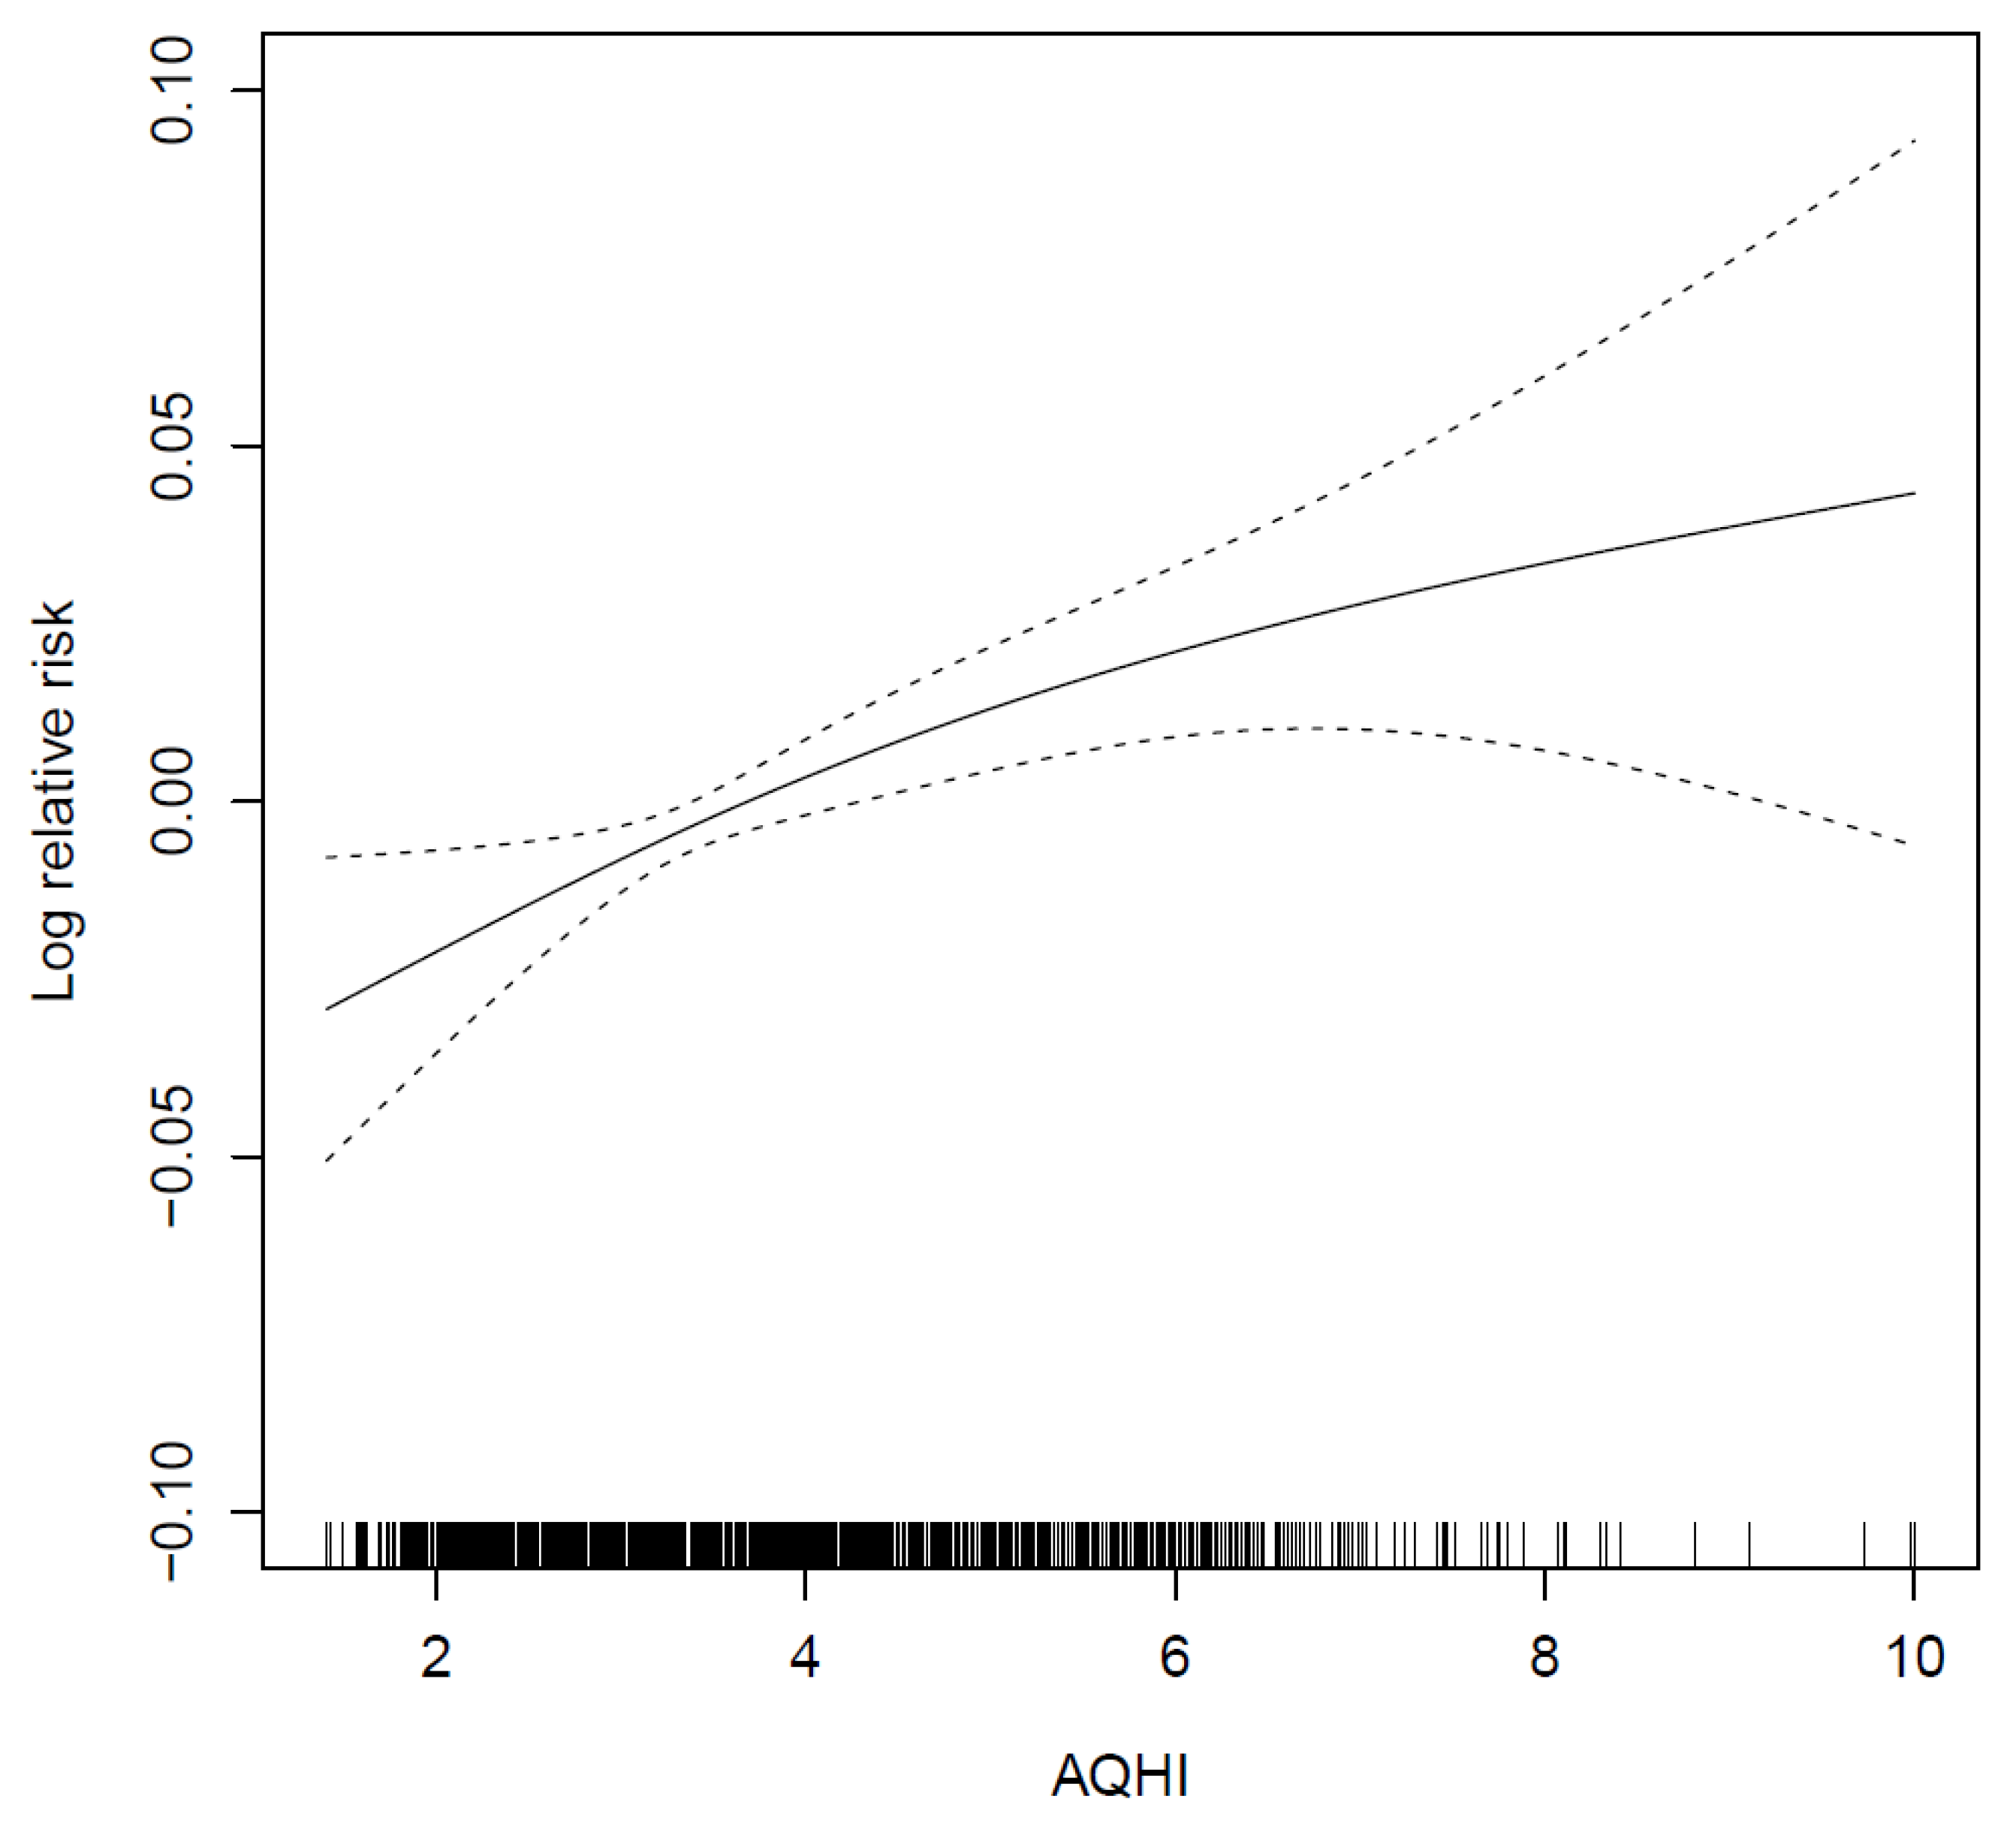
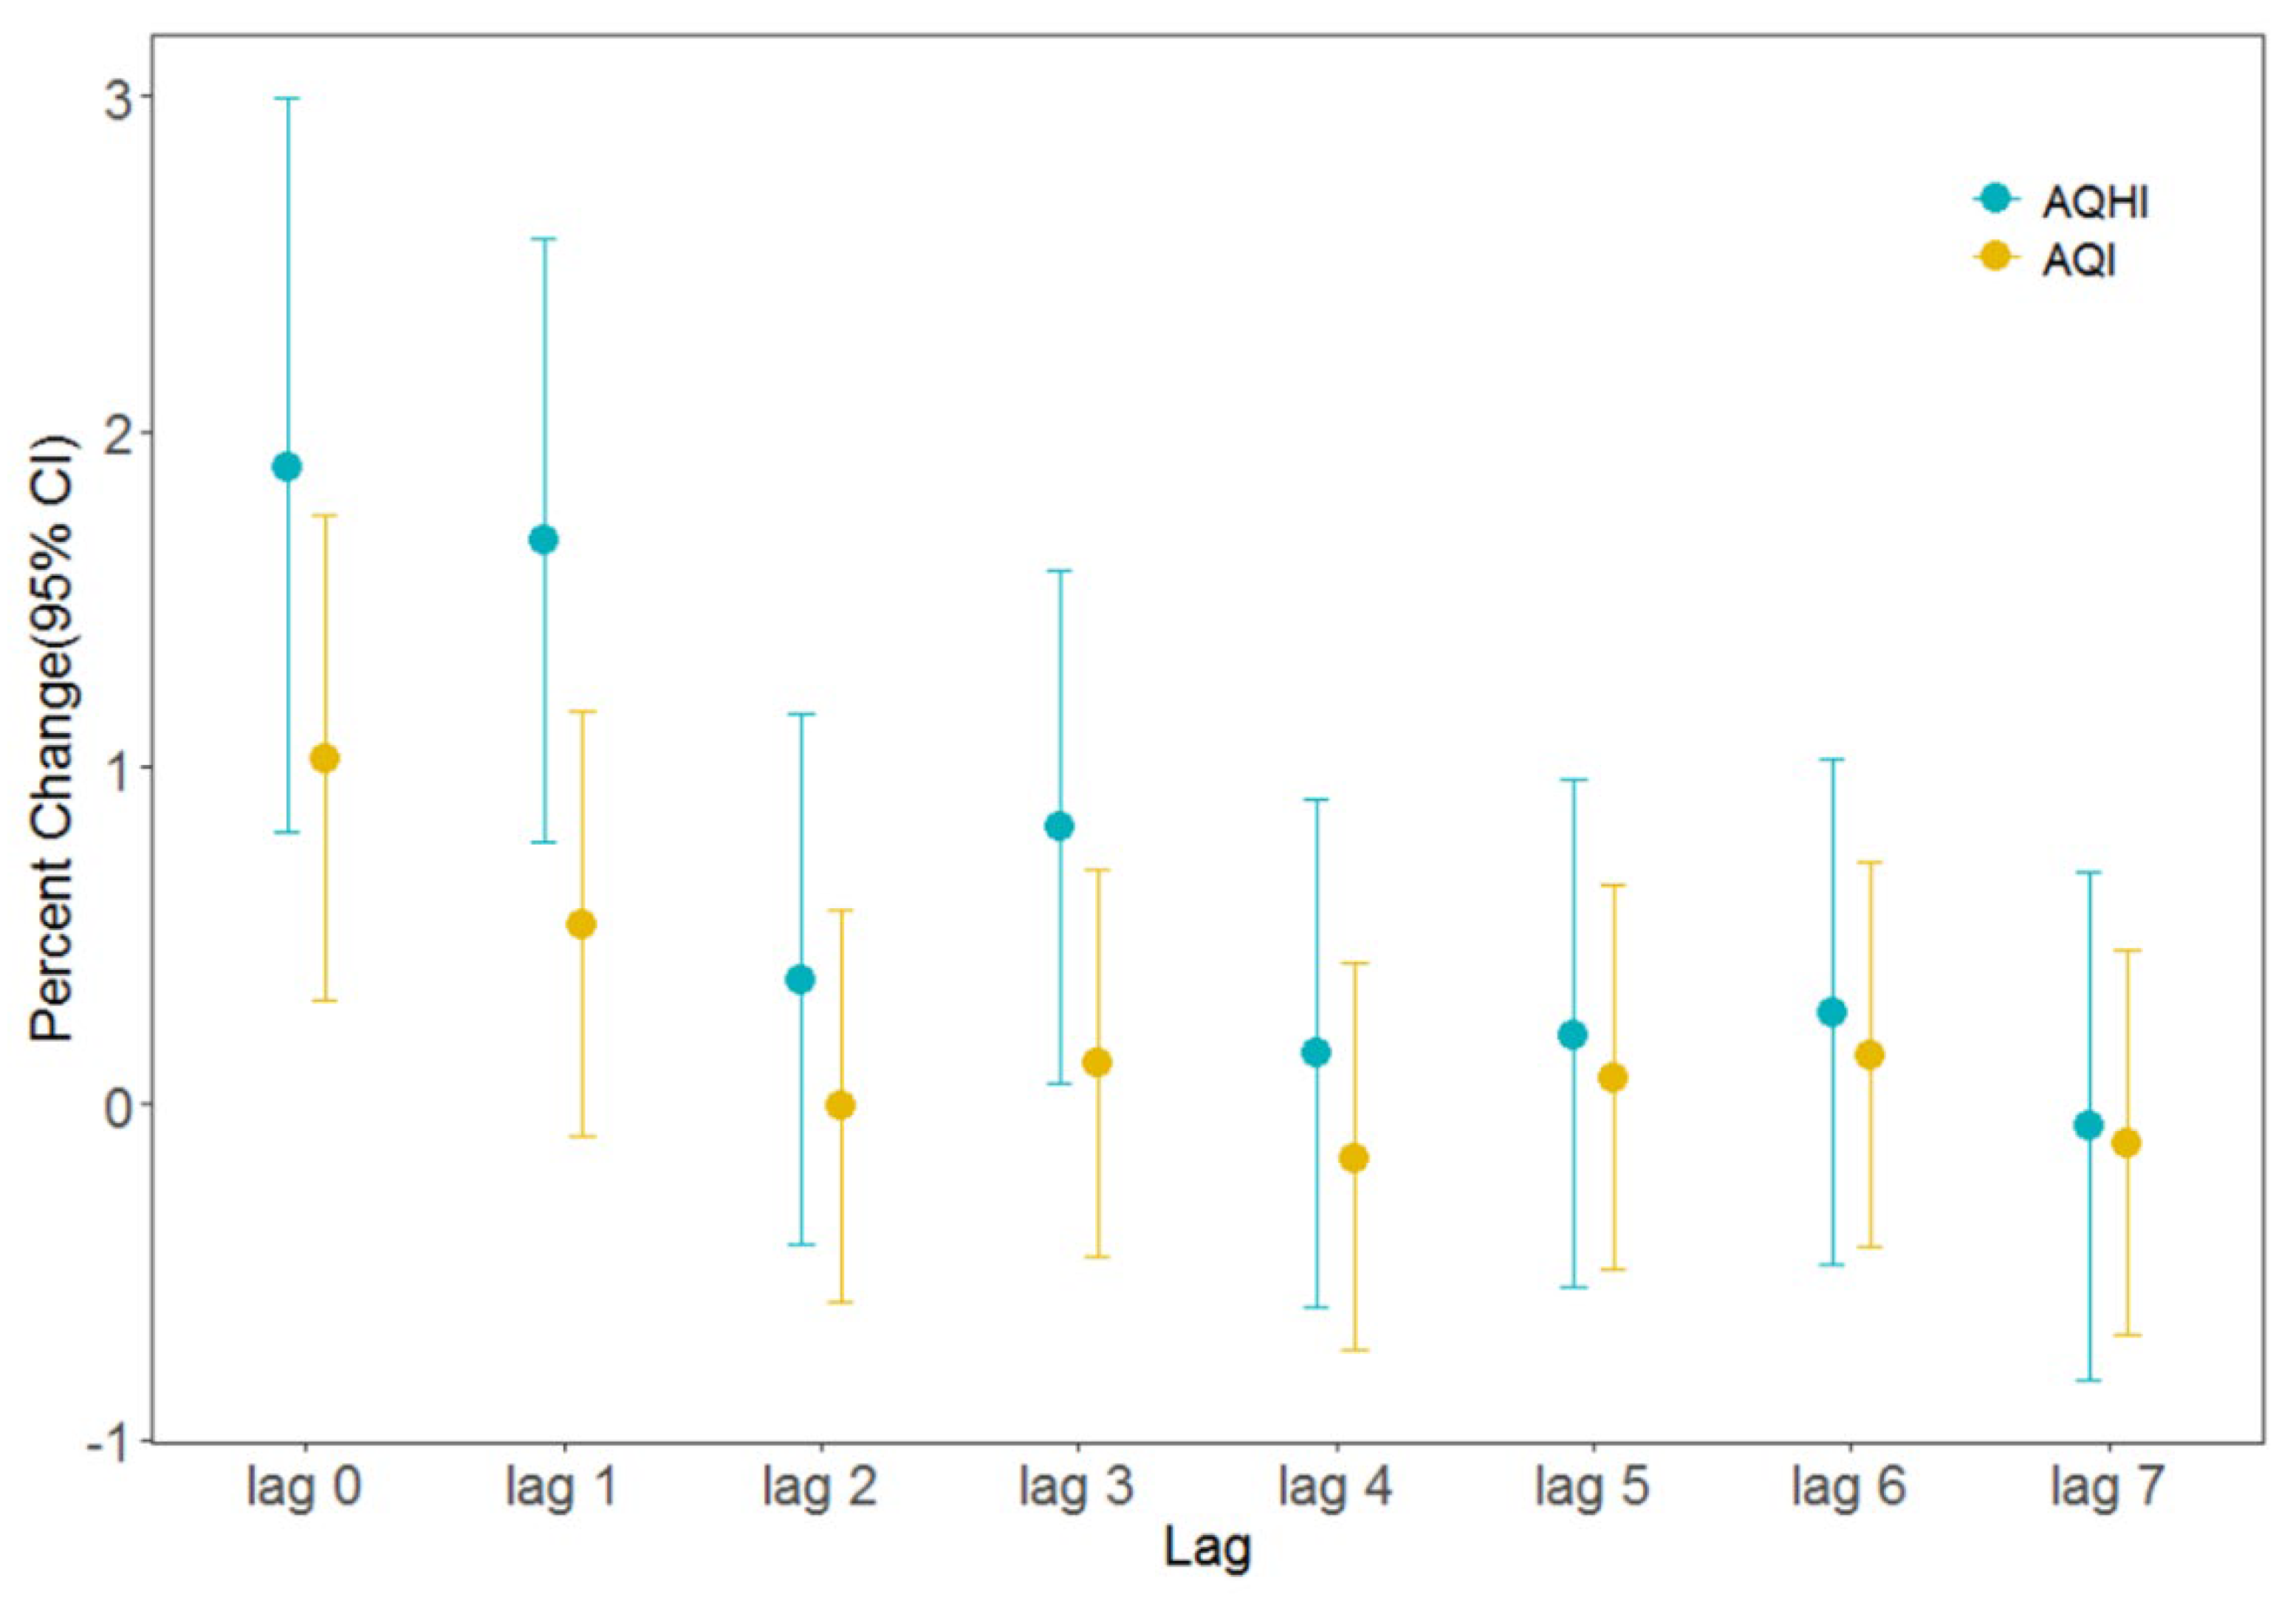
3.5. Validity Analysis of the AQHI

To evaluate the effectiveness of the AQHI, we compared it with the AQI. Table 5 summarizes the comparative statistical results of the daily AQI and AQHI in Beijing from 2018 to 2020. The P50s of the AQI and AQHI were 63 and 3.6, respectively, whereas the respective IQRs were 47 and 2.01.
The Spearman coefficient of correlation between the AQHI and AQI (Figure 5) was 0.78 (p < 0.01), which indicated a correlation; thus, the AQHI can be used for air quality and health impact assessments. Analysis of the AQHI–mortality exposure–response relationship (Figure 6) revealed a positive linear relationship between the AQHI and overall mortality risk of citizens.
In this study, the daily values of the AQHI and AQI during the study period were included separately in the time-series model. Because of differences in daily relative changes in the AQHI and AQI, the IQR was used as a measurement scale to examine the abilities of the AQHI and AQI to predict health hazards. The greater each IQR increase corresponding to an increase in total mortality, the stronger the correlation between the IQR and total mortality [26,30]. As illustrated in Figure 7, in Beijing, each IQR increase in the AQHI led to a 1.894% rise in daily mortality. Correspondingly, the excess mortality reflected in each IQR increase was considerably lower (1.029%). Accordingly, the AQHI exhibited a significantly stronger correlation with health than did the AQI; this finding reveals the superior ability of the AQHI to predict the daily mortality of citizens compared with the AQI.
The Beijing AQHI constructed in this study was compared with studies in other regions (Table 6), and the findings indicated that the relationships between air pollution and health risk in different regions and periods were quite different. However, the studies in Beijing are earlier and few of the studies have a comprehensive health effect evaluation. Therefore, in this study, an AQHI for Beijing was constructed using the health data and air pollution data (PM2.5, NO2, SO2, and O3) in recent years, and the susceptibility of different populations was analyzed, which make up for the deficiencies in the early studies. The results of this study have guiding significance for the general residents and the patients in Beijing to adopt healthy behaviors and can serve as a demonstration role in the AQHI construction of other cities in China. It provides a scientific reference for the revision and proposal of environmental air quality standards and policies and a way for the public to become aware of the importance of air pollution and its potential health effects.

4. Conclusions

In this study, an AQHI for Beijing was successfully constructed using a GAM and environmental, meteorological, and health data from 2018 to 2020. Factors increasing the susceptibility of various populations to the health effects of air pollution were determined. The results revealed that even if exposed to an identical level of air pollution, different populations responded differently. Older adults, women, and those with respiratory disease were discovered to be more susceptible to the short-term health effects of air pollution. For these susceptible groups, the S-AQHI for different populations (men, women, those with lung cancer and chronic respiratory disease, those aged >75 years, and those aged ≤75 years) was established. The results indicated that the AQHI and S-AQHI are not different in terms of changes in the percentage of daily mortality of various specific populations. This indicates the universality of the AQHI in predicting health risks and demonstrates that the construction of the S-AQHI for different age groups, genders, and diseases is unnecessary. Moreover, we discovered that the exposure–response relationship between the AQHI and total mortality risk of citizens is linear. AQHI is correlated with AQI, and the AQHI can be used for air quality and health impact assessments. Each IQR increase in the AQHI and AQI results in an increase of 1.894% and 1.029%, respectively, in total daily mortality, indicating that the AQHI is more capable than the AQI in predicting the daily mortality of citizens. This study constructed an accurate and reliable Beijing AQHI for evaluating the short-term health effects of air pollution in Beijing. In this study, health risk assessments for different populations and susceptible populations were conducted in the study area. The findings serve as a scientific reference for the revision and proposal of environmental air quality standards and policies and can be used to guide citizens and susceptible populations in adopting health-related behaviors.

Author Contributions

Conceptualization, Y.W., M.D. and M.S.; methodology, Y.W. and D.D.; software, Y.W. and X.Z.; validation, X.J. and P.Z.; formal analysis, Y.D.; investigation, Y.W. and D.D.; resources, M.D. and X.Z.; data curation, X.J. and P.Z.; writing—original draft preparation, Y.W., D.D. and M.S.; writing—review and editing, Y.W., M.D. and M.S.; supervision, M.D. and M.S.; project administration, M.D. and M.S.; funding acquisition, M.D. and M.S. All authors have read and agreed to the published version of the manuscript.

Funding

This research was funded by China’s National Key Research and Development Program, grant number 2019YFE0194500; Horizon 2020, grant number 870301; the Municipal Financial Research Project of Beijing Academy of Science and Technology, grant number 11000022T000000468149.

Institutional Review Board Statement

Not applicable.

Informed Consent Statement

Not applicable.

Data Availability Statement

Data set available on request to corresponding authors.

Acknowledgments

The researchers would like to extend sincerest gratitude to the National Center for Chronic and Noncommunicable Disease Control and Prevention for providing the daily citizen mortality data.

Conflicts of Interest

The authors declare no conflict of interest. The funders had no role in the design of the study; in the collection, analyses, or interpretation of data; in the writing of the manuscript or in the decision to publish the results.

References

  1. World Health Organization. Evolution of WHO Air Quality Guidelines: Past, Present and Future; World Health Organization: Geneva, Switzerland; Regional Office for Europe: Copenhagen, Denmark, 2017; Available online: https://apps.who.int/iris/handle/10665/341912 (accessed on 21 March 2022).
  2. World Health Organization. Ambient Air Pollution: A Global Assessment of Exposure and Burden of Disease; World Health Organization: Geneva, Switzerland, 2016; Available online: https://apps.who.int/iris/handle/10665/250141 (accessed on 21 March 2022).
  3. Babatola, S.S. Global burden of diseases attributable to air pollution. J. Public Health Afr. 2018, 9, 813. [Google Scholar] [CrossRef] [PubMed]
  4. Mathers, C.; Stevens, G.; Hogan, D.; Mahanani, W.R.; Ho, J. Disease Control Priorities: Improving Health and Reducing Poverty; World Bank: Washington, DC, USA, 2017. [Google Scholar]
  5. Brunekreef, B.; Holgate, S.T. Air pollution and health. Lancet 2002, 360, 1233–1242. [Google Scholar] [CrossRef]
  6. He, F.; Shaffer, M.L.; Rodriguez-Colon, S.; Yanosky, J.D.; Bixler, E.; Cascio, W.E.; Liao, D.P. Acute effects of fine particulate air pollution on cardiac arrhythmia: The APACR study. Environ. Health Perspect. 2011, 119, 927–932. [Google Scholar] [CrossRef]
  7. Hwang, B.F.; Lee, Y.L. Air pollution and prevalence of bronchitic symptoms among children in Taiwan. Chest 2010, 138, 956–964. [Google Scholar] [CrossRef] [PubMed]
  8. Liu, W.Y.; Yu, Z.B.; Qiu, H.Y.; Wang, J.B.; Chen, X.Y. Association between ambient air pollutants and preterm birth in Ningbo, China: A time-series study. BMC Pediatr. 2018, 18, 305. [Google Scholar] [CrossRef] [PubMed]
  9. Campbell, L.D.; Pruss, U.A. Climate change, air pollution and noncommunicable diseases. Bull. World Health Organ. 2019, 97, 160–161. [Google Scholar] [CrossRef] [PubMed]
  10. Stanaway, J.D.; Afshin, A.; Gakidou, E.; Lim, S.S.; Abate, D.; Abate, K.H.; Abbafati, C.; Abbasi, N.; Abbastabar, H.; Abd-Allah, F.; et al. Global, regional, and national comparative risk assessment of 84 behavioural, environmental and occupational, and metabolic risks or clusters of risks for195countries and territories, 1990–2017: A systematic analysis for the Global Burden of Disease Study 2017. Lancet 2018, 392, 1923–1994. [Google Scholar] [CrossRef]
  11. Yang, G.; Wang, Y.; Zeng, Y.; Gao, G.F.; Liang, X.; Zhou, M.; Wan, X.; Yu, S.; Jiang, Y.; Naghavi, M. Rapid health transition in China, 1990–2010: Findings from the Global Burden of Disease Study 2010. Lancet 2013, 381, 1987–2015. [Google Scholar] [CrossRef]
  12. Wu, Y.F.; Jin, A.; Xie, G.Q.; Wang, L.; Liu, K. The 20 most important and most preventable health problems of China: A Delphi consultation of Chinese experts. Am. J. Public Health 2018, 108, 1592–1598. [Google Scholar] [CrossRef]
  13. World Health Organization. WHO Global Air Quality Guidelines: Particulate Matter (Pm2.5 and Pm10), Ozone, Nitrogen Dioxide, Sulfur Dioxide and Carbon Monoxide; World Health Organization: Geneva, Swtizerland, 2021; Available online: https://apps.who.int/iris/handle/10665/345329 (accessed on 21 March 2022).
  14. Plaia, A.; Ruggieri, M. Air quality indices: A review. Rev. Environ. Sci. Bio/Technol. 2011, 10, 165–179. [Google Scholar] [CrossRef]
  15. Stieb, D.M.; Burnett, R.T.; Smith-Doiron, M.; Brion, O.; Shin, H.H.; Economou, V. A new multipollutant, no-threshold air quality health index based on short-term associations observed in daily time-series analyses. J. Air Waste Manag. Assoc. 2008, 58, 435–450. [Google Scholar] [CrossRef] [PubMed]
  16. Chen, R.J.; Chen, B.H.; Kan, H.D. Air quality health index in China: A pilot study. China Environ. Sci. 2013, 33, 2081–2086. [Google Scholar] [CrossRef]
  17. Li, X.; Xiao, J.P.; Lin, H.L.; Liu, T.; Qian, Z.M.; Zeng, W.L.; Guo, L.C.; Ma, W.J. The construction and validity analysis of AQHI based on mortality risk: A case study in Guangzhou, China. Environ. Pollut. 2017, 220, 487–494. [Google Scholar] [CrossRef]
  18. Cairncross, E.K.; John, J.; Zunckel, M. A novel air pollution index based on the relative risk of daily mortality associated with short-term exposure to common air pollutants. Atmos. Environ. 2007, 41, 8442–8454. [Google Scholar] [CrossRef]
  19. Mason, T.G.; Schooling, C.M.; Chan, K.P.; Tian, L.W. An evaluation of the air quality health index program on respiratory diseases in Hong Kong: An interrupted time series analysis. Atmos. Environ. 2019, 211, 151–158. [Google Scholar] [CrossRef]
  20. Spurr, K.; Pendergast, N.; MacDonald, S. Assessing the use of the Air Quality Health Index by vulnerable populations in a ‘Lowrisk’ region: A pilot study. Can. J. Respir. Ther. 2014, 50, 45–49. Available online: https://www.ncbi.nlm.nih.gov/pmc/articles/PMC4456833/ (accessed on 21 March 2022).
  21. To, T.; Feldman, L.; Simatovic, J.; Gershon, A.S.; Dell, S.; Su, J.D.; Foty, R.; Licskai, C. Health risk of air pollution on people living with major chronic diseases: A Canadian population-based study. BMJ Open 2015, 5, 9075. [Google Scholar] [CrossRef]
  22. Olstrup, H. An air quality health index (AQHI) with different health outcomes based on the air pollution concentrations in Stockholm during the period of 2015–2017. Atmosphere 2020, 11, 192. [Google Scholar] [CrossRef]
  23. Fan, L. Preliminary Establishment of an Air Quality Health Index Based on the Relationship between Exposure to Air Pollution and Years of Life Lost; Tianjin Medical University: Tianjin, China, 2019. [Google Scholar]
  24. Liao, T.T.; Jiang, W.T.; Ouyang, Z.W.; Hu, S.X.; Wu, J.Q.; Zhao, B.; Wang, B.H.; Wang, S.G.; Sun, Y. Evaluation of the health risk of air pollution in major Chinese cities using a risk-based, multi-pollutant air quality health index during 2014–2018. Air Qual. Atmos. Health 2021, 14, 1605–1617. [Google Scholar] [CrossRef]
  25. Zhang, L.J.; Xu, H.H.; Guo, C.Y.; Chen, J.; Dong, C.Y.; Zhang, J.H.; Shi, Y.W.; Xu, D.; Ling, L.M.; Zhang, B.; et al. Constructing an air quality health index for children: A case study in Shanghai, China. Atmos. Environ. 2021, 267, 118765. [Google Scholar] [CrossRef]
  26. Huang, W.Z.; He, W.Y.; Knibbs, L.D.; Jalaludin, B.; Guo, Y.M.; Morawska, L.; Heinrich, J.; Chen, D.H.; Yu, Y.J.; Zeng, X.W.; et al. Improved morbidity-based air quality health index development using Bayesian multi-pollutant weighted model. Environ. Res. 2022, 204, 112397. [Google Scholar] [CrossRef] [PubMed]
  27. Chen, R.J. The Health Effects of Complex Air Pollution in 17 Chinese Cities; Fudan University: Shanghai, China, 2013. [Google Scholar]
  28. Zhang, J.Y.; Guo, Y.M.; Meng, H.Y.; Jia, Y.P.; Luo, F.J.; Pan, X.C. A time-series study on the relationship between air pollution and citizens’ daily deaths in Chaoyang District, Beijing. Environ. Health. 2010, 27, 797–800. [Google Scholar] [CrossRef]
  29. Chen, R.J.; Li, Y.; Ma, Y.J.; Pan, G.W.; Zeng, G.; Xu, X.H.; Chen, B.H.; Kan, H.D. Coarse particles and mortality in three Chinese cities: The China Air Pollution and Health Effects Study (CAPES). Sci. Total Environ. 2011, 409, 4934–4938. [Google Scholar] [CrossRef] [PubMed]
  30. Du, X.H.; Chen, R.J.; Meng, X.; Liu, C.; Niu, Y.; Wang, W.D.; Li, S.Q.; Kan, H.D.; Zhou, M.G. The establishment of National Air Quality Health Index in China. Environ. Int. 2020, 138, 105594. [Google Scholar] [CrossRef]
  31. Chen, R.J.; Yin, P.; Meng, X.; Wang, L.J.; Liu, C.; Niu, Y.; Lin, Z.J.; Liu, Y.N.; Liu, J.M.; Qi, J.L.; et al. Associations between ambient nitrogen dioxide and daily cause-specific mortality evidence from 272 Chinese cities. Epidemiology 2018, 29, 482–489. [Google Scholar] [CrossRef]
  32. Qian, Z.; He, Q.; Lin, H.M.; Kong, L.; Liao, D.; Dan, J.; Bentley, C.M.; Wang, B. Association of daily cause-specific mortality with ambient particle air pollution in Wuhan, China. Environ. Res. 2007, 105, 380–389. [Google Scholar] [CrossRef]
  33. Welty, L.; Zeger, S.L. Are the acute effects of particulate matter on mortality in the National Morbidity, Mortality, and Air Pollution Study the result of inadequate control for weather and season? A sensitivity analysis using flexible distributed lag models. Am. J. Epidemiol. 2005, 162, 80–88. [Google Scholar] [CrossRef]
  34. Teng, B.; Zhang, X.L.; Yi, C.H.; Zhang, Y.; Ye, S.F.; Wang, Y.F. The association between ambient air pollution and allergic rhinitis: Further epidemiological evidence from Changchun, Northeastern China. Int. J. Environ. Res. Public Health. 2017, 14, 226. [Google Scholar] [CrossRef]
  35. Pope, C.A.; Burnett, R.T.; Krewski, D.; Jerrett, M.; Shi, Y.; Calle, E.E.; Thun, M.J. Cardiovascular mortality and exposure to airborne fine particulate matter and cigarette smoke shape of the exposure-response relationship. Circulation 2009, 120, 941–948. [Google Scholar] [CrossRef]
  36. Gu, D.F.; Kelly, T.N.; Wu, X.G.; Chen, J.; Samet, J.M.; Huang, J.F.; Zhu, M.L.; Chen, J.C.; Chen, C.S.; Duan, X.F.; et al. Mortality attributable to smoking in China. N. Engl. J. Med. 2009, 360, 1911. [Google Scholar] [CrossRef]
  37. Künzli, N.; Jerrett, M.; Mack, W.J.; Beckerman, B.; Labree, L.; Gillil, F.; Thomas, D.; Peters, J.; Hodis, H.N. Ambient air pollution and atherosclerosis in Los Angeles. Environ. Health Perspect. 2005, 113, 201–206. [Google Scholar] [CrossRef] [PubMed]
  38. Shang, Y.; Sun, Z.W.; Cao, J.J.; Wang, X.M.; Zhong, L.J.; Bi, X.H.; Li, H.; Liu, W.X.; Zhu, T.; Huang, W. Systematic review of Chinese studies of short-term exposure to air pollution and daily mortality. Environ. Int. 2013, 54, 100–111. [Google Scholar] [CrossRef] [PubMed]
  39. Qian, Z.M.; He, Q.C.; Lin, H.M.; Kong, L.L.; Liao, D.P. Short-term effects of gaseous pollutants on cause-specific mortality in Wuhan, China. J. Air Waste Manag. Assoc. 2007, 57, 785–793. [Google Scholar] [CrossRef] [PubMed]
  40. Tao, Y.B.; Huang, W.; Huang, X.L.; Zhong, L.J.; Lu, S.E.; Li, Y.; Dai, L.Z.; Zhang, Y.H.; Zhu, J. Estimated acute effects of ambient ozone and nitrogen dioxide on mortality in the Pearl River Delta of Southern China. Environ. Health Perspect. 2012, 120, 393–398. [Google Scholar] [CrossRef] [PubMed]
  41. Chen, R.; Pan, G.; Kan, H.; Tan, J.; Song, W.; Wu, Z.; Xu, X.; Xu, Q.; Jiang, C.; Chen, B. Ambient air pollution and daily mortality in Anshan, China: A time-stratified case-crossover analysis. Sci. Total Environ. 2010, 408, 6086–6091. [Google Scholar] [CrossRef]
Figure 1. Correlation matrix analysis of environmental variables in Beijing (2018−2020); the strongest correlation is indicated in red, followed by yellow, with the weakest indicated in blue.
Atmosphere 13 01370 g001
Figure 2. Exposure−response relationship of air pollutant concentrations with nonaccidental mortality in Beijing (2018−2020): (a) PM2.5; (b) PM10; (c) SO2; (d) CO; (e) NO2; (f) O3. The solid line represents the log relative risk of mortality, and the dashed lines represent the 95% confidence interval of the log relative risk.
Atmosphere 13 01370 g002
Figure 3. Daily trends in air pollutant concentrations, number of deaths, the AQI, and the AQHI in Beijing from 2018 to 2020.
Atmosphere 13 01370 g003
Figure 4. Comparison of the AQHI and S-AQHI classification statistics in Beijing from 2018 to 2020.
Atmosphere 13 01370 g004
Figure 5. Correlation between the AQHI and AQI.
Atmosphere 13 01370 g005
Figure 6. Exposure–response relationship curve for the association between the AQHI and total mortality rate of citizens.
Atmosphere 13 01370 g006
Figure 7. Comparison of the correlations of the AQHI and AQI with daily mortality in Beijing (2018−2020).
Atmosphere 13 01370 g007
Table 1. Summary of environmental variables and daily nonaccidental deaths in Beijing from 2018 to 2020.
VariablesMeanSDMinP25MedianP75MaxIQR
PM2.5 (μg/m3)42.5536.28316.753355.45242.938.7
PM10 (μg/m3)67.8745.28.435.5556.185.05292.949.5
SO2 (μg/m3)4.683.31.82.63.35.6539.13.05
CO (mg/m3)0.70.380.10.40.60.92.60.5
NO2 (μg/m3)34.3417.494.421.7529.744.25101.722.5
O3 (μg/m3)112.6466.013.863.8591.9158.95319.295.1
AVET (°C)13.7111.43−17.82.614.324.632.422
Wind (mph)4.571.910.53.14.35.512.82.4
AVEH (%)49.0818.71113449649430
Mortality2142813819421023133137
Table 2. Effects of air pollutants on the daily mortality of various populations in Beijing (%).
Population ClassificationPM2.5SO2NO2O3
Overall0.195 (0.002, 0.387)2.133 (0.235, 4.067)0.524 (0.037, 1.014)0.266 (0.144, 0.389)
75 years and younger0.101 (−0.175, 0.378)2.045 (−0.530, 4.686)0.409 (−0.169, 0.991)0.230 (0.058, 0.403)
Older than 75 years0.215 (−0.028, 0.459)2.390 (0.016, 4.820)0.537 (−0.080, 1.157)0.342 (0.183, 0.500)
Men0.123 (−0.116, 0.363)1.594 (−0.619, 3.855)0.265 (−0.341, 0.874)0.298 (0.132, 0.464)
Women0.235 (−0.034, 0.504)3.305 (0.657, 6.023)0.781 (0.217, 1.347)0.305 (0.096, 0.513)
Low education level0.184 (−0.047, 0.416)1.861 (−0.271, 4.038)0.448 (−0.034, 0.933)0.338 (0.158, 0.517)
High education level0.142 (−0.154, 0.439)2.948 (0.009, 5.973)0.794 (0.042, 1.553)0.245 (0.059, 0.431)
Cardiovascular disease0.181 (−0.092, 0.455)1.648 (−1.028, 4.397)0.505 (−0.190, 1.205)0.369 (0.156, 0.583)
Lung cancer0.461 (0.056, 0.868)7.878 (2.148, 13.929)0.897 (−0.286, 2.093)0.369 (0.025, 0.715)
Chronic respiratory disease0.591 (−0.050, 1.238)4.245 (−1.435, 10.253)0.673 (−0.405, 1.761)0.723 (0.300, 1.148)
Table 3. AQHI classification standards.
AQHIHealth Risk LevelWarning ColorSusceptible PopulationGeneral Population
0–3LowGreenNormal outdoor activitiesNormal outdoor activities
4–6ModerateYellowReduction in outdoor activities is requiredReduction in daily outdoor activities is not required
7–10HighRedOlder adults, children, and the susceptible population must reduce their outdoor activitiesIndividuals with symptoms such as coughing and sore throat must reduce their outdoor activities
>10SevereBrownOlder adults, children, and the susceptible population must avoid outdoor activitiesAll populations must reduce their outdoor activities
Table 4. Effects of the AQHI and S-AQHI on daily mortality in various populations in Beijing (%).
ClassificationAQHIS-AQHI
Overall0.938 (0.401, 1.477)——
Men0.850 (0.177, 1.528)0.938 (0.388, 1.490)
Women1.254 (0.511, 2.002)1.182 (0.411, 1.958)
≤75 years0.730 (0.103, 1.360)0.765 (0.130, 1.405)
>75 years1.196 (0.523, 1.873)1.236 (0.563, 1.912)
Lung cancer1.579 (0.497, 2.674)1.557 (0.497, 2.628)
Chronic respiratory disease1.140 (−0.148, 2.444)1.175 (−0.076, 2.442)
Table 5. Comparative statistics of the AQI and AQHI in Beijing from 2018 to 2020.
IndexMeanSDMinP25P50P75MaxIQR
AQI72.7542.751543639028947
AQHI3.851.461.412.713.64.72102.01
Table 6. Summary of studies on β coefficient of exposure–response relationship of pollutants.
RegionPeriodPM10PM2.5O3SO2NO2Reference
Beijing2018–2020——0.00019450.0002660.00211080.0005228This research
Beijing2001–20100.000260.000470.00032————[27]
Beijing2004–20080.00025————0.000470.00055[28]
Beijing2007–2008——0.00053——————[29]
China2013–2015——0.0001870.000119——0.000675[30]
China2002–2012——0.000380.00048————[38]
China2001–20100.00019——————0.00061[27]
Tianjin2014–20170.0001850.0002340.0005580.0007400.000476[23]
Shanghai2001–20100.000850.000190.00031————[27]
Guangzhou2012–2015——0.0000920.0000360.0002510.000148[17]
Wuhan2000–2004————0.000220.000010.00143[39]
Pearl river delta2006–20080.00079——0.00081——0.00195[40]
Anshan2004–20050.00024————0.000270.00130[41]
Publisher’s Note: MDPI stays neutral with regard to jurisdictional claims in published maps and institutional affiliations.

