1. Introduction
China is the largest country that produces and exports coke. China produced 464.46, 471.16, and 471.26 million tons of coke and exported 6.4493, 3.4891, and 6.5251 million tons of coke in 2021, 2020, and 2019, respectively [
1]. Independent coking accounts for 65% of the Chinese coking industry [
2], which consumes a large amount of fuel and emits large quantities of various air pollutants (e.g., SO
2, NO
X, PM
10) annually [
3,
4,
5]. Although independent coking does not make the greatest contribution of Chinese industry to national air pollution, its emission intensity is relatively high [
4]. Moreover, its emissions not only contribute to atmospheric environmental degradation such as haze events and acid rain [
6], but also cause human health problems. That is, the polycyclic aromatic hydrocarbons produced in coke ovens are highly toxic and carcinogenic [
4,
7,
8,
9]. Although some researchers were trying to use eco-friendly potential catalysts to mitigate the harm caused by related pollutants to humans, the emission characteristics are yet to be explored [
10,
11,
12,
13,
14]. To overcome these problems, it is necessary to explore the emission characteristics and spatial distribution of China’s independent coking industry.
To resolve the problems of air pollution associated with the coking industry in China, the Chinese government has issued a series of policy documents. In June 2012, the State Environmental Protection Administration of the People’s Republic of China promulgated the “Emission Standard of Pollutants for the Coking Chemical Industry (GB 16171-2012),” which was more stringent than the previous standard (i.e., GB 16171-1996) by lowering the emission limits as much as 67–95% and 60–80% for PM and SO
2, respectively, and adds the emission limits for NO
X [
15]. In March 2014, the Ministry of Industry and Information Technology of China issued the “Access Conditions for the Coking Industry (Revised in 2014),” which proposed restrictions on production processes, production layout, and processing equipment of coking enterprises and required coking enterprises to regulate the discharge of their pollutants. Another measure required that coke oven chimneys be operated with a continuous pollutant emission monitoring system (CEMS) connected to the environmental protection authority in accordance with regulations [
16]. In September 2017, the State Environmental Protection Administration issued the “Technical Specification for Application and Issuance of Pollutant Permits for the Coking Chemical Industry (HJ854-2017),” which formulated a series of environmental management requirements such as the necessity for coking enterprises to apply for emission permits, recognize permitted emission limits, and perform actual emission accounting [
17]. In April 2019, the Ministry of Ecological Environment of the People’s Republic of China (MEE) promulgated a set of ultralow emissions (ULE) standards that reduce the 2012 standards by 33–90%, 50–100% and 70% for PM, SO
2 and NO
X, respectively [
18]. The release of these policy documents effectively promoted the reduction of pollutant emissions by the coking industry.
The coking industry can be divided into two categories: coking enterprises attached to iron and steel enterprises, and independent coking enterprises. Independent coking enterprises accounted for 65% of the entire coking industry in China in 2020 [
2]. However, most studies ignore the analysis and research on the emission characteristics of independent coking enterprises. Researchers applied the bottom-up emission factor method to estimate the emissions of various pollutants by China’s coking industry in 2015 [
3], while they did not provide a comprehensive understanding in the analysis of independent coking enterprises. Studies also estimated the emissions of typical pollutants associated with China’s coking industry, e.g., VOC
S [
19], SO
2 [
20], and OC [
21]; however, their emission factors relied on the references which could not reflect the real emission. Coking companies are also often considered affiliated enterprises in the iron and steel industry when studying the emission characteristics of air pollutants [
6,
22,
23,
24,
25], which means that such studies cannot access the emission characteristics of the independent coking industry in China.
China’s energy consumption structure remains dominated by coal [
26], which leads to the homology of China’s CO
2 emissions and conventional air pollutant emissions [
27]. In 2020, China announced the goals of realizing peak carbon emissions by 2030 and achieving carbon neutrality by 2060 [
28], while optimizing the structure of energy consumption and reducing dependence on fossil energy. Reduction of CO
2 emissions also reduces the emission of other air pollutants, thus realizing coordinated control of pollution reduction and carbon reduction [
29]. The independent coking industry is an important industry that consumes fossil energy [
30,
31], which means that it is imperative to explore the characteristics of the associated CO
2 emissions comprehensively. In order to assess the emission reduction potential of some industries and the co-benefit of pollutants and CO
2 reduction, Tang et al. [
32] predicted future pollutants and CO
2 emissions of the cement industry by setting scenarios. Li et al. [
33] evaluated the synergistic emission reduction effect of CO
2 and air pollutants in China’s iron and steel industry by establishing a dynamic optimization model.
However, current researches on the spatiotemporal characteristics of emissions from the independent coking industry were inadequate for supporting scientific formulation of emission reduction plans. Therefore, based on coking industry emission standards, CEMS data, and pollutant emission factors of the Intergovernmental Panel on Climate Change (IPCC), this study established a database of air pollutants and CO2 emission factors for China’s independent coking industry. In combination with environmental statistics, a high-resolution bottom-up air pollutant and CO2 emission inventory of China’s independent coking industry was established for 2012, 2015, and 2018, which was used to estimate the air pollutants and CO2 emissions of China’s independent coking industry during 2001–2018. Ultimately, the emission status of China’s independent coking industry was analyzed from different aspects (i.e., temporal trends, spatial distribution, and coking procedures). On this basis, this study evaluated on future emissions of air pollutants and CO2 with different scenarios (BAU and three reduction scenarios). The findings could provide scientific support for policymakers in China regarding the determination of air pollutant discharge permits, promotion of capacity reduction, and realization of peak carbon emission and carbon neutrality goals.
2. Methodology
In this study, we adopted a unit-based bottom-up emission factor method, which through estimating emissions by multiplying the activity level by the relevant emission factor, was used to calculate the emissions of SO
2, NO
X, PM
10, PM
2.5, CO, BC, OC, VOC
S, and CO
2 by each component of the procedures performed by China’s independent coking industry during 2001–2018 [
6,
22,
34].
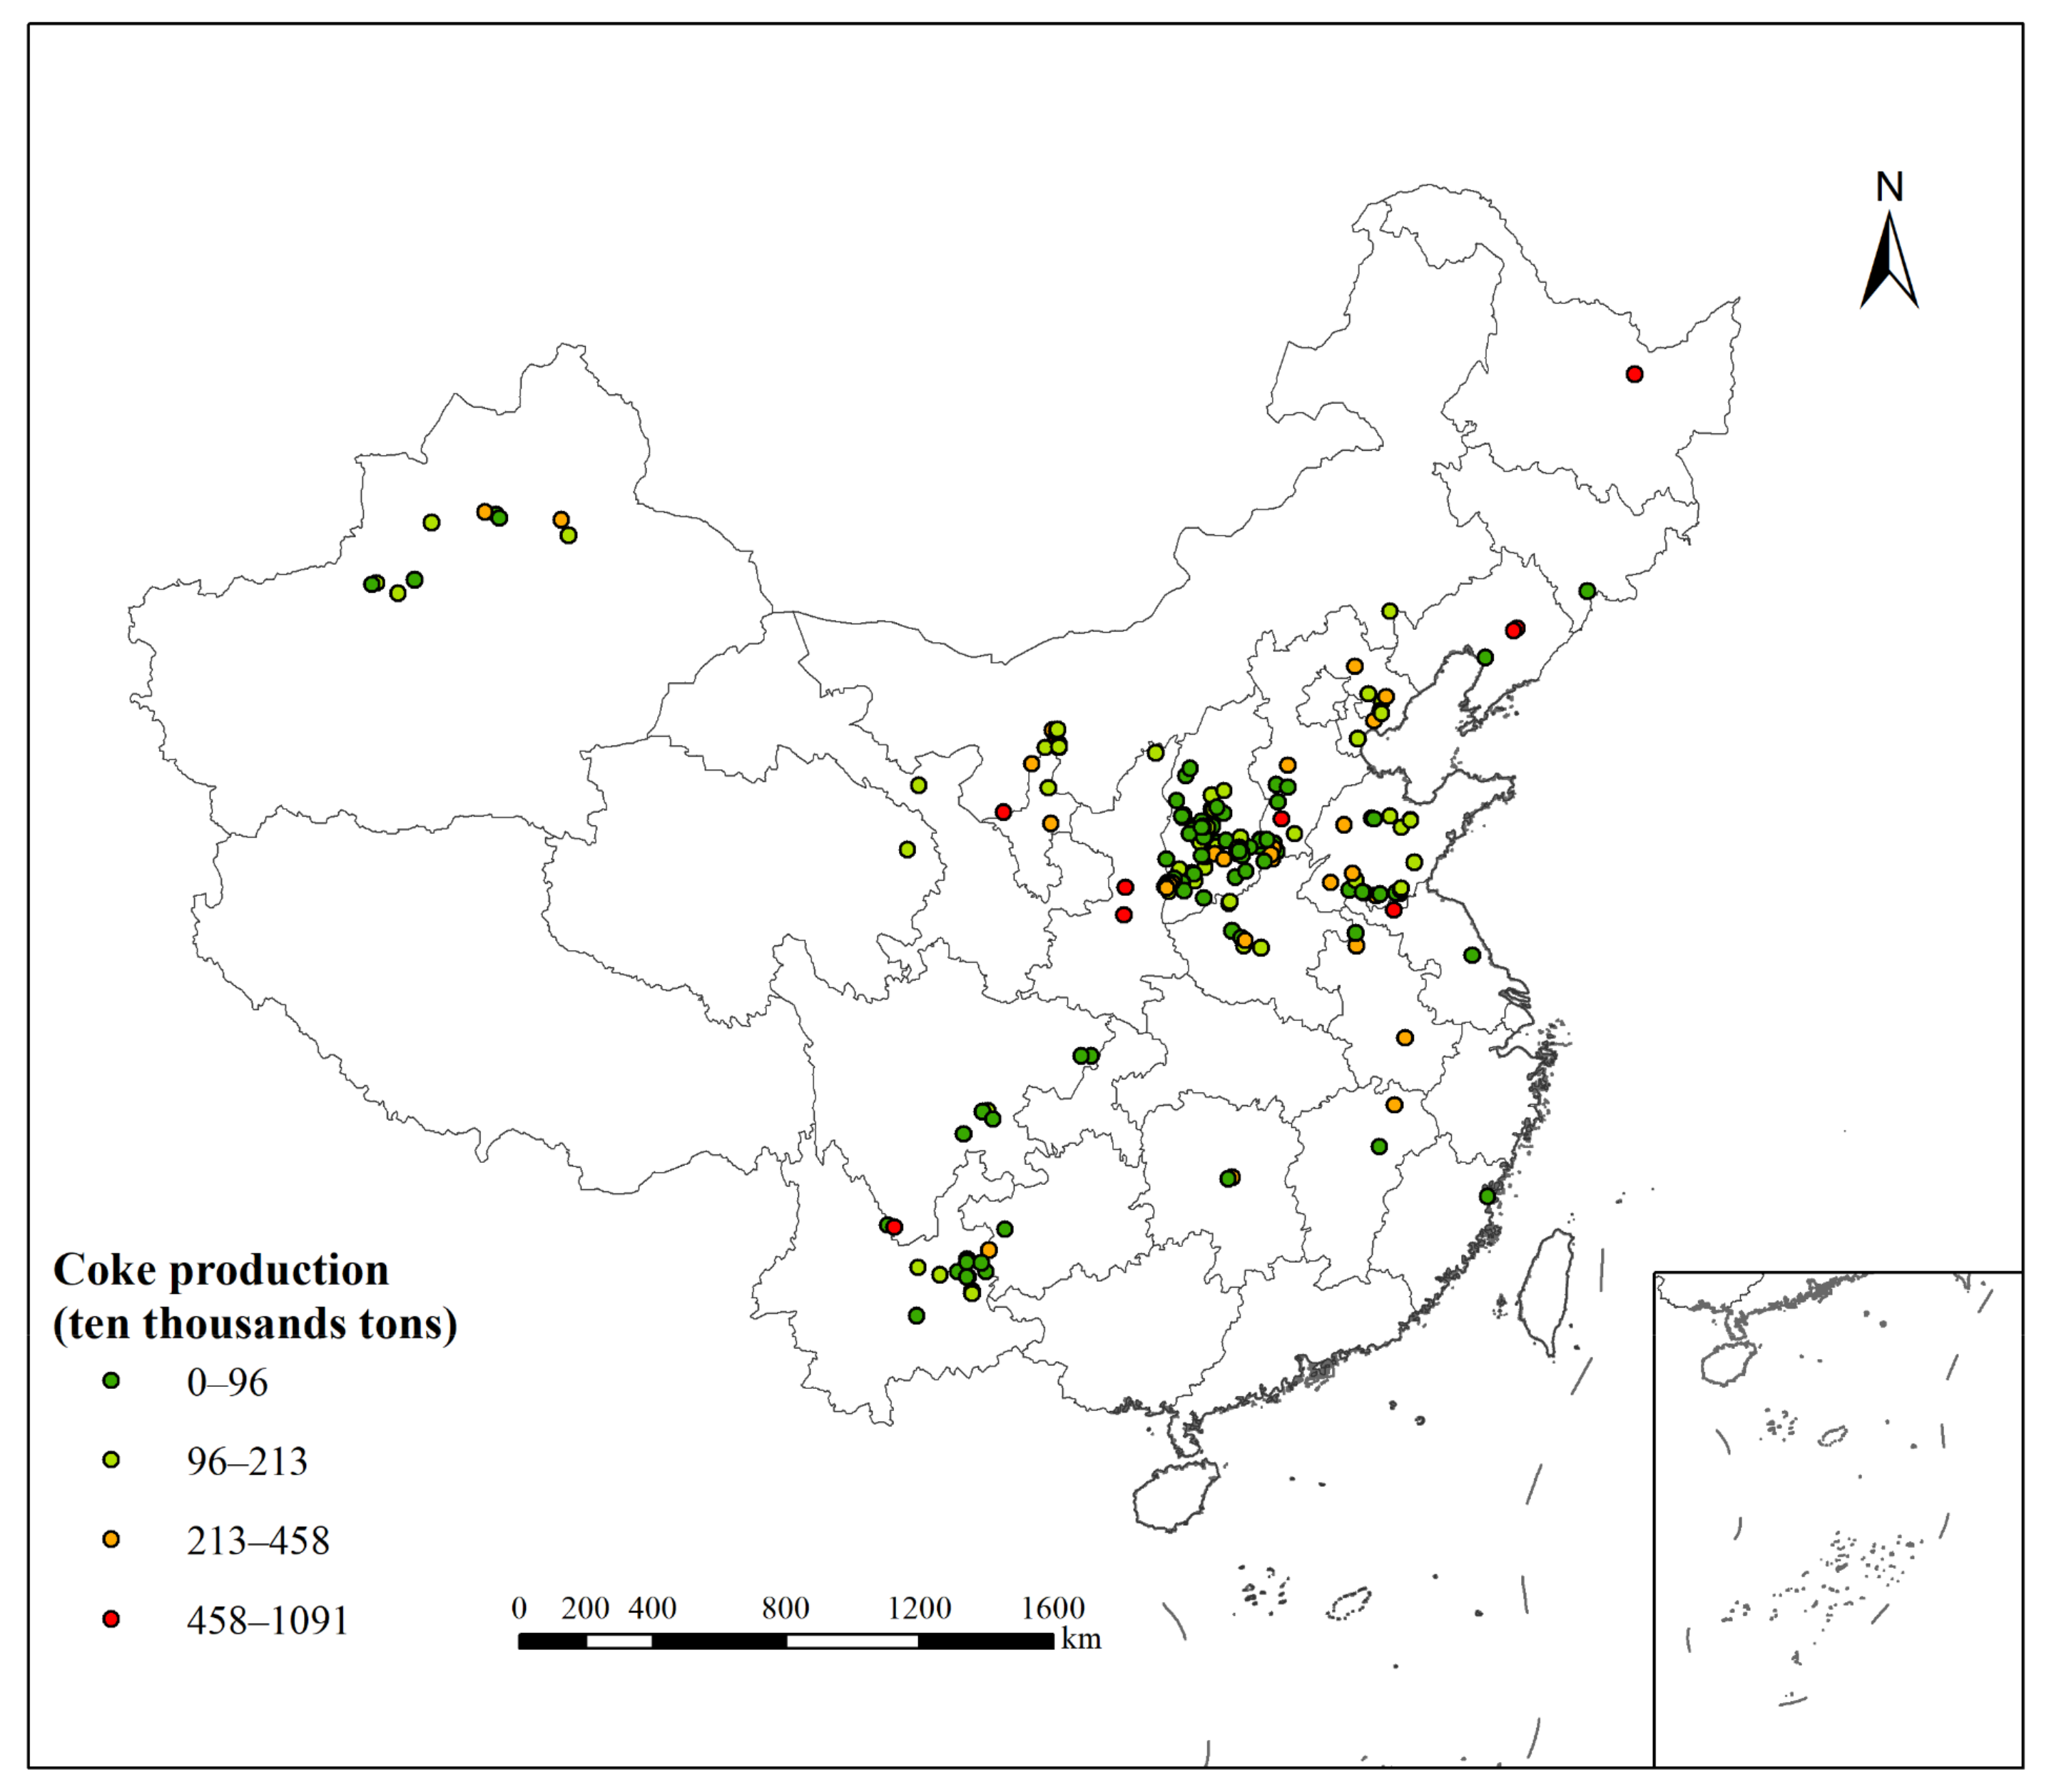
China’s independent coking industry emission inventory in 2012, 2015, and 2018 encompassed 630, 484, and 219 independent coking enterprises, respectively, in 23 Chinese provinces and 2 municipalities, excluding Zhejiang, Hainan, Taiwan, Tibet, Guangxi, Beijing, Shanghai, Hong Kong, and Macau. The emissions considered in this study were associated with the following components of the coke production process: coal preparation, coal charging, coke pushing, the coke oven chimney, and quenching. The quantity of coke production incorporated in the analysis was 254.15, 270.50, and 346.82 million tons, accounting for 57.98%, 60.35%, and 77.36% of China’s total national coke production in 2012, 2015, and 2018, respectively. The geographic location and scale of coke production of independent coking enterprises in China in 2018 are shown in
Figure 1, while those in 2012 and 2015 are shown in
Figure S1.
2.1. Calculation Equations
The emissions of SO
2, NO
X, and PM
10 from each coking unit in 2012, 2015, and 2018 were calculated separately, and the emissions of PM
2.5, CO, BC, OC, VOC
S, and CO
2 were calculated for the scale of each enterprise and then aggregated to obtain provincial emissions. Coke production, air pollutants, and CO
2 emissions in other years were estimated from national statistics and details of coke production in the steel industry [
35,
36]:
where
represents the emission pollutant species;
represents the emission sources of independent coking;
represents the year;
represents the province in which the independent coking enterprise is located;
represents the emissions of air pollutants from independent coking production (g);
is the activity level, defined as the amount of coke production (kg); and
is the emission factor that reflects the mass of emissions per emission source of production (g/kg).
The calculation of CO
2 emissions from China’s independent coking industry represents a production-based approach that is calculated using an equation based on the level of production of an enterprise and the default IPCC emission factor [
37]:
where
represents the emissions of CO
2 from coke production in year
(unit: tons of CO
2),
means the quantity of coke produced by an enterprise in year
(unit: tons), and
is the emission factor of CO
2 (unit: tons CO
2/tons coke produced).
2.2. Activity Level
Updated data on the activity of China’s independent coking industry during 2001–2018 were obtained from facility-level survey data of MEE (unpublished data). This database contains details of the geographical location, equipment, and scale of coke production of 630 and 484 independent coking enterprises in 2012 and 2015, respectively. Using data from China’s steel industry and the National Bureau of Statistics [
38], the activity of the independent coking industry in each province and municipality in 2018 was obtained, and then combined with the annual report of 219 independent coking enterprises’ emission permit implementation reports in 2018, the activity levels were distributed to enterprises by using technology-based methods. The unit-level activity rates for other years were estimated by combining the unit-level activity rates for these years with data from the National Bureau of Statistics.
2.3. Emission Factors
Emission factors of PM10, SO2, and NOX were estimated using technical methods. Emission factors of CO2 were obtained from the National Greenhouse Gas Inventory Guidelines prepared by the IPCC. Emission factors of other pollutants were obtained from previous related studies.
2.3.1. Emission Factors of PM10, SO2, and NOX
To improve the accuracy of the inventory, within the context of updated air pollutant emission standards and monitoring technology, different emission factors were used in different periods (as listed in
Table S2 and
Table S3).
For the period 2001–2011, given that few enterprises had installed CEMS equipment, the concentration value of the new Enterprise Implementation Standard of Emissions of Air Pollutants for Coke Ovens (GB16171-1996), issued in 1996, was used in combination with the theoretical flue gas volume to calculate the emission factors of PM
10, SO
2, and NO
X of the coking industry in China [
24]. The flue gas rates of each process of coking production were obtained from the MEE [
17] (
Table S1).
In 2012, the MEE revised the emission standards for the coking industry, and based on previous research by our team, classified the various coking processes in terms of scale structure. The scale structure of the emission sources (i.e., the amount of production capacity) is defined as First, Second, and Third level from high to low as follows:
where
C represents the concentration based on the emission source emitted from coking production (mg/m
3), and
V represents the theoretical flue gas rate, which represents the volume of flue gas emitted per unit of production (m
3/t).
During 2013–2016, owing to implementation of coking access conditions, some enterprises installed online monitoring systems (i.e., CEMS) [
16]; therefore, the CEMS database of the Ecological Environment Law Enforcement Bureau of the MEE for 2015 was used for this period [
39]. For 2017 and 2018, with the release of the “Technical Specifications for the Application and Issuance of Pollution Discharge Permits in the Coking Chemical Industry (HJ854-2017),” emission limits were formulated for enterprises and the CEMS data were updated [
17]. The CEMS data of China’s coking industry covers 71 outlets of 34 coking enterprises. Based on the CEMS data of the coking process in China’s steel industry, this study calculated the PM
10, SO
2, and NO
X emission factors of coke oven chimneys of the coking industry in each province.
Based on the annual average concentrations of PM
10, SO
2 and NO
X in the CEMS data after quality control [
40,
41,
42], and in combination with the theoretical flue gas volume of each discharge node [
17], the annual emission factor of each CEMS outlet was calculated, and the annual emission factor of each province was calculated as the arithmetic mean [
23]. For provinces with missing CEMS data, the emission factors of pollutants were replaced by Chinese averages:
where
represents the emission factor (g/kg of product),
represents the statistical mean of the emission concentration (mg/m
3),
represents the theoretical flue gas volume (m
3/t of product),
OPh represents the number of monitoring hours included in the analysis,
N represents the number of samples,
represents the different outlets, and
represents the time (h).
2.3.2. Emission Factors of CO2
Methods for the calculation of the CO
2 emission factor include the method of the National Greenhouse Gas Inventory proposed by the IPCC [
37,
43], and the specific greenhouse gas accounting guidelines issued by individual countries [
27]. In this study, the emission factor provided by the IPCC was used to estimate the CO
2 emissions of the coking production process. The CO
2 emission factor of China’s independent coking industry, calculated according to the “2019 Refinement to the 2006 IPCC Guidelines for National Greenhouse Gas Inventories”, was set at 0.51 tCO
2/t of product [
37].
2.3.3. Emission Factors of Other Pollutants
Emissions of other pollutants considered in this study, including BC, OC, VOC
S, CO, and PM
2.5, were mainly based on PM
10 emissions and the quantity of PM
2.5 in the PM
10 emissions. The mass percentages of PM
2.5 in PM
10 associated with the various processes of the independent coking industry, derived from the literature [
44,
45,
46], are shown in
Table S4. Following review of Chinese and international literature and reference materials, the characteristic pollutant emission factors of each process in China’s independent coking industry were obtained for BC, OC, VOC
S, and CO. The relevant emission factors are shown in
Table S5; the unit for BC and OC is expressed as the percentage of PM
2.5 emissions.
2.4. Emission Analysis of Different Scenarios
Under the current situation of increasingly serious environmental problems globally, strengthening of the emission reduction measures associated with the independent coking industry is a primary focus in China and worldwide. China announced several emission reducing plans and has updated the emission standard for coking industry [
18,
47]. We performed an assessment of a possible 4 scenarios in air pollutants and CO
2 emissions in independent coking industry.
2.4.1. Business-As-Usual (BAU) Scenario
In this scenario, the activity level of independent coking enterprises continued to increase with the growth of GDP, but the implementation of all emission reduction measures was ignored, so that all independent coking enterprises in China maintained the current pollution discharge capacity in 2018. By taking the logarithm of the coke production of the independent coking industry and China’s GDP value in the past 14 years and performing a correlation analysis, it was found that there was a good linear relationship between the two as shown in the
Figures S6 and S7. Therefore, the GDP value was used to predict the coke production of independent coking enterprises in this study (shown in
Section S1 of the
Supplementary Materials).
2.4.2. Ultralow Emissions (ULE) Scenario
In April 2019, China announced its opinions on promoting the implementation of ultra-low emissions in the iron and steel industry, mentioning that by the end of 2025, more than 80% of the production capacity of iron and steel enterprises will be transformed. As an important process for iron and steel enterprises, coking is also an important basic industry in China, and it was an important object for the implementation of ultra-low emission transformation. In this scenario, we considered that by the end of 2025, all independent coking enterprises would complete their ultra-low emission renovations while maintaining production growth. The emission concentration and emission factors for coking under the ULE index were shown in
Table S6.
2.4.3. Peak Coke Production (PCP) Scenario
In this scenario, we assume that all Chinese independent coking facilities keep coke production at the 2018 levels and the ultralow emission renovations of the coking industry are considered to be consistent with the ULE scenario [
32].
2.4.4. Carbon Peak (CBP) Scenario
China Coking Industry Association (CCIA) released the carbon neutralization action plan for carbon peaking in the coking industry in August 2022 [
47]. The plan proposes that the carbon dioxide emissions of China’s coking industry will peak in 2025.
2.5. Uncertainty Assessment
Estimates of air pollutant emissions derived from the 2012, 2015, and 2018 emission inventories were subjected to uncertainty analysis via Monte Carlo simulations. The uncertainty of this emission inventory was derived mainly from two factors: the activity level based on the unit coking enterprise (mainly coke production), and the emission factor based on emission standards and the CEMS. Based on previous studies that assumed that the activity level and emission factor follow normal distributions with coefficients of variation of 5% and 20%, respectively [
48], the activity level and emission factor were randomly selected 10,000 times using the Monte Carlo method within a 95% confidence interval to validate the uncertainty of the emissions inventory [
22].
3. Results and Discussion
Based the calculations, this paper obtained details of the production of coke and the emission of pollutants (i.e., PM10, SO2, NOX, VOCS, CO, PM2.5, BC, and OC) during 2001–2018. Detailed analysis of these results considered the aspects of temporal trends, spatial distribution, coking procedures and the air pollutant emissions in different scenarios.
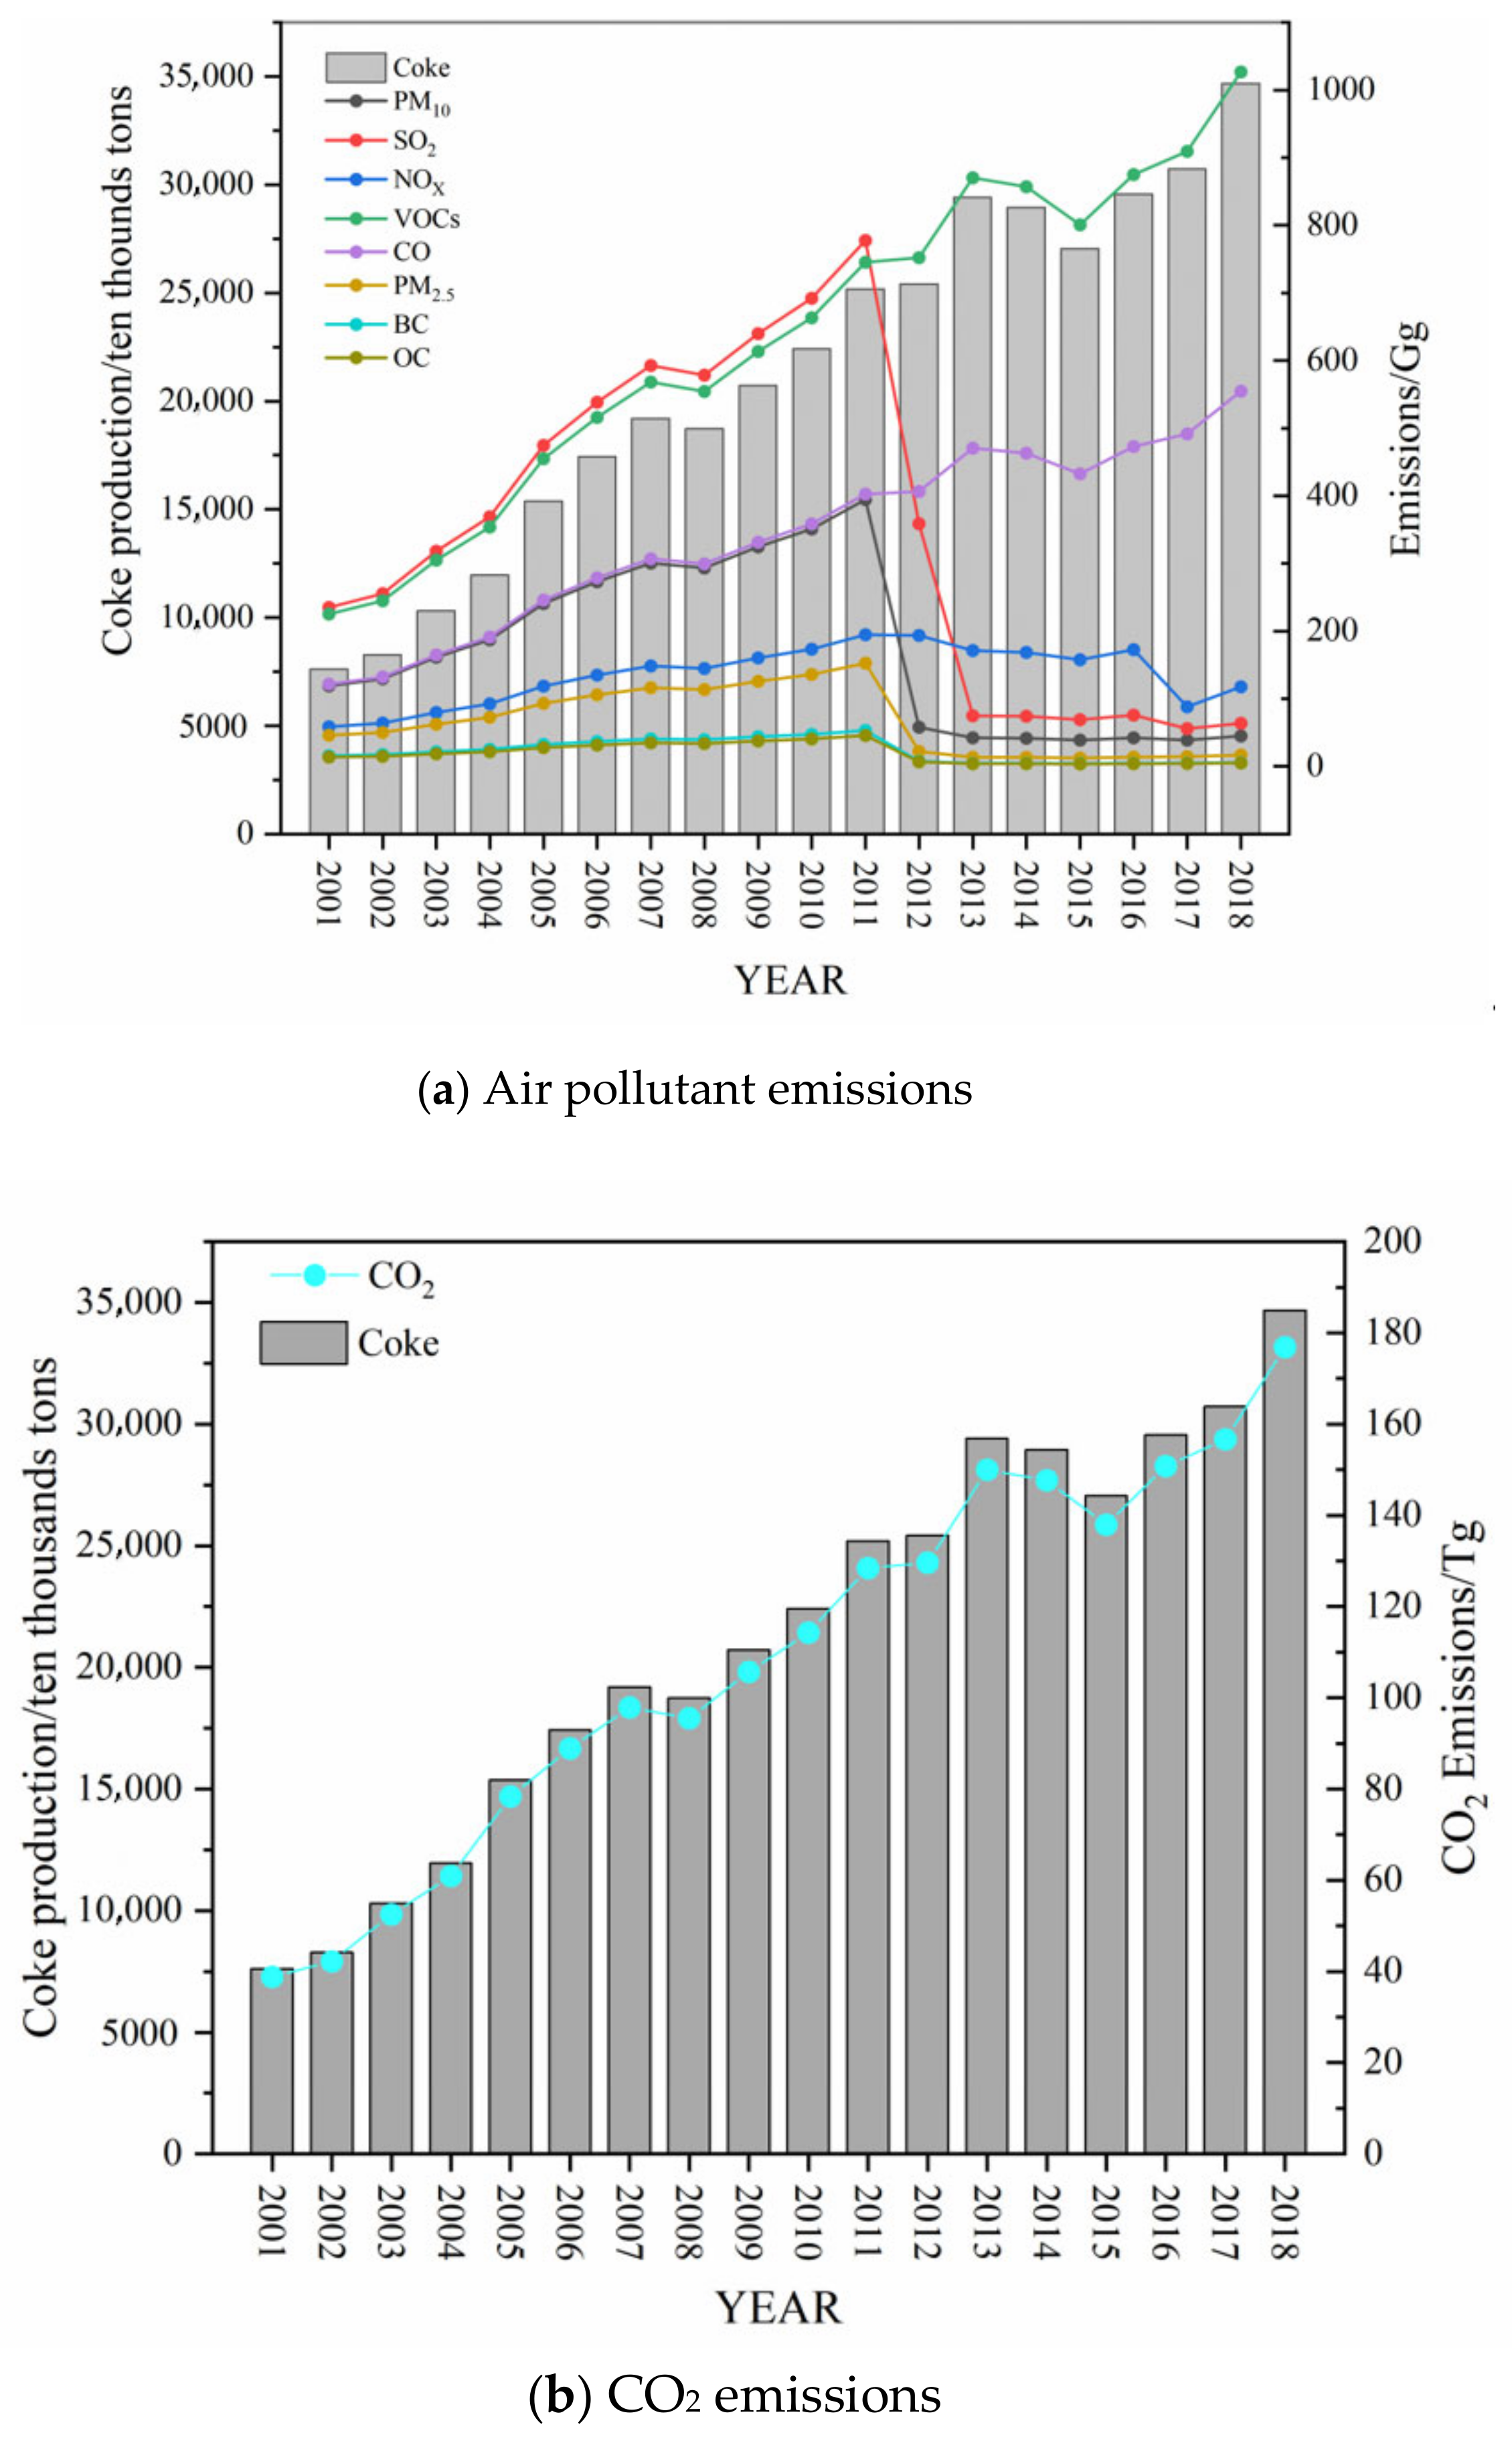
3.1. Temporal Trends
The temporal distributions of air pollutants emissions (PM
10, NO
X, SO
2, PM
2.5, BC, OC, CO, VOC
S, and CO
2) and coke production of independent coking industry during 2001–2018 in China were shown in
Figure 2. Overall, the emission of PM
2.5 and PM
10 decreased by 63.41% (from 46.22 to 16.91 Gg) and 62.11% (from 119.30 to 45.20 Gg), peaking in 2011 (152.89 Gg and 394.64 Gg) and reaching the lowest value in 2015 (14.72 Gg and 38.97 Gg). The emissions of BC and OC had the same rate of decline (63.41%) as the emission of PM
2.5, reaching values of 5.07 and 5.91 Gg, respectively, in 2018. Similarly, NO
X emissions increased by 99.74% (from 58.93 to 117.71 Gg), peaking in 2011 (194.93 Gg). The emissions of CO and VOC
S both showed an overall upward trend, increasing by 355.51% (CO emissions increased from 121.82 to 554.91 Gg; VOC
S emissions increased from 225.37 to 1026.58 Gg). Although the production of coke increased with average rate of 9% by year, the emission of several air pollutants showed a discrepancy. Specially, the emission of VOC
S, CO, and CO
2 generally showed an upward trend until 2012, and the emissions of PM, SO
2, NO
X, BC, and OC reached an inflection point and began to decline in 2012, which can be attributed to the promulgation of new emission standards for the coking industry by the MEE in 2012. From 2011 to 2012, the emissions of PM
2.5 and SO
2 associated with each process of coke production decreased substantially. From previous studies, it was found that the promulgation of policies and regulations could achieve a sharp reduction in industrial pollutant emissions in a short-term [
22,
34]. Conversely, NO
X emissions continued to increase, which was linked to the new emission standard adding further restrictions on NO
X emissions. This paper applied this standard to the inventory before 2012 and therefore the updated emission standard had no effect on the increasing trend of NO
X. It highlights the impacts of the multiple efforts implemented to control the air pollution emissions from coking industry. For other pollutants, the emission trends of VOC
S, BC, OC, CO, and CO
2 can be mainly attributed to clear variations in coke production yields. The CO
2 emissions increased from 38.83 Tg (2001) to 176.88 Tg (2018) owing to the rapid development of the independent coking industry in recent decades and the growing demand for coke. To help achieve the goal of China’s government of peak carbon emissions by 2030 and carbon neutrality by 2060, the independent coking industry, as an important industrial source of CO
2 emissions in China, should adjust its energy structure and improve the combustion efficiency of coke ovens to augment its contribution.
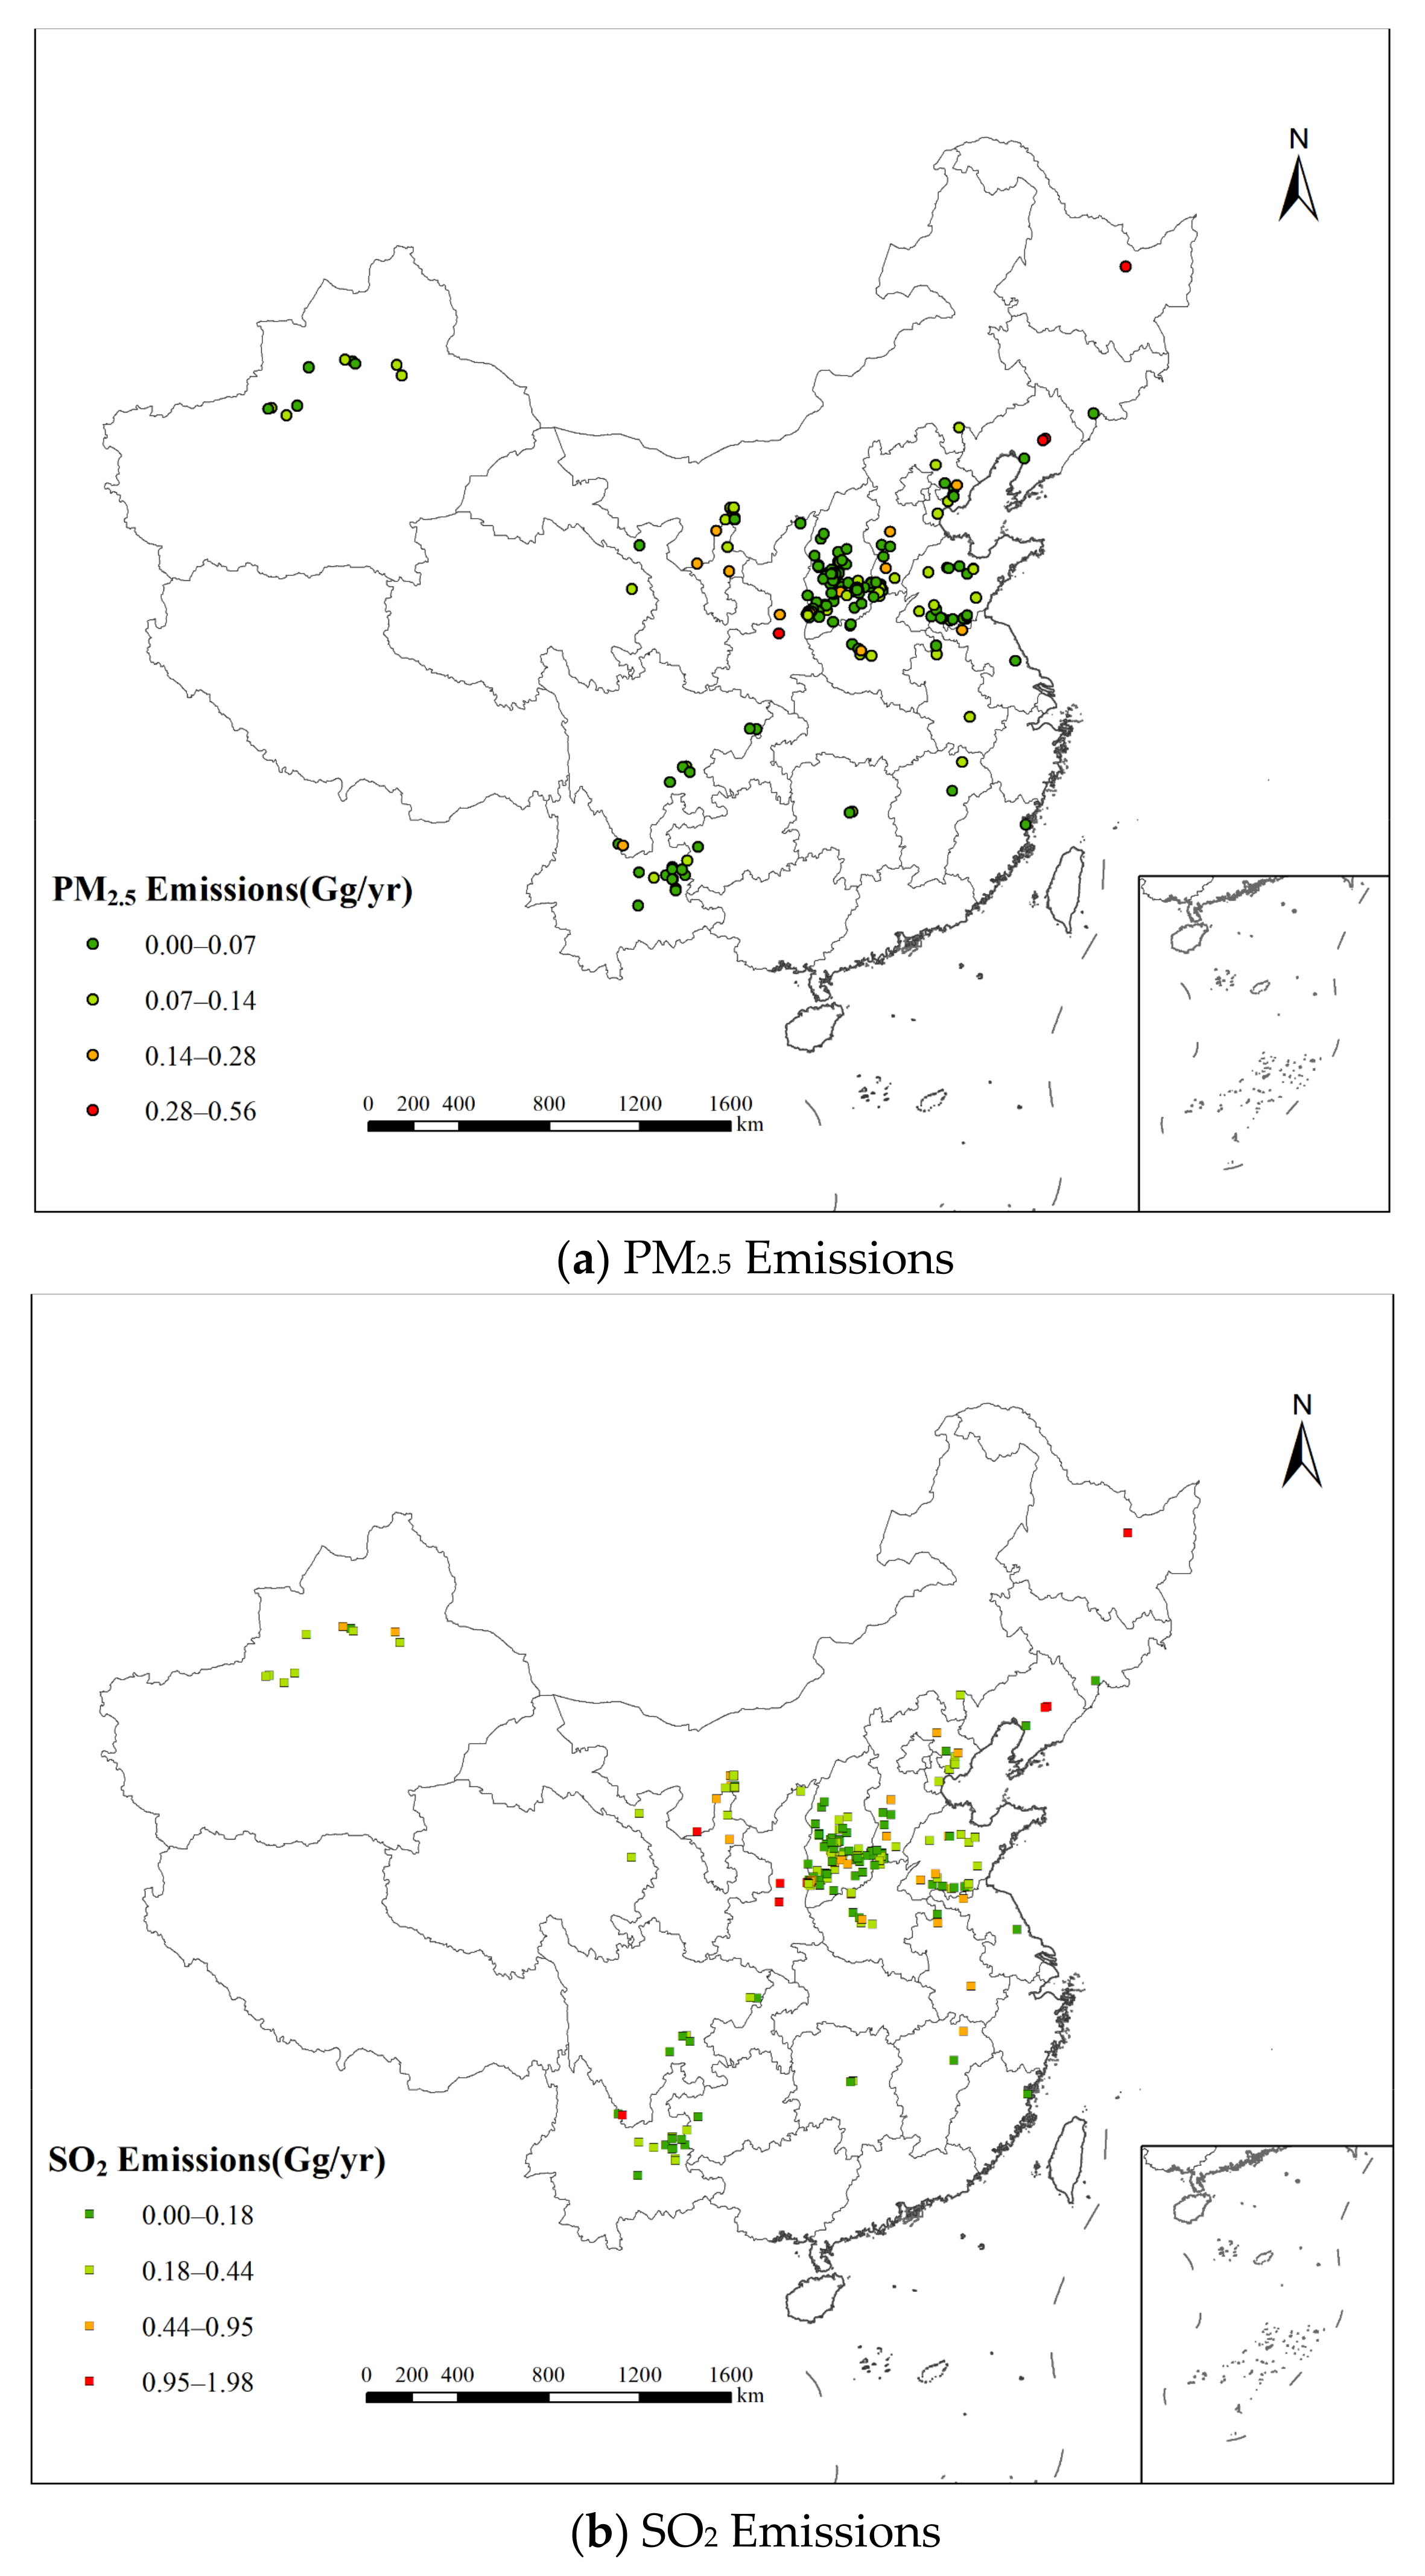
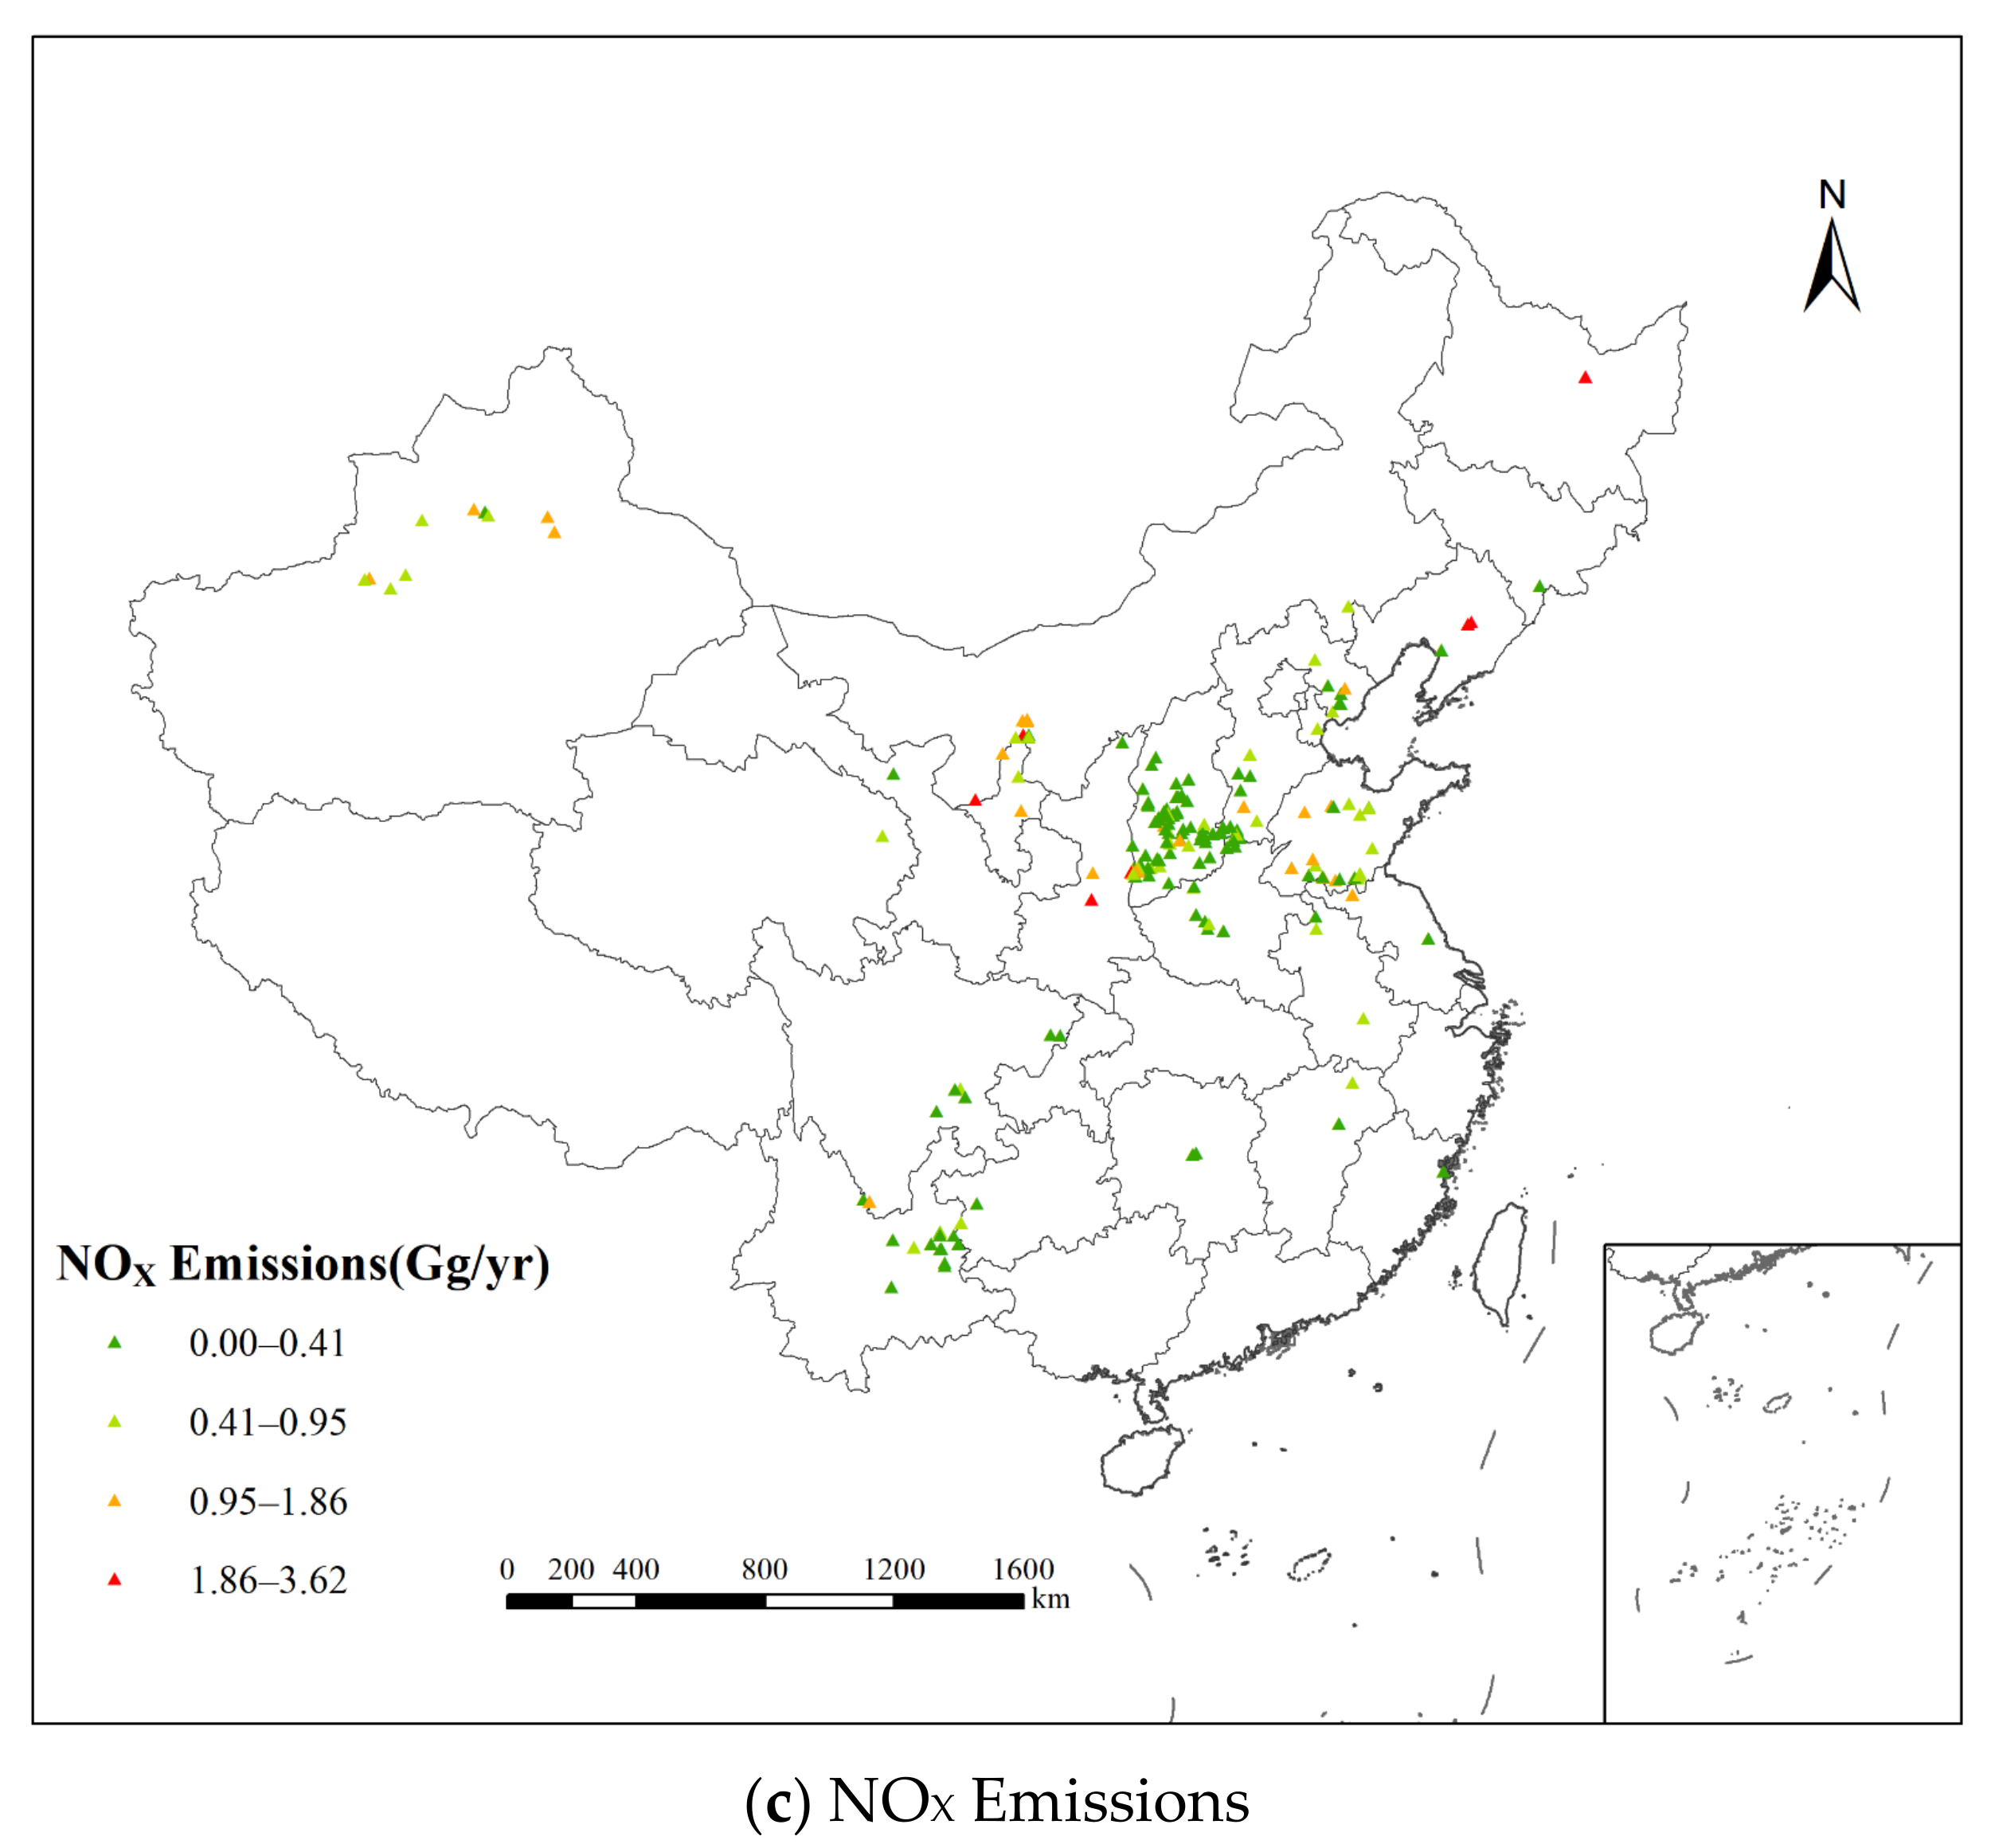
3.2. Spatial Distribution
The spatial distributions of air pollutant emissions (PM
2.5, SO
2, and NO
X) of all of China’s independent coking industry facilities in 2018 (2012 and 2015) were shown in
Figure 3 (
Figure S2 and
Figure S3, respectively). The emissions of air pollutants of China’s independent coking industry by province in 2018 (2012 and 2015) were illustrated in
Figure 4 (
Figure S4 and
Figure S5, respectively). Air pollutant emissions from coking plants in China are geographically dispersed; however, emissions were concentrated mainly in northern China.
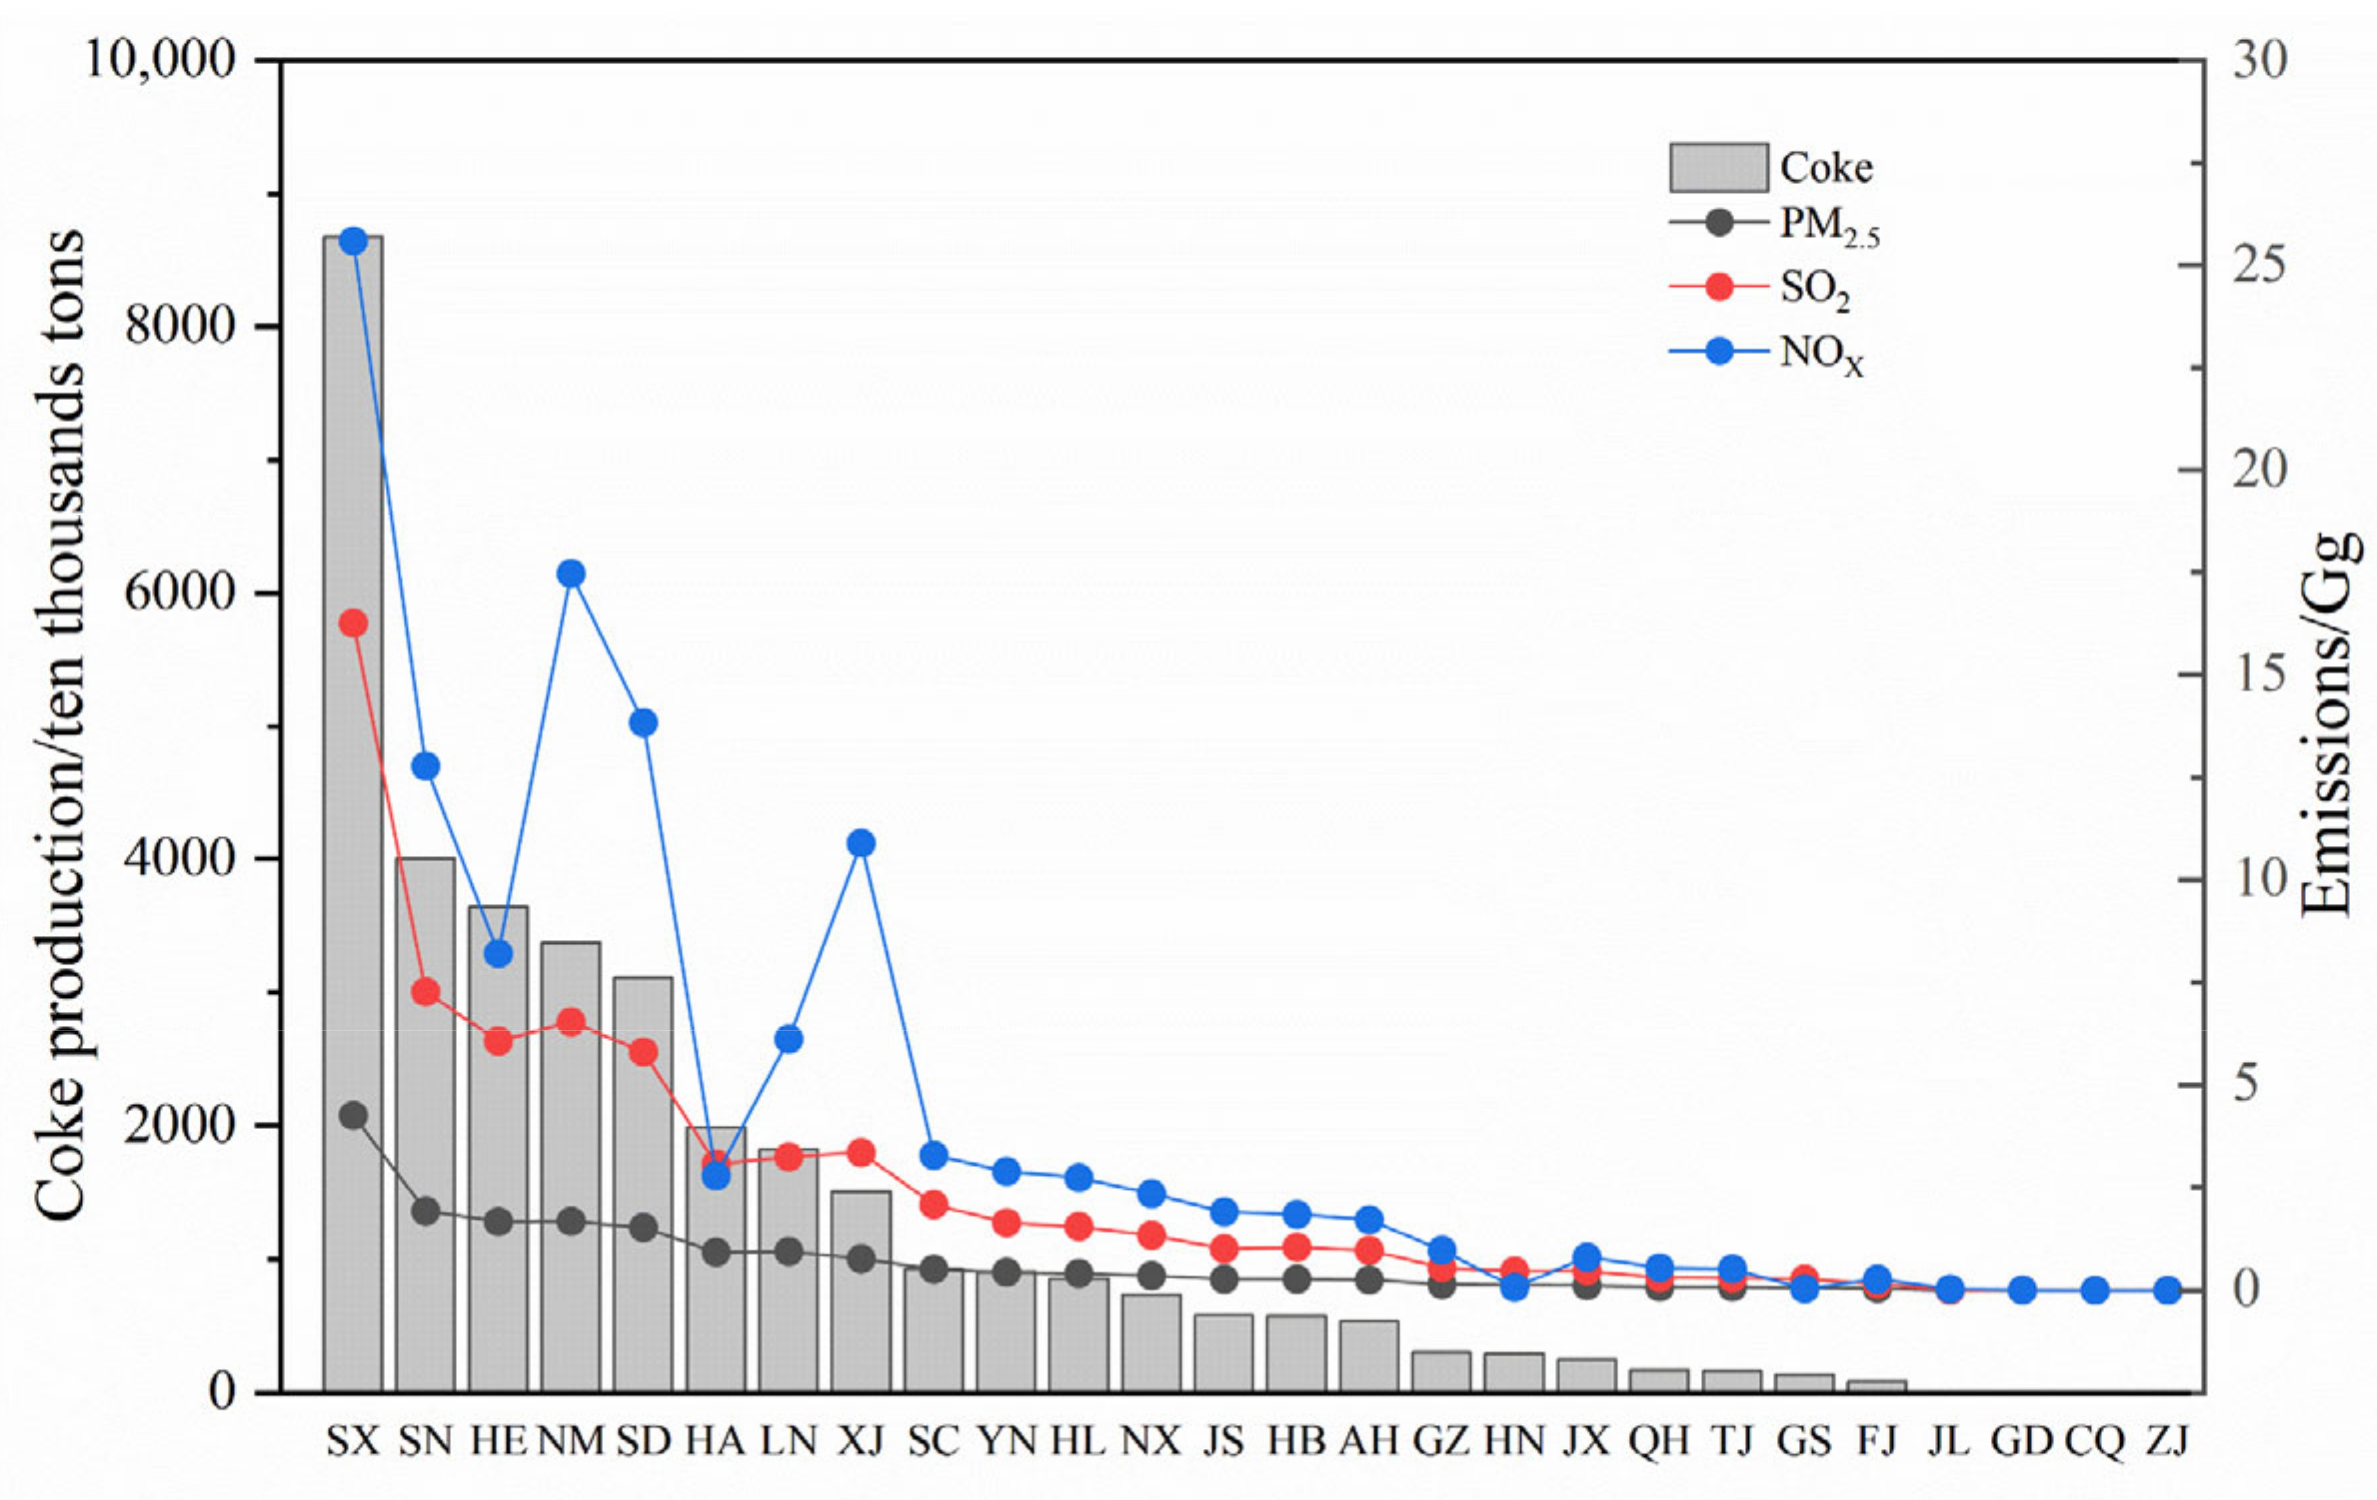
It can be seen from
Figure 4 that coke production and emissions of PM
2.5, SO
2, and NO
X associated with China’s independent coking industry in 2018 were the greatest in the provinces of Shanxi, Shaanxi, Hebei, Inner Mongolia, and Shandong, accounting for 65.77%, 65.40%, 65.69%, and 66.17% of the national total, respectively. It was also evident from
Figure 4 that the provinces of Shanxi and Shaanxi had a much greater coke production than the other provinces, and that their associated emissions of the various air pollutants ranked first and second in the country. Coke production in Hebei Province was greater than that of Inner Mongolia, but its emissions of PM
2.5, SO
2, and NO
X were lower than those of Inner Mongolia by 0.015, 0.462, and 9.280 Gg, respectively. These findings reflected differences in related production processes and in the implementation of emission reduction technologies among different provinces.
3.3. Emission Characteristics of Various Coking Procedures
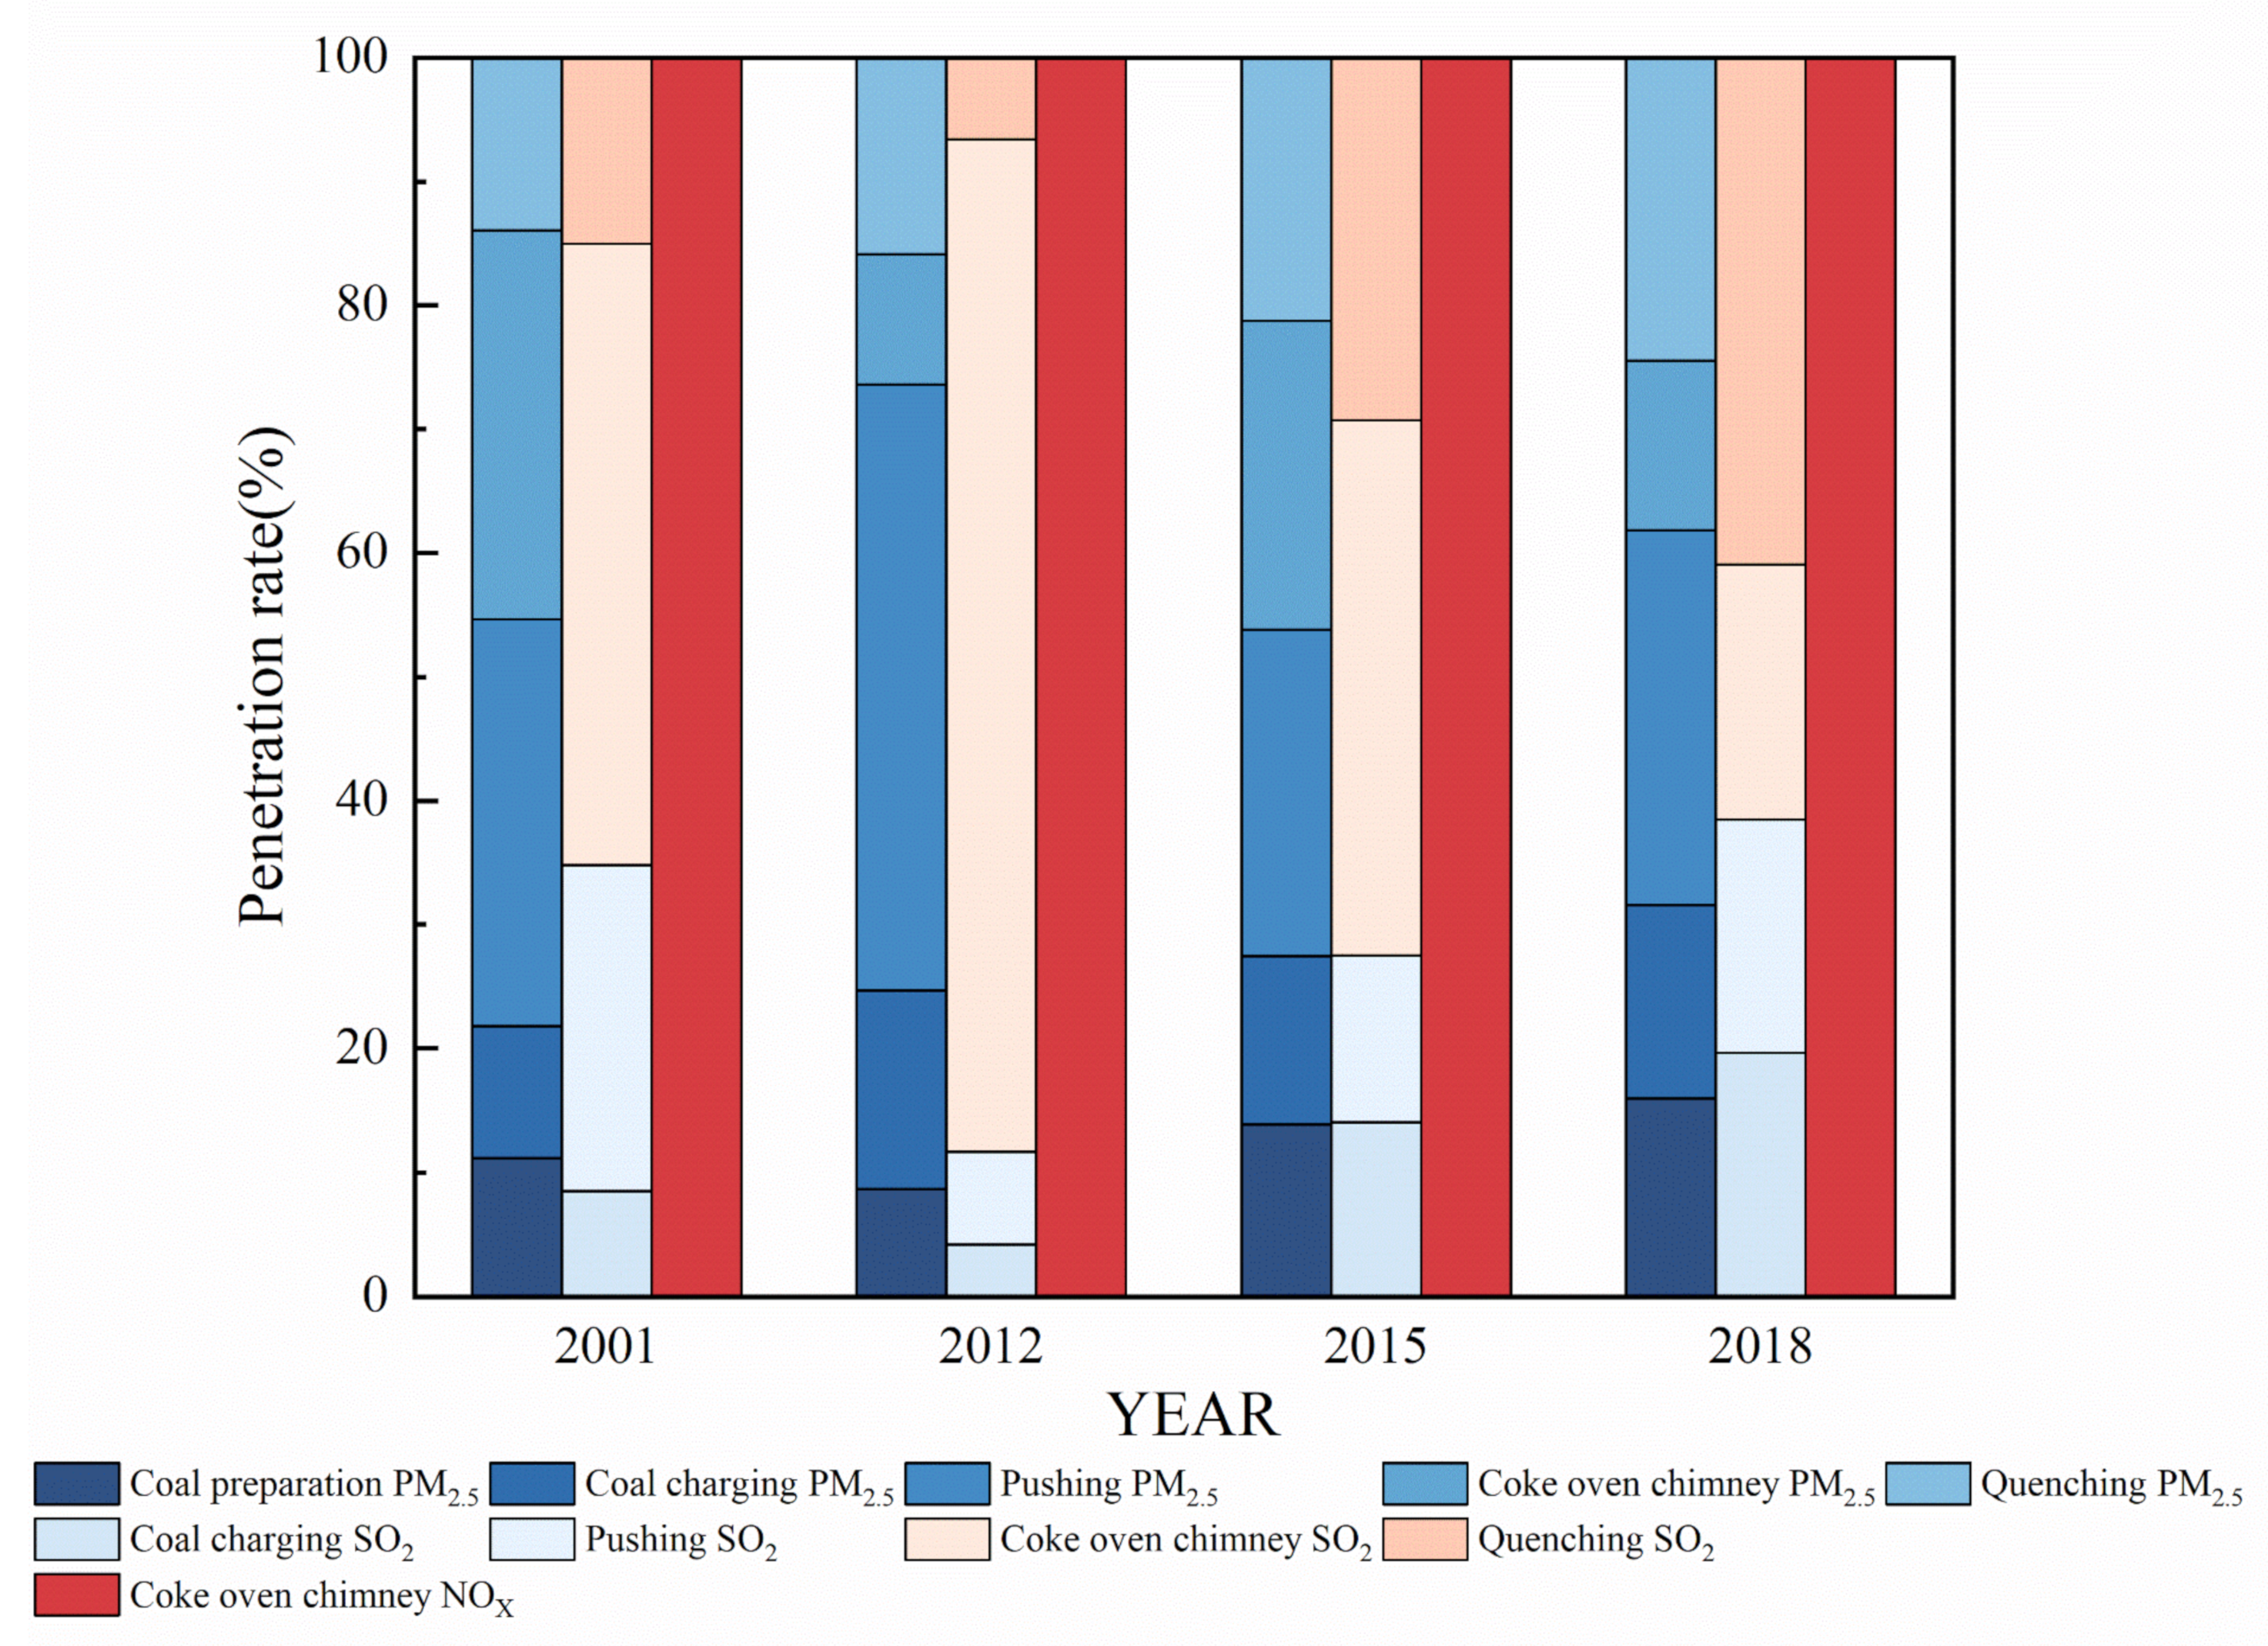
Table 1 summarized the PM
2.5, SO
2, and NO
X emissions associated with five components (coal preparation, coal charging, coke pushing, the coke oven chimney, and quenching) of the procedures conducted by independent coking industry in 2001, 2012, 2015, and 2018. According to the estimates, from 2001 to 2018, the emissions associated with the various components of the procedures decreased substantially. The SO
2 emissions associated with the components of coal charging, pushing, the coke oven chimney, and quenching decreased by 37.33%, 80.55%, 88.88%, and 25.99% respectively. The relative contributions of PM
2.5, SO
2, and NO
X emissions of each component of the coking procedures in 2001, 2012, 2015, and 2018 are shown in
Figure 5. The coke oven chimney is the only component of the procedure that emits NO
X. In terms of PM
2.5 emissions, pushing is the most important process from beginning to the end. However, in terms of SO
2 emissions, following updates of emission reduction technologies, the most important part of the process has changed from the coke oven chimney to quenching. From the perspective of the entire coking procedure, pushing was the most important component regarding PM
2.5 emissions, accounting for 32.9%, 48.9%, 26.4%, and 30.3% of the total emissions of pollutants in 2001, 2012, 2015, and 2018, respectively. Meanwhile, in terms of SO
2 emissions, the coke oven chimney was the dominant component of the procedure, contributing 50.2%, 81.8%, 43.2%, and 20.5% of the total SO
2 emissions in 2001, 2012, 2015, and 2018, respectively.
From the discussion in
Section 3.1, the MEE promulgated new emission standards for the coking industry in China in 2012; therefore, from 2001 to 2012, the contribution of each component of the process to the total emissions was attributed to the new emission standards in different processes. After 2015, with the application of CEMS, the main contribution changed associated with total emissions was attributed to the more accurate calculation of the emissions of coke oven chimney procedure. The emissions of important procedures regarding pollutant emissions had a downward trend, attributable to continuous strengthening of emission standards and implementation of emission reduction technologies.
3.4. Uncertainty Analysis and Limitations
The uncertainty analysis results shown in
Table 2 indicate that the ranges of uncertainty of the total emissions of PM10, SO
2, and NO
X in Chinese independent coking industry were −34% to 35%, −33% to 34%, and −33% to 34% in 2012, −33% to 35%, −33% to 34%, and −34% to 34% in 2015, −34% to 35%, −33% to 35%, and −34% to 34%, in 2018, respectively.
The independent coking industry database in this paper covered a wide range, and the limitations of the results mainly came from three aspects. Emission factors of the pollutants in 2012 were derived from the emission standards of the coking industry, which may be different from the real emission. The activity levels of independent coking production in 2018 were estimated from the coke production associated with iron, steel enterprises, and the total production of coke. There were deviations in the actual production. Finally, the emission factors of some pollutants such as BC, OC, and PM2.5 were obtained from literature researches. After the independent coking industry has repeatedly strengthened standards and supervision, the changes in component concentration have not been considered.
3.5. Emission Reduction Scenario Analysis
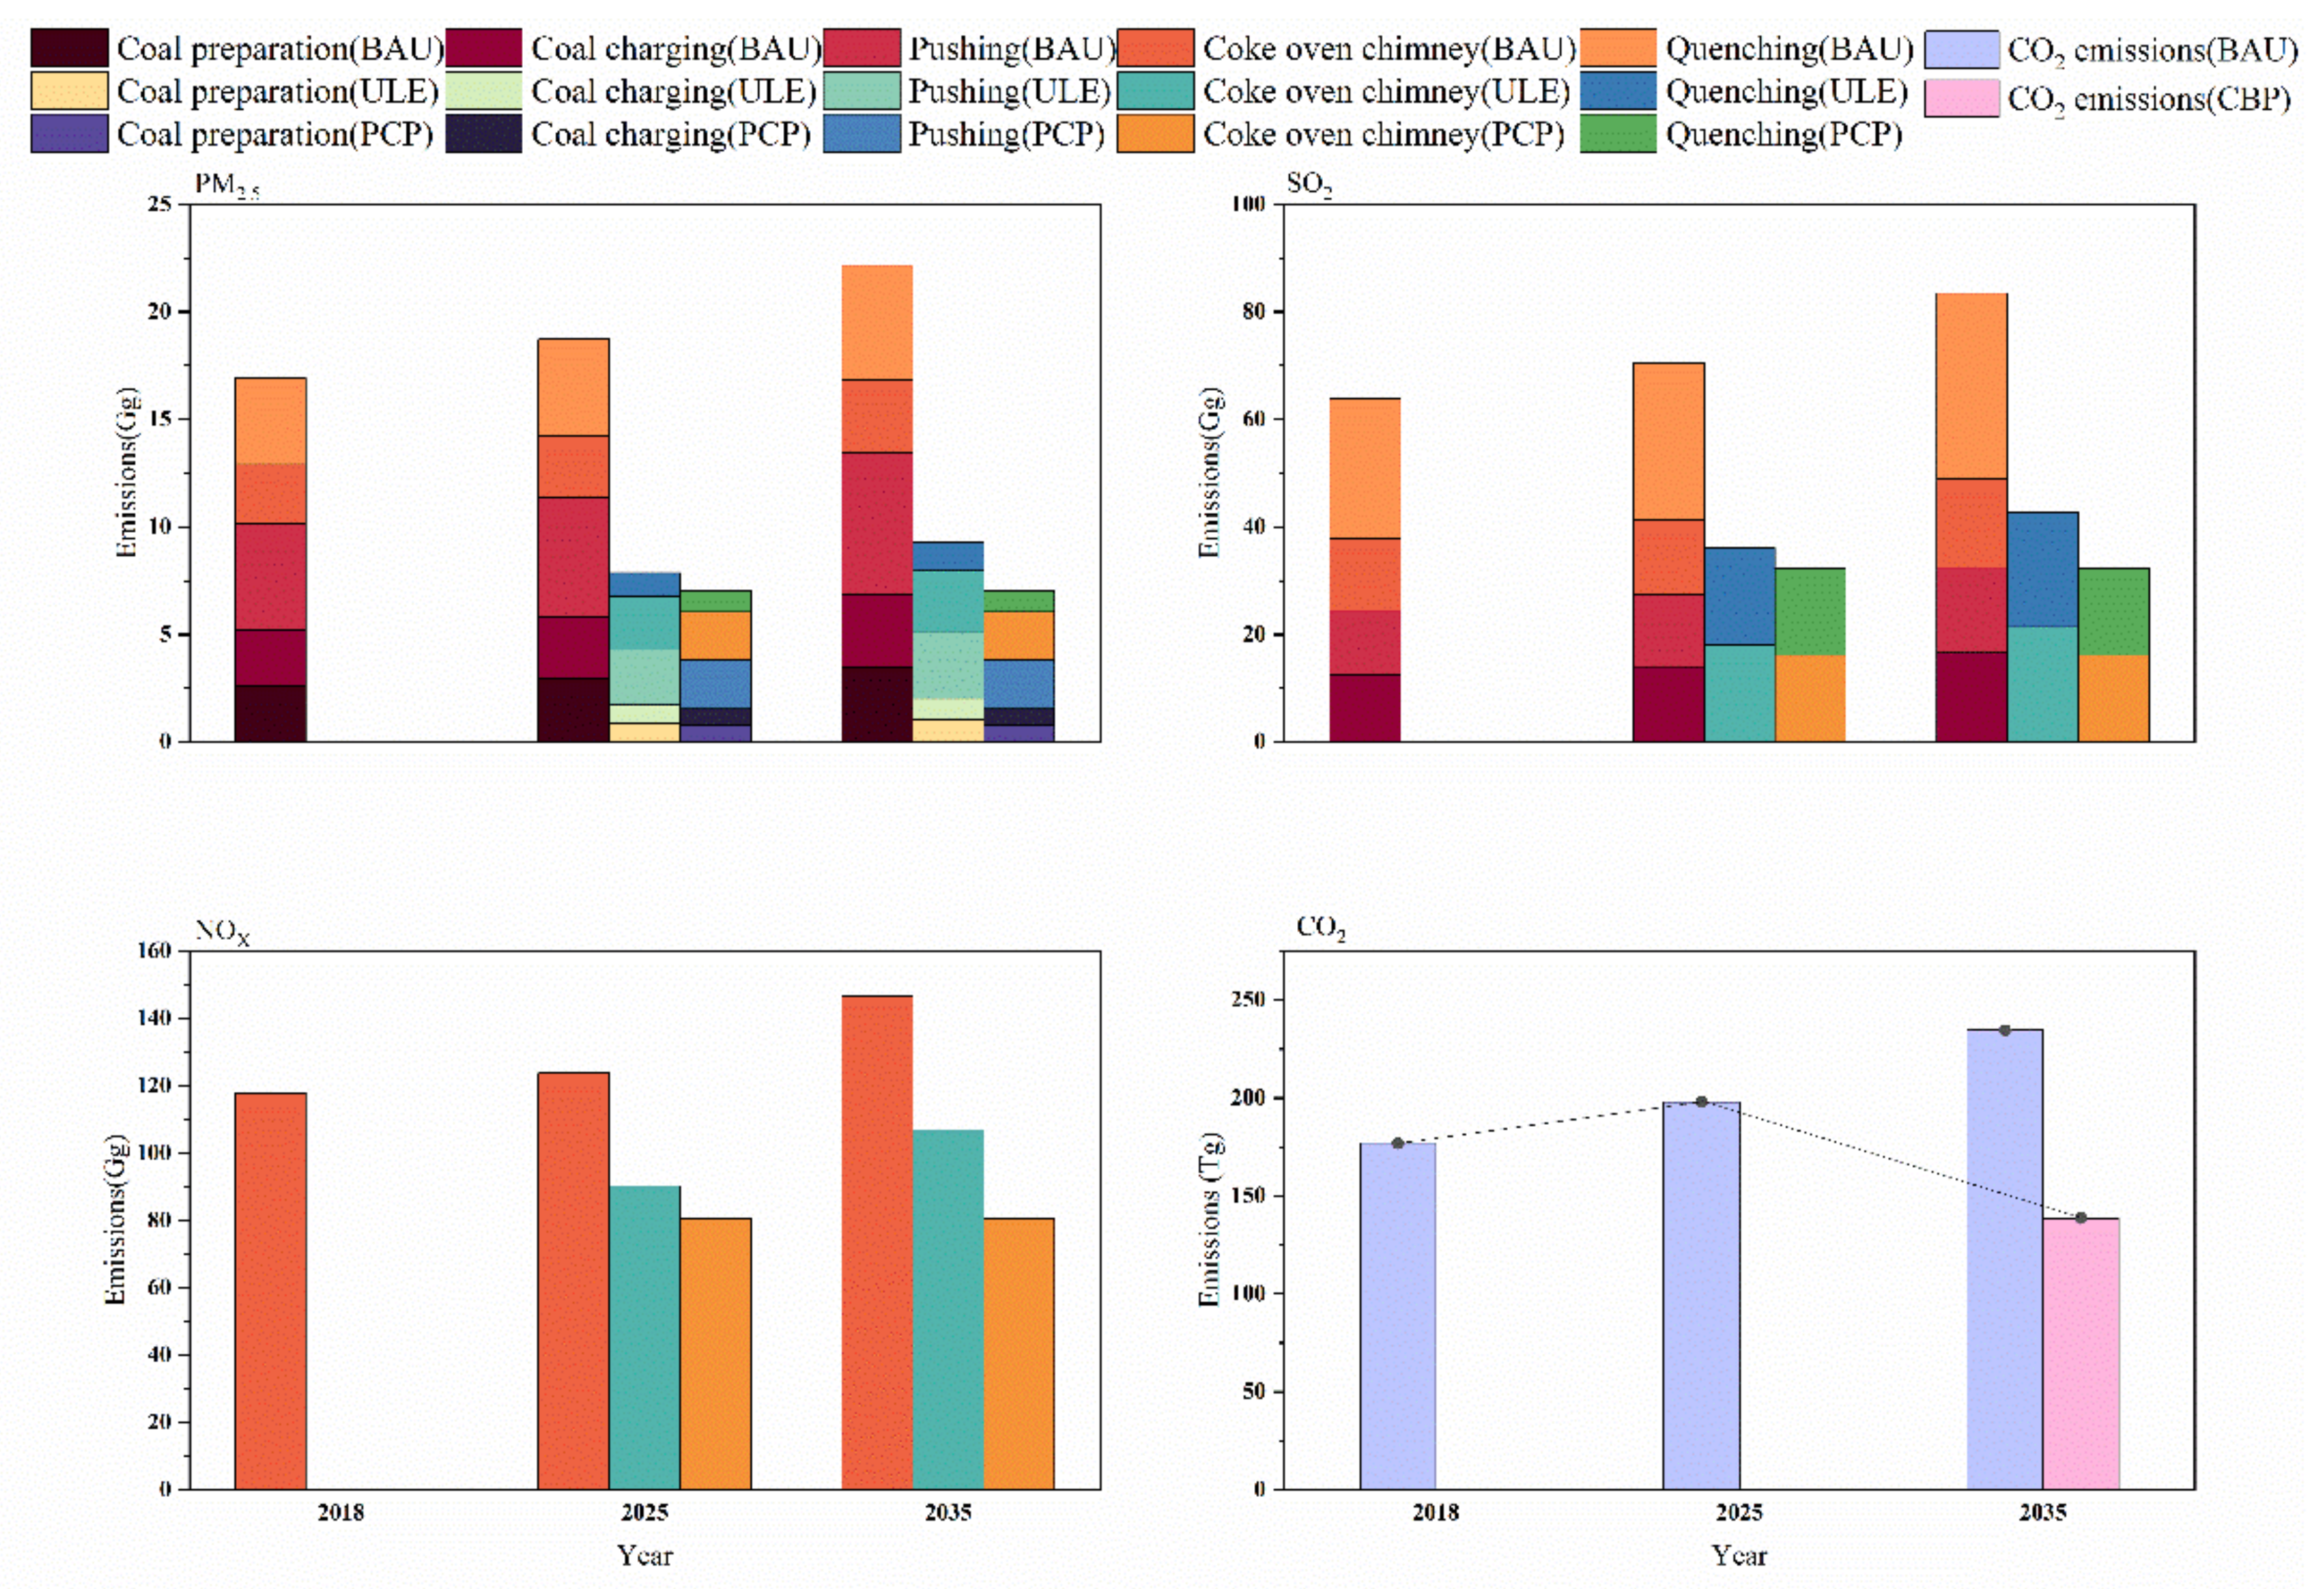
We have established four scenarios to estimate air pollutants and CO
2 emissions of each emission unit in future in
Figure 6. In the BAU scenario, emissions of PM
2.5, SO
2, and NO
X increased 1.81 Gg (10.69%), 6.62 Gg (10.37%) and 6.13 Gg (5.21%) in 2025, respectively. Furthermore, emissions of PM
2.5, SO
2, and NO
X in 2035 were 5.26 Gg (31.10%), 19.62 Gg (30.73%), and 28.97 Gg (24.61%) higher than 2018.
Under the ULE scenario, emissions of PM2.5 were 10.86 Gg (58.04%) lower than those under BAU scenario in 2025, to which the contributions of Coal preparation, Coal charging, pushing, Coke oven chimney, and Quenching were 18.89%, 18.71%, 27.46%, 3.68%, and 31.26%, respectively. Emissions of SO2, under the ULE scenario, are 34.41 Gg (48.84%) lower than those under BAU scenario in 2025, to which the contributions of Coal charging, pushing, Coke oven chimney and Quenching were 40.61%, 38.92%, −11.80% and 32.27%, respectively. This showed that the emission reduction of SO2 in the coke oven chimney process in 2018 has been implemented well and has reached the standard of ultra-low emission reduction in the future. NOX emissions decreased 33.66 Gg (27.18%) in the Coke oven chimney unit compared to those under the BAU scenario in 2025. With the contribution of each emission unit unchanged, emissions of PM2.5, SO2, and NOX under the ULE scenario were 12.86 Gg, 48.84 Gg, and 27.18 Gg lower than those under BAU scenario in 2035. In comparison with 2018, the emissions of PM2.5, SO2, and NOX under the ULE scenario will be reduced by 44.99%, 33.12%, and 9.25%, respectively, in 2035. It can be seen that the adoption of advanced PM2.5, SO2, and NOX governance measures for Quenching, Coal charging and Coke oven chimney respectively is important for the emission reduction of the independent coking industry.
Under the PCP scenario, emissions of PM2.5, SO2, and NOX are 0.84 Gg, 3.84 Gg, and 9.61 Gg which were lower than those under ULE scenario in 2025, and in 2035, emissions of PM2.5, SO2, and NOX under the ULE scenario are 2.29 Gg, 10.49 Gg, and 26.25 Gg lower than those under the ULE scenario. This is mainly due to the fact that, under the PCP scenario, the coke production was in a state of continuous non-increase.
For CO2 emission scenarios, we have set up two scenarios: the BAU scenario and the CBP scenario. In the BAU scenario, compared with the base year in 2018, CO2 emission of the independent coking industry would increase 21.11Tg (11.93%) in 2025, and 57.63Tg (32.58%) in 2035 based on that in 2018. Then we consider the target by 2025 and establish the CBP scenario. In this scenario, the emission of CO2 will peak in 2025, and begin to decline. In 2035, CO2 emissions under the CBP scenario will be 95.92Tg (40.90%) lower than those under BAU scenario and will decrease by 30.00% compared with the target peak in 2025. This means there will be a huge reduction space in the CO2 emission of the independent coking industry. The result showed that there was large co-benefit between air pollutants and CO2 reduction potential by developing ULE standards and carbon-neutrality policies.
4. Conclusions
This work represented the first attempt to distinguish the coking industry from the independent coking industry, establish a complete inventory of multiple air pollutants and CO2 associated with the independent coking industry, and analyze the emission characteristics and potential emissions reduction of Chinese independent coking industry at a higher resolution. By introducing more reliable enterprise-based data and combining with the highly time-sensitive emission factor database containing CEMS data, the air pollutant and CO2 emission inventory of China’s independent coking industry was constructed from 2001 to 2018. According to our estimates, from 2001 to 2018, the emissions of PM, SO2, NOX, BC, and OC showed a trend of decrease after increase, reaching a peak in 2011 (2016 for NOX), and the emissions of CO, VOCS, and CO2 showed a trend of straight rise. The emissions of air pollutants from coking plants in China are geographically dispersed; however, they are concentrated mainly in northern China. Coke production and emissions of PM2.5, SO2, and NOX associated with China’s independent coking industry in 2018 were greatest in the provinces of Shanxi, Shaanxi, Hebei, Inner Mongolia, and Shandong, accounting for 65.77%, 65.40%, 65.69%, and 66.17% of the national total, respectively. In terms of each component of the coking procedures, including coal preparation, coal charging, coke pushing, the coke oven chimney, and quenching, the coke oven chimney is the only procedure that emits NOX. For PM2.5 emissions, pushing is the most important procedure from beginning to end. However, for SO2 emissions, following updates of emission reduction technologies, the most important component of the coking procedure has changed from the coke oven chimney to quenching. In order to achieve the collaborative control of pollution reduction and carbon reduction in the independent coking industry, we set up four scenarios to estimate the emission reduction potential of air pollutants and CO2 in the coming years, and the results show that, from 2018 to 2035, under the ULE scenario, PM2.5, SO2, and NOX emissions will be reduced by 44.99%, 33.12%, and 9.25% respectively, and under the PCP scenario, the emissions of PM2.5, SO2, and NOX can also decrease by 24.58%. Under the CBP scenario, CO2 emissions will peak at 197.99 Tg in 2025 and decrease to 70% of the peak in 2035. Compared with other emission inventories, it had higher resolution and more accurate features. By establishing relevant scenarios based on existing policy documents, the coordinated emission reduction potential of air pollutants and CO2 in the coming years is estimated. More measured data will be introduced to further improve the accuracy of industry emission estimates.


