Article

Spatiotemporal Variations of XCH4 across China during 2003–2021 Based on Observations from Multiple Satellites

1
International Institute for Earth System Science, Nanjing University, Nanjing 210023, China
2
Jiangsu Center for Collaborative Innovation in Geographical Information Resource Development and Application, Nanjing 210023, China
3
College of Surveying and Geo-Informatics, North China University of Water Resources and Electric Power, Zhengzhou 450046, China
4
State Key Laboratory of Environmental Criteria and Risk Assessment, Chinese Research Academy of Environmental Science, Beijing 100012, China
5
School of Geography Science and Geomatics Engineering, Suzhou University of Science and Technology, Suzhou 215009, China
*
Author to whom correspondence should be addressed.
Atmosphere 2022, 13(9), 1362; https://doi.org/10.3390/atmos13091362
Submission received: 23 July 2022 / Revised: 19 August 2022 / Accepted: 23 August 2022 / Published: 25 August 2022
(This article belongs to the Section Atmospheric Techniques, Instruments, and Modeling)

Abstract

:
Atmospheric methane (CH4) is an important greenhouse gas that can reflect variations of CH4 emissions and sinks. This study aimed to detect spatial and temporal variations of atmospheric CH4 concentrations in China during 2003–2021 based on CH4 column-averaged dry-air mole fraction (XCH4) products from three satellites, namely, Scanning Imaging Absorption Spectrometer for Atmospheric Chartography (SCIAMACHY), Greenhouse Gases Observing Satellite (GOSAT), and Copernicus Sentinel-5 Precursor (S5P). The results revealed that XCH4 observed from three satellites showed high agreement in spatiotemporal variations and demonstrated good consistency with ground station measurements. The correlation coefficients (r) between the three satellites were 0.72 and 0.73, and the correlation coefficients for the ground stations were 0.79, 0.66, 0.03, 0.21, 0.70, and 0.80. The spatial distribution of XCH4 in China was generally high in the east and low in the west and close to that of CH4 emissions, indicating that CH4 emission sources dominated the spatial variations of atmospheric XCH4. From 2003 to 2006, XCH4 remained stable with an annual growth rate of 0.51 ppb·yr−1 and then abruptly increased with an overall growth rate of 6.96 ppb·yr−1. There were obvious seasonal changes in XCH4, with peaks in autumn and summer and nadir in winter and spring. These seasonal variations of XCH4 were related to CH4 emissions from rice planting. Rice cultivation areas generally had high XCH4 concentrations, and the growth cycle of rice plants significantly contributed to seasonal variations of XCH4 in the main rice planting areas. These results provide scientific data that could encourage decision-makers to enact policies and processes to reduce methane emissions.

1. Introduction

Methane (CH4) is an important greenhouse gas, second only to carbon dioxide [1]. The radiative forcing of CH4 is more than 80 times that of carbon dioxide. From 1750 to 2020, the increasing ratio of CH4 concentrations was more than three times that of CO2 [2,3]. This rapid increase in atmospheric CH4 deserves much attention; however, spatial and temporal variations of methane emissions have not been well understood [4]. As China is one of the countries with the largest carbon emissions, it is critical to understand temporal and spatial variations of atmospheric CH4 concentrations to help formulate effective emission reduction strategies.
Several techniques have been developed to measure atmospheric CH4 concentrations, including ground-based, aircraft, and satellite monitoring. Among these methods, satellites can observe temporal and spatial variations of CH4 concentrations on a regional or global scale [5]. Several sensors can provide CH4 concentrations, such as the Atmospheric Chemistry Experiment Fourier Transform Spectrometer (ACE-FTS), Atmospheric Infrared Sounder (AIRS), Infrared Atmospheric Sounding Interferometer (IASI), Michelson Interferometer for Passive Atmospheric Sounding (MIPAS), Scanning Imaging Absorption Spectrometer for Atmospheric Chartography (SCIAMACHY), Greenhouse Gases Observing Satellite (GOSAT), Tropospheric Emissions Spectrometer (TES), and TROPOspheric Monitoring Instrument (TROPOMI) mounted on Copernicus Sentinel-5 Precursor (S5P). Since 2002, these satellites have provided gridded daily or monthly data products on CH4 concentrations in the atmosphere on a global capacity. CH4 column-averaged dry air mole fractions (XCH4) is defined as the total column amount of CH4 divided by the total column amount of dry air, and it is often used to study variations of atmospheric CH4.
These satellite observations have been used to study spatial and temporal distribution of CH4 concentrations in the atmosphere and their driving forces on a regional scale. Based on SCIAMACHY, Zhang analyzed the spatial distribution of XCH4 in China during 2003–2005 [6], Kavitha studied the trends in XCH4 over the Indian region during 2003–2009 [7], and Frankenberg reported trends and variability of XCH4 globally during 2003–2009. Based on GOSAT, Qin preliminary assessed XCH4 variations in China during 2010–2012 [8], Kivimäki analyzed the average XCH4 between latitudes 44.43° S and 53.13° N during 2009–2017 [9], and Islam detected XCH4 trends in Western Canada for the period 2009–2019 [10]. Zhang studied XCH4 spatial distribution in China using S5P during 2018–2021 [11]. Most of these studies used observations from one satellite to study the long-term variations of CH4 in China over no more than 10 years due to the limited life cycle of one single satellite.
Fortunately, although these satellites carried different instruments to observe CH4 in the atmosphere, the CH4 concentrations from different satellites presented relative consistency. For example, Zou found that the correlation coefficients of CH4 columns from AIRS and GOSAT were more than 0.8 and that the difference was larger in high-latitude regions than in lower-latitude regions [12]. Hu presented a comparison of XCH4 products from S5P and GOSAT that showed excellent consistency [13]. Zhang found that atmospheric CH4 from AIRS, SCIAMACHY, and GOSAT were in good agreement with those from ground-based measurements [14]. These studies highlight the potential of studying long-term variations based on serious observations from satellites.
In the present study, we aimed to obtain an overall insight on spatiotemporal trends of CH4 based on monthly XCH4 products from multiple satellite observations, namely, SCIAMACHY, GOSAT, and S5P. The rest of the paper is structured as follows. Section 2 introduces data sources and methods, Section 3 demonstrates the accuracy and consistency of satellite data on XCH4 and analyzes spatiotemporal variations of XCH4 concentrations in China. The effects of rice planting on the seasonal cycle of XCH4 are then evaluated, and the analysis is summarized in Section 4.

2. Materials and Methods

2.1. Materials

2.1.1. Satellite-Observed Atmospheric XCH4

SCIAMACHY on board ENVISAT (Environmental Satellite) was launched in March 2002 [15]. The spectral information in 2360–2385 nm at spectral resolutions of 0.2 nm was used to retrieve data on CH4. XCH4 was inversed from the proxy algorithm by applying WFM-DOAS to a small spectral fitting window in SCIAMAHCY. This method assumes that the scattering effect is offset in the CH4 to CO2 column ratio and that prior estimation of the CO2 column is accurate enough to reliably recalculate the CH4 column according to this ratio [16]. The SCIAMACHY monthly XCH4 data (from January 2003 to December 2011) used in this study were provided by Bremen University in Germany and were retrieved by the WFM-DOAS algorithm [15,17,18,19].
GOSAT was launched on 23 January 2009 with the aim of estimating global distributions and temporal variations of greenhouse gas emissions. It was equipped with TIR and NIR Sensor for Carbon Observation Fourier Transform Spectrometer (TANSO-FTS) and Cloud and Aerosol Image (CAI). The TANSO-FTS measures greenhouse gases, while the CAI detects clouds and aerosols [20,21,22]. This study used XCH4 data from the bias-corrected FTS level 2 CH4 products (v02.95) from January 2010 to December 2021.
S5P was the first Copernicus mission and provided data on atmospheric CH4 concentration that have high sensitivity to the lower atmosphere and high spatiotemporal resolution to facilitate understanding of methane sources and sinks. It was launched on 13 October 2017 carrying a single instrument, TROPOMI. For this study, we used S5P RPRO (L2) CH4 products from January 2019 to August 2019 with a spatial resolution of 7 × 7 km2 and products from August 2019 to December 2021 with a spatial resolution of 5.5 × 7 km2. These were stored in net CDF format, and pixels with qa_value < 0.8 were filtered to ensure data quality.

2.1.2. Ground Observations of CH4 Concentrations from WDCGG

The ground observations of CH4 from the World Data Centre for Greenhouse Gases (WDCGG) were used to evaluate the satellite observations. WDCGG is one of seven Global Atmosphere Watch Program (GAW) world data centers responsible for archiving greenhouse gas monitoring. The estimated precision of measurements of CH4 concentrations is ±0.2% [23]. We obtained monthly measurements of CH4 concentrations from six ground stations located in and close to China. Lulin (LLN), Shangdianzi (SDZ), and Waliguan (WLG) are located in China [24], while Anmyeon do (Amy), Pha Din (PDI), and Ulaan UUL (UUM) are located in areas near China. Monthly data from 2003 to 2021 was collected, and CH4 concentrations that deviated by two times the standard deviation were excluded to ensure data quality. More specific information about the six stations is shown in Table A1.

2.1.3. CH4 Emissions from EDGAR

The gridded CH4 emissions database in China was from the Emissions Database for Global Atmospheric Research (EDGAR), which is a widely used inventory for anthropogenic emissions of greenhouse gases on Earth. EDGAR provides CH4 emission estimation from sector-specific grid maps at 0.1° × 0.1° resolution with yearly, monthly, and hourly data using the IPCC methodology. This study collected data on yearly CH4 total emissions from all sectors and monthly sector-specific grid maps for 2003–2018.

2.1.4. Enhanced Vegetation Index from MODIS

As an optimized vegetation index, enhanced vegetation index (EVI) is less influenced by the atmosphere or underlying surface, has improved sensitivity in high biomass areas, and can be used to estimate the gross primary production of paddy rice [25]. The EVI in China was from the National Aeronautics and Space Administration. The dataset used a MODIS-specific synthesis method to remove low-quality pixels to ensure product quality, with temporal resolutions of 16 days and one month and spatial resolutions of 250 m, 500 m, 1 km, and 0.05°. In this study, we used monthly MODIS-based EVI from 2003 to 2021 with spatial resolution of a 0.05° × 0.05° grid.

2.1.5. Rice-Harvested Area from EARTHSTAT

The gridded dataset of rice-harvested area was provided by University of Minnesota and University of British Columbia. This dataset was created by collecting census statistics at the national, state, and county levels. The database describes the average fractional proportion of rice paddy crop areas at a spatial resolution of 10 km × 10 km and could represent the complete and detailed source of spatial agricultural systems in existence.

2.2. Methods

2.2.1. Inverse Distance Weighted Interpolation Method

The inverse distance weighted (IDW) interpolation method accounts for the reciprocal relationship between distance and weight, which can interpolate in an exact and smooth way to estimate the value of an unobserved point [26]. The IDW function is as follows:
V e = i = 1 n w i v i
where V e is the point ( x e , y e ) to be evaluated, v i (i = 1, 2, …, n) is the observation point ( x i , y i ) involved in interpolation around ( x e , y e ), and   w i is the weight coefficient that can be calculated as follows:
W i = d e j p i = 1 n d e j p
where n is the number of points involved in interpolation, d e j is the distance between ( x e , y e ) and ( x i , y i ), and p = 1 or 2 and represents the function of reciprocal or reciprocal squares of distance, respectively. The IDW method was utilized for the area without a value to help generate the monthly average XCH4 grid datasets for SCIAMACHY, GOSAT, and S5P with a grid resolution of 0.5° × 0.5°.

2.2.2. A Linear Sinusoidal Trend Model with a Seasonal Component

A linear sinusoidal trend model has been widely used to detect long-term trends and seasonal variations of atmospheric components. This model was used to simulate the trends of atmospheric SO2, CH4, and NO2 in China [27,28,29]. The long-time trends of XCH4 concentrations over China from January 2003 to December 2021 were simulated using a linear sinusoidal trend model.
The model formula is as follows:
Yi = A + BXi + C sin(DXi + E) + Mi
where Yi represents the monthly XCH4 concentrations (ppb) at month i; Xi is the number of months after January 2003; Mi is the residual; and A, B, C, D, and E are the function parameters.

2.2.3. Mann–Kendall Test and Theil–Sen Estimator

The Mann–Kendall (MK) test is a nonparametric time-series trend test method that does not need the measured values to obey the normal distribution and is not affected by missing values and outliers [30]. It is suitable for trend significance test of long-time series data. Based on the time-series variables (x1, x2, … xn), the statistic variable S is calculated as follows:
S = i = 1 n 1 i = 1 n s g n x j x i
with the sample size n > 10, the standard normal test statistic ZMK is calculated using the following equation:
Z M K = S V a r S , ( S > 0 )       0 ,       S = 0 S + 1 V a r S , ( S < 0 )
where Var(S) is the variance and is calculated using the following equation:
Var S = n n 1 2 n + 5 p = 1 g t p t p 1 2 t p + 5 18
where p is the number of tied (same data observed) groups, and tp denotes the number of ties (same data observed) of extent p. A positive value of Z M K indicates an upward trend, and a negative value of Z M K indicates a downward trend. The absolute value of Z M K is greater than or equal to 1.28, 1.64, and 2.32, indicating that the upward and downward trend of this sequence has passed the significance test of 90%, 95%, and 99% reliability, respectively [31].
The Theil–Sen estimator is a robust nonparametric statistical trend calculation method with high computational efficiency and insensitive to measurement errors and outlier data [32]. Based on the time-series variables (x1, x2, … xn), the Theil–Sen slope β can be calculated as shown in Equation (7):
β = Median x j x i j i   j > i
The nonparametric Mann–Kendall and Theil–Sen slopes have been widely used in the fields of environment, hydrology, meteorology, and climatology by various authors [33,34,35].

3. Results and Discussion

3.1. Validation of Satellite XCH4 Accuracy and Consistency

The observed CH4 concentrations at six stations from WDCGG were used to test whether the XCH4 data from satellite observations could reflect temporal variations and spatial distributions of CH4 in the atmosphere (see Figure 1 and Table 1). The scatter plots showed there was good consistency between satellite-observed XCH4 concentrations and ground-observed CH4 concentrations except for PDI and SDZ. These results showed that satellite-observed XCH4 could indicate spatiotemporal variations of atmospheric CH4 at the four sites. The low correlation coefficient (r) at PDI and SDZ might be because there were only a few valid ground observations and we synthesized the monthly mean CH4 concentrations from satellite observation and ground observation to analyze their relevance. SDZ is located in Beijing, one of the biggest cities in China, where human activities and industrial production have more influence on ground-level CH4 concentrations than atmospheric CH4 [36]. PDI is in Vietnam, where CH4 might be affected by tropical long-distance atmospheric transmission [37].
Figure 1 shows that the observed CH4 concentrations were obviously higher than the satellite measurements of XCH4 concentrations. This is because ground-level CH4 concentrations are more influenced by emissions than those in the atmosphere as CH4 can be transported in the direction of atmospheric movement after being emitted into the atmosphere. Its concentrations show decreased gradient in the vertical directions, with the highest CH4 concentrations often occurring at the surface [38]. Table 1 shows that CH4 from ground measurements showed more consistency with XCH4 from GOSAT and S5P than from SCIAMACHY. The lowest correlation coefficient between GOSAT and ground measurements was 0.69, the highest correlation coefficient between SCIAMACHY and ground measurements was 0.41, and the correlation between S5P and ground measurements were between the two satellites.
It is important to note that data consistency between satellites has been proven in previous studies, so the specific value of the observation difference was not the main research objective of this study. However, considering that the systematic error between different satellites in China has not been studied and that this is important for the accuracy of spatiotemporal distribution through satellites with different time coverage, the uncertainty caused still needs to be discussed. The uncertainty of satellite observation is mainly due to the observation modes, CH4-retrieved algorithms, the instruments themselves, and height sensitivities [39,40,41]. The specific parameters of the three satellites are shown in Table 2. The reliability of the satellite itself should be determined before considering the differences between satellites. The accuracy of SCIAMACHY was verified by ground-based FTS measurements [42,43] and model simulation [44], with the overall error being below 5%. The relative deviation between GOSAT and China’s Hefei Station was about 0.34% [45], while GOSAT XCH4 data was consistent with aircraft-based measurements with a standard deviation of 14.9 ppb [46]. For S5P, the data was compared with COCCON and TCCON measurements, and the systematic difference was in the range of 3–6% on average [47,48,49]. These results show the reliability of satellite measurements, but the error between different satellites requires further comparison of the satellite products. Hu showed a comparison between GOSAT and S5P on the global scale and found an excellent agreement with a mean difference of 13.6 ppb [13]. Monteil performed a comparison between SCIAMACHY and GOSAT and found a remarkable agreement [50]. This suggests that the quality of satellite XCH4 data is comparable on a global scale. However, the consistency of satellite XCH4 products in China is still uncertain.
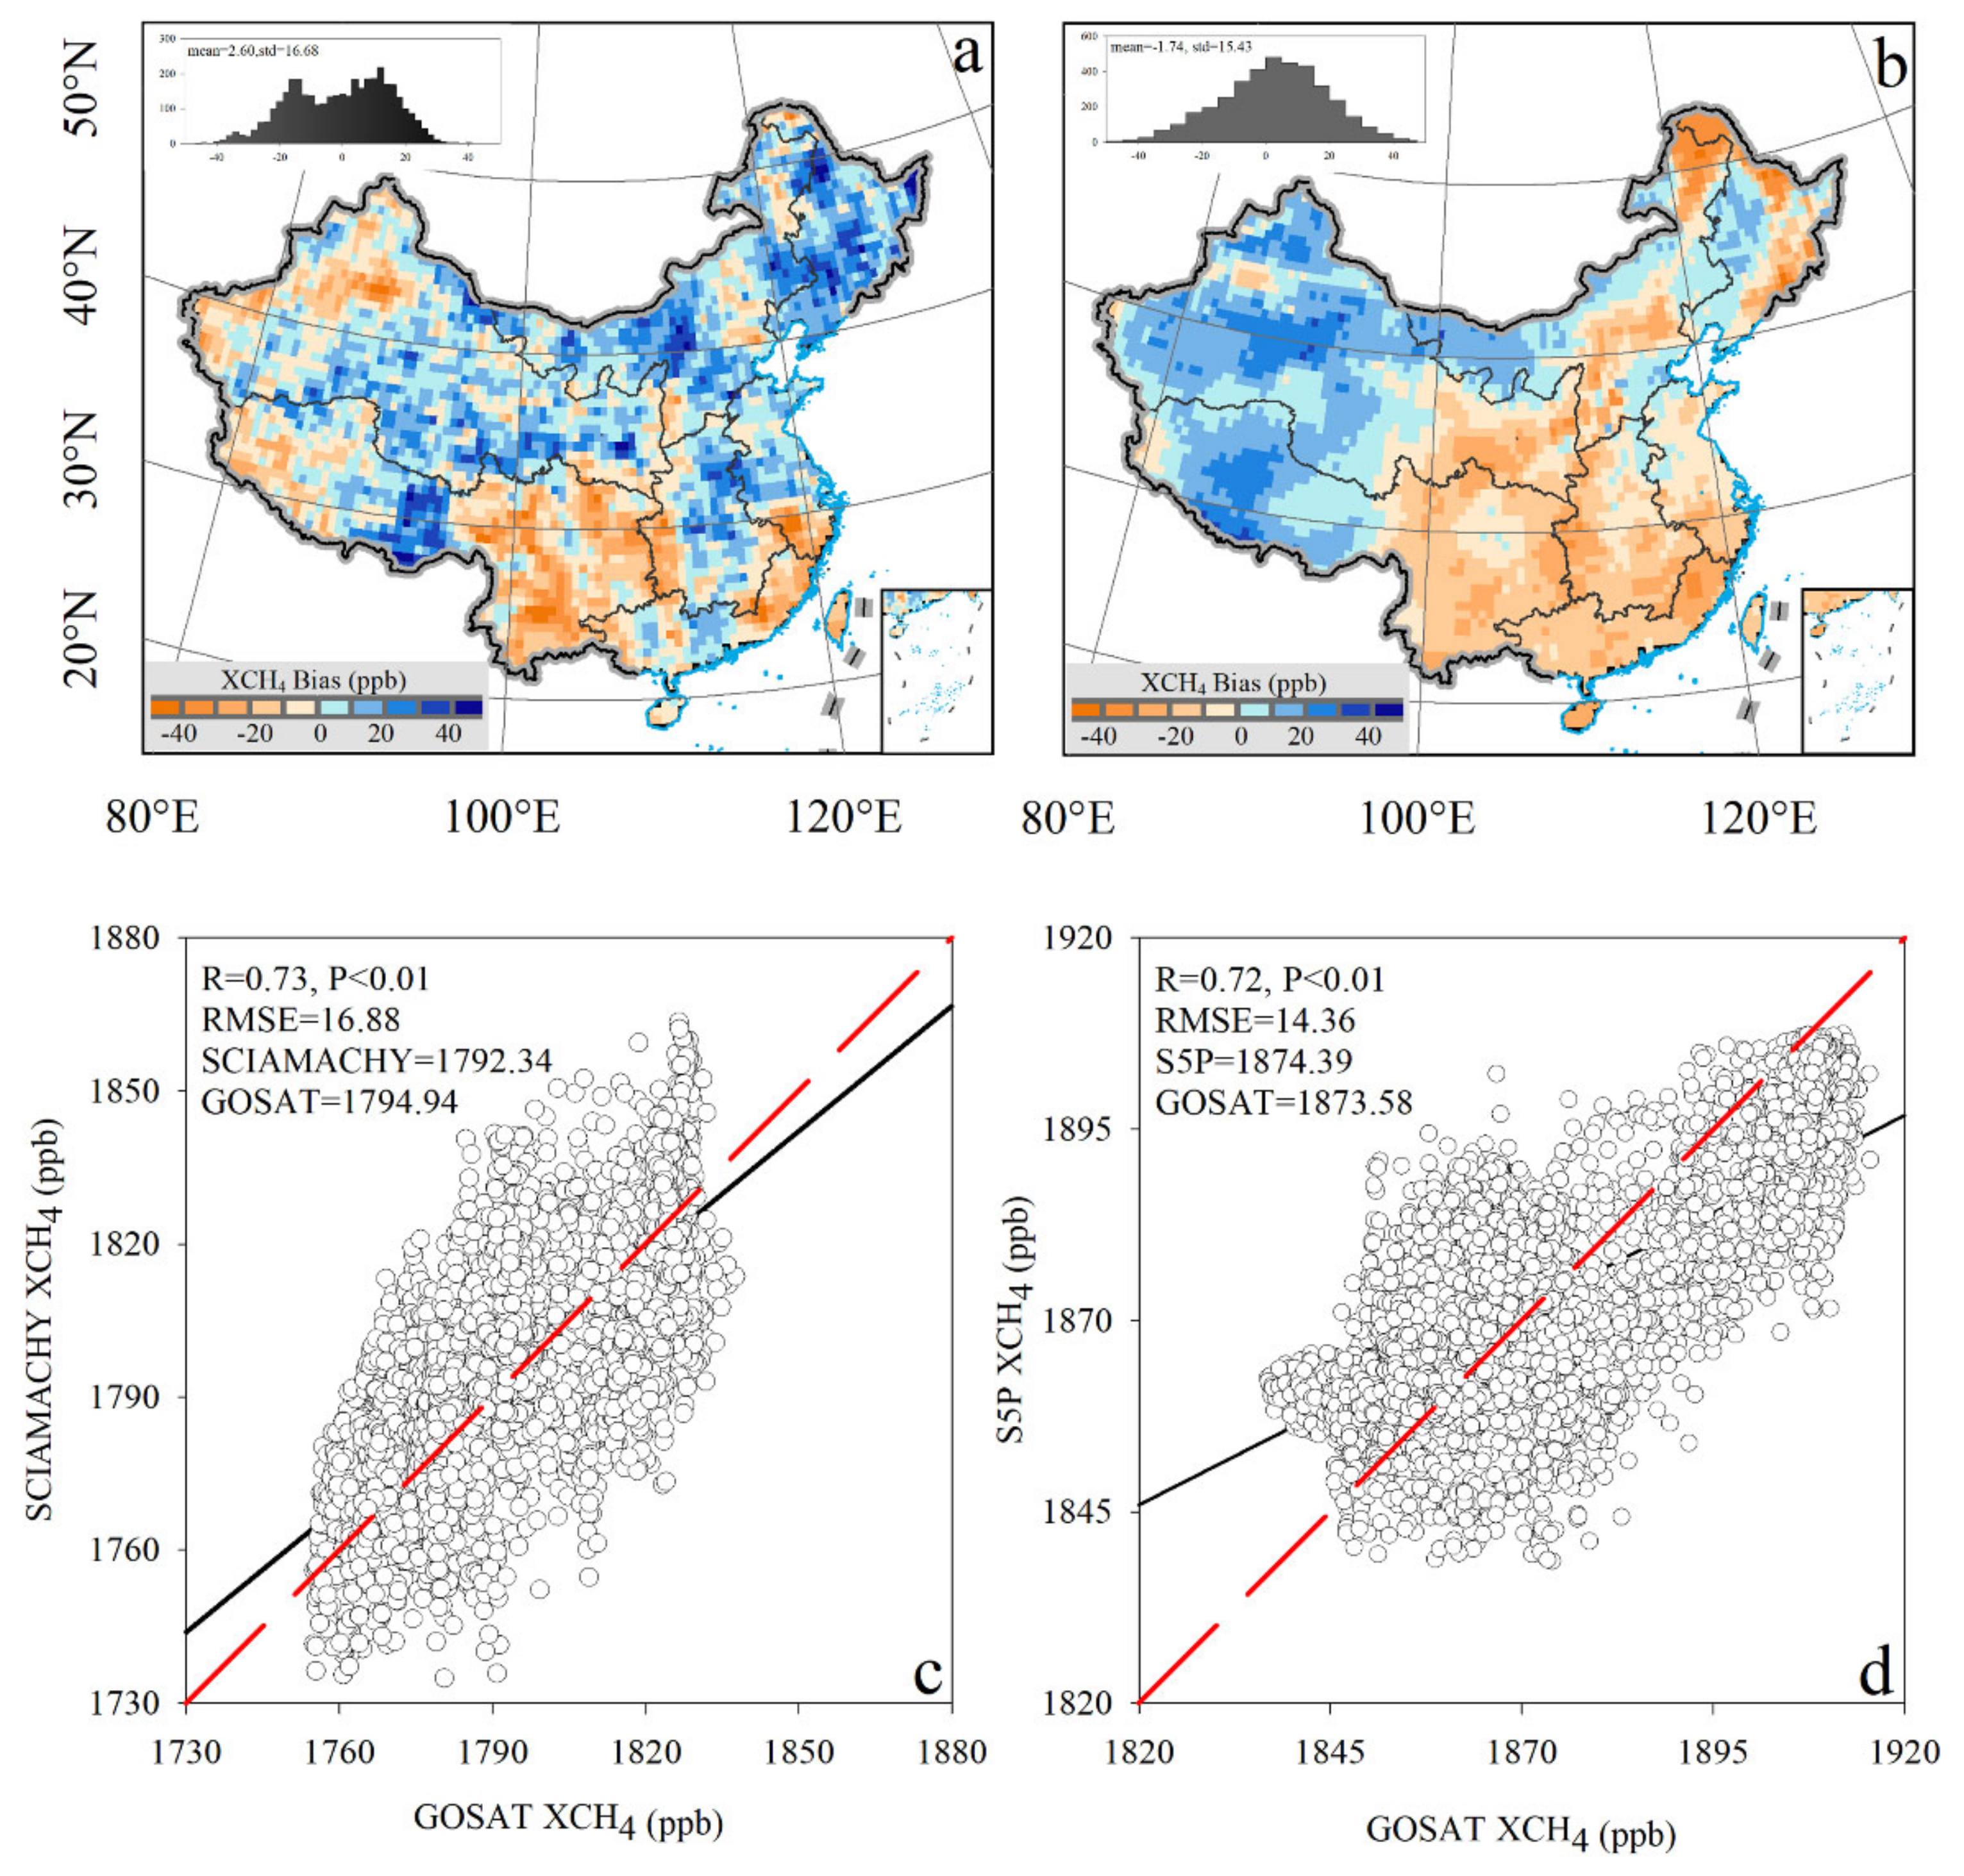
To analyze the deviations of XCH4 products from different satellites over China, we compared their observation results during the overlap time in Figure 2. The results showed that, on the pixel scale, the bias between SCIAMACHY and GOSAT ranged from −55 to 65 ppb with an average of 2.36 ppb, and the bias between S5P and GOSAT ranged from −45 to 38 ppb with an average of 1.90 ppb. At a pixel scale, the scatter plot showed that the mean XCH4 concentrations of SCIAMACHY and GOSAT were 1792.34 and 1794.94 ppb with a correlation coefficient of 0.73. The mean XCH4 concentrations of S5P and GOSAT were 1874.39 and 1873.58 ppb, respectively, and the correlation coefficient was 0.72. These results indicated that the overall observations of different satellites in China were highly consistent.

3.2. Spatial Distribution Patterns of Atmospheric XCH4 across China

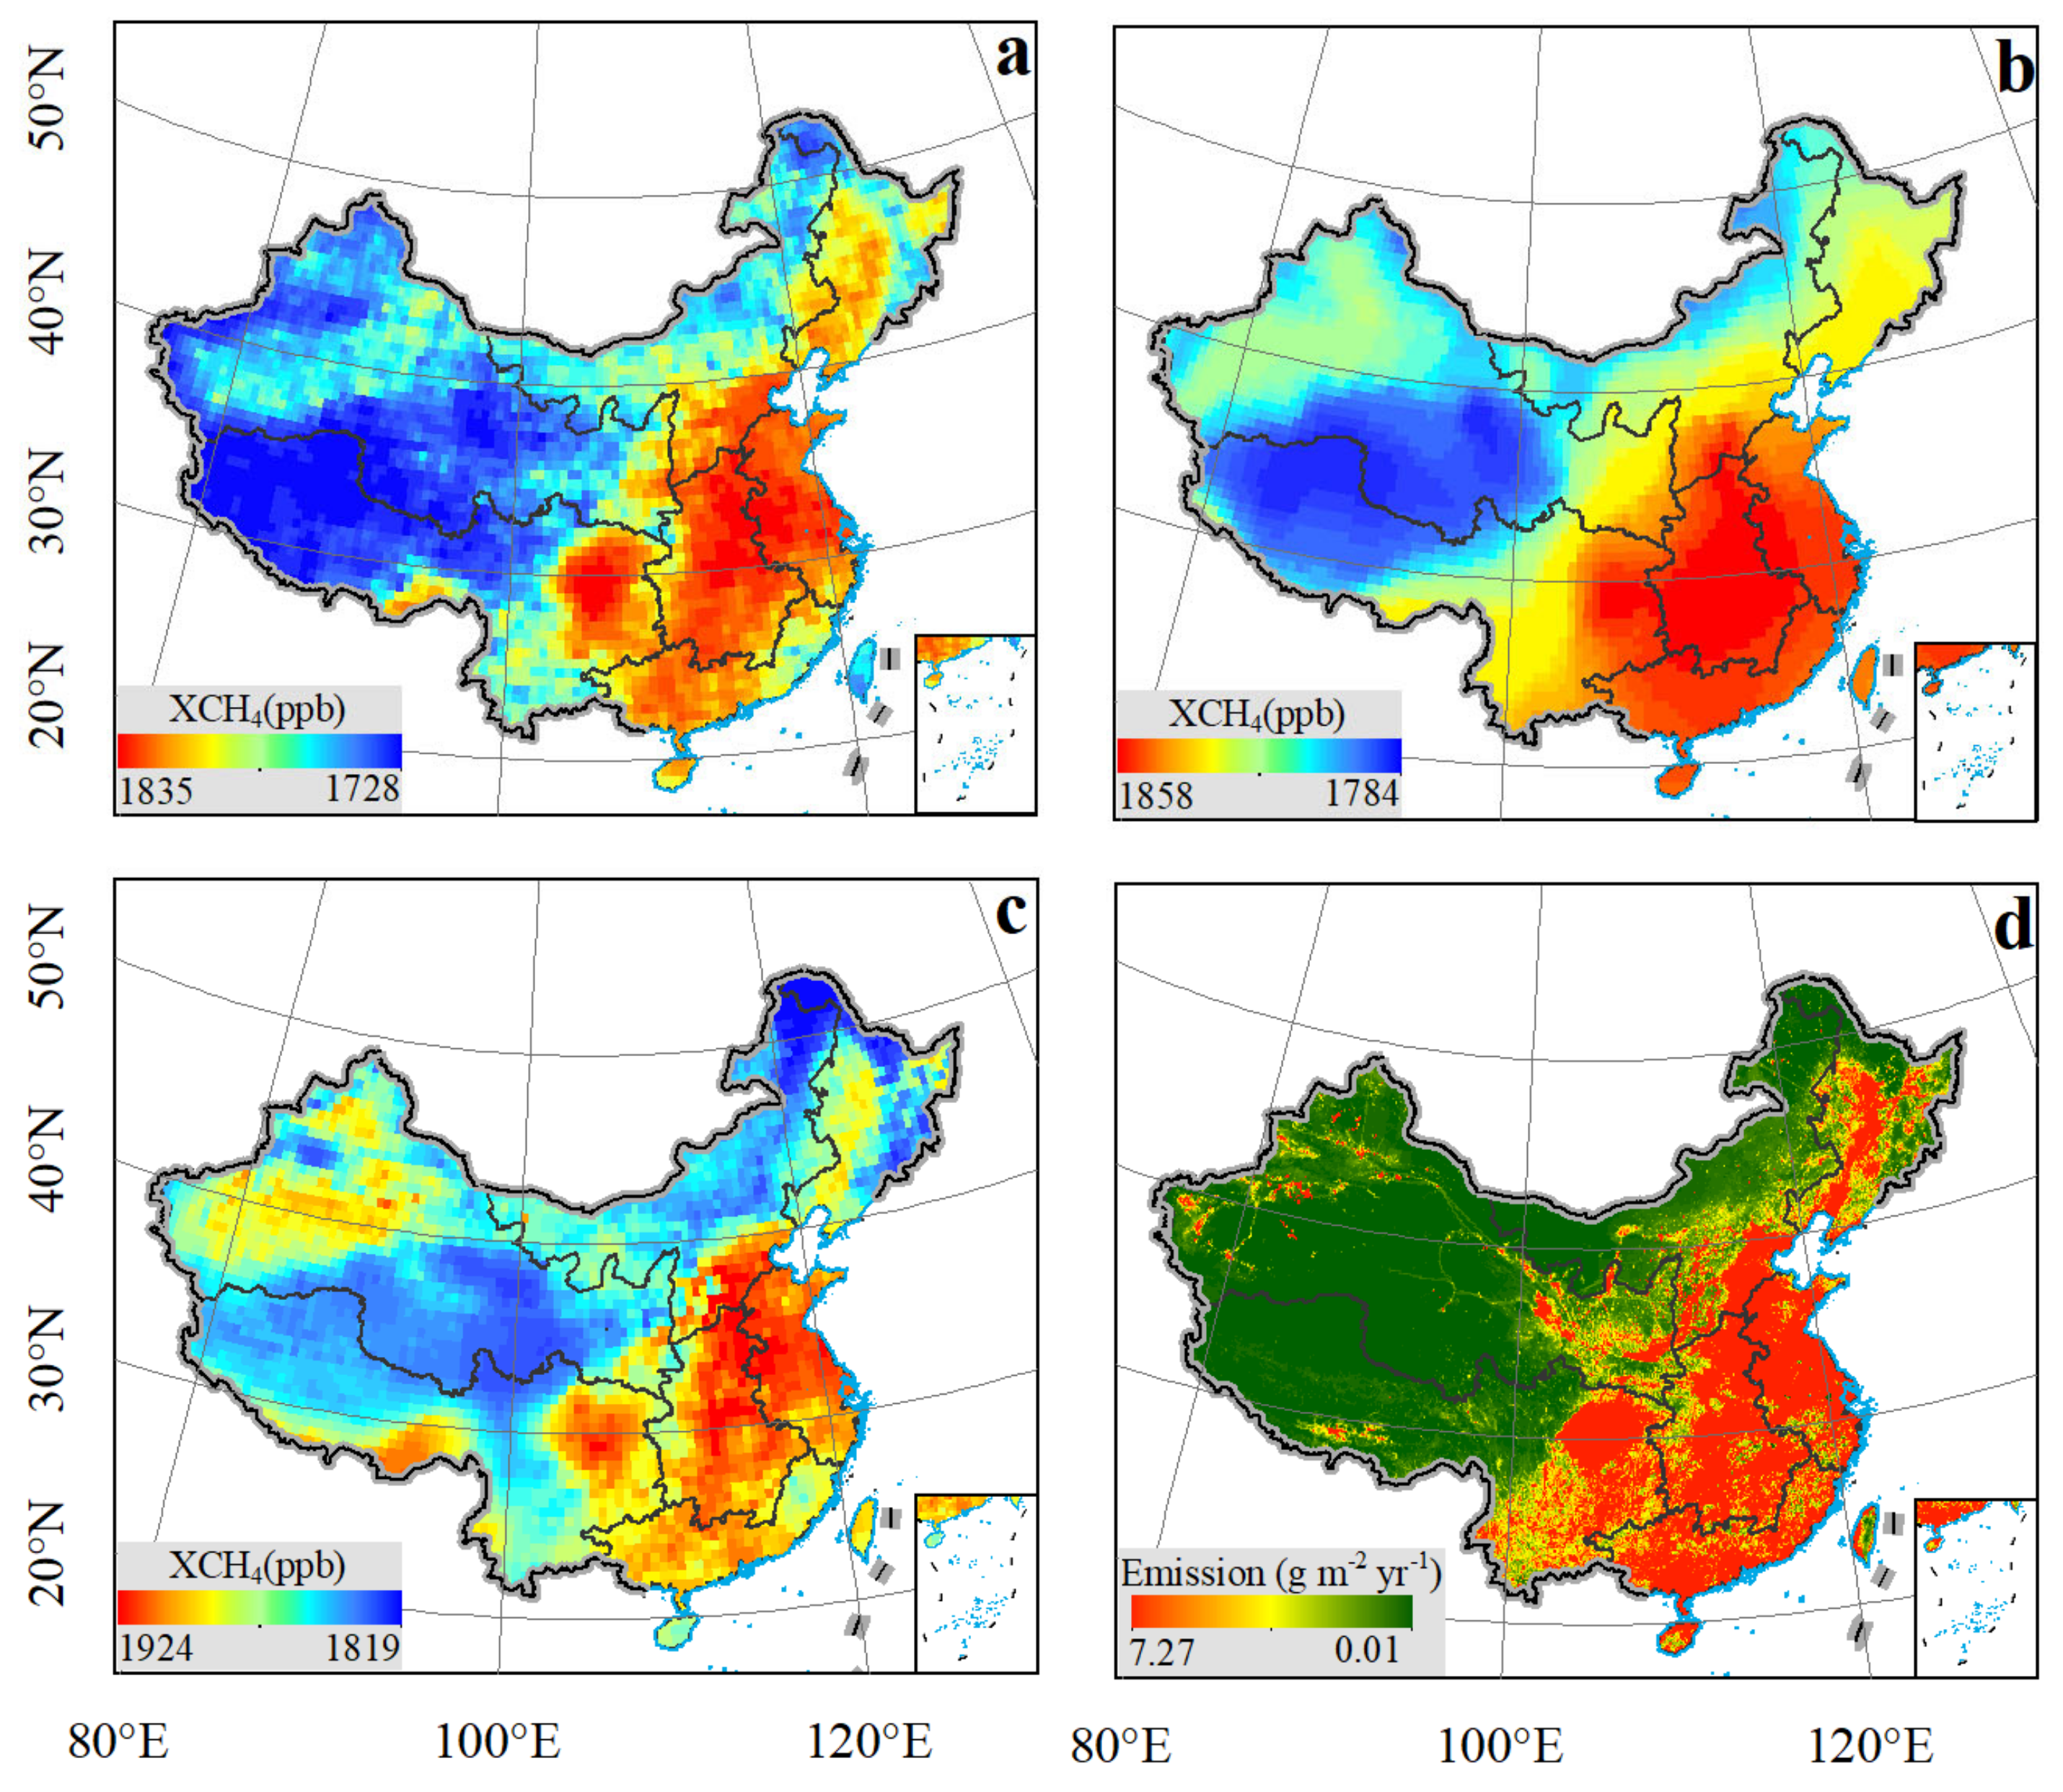
To analyze the spatial distribution patterns of XCH4 across China, the spatial distribution of multi-year-averaged XCH4 concentrations from three satellites and the multi-year-averaged CH4 emissions from EDGAR are illustrated in Figure 3. The range, average, and standard deviation of XCH4 concentrations from SCIAMCHY, GOSAT, and S5P were 1728 to 1835, 1777, and 18.52 ppb; 1784 to 1858, 1818, and 21.01 ppb; and 1819 to 1924, 1873, and 17.26 ppb, respectively. The spatial distributions of XCH4 from the three satellites were close, but SCIAMACHY and S5P provided more detailed information than GOSAT. The XCH4 concentrations showed greatly spatial variation in different regions of China and presented spatial cluster in different regions. Overall, there were low XCH4 concentrations in western China and high concentrations in eastern China (109–122° E, 20–41° N). Because CH4 is a long-lived gas that can exist in the atmosphere for 12.5 years, the spatial variations of atmospheric CH4 concentrations might reflect the accumulation of CH4 emissions and transportations.
The regions with high XCH4 concentrations were mainly distributed in Central China, East China, Sichuan Basin in Southwest China, and Beijing Tianjin Hebei region in North China, where the XCH4 concentrations were approximately 29 ppb higher than China’s average. The secondary high areas were found in South China, some regions of Northeast China, some regions of Tibet bordering India, and the Tarim Basin. The XCH4 concentrations in these areas were approximately 9 ppb higher than China’s average. The lowest XCH4 were in the Qinghai Tibet Plateau and Inner Mongolia Plateau, where the concentrations were approximately 17 ppb lower than China’s average.
In terms of EDGAR CH4 emission spatial distribution in Figure 3d, the spatial distribution pattern of satellite-observed XCH4 was highly consistent with CH4 emission, indicating XCH4 observed by satellite could reflect the spatial distribution of methane emissions. Regions with high XCH4 concentrations were mostly distributed near areas of high population density, large energy consumption, developed industrial activities, and large rice-growing areas.
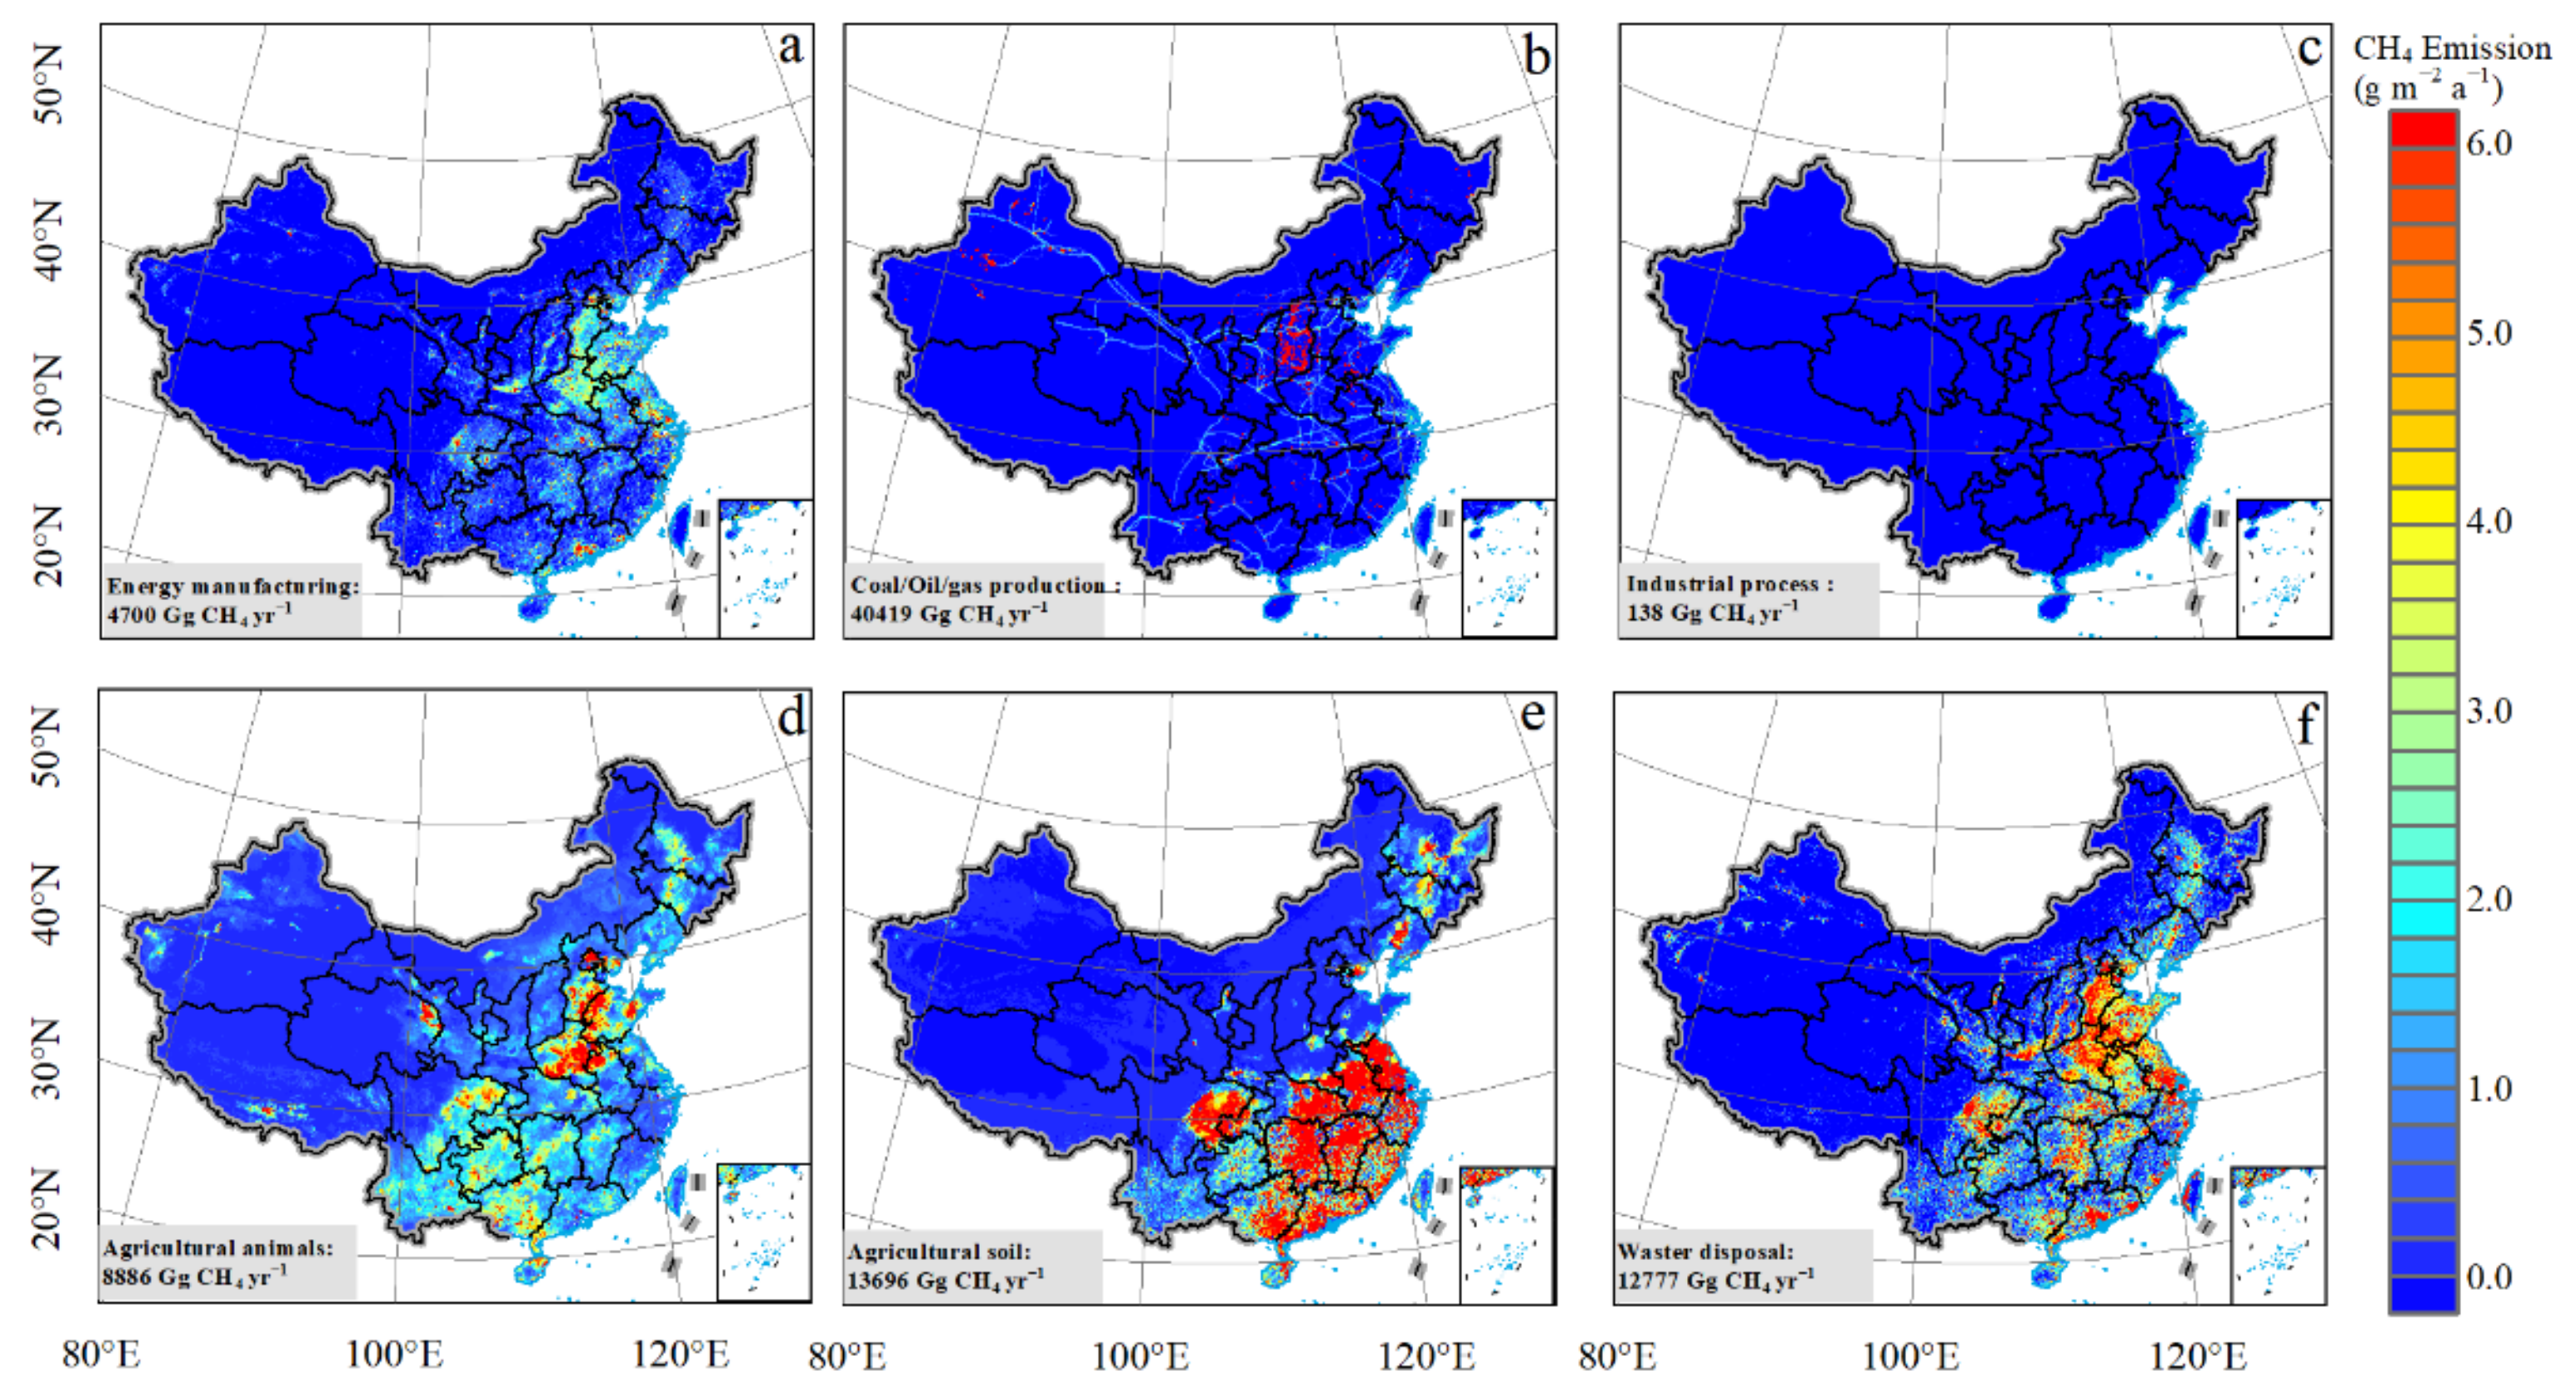
To further analyze the contribution of CH4 emission from different sectors to the spatial distribution of high XCH4 concentrations, we obtained the sector-specific CH4 emission from EDGAR. The XCH4 sources were divided into six categories according to the IPCC code: energy manufacturing, coal/oil/gas production, industrial process, agricultural animal (including enteric fermentation and manure management), agricultural soil (including rice cultivation and field burning of agricultural residues), and waste disposal (See Figure A1). China emitted about 80,000 Gg·yr−1, of which about 50% came from coal and oil exploitation, 30% from agricultural emissions, 15% from waste treatment, and others were mainly from industrial emissions and energy consumption.
Coal and oil exploitation emissions were at a very low level in most parts of China and mainly distributed in Shanxi, northwest Xinjiang, and other coal or oil fields, presenting highly spatial clusters. For agricultural emissions, rice cultivation emissions were mainly distributed in Sichuan Basin, Northeast China, and some regions of Northeast China, while enteric fermentation and manure management emissions were mainly distributed in North China. Waste disposal emissions areas were mainly distributed in densely populated areas, such as North China, Sichuan, Jiangsu, and Guangdong. This shows that CH4 emissions from different sources present different spatial clusters and further explains the spatial variations of XCH4 concentrations across China. We also computed the share of individual sectors in methane emissions (Figure A2). The main emission sources differed from the north to the south, with industrial-related emissions dominant in the north and agricultural emissions dominant in the south. Oil and coal mining in the northern region accounted for the main part of methane emissions, especially in Heilongjiang, Shanxi, Liaoning, Hebei, and Tibet. The rice emissions dominated anthropogenic emission in Southeast China, such as Zhejiang, Jiangsu, Jiangxi, Hunan, and other major rice planting areas.
For the Sichuan Basin and Southeast China (109–122° E, 20–34° N), including Jiangsu, Anhui, Hubei, Jiangxi, Fujian, Zhejiang, Guangdong, and Yunnan, high value of XCH4 concentrations in these areas were mainly caused by emissions from rice planting. These areas with high agricultural soil CH4 emissions, with total emissions reaching 10,732 Gg·yr−1, accounted for about 78% of China’s total agricultural soil emissions. These areas and the surrounding environment have appropriate temperature, sufficient sunlight and water, and rich organic nutrients, which provide good environmental conditions for the growth of rice and breeding of methanogens.
The Beijing Tianjin Hebei region has a large population, heavy industry, and serious waste pollution. Emissions in this region was mainly dominated by animal husbandry and waste disposal, with emissions from these sources reaching 2087 and 2475 Gg·yr−1, accounting for 23% and 19% of China’s total emissions, respectively. Energy manufacturing was also relatively high in this area, but the emission level was low. Shanxi is the major energy-producing area in China, and the CH4 emissions caused by the exploitation of coal accounted for more than half of China’s total coal/oil/gas production emission. For the high XCH4 concentrations in Northeast China, its spatial distribution was highly consistent with agricultural emissions and waste management. Northeast China has been a major rice planting area with many industrial bases producing substantial CH4 emissions. In the Tarim Basin, the high XCH4 concentrations observed might be due to the Tarim, Tahe, and Baolang oilfields, which are distributed in the Tarim Basin, with the coal/oil/gas production emission reaching 1772 Gg·yr−1.

3.3. Temporal Variation of Atmospheric XCH4 across China

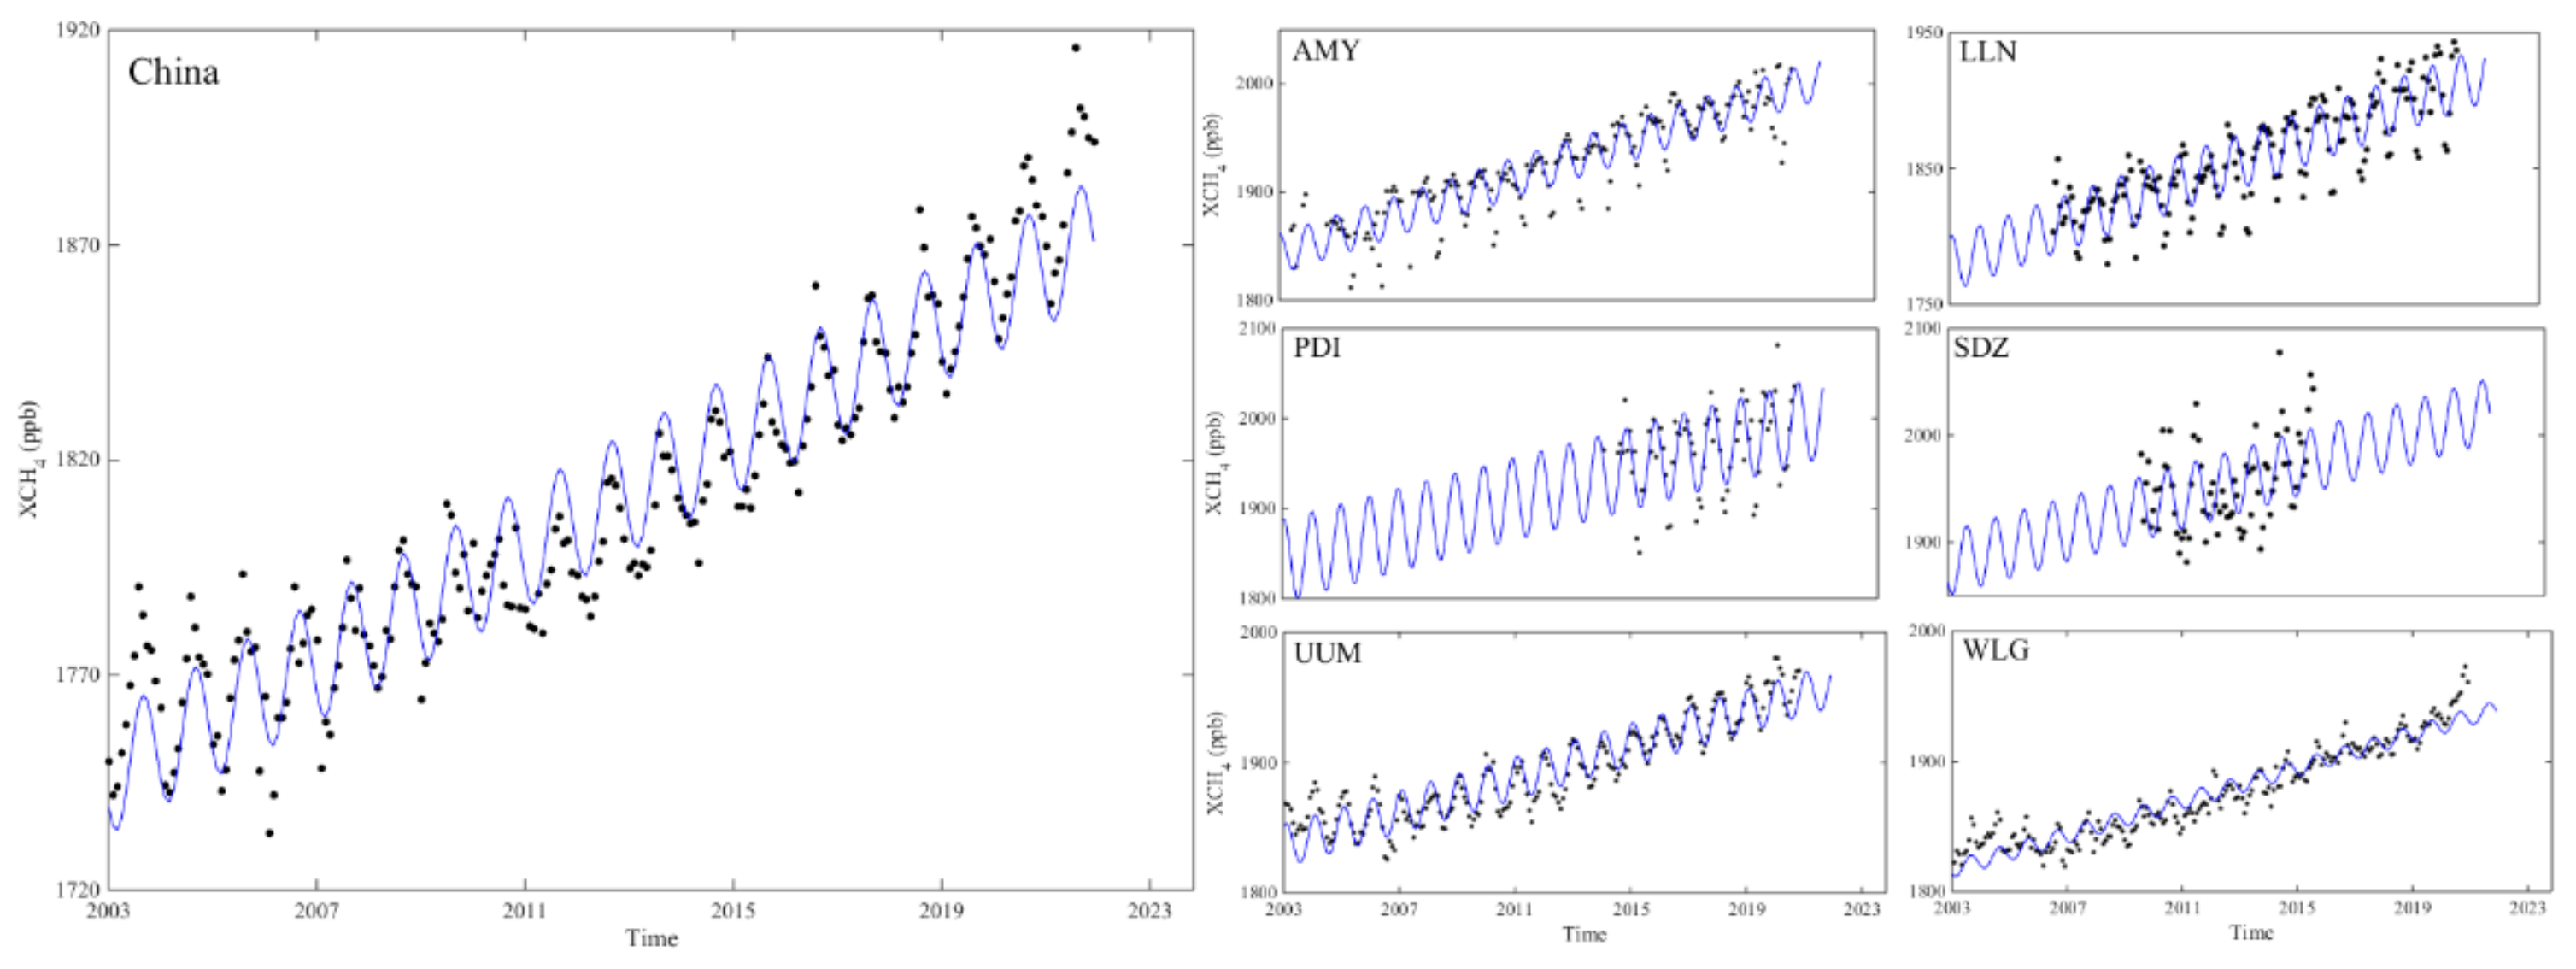
The linear sinusoidal trend-fitting model was employed to simulate temporal variations of XCH4 concentrations in China during 2003–2021, and a high R2 (0.93, p < 0.01) was obtained (Figure 4). In January 2003, the simulated XCH4 concentration was about 1747 ppb, which increased 0.58 ppb·month−1 to December 2021. The monthly XCH4 concentration amplitude in the annual cycle was 14.15 ppb, indicating XCH4 concentrations had obvious seasonal variations over a one-year cycle. Comparing the fitting coefficients among satellite-observed XCH4 concentrations over China and ground measurement from WDCGG stations (Table 3), the amplitude of seasonal variations and the growth trend were quite different in each site. Overall, the XCH4 concentrations increased from 2003 to 2021 with obvious seasonal variation cycles each year. Therefore, it is necessary to describe temporal characteristics from long-term annual trends and seasonal variations.

3.3.1. Long-Term Annual Trends of XCH4 Concentrations across China

Before the satellite observations, CH4 concentrations were assessed through ground measurement, aircraft sampling, and polar ice core samples. The data revealed a significant increase in CH4 levels since the 1850s. The global CH4 growth rate showed a decreasing trend from 1980 to 2000, then stabilized from 1999 to 2006, and has been increasing since 2007 [51,52,53,54,55,56]. It should be noted that measurements from sparse distribution can reflect the global average trend, and analyzing the growth of spatial distribution requires continuous satellite observations.
To analyze the annual trends of XCH4 concentration variations over China during 2003–2021 on the grid, we used a nonparametric Mann–Kendall test to examine the monotonic trends of XCH4 concentrations and then computed the Theil–Sen slope over grids that passed the Mann–Kendall test to obtain the annual growth rate map of XCH4 concentrations (Figure 5). Because all pixels over China had a significant XCH4 concentration growth trend (p < 0.1), a nonparametric Theil–Sen slope estimator was used to compute the slope of XCH4 concentrations, and the growth rate of XCH4 ranged from 4.07 to 9.77 ppb·yr−1. The slope of XCH4 concentrations showed obvious latitudinal gradient distribution, presenting high slope in the south and low slope in the north (Figure 5c). This may be due to the obvious growth of human activities in the low latitude region, which has been the main population migration area in the last two decades. Regions with high growth rates were mainly distributed in Southeast China, the junction of Hubei, Sichuan, and Shanxi, where there have been large population activity and oil and gas exploitation. The Yunnan border, Tibet border, and Tarim Basin also had relatively high growth, which was perhaps caused by long-distance air mass transmission and the increasing rate of CH4 concentrations in the mid-upper troposphere [27,57].
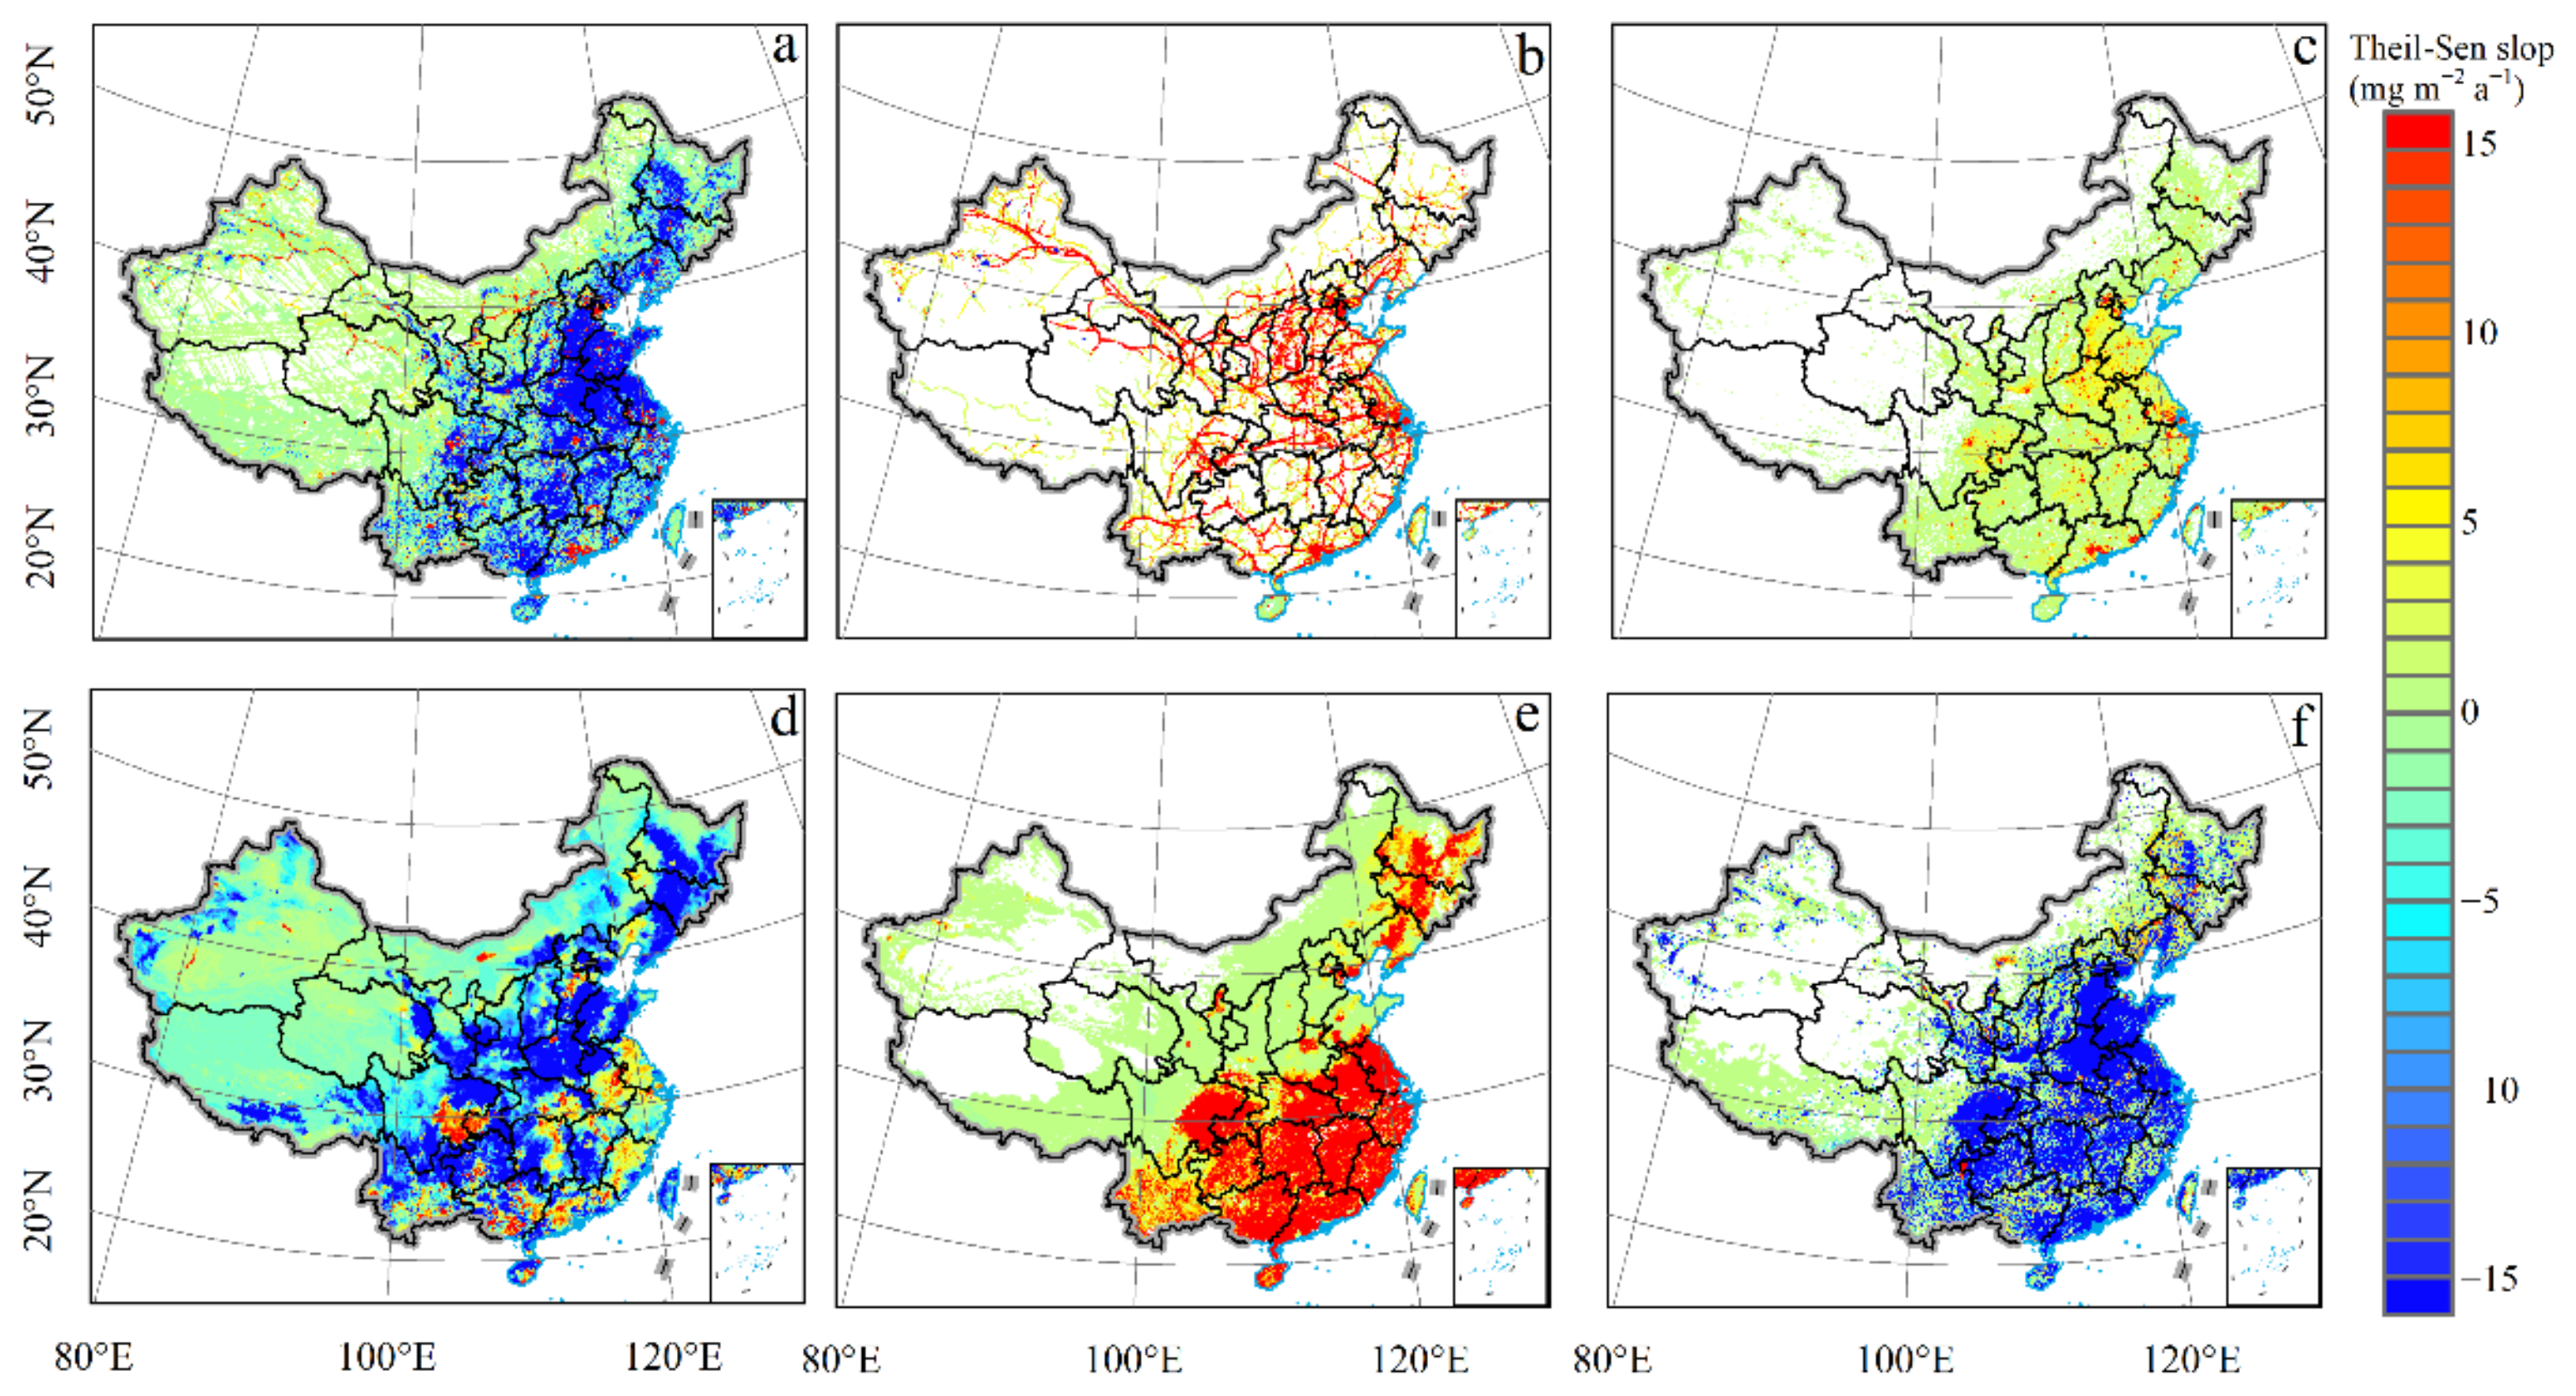
The spatial distribution of the growth of different types of CH4 emissions in China was calculated to analyze the driving factors of XCH4 concentrations (Figure A3). Unlike XCH4, the growth of CH4 emissions was not obvious in some regions and some sources and even showed a downward trend. Among these different CH4 emission sources, agricultural soil and coal/oil/gas production had the most significant upward trend. Studies have shown that global CH4 emission from coal mining increased about 17 Tg·yr−1, with dominant contribution from China [58]. With the improvement of agricultural production technology, management of fertilization measures, and rice expansion and intensification, CH4 emissions from rice have inevitably increased [59]. China’s rapid productivity has contributed to an increase in energy exploitation, consumption, and industrial production. In Shanxi, Shaanxi, and other major coal resource development provinces as well as in North China, where heavy industry dominates, increased energy consumption and anthropogenic activities have led to increased CH4 emissions.
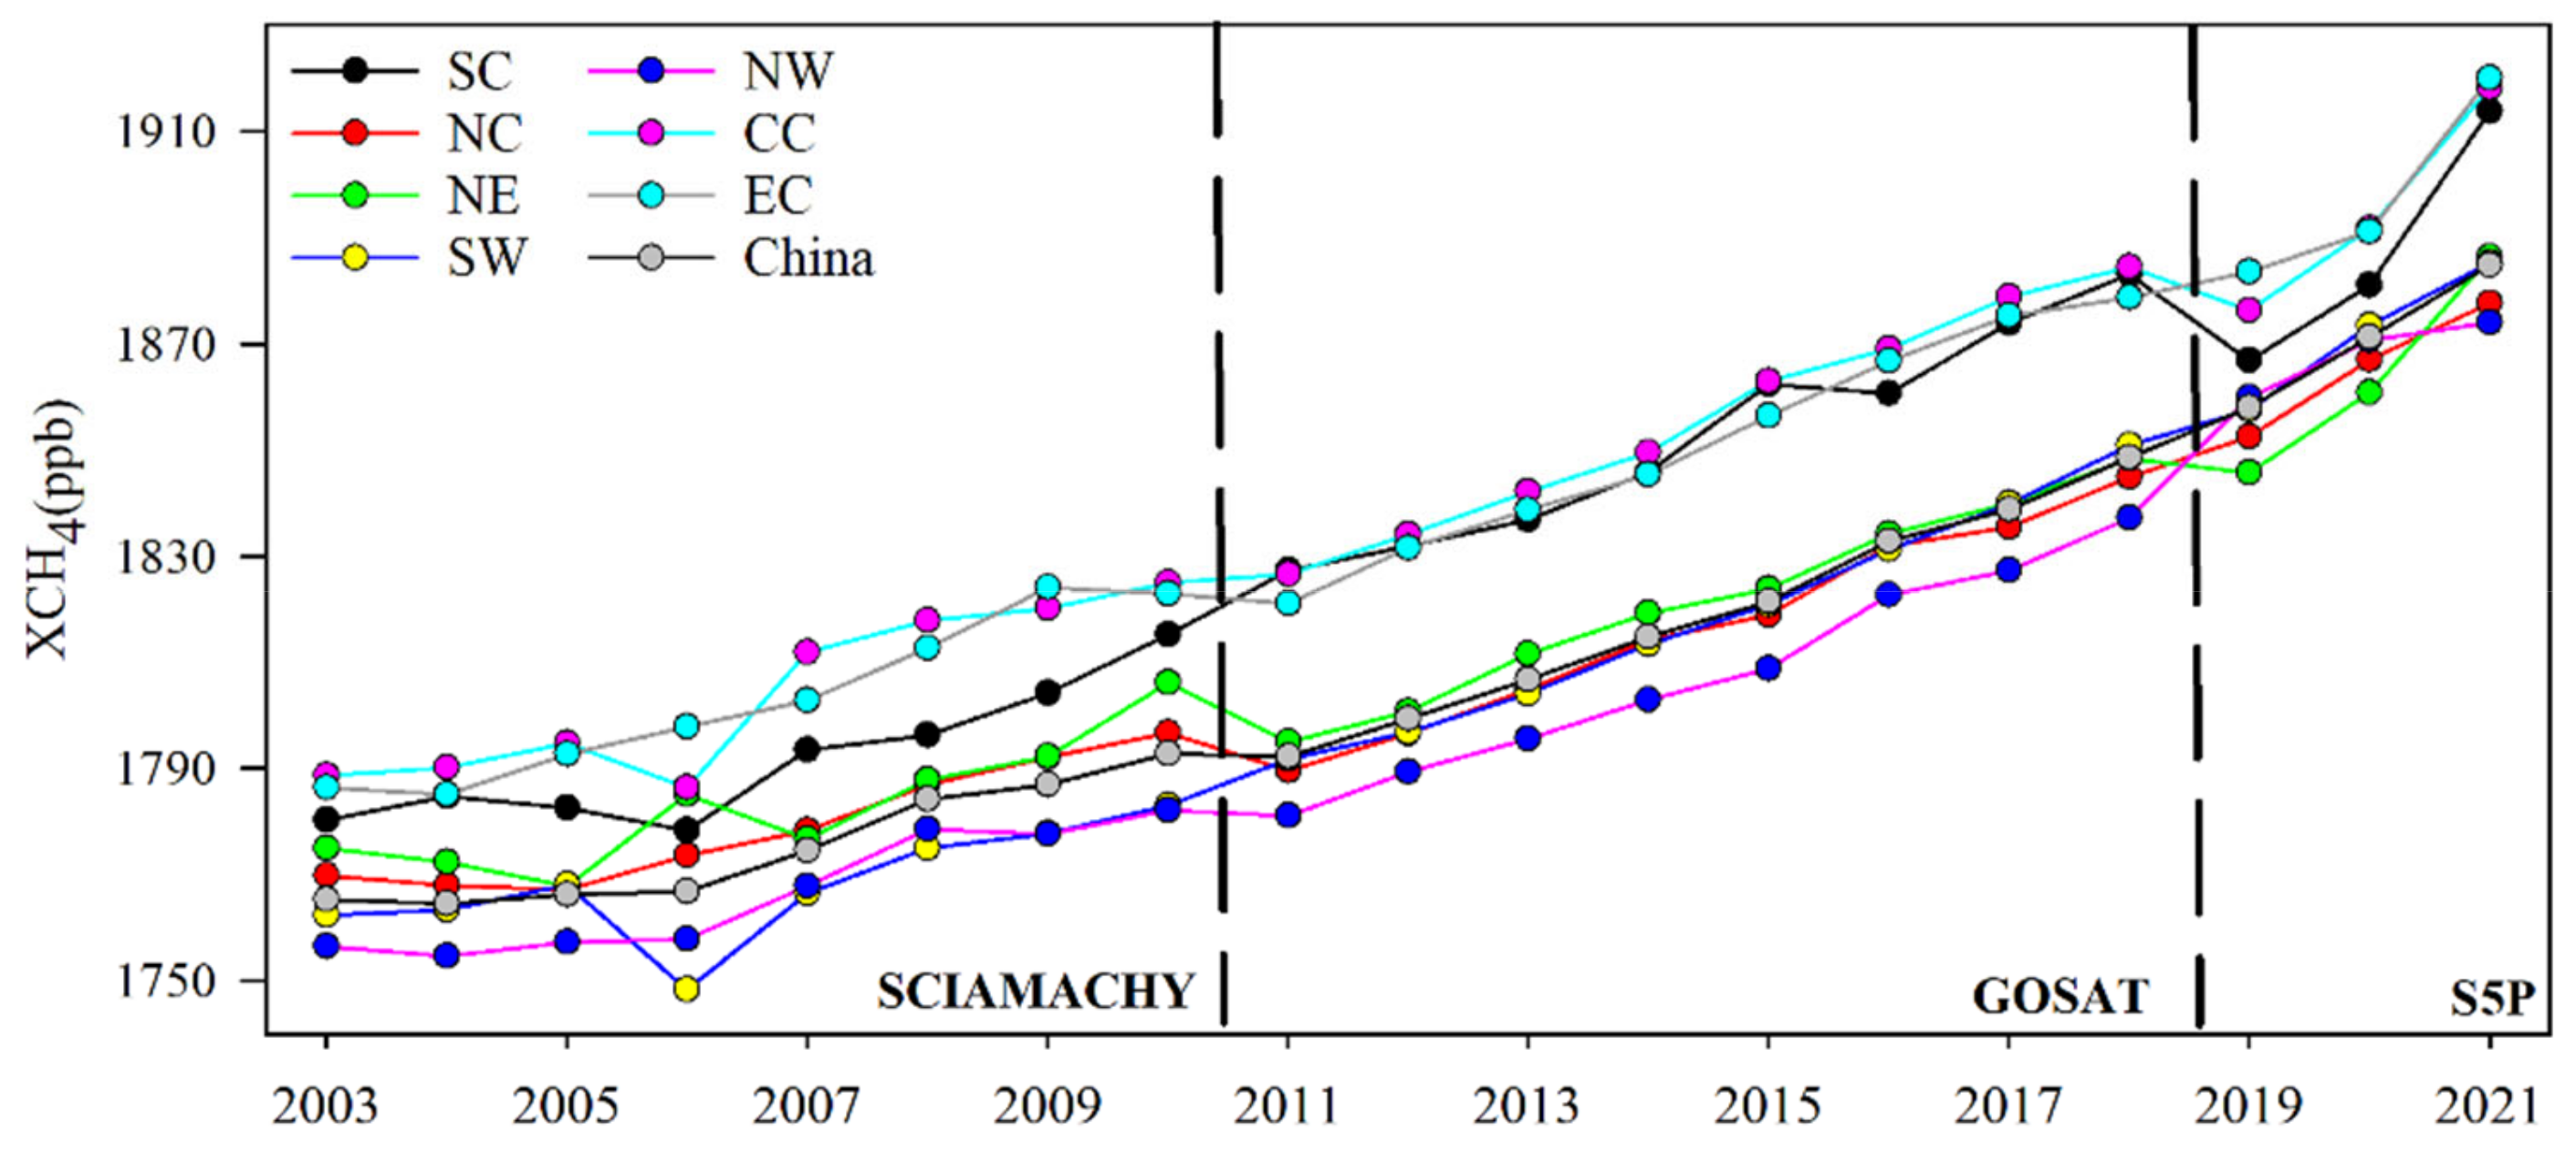
Further analysis of the long-term annual trends of XCH4 concentrations over China was conducted on a regional scale. China was divided into seven regions based on the geographic division rules, and the annual average XCH4 concentrations in each region are shown in Figure 6. The bias of XCH4 concentrations between different regions was complex for SCIAMACHY and S5P observations but stable for GOSAT. This may be because coverage from GOSAT was relatively low and the spatial details were erased during inverse distance interpolation. XCH4 concentrations were higher in CC, SC, and EC compared to NE, NC, SW, and NW. XCH4 concentrations in SW was lower than NE and NC before 2014, exceeded NC after 2015, then exceeded NE after 2018. The XCH4 concentrations in SC, SW, and CC all decreased in 2006. CC rose in 2007 and 2008, decreased in 2009, and has been rising again since then. SC increased until 2015, decreased in 2016, and has been increasing again, while SW has presented an increasing trend since 2006. Previous studies have shown that global atmospheric CH4 remained stable in the early 2000s and increased again after 2006 [60]. Similar trends of XCH4 were found in China, where XCH4 concentrations in the seven regions remained stable during 2003–2006 and even slightly decreased (with an average annual growth rate of 0.51 ppb·yr−1) but then increased after 2006 (with an average annual growth rate of 7.87 ppb·yr−1).

3.3.2. Seasonal Cycle of XCH4 Concentrations across China

From the three satellites, the average XCH4 concentrations in China decreased from December to February, then increased, peaked in August, and decreased again. The peak XCH4 concentrations occurred in summer (August), and the minimum value was in spring (February) (Figure 7). The seasonal cycle of XCH4 concentrations is determined by the combined effects of CH4 emission sources and sinks [2]. Atmospheric oxidation is the main CH4 sink, and elimination from OH in the troposphere is the main mechanism of atmospheric CH4 loss, accounting for about 85–90% [61]. As the concentrations of OH radicals are basically stable with little seasonal variation, the oxidation-cleaning effect of OH radicals have a weak impact on the seasonal variation of XCH4 concentrations [62]. Meanwhile, the seasonal variation of CH4 emission in rice fields, wetlands, and marshes is obvious. Temperature is a major factor in the anaerobic decomposition process and the release of methane by microorganisms in biological sources. Therefore, high temperatures and increase in microbial activity and quantity in summer may have contributed to the identified CH4 emission peaks [63].
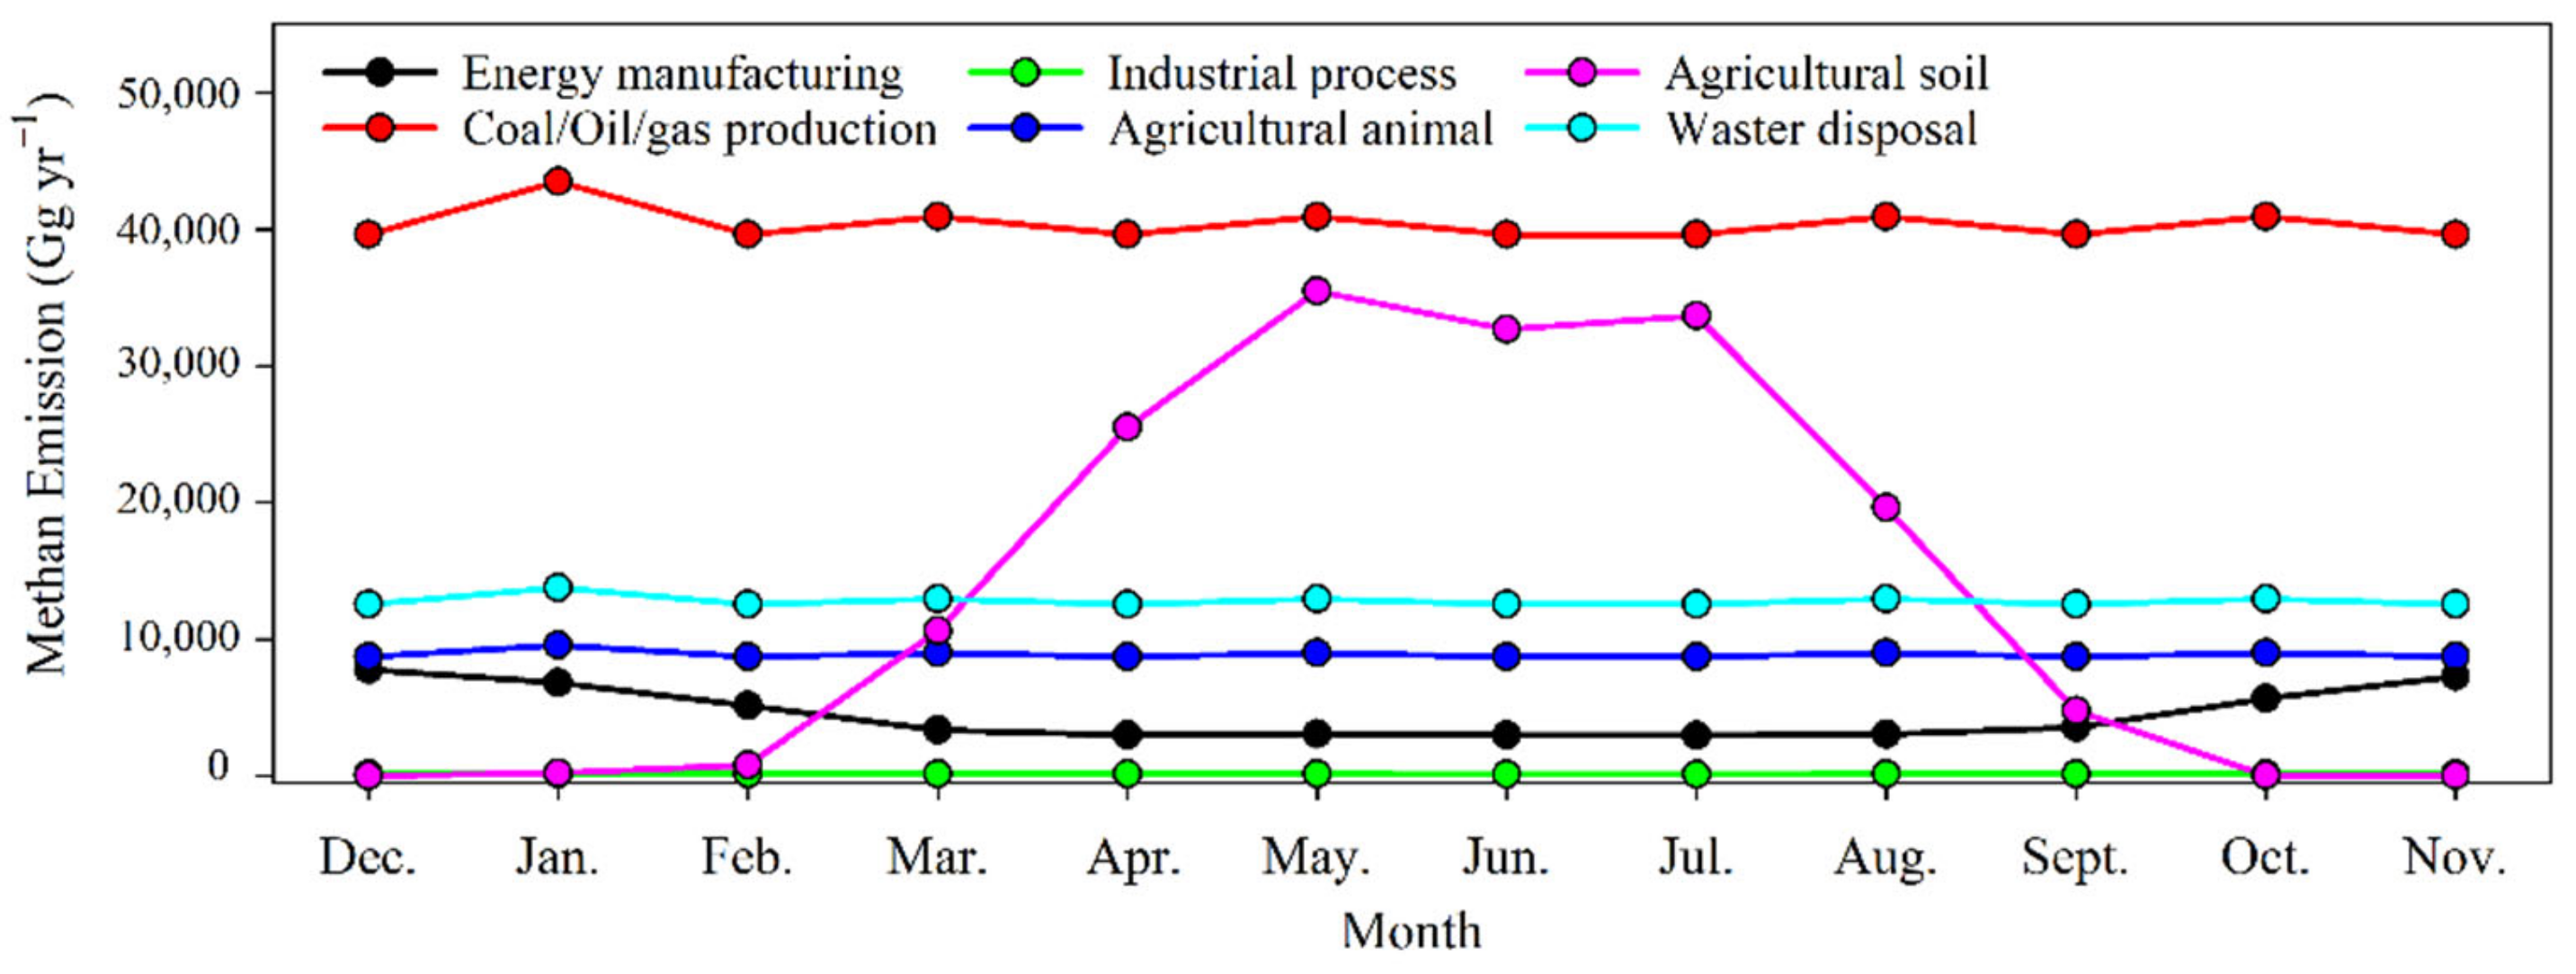
The monthly changes in six different categories of CH4 emissions are shown in Figure A4. Among these emissions, agricultural soil had the most obvious seasonal changes, with emissions reaching the maximum in summer and the lowest in spring and winter. However, industrial emissions, energy consumption, and other emissions impacted by human activities were not associated with significant seasonal changes. Previous studies have shown that rice planting emissions is the key factor leading to maximum average CH4 concentrations in summer [64,65]. Higher temperature and humidity provide good conditions for growth of rice paddies and increase the rate of root decay to provide abundant substrates for CH4 production, while flooded rice paddies help biomass-related methanogens release CH4 [66]. In winter, with drainage and drying of the fields, CH4 emissions from paddy fields are greatly reduced. Meanwhile, CH4 emissions from natural sources, including wetlands, frozen soil, biomass combustion, and plants, are also at low levels in winter. Individually and combined, these environmental and human factors could affect seasonal variations of XCH4 concentrations, leading to the pattern of high CH4 concentrations in warm season and low CH4 concentrations in cold season.

3.4. Influence of Rice Paddy on Atmospheric XCH4 across China

Atmospheric CH4 mainly come from natural ecology and human activities. CH4 emissions caused by human activities is considered the dominant contributor, with CH4 emissions from rice cultivation playing an important role in anthropogenic CH4 emissions [67]. As one of the most populous countries, China’s rice planting area accounts for about 20% of the world’s total. Moreover, 90% of the rice fields is fully irrigated, which makes CH4 emissions more frequent [68,69]. Studies have shown that CH4 emissions from rice in China account for about 29% of the global paddy field emissions [69]. Therefore, it is essential to explore the effect of rice paddies in the spatial distribution and seasonal cycle of atmospheric XCH4 observed by satellite over China.
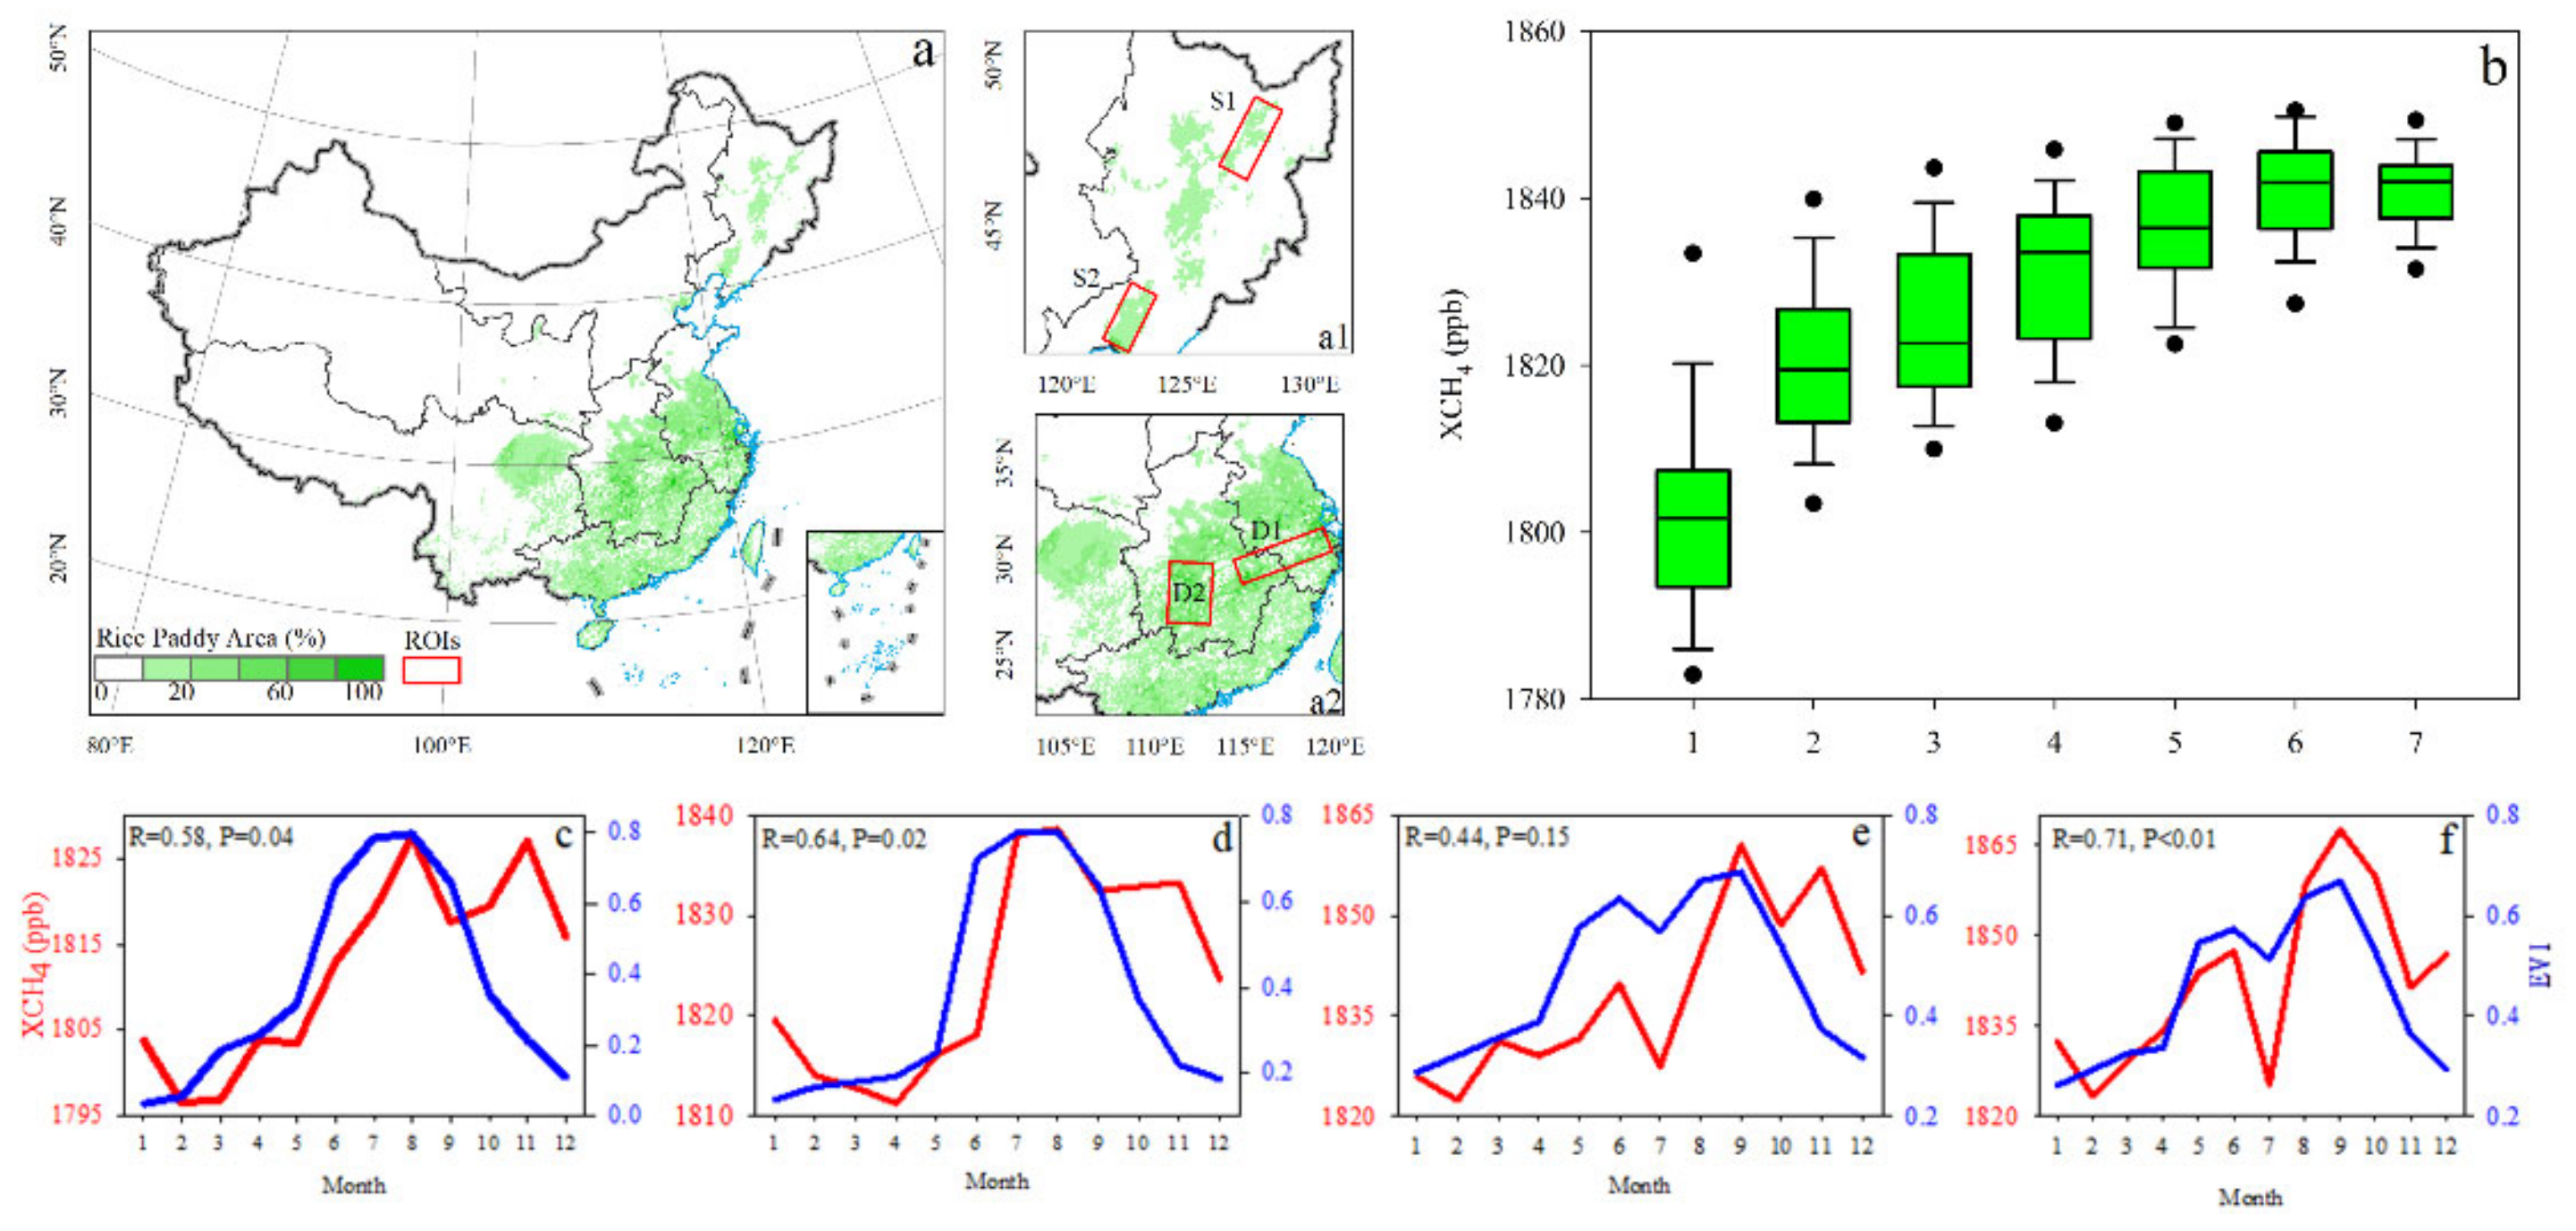
Analysis of the spatial distribution consistency between rice paddies and XCH4 concentrations is illustrated in Figure 8. China’s rice growing areas are mainly distributed in the Southeast, and the hotspots of XCH4 concentrations were linked to the distribution of areas of rice paddies. Over the last two decades, the average XCH4 concentration in areas in China with rice paddies was about 1820 ppb, while the average XCH4 concentration in areas without rice paddy cover was about 1799 ppb. We further divided the rice planting areas into seven grades [65]. As rice planting density increased in China, the concentration of XCH4 also increased. In areas where the proportion of rice paddy was less than 0.5%, the average XCH4 concentration was 1802 ppb. In areas where the proportion of rice paddy was larger than 40%, the average XCH4 was 1840 ppb (Figure 8b).
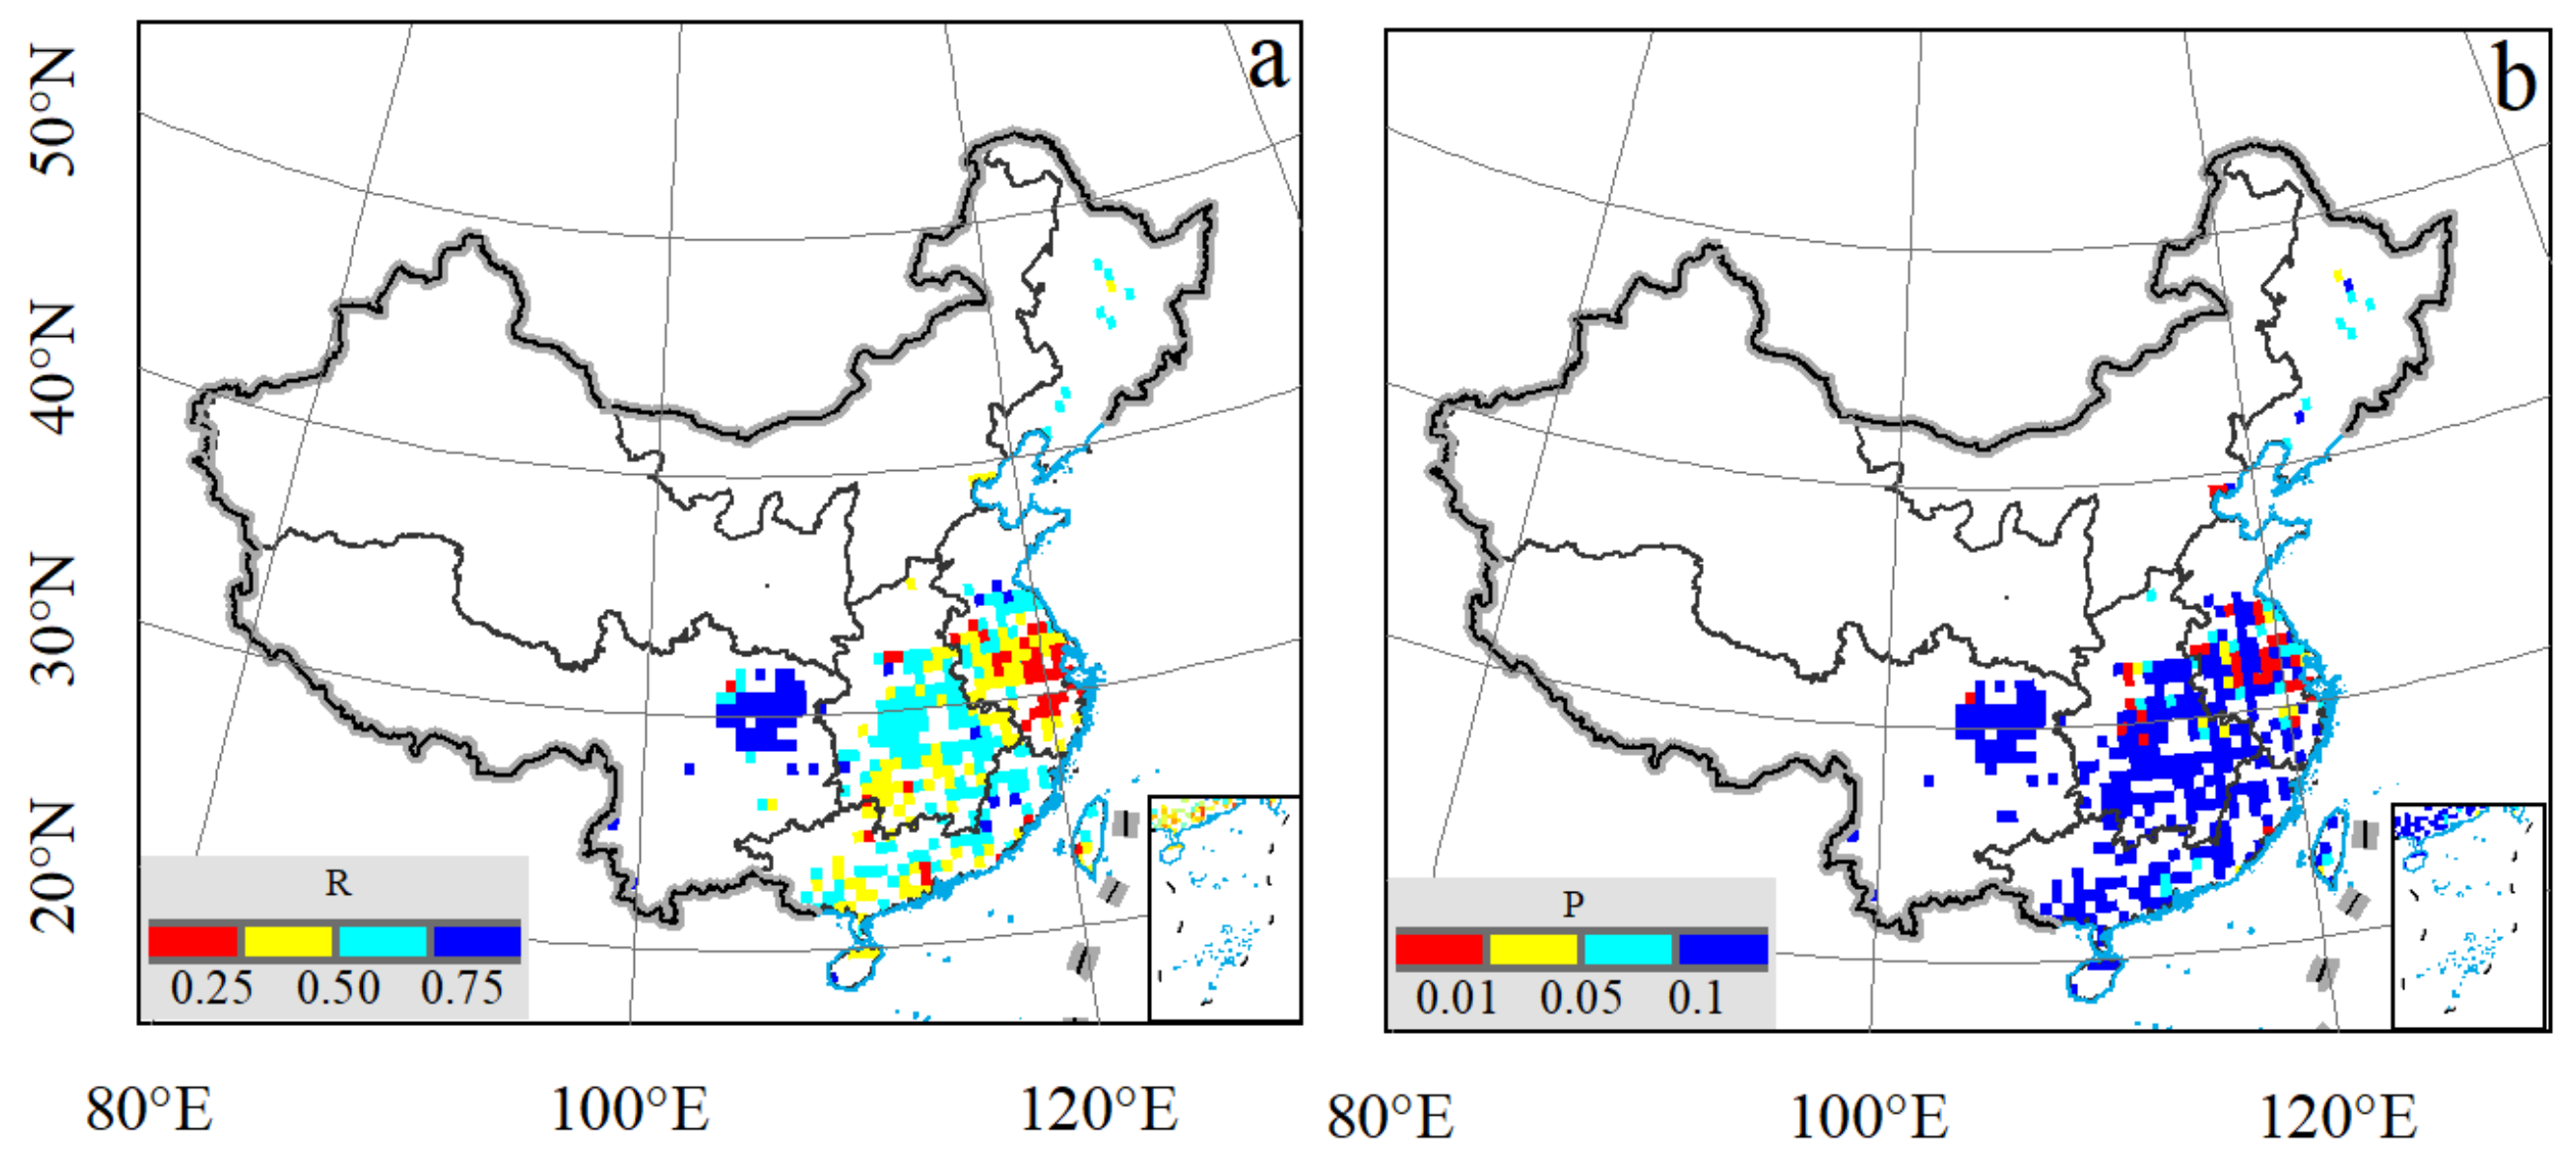
We then analyzed the seasonal cycle consistency of paddy rice growth and XCH4 concentrations. The EVI from MODIS was used to indicate rice plant growth and explore and quantify the seasonal relationship between the growth of paddy rice and XCH4 concentrations. We selected four typical high-density rice planting areas in China with different cropping systems to explore the seasonal variations of XCH4 concentrations and rice growth (Figure 8c–f). The seasonal variations of XCH4 had one peak per year in two regions in Northeast China and two peaks in two regions in Southeast China. The time consistency between XCH4 and EVI peak indicated the influence of rice growth on XCH4 concentrations. A single cropping system is used on the Sanjiang Plain in Northeast China, where both XCH4 and EVI had a single peak between July and September with correlation coefficients of 0.58 and 0.64, respectively (Figure 8c,d). The middle-lower Yangtze Plain in Southeast China is mainly planted with double cropping rice, and there are three crops a year in some areas. Here, there were two peaks around June and September, and the correlation coefficients were 0.44 and 0.71, respectively. Further, we computed the seasonal correlation between XCH4 and EVI on each paddy’s grid (rice density greater than 0.1) to analyze the spatial distribution pattern of seasonal consistency of rice growth and EVI (Figure A5). XCH4 concentrations and EVI showed a significant positive correlation in the rice planting areas, thereby proving the strong relationship between paddy growth and XCH4. Regions in China dominated by single rice crops, such as Sichuan Basin, central China, and Liaohe Plain, had high statistically significant positive correlation coefficients. On the Yangtze River delta plain in East China, double cropping rice is more common, with mixed crops during the rotation period and a low Pearson coefficient. This could be affected by the different rice planting times, which lead to more complicated seasonal variations.

4. Conclusions

Satellite observation is a powerful way to study atmospheric methane concentration, but the lifecycle of a single satellite limits long-term study. Based on the XCH4 product from three satellites (SCIAMACHY, GOSAT, and S5P), we analyzed spatiotemporal variations of atmospheric CH4 in China during 2003–2021 while accounting for the impact of variability of emission sources. The observations from SCIAMACHY, GOSAT, and S5P satellites in China were highly consistent (r = 0.72, 0.73, p < 0.01), and all three XCH4 data sources showed good agreement with ground measurements.
The XCH4 concentrations in China generally showed great spatial variation with high values in the east and low values in the west. This was due to different regional CH4 emission sources, with industrial-related emissions dominant in the north and agricultural emissions dominant in the south. XCH4 concentrations over China increased significantly from 2003 to 2021, with the trends being stable from 2003 to 2006 and then increasing until 2021. The XCH4 concentrations showed obvious seasonal cycles in China, with higher values in summer than in winter. This seasonal change was highly correlated with the rice growth cycle.
These findings are helpful for predicting possible feedback due to global warming and scientifically formulating emission reduction strategies. XCH4 is the comprehensive result of methane emissions, absorption, transportation, and mixing in the atmosphere and is not fully equivalent to methane emissions. Therefore, further research is required to specifically identify the estimation of methane emissions from XCH4.

Author Contributions

Conceptualization, J.Q. and X.Z.; methodology, J.Q. and X.Z.; software, J.Q., X.Z., L.Z. and M.C.; visualization, X.L.; writing—original draft, J.Q. and X.Z.; writing—review and editing, M.C. and X.L. All authors have read and agreed to the published version of the manuscript.

Funding

This work was supported by the Basic Research Program of Jiangsu Province (NO.: BK20211156).

Data Availability Statement

The relevant data in the paper can be found in the following links. The SCIAMACHY XCH4 concentration data were provided by Bremen University in Germany (https://www.iup.uni-bremen.de/sciamachy/NIR_NADIR_WFM_DOAS/products/) (accessed on 5 June 2022), the GOSAT XCH4 concentration data were obtained from the GOSAT project website (https://www.gosat.nies.go.jp/en/index.html) (accessed on 5 June 2022), the S5P XCH4 concentration data were obtained from the National Aeronautics and Space Administration (https://disc.gsfc.nasa.gov/) (accessed on 5 June 2022), the ground observations of CH4 concentrations were from the World Data Centre for Greenhouse Gases (WDCGG) (https://gaw.kishou.go.jp/) (accessed on 6 June 2022), the gridded CH4 emissions across China were from the Emissions Database for Global Atmospheric Research (EDGAR) (http://edgar.jrc.ec.europa.eu/archived_datasets.phpghg) (accessed on 6 June 2022), the enhanced vegetation index (EVI) in China were accessed from the National Aeronautics and Space Administration (https://modis.gsfc.nasa.gov/data/dataprod/) (accessed on 27 June 2022), and the rice harvested area were from EARTHSTAT (http://www.earthstat.org/) (accessed on 27 June 2022).

Conflicts of Interest

The authors report no potential conflict of interest.

Appendix A

Table A1. Observed greenhouse gas information by WDCGG station.
Station NameLongitude (°)Latitude (°)Elevation (m)Time in This Study
AMY36.54126.3342January 2003–December 2020
LLN23.47120.872862August 2006–December 2020
PDI21.57103.521466January 2014–November 2020
SDZ40.65117.12287September 2009–September 2015
UUM44.44111.09992January 2003–October 2020
WLG36.29100.903810January 2003–December 2020
Figure A1. Spatial distribution of the annual mean of CH4 emission of six categories from EDGAR over China during 2003–2018 (g m−2 a−1). (a) Energy manufacturing (including public electricity and heat production, petroleum refining, manufacture of solid fuels and other energy industries, mobile, solid fuel transformation, distribution of oil products, natural gas, iron and steel production, manufacturing industries and construction (ISIC), civil aviation, road transportation, railways, other transportation, navigation, and other sectors); (b) coal/oil/gas production (including coal mining, oil exploration, oil production, oil transport, oil refining/storage, venting, and flaring); (c) industrial process (including chemical industry, iron and steel production, and ferroalloys production); (d) agricultural animal (including enteric fermentation and manure management); (e) agricultural soil (including rice cultivation, agricultural soils, and field burning of agricultural residues); (f) waste disposal (including solid waste disposal on land, waste incineration, and wastewater handling).
Atmosphere 13 01362 g0a1
Figure A2. The share of individual sectors in the production of methane emission from EDGAR over China. (a) Spatial distribution of the share of individual sectors in the production of methane emission; (b) The share of individual sectors in the production of methane emission at provincial Scale. The abbreviations of provinces are as follows: BJ, Beijing; TJ, Tianjin; SH, Shanghai; CQ, Chongqing; HB, Heibei Province; HuB, Hubei Province; HN, Henan Province; HuN, Hunan Province; HaN, Hainan Province; SX, Shanxi Province; SaX, Shaanxi Province; GZ, Guizhou Province; XZ, Tibet Autonomous Region; NX, Ningxia Hui Autonomous Region; GX, Guangxi Zhuang Autonomous Region; GD, Guangdong; YN; Yunnan Province; SC, Sichuan Province; XJ, Xinjiang Uygur Autonomous Region; ZJ, Zhejiang Province; JX, Jiangxi Province; JS, Jiangsu Province; AH, Anhui Province; QH, Qinghai Province; SD, Shandong Province; HLJ, Heilongjiang Province; JL, Jilin Province; LN, Liaoning Province; FJ, Fujian; NM, Inner Mongolia Autonomous Region; GS, Gansu Province; GZ, Guizhou Province.
Atmosphere 13 01362 g0a2
Figure A3. Spatial distribution of the annual rate of increase in methane emission of six categories from EDGAR over China during 2003–2018 (mg m2 a1). (a) Energy manufacturing; (b) coal/oil/gas production; (c) industrial process; (d) agricultural animal (including enteric fermentation and manure management); (e) agricultural soil (including rice cultivation and field burning of agricultural residues); (f) waste disposal.
Atmosphere 13 01362 g0a3
Figure A4. Monthly variations of methane emission of six categories from EDGAR over China.
Atmosphere 13 01362 g0a4
Figure A5. Spatial patterns of correlation coefficients between the seasonal atmospheric methane concentration and rice growth. (a) The spatial distributions of Pearson’s correlation coefficients between XCH4 and EVI; (b) The spatial distributions of significance levels of Pearson’s correlation between XCH4 and EVI.
Atmosphere 13 01362 g0a5

References

  1. Etminan, M.; Myhre, G.; Highwood, E.J.; Shine, K.P. Radiative forcing of carbon dioxide, methane, and nitrous oxide: A significant revision of the methane radiative forcing. Geophys. Res. Lett. 2016, 43, 12614–12623. [Google Scholar] [CrossRef]
  2. Canadell, J.G.; Monteiro, P.M.S.; Costa, M.H.; Cunha, L.C.D.; Cox, P.M.; Eliseev, A.V.; Henson, S.; Ishii, M.; Jaccard, S.; Koven, C.; et al. Global Carbon and other Biogeochemical Cycles and Feedbacks. In Climate Change 2021: The Physical Science Basis. Contribution of Working Group I to the Sixth Assessment Report of the Intergovernmental Panel on Climate Change; In Pressed; Masson-Delmotte, V., Zhai, P., Pirani, A., Connors, S.L., Péan, C., Berger, S., Caud, N., Chen, Y., Goldfarb, L., Gomis, M.I., et al., Eds.; Cambridge University Press: Cambridge, UK, 2021. [Google Scholar]
  3. Nisbet, E.G.; Dlugokencky, E.J.; Bousquet, P. Methane on the Rise-Again. Science 2014, 343, 493–495. [Google Scholar] [CrossRef] [PubMed]
  4. Solarin, S.A.; Gil-Alana, L.A. Persistence of Methane Emission in OECD Countries for 1750–2014: A Fractional Integration Approach. Environ. Model. Assess. 2021, 26, 497–509. [Google Scholar] [CrossRef]
  5. Zhang, X.Y.; Jiang, H.; Lu, X.H.; Cheng, M.M.; Zhang, X.M.; Li, X.H.; Zhang, L.J. Estimate of methane release from temperate natural wetlands using ENVISAT/SCIAMACHY data in China. Atmos. Environ. 2013, 69, 191–197. [Google Scholar] [CrossRef]
  6. Zhang, G.J.; Le, Q. Analysis distribution of CH4 column concentration using SCIAMACHY data in China. Geospat. Inf. 2011, 9, 115–117. [Google Scholar]
  7. Kavitha, M.; Nair, P.R. SCIAMACHY observed changes in the column mixing ratio of methane over the Indian region and a comparison with global scenario. Atmos. Environ. 2017, 166, 454–466. [Google Scholar] [CrossRef]
  8. Qin, X.C.; Lei, L.P.; He, Z.H.; Zeng, Z.C.; Kawasaki, M.; Ohashi, M.; Matsumi, Y. Preliminary Assessment of Methane Concentration Variation Observed by GOSAT in China. Adv. Meteorol. 2015, 2015, 125059. [Google Scholar] [CrossRef]
  9. Kivimäki, E.; Lindqvist, H.; Hakkarainen, J.; Laine, M.; Sussmann, R.; Tsuruta, A.; Detmers, R.; Deutscher, N.M.; Dlugokencky, E.J.; Hase, F.; et al. Evaluation and Analysis of the Seasonal Cycle and Variability of the Trend from GOSAT Methane Retrievals. Remote Sens. 2019, 11, 882. [Google Scholar] [CrossRef]
  10. Islam, S.M.N.; Jackson, P.L.; Sweeney, C.; McKain, K.; Frankenberg, C.; Aben, I.; Parker, R.J.; Boesch, H.; Wunch, D. Methane Growth Rate Estimation and Its Causes in Western Canada Using Satellite Observations. J. Geophys. Res. Atmos. 2021, 126, e2020JD033948. [Google Scholar] [CrossRef]
  11. Zhang, J.X.; Han, G.; Mao, H.Q.; Pei, Z.P.; Ma, X.; Jia, W.J.; Gong, W. The Spatial and Temporal Distribution Patterns of XCH4 in China: New Observations from TROPOMI. Atmosphere 2022, 13, 177. [Google Scholar] [CrossRef]
  12. Zou, M.M.; Xiong, X.Z.; Saitoh, N.; Warner, J.; Zhang, Y.; Chen, L.F.; Weng, F.Z.; Fan, M. Satellite observation of atmospheric methane: Intercomparison between AIRS and GOSAT TANSO-FTS retrievals. Atmos. Meas. Tech. 2016, 9, 3567–3576. [Google Scholar] [CrossRef] [Green Version]
  13. Hu, H.; Landgraf, J.; Detmers, R.; Borsdorff, T.; de Brugh, J.A.; Aben, I.; Butz, A.; Hasekamp, O. Toward Global Mapping of Methane With TROPOMI: First Results and Intersatellite Comparison to GOSAT. Geophys. Res. Lett. 2018, 45, 3682–3689. [Google Scholar] [CrossRef]
  14. Zhang, L.J.; Wei, C.; Liu, H.; Jiang, H.; Lu, X.H.; Zhang, X.Y.; Jiang, C. Comparison analysis of global methane concentration derived from SCIAMACHY, AIRS, and GOSAT with surface station measurements. Int. J. Remote Sens. 2021, 42, 1823–1840. [Google Scholar] [CrossRef]
  15. Bovensmann, H.; Burrows, J.P.; Buchwitz, M.; Frerick, J.; Noel, S.; Rozanov, V.V.; Chance, K.V.; Goede, A. SCIAMACHY: Mission objectives and measurement modes. J. Atmos. Sci. 1999, 56, 127–150. [Google Scholar] [CrossRef]
  16. Buchwitz, M.; de Beek, R.; Burrows, J.P.; Bovensmann, H.; Warneke, T.; Notholt, J.; Meirink, J.F.; Goede, A.; Bergamaschi, P.; Korner, S.; et al. Atmospheric methane and carbon dioxide from SCIAMACHY satellite data: Initial comparison with chemistry and transport models. Atmos. Chem. Phys. 2005, 5, 941–962. [Google Scholar] [CrossRef]
  17. Barkley, M.P.; Monks, P.S.; Engelen, R.J. Comparison of SCIAMACHY and AIRS CO2 measurements over North America during the summer and autumn of 2003. Geophys. Res. Lett. 2006, 33, L20805. [Google Scholar] [CrossRef]
  18. Buchwitz, M.; Rozanov, V.V.; Burrows, J.P. A near-infrared optimized DOAS method for the fast global retrieval of atmospheric CH4, CO, CO2, H2O, and N2O total column amounts from SCIAMACHY Envisat-1 nadir radiances. J. Geophys. Res. Atmos. 2000, 105, 15231–15245. [Google Scholar] [CrossRef]
  19. Burrows, J.P.; Holzle, E.; Goede, A.; Visser, H.; Fricke, W. SCIAMACHY—scanning imaging absorption spectrometer for atmospheric chartography. Acta Astronaut. 1995, 35, 445–451. [Google Scholar] [CrossRef]
  20. Kuze, A.; Suto, H.; Nakajima, M.; Hamazaki, T. Thermal and near infrared sensor for carbon observation Fourier-transform spectrometer on the Greenhouse Gases Observing Satellite for greenhouse gases monitoring. Appl. Opt. 2009, 48, 6716–6733. [Google Scholar] [CrossRef]
  21. Morino, I.; Uchino, O.; Inoue, M.; Yoshida, Y.; Yokota, T.; Wennberg, P.O.; Toon, G.C.; Wunch, D.; Roehl, C.M.; Notholt, J.; et al. Preliminary validation of column-averaged volume mixing ratios of carbon dioxide and methane retrieved from GOSAT short-wavelength infrared spectra. Atmos. Meas. Tech. 2011, 4, 1061–1076. [Google Scholar] [CrossRef]
  22. Suto, H.; Kataoka, F.; Kikuchi, N.; Knuteson, R.O.; Butz, A.; Haun, M.; Buijs, H.; Shiomi, K.; Imai, H.; Kuze, A. Thermal and near-infrared sensor for carbon observation Fourier transform spectrometer-2 (TANSO-FTS-2) on the Greenhouse gases Observing SATellite-2 (GOSAT-2) during its first year in orbit. Atmos. Meas. Tech. 2021, 14, 2013–2039. [Google Scholar] [CrossRef]
  23. Dlugokencky, E.J.; Steele, L.P.; Lang, P.M.; Masarie, K.A. The growth rate and distribution of atmospheric methane. J. Geophys. Res. Atmos. 1994, 99, 17021–17043. [Google Scholar] [CrossRef]
  24. Yang, Q.; Guan, L.; Tao, F.; Liang, M.; Sun, W.Q. Changes of CH4 Concentrations Obtained by Ground-based Observations at Five Atomspheric Background Stations in China. Environ. Sci. Technol. 2018, 41, 1–7. [Google Scholar]
  25. Huete, A.; Didan, K.; Miura, T.; Rodriguez, E.P.; Gao, X.; Ferreira, L.G. Overview of the radiometric and biophysical performance of the MODIS vegetation indices. Remote Sens. Environ. 2002, 83, 195–213. [Google Scholar] [CrossRef]
  26. Xu, J.H.; Li, W.T.; Xie, H.M.; Wang, Y.X.; Wang, L.; Hu, F. Long-Term Trends and Spatiotemporal Variations in Atmospheric XCH4 over China Utilizing Satellite Observations. Atmosphere 2022, 13, 525. [Google Scholar] [CrossRef]
  27. Wu, X.D.; Zhang, X.Y.; Chuai, X.W.; Huang, X.J.; Wang, Z. Long-Term Trends of Atmospheric CH4 Concentration across China from 2002 to 2016. Remote Sens. 2019, 11, 538. [Google Scholar] [CrossRef]
  28. Weatherhead, E.C.; Reinsel, G.C.; Tiao, G.C.; Meng, X.L.; Choi, D.S.; Cheang, W.K.; Keller, T.; DeLuisi, J.; Wuebbles, D.J.; Kerr, J.B.; et al. Factors affecting the detection of trends: Statistical considerations and applications to environmental data. J. Geophys. Res. Atmos. 1998, 103, 17149–17161. [Google Scholar] [CrossRef]
  29. Zhang, X.Y.; Chuai, X.W.; Liu, L.; Zhang, W.T.; Lu, X.H.; Zhao, L.M.; Chen, D.M. Decadal Trends in Wet Sulfur Deposition in China Estimated From OMI SO2 Columns. J. Geophys. Res. Atmos. 2018, 123, 10796–10811. [Google Scholar] [CrossRef]
  30. Hamed, K.H.; Rao, A.R. A modified Mann-Kendall trend test for autocorrelated data. J. Hydrol. 1998, 204, 182–196. [Google Scholar] [CrossRef]
  31. Wang, J.J.; Zhang, Y.N.; Sun, X.Y. Trend of Light Rain Precipitation Days of Hangzhou in Recent 60 Years. Bull. Sci. Technol. 2019, 35, 41–45. [Google Scholar] [CrossRef]
  32. Gocic, M.; Trajkovic, S. Analysis of changes in meteorological variables using Mann-Kendall and Sen’s slope estimator statistical tests in Serbia. Global Planet. Chang. 2013, 100, 172–182. [Google Scholar] [CrossRef]
  33. Aziz, O.; Burn, D.H. Trends and variability in the hydrological regime of the Mackenzie River Basin. J. Hydrol. 2006, 319, 282–294. [Google Scholar] [CrossRef]
  34. Cannarozzo, M.; Noto, L.V.; Viola, F. Spatial distribution of rainfall trends in Sicily (1921–2000). Phys. Chem. Earth 2006, 31, 1201–1211. [Google Scholar] [CrossRef]
  35. Wilks, D.S. On “Field Significance” and the False Discovery Rate. J. Appl. Meteorol. Clim. 2006, 45, 1181–1189. [Google Scholar] [CrossRef]
  36. Xu, Y.Y.; Wang, J.L.; Sun, J.L.; Xu, Y.; Harris, W. Spatial and Temporal Variations of Lower Tropospheric Methane During 2010–2011 in China. IEEE J. Stars 2012, 5, 1464–1473. [Google Scholar] [CrossRef]
  37. Zhang, X.M.; Zhang, X.Y.; Zhang, L.J.; Li, X.H. Accuracy Comparison of Monthly AIRS, GOSAT and SCIAMACHY Data in Monitoring Atmospheric CH4 Concentration. In Proceedings of the 21st International Conference on Geoinformatics, Kaifeng, China, 20–22 June 2013. [Google Scholar]
  38. Saito, R.; Patra, P.K.; Sweeney, C.; Machida, T.; Krol, M.; Houweling, S.; Bousquet, P.; Agusti-Panareda, A.; Belikov, D.; Bergmann, D.; et al. TransCom model simulations of methane: Comparison of vertical profiles with aircraft measurements. J. Geophys. Res. Atmos. 2013, 118, 3891–3904. [Google Scholar] [CrossRef]
  39. Kulawik, S.S.; Worden, J.R.; Payne, V.H.; Fu, D.J.; Wofsy, S.C.; McKain, K.; Sweeney, C.; Daube, B.C.; Lipton, A.; Polonsky, I.; et al. Evaluation of single-footprint AIRS CH4 profile retrieval uncertainties using aircraft profile measurements. Atmos. Meas. Tech. 2021, 14, 335–354. [Google Scholar] [CrossRef]
  40. Lorente, A.; Borsdorff, T.; Butz, A.; Hasekamp, O.; Aan De Brugh, J.; Schneider, A.; Wu, L.H.; Hase, F.; Kivi, R.; Wunch, D.; et al. Methane retrieved from TROPOMI: Improvement of the data product and validation of the first 2 years of measurements. Atmos Meas Tech. 2021, 14, 665–684. [Google Scholar] [CrossRef]
  41. Xiong, X.Z.; Barnet, C.; Maddy, E.; Sweeney, C.; Liu, X.P.; Zhou, L.H.; Goldberg, M. Characterization and validation of methane products from the Atmospheric Infrared Sounder (AIRS). J. Geophys. Res. Biogeo. 2008, 113, 500. [Google Scholar] [CrossRef]
  42. Schneising, O.; Bergamaschi, P.; Bovensmann, H.; Buchwitz, M.; Burrows, J.P.; Deutscher, N.M.; Griffith, D.; Heymann, J.; Macatangay, R.; Messerschmidt, J.; et al. Atmospheric greenhouse gases retrieved from SCIAMACHY: Comparison to ground-based FTS measurements and model results. Atmos. Chem. Phys. 2012, 12, 1527–1540. [Google Scholar] [CrossRef]
  43. Dils, B.; De Maziere, M.; Muller, J.F.; Blumenstock, T.; Buchwitz, M.; de Beek, R.; Demoulin, P.; Duchatelet, P.; Fast, H.; Frankenberg, C.; et al. Comparisons between SCIAMACHY and ground-based FTIR data for total columns of CO, CH4, CO2 and N2O. Atmos. Chem. Phys. 2006, 6, 1953–1976. [Google Scholar] [CrossRef]
  44. Gloudemans, A.; Schrijver, H.; Hasekamp, O.P.; Aben, I. Error analysis for CO and CH4 total column retrievals from SCIAMACHY 2.3 mu m spectra. Atmos. Chem. Phys. 2008, 8, 3999–4017. [Google Scholar] [CrossRef] [Green Version]
  45. Dan-dan, L.; Yin-bo, H.; Zhen-song, C.; Xing-ji, L.U.; Yu-song, S.; Qian-si, T.U. Analysis of Total Columns of Greenhouse Gas Based on Direct Observation and Comparison with Satellite Data in Hefei. Acta Photonica Sin. 2020, 49, 159–168. [Google Scholar] [CrossRef]
  46. Inoue, M.; Morino, I.; Uchino, O.; Miyamoto, Y.; Saeki, T.; Yoshida, Y.; Yokota, T.; Sweeney, C.; Tans, P.P.; Biraud, S.C.; et al. Validation of XCH4 derived from SWIR spectra of GOSAT TANSO-FTS with aircraft measurement data. Atmos. Meas. Tech. 2014, 7, 2987–3005. [Google Scholar] [CrossRef]
  47. Mermigkas, M.; Topaloglou, C.; Balis, D.; Koukouli, M.E.; Hase, F.; Dubravica, D.; Borsdorff, T.; Lorente, A. FTIR Measurements of Greenhouse Gases over Thessaloniki, Greece in the Framework of COCCON and Comparison with S5P/TROPOMI Observations. Remote Sens. 2021, 13, 3395. [Google Scholar] [CrossRef]
  48. Sha, M.K.; Langerock, B.; Blavier, J.; Blumenstock, T.; Borsdorff, T.; Buschmann, M.; Dehn, A.; De Maziere, M.; Deutscher, N.M.; Feist, D.G.; et al. Validation of methane and carbon monoxide from Sentinel-5 Precursor using TCCON and NDACC-IRWG stations. Atmos. Meas. Tech. 2021, 14, 6249–6304. [Google Scholar] [CrossRef]
  49. Tu, Q.S.; Hase, F.; Blumenstock, T.; Kivi, R.; Heikkinen, P.; Sha, M.K.; Raffalski, U.; Landgraf, J.; Lorente, A.; Borsdorff, T.; et al. Intercomparison of atmospheric CO2 and CH4 abundances on regional scales in boreal areas using Copernicus Atmosphere Monitoring Service (CAMS) analysis, COllaborative Carbon Column Observing Network (COCCON) spectrometers, and Sentinel-5 Precursor satellite observations. Atmos. Meas Tech. 2020, 13, 4751–4771. [Google Scholar] [CrossRef]
  50. Monteil, G.; Houweling, S.; Butz, A.; Guerlet, S.; Schepers, D.; Hasekamp, O.; Frankenberg, C.; Scheepmaker, R.; Aben, I.; Rockmann, T. Comparison of CH4 inversions based on 15 months of GOSAT and SCIAMACHY observations. J. Geophys. Res. Atmos. 2013, 118, 11807–11823. [Google Scholar] [CrossRef]
  51. Etheridge, D.M.; Pearman, G.I.; Fraser, P.J. Changes in Tropospheric Methane Between 1841 and 1978 from a High Accumulation-Rate Antarctic Ice Core. Tellus B 1992, 44, 282–294. [Google Scholar] [CrossRef]
  52. Brenninkmeijer, C.; Crutzen, P.; Boumard, F.; Dauer, T.; Dix, B.; Ebinghaus, R.; Filippi, D.; Fischer, H.; Franke, H.; Friess, U.; et al. Civil Aircraft for the regular investigation of the atmosphere based on an instrumented container: The new CARIBIC system. Atmos Chem. Phys. 2007, 7, 4953–4976. [Google Scholar] [CrossRef]
  53. Schuck, T.J.; Ishijima, K.; Patra, P.K.; Baker, A.K.; Machida, T.; Matsueda, H.; Sawa, Y.; Umezawa, T.; Brenninkmeijer, C.A.M.; Lelieveld, J. Distribution of methane in the tropical upper troposphere measured by CARIBIC and CONTRAIL aircraft. J. Geophys. Res. Atmos. 2012, 117, D19304. [Google Scholar] [CrossRef]
  54. Blake, D.R.; Mayer, E.W.; Tyler, S.C.; Makide, Y.; Montague, D.C.; Rowland, F.S. Global Increase In Atmospheric Methane Concentrations Between 1978 and 1980. Geophys. Res. Lett. 1982, 9, 477–480. [Google Scholar] [CrossRef] [Green Version]
  55. Cunnold, D.M. In situ measurements of atmospheric methane at GAGE/AGAGE sites during 1985–2000 and resulting source inferences. J. Geophys. Res. 2002, 107, ACH 20-1–ACH 20-18. [Google Scholar] [CrossRef]
  56. Dlugokencky, E.J.; Bruhwiler, L.; White, J.W.C.; Emmons, L.K.; Novelli, P.C.; Montzka, S.A.; Masarie, K.A.; Lang, P.M.; Crotwell, A.M.; Miller, J.B.; et al. Observational constraints on recent increases in the atmospheric CH4 burden. Geophys. Res. Lett. 2009, 36, L18803. [Google Scholar] [CrossRef]
  57. Zhou, L.; Worthy, D.; Lang, P.M.; Ernst, M.K.; Zhang, X.C.; Wen, Y.P.; Li, J.L. Ten years of atmospheric methane observations at a high elevation site in Western China. Atmos. Environ. 2004, 38, 7041–7054. [Google Scholar] [CrossRef]
  58. Crippa, M.; Solazzo, E.; Huang, G.; Guizzardi, D.; Koffi, E.; Muntean, M.; Schieberle, C.; Friedrich, R.; Janssens-Maenhout, G. High resolution temporal profiles in the Emissions Database for Global Atmospheric Research. Sci. Data 2020, 7, 121. [Google Scholar] [CrossRef]
  59. Van Groenigen, K.J.; van Kessel, C.; Hungate, B.A. Increased greenhouse-gas intensity of rice production under future atmospheric conditions. Nat. Clim. Chang. 2013, 3, 288–291. [Google Scholar] [CrossRef]
  60. Kirschke, S.; Bousquet, P.; Ciais, P.; Saunois, M.; Canadell, J.G.; Dlugokencky, E.J.; Bergamaschi, P.; Bergmann, D.; Blake, D.R.; Bruhwiler, L.; et al. Three decades of global methane sources and sinks. Nat. Geosci. 2013, 6, 813–823. [Google Scholar] [CrossRef]
  61. Saunois, M.; Stavert, A.R.; Poulter, B.; Bousquet, P.; Canadell, J.G.; Jackson, R.B.; Raymond, P.A.; Dlugokencky, E.J.; Houweling, S.; Patra, P.K.; et al. The Global Methane Budget 2000–2017. Earth Syst. Sci. Data 2020, 12, 1561–1623. [Google Scholar] [CrossRef]
  62. Zhang, H.H.; Li, C.; Gao, Y.B.; Fang, X.J.; Xiong, W.; Mas, J.J. Research for High-Level OH Radicals Spatio-Temporal Distribution Characteristics and Its Formation Mechanism. J. Atmos. Environ. Opt. 2017, 12, 292–304. [Google Scholar] [CrossRef]
  63. Zhang, X.Y.; Bai, W.G.; Zhang, P.; Wang, W.H. Spatiotemporal variations in mid-upper tropospheric methane over China from satellite observations. Chin. Sci. Bull. 2011, 56, 3321–3327. [Google Scholar] [CrossRef]
  64. Zhang, D.Y.; Liao, H.; Wang, Y.S. Simulated Spatial Distribution and Seasonal Variation of Atmospheric Methane over China: Contributions from Key Sources. Adv. Atmos Sci 2014, 31, 283–292. [Google Scholar] [CrossRef]
  65. Zhang, G.L.; Xiao, X.M.; Dong, J.W.; Xin, F.F.; Zhang, Y.; Qin, Y.W.; Doughty, R.B.; Moore, B. Fingerprint of rice paddies in spatial-temporal dynamics of atmospheric methane concentration in monsoon Asia. Nat. Commun. 2020, 11, 554. [Google Scholar] [CrossRef] [PubMed]
  66. Tokida, T.; Adachi, M.; Cheng, W.G.; Nakajima, Y.; Fumoto, T.; Matsushima, M.; Nakamura, H.; Okada, M.; Sameshima, R.; Hasegawa, T. Methane and soil CO2 production from current-season photosynthates in a rice paddy exposed to elevated CO2 concentration and soil temperature. Glob. Chang. Biol. 2011, 17, 3327–3337. [Google Scholar] [CrossRef]
  67. Tian, H.Q.; Lu, C.Q.; Ciais, P.; Michalak, A.M.; Canadell, J.G.; Saikawa, E.; Huntzinger, D.N.; Gurney, K.R.; Sitch, S.; Zhang, B.W.; et al. The terrestrial biosphere as a net source of greenhouse gases to the atmosphere. Nature 2016, 531, 225. [Google Scholar] [CrossRef]
  68. Chen, H.; Zhu, Q.A.; Peng, C.H.; Wu, N.; Wang, Y.F.; Fang, X.Q.; Jiang, H.; Xiang, W.H.; Chang, J.; Deng, X.W.; et al. Methane emissions from rice paddies natural wetlands, lakes in China: Synthesis new estimate. Glob. Chang. Biol. 2013, 19, 19–32. [Google Scholar] [CrossRef]
  69. Yan, X.Y.; Akiyama, H.; Yagi, K.; Akimoto, H. Global estimations of the inventory and mitigation potential of methane emissions from rice cultivation conducted using the 2006 Intergovernmental Panel on Climate Change Guidelines. Glob. Biogeochem. Cy. 2009, 23, GB2002. [Google Scholar] [CrossRef]
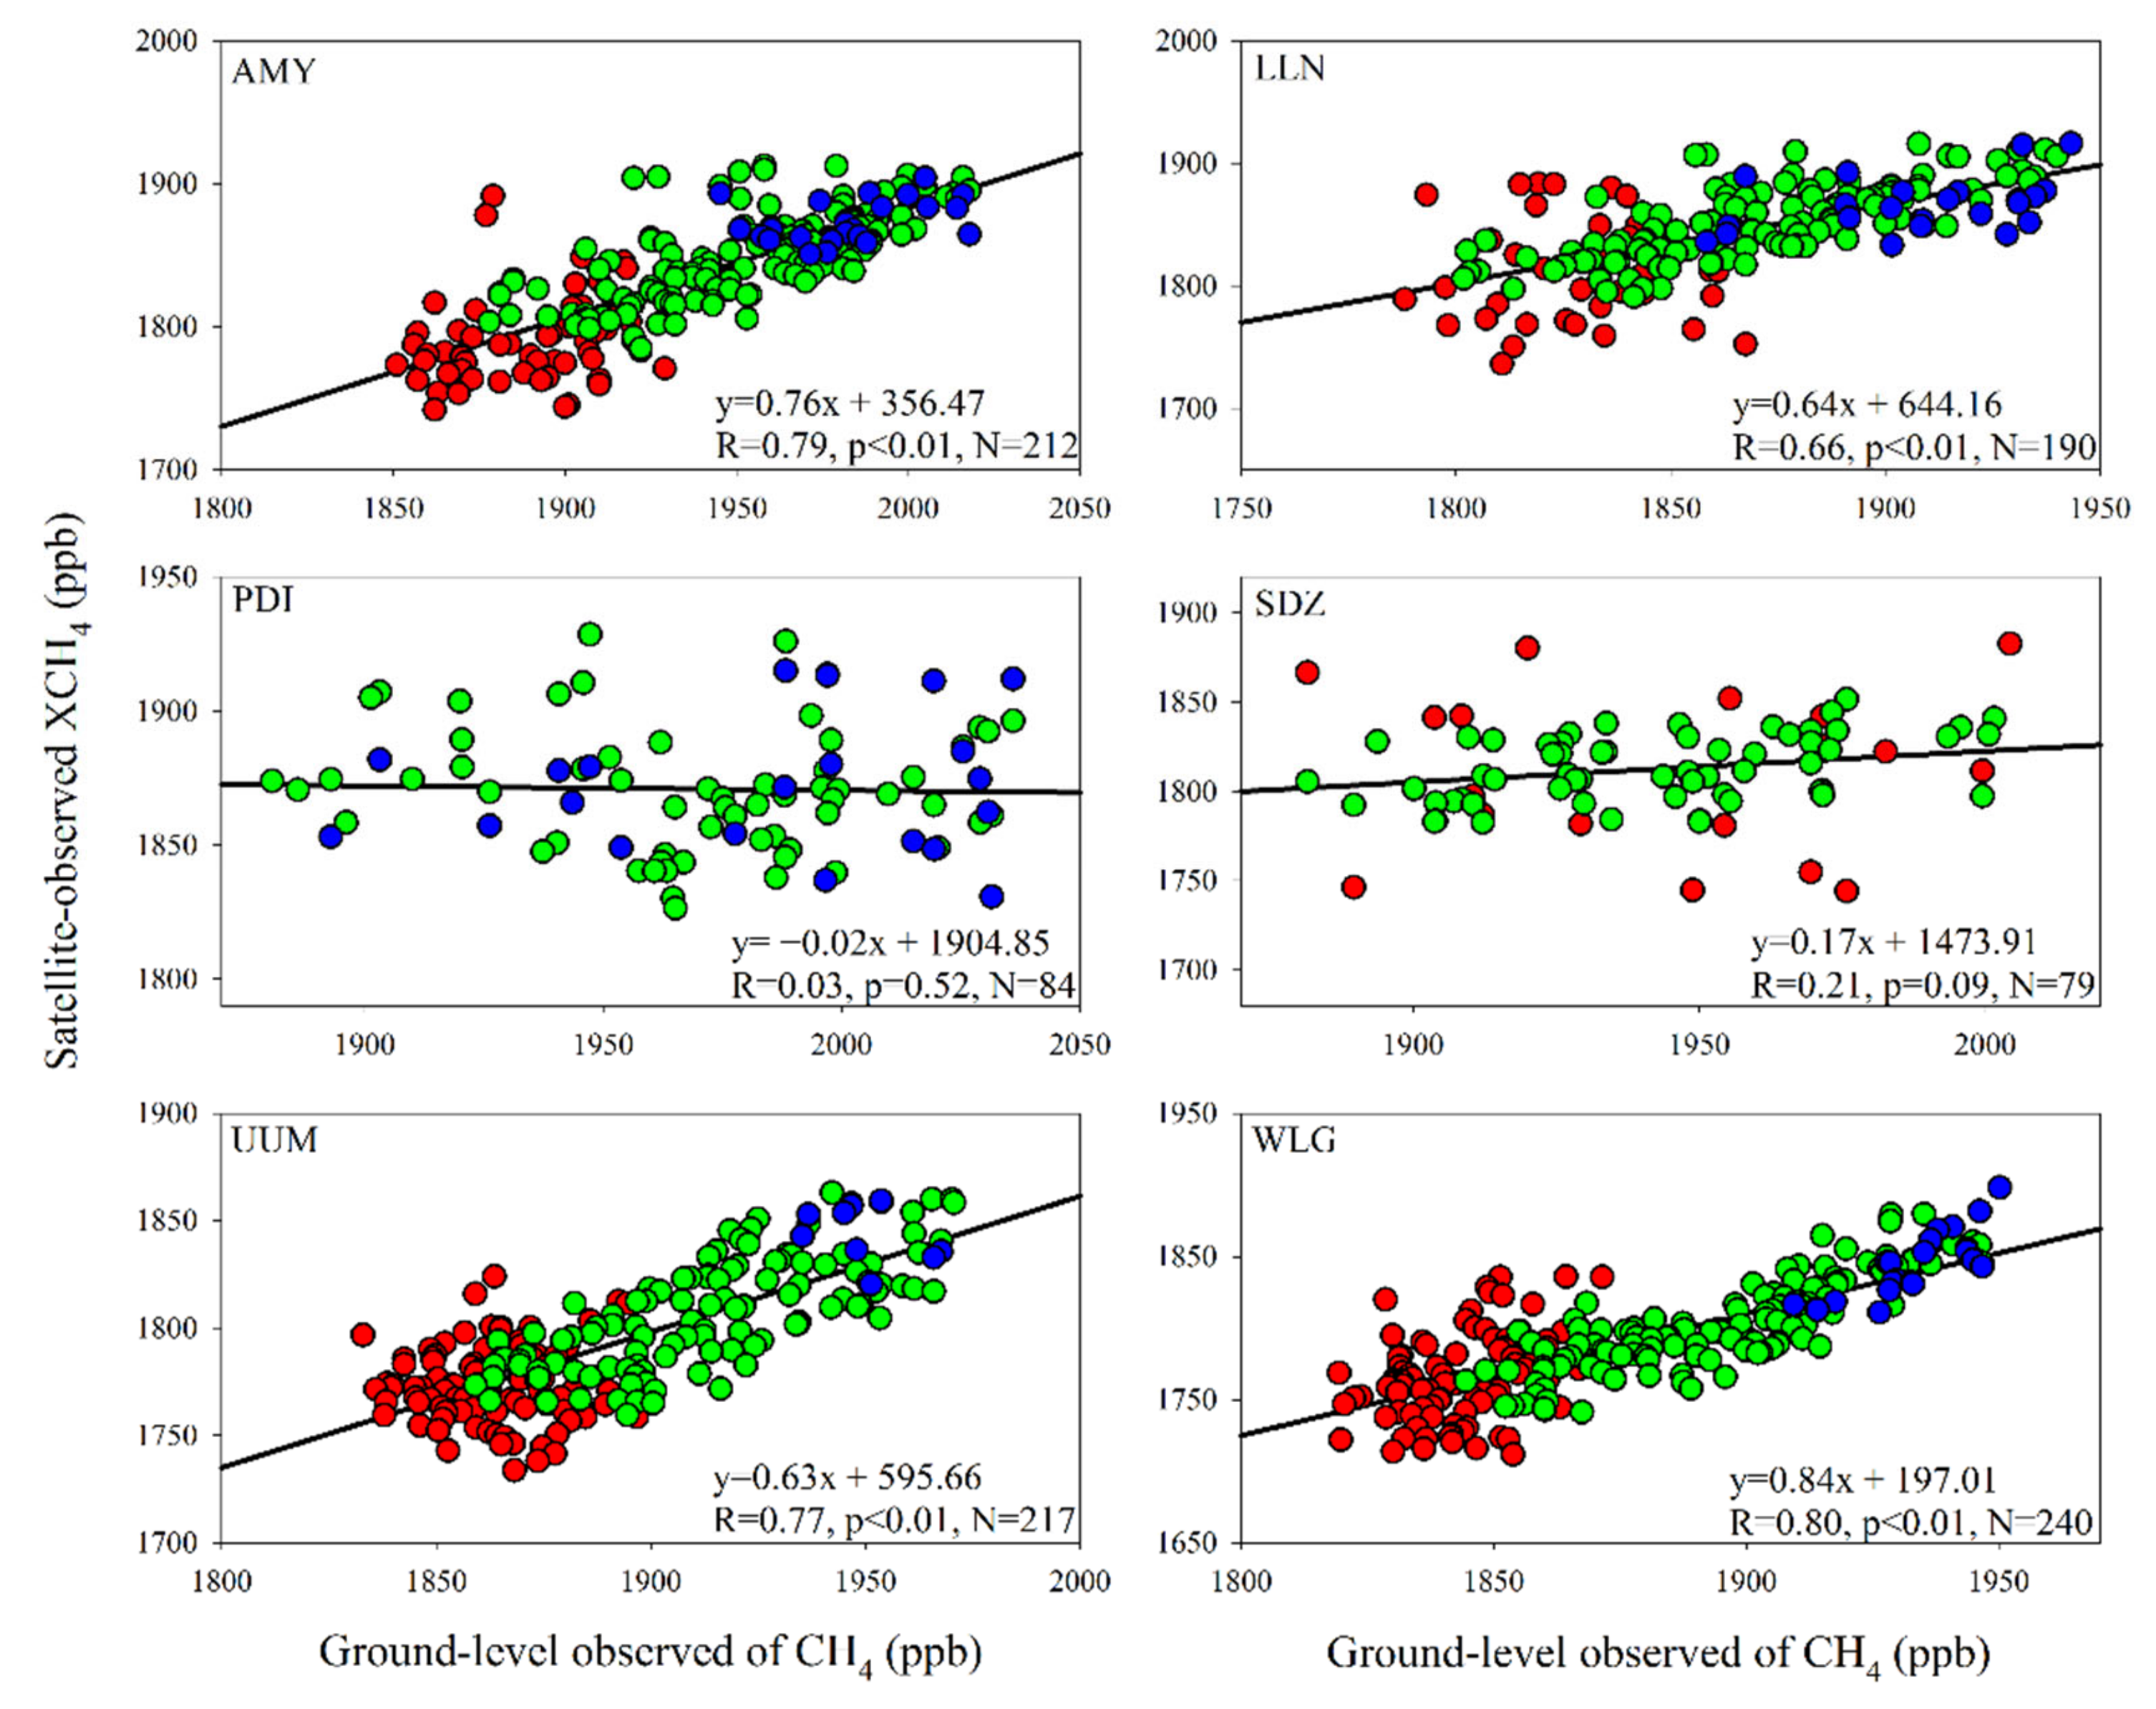
Figure 1. Scatter plots of satellite-observed XCH4 concentrations and ground-level observations of CH4 concentrations; red: SCIAMACHY, green: GOSAT, blue: S5P.
Atmosphere 13 01362 g001
Figure 2. Comparison of XCH4 concentrations from different satellites. (a) The XCH4 bias calculated by subtracting GOSAT data from SCIAMACHY data during the overlap time (January 2010 to December 2011); (b) the XCH4 bias calculated by subtracting GOSAT data from S5P data during the overlap time (January 2019 to December 2021); (c) scatter plots of the monthly averaged XCH4 concentrations between GOSAT and SCIAMACHY during the overlap time (January 2010 to December 2011); and (d) scatter plots of the monthly averaged XCH4 concentrations between GOSAT and S5P during the overlap time (January 2019 to December 2021).
Atmosphere 13 01362 g002
Figure 3. Spatial distribution of multi-year averages of atmospheric XCH4 and CH4 emissions over all of China. (a) XCH4 concentrations from SCIAMACHY (January 2003 to December 2010); (b) XCH4 concentrations from GOSAT (January 2011 to December 2018); (c) XCH4 concentrations from S5P (January 2019 to December 2021); and (d) CH4 emission from EDGAR (2003 to 2018).
Atmosphere 13 01362 g003
Figure 4. Linear sinusoidal trend model fitting results of the monthly mean XCH4 concentrations over China from January 2003 to December 2021.
Atmosphere 13 01362 g004
Figure 5. Spatial distribution of the annual rate of increase in XCH4 concentrations from 2003 to 2021. (a) Mann–Kendall trend test map for XCH4 concentrations over China; (b) Theil–Sen slope trend map for XCH4 concentrations over China; (c) Theil–Sen slope distribution at different latitudes, varying by 0.5°.
Atmosphere 13 01362 g005
Figure 6. Annual averages of XCH4 concentrations in the seven regions and China overall from 2003 to 2021.
Atmosphere 13 01362 g006
Figure 7. Spatial distributions of the seasonal averages of XCH4 concentrations across China in the four seasons from SCIAMACHY (2003–2010), GOSAT (2011–2018), and S5P (2019–2021). (a1a4) Spring, summer, autumn, and winter data from SCIAMACHY; (b1b4) spring, summer, autumn, and winter data from GOSAT; (c1c4) spring, summer, autumn, and winter data from S5P; (d) monthly variations of XCH4 concentrations over China.
Atmosphere 13 01362 g007
Figure 8. Relationship between rice paddies and XCH4 concentrations. (a) Spatial distribution of rice paddy areas in China and the four regions of interest (ROIS); (a1) Single cropping rice S1 and S2; (a2) Double cropping of rice D1 and D2; (b) XCH4 concentrations at seven areas with different proportions of rice paddies (1–7 correspond to <0.5%, 0.5–1%, 1–5%, 5–10%, 10–20%, 20–40%, and >40%, respectively); (cf) The monthly average of XCH4 concentrations and enhanced vegetation index (EVI) on rice paddy pixels (rice area >10%) in four regions of interest (ROIs) of S1, S2, D1, and D2, respectively.
Atmosphere 13 01362 g008
Table 1. The correlation between satellite-observed XCH4 concentrations and ground measurement of CH4 concentrations.
SitesSatellitesRegressionRpRMSEN
AMYSCIAMACHYy = 0.39x + 1047.770.270.0452.2161
GOSATy = 0.65x + 584.040.69<0.0177.24128
S5Py = 0.27x + 1331.060.370.0834.3223
LLNSCIAMACHYy = 0.07x + 1686.860.030.8419.7743
GOSATy = 0.678x + 583.080.75<0.0121.64125
S5Py = 0.35x + 1205.980.400.0714.5922
PDISCIAMACHY
GOSATy = −0.06x + 1986.990.100.4456.3963
S5Py = 0.08x + 1721.490.130.5735.8421
SDZSCIAMACHYy = 0.01x + 1794.790.010.9841.5820
GOSATy = 0.26x + 1312.770.43<0.0165.0659
S5P
UUMSCIAMACHYy = 0.04x + 1692.940.040.7357.4392
GOSATy = 0.66x + 552.700.73<0.0175.49116
S5Py = −0.47x + 2758.410.400.2820.989
WLGSCIAMACHYy = 0.98x − 39.400.41<0.0152.7298
GOSATy = 1.06x − 203.270.84<0.0168.03126
S5Py = 1.72x − 1484.190.81<0.0126.0720
Table 2. Main parameters of three satellites.
SatelliteSCIAMACHYGOSATSentine-5P
Launch timeMar, 2002Jan, 2009Oct, 2017
Orbit(km)772666824
Accuracy(ppb)-375.6
Spectral coverage(um)0.21–2.380.76–14.330.27–0.775
2.305–2.385
CH4 band(um)2.36–2.381.56–1.720.25–1.0
5.56–14.33
Swath(km)9606402600
Spatial resolution(km)32 × 6010.57 × 5.5
limn sounders
Viewing Modelnadir lookingnadir llokingnadir looking
occulation mode
CH4 algorithmWFM-DOASOptimization algorithmWFM-DOAS
Table 3. Comparison of the linear sinusoidal trend mode parameters for China and the ground stations.
SitesABCDR2RMSE
China17470.55−14.151.530.9310.08
AMY18430.7118.951.630.8716.98
LLN17800.6120.711.150.8016.68
PDI18420.7046.961.300.6129.54
SDZ18810.6330.663.750.4132.54
UUM18360.5416.751.070.9111.30
WLG18170.546.543.830.9110.96
Publisher’s Note: MDPI stays neutral with regard to jurisdictional claims in published maps and institutional affiliations.