Abstract
The forests of northern Mexico and the southwestern United States have been subjected to warmer temperatures, persistent drought, and more intense and widespread wildfire. Tree-ring data from four conifer species native to these borderlands forests are compared with regional and large-scale precipitation and temperature data. These species include Abies durangensis, Pinus arizonica, Pinus cembroides, and Pseudotsuga menziesii. Twelve detrended and standardized ring-width chronologies are derived for these four species, all are cross-correlated during their common interval of 1903–2000 (r = 0.567 to 0.738, p < 0.01), and all load positively on the first principal component of radial growth, which alone represents 56% of the variance in the correlation matrix. Correlation with monthly precipitation and temperature data for the study area indicates that all four species respond primarily to precipitation during the cool season of autumn and winter, October–May (r = 0.71, p < 0.01, 1931–2000), and to temperature primarily during the late spring and early summer, January–July (r 0 −0.67, p < 0.01, 1931–2000), in spite of differences in phylogeny and microsite conditions. The instrumental climate data for the region indicate that warmer conditions during the January–July season most relevant to radial growth are beginning to exceed the warmest episode of the 20th century in both intensity and duration. The strong negative correlation between temperature and tree growth indicates that these four conifer species may be challenged by the warmer temperatures forecast in the coming decades for the borderlands region due to anthropogenic forcing. This information could constitute a baseline to analyze the impact of climate change in other regions of Mexico and the USA, where conifer species are of great ecological and socioeconomical importance.
1. Introduction
Understanding climate variability and the impacts of climate change in natural protected areas is important for the development of management strategies for conservation, restoration, and the sustainable use of natural resources. Natural areas protect biodiversity and may provide multiple environmental services of basic importance to society [1]. The sustainable management of natural areas is therefore potentially important to the communities living in or near by the protected preserves.
A limitation to developing and implementing management strategies of natural protected areas, in particular those located in the borderland area of the Mexican side, is the lack of information about the dynamics of plant communities, annual radial growth and biomass production of dominant trees, scarcity of climatic information records, and the representativeness and quality of the available data. This information is needed to develop hydrological balances and to determine the water and other environmental services provided by these preserves and the impact that land-use changes may have on variables affecting the hydrological cycle and biodiversity [2]. Climatic scenarios for northern Mexico based on the Intergovernmental Panel on Climate Change (IPCC) models for the period 2000–2099 indicate an increase in aridity and more frequent droughts [3], with an estimated reduction in water availability of approximately 30% [4]. This reduction will affect those species with higher water demands, and it may increase tree mortality and disrupt ecosystem stability [5,6,7]. Warming temperatures have a direct effect on the rate of photosynthesis and respiration processes, increasing the rate of infestation, changing forest structure and biodiversity, and disturbing the carbon cycle and other ecological processes [8]. Understanding the effect of climate warming in forest species present in semiarid forest communities of the borderland area of Texas and northern Mexico is important to propose mitigation alternatives and to preserve the environmental services provided by those ecosystems, which may also contribute to ameliorate the effect of climate warming [9].
The Maderas del Carmen Natural Protected Area (MDCPA) located in northern Coahuila is adjacent to and east of Big Bend National Park (BBNP), Texas. The Cañón de Santa Elena (CSEPA) preserve is located immediately west of Big Bend NP along the Rio Bravo (Rio Grande) in Chihuahua, Mexico. These three protected areas share similar flora and fauna, and they constitute a bi-national corridor that protects regional biodiversity and provides habitat for endemic species native to the Chihuahuan desert [10].
Predicted changes in the amount and timing of precipitation along with further warming may have a strong impact on plant species in the borderlands area of the Chihuahuan desert [11]. Lower precipitation and warmer temperatures have already caused bark-beetle infestations, wildfires, and tree mortality in the temperate forests of the southwestern United States during the last 50 years [12,13]. Understanding climate–vegetation relationships is important in the borderlands, where prolonged droughts may have a particularly detrimental impact on the native conifer species [7]. The objective of this study was to identify the precise seasonal precipitation and temperature signal present in tree-ring data of four conifer species native to the borderlands (i.e., Abies durangensis Martínez, Pinus arizonica Engelm., Pinus cembroides Zucc., and Pseudotsuga menziesii Mirb. Franco). We hypothesize that given the environmental and phylogenetic differences among the studied conifer species, they will have a different climatic response function and will be affected differently by climate warming. To what extent might projected seasonal climate change threaten these native forest species?
2. Materials and Methods
2.1. Location of the Study Area
The natural protected areas BBNP, MDCPA, and CSEPA are located at the northern edge of the Sierra Madre Oriental (Eastern Sierra Madre) in western Texas, USA, and the state limits of Chihuahua and Coahuila, Mexico. The area is geologically diverse, and much of the main mountain mass is composed of Tertiary volcanic rocks covered by a layer of Cretaceous sedimentary rocks [10]. The topography of the area is complex dominated by rocky uplands separated by steep and deep canyons. This heterogeneous physiography creates varied environmental conditions that favor biodiversity [14].
The BBNP has an area of 324,000 ha in western Texas bordering Mexico along the Rio Grande/Rio Bravo; it has an elevation of 595 m along the river to 2575 m in the Chisos Mountain, and it is the southernmost range in the continental United States. The BBNP exhibits contrasted climatic conditions due to the range in elevation, which cause a wide variation in moisture availability and temperature. Annual precipitation ranges from 150 mm in the arid alluvial plains to 430 mm at the Emory Peak at the Chisos Mountains. Summer temperatures reach near 40 °C, and subfreezing temperatures occasionally occur in the wintertime. This variation in climate contributes to the extraordinary diversity in plant and wildlife habitats present in the park [15].
The MDCPA encompasses an area of 208,381 ha in the municipalities of Ocampo, Muzquiz, and Acuña, Coahuila, Mexico. Elevation varies from 500 to 3100 m and precipitation ranges from 100 to 400 mm at the MDCPA. Mean annual temperature varies from 18 to 22 °C. These conditions favor the presence of different vegetation communities along the elevation gradient; thus, desert grasslands and shrublands dominate low elevations, and mixed-conifer forest dominate upper elevations. Dominant vegetation above 1600 m elevation is composed by a piñon–juniper community (1400 to 2700 m), pine–oak forests (1900 to 2600 m), and fir–cypress forest (1600 to 2700 m) with the presence of Psedutosuga menziesii Mirb., and Abies durangensis var. Coahuilenses [16].
The CSEPA has an area of 277,209 ha and is located at the international frontier at the northeastern margin of the Chihuahua state, bordering BBNP to the north. At an elevation range from 575 to 1840 m, the dominant vegetation communities are grasslands and shrublands at lower elevations and an oak–pinon community at higher elevations with the presence of Pinus cembroides, Quercus grisea, and Quercus arizonica [17].
Climate conditions in the CSEPA were obtained from weather stations located at the municipalities of Ojinaga and Manuel Benavides in the state of Chihuahua, Mexico, and Chisos in the BBNP, Texas, USA. Dominant climate varies according to the region, with a precipitation range from 287 to 571 mm at lower and upper elevations, respectively. Mean annual average temperature ranges from 19.5 to 26.0 °C, with an average minimum temperature of 10.0 °C in January and a mean maximum of 27.8 °C in June [15]. The hydrology of the region is very limited with watersheds yielding ephemeral streams draining toward the Conchos and Rio Bravo rivers. Dominant soils are shallow in depth and classified as lithosols, mollisols and entisols; they are composed of deep gravelly loam, which is well drained and non-calcareous with a low water-holding capacity [17].
2.2. Tree-Ring Chronology Development
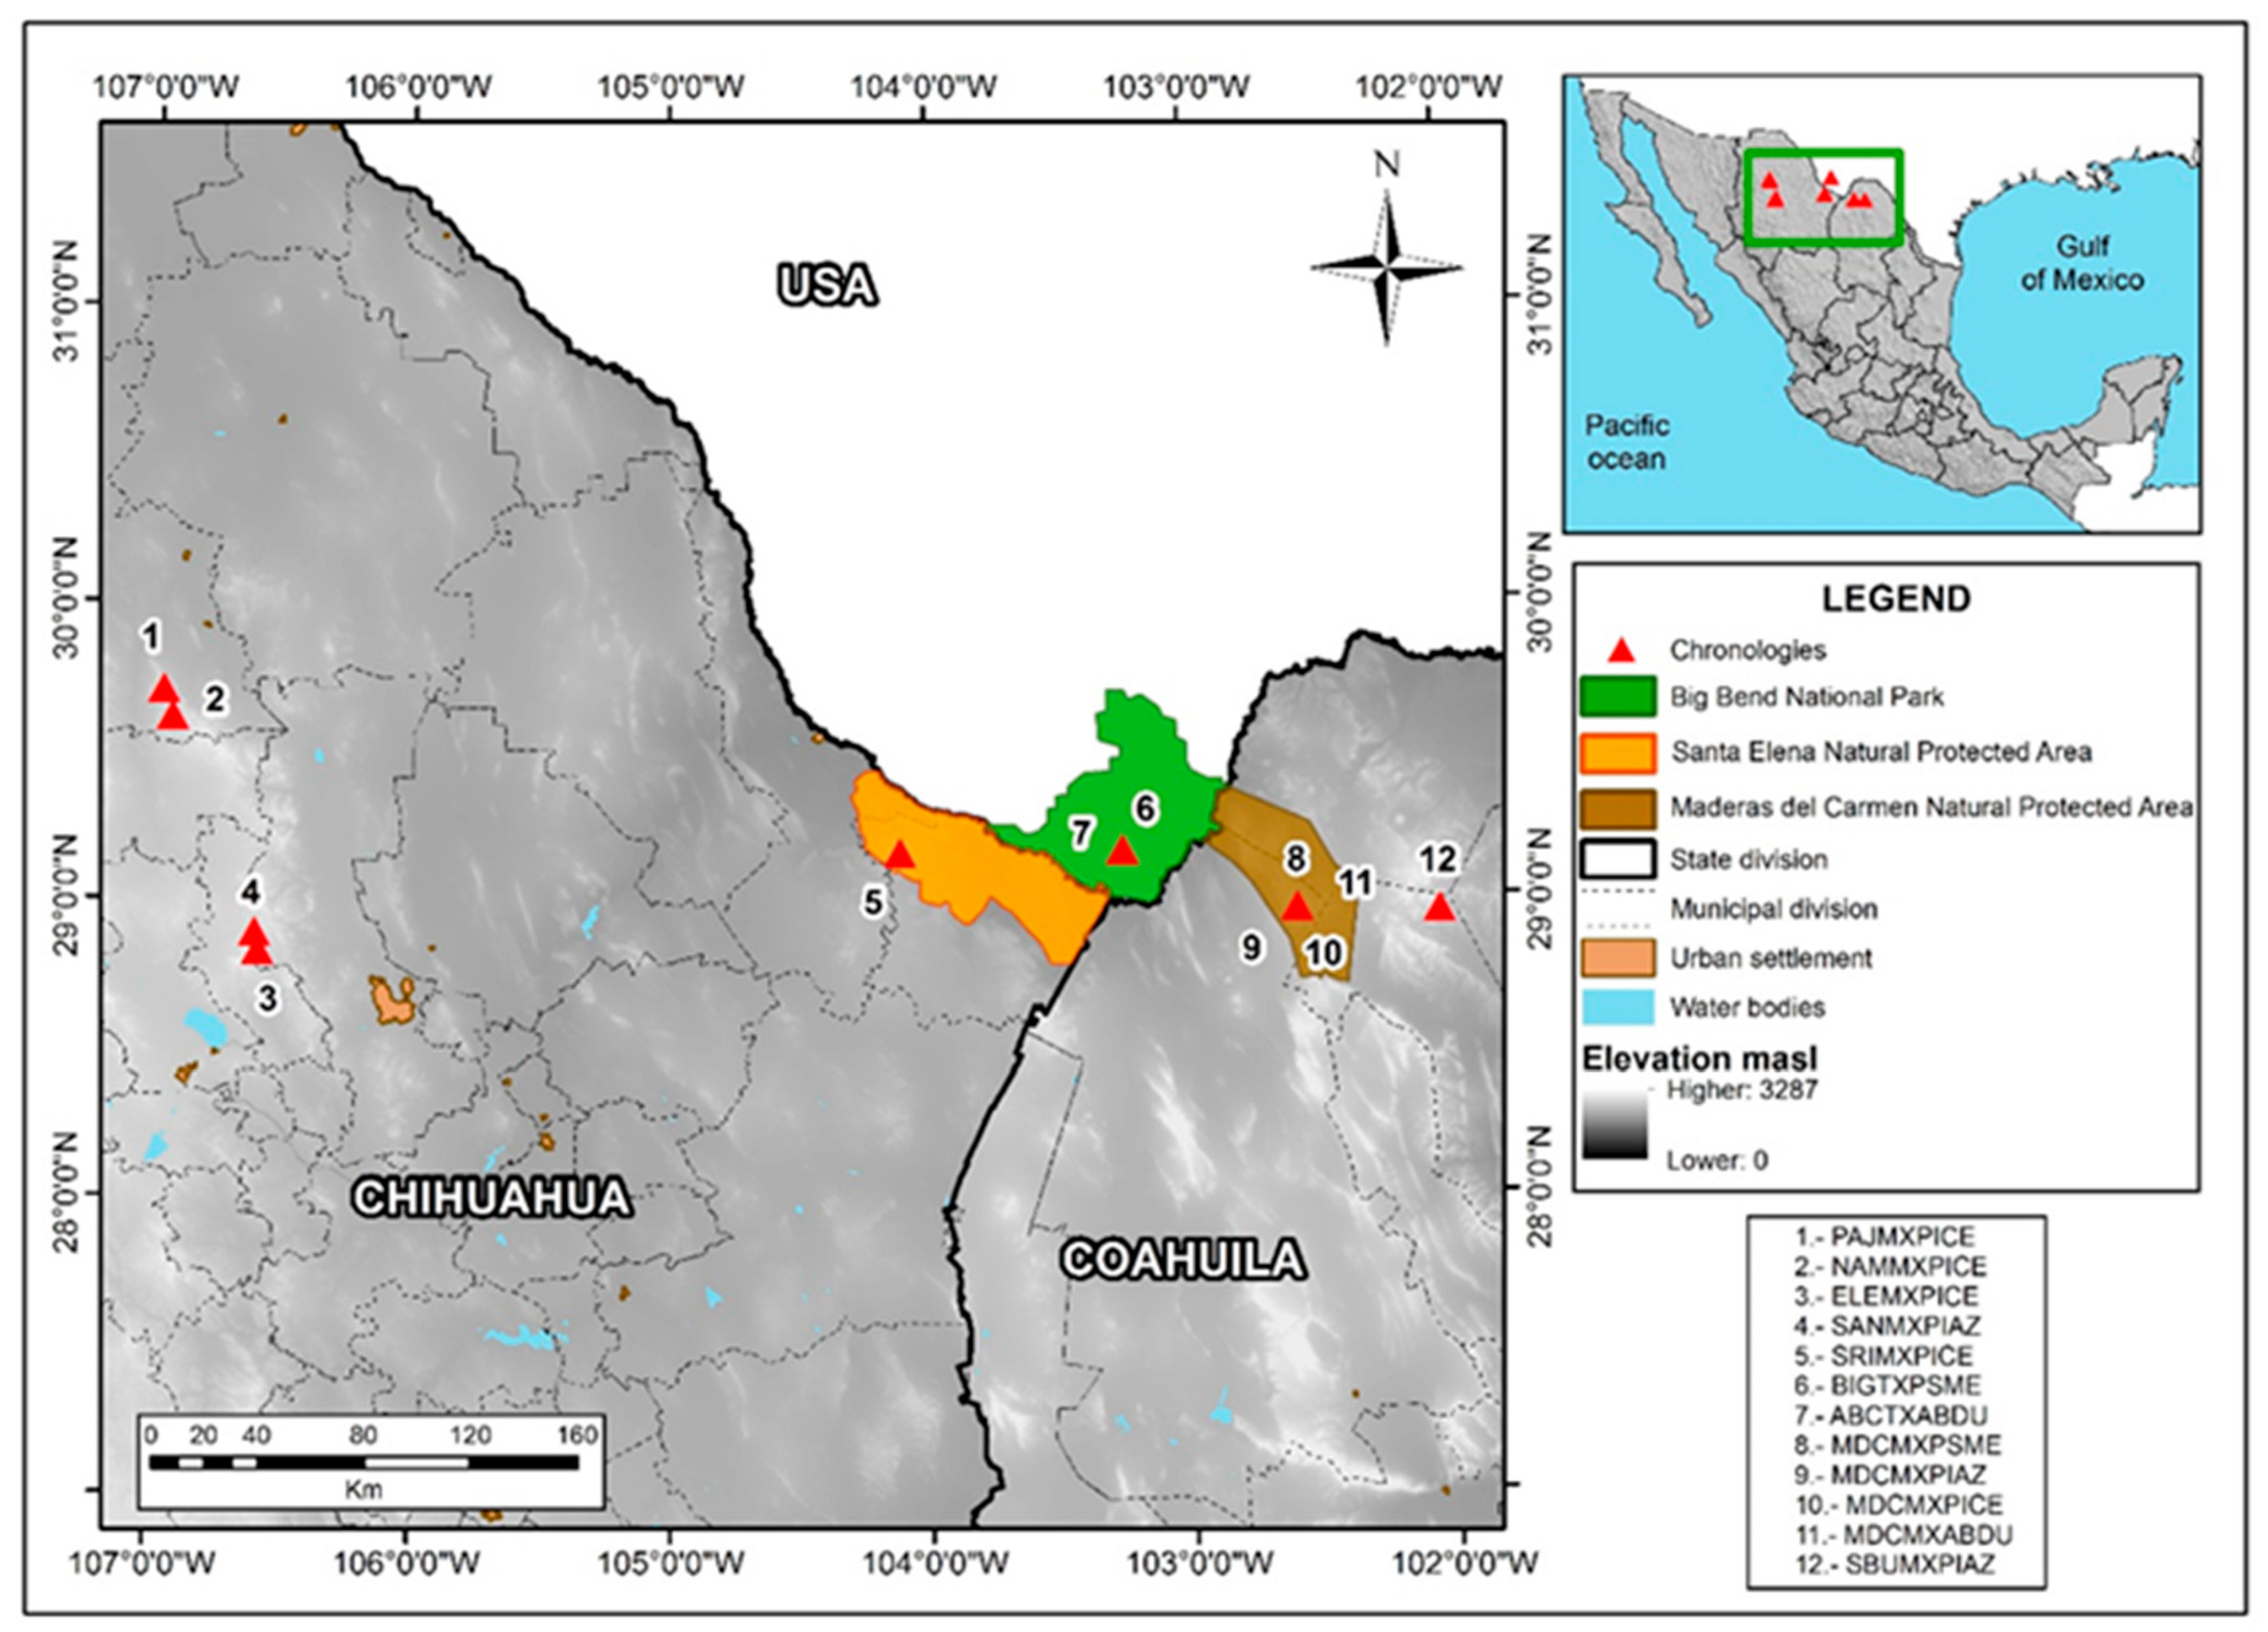
Twelve conifer tree-ring chronologies from the borderlands region were used in this analysis (Figure 1, Table 1). To develop the chronologies, the field sampling procedures involved obtaining two increment cores at breast height from selected trees with a Swedish increment borer and cross-sections from stumps or dead trees with a chainsaw in the MDCPA, CSEA, and neighboring watersheds. The tree species sampled were Abies duranguensis var. Coahuilenses, Pinus arizonica, Pinus cembroides, and. Pseudotsuga menziesii. The total ring-width data for BBNP, Texas, were downloaded from the ITRDB (https://www1.ncdc.noaa.gov/pub/data/paleo/treering/measurements/northamerica/usa/tx042.rwl (accessed on 10 March 2022)).
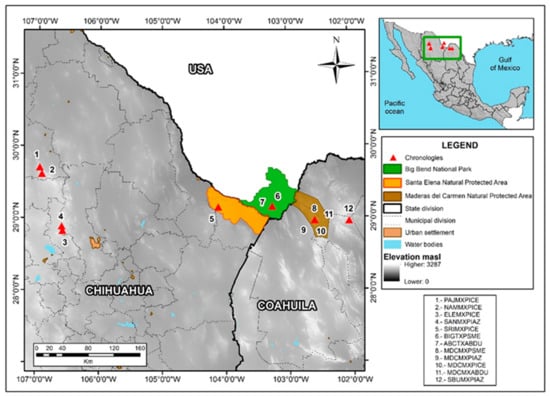
Figure 1.
The locations of tree-ring chronologies from the borderland are numbered and plotted (red triangles). The three large protected natural areas in the Big Bend region of the Rio Brave are also mapped along with the international frontier and the municipal divisions in Chihuahua and Coahuila.

Table 1.
Network of ring-width chronologies along the international border between Texas and the Mexican states of Chihuahua and Coahuila.
The polished cores and cross-sections were crossdated following standard dendrochronological procedures [18]. Ring widths were measured with a Velmex measurement system to a precision of 0.001 mm, and the measured time series were screened for dating or measurement errors using correlation analyses in the computed program COFECHA [19,20]. The Signal Free method was used to compute the ring-width index chronologies [21,22]. However, the Signal Free approach requires large sample sizes for best results, and some of the borderlands datasets are based on relatively few trees. Consequently, we computed the chronologies used in this study as the robust mean value of the index series that were detrended and standardized based on an age-dependent spline function. The variance of the derived mean index chronologies was also then stabilized by the methods outlined by Meko et al. [23] and Stahle et al. [24]. A regional average ring-width index chronology was computed for each species and plotted for comparisons between the species.
2.3. Correlation of the Tree-Ring Chronologies with Regional Precipitation and Temperature
The 0.5° gridded monthly precipitation totals were obtained from the Global Precipitation Climatology Centre (GPCC) [25,26]. The 0.5° gridded monthly mean temperature data were obtained from the University of Delaware [27]. This database was chosen considering that the gridded climate data are derived from quality controlled station data, and that the full data reanalysis product (1901–2010) is well recommended for regional water balance studies, particularly considering that includes the period covered for most of the tree-ring series involved in this study. Other gridded precipitation datasets, e.g., ERA-Interim ECMWF or CHELSEA (Climatologies at high resolution for the earth’s land surface area), are high-resolution databases, but they have extension limitations, providing information for the periods 1979–2019 and 1979–2013, respectively. On the other hand, Terraclimate has limited validation in data-sparse regions such as the Chihuahuan desert in northern Mexico.
To compute the climate response of each tree-ring chronology, the gridded instrumental precipitation data were first totaled, and the temperature data were averaged on a monthly basis for the study area (28.5–30.5° N, 102–107° W). The period of analysis extended from 1946 to 2000 because the instrumental precipitation and temperature data are limited before 1946, and some of the tree-ring chronologies end in the early 2000s when the core samples were collected. A significant correlation of at least (p < 0.05) for the common period of 1946–2000 was used to define the monthly climate signal in these tree-ring chronologies.
2.4. Principal Component Analysis
Principal component analysis (PCA) consists of a dimensionality-reduction method of a large data set used to minimize the number of variables, while preserving as much information as possible. To perform a PCA analysis, it is important to consider that the data set fulfills some statistical requirements; among them is that the correlation between variables be linear, the data set be free of outliers, and data be continuous. The tree-ring data set employed in this study fulfilled these requirements. Other dimensionally-reduction methods such as partial least square (PLS) or the principal component regression method (PCR) were not useful for this purpose, given that the PLS is particularly suited when the matrix of predictors has more variables than observations, whereas the PCR is used for estimating the unknown regression coefficients in a standard linear regression model, which was not the purpose of the analysis.
In this study, PCA was used to investigate the common growth signal detrended and standardized chronologies of total ring width. The time series scores of the first principal component with the highest variance in the correlation matrix of ring-width chronologies was then correlated with gridded monthly precipitation and monthly mean temperature over North America to document the strength and spatial pattern of the monthly climate signal in conifer growth over the borderlands region. A time series perspective on the signal of climate variability and climate change was also derived by totaling the monthly precipitation for each grid point and then averaging it for the study area (28.5–30.5° N, 102–107° W) from 1901 to 2017. These regional precipitation data were then totaled for the October–May cool season and correlated with PC1 of the 12 conifer chronologies from the borderlands for the common period (1931–2000). The monthly temperature data were also averaged for the same area and for the seasonal period January–July and then correlated with the scores of PC1.
3. Results
3.1. The Borderlands Tree-Ring Chronologies
The 12 total ring-width chronologies developed in the borderlands region are listed in Table 1. The shortest chronology is the A. durangensis series from Big Bend National Park, Texas, that extends from 1903 to 2004, and the longest is the P. menziesii chronology that extends from 1473 to 2014, which is also from Big Bend. Four chronologies were developed from the Maderas del Carmen, Coahuila, and the remaining chronologies were developed at various locations in Coahuila and Chihuahua (Table 1). All of these conifer chronologies were collected from arid forest sites that are highly sensitive to inter-annual and decadal climate variability [28,29].
3.2. Co-Variability of the Borderlands Tree-Ring Chronologies
The results of the PCA based on the 12 borderland chronologies for the common period 1931–2000 are presented in Table 2 and Table 3. These 12 chronologies are all well correlated, all load positively on PC1, and the PC1 scores are very strongly and significantly correlated with the soil moisture balance over northern Mexico and the southwestern US. PC1 explains 56% of the variance, while PC2 and PC3 explain 9.7 and 8.0% of the variance, respectively (Table 2). The loadings of each conifer chronology on PC1 indicate that the center of gravity for these 12 chronologies is the Maderas del Carmen Protected Area (Table 3), with the Douglas-fir from MDC having the highest loading. The loadings on PC2 mostly discriminate the MDC chronologies from the others.
Table 2.
Principal components analysis of the 12 conifer chronologies from the Borderlands region of Texas and Mexico, 1931–2000.
Table 3.
Loadings of the 12 conifer chronologies on the first three principal components, 1931–2000. Chronology naming conventions: first three characters = site code, TX = Texas, MX = Mexico; ABDU = A. durangensis, PSME = P. menziesii, PICE = P. cembroides, PIAZ = P. arizonica.
The correlations among the four separate species are also very strong, especially when based on the regional averages of two separate chronologies per species (Table 4). The regional ring-width chronologies for the four species are plotted in Figure 2. The inter-species correlations among these four species chronologies range from 0.56 to 0.73 for the common period of 1903–2000 (Table 4). All four species recorded low growth during the severe drought of the 1950s, especially P. arizonica (Figure 2). Above average growth was recorded by all species during the 1980s (Figure 2). The strong loadings on PC1, the significant correlation among the species chronologies, and the synchronous sub-decadal tree growth anomalies in the 1950s and 1980s all suggest that the radial growth of the four conifer species in the borderlands region is driven largely by the same regional climate conditions.
Table 4.
The correlation matrix is presented for the regional average ring-width chronologies based on four conifer species for the common period of 1903–2000.

Figure 2.
Regional average ring-width index chronologies based on two collection sites per species are plotted for their common intervals. The Abies average is based on ABCTXABDU and MDCMXABDU (site codes defined in Table 1), which are correlated at r = 0.58 for 1905–2000 (a). The P. arizonica average is based on MDCMXPIAZ and SANMXPIAZ, correlated at r = 0.47 for 1860–2000 (b). The P. menziesii average is based on BIGTXPSME and MDCMXPSME, correlated at r = 0.42 from 1811–2000 (c). The P. cembroides average is based on ELEMXPICE and NAMMXPICE, correlated at r = 0.62 for 1725–2014 (d). The correlation matrix for these four species chronologies is presented in Table 4.
3.3. Climatic Response of the Borderlands Tree-Ring Chronologies
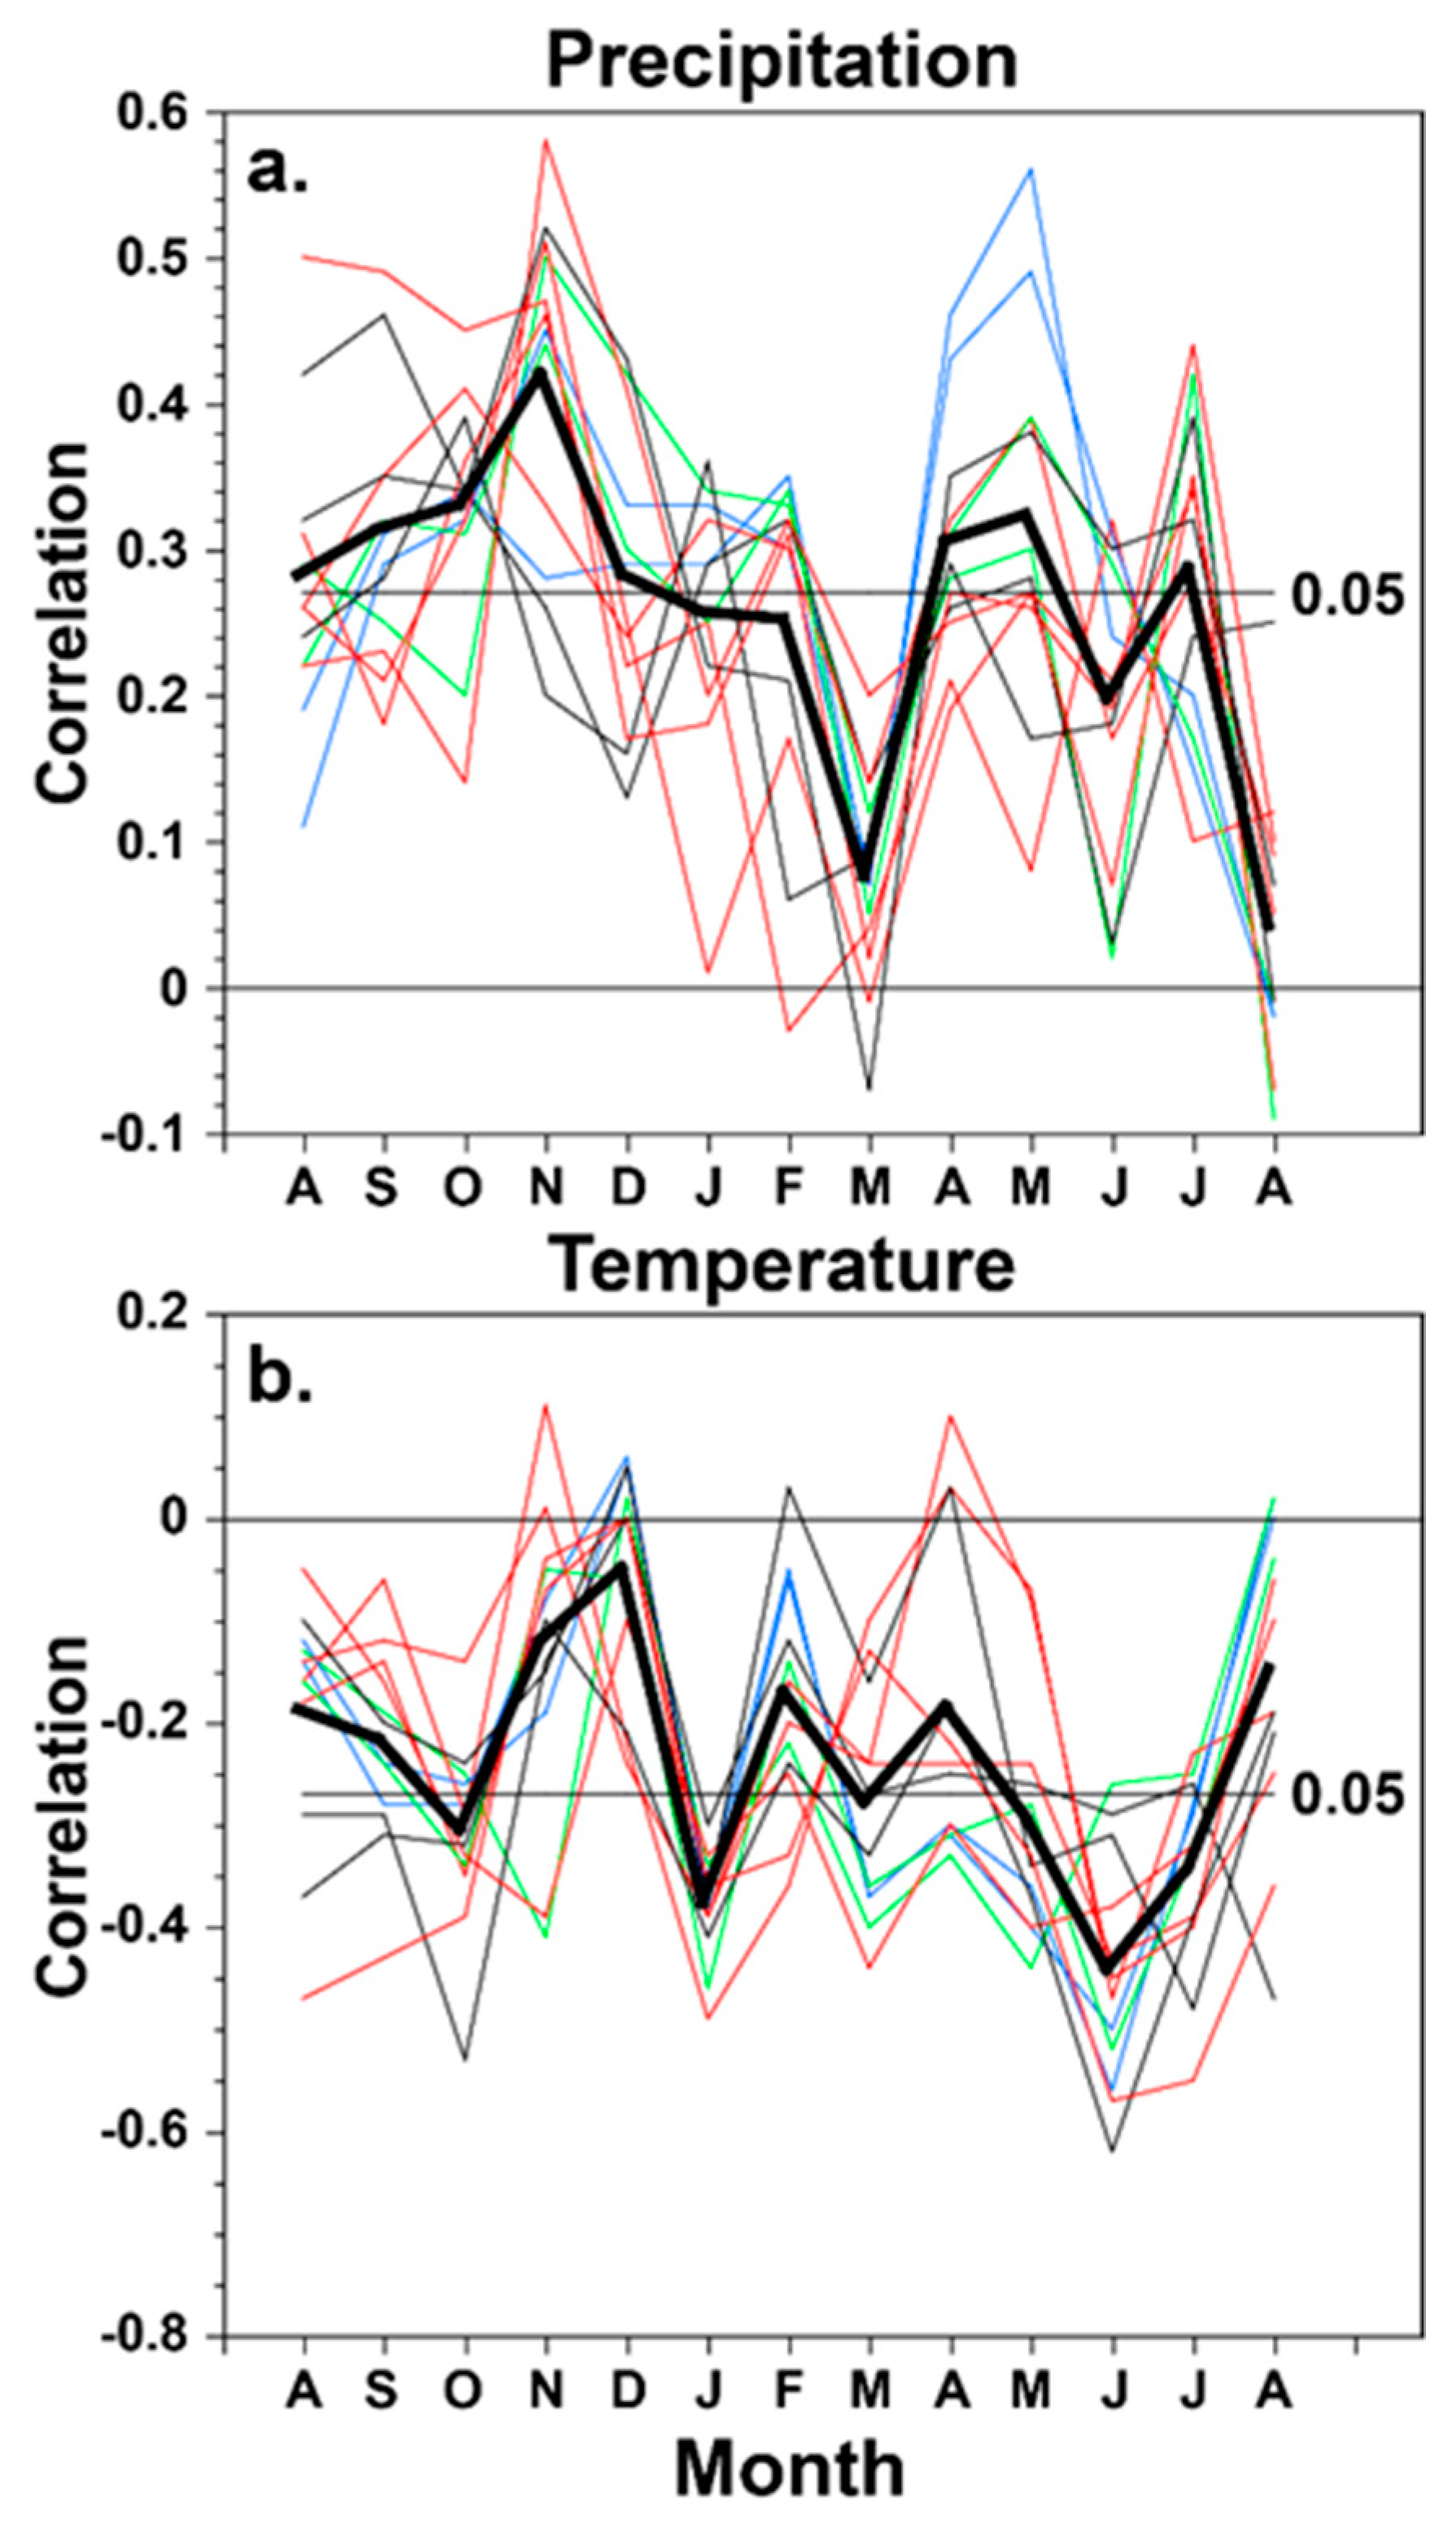
Each chronology was compared with monthly precipitation and temperature observations averaged for the study area to carefully define the monthly correlations of each species with climate. The association between the chronologies and monthly precipitation and temperature from the prior August to the current August is plotted in Figure 3. Most of the chronologies responded positively and significantly to monthly precipitation of the previous September to the current February and from April to July. In terms of temperature, a negative response for January, March, April, June and July for most of the chronologies was found (Figure 3; Table 5).

Figure 3.
The monthly climate response for the 12 conifer tree-ring chronologies from the borderlands region is plotted, based on the correlation between each chronology and the monthly precipitation totals (a) and mean temperature (b) for the study area from the prior August to the current August. The response of the A. durangensis chronologies is plotted in blue, P. menziesii in green, P. arizonica in black, and P. cembroides in red. The average monthly correlation for the 12 chronologies is also plotted (heavy black line) and with the significance thresholds (p < 0.05). The chronologies are listed in Table 1 and correlation coefficients are presented for all chronologies, climate variables, and months in Table 5.
Table 5.
Correlation coefficients computed between each tree-ring chronology and monthly precipitation and temperature data averaged for the study. All correlations were computed for the period 1946–2000 when the instrumental climate and the 12 tree-ring chronologies are most strongly replicated. Correlation values in bold are significant (p < 0.05).
The precipitation response for most of the species is strongest in autumn–early winter and in spring. P. cembroides is most strongly correlated with precipitation in autumn and early winter preceding growth, and A. durangensis is most strongly correlated with spring precipitation (Figure 3, Table 5). None of the chronologies are significantly correlated with March precipitation totals for 1946–2000, and only four are significantly correlated with June precipitation. All 12 chronologies are negatively and significantly correlated with temperature in January and June, and the strongest seasonal response to temperature extends from May to July concurrent with radial growth (Figure 3, Table 5). Ironically, the strongest correlation between these 12 conifer chronologies and temperature was observed in June when the positive correlation with precipitation is weak and only marginally significant for just four chronologies (Figure 3). The results suggest an interesting partitioning of the moisture and temperature response in these conifers of the borderland region of Texas and Mexico. The average moisture response for the 12 chronologies is strongest in autumn and early winter, but the temperature response is strongest in early summer (June–July). With the possible exception of A. durangensis, these four species have a very similar climate response.
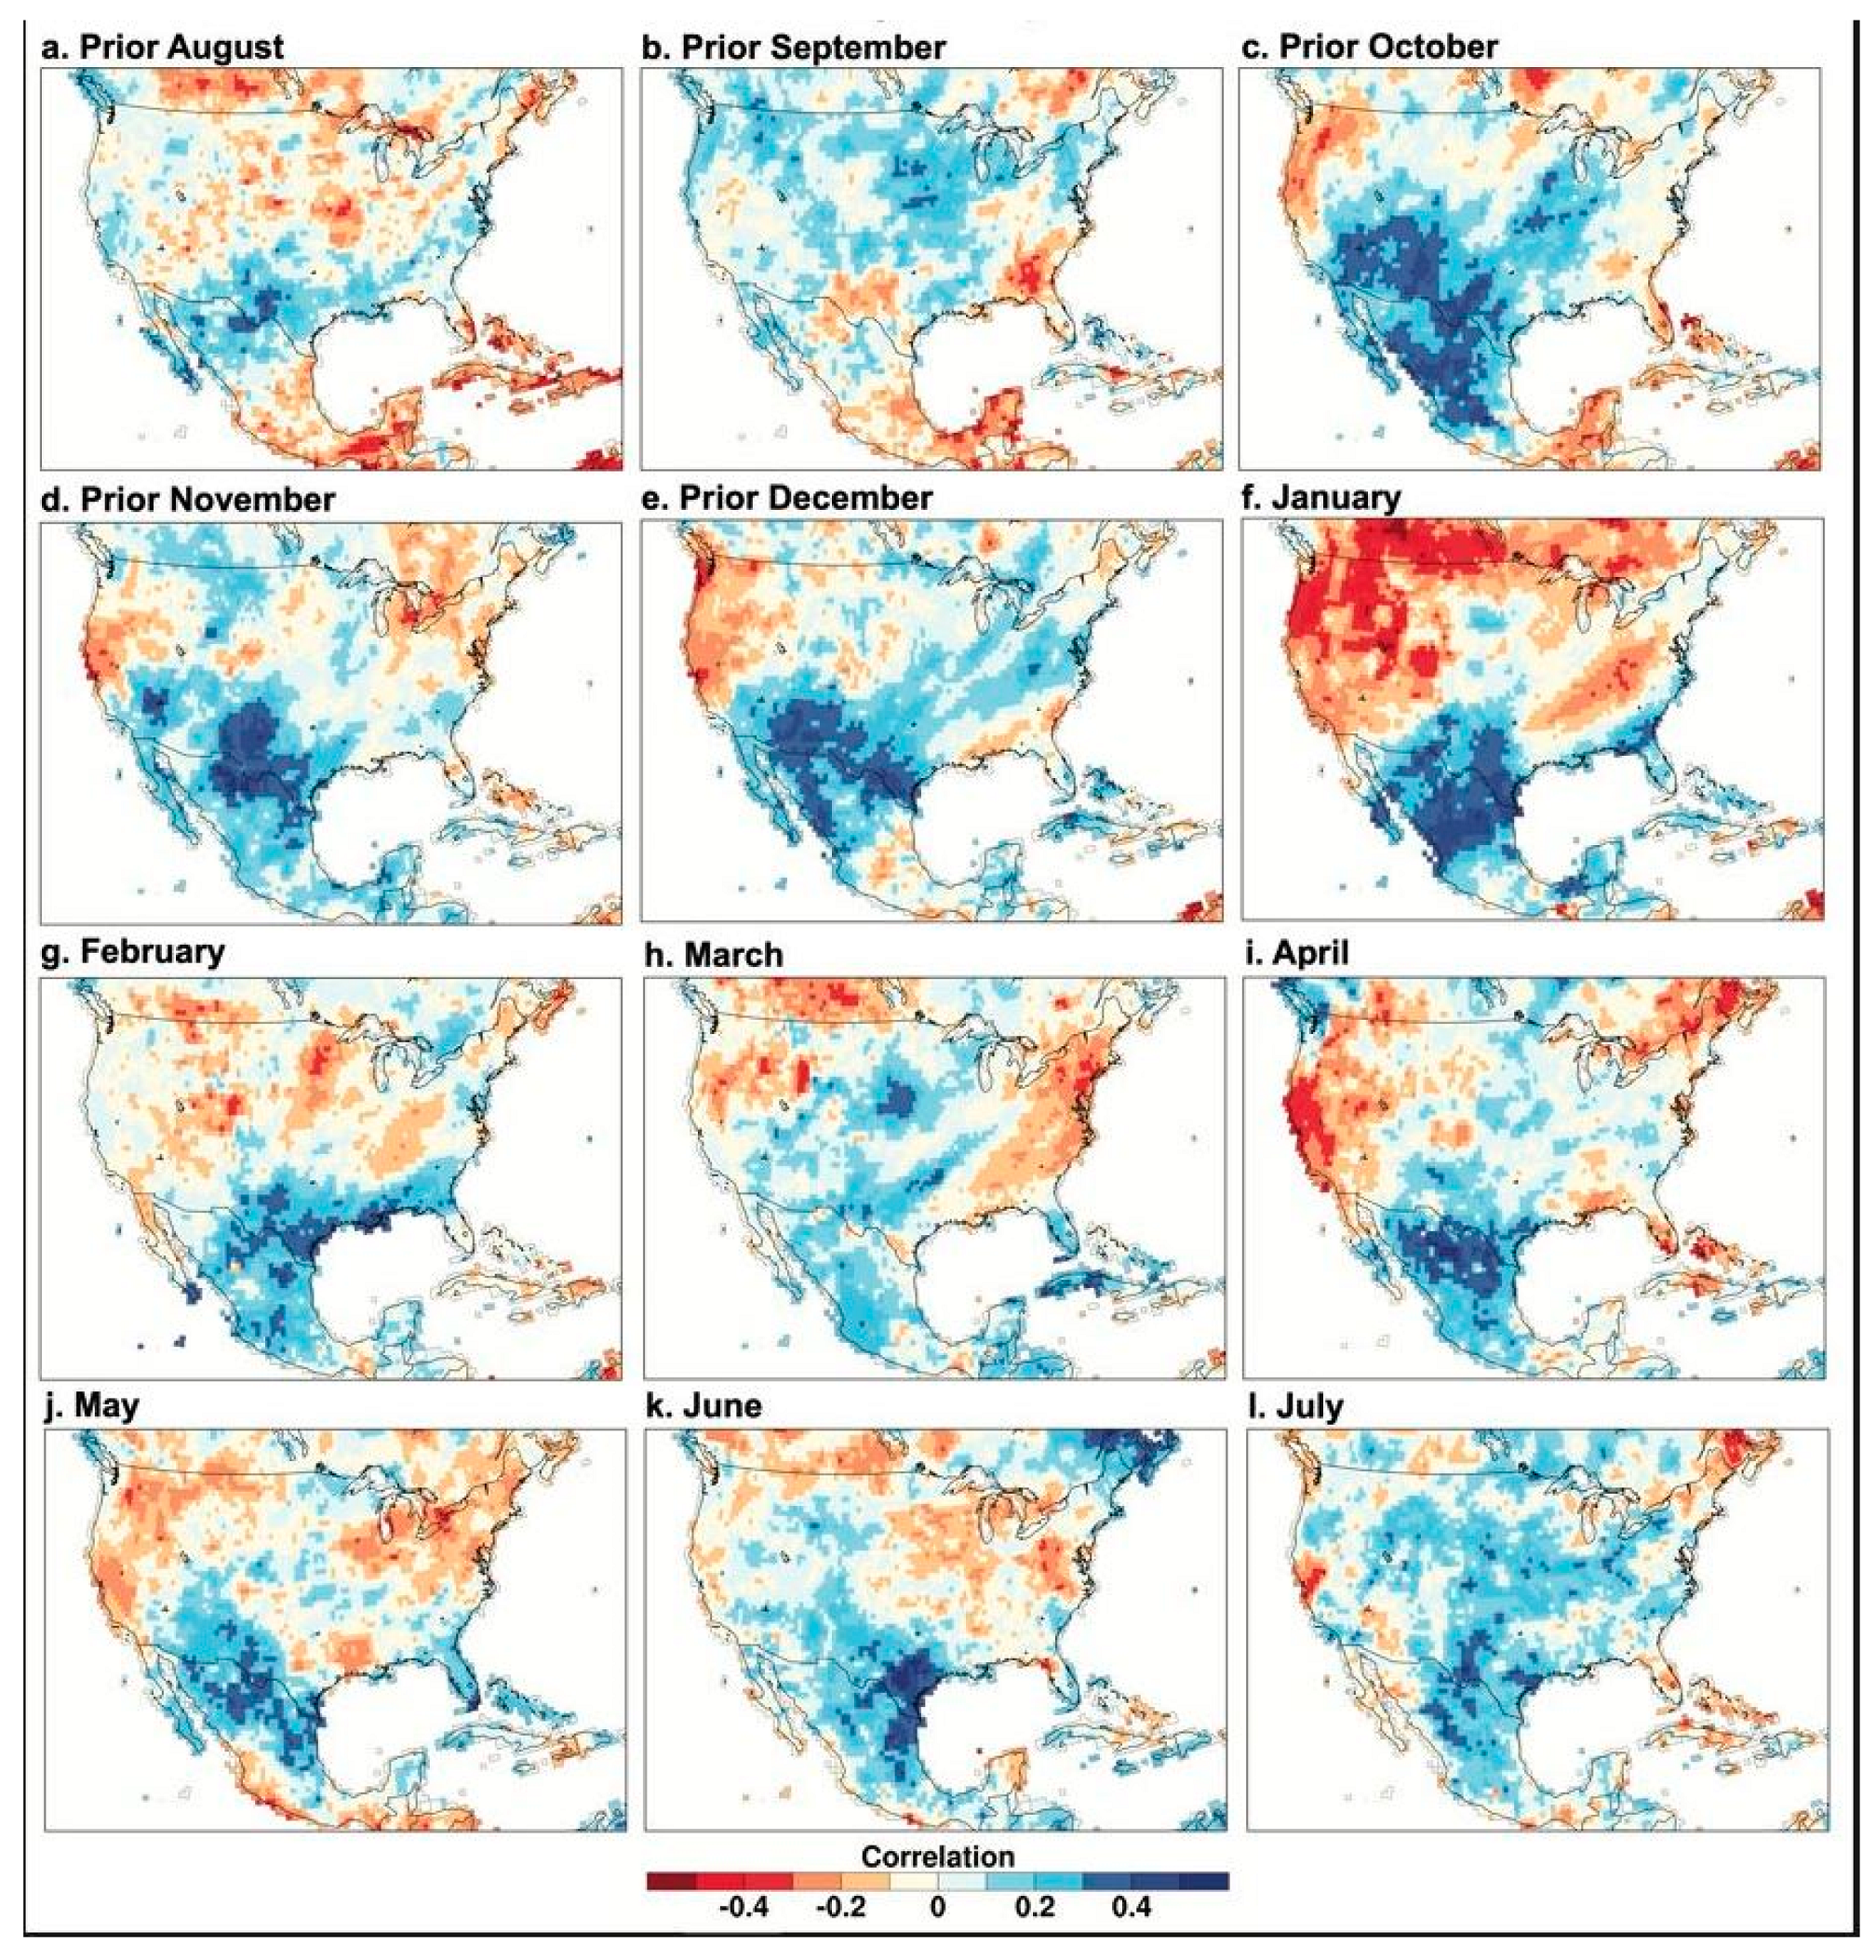
The time series scores for the first principal component of tree growth for the 12 chronologies were correlated with gridded monthly precipitation and temperature over North America from the previous August to the current August to map the intensity and spatial pattern of the climate signal in the borderland tree-ring chronologies (Figure 4 and Figure 5). Note the strong and widespread correlation between PC1 of conifer tree growth from the borderlands region and gridded precipitation over Texas and northern Mexico beginning in October of the year prior to growth and extending most strongly through January (Figure 4). Note also the dipole pattern of positive and negative precipitation correlations most vividly evident in January (also seen in correlations between instrumental precipitation totals; Dettinger et al. [30]). The positive precipitation correlation over the borderlands extends into the summer concurrent with tree growth, but it is much weaker, especially in March (Figure 4).

Figure 4.
PC1 of the Borderlands tree-ring chronologies correlated with monthly precipitation data, 1946–2000. The time series scores for the first principal component of tree growth for the 12 detrended and standardized ring-width chronologies are correlated with gridded monthly precipitation totals over North America. The precipitation data were obtained from the GPCC with a grid spacing of 0.5° [24], and the correlations were all based on the common period 1946–2000 when the tree ring and instrumental precipitation data are well replicated.
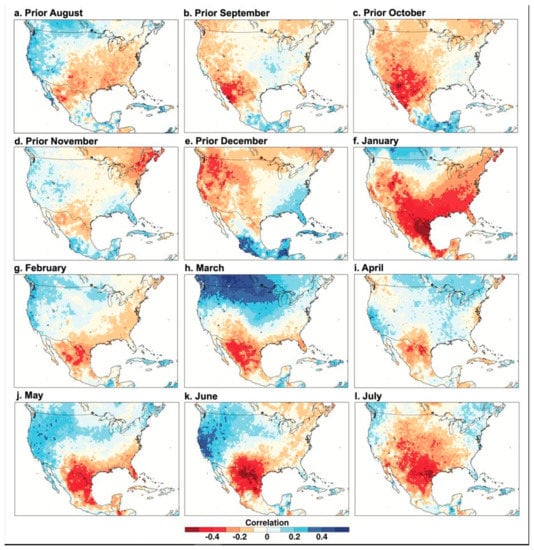
Figure 5.
PC1 of the Borderlands tree-ring chronologies correlated with monthly temperature data, 1946–2000. Same as Figure 3, except PC1 of tree growth is correlated with the 0.5 grid of monthly mean temperature from the University of Delaware [25].
The PC1 scores for the 12 chronologies are correlated with gridded monthly mean temperature in Figure 5. The tree growth correlation with monthly temperature is strong over northern Mexico and Texas in January, weakens substantially in February and April, and then is strongest in late spring and early summer (May–July). Note the very strong negative correlation between the PC1 scores and June temperature over the Rio Bravo region (Figure 5k). The correlation of the individual chronologies with June precipitation is quite weak for the study area centered over the Big Bend region (Figure 3, Table 5). However, the spatial correlations of the PC1 scores indicate that the region of highest correlations for June is shifted east of the study area to the lower Rio Bravo sector (Figure 4k), which is possibly related to the influx of moisture from the Gulf of Mexico early in the monsoon season.
The dipole pattern of correlation with temperature from the borderlands into the Pacific Northwest is strongest from March through June. The correlations between the PC1 chronologies with precipitation and temperature of the prior April, May, June, and July are weak or even slightly negative for the study area (results not shown). This suggests that any carryover effects of precipitation or temperature anomalies from the monsoon season of the year prior to growth tend to be small or inconsistent.
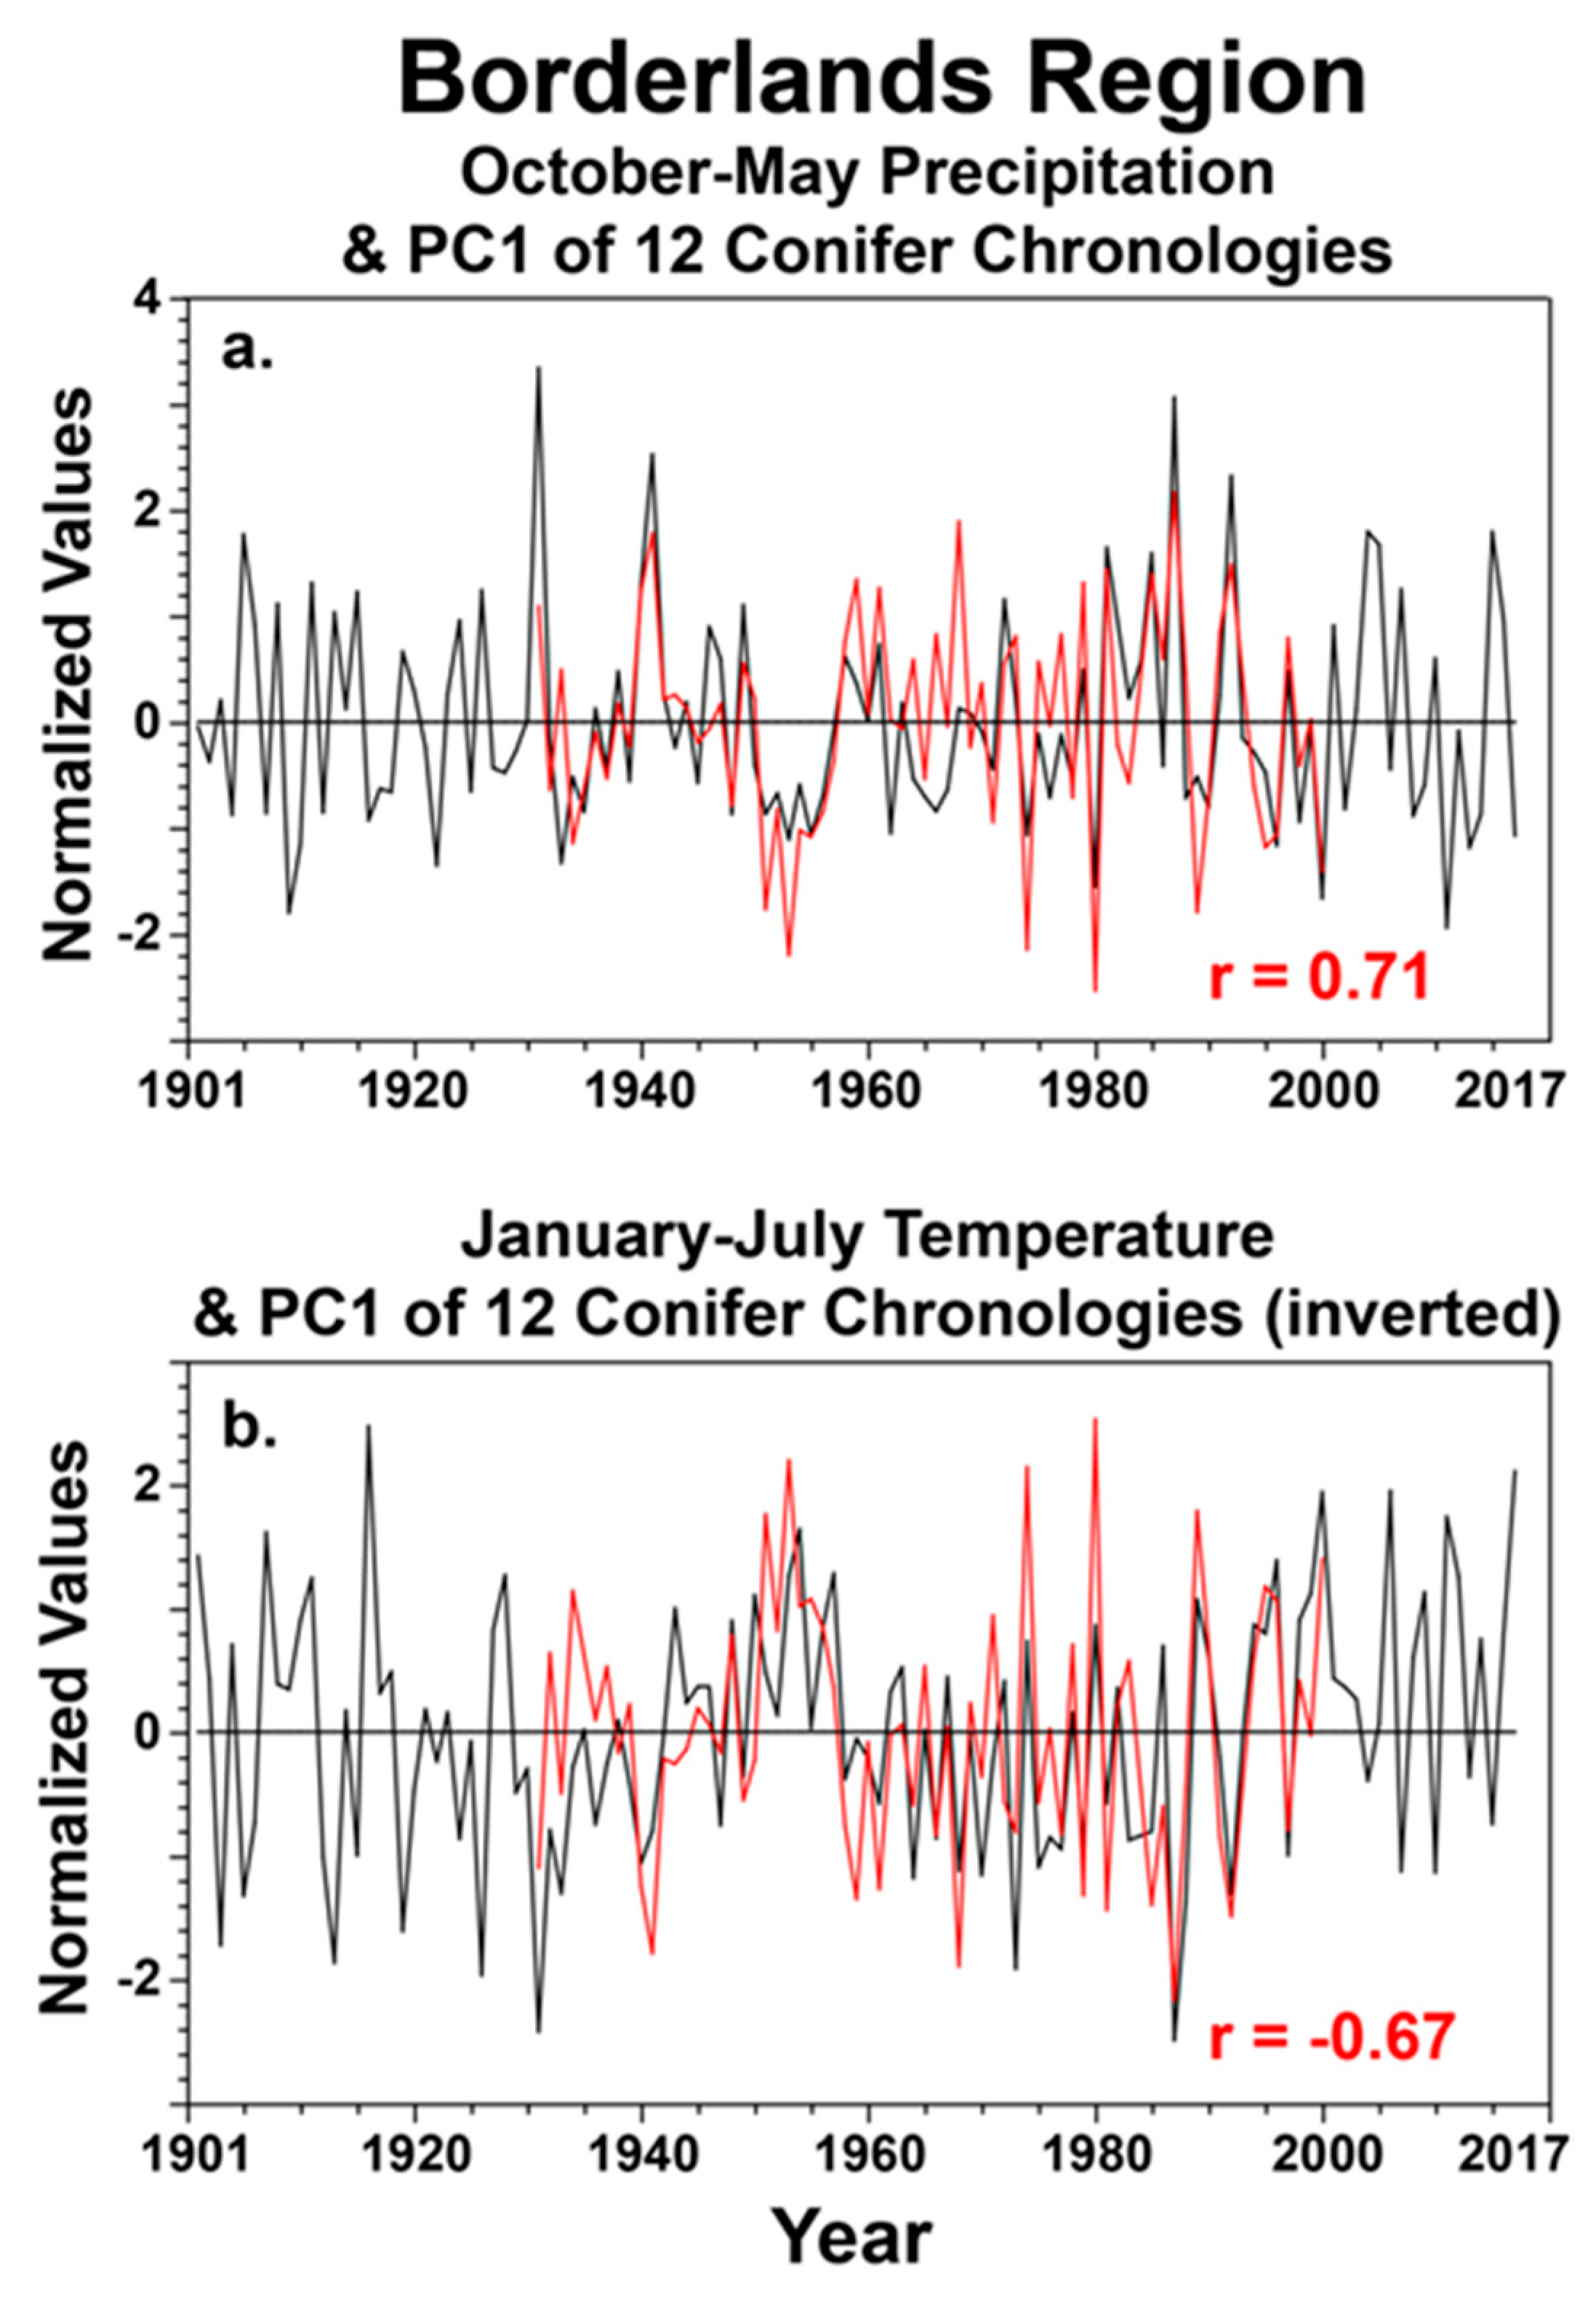
The instrumental precipitation and temperature data for the study area (28.5–30.5° N and 102–107° W) were totaled and averaged for the particular seasons that appear to be most important to conifer growth in the borderlands region (Figure 6) to gain some perspective on the potential for climate change to impact tree growth in these protected natural areas. The observed precipitation data are plotted for October–May and the temperature data are plotted for January–July for the full instrumental period of 1901–2017 (Figure 6). The PC1 scores are plotted along with the seasonal precipitation and temperature data for 1931–2000, when the tree ring data are reasonably well replicated (Figure 6). Note that the instrumental precipitation and temperature data for the study are negatively correlated at r = −0.54 for these two partially overlapping seasons (Figure 6).
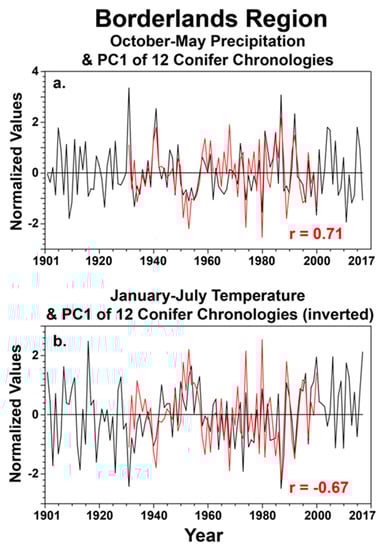
Figure 6.
The instrumental precipitation data were totaled monthly for each grid point and then averaged for the study area (28.5–30.5° N and 102–107° W) for 1901–2017. These regional precipitation data were then summed for the October–May cool season and correlated with the PC1 scores for the 12 conifer chronologies from the borderlands for the common period 1931–2000 ((a); PC1 in red). The correlation is r = 0.71 (p < 0.001). The monthly temperature data were also averaged for the study area and for the months of January–July (plotted for 1901–2017; (b)). The PC1 time series of tree growth was inverted and is plotted along with the regional temperature series. The correlation is r = −0.67 (p < 0.001), prior to inverting the PC1 time series. Regional precipitation for October–May has generally declined since the wet extremes in the 1980s and 1990s (a) while January–July temperatures have increased over the region (b). Some of the tree-ring chronologies unfortunately end in 2000, but the PC1 time series does follow the low-frequency changes in both seasonal precipitation and temperature over the borderlands region.
One implication of this strong association between the first principal component of tree growth and climate at the inter-annual and decadal scale is that conifer growth in the natural areas along the international frontier will suffer with the recurrence of severe drought episodes such as the 1930s, 1950s, 1980s, and 2010s (Figure 6a). However, the recent changes in January–July temperatures over the study area may be an even greater concern. In spite of large inter-annual variability, January to July mean temperatures have generally increased since the 1980s (Figure 6b) and will likely impact conifer growth if this seasonal warming continues.
4. Discussion
The development of tree-ring chronologies to analyze the climate variability of a basin or a larger region such as the borderland area of Texas, USA and Chihuahua and Coahuila, Mexico provides an excellent opportunity to understand the climatic response on conifer species growth and potential anthropogenic influence on climate variability. This advantage derives from the distribution of the chronologies in this large area and the involvement of conifer species with different ecological requirements that capture in greater detail the dominant climate variability and changes attributed to climate warming [31,32,33].
The natural protected areas BBNP, MDCPA, and CSEPA are part of the Chihuahuan desert and are dominated by particular environmental conditions that give place to special microclimates, hydrological behavior, and biodiversity [10,34]. However, overall, the climate on this extended region seems to be homogeneous due in part to the dominance of semiarid conditions and the common impact of ocean–atmospheric modes [9,24,35,36,37,38]. Climate warming, however, may put at risk the great biodiversity of this region, particularly when there is consensus about the potential impact of climate change on the stability of semiarid ecosystems present in the southwestern United States and the Chihuahuan desert due to the warm-season vapor pressure deficit largely controlled by temperature and cold-season precipitation [39,40].
The footprint of climate variability, however, is not similar in all semiarid or in more humid ecosystems around the world; recent research shows that temporal changes in drought conditions and physiological responses differ significantly among forest ecosystems, species composition (broadleaved, conifers), position along ecological gradients, and dominant climatic conditions [41,42,43]. It has also been confirmed that the annual growth of some conifer species is correlated with the meteorological variations, extent, and frequency of droughts around the world [44]; however, there is consensus that tree mortality is increasing due to drought and heat in forest ecosystems worldwide [5]. Previous studies have attributed an increase in fire frequency, reduction in forest productivity, increase in insect outbreaks, and change in species composition, among other negative impacts on the ecosystem, to the influence of climate change [12,39].
The four conifer species investigated represent a range of ecological conditions. Pinus cembroides thrives in semiarid climates (300 to 700 mm) with relatively high temperatures and evaporation rates, in soils nearly leveled or steep slopes with shallow soils on south and east-facing slopes [45]. On the other hand, Abies durangensis var. Coahuilenses and Pesudotusga menzieii are part of a mixed conifer forest in MDCPA found at higher elevations (over 2300 m) on north-facing slopes and humid canyons, whereas Pinus arizonica is part of a pine forest community growing at similar elevations but in drier sites [10]. Nevertheless, despite these ecological differences, they responded similarly to the dominant climatic conditions of the region, with significant positive response to the seasonal cool season of autumn and winter (October–May) precipitation and to temperature during the late spring and early summer seasons (January–July). In spite of these environmental gradients and phylogentic differences among Abies, Pinus, and Pseudotsuga, the climate response is quite similar in this region. These results may not differ from previous findings obtained with particular species present in similar ecological environments, but they are relevant from the climatic response perspective considering that the all the species involved in this study showed a common climate signal, where 56% of the variance was explained by the first principal component.
The impact of climate warming in semiarid ecosystems of the southwestern United States and northern Mexico may have important implications for future forest dynamics, plant cover, and environmental services they may provide [9,11,44,46,47].
The October–May accumulated seasonal precipitation to which the borderland chronologies responded has shown a significant decline since the wet extremes in the 1980s and 1990s, while January–July temperatures have increased over the region (Figure 5). If this temperature-raising trend continue to escalate, the vapor pressure deficit largely controlled by winter–early summer temperature and cold season precipitation will exacerbate forest drought stress, causing species mortality and triggering other negative impacts on semiarid ecosystems [7,13,39,48]. This negative impact has already been forecasted for the southwestern United forests where forest species dieback [5], insect outbreaks [49], increases in tree mortality [50], and fragmentation of ecosystems have been underway [51].
In the 20th century, the 1950s drought with a low October–May precipitation and high January–July temperature for eight consecutive years (1950–1957) affected extensive areas of the United Stated and most of the republic of Mexico [52]. This drought was one of the most severe in the last 500 years and could be considered a useful analog for the environmental consequences of higher temperatures and lower precipitation that are affecting forest ecosystems in semiarid regions such as the borderland area [39].
The 1950s drought in Mexico had serious socioeconomic impacts, i.e., failures in crop yields, lack of grains, famine, and livestock deaths, among others [53,54,55], but there is limited information on the impacts that this drought produced on the ecosystems. In the case of the United States, the 1950s drought in near three-fourths of the conterminous United States produced water shortages and streamflow reduction for different productive activities [56]. The years 1951, 1953, and 1956 had annual precipitation <225 mm, while the wet 1980s and 1990s had over 300 mm in the state of New Mexico with a similar effect for a great part of the semiarid regions [57].
Recent studies based on General Circulation Models (GCMs) project an increased risk for megadrought development over the southwest due to greenhouse gas forced reductions in precipitation and increased temperature and evaporative demand [58]. These predicted climate changes in the borderlands region are expected to aggravate harmful insect outbreaks [49], cause greater tree mortality [5], increase fire frequency and severity [47,48,49], change species composition [5], and lead to ecosystem fragmentation [44]. These projected changes threaten the stability of the conifer ecosystems in the protected natural areas of the borderlands region and the environmental services they provide [40].
As climate change continues to increase in the borderland area as projected by climate models, the mean forest drought stress by 2050 will exceed that of the most severe droughts on the last millennium [39]; thus, the species distribution, biodiversity, and dominant ecosystems present in this region will be altered. An understanding of the trends in these changes can allow protected area managers to implement more effective climate-adaptation strategies to conserve some of the most sensitive species to climate warming.
5. Conclusions
Four conifer species dominant in natural protected preserves of the borderland area with different habitat types responded similarly to the regional average total precipitation October–May and to the January–July average monthly temperature. Regional precipitation for October–May has generally declined since the wet extremes in the 1980s and 1990s, while January–July temperatures have increased over the region. The simple fact that these entire chronologies load positively at about the same magnitude on PC1 is telling us that they are very similar in their climatic response. This suggests that tree growth in the region is mainly driven by moisture, but the increased trend in temperature observed at the regional level may exacerbate the 1950s drought and put at risk the ecosystems of these borderland-protected areas. These results do not contradict climate response results previously reported for some of these species from the greater southwestern sector of North America, but they do have important implications for future forest dynamics, plant cover, and the environmental services they may provide.
Author Contributions
Conceptualization, J.V.-D., D.W.S. and A.R.M.-S.; Data curation, J.V.-D., H.M.P., J.C.-P. and D.H.-R.; Formal analysis, J.V.-D., D.W.S., I.H. and A.R.M.-S.; Funding acquisition, J.V.-D. and D.W.S.; Investigation, J.V.-D.; Methodology, D.W.S., J.V.-D., M.D.T., A.R.M.-S., I.H., D.H.-R. and J.E.-Á.; Project administration, J.V.-D.; Resources, J.V.-D. and D.W.S.; Software, A.R.M.-S. and I.H.; Supervision, J.V.-D. and D.W.S.; Writing—original draft, J.V.-D., D.W.S. and A.R.M.-S., Writing—review and editing, D.W.S., J.V.-D. and M.D.T. All authors have read and agreed to the published version of the manuscript.
Funding
The present study was funded by the Mexican Agency of Science and Technology (CONACYT), funding number CB-2016-01-283134, the U.S. National Science Foundation Award No. 2002374, and by the Joint Fire Sciences Program of the Department of the Interior Award No. 03-3-3-13.
Conflicts of Interest
The authors declare no conflict of interest.
References
- Ortega-Rubio, A.; Pinkus-Rendón, M.J.; Espitia-Moreno, I.C.; Las Áreas Naturales Protegidas y la Investigación Científica en México. Centro de Investigaciones Biológicas del Noroeste S.C., La Paz, B.C.S., Universidad Autónoma de Yucatán, Mérida, Yucatán y Universidad Michoacana de San Nicolás de Hidalgo, Morelia, Michoacán, México. 2015. Available online: https://cobi.org.mx/wp-content/uploads/2016/01/2015_LIBRO-Las-%C3%A1reas-naturales-protegidas-y-la-investigaci%C3%B3n-cient%C3%ADfica-en-M%C3%A9xico.pdf (accessed on 12 July 2020).
- Adams, V.M.; Setterfield, S.A.; Douglas, M.M.; Kennard, M.J.; Ferdinands, K. Measuring benefits of protected area management: Trends across realms and research gaps for freshwater systems. Phil. Trans. R. Soc. B 2015, 370, 20140274. [Google Scholar] [CrossRef] [PubMed] [Green Version]
- Seager, R.; Ting, M.; Davis, M.; Cane, M.; Nike, M.; Nakumara, J.; Lie, C.; Cook, E.; Stahle, D.W. Mexican drought: An observational modeling and tree ring study of variability and climate change. Atmosfera 2009, 22, 1–31. [Google Scholar]
- Magaña, V.; Zermeño, D.; Neri, C. Climate change scenarios and potential impacts on water availability in northern Mexico. Clim. Res. 2012, 51, 171–184. [Google Scholar] [CrossRef]
- Allen, C.A.; Macalady, A.; Bachelet, D.; McDowell, N.; Vennetier, M.; Kitzberger, T.; Rigling, A.; Breshears, D.; Hogg, E.H.; Gonzalez, O.; et al. A global overview of drought and heat-induced tree mortality reveals emerging climate change risks for forests. For. Ecol. Manag. 2010, 259, 660–684. [Google Scholar] [CrossRef] [Green Version]
- Adams, H.A.; Barron-Gafford, G.A.; Minor, R.L.; Gardea, A.A.; Bentley, L.P.; Dorin, L.; Breshears, D.D.; McDowell, N.G.; Huxman, T.C. Temperature response surfaces for mortality risks of tree species with future drought. Environ. Res. Lett. 2017, 12, 115014. [Google Scholar] [CrossRef]
- Truettner, C.; Anderegg, R.L.; Biondi, F.; Koch, G.W.; Ogle, K.; Schwalm, C.; Livtak, M.E.; Shaw, J.D.; Ziaco, E. Conifer radial growth response to recent seasonal warming and droughts from the Southwestern USA. For. Ecol. Manag. 2018, 48, 55–62. [Google Scholar] [CrossRef]
- Marshet, N.G.; Fekadu, H.H. Review on effect of climate change on forest ecoystems. Environ. Sci. Nat. Resour. 2019, 17, 555968. [Google Scholar] [CrossRef]
- IPCC. Climate Change 2021: The Physical Science Basis; Contribution of Working Group, 1 to the Sixth Assessment Report of the Intergovernmental Panel of Climate Change; Cambridge University Press: Cambridge, UK, 2021. [Google Scholar]
- Muldavin, E.H.; Harper, G.; Neville, P.; Wood, S. A vegetation classification of the Sierra del Carmen, U.S.A. and México. In Proceedings of the Sixth Symposium on the Natural Resources of the Chihuahuan Desert Region; Hoyt, C.A., Karges, J., Eds.; Chihuahuan Desert Research Institute: Fort Davis, TX, USA, 2014; pp. 117–150. Available online: http://cdri.org/publications/proceedings-of-the-symposium-on-the-naturalresources-of-the-chihuahuan-desert-region/ (accessed on 14 June 2020).
- Munson, S.M.; Raiser, M.H. Chihuahuan Desert Plant Responses to Climate Change; Chihuahuan Desert Network I&M Program: Big Ben National Park, TX, USA, 2013. Available online: https://www.nps.gov/articles/chihuahuan-desert-plant-responses-to-climate-change.htm (accessed on 13 June 2020).
- Williams, A.P.; Allen, C.D.; Millar, C.I.; Swetnam, T.W.; Michaelsen, J.; Still, C.J.; Leavitt, S.W. Forest responses to increasing aridity and warmth in the southwestern United States. Proc. Natl. Acad. Sci. USA 2010, 107, 21289–21294. [Google Scholar] [CrossRef] [Green Version]
- Marquardt, P.E.; Miranda, B.R.; Telewski, F.W. Shifts in climate-growth relationships of sky island pines. Forests 2019, 10, 1011. [Google Scholar] [CrossRef] [Green Version]
- Ferrusquia-Villafranca, I.; González-Guzman, L.I.; Cartron, J.E. Northern Mexico’s landscape, Part I: The physical setting and constraints on modeling biotic evolution. In Biodiversity, Ecosystems, and Conservation in Northern Mexico; Cartron, J.E., Ceballos, G., Felger, R.S., Eds.; Oxford University Press: New York, NY, USA, 2005. [Google Scholar]
- National Park Service, U.S. Department of the Interior. Foundation Document, Big Bend National Park, Texas. 2016. Available online: http://www.npshistory.com/publications/foundation-documents/bibe-fd-2016.pdf (accessed on 12 July 2020).
- Poulos, H.M.; Gatewood, R.G.; Camp, A.E. Fire-regimes of the pinyon-juniper woodlands of Big Bend national park, and the Davis Mountains West Texas, USA. Can. J. For. Res. 2009, 39, 1236–1246. [Google Scholar] [CrossRef]
- Instituto Nacional de Ecología. Programa de Manejo del Área de Protección de Flora y Fauna Cañón de Santa Elena México. México, D.F., 1997. Available online: https://simec.conanp.gob.mx/pdf_libro_pm/144_libro_pm.pdf (accessed on 20 July 2020).
- Stokes, M.A.; Smiley, T.L. An Introduction to Tree-Ring Dating; University of Chicago Press: Chicago, IL, USA, 1968. [Google Scholar]
- Holmes, R.L. Computer-assisted quality in tree-ring dating and measurement. Tree-Ring Bull. 1983, 43, 69–78. Available online: https://repository.arizona.edu/handle/10150/261223 (accessed on 3 June 2020).
- Grissino-Mayer, H.D. Evaluating crossdating accuracy: A manual and tutorial for the computer program COFECHA. Tree-Ring Res. 2001, 57, 205–221. [Google Scholar]
- Melvin, T.M.; Briffa, K.R. A “signal-free” approach to dendroclimatic standardization. Dendrochronologia 2008, 26, 71–86. [Google Scholar] [CrossRef]
- Cook, E.R.; Krusic, P.J.; Melvin, T.; Program RCSigFree. Tree-Ring Laboratory, Lamont Doherty Earth Observatory of Columbia University. 2014. Available online: https://www.ldeo.columbia.edu/tree-ring-laboratory/resources/software (accessed on 15 May 2020).
- Meko, D.; Cook, E.R.; Stahle, D.W.; Stockton, C.W.; Hughes, M.K. Spatial patterns of tree-growth anomalies in the United States and Southeastern Canada. J. Clim. 1993, 6, 1773–1786. [Google Scholar] [CrossRef] [Green Version]
- Stahle, D.W.; Cook, E.R.; Burnette, D.J.; Torbenson, M.C.; Howard, I.M.; Griffin, D.; Villanueva-Diaz, J.; Cook, B.I.; Willimas, A.P.; Watson, E.; et al. Dynamics, Variability, and Change in Seasonal Precipitation Reconstructions for North America. J. Clim. 2020, 33, 3173–3194. [Google Scholar] [CrossRef]
- Becker, A.; Finger, P.; Meyer-Christoffer, A.; Rudolf, B.; Schamm, K.; Schneider, U.; Ziese, M. A description of the global land-surface precipitation data products of the Global Precipitation Climatology Centre with sample applications including centennial (trend) analysis from 1901–present. Earth Syst. Sci. Data 2013, 5, 71–99. [Google Scholar] [CrossRef] [Green Version]
- Schneider, U.; Becker, A.; Finger, P.; Meyer-Christoffer, A.; Ziese, M. GPCC Full Data Monthly Product Version 2018 at 0.5°: Monthly Land-Surface Precipitation from Rain-Gauges built on GTS-based and Historical Data. Glob. Precip. Climatol. Cent. 2018. [Google Scholar] [CrossRef]
- Willmott, C.J.; Matsuura, K. Terrestrial Air Temperature and Precipitation: Monthly and Annual Time Series (1950–1999); Version 1.02; Center for Climatic Research, Department of Geography, University of Delaware: Newark, DE, USA, 2001. [Google Scholar]
- Woodhouse, C.; Lukas, J. Drought, tree rings and water resource management in Colorado. Can. Water Resour. J. 2006, 31, 297–310. Available online: https://www.tandfonline.com/doi/pdf/10.4296/cwrj3104297 (accessed on 20 July 2020). [CrossRef]
- Constante, V.; Villanueva, J.; Cerano, J.; Cornejo, E.; Valencia, S. Dendrocronología de Pinus cembroides Zucc. y reconstrucción de precipitación estacional para el sureste de Coahuila. Rev. Cienc. For. Méx. 2009, 34, 17–39. Available online: http://cienciasforestales.inifap.gob.mx/editorial/index.php/forestales/article/view/685 (accessed on 15 June 2020).
- Dettinger, M.D.; Cayan, D.R.; Diaz, H.F.; Meko, D.M. North-South precipitation patterns in Western North America on interannual-to-decadal timescales. J. Clim. 1998, 11, 3095–3111. [Google Scholar] [CrossRef]
- Pederson, N.; Bell, A.R.; Knight, K.N.; Leland, C.; Malcomb, N.; Anchukaitis, K.J.; Tackett, K.; Scheff, J.; Brice, A.; Carton, B.; et al. A long-term perspective on a modern drought in the American Southeast. Environ. Res. Lett. 2012, 7, 014034. [Google Scholar] [CrossRef]
- Wilder, M.; Garfin, G.; Ganster, P.; Eakin, H.; Romero-Lankao, P.; Lara-Valencia, F.; Cortez-Lara, A.A.; Mumme, S.; Neri, C.; Muñoz-Arriola, F. Climate Change and U.S.-Mexico Border Communities. In Assessment of Climate Change in the Southwest United States: A Report Prepared for the National Climate Assessment; Island Press: Washington, DC, USA, 2013. [Google Scholar]
- Maxwell, J.T.; Grant, G.L.; Matheusa, Y.J. Dendroclimatic reconstructions from multiple co-occurring species: A case study from an old growth deciduous forest in Indiana, USA. Int. J. Climatol. 2015, 35, 860–870. [Google Scholar] [CrossRef]
- Poulos, H.M.; Camp, A.E. Vegetation-Environmental Relations of the Chisos Mountains, Big Bend National Park, Texas. USDA Forest Service Proceedings RMRS-P-36. 2005. Available online: https://www.fs.fed.us/rm/pubs/rmrs_p036/rmrs_p036_539_544.pdf (accessed on 10 January 2022).
- Cook, E.R.; Seager, R.; Heim, R.; Vose, R.S.; Herweijer, C.; Woodhouse, C. Megadroughts in North America: Placing IPCC projections of hydroclimatic change in a long-term palaeoclimate context. J. Quat. Sci. 2010, 25, 48–61. [Google Scholar] [CrossRef] [Green Version]
- Mendez, M.; Magaña, V. Regional aspects of meteorological droughts over Mexico and Central America. J. Clim. 2010, 23, 1175–1188. [Google Scholar] [CrossRef] [Green Version]
- Hughes, M.K. Dendroclimatology in High-Resolution Paleoclimatology. In Dendroclimatology; Developments in Paleoenvironmental Research; Hughes, M., Swetnam, T., Diaz, H., Eds.; Springer: Dordrecht, The Netherlands, 2011; Volume 11. [Google Scholar] [CrossRef]
- Torbenson, M.C.; Stahle, D.W.; Howard, I.M.; Burnette, D.J.; Villanueva-Diaz, J.; Cook, E.R.; Griffin, D. Multidecadal modulation of the ENSO teleconnection to precipitation and tree growth over subtropical North America. Paleoceanogr. Paleoclimatol. 2019, 34, 886–900. [Google Scholar] [CrossRef]
- Williams, A.P.; Allen, C.D.; Macalady, A.K.; Griffin, D.; Woodhouse, C.; Meko, D.M.; Swetnam, T.W.; Rausscher, S.A.; Seager, R.; Grissino-Mayer, H.D.; et al. Temperature as a potential driver of regional forest drought stress and tree mortality. Nat. Clim. Change 2013, 3, 292–297. [Google Scholar] [CrossRef]
- Thorne, J.H.; Choe, H.; Stine, P.A.; Chambers, J.C.; Holguin, A.; Kerr, A.C.; Schwartz, M.W. Climate change vulnerability assessment of forests in the Southwest USA. Clim. Change 2018, 148, 387–402. [Google Scholar] [CrossRef] [Green Version]
- Stefanidis, S.; Alexandridis, V. Precipitation and potential evapotranspiration temporal variability and their relationship in two forest ecosystems in Greece. Hydrology 2021, 8, 160. [Google Scholar] [CrossRef]
- Brand, R.; Srur, A.M.; Villalba, R. Contrasting growth trends in Nothofagus pumilio upper-elevation forests induced by climate warming in the Southern Andes. Agric. For. Meteorol. 2022, 323, 109083. [Google Scholar] [CrossRef]
- Proutsos, N.; Tigkas, D. Growth response of endemic black pine trees to meteorological variations and drought episodes in a mediterranean region. Atmosphere 2020, 11, 554. [Google Scholar] [CrossRef]
- Archer, S.R.; Predick, K.I. Climate change and ecosystems of the Southwestern United States. Rangelands 2008, 30, 23–28. [Google Scholar] [CrossRef] [Green Version]
- Pavek, D.S. Pinus cembroides. Fire Effects Information System ; U.S. Department of Agriculture, Forest Service, Rocky Mountain Research Station, Fire Sciences Laboratory (Producer), 1994. Available online: https://www.fs.fed.us/database/feis/plants/tree/pincem/all.html (accessed on 28 February 2021).
- CONANP. Programa de Manejo Área de Protección de Flora y Fauna Maderas del Carmen. Secretaría de Medio Ambiente y Recursos Naturales. México, D.F., 2013; p. 151. Available online: https://simec.conanp.gob.mx/pdf_libro_pm/158_libro_pm.pdf (accessed on 15 July 2020).
- Garfin, G.; Jardine, A.; Merideth, R.; Black, M.; LeRoy, S. Assessment of Climate Change in the Southwest United States: A Report Prepared for the National Climate Assessment; A Report by the Southwest Climate Alliance; Island Press: Washington, DC, USA, 2013. [Google Scholar]
- Kolb, T.E. A new drought tipping point for conifer mortality. Environ. Res. Lett. 2018, 10, 0311002. [Google Scholar] [CrossRef]
- Waring, K.M.; Reboletti, D.M.; Mork, L.A.; Huang, E.H.; Hofstetter, R.W.; Garcia, A.M.; Fulé, P.Z.; Davis, T.S. Modeling the impacts of two bark beetle species under a warming climate in the Southwestern USA: Ecological and economic consequences. Environ. Manag. 2009, 44, 824–835. [Google Scholar] [CrossRef] [PubMed]
- McDowell, N.; Allen, C.D. Darcy’s law predicts widespread forest mortality under climate warming. Nat. Clim. Change 2015, 5, 669–672. [Google Scholar] [CrossRef]
- Langdon, G.R.; Lawler, J.J. Assessing the impacts of projected climate change on biodiversity in the protected areas of western North America. Ecosphere 2015, 6, 87. [Google Scholar] [CrossRef]
- Stahle, D.W.; Cook, E.R.; Villanueva-Diaz, J.; Fye, F.K.; Burnett, D.J.; Griffin, R.D.; Acuña-Soto, R.; Seager, R.; Heim, R.R., Jr. Early 21st-century drought in Mexico. Eos 2009, 90, 89–90. [Google Scholar] [CrossRef]
- Florescano, E.; Swan, S.; Menegus, M.; Galindo, I. Breve Historia de la Sequía en Mexico; Universidad Veracruzana: Veracruz, Mexico, 1995. [Google Scholar]
- Liverman, D.M. Vulnerability and adaptation to drought in Mexico. Nat. Resour. J. 1999, 39, 99. Available online: https://digitalrepository.unm.edu/nrj/vol39/iss1/7 (accessed on 15 December 2021).
- Endfield, G.H.; Fernández-Tejedo, I. Decades of drought years of hunger: Archival investigations of multiple year droughts in late colonial Chihuahua. Clim. Change 2006, 75, 391–419. [Google Scholar] [CrossRef]
- Nace, R.L.; Pluhowski, E.J. Drought of the 1950’s with Special Reference to the Midcontinent; Geological Survey Wayer Supply Paper 1804; United States Government Printing Office: Washington. DC, USA, 1965. Available online: https://pubs.usgs.gov/wsp/1804/report.pdf (accessed on 15 December 2021).
- Gutzler, D.S. Drought in New Mexico: History, Causes, and Future Prospects. 2003. Available online: https://digitalrepository.unm.edu/eps-fsp/3 (accessed on 12 January 2022).
- Cook, B.I.; Cook, E.R.; Smerdon, J.E.; Seager, R.; Parks, W.A.; Coats, S.; Stahle, D.W.; Villanueva-Diaz, J. North American megadroughts in the Common Era: Reconstructions and simulations. Wiley Interdiscip. Rev. Clim. Change 2016, 7, 411–432. [Google Scholar] [CrossRef] [Green Version]


Publisher’s Note: MDPI stays neutral with regard to jurisdictional claims in published maps and institutional affiliations. |
© 2022 by the authors. Licensee MDPI, Basel, Switzerland. This article is an open access article distributed under the terms and conditions of the Creative Commons Attribution (CC BY) license (https://creativecommons.org/licenses/by/4.0/).