Article

High-Resolution Ammonia Emissions from Nitrogen Fertilizer Application in China during 2005–2020

1
Sichuan Academy of Environmental Policy and Planning, Chengdu 610041, China
2
Laboratory for Climate and Ocean-Atmosphere Studies, Department of Atmospheric and Oceanic Sciences, School of Physics, Peking University, Beijing 100871, China
3
College of Oceanic and Atmospheric Sciences, Ocean University of China, Qingdao 266100, China
4
Shanghai Central Meteorological Observatory, Shanghai Meteorological Bureau, Shanghai 200030, China
5
State Key Laboratory of Atmospheric Boundary Layer Physics and Atmospheric Chemistry (LAPC), Institute of Atmospheric Physics (IAP), Chinese Academy of Sciences, Beijing 100029, China
6
Satellite Observation Department, Royal Netherlands Meteorological Institute (KNMI), 3731 GA De Bilt, The Netherlands
7
Princeton School of Public and International Affairs, Princeton University, Princeton, NJ 08540, USA
*
Authors to whom correspondence should be addressed.
Atmosphere 2022, 13(8), 1297; https://doi.org/10.3390/atmos13081297
Submission received: 7 July 2022 / Revised: 4 August 2022 / Accepted: 10 August 2022 / Published: 15 August 2022
(This article belongs to the Special Issue Sources and Sinks of Atmospheric Pollutants and Greenhouse Gases)

Abstract

:
The accurate estimation of ammonia emission is essential for quantifying secondary inorganic aerosol formation and reactive nitrogen deposition. During the last decades, both fertilizer type and the total amount of nitrogen fertilizer in China have changed, while the resulting changes in ammonia emissions and their spatio-temporal variations are unclear. In this study, we compile a long-term (2005–2020) high-resolution ammonia emission inventory for synthetic fertilizer in China with bottom-up method. We parameterized emissions factors (EFs) considering the impacts of soil properties, method of fertilizer application, fertilizer type, crop type, ambient temperature and wind speed. Meanwhile, the monthly nitrogen fertilizer application is calculated by detailed information on crop-specific fertilizer application practices. For the spatial distribution, the ammonia emissions from fertilizer mostly concentrate in eastern and southwestern China, coincident with the high density of agriculture activity and population in these regions. For the seasonal variation, the ammonia emissions from fertilizer application peak in spring and summer because of dense fertilizer application and high ambient temperature. For the long-term trend, we estimate that the emissions from synthetic fertilizer increased from 5.38 Tg in 2005 to 5.53 Tg in 2008 and remained nearly unchanged during 2008–2012, then decreased to 3.96 Tg in 2020. Urea, ammonium bicarbonate (ABC) and nitrogenous compound fertilizer are major fertilizer types used in China. Despite the increased use of nitrogen fertilizer, ammonia emissions remained stable throughout 2008–2012 with the declined use of ABC. This stable period also reflects ammonia emission increases in western China, offsetting the decreases in eastern China. Furthermore, our emission inventory provides a monthly estimation at a spatial resolution of 0.1 degrees, which can be applied to global and regional atmospheric chemistry model simulations.

1. Introduction

Ammonia (NH3) is the most abundant alkaline gas in the atmosphere and has an irritating smell [1]. Over 85% of NH3 is emitted from agriculture activities [2,3,4], including synthetic nitrogen fertilizer application and livestock waste management. NH3 emitted from the soil after nitrogen fertilizer application contributed 40% of NH3 concentration at the altitude of 320 m in urban Beijing [5]. The chemistry industry, residential, human waste and traffic are other important anthropogenic sources of NH3 [6,7]. NH3 also has natural sources, such as natural soil [8]. NH3 in the atmosphere would react with acid components (nitric acid and sulfate acid) both in the gas phase and aerosol phase to form sulfate ammonium ((NH4)2SO4) [9] and nitrate ammonium (NH4NO3) [10,11], which accounts for 20–42% of PM2.5 (PM2.5 is a kind of microscopic solid or liquid matter in the atmosphere, which has an aerodynamic diameter of less than 2.5 μm and is also referred to as fine particles [12]) in China [13,14]. Severe fine particle pollution increases the hospital visits and hospital admissions in Beijing [15] and causes thousands of premature deaths in the US [16] by increasing the risk of suffering respiratory diseases, blood diseases and even cardiovascular diseases. Particulate matter also plays an important role in the climate by altering radiative transport in the atmosphere as well as changing the physical properties of clouds [10]. Moreover, these nitrogen particles are deposited on earth in both terrestrial and aquatic ecosystems, and too much nitrogen will deteriorate ecosystems through, e.g., soil acidification, water eutrophication, decreasing the diversity of ecosystems [17,18] and even increasing NO and N2O emissions [19,20].
China is one of the global hotspots of ambient NH3 concentrations from the satellite observations of IASI [21,22,23] and AIRS [24]. Because China needs high-density agricultural activities to support its large population. According to the World Bank Group, the Chinese population reached 1.411 billion in 2020 [25]. China consumes over 25% of the global total of nitrogen fertilizer [26]. In addition, an increasing trend of NH3 concentration in China has been discovered over the past decades [27,28]. Reducing ammonia emissions is an effective way to mitigate PM2.5 pollution [29,30]. Backes et al. [31] reported that decreasing 50% NH3 emissions can remove 24% of total PM2.5 in northwest Europe. Quantifying the reducing rate of NH3 emissions to mitigate PM2.5 pollution efficiently in China relies on the accuracy of NH3 emissions inventory. However, total NH3 emissions in China estimated by different inventories vary by greater than a factor of two [4]. In research by Yan et al. [32], ammonia emissions over China in 1995 was 7.01 Tg, while 18.3 Tg was estimated by Zhao et al. [33] for 2010. The uncertainty of NH3 emissions in China exists in both total amount and spatio-temporal distributions [4]. Most NH3 is emitted from the North China Plain, which is one of the major agricultural regions in China [2,3,4]. Emission Database for Global Atmospheric Research [34] (EDGAR) has a more even distribution of NH3 emissions than other estimates, such as the Regional Emissions in ASia (REAS v2) inventory [35] as well as inventories developed by Huang et al. [3] and Streets et al. [36] NH3 emissions usually peak in summer due to the high fertilizer application rate and the highest temperature throughout the year [2,3,4]. However, the seasonal pattern of NH3 emissions shows large varieties among inventories. For example, the NH3 emissions in EDGAR and REAS v2 [35] don’t show the annual cycle, while the NH3 emissions in Huang et al. [3] peak in summer. The MASAGE_NH3 [2] inventory peaks in April and July because fertilizer applications are assumed at three periods (at planting, at growth and after harvest) during crops’ growth.
It is essential to have a better understanding of NH3 emissions in recent decades in China to evaluate the associated environmental effects and their changes in China. The Chinese government proposed NH3 emission reduction in the Three-Year Action Plan in 2018 without a strictly binding target [37]. In 2021 the Chinese authorities issued a circular on further promoting the nationwide battle to prevent and control pollution and required a 5% NH3 emissions reduction from the large-scale farm by 2025 compared to 2020 levels in Beijing–Tianjin–Hebei and surrounding regions [38]. In recent years, some studies have tried to investigate the NH3 emissions in China. Kang et al. [39] estimated the NH3 emissions in China during 1980–2012 using the bottom-up method. Adalibieke et al. [40] employed a data-driven model to estimate NH3 emissions from cropland in China from 1980 to 2017 at a 1 km resolution. In a previous study, we developed an NH3 emission inventory for 2008 in China by combing the bottom-up and top-down methods [4] and then extended it to the period of 2005–2016 [41]. However, the trend of NH3 emissions from nitrogen fertilizer varies widely among existing research [3,39,42,43,44,45,46,47,48,49]. In this work, further study will focus on the bottom-up method and updated datasets are adopted. We estimate NH3 emissions from synthetic nitrogen fertilizer during 2005–2020 over China by considering the changes in (1) farmland area; (2) fertilizer types and (3) meteorology conditions. The NH3 emission inventory is built on a fine spatial resolution of 0.1° latitude by 0.1° longitude. Future studies that focus on atmospheric nitrogen deposition and PM2.5 pollution on a regional and national scale in China with atmospheric chemistry models will benefit from this long-term and high spatial resolution NH3 emission inventory.

2. Materials and Methods

In this study, we adopt the bottom-up method, which estimates the ammonia emissions (E) with activity data (A: nitrogen fertilizer application rate) and corresponding emission factors (EF: NH3 emissions from per-unit activity) through Equation (1) [4]. We estimate the spatial pattern of fertilizer application in each month based on the cropland area, fertilizer application time and rate for 18 crops and fruits (including early/late rice, spring/winter wheat, spring/summer maize, cotton, potato, sweet potato, rapeseed, soybean, groundnut, apple, banana, citrus, pear and grape) and 3 remaining groups (vegetables, other crops and other fruits) [4]. Generally, the fertilizer is applied to cropland by broadcast and injection. The emission factor of broadcast is larger than injection because of the larger area exposed to air. Therefore, the fertilizer application for basal dressing (at planting, typically through injection) and top dressing (at growth, typically through broadcast) are calculated separately. We classify the synthetic nitrogen fertilizers used in China as urea, ammonium bicarbonate (ABC), ammonium sulfate (AS), ammonium nitrate (AN), ammonium phosphates, NK (nitrogen + potassium), other NP (nitrogen + phosphorus) + NPK (nitrogen + phosphorus + potassium) and other nitrogen fertilizer, according to their differences in emissions factors [50].
E = A × E F
The fertilizer application amount is estimated by the crop area multiplied by fertilizer application rate. The basic crop harvest area on a 5’ latitude by 5’ longitude resolution for each crop is from EarthStat [51,52]. With rapid urbanization, the crop planting area in China has dramatically changed during the past decades. Cropland changes in this study are derived from Moderate Resolution Imaging Spectroradiometer (MODIS) during 2005–2020 [53] at 0.05 latitude by 0.05° longitude resolution. With gridded crop-planting dates [54] and fertilizer application rate and time for each crop [4], we calculate the fertilizer applications in China and further constrain the provincial totals with the latest data from China Rural Statistical Yearbook during 2005–2020 [55].
E F = e f p H + f C E C + f t y p e + f c r o p + f m o d e   × α
α = e 0.0223 T i + 0.0419 W i 1 12 i = 1 12 e 0.0223 T i + 0.0419 W i
The emission factors of fertilizer use are estimated through Equation (2) [4,50], where the factors (f) are determined by soil properties (pH and CEC), fertilizer type, crop type and fertilizer application mode (broadcast and injection), and a monthly scalar based on meteorology conditions (α) [4,56,57]. We account for the seasonality of emission factors by applying 2 m air temperature (Ti) in °C and 10 m wind speed (Wi) in m/s for month i through equation (3) [4]. We use updated soil pH and CEC from Soilgrids at a spatial resolution of 250 m [58,59]. As introduced by our previous paper, fertilizer types have been changed from low nitrogen efficient fertilizer—ABC to higher efficient fertilizer—compound fertilizer [41]. For fertilizer types changes, we use the fertilizer application amount of 8 fertilizer types in China from International Fertilizer Association (IFA) [26]. Temperature and wind speed data are extracted from ERA5 (the fifth generation of the European Center for Medium-Range Weather Forecasts atmospheric reanalysis of the global climate), which provides monthly averaged data at 0.1° latitude by 0.1° longitude resolution [60]. All datasets (Table S1) are interpolated to resolution at 0.1° by 0.1° to estimate the NH3 emissions from nitrogen fertilizer in China during 2005–2020.

3. Results and Discussion

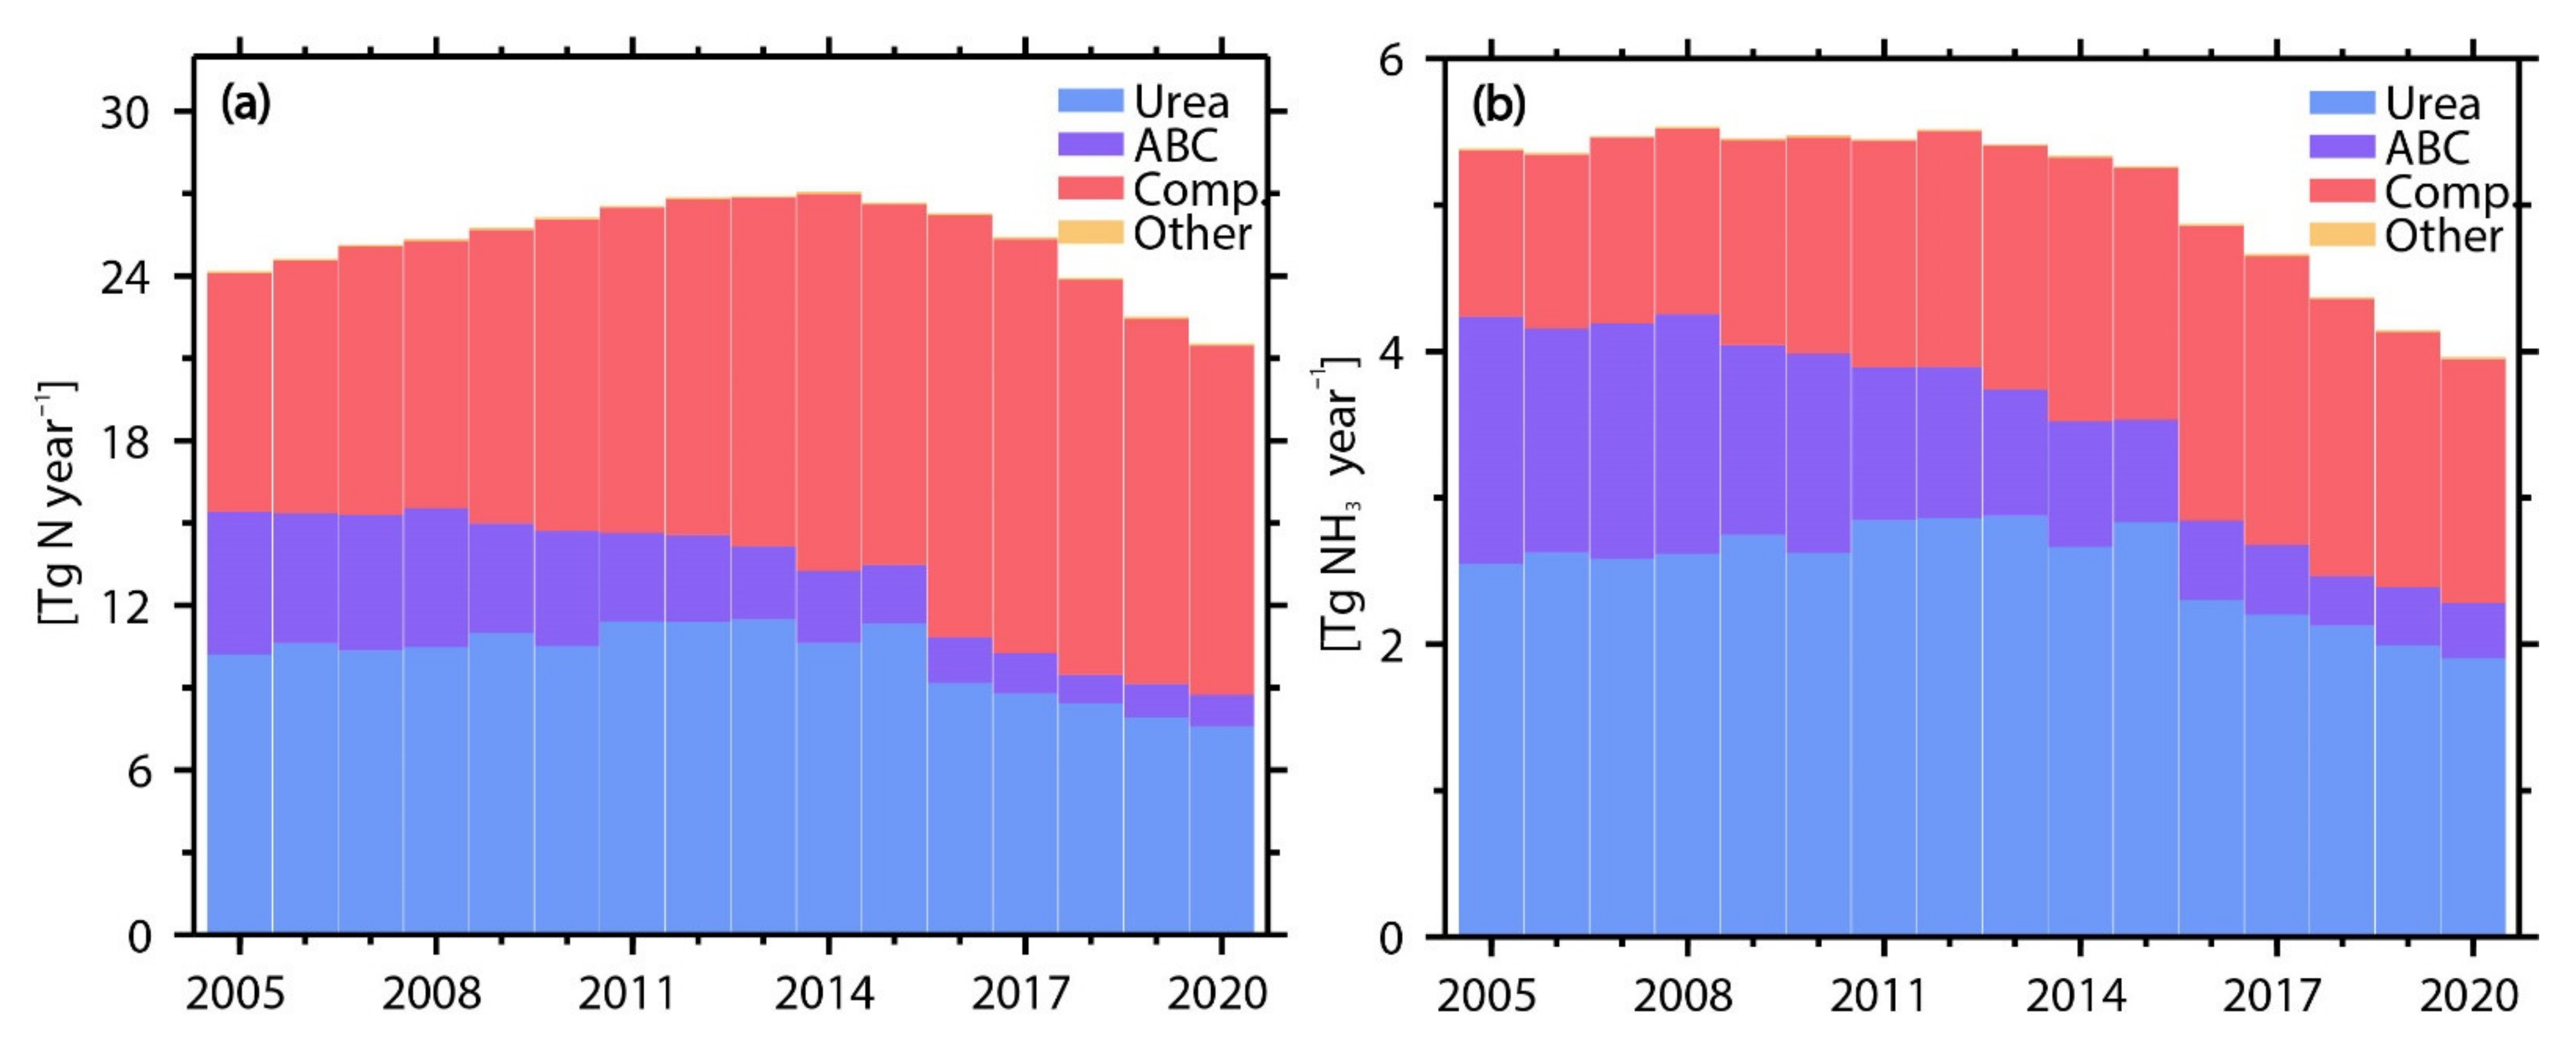
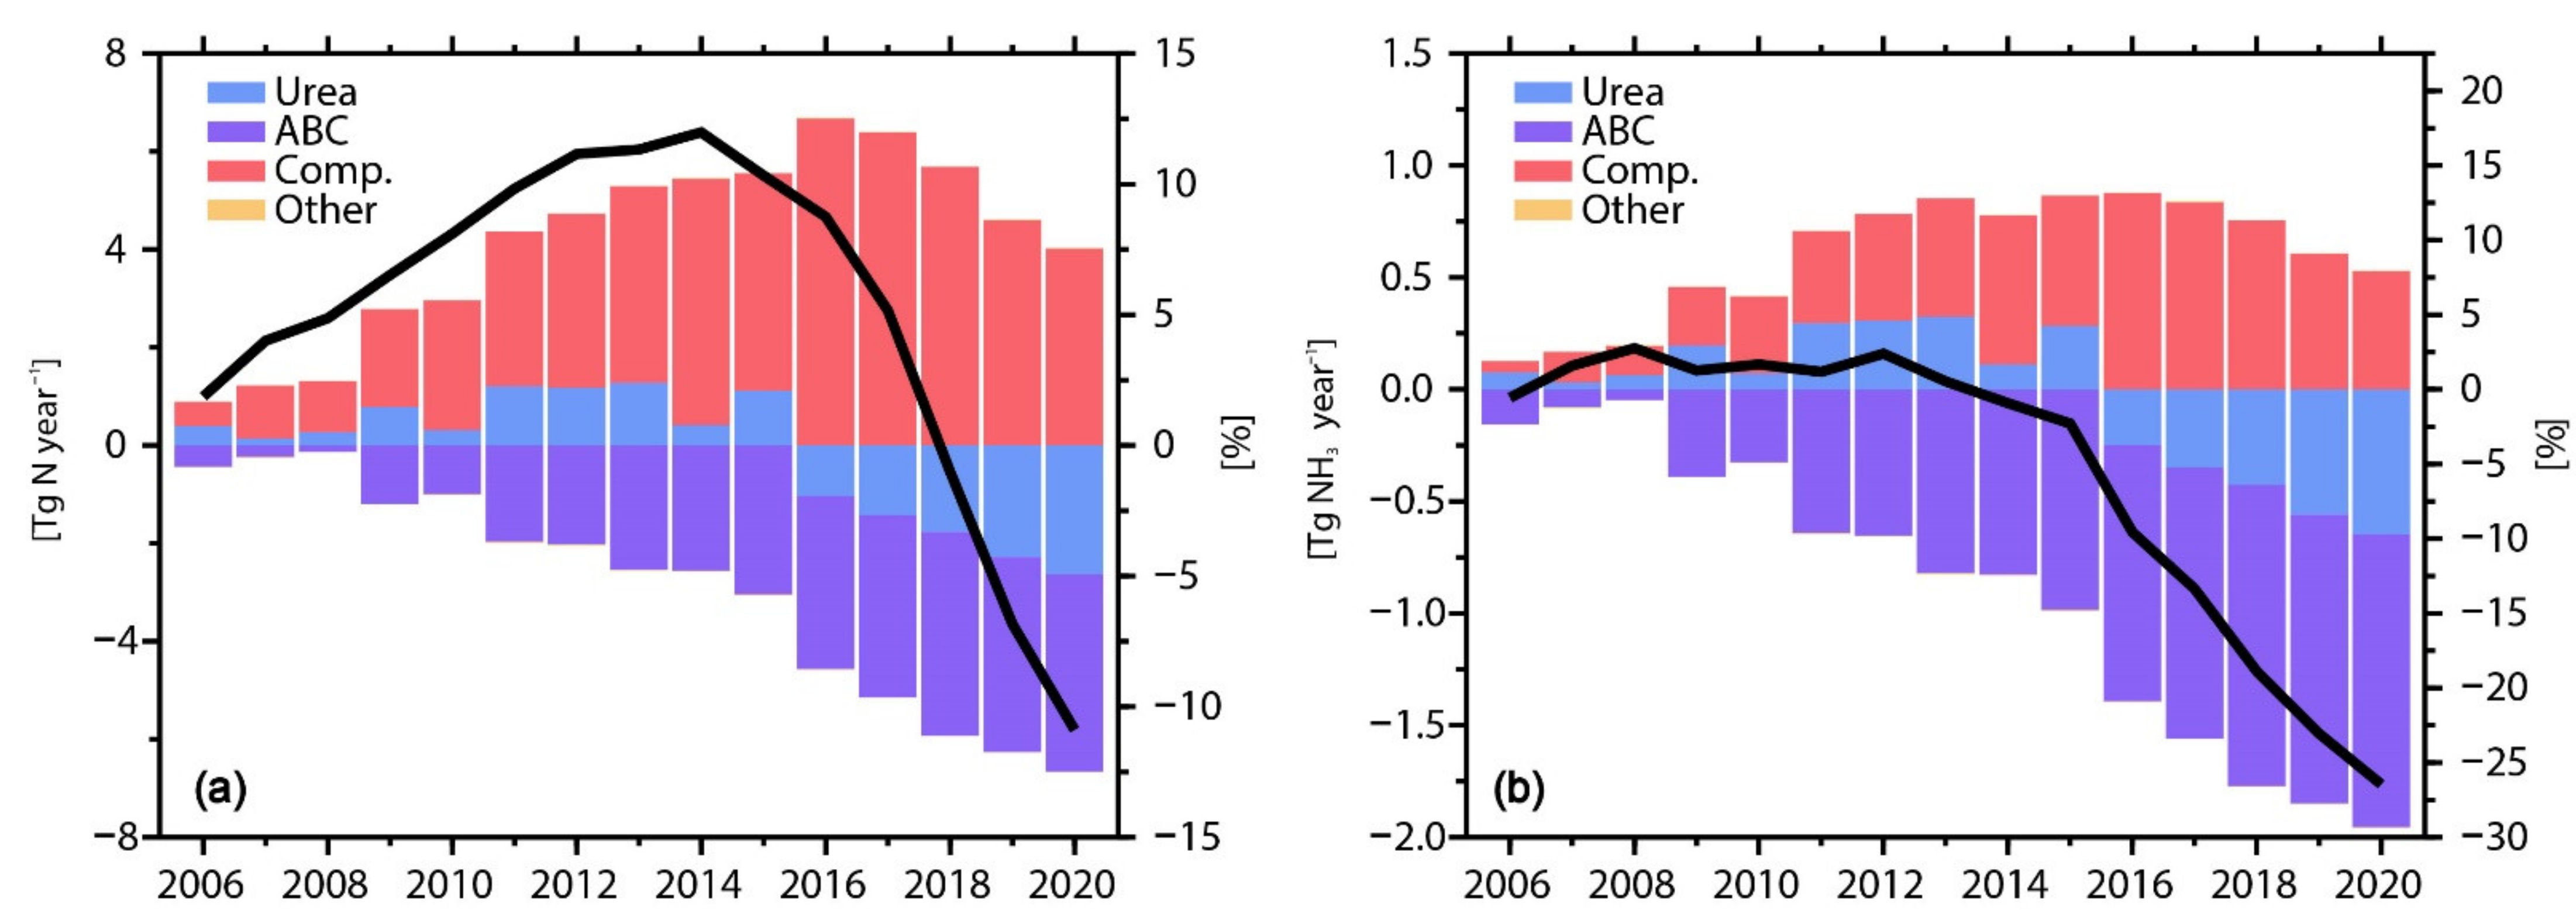
3.1. Annual Changes in NH3 Emissions from Nitrogen Fertilizer Application

Figure 1 and Figure 2 show the amount of major synthetic nitrogen fertilizer applications and resulting NH3 emissions from nitrogen fertilizer during 2005–2020 in China. Previous studies demonstrate that urea and ABC are major direct nitrogen fertilizer in China [39,40]. Our results show that compound fertilizer is also a major nitrogen fertilizer in China, which is consistent with Li et al. [61]. Urea, compound fertilizer and ABC accounted for 49.4%, 31.7% and 18.7% of the total synthetic nitrogen fertilizer, respectively, during 2005–2020 in China. To compare with urea and ABC, we label ammonium phosphates, NK and other NP + NPK as compound fertilizer and label AN, AS and other fertilizer used as other fertilizers. Based on field and lab observations, the emission rates of urea, ABC and NPK compound fertilizer are approximately 14% [4,50,62,63], 30% [62,63,64,65] and 7% [4,50,66], respectively. As present in Figure 1b, NH3 emissions from urea, compound, ABC and other fertilizers account for 49.3%, 31.7%, 18.7% and 0.2% of the national total average from 2005 to 2020.
The annual national total NH3 emissions from nitrogen fertilizer applications were 5.38 Tg in 2005, then slightly increased to 5.53 Tg in 2008 and remained nearly unchanged during 2008–2012, then decreased to 3.96 Tg in 2020 (Figure 1b). With updated soil pH, CEC and finer meteorology conditions from ERA5, the estimations in this study are 0.3 Tg higher than our previous work [41]. The trend of annual NH3 emissions was different from that of the national total nitrogen fertilizer application amounts, which increased from 24.2 Tg N in 2005 to 27.1 Tg N in 2014 and then decreased to 21.5 Tg N in 2020. The usage of ABC was 5.2 Tg in 2005 and decreased to 1.2 Tg N (−77.6%) in 2018, then almost remained stable until 2020, as presented in Figure 2. Meanwhile, the consumption of compound fertilizer, which has a much lower emission factor [4,50], increased by 6.7 Tg N (76.7%) from 2005 (8.7 Tg N) to 2016 (15.4 Tg N), then decreased to 12.7 Tg N (12.3%). The application amount of urea increased from 10.2 Tg N in 2005 to 11.5 Tg N in 2013, accounting for approximately 43% of nitrogen fertilizer. After 2013, the usage of urea decreased to 7.6 Tg N in 2020. So we conclude that before 2014, the difference between the trend in fertilizer application and NH3 emissions from fertilizer use can be attributed to the switch of fertilizer type under the guidance of the National Soil Testing and Nutrient Recommendation Program [67]. After 2014, changes in fertilizer type associated with decreased total nitrogen fertilizer application accelerated the decrease of the NH3 emissions from nitrogen fertilizer. Kang et al. [39] and Adalibieke et al. [40] also point out that the changes in fertilizer type led to the decline in the mean emission factor of NH3 emissions from synthetic nitrogen fertilizer application in recent decades.

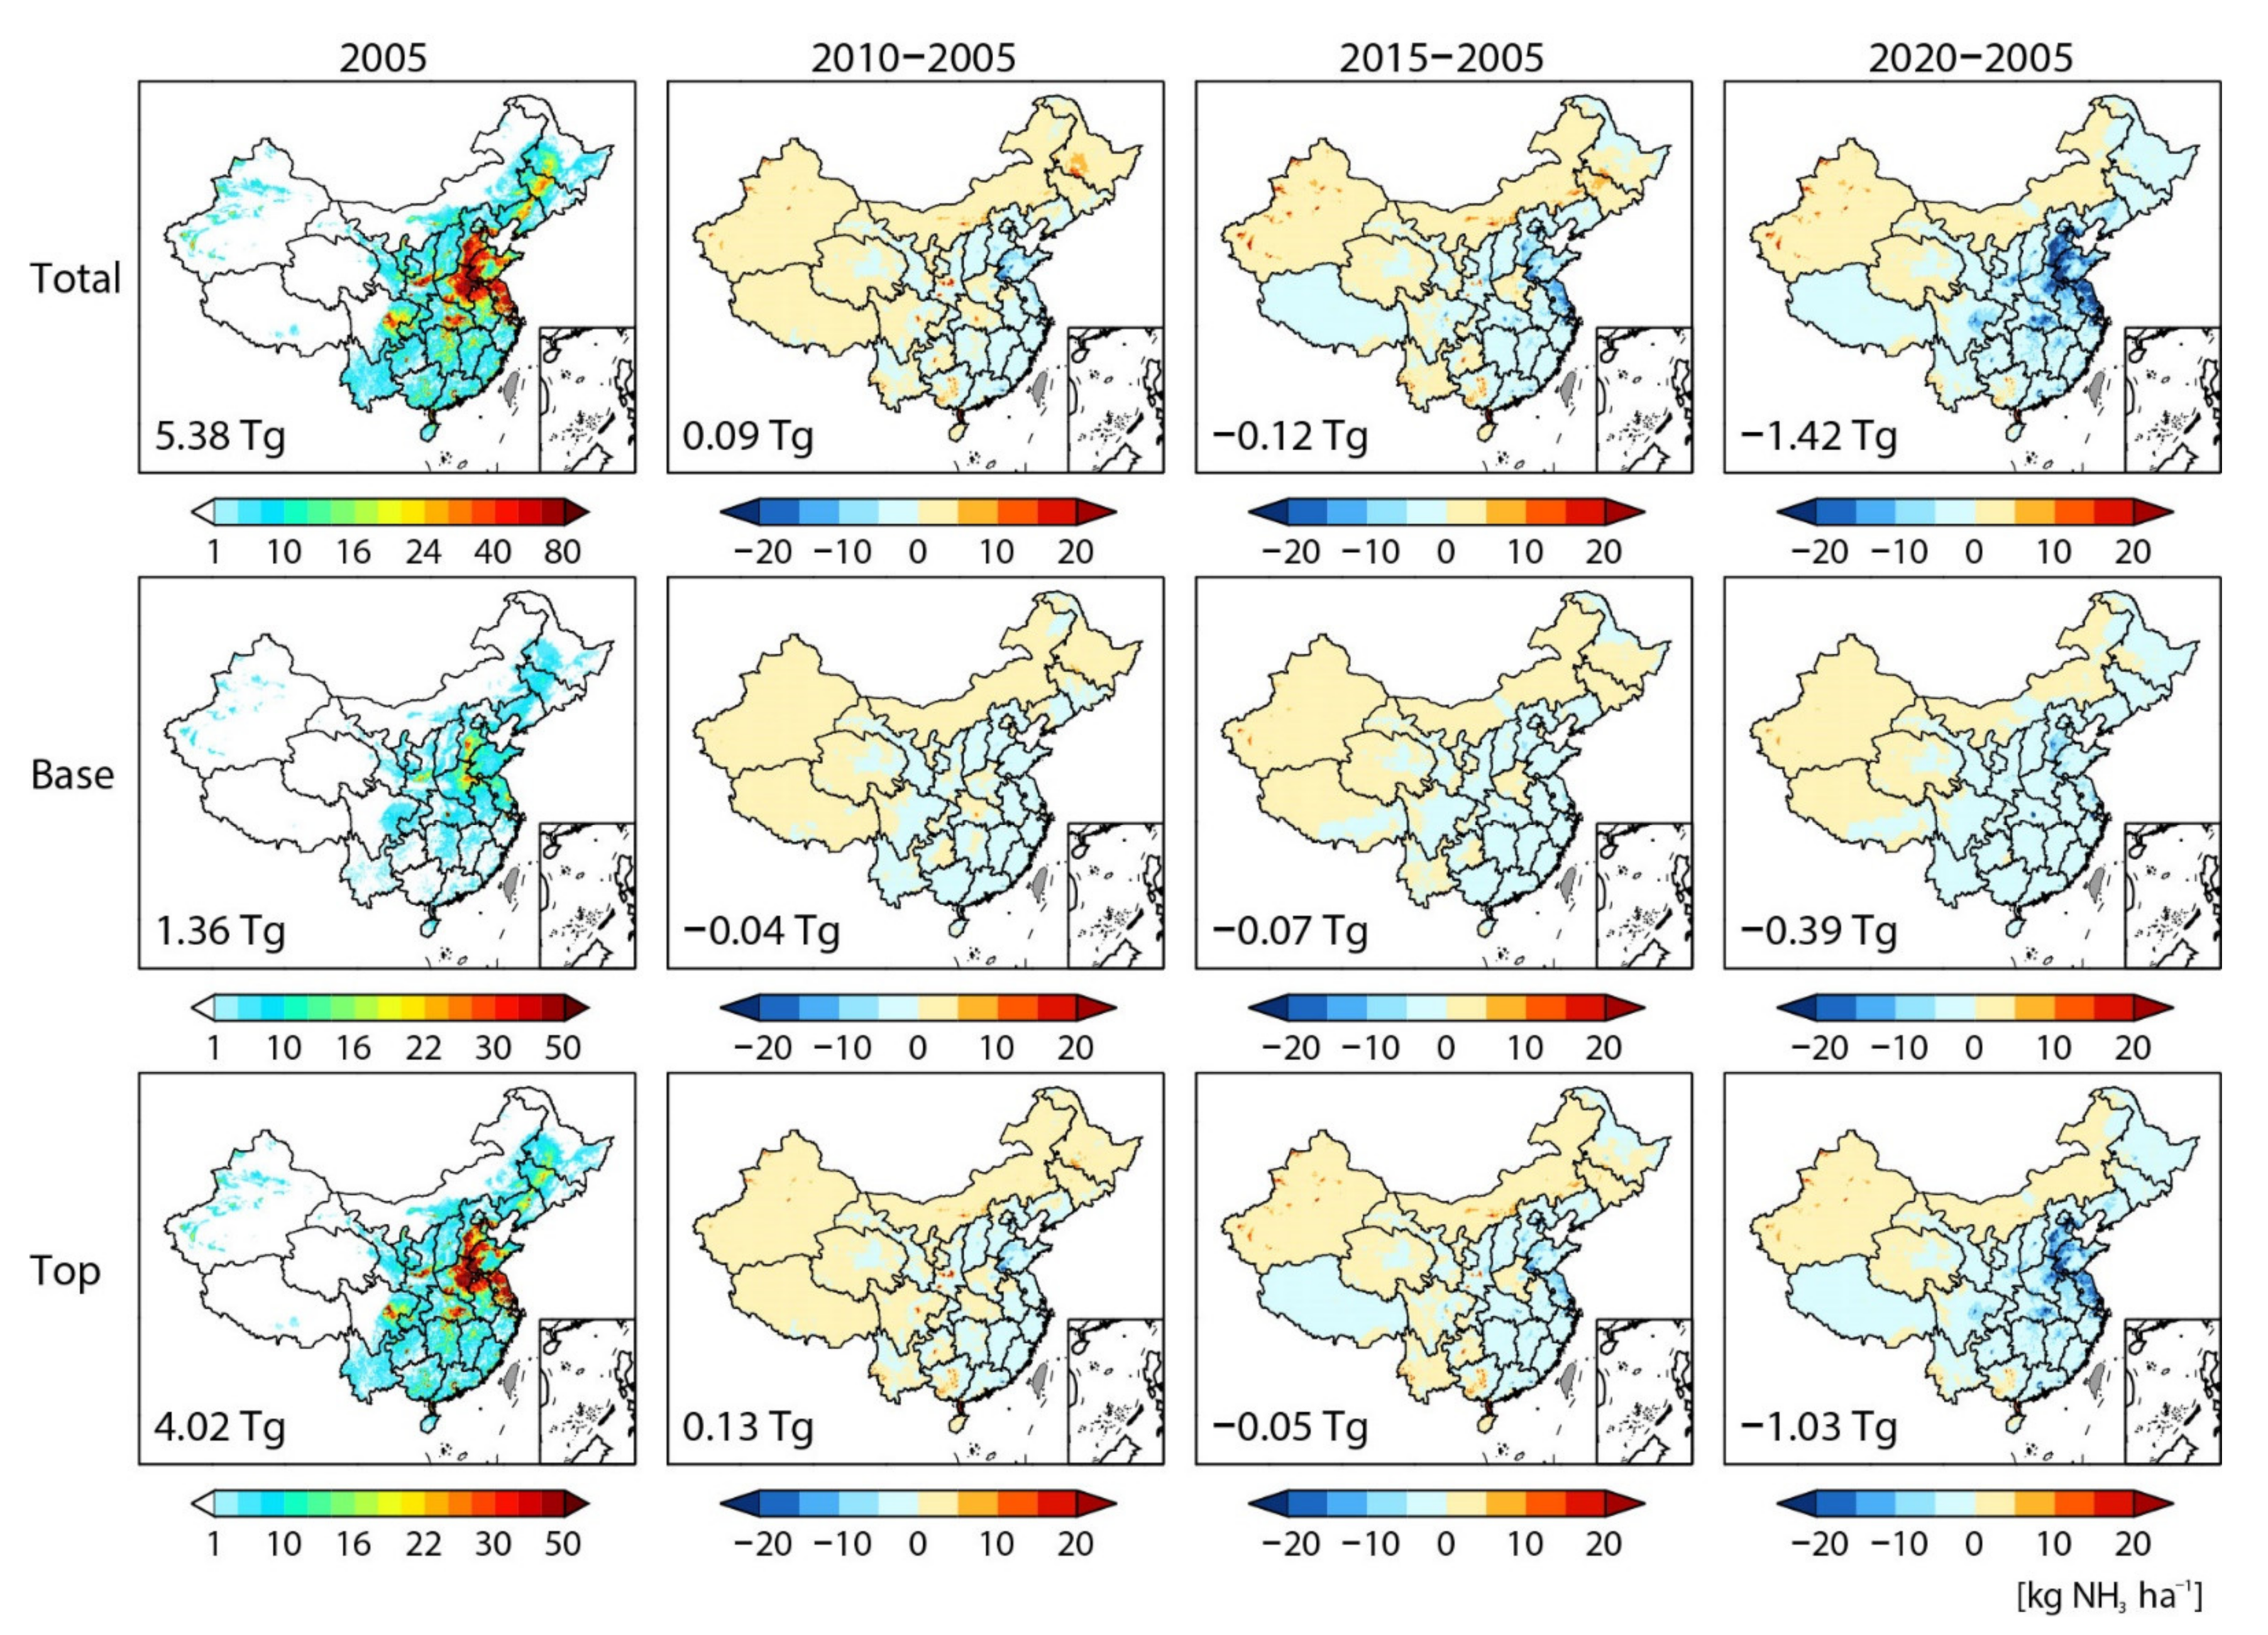
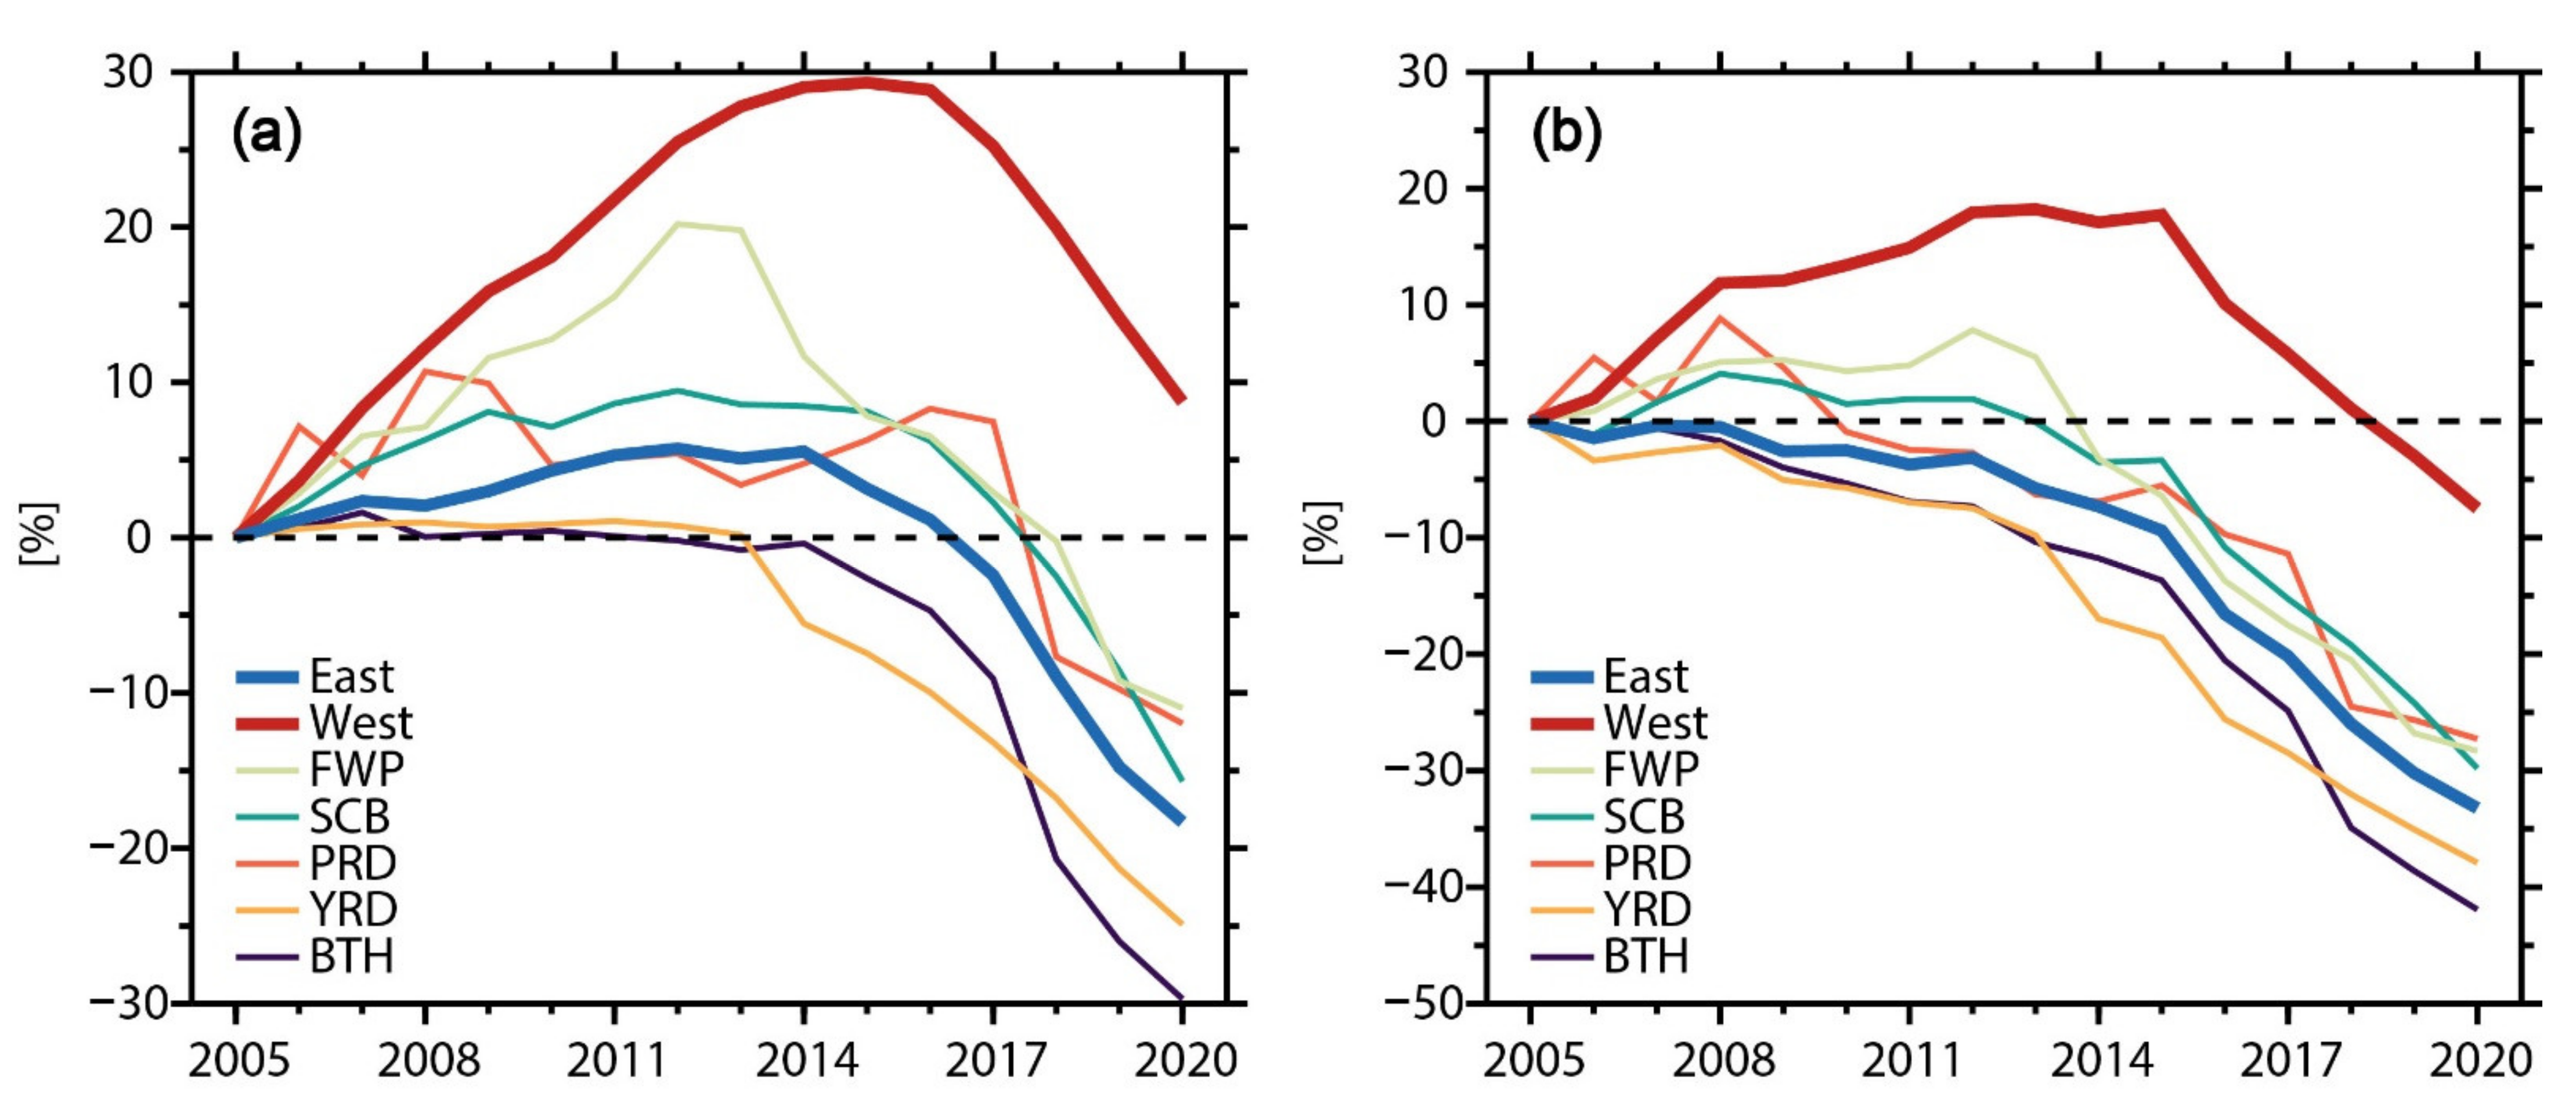
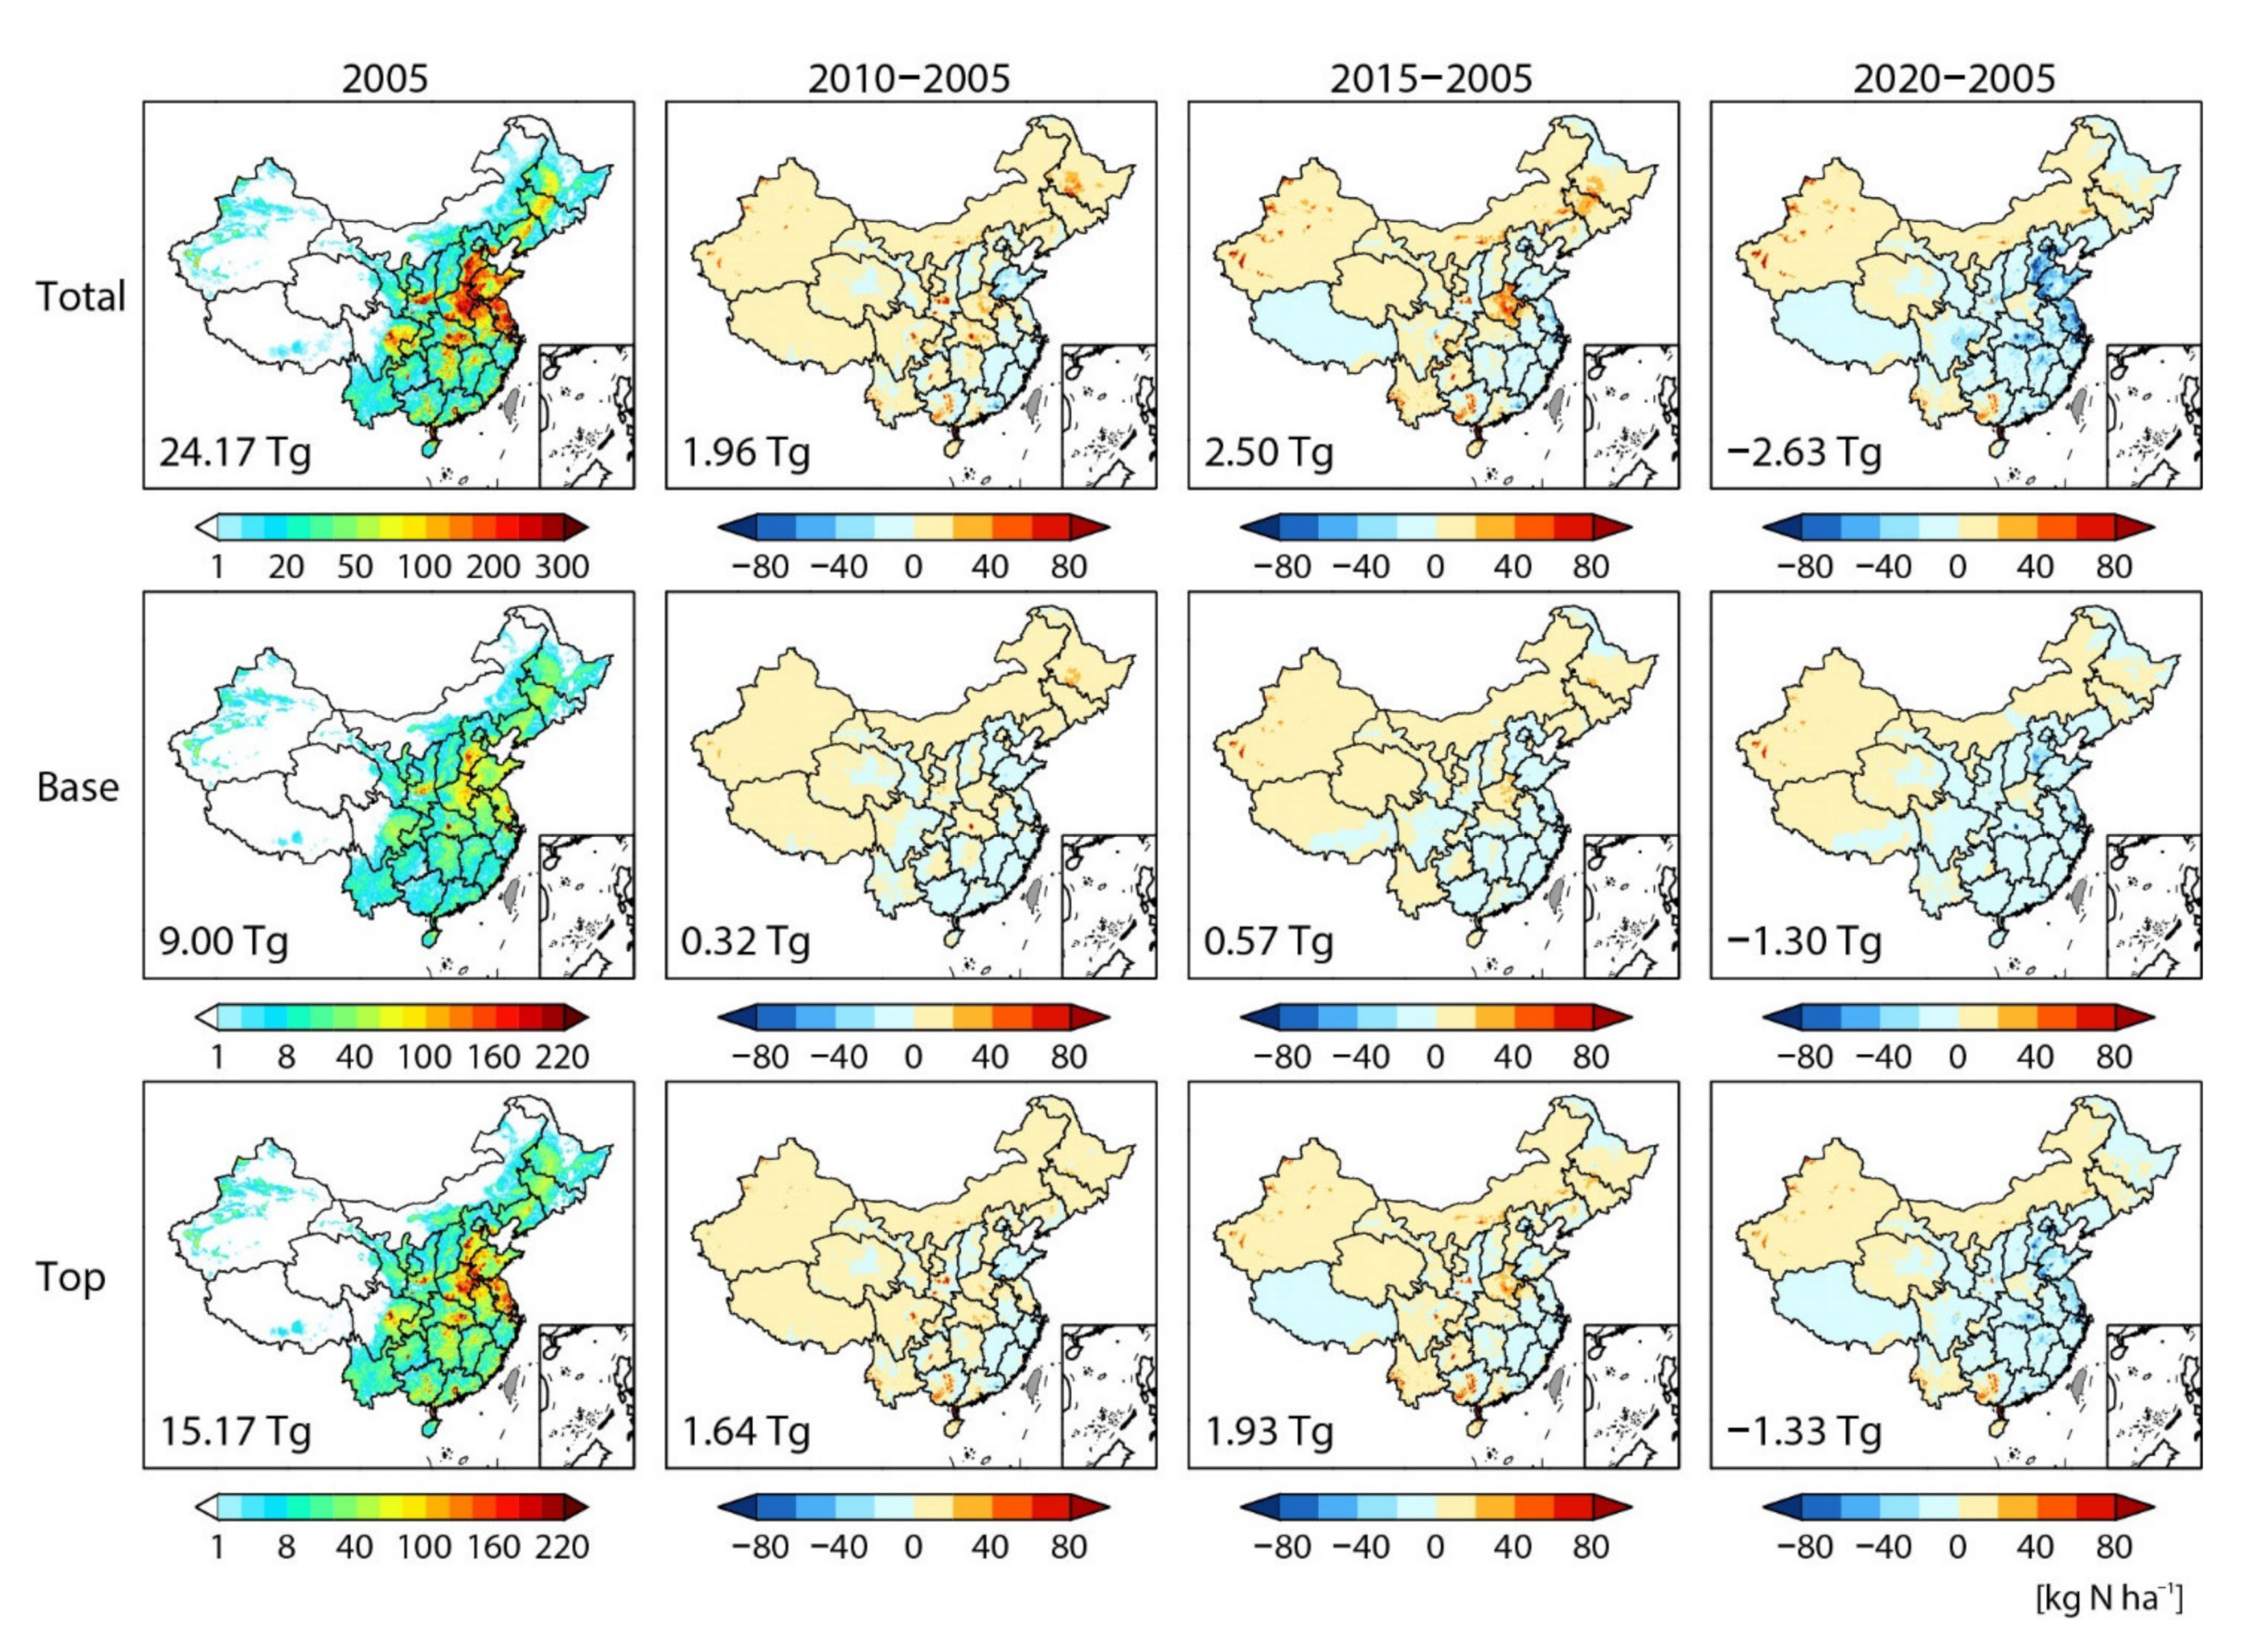
3.2. Changes in Spatial Distribution of NH3 Emissions from Nitrogen Fertilizer Application

Figure 3 and Figure 4 show the spatial distribution of synthetic nitrogen fertilizer application and associated NH3 emissions in 2005 and further changes in 2010, 2015 and 2020, respectively. During 2005–2020, the high emissions of NH3 from nitrogen fertilizer over 30 kg ha−1 occurred in Henan, Jiangsu, Shandong, Hebei, Hubei, Sichuan and Anhui provinces, which are major areas that have intensive agriculture activities in China [3,4,39]. Averaged during 2005–2020, the total NH3 emissions from these seven provinces reached 3.6 Tg, accounting for 49.5% of national total emissions from fertilizer use. The proportion of NH3 emissions from these seven provinces was 52.8% in 2005 and then declined to 47.8% in 2020. Northeast China (Heilongjiang, Jilin, Liaoning provinces) and Fengwei Plain also emit a great amount of NH3 due to their intensive agriculture activities. The number of NH3 emissions hotspots, with more than 10 kg ha−1 declined in 2020 when compared with 2005 in Hebei, Shandong and Jiangsu provinces. The associated nitrogen fertilizer decrease was over 40 kg N ha−1. The NH3 emissions from top dressing are over twice larger than basal dressing, which has a ca. 32% smaller emission factor than top dressing [50].
The nitrogen fertilizer application and resulting NH3 emissions both decreased in eastern China but increased in the western China from 2005 to 2020 (Figure 3, Figure 4 and Figure 5). Fertilizer application in western China increased by 1.94 Tg N (29.3%) from 2005 to 2015 and began to decline afterwards. Overall, fertilizer uses in western China increased by 0.58 Tg N (8.7%) in 2020 compared to 2005. In eastern China, nitrogen fertilizer application increased by 1.00 Tg N (5.7%) from 2005 to 2012, remained stable from 2012 to 2014 and decreased by 3.21 Tg (18.3%) in 2020. Taking the above-mentioned changes in fertilizer use amounts and fertilizer types into consideration, the corresponding NH3 emissions decreased by 1.32 Tg (33.2%) and 0.10 Tg (7.5%) in eastern and western China from 2005 to 2020, respectively.
Annual changes in NH3 emissions from nitrogen fertilizer differ from region to region. Beijing–Tianjin–Hebei (BTH), Fengwei Plain (FWP), Sichuan Basin (SCB), Yangtze River Delta (YRD) and Pearl River Delta (PRD) are the regions with dense human activities (Figure S1) and relatively poor air quality in China. The NH3 emissions from fertilizer among these regions decreased during 2005–2020, ranging from −27.3% in PRD to −41.9% in BTH. NH3 emissions show continuous decrease in BTH and YRD, while emissions first increased and then decreased in PRD, SCB and FWP. NH3 emissions in PRD and SCB peaked in 2008, while they peaked in 2012 for FWP. The trend of NH3 emissions is not consistent with fertilizer application in Figure 5a,b, which is also due to fertilizer type changes. Compared with SCB, the fertilizer application amount in BTH is smaller while the NH3 emissions are larger (Figure S2). This can be explained by the relatively high emission factor for nitrogen fertilizer associated with higher soil pH in BTH (Figure S3).

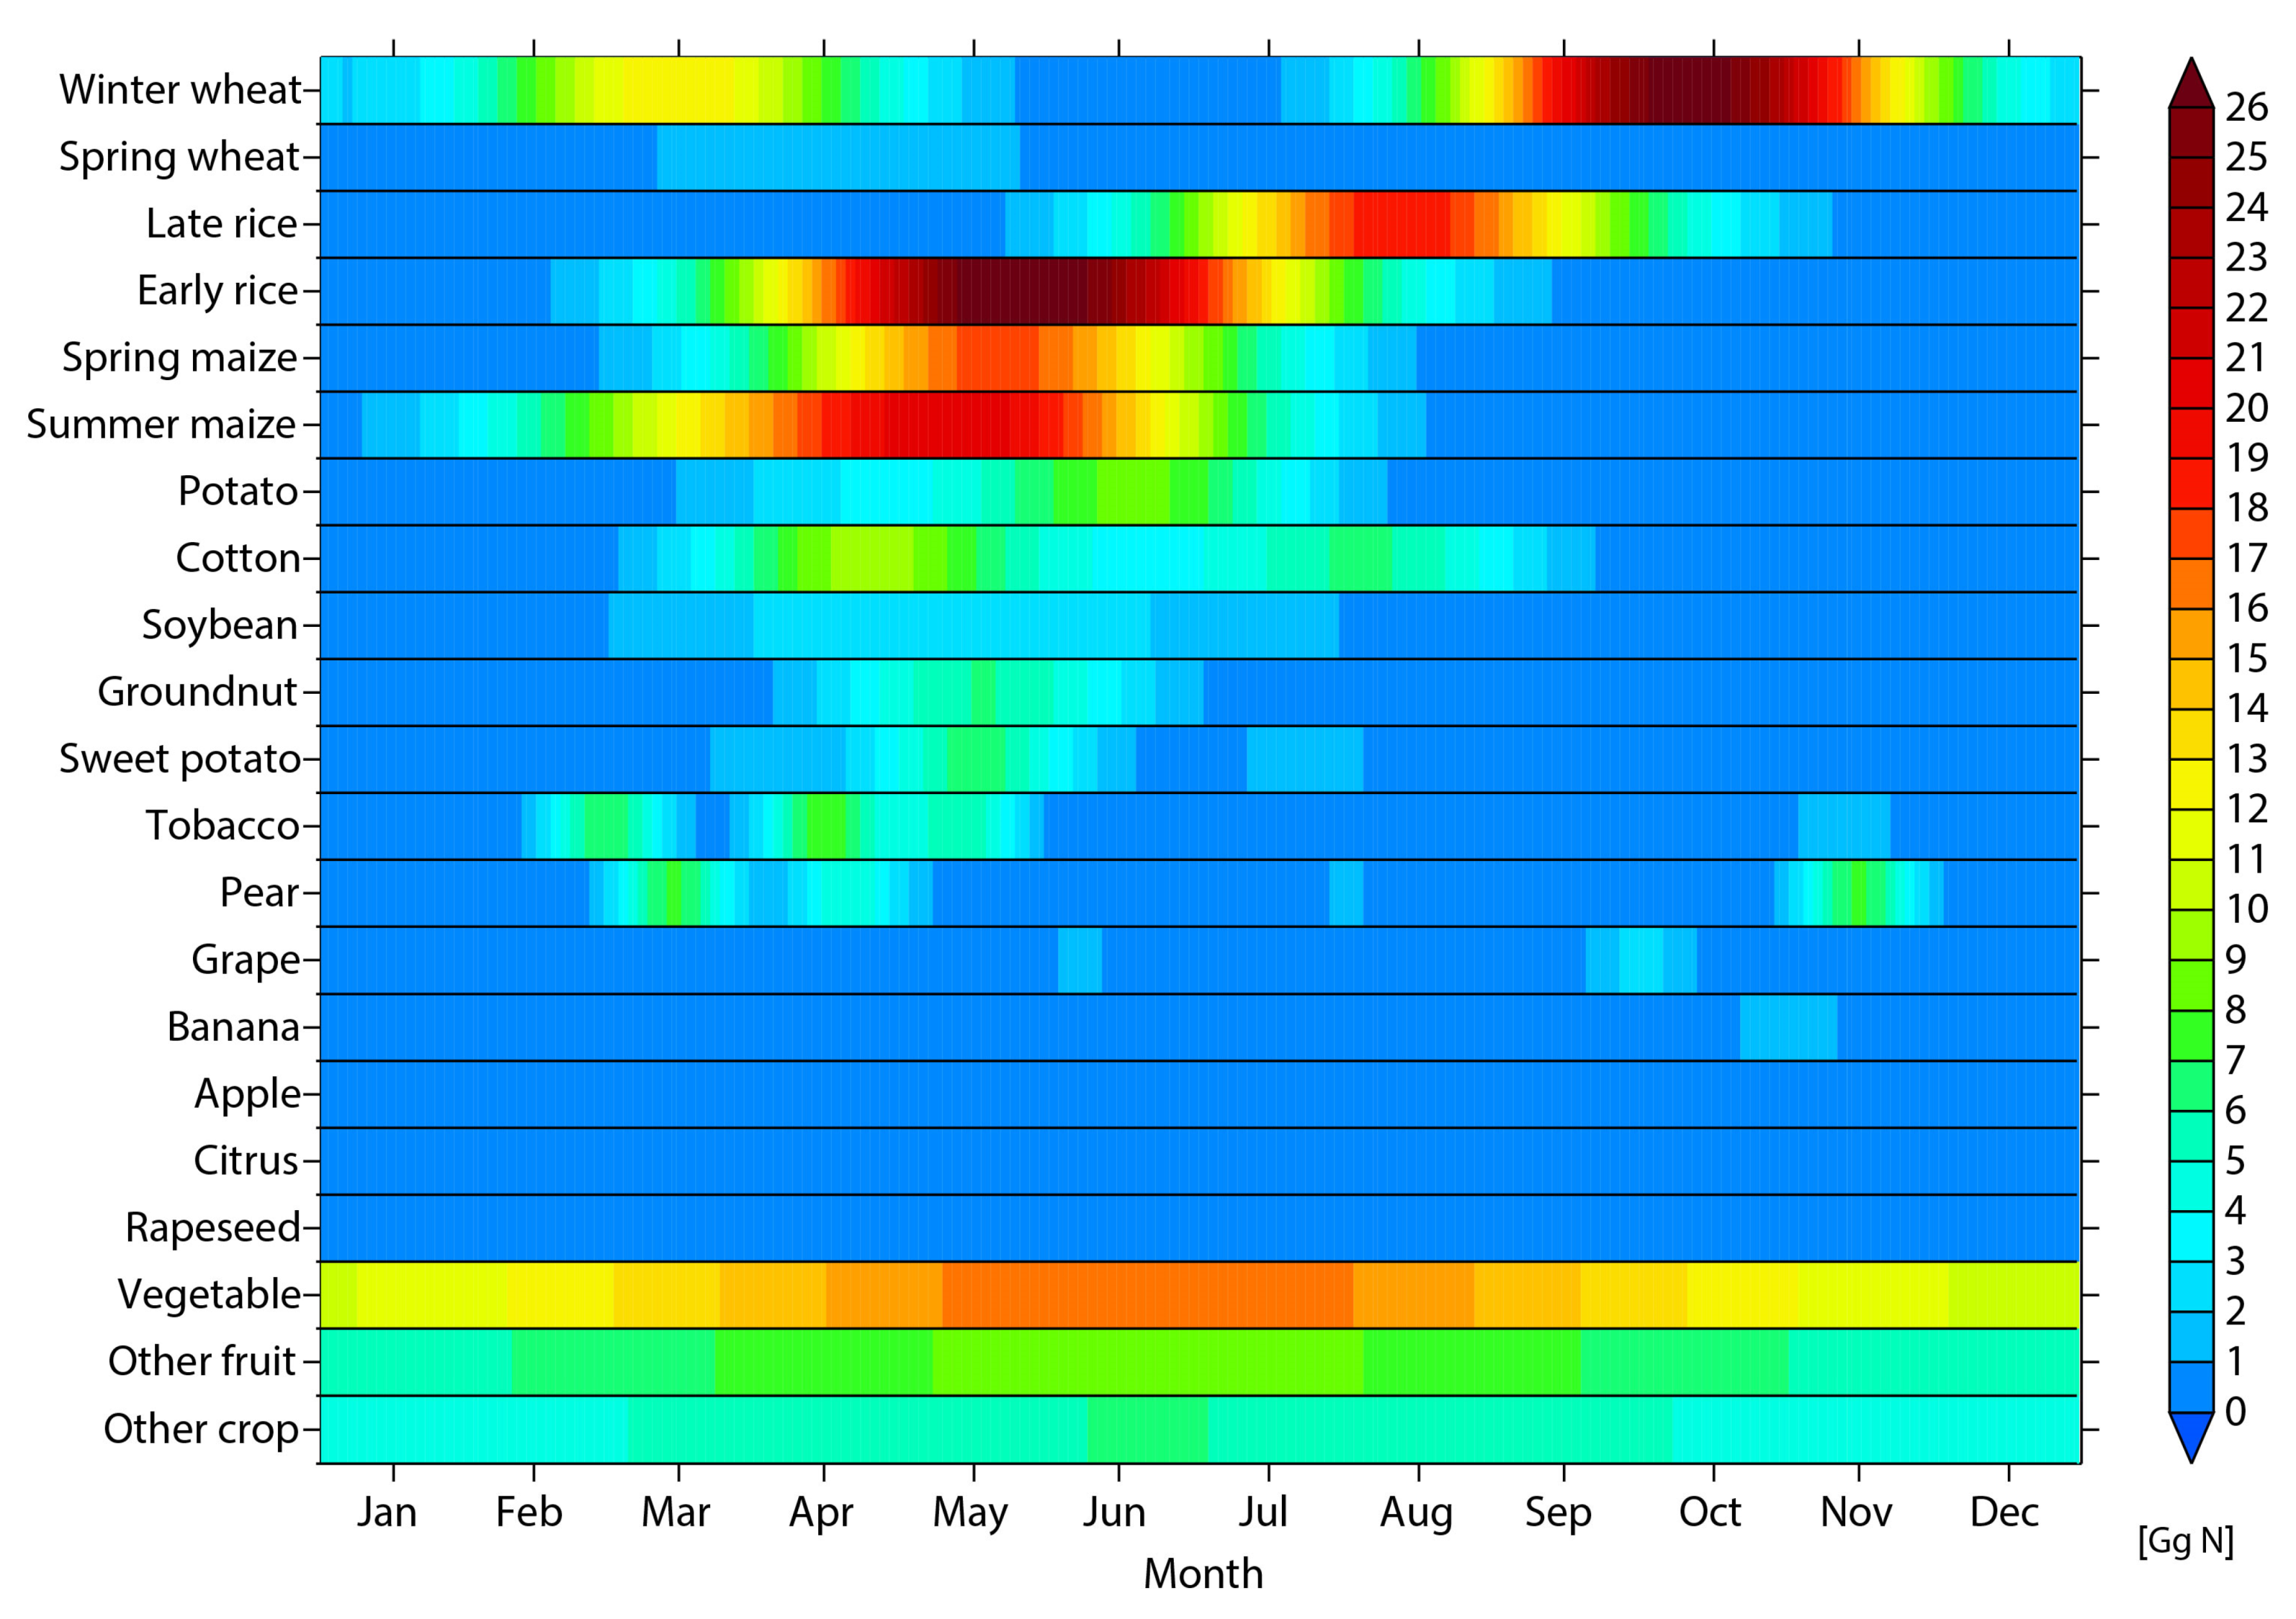
3.3. Monthly Variation of NH3 Emissions from Nitrogen Fertilizer Application

As presented in previous studies [2,3,4,39,41], the NH3 emissions from the fertilizer application peak in spring and summer because of the seasonal variability of fertilizer application and meteorological conditions. Figure 6 presents the seasonal variations of fertilizer application and resulting NH3 emissions for each year in China during 2005–2020. Consistent with previous studies, our estimates also show a spring and summer peak for NH3 emissions from fertilizer application in China. In general, the largest emissions occurred in late spring and summer (May to July), accounting for 45.4–47.0% of annual NH3 emissions from synthetic nitrogen fertilizer, which can be attributed to dense fertilizer use and high ambient air temperature. With less fertilizer application and lower air temperature, the NH3 emissions in winter (December–February) only account for 7.4–8.5% of annual NH3 emissions.
The detailed daily synthetic nitrogen fertilizer application for 18 crops and 3 groups in China throughout the year is given in Figure 7. Vegetables, maize, rice and wheat are major crops, which consumed about 20%, 17%, 16% and 15% of synthetic nitrogen fertilizer in China during 2005–2020, respectively. It can be concluded that the first heavy nitrogen fertilizer application period is around March, which is the time for the first top dressing for winter wheat, basal dressing for tobacco and top dressing for pear. Most crops begin to be planted in April with basal fertilization, which often adopts the injection method. The following fertilizer application period is basal dressing for spring wheat, early rice, spring maize and summer maize in April and May. Generally, nitrogen fertilizer applications from April to June account for 42.5% of the annual total amount. With increased fertilizer application and ambient air temperature, the NH3 emissions from fertilizer application continuously increase before June. The top dressing for late rice is mainly applied in August. The basal dressing for winter wheat generally happens in late September and early October around the North China Plain. Therefore, we can observe a small peak in fertilizer application in October (Figure 7). In winter, the fertilization of cash crops, such as pears and vegetables, contribute to the small amount of NH3 emissions from fertilizer.

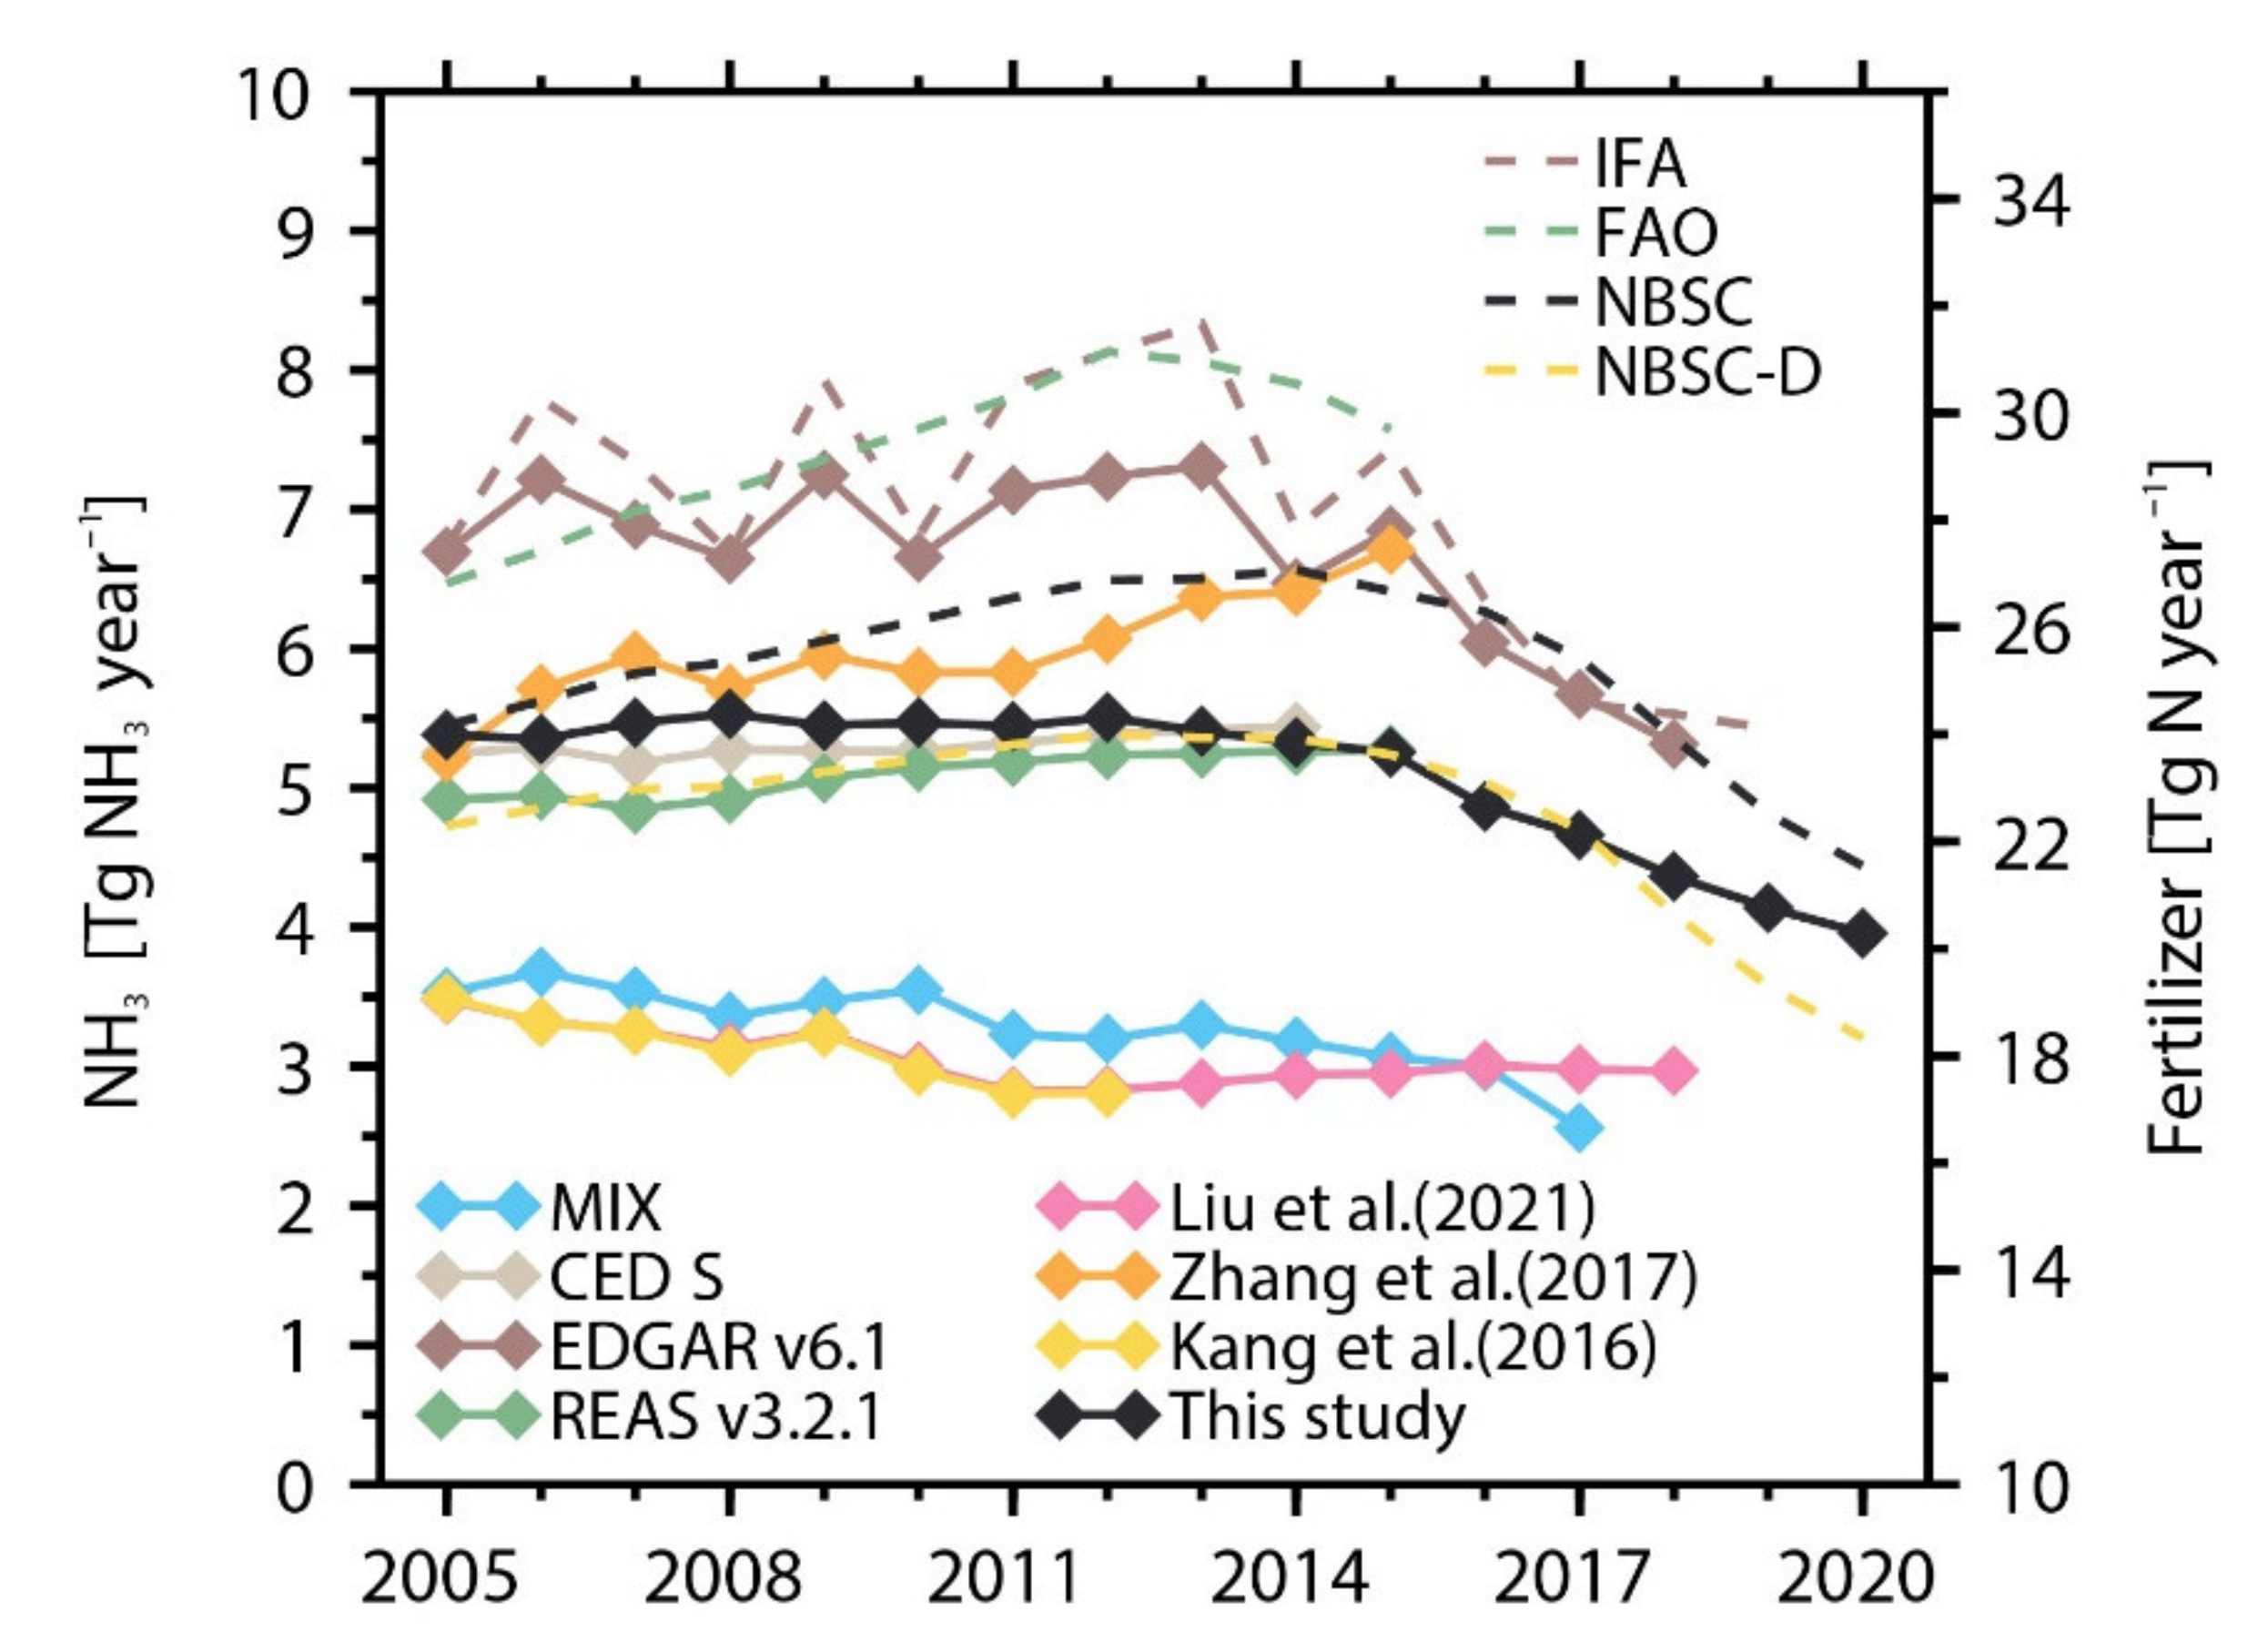
3.4. Comparison with Previous Studies

Our estimates provide monthly and annual spatio-temporal variations in NH3 emissions from fertilizer applications in China from 2005 to 2020. Figure 8 presents a comparison between this study and previous studies, including MIX [3,39,42] (a mosaic Asian anthropogenic emission inventory), Community Emissions Data System (CEDS) [43,44], EDGAR v6.1 [45], REAS v3.2.1 [46,47], Liu et al. [48], Zhang et al. [49] and Kang et al. [39]. The ammonia emissions from cropland in REAS v3.2.1 contains emissions from the decomposition of returned crop residue, the use of synthetic fertilizer, biologically fixed nitrogen, crop residue and livestock manure used as organic fertilizer [32]. In China, synthetic fertilizer emissions account for 61.6% of total NH3 emissions from cropland [32]. Therefore, we use this fraction to extract the NH3 emissions from synthetic fertilizer in REAS v3.2.1 as presented in Figure 8. Our estimates are close to REAS v3.2.1, CEDS and Zhang et al. [49]; lower than EDGAR v6.1; and higher than MIX, Kang et al. [39] and Liu et al. [48]. The differences with other inventories are mainly attributed to the differences in nitrogen fertilizer use and corresponding emission factors. The NH3 emissions in MIX and Liu et al. [48] are extensions of emissions in Kang et al. [39] and Huang et al. [3]. The synthetic fertilizer application in Huang et al. [3] is 22.4 Tg, which may underestimate the use of compound fertilizer in 2006 in China. The total amount of fertilizer application used in MIX, Kang et al. [39] and Liu et al. [48] is close to NBSC-D (direct nitrogen fertilizer), which is less than that used in this study (NBSC, direct nitrogen fertilizer + compound fertilizer (N)). The emission factors used in MIX, Kang et al. [39] and Liu et al. [48] are smaller than ours as well. The fertilizer use data in EDGAR v6.1 is from IFA, which is larger and more fluctuant than this study. CEDS uses a larger nitrogen fertilizer use amount from FAO than ours but adapts smaller emissions factors. Thus, our results are comparable with CEDS. Zhang et al. [49] evaluated NH3 emissions in China with a mass balanced approach, which is different from all other studies shown in Figure 8.
The changes in annual NH3 emissions in this study are similar to MIX and Kang et al. [39]. Estimated NH3 emissions from nitrogen fertilizer in MIX, Kang et al. [39] and this study remain unchanged during the first period and start to decline afterwards. However, the year that NH3 emissions from nitrogen fertilizer started to decrease in our estimates is later than MIX and Kang et al. [39]. The increased consumption of compound nitrogen fertilizer from 2005 to 2016 in our estimates postpones the decreasing trend of NH3 emissions from fertilizer in China when compared with MIX and Kang et al. [39]. The increasing trend of NH3 emissions in Zhang et al. [49] is consistent with the increasing trend of NH3 concentrations and reactive nitrogen depositions observed by satellite and site observations. Previous studies indicated that the increasing trend of NH3 concentrations over the past decade in China was mainly driven by the decreasing emissions of SO2 and NOx [28,41,68]. The changes in NH3 emissions from fertilizer in EDGAR v6.1 almost follow the changes in nitrogen fertilizer uses. CEDS is scaled to MEIC (Multi-resolution Emission Inventory for China) [69,70] in China. The NH3 emissions from fertilizer in REAS v3.2.1 kept increasing during 2005–2015. The unchanged scaling factor [32] to estimate NH3 emissions from synthetic fertilizer applied in REAS v3.2.1 can distort the actual trend of NH3 emissions from fertilizer use. From the estimations in Fu et al. [68], the NH3 emissions from fertilizer decreased by 1.3% from 2008 to 2014, while increased by 13.9% from livestock. This change will decrease the percentage of fertilizer emissions and may reverse NH3 emissions from increase to decrease in REAS v3.2.1.

3.5. Uncertainty

Uncertainties in NH3 emissions from synthetic nitrogen fertilizer exist in both fertilizer application and emission factors. The distribution and uncertainties for activity levels are listed in Table S2 based on existing publications [3,71,72] or assumptions made for this study. The uncertainty of NH3 emissions from synthetic nitrogen fertilizer is 29–41% [72]. In this study, fertilizer applications are estimated by conventional crop planting experiences in China. Gridded datasets are adopted to capture the local situations in fertilizer applications and emission factors. Nevertheless, there is still large uncertainty due to the unchanged parameters in emission factors estimations. With the technology development, the fertilizer application time, rate and fertilizer type changed dramatically over time. With rapid urbanization, Chinese farmers have to improve crop yield to deal with the contradiction between the limited area of cropland and the growing population. Slow-release fertilizer and controlled-release fertilizer can increase crop yield meanwhile significantly improve nitrogen efficiency through much lower NH3 volatilization and nitrogen leaching [73,74,75]. In rural areas where there is a shortage of labor, single-layered deep-application is being introduced as a new pattern to replace the conventional fertilizer application [76]. With these new types of nitrogen fertilizer and fertilizer application methods, both the fertilizer application amount and emission factors changed over time. However, these changes are not considered in this study. We expect more measurements on emission factors and local investigations on fertilizer application activities will be carried out in the future.

4. Conclusions

In this study, we use the bottom-up method to refine the high-resolution NH3 emissions from synthetic nitrogen fertilizer from 2005 to 2020 in China. The annual average NH3 emissions from fertilizer use are about 5.1 Tg during 2005–2020 in China. Urea, nitrogenous compound fertilizer and ABC are major nitrogen fertilizers in China, accounting for 49.4%, 31.7% and 18.7%, respectively. Emissions from synthetic nitrogen fertilizer initially increased from 5.38 Tg in 2005 to 5.53 Tg in 2008, then slightly fluctuated at around 5.5 Tg from 2008 to 2012, despite the increasing use of total annual fertilizer application. This stable period of NH3 emissions from nitrogen fertilizer application can be explained by the increased use of low emissions factor fertilizer (compound fertilizer) and decreased use of high NH3 volatility fertilizer (ABC). The percentage of fertilizer NH3 emissions from urea remained at approximately 50% during 2005–2020, while the proportion of NH3 emissions from ABC decreased from 31.3% in 2005 to 9.6% in 2020 and the fraction of nitrogenous compound fertilizer increased from 21.0% to 42.0% during 2005–2020. Thus, the NH3 emissions began to slowly decrease between 2012–2015 and show a sharp decrease after 2015, which can be attributed to changes in fertilizer types and decreased total fertilizer application. With dense fertilization activities and relatively high temperature, NH3 emissions generally peak in late spring and summer.
Spatial patterns of NH3 emissions from fertilizer are almost consistent over the past 16 years, with high emissions located in eastern and southwestern China, which represent the major regions with dense agricultural activities. The total NH3 emissions from synthetic nitrogen fertilizer in Henan, Jiangsu, Shandong, Hebei, Hubei, Sichuan and Anhui provinces reached 3.6 Tg, accounting for almost half (49.5%) of the national total amount. With changes in nitrogen fertilizer use amount and fertilizer type, the NH3 emissions from fertilizer decreased more in eastern China (−33.2%) than in western China (−7.5%) from 2005 to 2020.
We also compared our estimates with other studies. It should be noted that differences still exist among different inventories due to the varying choice in activity data and emission factors. The fertilizer application time, rate and type are different in different regions and for different crop types. What’s more, the agricultural activities mode and technologies are changing because of decreases in labor in rural areas and rapid economic development in recent decades in China. The quest for further air quality improvement in China emphasizes the importance of NH3 emission reduction [38]. The high resolution of monthly NH3 emissions during 2005–2020 constructed in this study can provide valuable information for policymakers to further mitigate NH3 emissions in China.

Supplementary Materials

The following are available online at https://www.mdpi.com/article/10.3390/atmos13081297/s1; Figure S1. Location of BTH, YRD, PRD, SCB and FWP (grey shape) regions, western (red line) and eastern (black line) China; Figure S2. Interannual changes of synthetic nitrogen fertilizer application (a) and resulting NH3 emissions (b) from BTH (purple line), YRD (yellow line), PRD (orange line), SCB (dark green line) and FWP (light green line) during 2005–2020; Figure S3. Distribution of soil pH and CEC in China from Soilgrids [59]; Table S1. Comparisons of datasets; Table S2. Selected parameters and assumptions for uncertain-ty analysis.

Author Contributions

Conceptualization, Y.C.; Data curation, Y.C.; Formal analysis, Y.C. and L.Z. (Lin Zhang); Funding acquisition, Y.C., L.Z. (Lin Zhang), Y.Z. and B.L.; Investigation, Y.C.; Methodology, Y.C., L.Z. (Lin Zhang) and Y.Z.; Project administration, Y.C.; Supervision, Y.C., L.Z. (Lin Zhang) and B.L.; Validation, L.Z. (Lin Zhang) and Y.Z.; Visualization, Y.C. and M.Z.; Writing—original draft, Y.C.; Writing—review & editing, Y.C., L.Z. (Lin Zhang), Y.Z., L.Z. (Lijuan Zhang), J.Z., M.L. and M.Z. All authors have read and agreed to the published version of the manuscript.

Funding

This work is funded by the Shandong Provincial Natural Science Foundation (2022HWYQ-066) and the National Natural Science Foundation of China (41922037).

Institutional Review Board Statement

Not applicable.

Informed Consent Statement

Not applicable.

Data Availability Statement

All data that support the findings of this study are available from the corresponding author on reasonable request.

Acknowledgments

We are grateful for financial support from the Department of Ecology and Environment of Sichuan Province, the Shandong Provincial Natural Science Foundation (2022HWYQ-066) and the National Natural Science Foundation of China (41922037). We also thank the reviewers and editors who have contributed valuable comments to improve the quality of the paper.

Conflicts of Interest

The authors declare no conflict of interest.

References

  1. Behera, S.N.; Sharma, M.; Aneja, V.P.; Balasubramanian, R. Ammonia in the atmosphere: A review on emission sources, atmospheric chemistry and deposition on terrestrial bodies. Environ. Sci. Pollut. Res. 2013, 20, 8092–8131. [Google Scholar] [CrossRef] [PubMed]
  2. Paulot, F.; Jacob, D.J.; Pinder, R.W.; Bash, J.O.; Travis, K.; Henze, D.K. Ammonia emissions in the United States, European Union, and China derived by high-resolution inversion of ammonium wet deposition data: Interpretation with a new agricultural emissions inventory (MASAGE_NH3). J. Geophys. Res.-Atmos. 2014, 119, 4343–4364. [Google Scholar] [CrossRef]
  3. Huang, X.; Song, Y.; Li, M.; Li, J.; Huo, Q.; Cai, X.; Zhu, T.; Hu, M.; Zhang, H. A high-resolution ammonia emission inventory in China. Glob. Biogeochem. Cycles 2012, 26, GB1030. [Google Scholar] [CrossRef]
  4. Zhang, L.; Chen, Y.; Zhao, Y.; Henze, D.K.; Zhu, L.; Song, Y.; Paulot, F.; Liu, X.; Pan, Y.; Lin, Y.; et al. Agricultural ammonia emissions in China: Reconciling bottom-up and top-down estimates. Atmos. Chem. Phys. 2018, 18, 339–355. [Google Scholar] [CrossRef]
  5. Zhang, Y.; Benedict, K.B.; Tang, A.; Sun, Y.; Fang, Y.; Liu, X. Persistent nonagricultural and periodic agricultural emissions dominate sources of ammonia in urban Beijing: Evidence from 15N stable isotope in vertical profiles. Environ. Sci. Technol. 2020, 54, 102–109. [Google Scholar] [CrossRef]
  6. Kean, A.J.; Harley, R.A.; Littlejohn, D.; Kendall, G.R. On-road measurement of ammonia and other motor vehicle exhaust emissions. Environ. Sci. Technol. 2000, 34, 3535–3539. [Google Scholar] [CrossRef]
  7. Sun, K.; Tao, L.; Miller, D.J.; Pan, D.; Golston, L.M.; Zondlo, M.A.; Griffin, R.J.; Wallace, H.W.; Leong, Y.J.; Yang, M.M.; et al. Vehicle emissions as an important urban ammonia source in the United States and China. Environ. Sci. Technol. 2017, 51, 2472–2481. [Google Scholar] [CrossRef]
  8. Hickman, J.E.; Dammers, E.; Galy-Lacaux, C.; Werf, G.R.v.d. Satellite evidence of substantial rain-induced soil emissions of ammonia across the Sahel. Atmos. Chem. Phys. 2018, 18, 16713–16727. [Google Scholar] [CrossRef]
  9. Li, L.; Kumar, M.; Zhu, C.; Zhong, J.; Francisco, J.S.; Zeng, X.C. Near-Barrierless ammonium bisulfate formation via a loop-structure promoted proton-transfer mechanism on the surface of water. J. Am. Chem. Soc. 2016, 138, 1816–1819. [Google Scholar] [CrossRef]
  10. Xu, L.; Penner, J.E. Global simulations of nitrate and ammonium aerosols and their radiative effects. Atmos. Chem. Phys. 2012, 12, 9479–9504. [Google Scholar] [CrossRef]
  11. Wang, M.; Kong, W.; Marten, R.; He, X.C.; Chen, D.; Pfeifer, J.; Heitto, A.; Kontkanen, J.; Dada, L.; Kurten, A.; et al. Rapid growth of new atmospheric particles by nitric acid and ammonia condensation. Nature 2020, 581, 184–189. [Google Scholar] [CrossRef]
  12. US Environmental Protection Agency (USEPA). Air Quality Criteria for Particulate Matter. Citeseer Princet. 2004, 1, 1–6. [Google Scholar]
  13. Huang, R.-J.; Zhang, Y.; Bozzetti, C.; Ho, K.-F.; Cao, J.-J.; Han, Y.; Daellenbach, K.R.; Slowik, J.G.; Platt, S.M.; Canonaco, F.; et al. High secondary aerosol contribution to particulate pollution during haze events in China. Nature 2014, 514, 218–222. [Google Scholar] [CrossRef]
  14. Wang, S.; Xing, J.; Jang, C.; Zhu, Y.; Fu, J.S.; Hao, J. Impact assessment of ammonia emissions on inorganic aerosols in East China using response surface modeling technique. Environ. Sci. Technol. 2011, 45, 9293–9300. [Google Scholar] [CrossRef]
  15. Chen, R.; Zhao, Z.; Kan, H. Heavy smog and hospital visits in Beijing, China. Am. J. Resp. Crit. Care. 2013, 188, 1170–1171. [Google Scholar] [CrossRef]
  16. Stokstad, E. Ammonia pollution from farming may exact hefty health costs. Science 2014, 343, 238. [Google Scholar] [CrossRef]
  17. Galloway, J.N. Acidification of the world: Natural and anthropogenic. Water Air Soil Pollut. 2001, 130, 17–24. [Google Scholar] [CrossRef]
  18. Galloway, J.N.; Aber, J.D.; Erisman, J.W.; Seitzinger, S.P.; Howarth, R.W.; Cowling, E.B.; Cosby, B.J. The nitrogen cascade. BioScience 2003, 53, 341–356. [Google Scholar] [CrossRef]
  19. Eickenscheidt, N.; Brumme, R.; Veldkamp, E. Direct contribution of nitrogen deposition to nitrous oxide emissions in a temperate beech and spruce forest—A 15N tracer study. Biogeosciences 2011, 8, 621–635. [Google Scholar] [CrossRef]
  20. Pilegaard, K.; Skiba, U.; Ambus, P.; Beier, C.; Brüggemann, N.; Butterbach-Bahl, K.; Dick, J.; Dorsey, J.; Duyzer, J.; Gallagher, M.; et al. Factors controlling regional differences in forest soil emission of nitrogen oxides (NO and N2O). Biogeosciences 2006, 3, 651–661. [Google Scholar] [CrossRef]
  21. Van Damme, M.; Clarisse, L.; Heald, C.L.; Hurtmans, D.; Ngadi, Y.; Clerbaux, C.; Dolman, A.J.; Erisman, J.W.; Coheur, P.F. Global distributions, time series and error characterization of atmospheric ammonia (NH3) from IASI satellite observations. Atmos. Chem. Phys. 2014, 14, 2905–2922. [Google Scholar] [CrossRef]
  22. Van Damme, M.; Clarisse, L.; Dammers, E.; Liu, X.; Nowak, J.B.; Clerbaux, C.; Flechard, C.R.; Galy-Lacaux, C.; Xu, W.; Neuman, J.A.; et al. Towards validation of ammonia (NH3) measurements from the IASI satellite. Atmos. Meas. Tech. 2015, 8, 1575–1591. [Google Scholar] [CrossRef]
  23. Dammers, E.; Palm, M.; Van Damme, M.; Vigouroux, C.; Smale, D.; Conway, S.; Toon, G.C.; Jones, N.; Nussbaumer, E.; Warneke, T.; et al. An evaluation of IASI-NH3 with ground-based Fourier transform infrared spectroscopy measurements. Atmos. Chem. Phys. 2016, 16, 10351–10368. [Google Scholar] [CrossRef]
  24. Warner, J.X.; Wei, Z.; Strow, L.L.; Dickerson, R.R.; Nowak, J.B. The global tropospheric ammonia distribution as seen in the 13-year AIRS measurement record. Atmos. Chem. Phys. 2016, 16, 5467–5479. [Google Scholar] [CrossRef]
  25. The World Bank Group. Available online: https://data.worldbank.org/indicator/SP.POP.TOTL?locations=CN (accessed on 19 June 2022).
  26. IFA. Fertilizer Consumption. Available online: https://www.ifastat.org/ (accessed on 28 April 2022).
  27. Warner, J.X.; Dickerson, R.R.; Wei, Z.; Strow, L.L.; Wang, Y.; Liang, Q. Increased atmospheric ammonia over the world’s major agricultural areas detected from space. Geophys. Res. Lett. 2017, 44, 2875–2884. [Google Scholar] [CrossRef]
  28. Liu, M.; Huang, X.; Song, Y.; Xu, T.; Wang, S.; Wu, Z.; Hu, M.; Zhang, L.; Zhang, Q.; Pan, Y.; et al. Rapid SO2 emission reductions significantly increase tropospheric ammonia concentrations over the North China Plain. Atmos. Chem. Phys. 2018, 18, 17933–17943. [Google Scholar] [CrossRef]
  29. Gu, B.; Zhang, L.; Dingenen, R.V.; Vieno, M.; Grinsven, H.J.V.; Zhang, X.; Zhang, S.; Chen, Y.; Wang, S.; Ren, C.; et al. Abating ammonia is more cost-effective than nitrogen oxides for mitigating PM2.5 air pollution. Science 2021, 374, 758–762. [Google Scholar] [CrossRef]
  30. Meng, F.; Zhang, Y.; Kang, J.; Heal, M.R.; Reis, S.; Wang, M.; Liu, L.; Wang, K.; Yu, S.; Li, P.; et al. Trends in secondary inorganic aerosol pollution in China and its responses to emission controls of precursors in wintertime. Atmos. Chem. Phys. 2022, 22, 6291–6308. [Google Scholar] [CrossRef]
  31. Backes, A.M.; Aulinger, A.; Bieser, J.; Matthias, V.; Quante, M. Ammonia emissions in Europe, part II: How ammonia emission abatement strategies affect secondary aerosols. Atmos. Environ. 2016, 126, 153–161. [Google Scholar] [CrossRef]
  32. Yan, X.; Akimoto, H.; Ohara, T. Estimation of nitrous oxide, nitric oxide and ammonia emissions from croplands in East, Southeast and South Asia. Glob. Change Bilo. 2003, 9, 1080–1096. [Google Scholar] [CrossRef]
  33. Zhao, B.; Wang, S.; Wang, J.; Fu, J.S.; Liu, T.; Xu, J.; Fu, X.; Hao, J. Impact of national NOx and SO2 control policies on particulate matter pollution in China. Atmos. Environ. 2013, 77, 453–463. [Google Scholar] [CrossRef]
  34. Janssens-Maenhout, G.; Crippa, M.; Guizzardi, D.; Muntean, M.; Schaaf, E.; Dentener, F.; Bergamaschi, P.; Pagliari, V.; Olivier, J.G.J.; Peters, J.A.H.W.; et al. EDGAR v4.3.2 Global Atlas of the three major greenhouse gas emissions for the period 1970–2012. Earth Syst. Sci. Data 2019, 11, 959–1002. [Google Scholar] [CrossRef]
  35. Kurokawa, J.; Ohara, T.; Morikawa, T.; Hanayama, S.; Janssens-Maenhout, G.; Fukui, T.; Kawashima, K.; Akimoto, H. Emissions of air pollutants and greenhouse gases over Asian regions during 2000–2008: Regional Emission inventory in ASia (REAS) version 2. Atmos. Chem. Phys. 2013, 13, 11019–11058. [Google Scholar] [CrossRef]
  36. Streets, D.G.; Bond, T.C.; Carmichael, G.R.; Fernandes, S.D.; Fu, Q.; He, D.; Klimont, Z.; Nelson, S.M.; Tsai, N.Y.; Wang, M.Q.; et al. An inventory of gaseous and primary aerosol emissions in Asia in the year 2000. J. Geophys. Res.-Atmos. 2003, 108, 8809. [Google Scholar] [CrossRef]
  37. CSC (China State Council). Notice of the State Council on Issuing the Three-Year Action Plan for Winning the Blue Sky Defense Battle. 2018. Available online: http://www.gov.cn/zhengce/content/2018-07/03/content_5303158.htm (accessed on 17 May 2022).
  38. CSC (China State Council). Further Promoting the Nationwide Battle to Prevent and Control Pollution. 2021. Available online: http://www.gov.cn/zhengce/2021-11/07/content_5649656.htm (accessed on 17 May 2022).
  39. Kang, Y.; Liu, M.; Song, Y.; Huang, X.; Yao, H.; Cai, X.; Zhang, H.; Kang, L.; Liu, X.; Yan, X.; et al. High-resolution ammonia emissions inventories in China from 1980 to 2012. Atmos. Chem. Phys. 2016, 16, 2043–2058. [Google Scholar] [CrossRef]
  40. Adalibieke, W.; Zhan, X.; Cui, X.; Reis, S.; Winiwarter, W.; Zhou, F. Decoupling between ammonia emission and crop production in China due to policy interventions. Glob. Change Bilo. 2021, 27, 5877–5888. [Google Scholar] [CrossRef]
  41. Chen, Y.; Zhang, L.; Henze, D.K.; Zhao, Y.; Lu, X.; Winiwarter, W.; Guo, Y.; Liu, X.; Wen, Z.; Pan, Y.; et al. Interannual variation of reactive nitrogen emissions and their impacts on PM2.5 air pollution in China during 2005–2015. Environ. Res. Lett. 2021, 16, 125004. [Google Scholar] [CrossRef]
  42. Li, M.; Zhang, Q.; Kurokawa, J.-i.; Woo, J.-H.; He, K.; Lu, Z.; Ohara, T.; Song, Y.; Streets, D.G.; Carmichael, G.R.; et al. MIX: A mosaic Asian anthropogenic emission inventory under the international collaboration framework of the MICS-Asia and HTAP. Atmos. Chem. Phys. 2017, 17, 935–963. [Google Scholar] [CrossRef]
  43. Hoesly, R.M.; Smith, S.J.; Feng, L.; Klimont, Z.; Janssens-Maenhout, G.; Pitkanen, T.; Seibert, J.J.; Vu, L.; Andres, R.J.; Bolt, R.M.; et al. Historical (1750–2014) anthropogenic emissions of reactive gases and aerosols from the Community Emissions Data System (CEDS). Geosci. Model Dev. 2018, 11, 369–408. [Google Scholar] [CrossRef]
  44. McDuffie, E.E.; Smith, S.J.; O’Rourke, P.; Tibrewal, K.; Venkataraman, C.; Marais, E.A.; Zheng, B.; Crippa, M.; Brauer, M.; Martin, R.V. A global anthropogenic emission inventory of atmospheric pollutants from sector- and fuel-specific sources (1970–2017): An application of the Community Emissions Data System (CEDS). Earth Syst. Sci. Data 2020, 12, 3413–3442. [Google Scholar] [CrossRef]
  45. Emissions Database for Global Atmospheric Research (EDGAR) v6.1 Air Pollutants. Available online: https://edgar.jrc.ec.europa.eu/index.php/dataset_ap61 (accessed on 30 May 2022).
  46. Regional Emission Inventory in ASia (REAS). 2022. Available online: https://www.nies.go.jp/REAS/index.html#REASv3.2.1 (accessed on 31 May 2022).
  47. Kurokawa, J.; Ohara, T. Long-term historical trends in air pollutant emissions in Asia: Regional Emission inventory in ASia (REAS) version 3. Atmos. Chem. Phys. 2020, 20, 12761–12793. [Google Scholar] [CrossRef]
  48. Liu, X.; Sha, Z.; Song, Y.; Dong, H.; Pan, Y.; Gao, Z.; lI, Y.; Ma, L.; Dong, W.; Hu, C.; et al. China’s atmospheric ammonia emission characteristics, mitigation options and policy recommendations. Res. Environ. Sci. 2021, 34, 149–157. [Google Scholar]
  49. Zhang, X.; Wu, Y.; Liu, X.; Reis, S.; Jin, J.; Dragosits, U.; Van Damme, M.; Clarisse, L.; Whitburn, S.; Coheur, P.F.; et al. Ammonia emissions may be substantially underestimated in China. Environ. Sci. Technol. 2017, 51, 12089–12096. [Google Scholar] [CrossRef] [PubMed]
  50. Bouwman, A.F.; Boumans, L.J.M.; Batjes, N.H. Estimation of global NH3 volatilization loss from synthetic fertilizers and animal manure applied to arable lands and grasslands. Glob. Biogeochem. Cycles 2002, 16, 8-1–8-14. [Google Scholar] [CrossRef]
  51. Monfreda, C.; Ramankutty, N.; Foley, J.A. Farming the planet: 2. Geographic distribution of crop areas, yields, physiological types, and net primary production in the year 2000. Glob. Biogeochem. Cycles 2008, 22, GB1022. [Google Scholar] [CrossRef]
  52. EarthStat: University of Minnesota’s Institute on the Environment and the Ramankutty Lab at the University of British Columbia, V Harvested Area and Yield for 175 Crops Year 2000. Available online: http://www.earthstat.org/ (accessed on 25 December 2015).
  53. Friedl, M.; Sulla-Menashe, D. MCD12C1 MODIS/Terra+Aqua Land Cover Type Yearly L3 Global 0.05Deg CMG V006. Available online: https://doi.org/10.5067/MODIS/MCD12C1.006. [CrossRef]
  54. Sacks, W.J.; Deryng, D.; Foley, J.A.; Ramankutty, N. Crop planting dates: An analysis of global patterns. Glob. Ecol. Biogeogr. 2010, 19, 607–620. [Google Scholar] [CrossRef]
  55. National Bureau of Statistics (NBSC). China Rural Statistical Yearbook, 2006–2021. Available online: https://ghdx.healthdata.org/organizations/national-bureau-statistics-china (accessed on 6 July 2022).
  56. Søgaard, H.T.; Sommer, S.G.; Hutchings, N.J.; Huijsmans, J.F.M.; Bussink, D.W.; Nicholson, F. Ammonia volatilization from field-applied animal slurry—The ALFAM model. Atmos. Environ. 2002, 36, 3309–3319. [Google Scholar] [CrossRef]
  57. Gyldenkærne, S.; Ambelas Skjøth, C.; Hertel, O.; Ellermann, T. A dynamical ammonia emission parameterization for use in air pollution models. J. Geophys. Res.-Atmos. 2005, 110, 1275–1287. [Google Scholar] [CrossRef]
  58. Poggio, L.; de Sousa, L.M.; Batjes, N.H.; Heuvelink, G.B.M.; Kempen, B.; Ribeiro, E.; Rossiter, D. SoilGrids 2.0: Producing soil information for the globe with quantified spatial uncertainty. Soil 2021, 7, 217–240. [Google Scholar] [CrossRef]
  59. International Soil Reference and Information Centre(ISRIC)—World Soil Information, SoilGrids. Available online: https://files.isric.org/soilgrids/ (accessed on 20 May 2022).
  60. Muñoz Sabater, J. ERA5-Land Monthly Averaged Data from 1981 to Present. Available online: https://cds.climate.copernicus.eu (accessed on 10 April 2022).
  61. Li, B.; Chen, L.; Shen, W.; Jin, J.; Wang, T.; Wang, P.; Yang, Y.; Liao, H. Improved gridded ammonia emission inventory in China. Atmos. Chem. Phys. 2021, 21, 15883–15900. [Google Scholar] [CrossRef]
  62. Zhu, Z.L.; Cai, G.X.; Simpson, J.R.; Zhang, S.L.; Chen, D.L.; Jackson, A.V.; Freney, J.R. Processes of nitrogen loss from fertilizers applied to flooded rice fields on a calcareous soil in north-central China. Fertil. Res. 1989, 18, 101–115. [Google Scholar] [CrossRef]
  63. Cai, G.X.; Zhu, Z.L.; Zhu, Z.W.; Trevitt, A.C.F.; Freney, J.R.; Simpsom, J.R. The research of nitrogen losses from ammonium bicarbonate and urea in rice paddy field. Soils 1985, 17, 225–256. [Google Scholar]
  64. Zhu, Z.L.; Cai, G.X.; Xu, Y.H.; Zhang, S.L. Ammonia volatilization and its significance to the losses of fertilizer nitrogen applied to paddy soil. Acta Pedol. Sin. 1985, 22, 321–328. [Google Scholar]
  65. Zhao, Z.D.; Zhang, J.S.; Ren, S.R.; Zhou, Y.M. The Nitrogen balance of crop field soil in north area of China. Acta Pedol. Sin. 1988, 3, 67–72. [Google Scholar]
  66. Dong, W.X.; Xin, J.; Wang, S.X. Temporal and spatial distribution of anthropogenic ammonia emissions in China: 1994–2006. Environ. Sci. 2010, 31, 1457–1463. [Google Scholar]
  67. MARA (Ministry of Agriculture and Rural Affairs). Implementation Plan for Soil Testing and Formulation Fertilization for 10 Million Farms. 2005. Available online: http://www.moa.gov.cn/nybgb/2005/dliuq/201806/t20180618_6152460.htm (accessed on 23 May 2022).
  68. Fu, X.; Wang, S.; Xing, J.; Zhang, X.; Wang, T.; Hao, J. Increasing ammonia concentrations reduce the effectiveness of particle pollution control achieved via SO2 and NOx emissions reduction in East China. Environ. Sci. Technol. Lett. 2017, 4, 221–227. [Google Scholar] [CrossRef]
  69. The Multi-Resolution Emission Inventory for China (MEIC). Available online: http://meicmodel.org/ (accessed on 7 June 2022).
  70. Zheng, B.; Tong, D.; Li, M.; Liu, F.; Hong, C.; Geng, G.; Li, H.; Li, X.; Peng, L.; Qi, J.; et al. Trends in China’s anthropogenic emissions since 2010 as the consequence of clean air actions. Atmos. Chem. Phys. 2018, 18, 14095–14111. [Google Scholar] [CrossRef]
  71. Olivier, J.G.J.; Bouwman, A.F.; Van der Hoek, K.W.; Berdowski, J.J.M. Global air emission inventories for anthropogenic sources of NOx, NH3 and N2O in 1990. Environ. Pollut. 1998, 102, 135–148. [Google Scholar] [CrossRef]
  72. Beusen, A.H.W.; Bouwman, A.F.; Heuberger, P.S.C.; Van Drecht, G.; Van Der Hoek, K.W. Bottom-up uncertainty estimates of global ammonia emissions from global agricultural production systems. Atmos. Environ. 2008, 42, 6067–6077. [Google Scholar] [CrossRef]
  73. Wu, Z.; Yang, Y.; Zhou, Z.; Ni, X.; Yu, L.; Lu, H.; Liu, B.; Wu, Y.; Wang, Y. Effects of adding proportions of functional absorption materials on performance of new slow-release urea. Chin. J. Eco-Agric. 2017, 25, 740–748. [Google Scholar]
  74. Wang, W.; Dong, W.; Chen, S.; Li, J.; Chen, T.; Hu, C. Effect of continuously appling controlled-release fertilizers on nitrogen balance and utilization in winter wheat-summer maize cropping system. Trans. Chin. Soc. Agric. Eng. 2016, 32, 135–141. [Google Scholar]
  75. An, W.; Sun, Y.; Li, Z.; Wang, J.; Zou, G.; Yang, J. Effects of different slow/controlled release fertilizers on yield, quality of fresh maize and ammonia emissions. Chin. J. Appl. Ecol. 2020, 31, 2422–2430. [Google Scholar]
  76. Hu, M.; Dong, W.; Wang, W.; Gaudel, G.; Mosongo, P.; Hu, C. The effects of deep application of nitrogen fertilization on ammonia volatilization in a winter wheat/summer maize rotation system in the North China Plain. Chin. J. Eco-Agric. 2020, 28, 1880–1889. [Google Scholar]
Figure 1. Interannual variation in (a) synthetic nitrogen fertilizer application and (b) resulting NH3 emissions in China from 2005–2020; synthetic nitrogen fertilizer is categorized as urea (blue bars), ABC (ammonium bicarbonate, purple bars), Comp. (compound fertilizer, including NK—nitrogen + potassium, NP—nitrogen + phosphorus and NPK—nitrogen + phosphorus +potassium, red bars) and other (AS—ammonium sulfate, AN—ammonium nitrate, and others, yellow bars).
Atmosphere 13 01297 g001
Figure 2. Interannual variation in (a) synthetic nitrogen fertilizer application and (b) resulting NH3 emissions in China from 2005–2020; synthetic nitrogen fertilizer is categorized as urea (blue bars), ABC (purple bars), Comp. (red bars) and other (yellow bars), each bar shows the absolute change in that year relative to 2005 (Tg N year−1 or Tg NH3 year−1, left y-axis), the black line shows the total relative change (%, right y-axis).
Atmosphere 13 01297 g002
Figure 3. Spatial distribution of synthetic nitrogen fertilizer application in 2005 (first column) and changes in 2010, 2015 and 2020 (second, third and fourth column) compared to 2005 over China in total (first row), basal dressing (at planting, typically through injection, second row) and top dressing (at growth, typically through broadcast, third row), the national total values of the plot are embedded in the left corner. The numbers in the first column represent the total nitrogen fertilizer application in 2005, and the numbers in the second to the fourth column represent the total change in that year compared with 2005.
Atmosphere 13 01297 g003
Figure 4. Spatial distribution of NH3 emissions from synthetic nitrogen fertilizer application in 2005 (first column) and changes in 2010, 2015 and 2020 (second, third and fourth column) compared to 2005 over China in total (first row), basal dressing (at planting, typically through injection, second row) and top dressing (at growth, typically through broadcast, third row), the national total values of the plot are embedded in the left corner. The numbers in the first column represent the total NH3 emissions from nitrogen fertilizer application in 2005, and the numbers in the second to the fourth column represent the total change in that year compared with 2005.
Atmosphere 13 01297 g004
Figure 5. The relative changes of (a) synthetic nitrogen fertilizer application and (b) resulting NH3 emissions in western China (bold red line), eastern China (bold blue line), FWP (Fengwei Plain, light green line), SCB (Sichuan Basin, dark green line), PRD (Pearl River Delta, orange line), YRD (Yangtze River Delta, yellow line) and BTH (Beijing–Tianjin–Hebei, purple line) from 2005 to 2020 with 2005 as a base year. The black dashed lines are zero lines.
Atmosphere 13 01297 g005
Figure 6. Monthly variations of (a) synthetic nitrogen fertilizer and (b) resulting NH3 emissions from 2005 to 2020 in China.
Atmosphere 13 01297 g006
Figure 7. Daily variations of synthetic nitrogen fertilizer application for 18 crops and 3 groups in China.
Atmosphere 13 01297 g007
Figure 8. Inter-annual variations of synthetic nitrogen fertilizer application (right y-axis; dashed lines) and NH3 emissions from fertilizer application (left y-axis; solid lines) from different inventories in China.
Atmosphere 13 01297 g008
Publisher’s Note: MDPI stays neutral with regard to jurisdictional claims in published maps and institutional affiliations.

