Abstract
Currently, there are more Global Navigation Satellite System (GNSS) signals available for civilians. Many types of GNSS receivers have been updated and several new receivers have been developed for new signals. To know about the performance of these signals and receivers and their stochastic model for data processing, in this study, the data quality of all GNSS signals, especially the new signals are analyzed, and two modified stochastic models with observation noise statistics (STA) and post-fit residuals (RES) are formed. The results show that for all the new signals, the corresponding carrier phase noise is at the same level as other old signals. The pseudorange noise of B2a, L5, E5a, and E5b is within 4 cm and significantly smaller than other signals for receivers without a smooth algorithm, and the multipath error of these signals is about 0.1 m which is also better than other signals. For B1C, the pseudorange multipath error is about 0.4 m, which is close to L1 and E1. Stochastic models are validated for precise orbit determination (POD). Compared with the empirical stochastic model (EMP), both modified models are helpful to reduce the mean unit weight square error and obtain high accuracy orbits with reduced iteration. The 3D orbit accuracy improvement can reach 0.27 cm (7%) for the STA model, and 0.40 cm (10%) for the RES model when compared with the final products from the international GNSS service (IGS). For BDS-3 POD by using B1C and B2a observations, the improvements in the 3D orbit consistency of two adjacent three-day solutions are 0.21 cm (3%) for the STA model and 0.29 cm (4%) for the RES model. In addition, the STA model based on the observation noise of globally distributed stations is less affected by stations with problematic observations and with reduced computation burden.
1. Introduction
The GPS modernization and newly emerging GNSS systems such as Galileo and BDS allow civilians to access signals from multiple frequencies in the L-band spectrum []. For tracking all the navigation signals of GPS, GLONASS, Galileo, and BDS, especially the new signals, many types of GNSS receivers have been updated and several new receivers have been developed with multi-system, multi-frequency designs. To understand the quality of all the signals and to optimize the stochastic model of observations for obtaining more reliable and accurate GNSS products, a comprehensive study on the characteristics of the signals is definitely necessary.
The results from ultrashort and zero-length baselines indicate that stochastic models are affected by both observation and receiver brands []. The error of observation includes receiver internal error and external error. The internal error is related to receiver and antenna hardware properties, signal strength, tracking loop characteristics and signal receiving and processing software []. The precision is also different between signals. The precision of BDS-2 carrier phase and pseudorange measurements analyzed by single-differenced (SD) residuals of zero baseline is about 0.5 mm and 11 cm for B1 and 0.3 mm and 5 cm for B2, which is at the same level as GPS []. The external error is related to the environment and multipath represents the major error source. Previous studies showed that the pseudorange multipath is related to signals, systems, and receivers [,,]. The achieved GPS/GIOVE tracking performance analysis shows that the Javad Triumph Delta receivers have a particularly high level of multipath mitigation achieved with the proprietary correlator design []. The stochastic model is governed by both the internal errors of the receiver and external errors at the site.
Careful weighting of the phase observations is needed because of different noise and systematic errors, especially for low elevation data []. The simplest weighting scheme assigns an identical weight to all observations. Due to the unrealistic assumptions of uncorrelatedness and homoscedasticity, this simplified stochastic model is inadequate for high-precision applications. The commonly applied stochastic model for phase observations, other than a scaled identity matrix, uses the satellite elevation angle as an indicator for observation quality []. In addition, different receivers have different capabilities for resisting external errors []. The measured carrier-to-noise-power-density ratio (C/N0) and the residuals of the double differenced phase observations have proven to be tools for the estimation of the random errors of the phase observables []. The data quality indicator can be used to modify the stochastic model. Based on the existing software and methods, we developed a new data quality analysis software, which can be used to analyze the data quality of all signals and formats in multi-constellation in terms of observation noise, multipath and cycle slips [,,].
This paper assesses the data quality of all available signals and different receivers, especially for new signals and new types of receivers. These signals with overlapping frequencies from different systems are also compared. The quality of measurement from three Chinese manufacturers and four types of widely used receivers is analyzed here including observation noise, multipath error, and residuals in POD. Based on the analysis of observation noise and post-fit residuals of POD, two modified stochastic models are formed to enhance the commonly used elevation-dependent model. Furthermore, the improvement of stochastic models on POD is analyzed.
2. Methods
To assess the data quality of different receivers, we analyzed the observation noise and multipath error. The processing strategy of observation noise and multipath, as well as a stochastic model for POD, are listed and discussed in this section.
2.1. Observation Noise
GNSS observation noise includes ranging error caused by the random deviation between channels of GNSS receiver, random deviation of Phase Locked Loop (PLL) and code tracking loop, as well as errors from troposphere, ionosphere, and multipath effects. Observation noise is one of the key performance indicators of receivers.
At present, there are many methods for calculating observation noise. The triple-differenced measurement between consecutive epochs can be used to evaluate the noise of observation []:
where is the measurement of carrier-phase or pseudorange; , and are single, double, and triple-differenced measurements of consecutive epochs. Assuming that the measurements are nearly independent between epochs, the observation noise can be calculated by:
where is the number of triple-differenced measurements. The mean observation noise of all satellites is regarded as the observation noise of each signal.
Another way of assessing the observation noise is polynomial fitting. We first divide the observation into segments of seconds. Secondly, polynomial fitting is used to obtain the theoretical values of each epoch, and the difference between theoretical values and observations is calculated. Next, the difference of all arcs within one day is calculated and outliers are detected. Then, the standard deviation (STD) of each satellite is calculated. Finally, the mean value of all satellites is regarded as the observation noise of each signal.
Both of the methods to calculate the observation noise are based on the fact that the orbit of the satellite is a smooth curve. The shorter the sampling interval, the more accurate noise can be obtained because of the smaller influence of other errors. Therefore, 1-s sampling rate data is generally used to analyze the observation noise.
2.2. Pseudoranges Multipath
The multipath error is caused by non-line-of-sight (between the satellite and the receiver) signal propagation. The received signals are the superposition of the direct and the reflected signals, and the interference superposition of the two signals results in an additional time delay []. Multipath is individual for each station and may be amplified when forming the combination. Multipath propagation is a major source of degradation in the performance of conventional pseudorandom noise code tracking loops. There are four broad categories of multipath mitigation techniques: antenna placement, antenna type, receiver type, and measurement post-processing.
The multipath error of carrier phase measurements is about 1/4 of the wavelength or less, which is much smaller than the multipath of pseudorange measurements. On the other hand, it is impossible to separate the multipath error of a single frequency carrier phase measurement. Therefore, the main focus is pseudorange multipath at present. The linear combination of single-frequency code and dual-frequency phase observations was used to compute the multipath error for pseudoranges P1 (MP1) and P2 (MP2) [],
where , are the frequency, is ratio between the squared frequencies of L1 and L2, i.e., ; , are pseudorange observations; , are carrier phase observations; , are wavelengths of L1 and L2; , are the terms that arise from phase ambiguities. , contains the pseudorange multipath , , carrier phase multipath , , observation noise and integer ambiguity information of L1 and L2. The multipath error on phase and the noise of phase are much smaller when compared to pseudorange multipath. The observation noise is also relatively small. The multipath error can be obtained by
For the same satellite, the ambiguity of the combination will not change in the case of continuous observation, so the ambiguity can be removed by computing the mean value of the multipath combination series in the period. is the number of epochs in the period, the default value of is 50 (25 min).
2.3. Stochastic Model for POD
Observations at lower elevation angles suffer more strongly from atmospheric and multipath effects, and hence are noisier than those at higher elevation angles []. Therefore, the elevation-dependent model is used for low satellite elevation angles ():
where is the a priori variance factor; is the elevation of the satellite. The commonly applied variance model for phase observations assigns an empirical to all stations (EMP model). However, in the practice of data analysis, the data quality is different for different stations. Therefore, the elevation-dependent model is taken as the original model and jointly used with the observation noise and residual information in POD to enhance the elevation-dependent model.
For the statistical noise-based stochastic model STA, the σ0 can be determined depending on the receiver and observation types. Triple-differenced measurement between consecutive epochs in Section 4.2. provides the observation noise of each signal. According to the error propagation law, the ionospheric-free (IF) combination observation noise of each station can be calculated, that is the σ0 of the STA model in Equation (6). For these stations without observation noise results, the means of other stations with the same type of receiver are used. The STA model incorporates frequency-dependent signal quality into the observation weighting procedure.
The residual-based stochastic model RES is carried out based on the residuals obtained from a least square evaluation. Since the post-fit residual is a key indicator of the accuracy or precision of observations and their modeling the residual-based stochastic model RES is carried out based on the residuals obtained from a least square evaluation. The basic assumption is that the least square residuals represent the same statistical properties as the true errors if the observation period is long enough to remove all systematic effects []. The IF combination residual of each station-satellite pair can be obtained from a least square evaluation. The σ0 of each station is acquired by averaging the residuals of all satellites. RES model will be updated with the residuals of stations after every iteration. The process flow of the POD based on three stochastic models is shown in Figure 1.
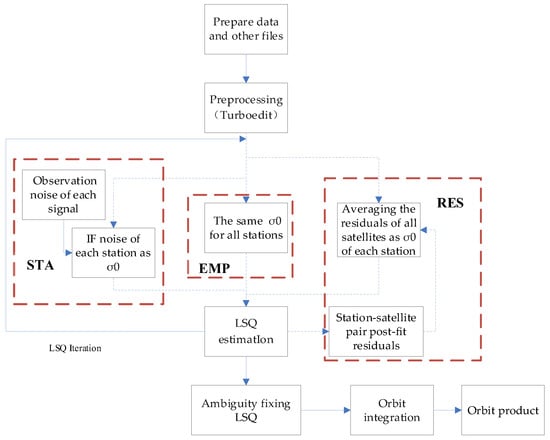
Figure 1.
Process flow of the POD based on three stochastic models.
3. Datasets and Processing Strategy
To achieve interoperability with other systems, BDS and Galileo use the same frequency and similar bandwidth as GPS. Table 1 shows the existing civilian navigation signals of GPS, BDS, and Galileo. The frequencies of BDS-3 new B1C/B2a signals overlap with L1/L5 and E1/E5a. At present, the signals broadcast by BDS-3 satellites also retained the existing signals of BDS-2 to achieve a smooth transition from BDS-2 to BDS-3. For GLONASS, the frequency of G1 is 1602 + k × 9/16 MHz and the frequency of G2 is 1246 + k × 7/16, k = −7…12, where k is the integer frequency number for GLONASS.

Table 1.
Frequency and band of GPS, BDS and Galileo.
Observations from three Chinese GNSS equipment manufacturers were collected, i.e., Beijing Unicore Communications Incorporation as well as the 54th and 20th Research Institute of China Electronics Technology Group Corporation (CETC-54, CETC-20), all of them are multi-frequency and multi-constellation receivers which can offer joint GPS, GLONASS, Galileo, BDS-2 (B1/B2/B3) and BDS-3 (B1I/B3I/B1C/B2a) tracking. Furthermore, four types of receivers widely used in the Multi-GNSS Experiment (MGEX) stations are also analyzed. All 32 stations provide 1-s sampling rate data and are equipped with external high precise atomic clocks except Unicore receivers. The distribution of tracking stations is shown in Figure 2. The information of receivers is listed in Table 2.
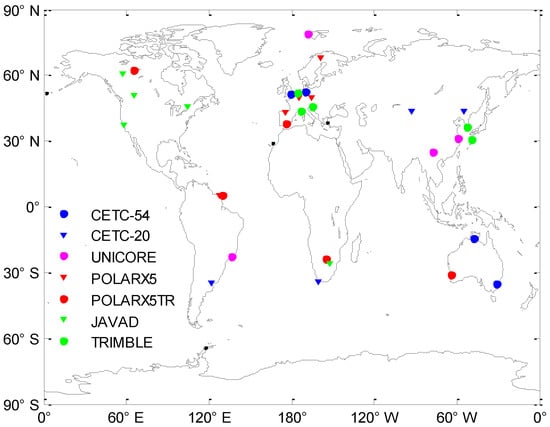
Figure 2.
Distribution of iGMAS and MGEX stations used for analysis.

Table 2.
Information of receivers.
The POD processing strategy is shown in Table 3. In this study, the observation of GPS L1/L2 and BDS B1C/B2a of 24 international GNSS Monitoring and Assessment System (iGMAS) stations and 130 MGEX stations were exploited for POD. Among these, 90 stations provide BDS-3 B1C and B2a observations. Weekly IGS and iGMAS solutions were used as a priori values to tightly constrain the station coordinates. The full set of BDS-3 satellite- and frequency-specific phase center offsets (PCOs) from the spacecraft manufacturers were informally provided by the Test and Assessment Research Center of the China Satellite Navigation Office (CSNO-TARC). The BDS satellite antenna phase center variations (PCVs) were fixed to zero. The PCOs and PCVs of the GPS satellite were fixed to igs14.atx values. Thereby, the scale factor of the ground station network was aligned to that of the IGS14 frame. BDS frequencies receiver antenna calibrations have been available in igsR3_2077.atx []. The Saastamoinen model and global mapping function (GMF) were used to estimate zenith troposphere delay (ZTD) in this contribution. The interval of ZTD was estimated by piecewise constant (PWC), with a 1-h interval, while the interval of horizontal gradient was 12 h []. The estimated GPS orbits and clocks are compared to the final GPS products provided by IGS on the same day. The orbit consistency of two adjacent three-day solutions over the overlapping time serves as an indicator to assess the quality of BDS-3 satellite orbits.

Table 3.
The strategy of GPS/BDS-3 POD.
4. Data Quality Analysis
4.1. Comparison of Methods in Analyzing Observation Noise
In this section, the observation noise is analyzed with two methods, namely the triple-differenced measurement between consecutive epochs (TDE) and polynomial fitting. As a case study, 1-s sampling rate data at HARB on DOY 030,2021 are analyzed to compare these two methods. For the polynomial fitting, the fitting window of 60 s, 30 s, and 10 s are used separately. The results of carrier phase noise are unreasonable when the time length is increased to 60 s for quadratic polynomial fitting because the variation of the distance between the satellite and the receiver with time does not conform to the quadratic polynomial, so cubic polynomial fitting is selected. Figure 3a,b show the pseudorange and carrier-phase fitting residuals of different time lengths (60 s, 30 s, 10 s). With the increase in time length, the noise distribution is more dispersed. The polynomial fitting method is under the hypothesis that the variation of the distance between the satellite and the station were all cubic forms. In fact, the variation is more complex, and the difference between the two will become larger as the fitting arc length increases. The noise varies significantly at low elevation angles for all methods. Figure 3c,d show the result of triple-differenced carrier-phase and pseudorange measurement, the result is the same as the first method that the observation noise variations increase as the satellite elevation angle decrease.
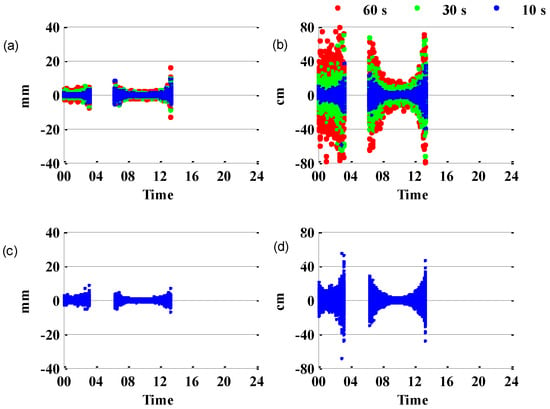
Figure 3.
Observation noise on B1I for C21 at HARB for one day. Carrier-phase and pseudorange residuals calculated by the polynomial fitting of different time lengths are shown in (a,b). Triple-differenced carrier-phase and pseudorange measurements are shown in (c,d).
Table 4 summarizes the observation noise on all 12 signals calculated by different methods. It can be seen that the noise calculated with polynomial fitting is very dependent on the length of the fitting window from Figure 3 and Table 3. With few exceptions, the noise calculated by triple-differenced measurement is close to the noise calculated by cubic polynomial fitting when the time length is 10 s for both pseudorange and carrier phase. The difference between the two methods is smaller than 0.1 mm for carrier phase noise. For pseudorange noise, the polynomial fitting result is 0.5 to 1 cm smaller than the other method for most signals. The carrier phase noise of GLONASS signals calculated by polynomial fitting is larger than other signals. Analysis results of other stations and other periods are consistent with this result.

Table 4.
Pseudorange and carrier-phase noise at HARB calculated by different methods. The second column is the fitting duration for the polynomial fitting method.
The two methods are essentially the same and based on that the orbit of the satellite in space is a smooth curve. The change in the distance from the satellite to the receiver is also smooth and regular. The observation noise and cycle slip will change this regularity, so the above two methods can be used to detect cycle slip. Although the fitting method is more intuitive, the selection of the fitting arc segment is a problem. It is more convenient and reasonable to assess the observation noise by triple-differenced measurement.
4.2. Observation Noise Assessment
To analyze the observation noise, 1-s sampling rate data of stations list in Figure 2 from DOY 001, 2021 to 080, 2021 are processed. Figure 4 shows the pseudorange and carrier-phase noise of all stations and all signals.
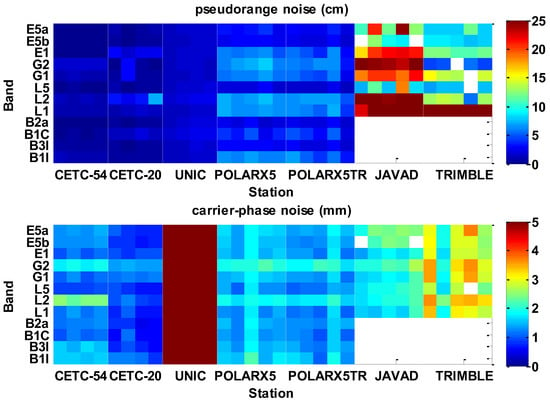
Figure 4.
Mean pseudorange and carrier-phase noise of stations analyzed by triple-differenced method for 80 days. Different types of receivers are separated by white lines.
It can be seen from Figure 4 that the observation noise of receivers from the same manufacturer is very similar for the same signal, but the difference in noise between different types of receivers is large. It shows that the observation noise is related to receiver types.
The receiver’s clock has a serious impact on the data quality, especially the phase noise. As shown in Equation (1), all differences are between epochs and therefore the receiver clocks are not eliminated. Therefore, the receiver clock corrections of the stations from IGS and iGMAS final products are analyzed. The results show that the average daily fitting accuracy is 450–750 ns for the Unicore receiver with an internal clock. For the stations with external atomic clocks, the fitting accuracy is on the ns scale. Most GNSS receivers use crystal oscillator, which is not as stable as atomic clocks. Assuming that the short-term stability of the internal clock of a receiver is 5 × 10⁻¹⁰, the influence of the receiver clock on the observation of L1 (1.57542 × 10⁹ Hz) is 5 × 10−10 × 1.5754 × 109 = 0.7877 cycle. The stability of the atomic clock is generally above 10−13, which indicates that the influence of the clock errors on phase noise is small on the stations with external atomic clocks. The phase noise of the Unicore receivers is much greater than the above three types of receivers, which is caused by the internal clocks.
Table 5 summarizes the mean pseudorange and carrier-phase noise of all receivers from different manufacturers listed in Table 2. For pseudorange, the noise of the first three receivers in Table 4 is much better than that of the normal value because of the inner pseudorange smooth algorithm. The pseudorange noise of the two types of SEPTENTRIO receivers is all within 7 cm. The pseudorange noise of TRIMBLE receivers is larger than SEPTENTRIO receivers but smaller than JAVAD receivers. For carrier-phase, the noise of CETC-54, CETC-20, and Septentrio receivers are within 2 mm for most signals, in which the smallest is CETC-20 receivers and the carrier phase noise of TRIMBLE receivers is larger than the others.

Table 5.
Mean pseudorange and carrier-phase noise of receivers from 7 manufacturers analyzed by triple-differenced method.
4.3. Zero Baseline Analysis
The above analysis on observation noise is affected by the antenna and the surrounding environment. To further analyze the internal observation noise and verify the above results, zero baseline data of four types of receivers are analyzed. From previous work, it was clear that the suitable measurement to assess the intrinsic noise characteristics of GNSS receivers is the zero baseline in which two receivers of the same type are connected to the same antenna.
For a zero baseline, taking the between receiver single difference (SD) can eliminate the multipath errors, and the antenna hardware delays are removed. Subtracting the measurements to one reference satellite from the measurements to all other satellites removes the receiver clocks. By taking the between satellite difference and the between receiver difference the double differences (DD) are formed. This leaves the DD phase ambiguity and the DD observation noise only. In the difference between the DD observations of two epochs also called triple difference (TD), the phase ambiguity is eliminated []. TD zero baseline observations can be used to analyze the receiver-specific internal error.
Zero baseline data were collected on DOY 070,2019, including four pairs of receivers from four manufacturers. Table 6 shows the zero baseline noise of these receivers. The zero baseline results are smaller than the triple-differenced method. Compared with the result in Table 5, the external errors from the antenna and the surrounding environment are completely eliminated and only the receiver internal errors remain. However, the pseudorange noise of the first three receivers is bigger than in Table 4 because the inner pseudorange smooth algorithm has more influence on the triple-differenced method. There are significant differences in the performance of different types of receivers. Since the elimination of external errors for all types of receivers also implies that different receivers have different receiver-specific internal errors.

Table 6.
Zero baseline pseudorange (a, unit: cm) and carrier-phase (b, unit: mm) noise.
Some similar conclusions can be drawn from the analysis in Section 4.2 and Section 4.3. For GPS, the pseudo-range and carrier-phase noise of new signal L5 are better than that of L1 and L2 for most receivers. Moreover, for all TRIMBLE receivers, the pseudorange noise of L1 is much larger than other receivers as shown in Table 4 and Table 5. For Galileo, the pseudorange noise of E1 is larger than that of the other signals, but the carrier phase noise of E1, E5a, and E5b is very close. For GLONASS, except for TRIMBLE receivers, the pseudorange noise of G1 is close to G2. However, the carrier phase noise of G1 is smaller than G2. For BDS, the zero baseline result shows that the carrier phase noise of B1C and B2a is at the same level as that of B1I and B3I. But the triple-differenced result in Table 5 shows that the carrier phase noise of B1C and B2a is smaller than that of B1I and B3I. Such results mean that the carrier phase of new BDS signals (B1C and B2a) can better resist external errors.
For these signals with overlapping frequencies, the pseudorange noise of E5a is close to L5, and the pseudorange and carrier phase noise of other Galileo signals are smaller than that of GPS due to the new signal modulation. The carrier phase noise of Galileo is at the same level as BDS-3, but Galileo has smaller pseudorange noise.
Based on the analysis results of observation noise by the above two methods, the accuracy of observation is quite different with respect to receivers and signals, so it is reasonable to form a stochastic model based on the noise information of different receivers and signals.
4.4. The Pseudorange Multipath Error
The MP combinations are used to analyze the multipath error. For GPS and Galileo signals, the MP combinations are combined with L5 and E5a separately. For BDS signals, the MP combinations with different signals are compared. The result shows that the multipath error combined with B1C and B2a were compared, and the main difference is the result of B1I. The multipath error of B1I combined with B1C is larger than that combined with B2a due to the proximity of the B1I and B1C frequencies, the MP combination for these signals amplifies carrier phase errors by more than a factor of 100 and therefore B2a was chosen as the reference.
In this section, 30-s sampling rate data of stations listed in Figure 2 from DOY 001, 2021 to 080, 2021 were used for the multipath error assessment. The time series of the pseudorange multipath in each signal of all stations are shown in Figure 5. For the same signal, there is a high consistency between different receivers. For example, the pseudorange multipath of B2a, L5, E5a, and E5b is smaller than 0.3 m for all stations. The STD of multipath for most stations and signals is within 5 mm. It shows that for the same station, the multipath varies little on different days. Thus, besides the antenna and surrounding environment, the multipath error is greatly impacted by signals and receiver types. The internal working mechanism of receivers is implicated in the generation of multipath error.
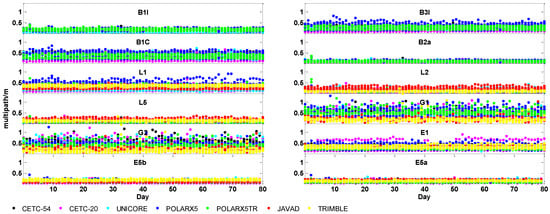
Figure 5.
Pseudorange multipath series of stations. Each subfigure represents the multipath of a signal.
Table 7 summarized the multipath error of receivers. For BDS, only the multipath error of BDS-3 satellites is calculated because they can receive both B1I/B3I and B1C/B2a signals. The multipath errors of B1I, B3I, and B2a are within 0.3 m but the multipath error of B1C is around 0.4 m, which might be caused by the lower signal power level of the B1C signal. The ability of depressing multipath grows in turns for B1C, B3I, B1I, and B2a. For GPS and Galileo, the multipath error of L1 is larger than L2 and L5, and the multipath error of E1 is larger than E5a and E5b. For these signals with overlapping frequencies, the figure also indicates that the differences of the multipath for L1/E1/B1C and L5/E5a/B2a signals are small. Their multipath errors are about 0.4 m and 0.1 m, respectively. Multipath errors of E5a (1176.45 MHz) and E5b (1207.14 MHZ) are very close for all receivers and vary in the range from 0.09 m to 0.15 m.

Table 7.
Mean pseudorange multipath of receivers from 4 manufacturers (unit: m).
The multipath error of CETC-20 receivers on four BDS signals is within 0.3 m and smaller than other receivers, whereas POLARX5TR receivers perform better than other receivers on Galileo signals. For GLONASS, JAVAD and TRIMBLE receivers perform much better than other receivers, and their multipath error is within 0.25 m. However, for other receivers, their multipath error is larger than 0.35 m on GLONASS signals. These results are consistent with that the analysis of other MGEX stations.
4.5. Post-Fit Residuals Analysis
The post-fit residual is a key indicator of the accuracy or precision of observations and their modeling []. Post-fit residuals may contain the observation noise, un-modeled tropospheric effects not covered by the estimated tropospheric parameters, and other un-modeled effects such as multipath, errors in antenna-phase center variations or satellite clocks. Data editing based on post-fit residuals can be used to detect any possibly problematic observations []. Therefore, the impact of different types of receivers on POD is analyzed from the ionospheric-free (IF) carrier-phase combination residuals. Observation models and dynamical models applied in POD are already listed in Table 3.
The RMS of the post-fit residuals of IF carrier-phase phase observations derived from the GPS POD are illustrated in Figure 6. For each receiver, the mean RMS and STD of the seven receiver types are shown for comparison: CETC-54(9), CETC-20(4), UNICORE(4), POLARX5(57), POLARX5TR(14), JAVAD(32), TRIMBLE(27). The number of stations is given in parentheses. Carrier-phase residuals ranges from 7 to 20 mm for most receivers and the differences among receivers are obvious. For different receivers, JAVAD receivers have larger residuals, with a mean STD of about 15 mm, which is more than twice the STD of other receivers. Carrier-phase residuals of TRIMBLE receivers are about 15 mm. The other five receivers are rather close and show smaller residuals of about 12 mm. The difference between the same type of receivers is most likely affected by the environment-related external errors of stations.
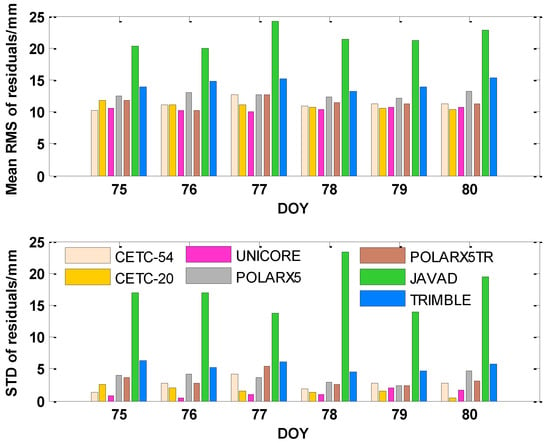
Figure 6.
Carrier phase residual RMS of each station-satellite pair derived from the GPS POD. The top panel is the mean residuals of receivers on different stations, and the bottom panel is their STD.
Similar to the result of observation noise in Section 4.2, carrier-phase residuals of CETC-54, CETC-20, POLARX5, and POLARX5TR receivers are at the same level and smaller than TRIMBLE and JAVAD receivers. It is noted that residuals are amplified by a factor of about three when forming the IF combination, compared to the single-frequency measurement. In addition, residuals are more affected by the environment-related external errors so that the value of the residual is larger than the observation noise.
5. The Modified Stochastic Model Validation on POD
A realistic stochastic model is very important for determining realistic variances, especially for real-time estimation []. For most GNSS software, only the elevation dependence of observation variances is implemented due to its simplicity and small computation burden. However, the elevation-dependent model does not consider the station-specific variance. Based on the above analysis, there is a direct correlation between the data quality and receivers and ignoring the correction will result in either overweighting or down weighting the observation. The stochastic model is governed by both the internal errors of the receiver and external errors at the station. Different receivers have different capabilities for resisting external errors []. Therefore, the observation noise and residual information can be used to enhance the stochastic model in POD.
The results of observation noise and orbit determination residual show that they have an obvious correlation with elevation angle. While the STA model uses the noise information from the data quality results, the residual-based stochastic model RES is carried out based on the residuals obtained from a least square evaluation. Compared with the STA model, the RES model has to read the residual of each station and update the weight after every iteration. Therefore, the STA model is more efficient and can be used for data processing more simply compared with the RES model.
Observation models and dynamical models listed in Table 3 are used for stochastic model comparison. To investigate the performance of the two modified stochastic models and commonly used elevation-dependent model EMP, these three stochastic models are used to estimate GPS orbits and clocks from DOY 075 2021 to DOY 080 2021. It is noted that all three models are based on the elevation-dependent model. The difference between the three models is the value of in Equation (6). The EMP model uses the same for all stations. The STA model uses the observation noise from the triple-differenced measurement between consecutive epochs. The RES model is carried out based on the residuals obtained from a least square evaluation. To obtain high-precision satellite orbit and clocks, the least square estimation needs to be solved iteratively. Therefore, the influence of stochastic models on POD is compared with three schemes of 3, 4, and 5 iterations, respectively.
The mean square error of unit weight can be used to effectively test the effect of the stochastic models. Table 8 shows the mean square error of unit weight of the first three iterations resulting from the POD with three stochastic models. Comparing the results between three stochastic models, it is obvious that the mean square error of unit weight of STA and RES models is smaller than the EMP model. For residuals, STA and RES models are slightly smaller than the EMP model, and the difference is less than 2 mm for most stations.

Table 8.
The GPS POD mean square error of unit weight with three stochastic models.
Figure 7 compares the priori variance factor in Equation (6) of all stations based on different stochastic models on DOY 078. It is noted that the is for the IF carrier-phase combination. For the EMP model, the value is 6.1 mm for all stations, and it is based on the assumption that the observation accuracy of both signals is 0.1 cycle. For the STA model, values range from 5 to 15 mm for most stations. The variation range is much larger on different stations for the RES model, and the large values of some stations may be caused by external errors.
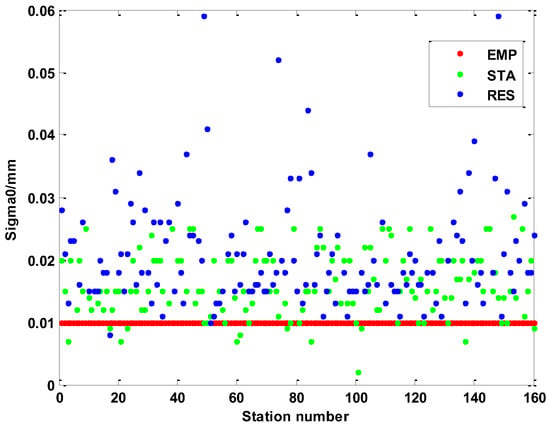
Figure 7.
The of stations based on different stochastic models.
The 3D RMS of the three stochastic models compared with the IGS final products is illustrated in Figure 8. The difference between the fourth and fifth iterations is within 0.1 cm, and the 3D RMS of the third iteration is larger. For different stochastic models, the STA and RES models bring almost no improvement on the fourth and fifth iterations compared with that of the EMP model. From this point of view, it can be concluded that the orbit qualities based on three stochastic models can all reach an accuracy of 3.5 cm when the number of iteration times is sufficient. It is clear that the orbit accuracy is different between different models on the third iteration, and STA and RES models bring improvement compared with that the EMP model.
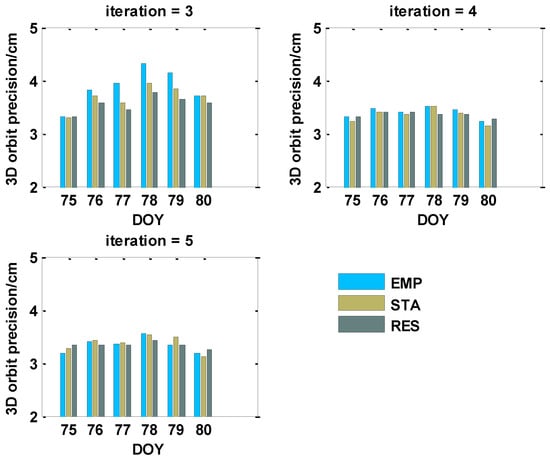
Figure 8.
3D-RMS for GPS satellites orbits estimated with three stochastic models.
By comparing the results of different days, the accuracy of orbit estimates benefits from the STA and RES models, and these two models bring significant improvement compared with that of the EMP model during the period between DOY 076 and DOY 079. The mean RMS in along-track, cross-track, and radial directions of the estimated GPS orbits of three stochastic models from DOY 076 and DOY 079 are presented in Table 9. For three stochastic models, the differences in three directions are within 0.5 mm on the fourth and fifth iterations for GPS. Therefore, the difference is only analyzed for the third iteration. Compared with the EMP model, the mean improvements of the STA model are about 0.26 cm, 0.11 cm, and 0.08 cm in along-track, cross-track, and radial directions, respectively. The improvements for the RES model are about 0.40 cm, 0.15 cm and 0.12 cm. The 3D RMS improvement are 0.27 cm (7%) and 0.40 cm (10%) for STA and RES models, respectively. The largest improvement occurs on DOY 078 and the EMP model has the largest RMS on that day. However, the improvement is modest on DOY 075 when the RMS of the EMP model is small. It can be concluded that compared to the EMP model, the two modified models can improve the orbit accuracy especially when the orbit is at a low accuracy level. The accuracy of the orbit is more stable by using the STA and RES models.

Table 9.
Orbit RMS with three stochastic models in along-track, cross-track, and radial directions (unit: cm).
The clock offset of the three stochastic models compared with the IGS final products. To remove the systematic biases of the clock offset overlap, the clock offset series were aligned to a reference satellite. The mean STD of the clock offset based on the three models is very similar with the average of 0.070 ns for the fourth and fifth iterations. The mean STD of the clock offset based on the EMP model is 0.078 ns for the third iteration. Compared with ELE, the mean STD of STA and RES models could be improved by 0.003 ns and 0.007 ns, respectively.
To further investigate the performance of modified models on BDS-3 POD, these three models were used to process orbits of 3 Inclined Geosynchronous Orbit (IGSO) satellites and 24 Medium Earth Orbit (MEO) satellites from DOY 075 2021 to DOY 080 2021. The observations of new signals B1C and B2a were used for POD. The overlap accuracy of the BDS-3 satellites by using three models is also shown in Table 9. Compared to the orbit overlap RMS of different iterations, the difference between the fourth and fifth iterations is very small, and the difference with the third iteration is larger. Two modified models bring almost no improvement on the fourth and fifth iterations compared with that of the EMP model. These results are similar to GPS POD. The accuracy of orbit estimates benefits from the STA and RES models, and mean improvements of the STA model are about 0.08 cm, 0.18 cm, and 0.17 cm in along-track, cross-track, and radial directions, respectively. The improvements for the RES model are about 0.15 cm, 0.23 cm and 0.14 cm. The 3D RMS improvement of BDS-3 orbit are 0.21 cm (3%) and 0.29 cm (4%) for STA and RES models, respectively. Compared to GPS POD, the improvement of BDS-3 POD is smaller.
From the analysis of stochastic models for POD, it was found that STA and RES both could improve the accuracy and stability of orbit with reduced iterations. The two modified models both are effective in mitigating error effects and can describe the observation more accurately. Compared to the STA model, the RES model can slightly improve the accuracy of the satellite orbit. However, when there are stations with bad data quality, the residuals of all stations may be too large to reflect the true accuracy of observations. The STA model can avoid this problem. In addition, the STA model based on the observation noise of globally distributed stations is with reduced computation burden.
6. Conclusions
With the observations of GNSS, the quality of measurements from receivers of three Chinese manufacturers at iGMAS networks and the other four types of receivers from MGEX networks are analyzed in terms of observation noise, pseudorange multipath, as well as the residuals in the POD. All signals of each system, especially the new signals are analyzed comprehensively with the data of 32 stations for 80 days. Based on the analysis of observation noise and orbit determination residuals, two modified stochastic models are formed for POD, and the influence on GPS and BDS-3 POD is validated.
The observation noise calculated by the triple-differenced measurement between consecutive epochs is close to the noise calculated by cubic polynomial fitting when the time length is 10 s. The noise from zero baseline observations is smaller than that of the triple-differenced method because zero baseline can better eliminate errors from the antenna and the surrounding environment.
The analysis of observation noise indicated that the performance of most receivers at iGMAS stations is comparable to the receivers widely used at MGEX stations. The performances of the observation noise for the same type of receivers are very consistent, and the noise is related to receiver types. For the pseudorange, the noise of all iGMAS and SEPTENTRIO receivers is within 7 cm and smaller than JAVAD and TRIMBLE receivers. For the carrier phase, the noise of most receivers is within 2 mm, and CETC-20 receivers perform better than others. For new signals, the pseudorange noise of E5a and E5b is close to L5 and is much smaller than L1, L2, and E1. The carrier phase noise of B1C, B2a, E5a, E5b, and L5 are all at the same level which is smaller than that of other signals.
The pseudorange multipath is related to signal and receiver. The analysis of pseudorange multipath of all receivers shows that the multipath error of CETC-20 receivers is within 0.3 m for all BDS signals and smaller than other stations, whereas POLARX5TR receivers perform better than other receivers for Galileo signals. The GLONASS multipath error of JAVAD and TRIMBLE receivers is within 0.25 m, which is smaller than other receivers. The pseudorange multipath is very consistent for these signals with overlapping frequencies. The multipath error of L1, E1, and B1C is about 0.4 m which is much larger than other signals of the same system. However, the multipath error of new B2a, E5a, E5b, and L5 is only about 0.1 m.
To verify the impact of different receivers on POD, the LC residuals of seven types of receivers are analyzed with a total of 147 tracking stations. The LC residuals of most JAVAD receivers are larger than others. The LC residuals of TRIMBLE receivers are about 15 mm, and the LC residuals are about 12 mm for the other five types of receivers.
Based on the analysis of observation noise and orbit determination residuals, two stochastic models are formed, and their influence on POD is analyzed. The mean square error of unit weight of the STA model based on observation noise and the RES model based on a post-fit residual is smaller than that of the traditional EMP model. It is demonstrated that the orbit qualities based on different stochastic models are at the same level when the number of iteration times is sufficient. However, compared with the EMP model, the STA model and RES model can efficiently obtain higher accuracy and more stable orbits with less iterations. The STA model can improve the GPS satellite orbit quality of about 0.15 cm, 0.08 cm, and 0.06 cm in along-track, cross-track and radial directions, and about 0.29 cm, 0.10 cm and 0.06 cm for the RES model, respectively. For BDS-3 POD by using B1C and B2a observations, the improvements are 0.08 cm, 0.18 cm, and 0.17 cm for the STA model, and 0.15 cm, 0.23 cm and 0.14 cm for the RES model. Compared to the STA model, the RES model can slightly improve the accuracy of the satellite orbit. However, the STA model is less affected by stations with problematic observations, and the simplicity and computational efficiency of the model also make it suitable for data processing, especially in real-time estimation.
Author Contributions
Conceptualization, C.H. and S.S.; methodology, C.H. and Z.W.; software, C.H.; validation, C.H., N.C. and Z.W.; investigation, S.S., N.C. and C.H.; data curation, Z.W.; writing—original draft preparation, C.H.; writing—review and editing, C.H., S.S. and N.C.; funding acquisition, S.S. All authors have read and agreed to the published version of the manuscript.
Funding
This research was funded by the National Natural Science Foundation of China, grant number 12073063.
Institutional Review Board Statement
Not applicable.
Informed Consent Statement
Not applicable.
Data Availability Statement
Not applicable.
Acknowledgments
The authors would like to express gratitude to iGMAS, IGS_MGEX. We acknowledge the support of the Shanghai Key Laboratory of Space Navigation and Positioning Techniques. We also acknowledge Maorong Ge for providing some helpful comments and suggestions.
Conflicts of Interest
The authors declare no conflict of interest.
References
- Bolla, P.; Borre, K. Performance analysis of dual-frequency receiver using combinations of GPS L1, L5, and L2 civil signals. J. Geod. 2018, 93, 437–447. [Google Scholar] [CrossRef]
- Li, B. Stochastic modeling of triple-frequency BeiDou signals: Estimation, assessment and impact analysis. J. Geod. 2016, 90, 593–610. [Google Scholar] [CrossRef]
- Luo, X. Mathematical Models for GPS Positioning. In GPS Stochastic Modelling: Signal Quality Measures and ARMA Processes; Luo, X., Ed.; Springer: Berlin/Heidelberg, Germany, 2013; pp. 55–116. [Google Scholar]
- Yang, Y.; Li, J.; Wang, A.; Xu, J.; He, H.; Guo, H.; Shen, J.; Dai, X. Preliminary assessment of the navigation and positioning performance of BeiDou regional navigation satellite system. Sci. China Earth Sci. 2013, 57, 144–152. [Google Scholar] [CrossRef]
- Wanninger, L.; Beer, S. BeiDou satellite-induced code pseudorange variations: Diagnosis and therapy. GPS Solut. 2014, 19, 639–648. [Google Scholar] [CrossRef] [Green Version]
- Lou, Y.; Gong, X.; Gu, S.; Zheng, F.; Feng, Y. Assessment of code bias variations of BDS triple-frequency signals and their impacts on ambiguity resolution for long baselines. GPS Solut. 2016, 21, 177–186. [Google Scholar] [CrossRef]
- Tu, R.; Zhang, R.; Fan, L.; Han, J.; Zhang, P.; Wang, X.; Hong, J.; Liu, J.; Lu, X. Real-time monitoring of the dynamic variation of satellite orbital maneuvers based on BDS observations. Measurement 2021, 168, 108331. [Google Scholar] [CrossRef]
- Montenbruck, O.; Hauschild, A.; Hessels, U. Characterization of GPS/GIOVE sensor stations in the CONGO network. GPS Solut. 2010, 15, 193–205. [Google Scholar] [CrossRef]
- Wieser, A.; Brunner, F.K. An extended weight model for GPS phase observations. Earth Planets Space 2000, 52, 777–782. [Google Scholar] [CrossRef] [Green Version]
- Estey, L.H.; Meertens, C.M. TEQC: The Multi-Purpose Toolkit for GPS/GLONASS Data. GPS Solut. 1999, 3, 42–49. [Google Scholar] [CrossRef]
- Kačmařík, M.; Douša, J.; Dick, G.; Zus, F.; Brenot, H.; Möller, G.; Pottiaux, E.; Kapłon, J.; Hordyniec, P.; Václavovic, P.; et al. Inter-technique validation of tropospheric slant total delays. Atmos. Meas. Tech. 2017, 10, 2183–2208. [Google Scholar] [CrossRef] [Green Version]
- Vaclavovic, P.; Dousa, J. G-Nut/Anubis: Open-Source Tool for Multi-GNSS Data Monitoring with a Multipath Detection for New Signals, Frequencies and Constellations. In Iag 150 Years; Rizos, C., Willis, P., Eds.; Springer International Publishing Ag: Cham, Switzerland, 2016; Volume 143, pp. 775–782. [Google Scholar]
- CSNO. Observation Data Quality Assessment Methods for BDS/GNSS Geodetic Receiver; China Satellite Navigation Office (China): Beijing, China, 2019; pp. 9–10. [Google Scholar]
- Pan, L.; Guo, F.; Ma, F. An Improved BDS Satellite-Induced Code Bias Correction Model Considering the Consistency of Multipath Combinations. Remote Sens. 2018, 10, 1189. [Google Scholar] [CrossRef] [Green Version]
- Zhang, X.; Wu, M.; Liu, W.; Li, X.; Yu, S.; Lu, C.; Wickert, J. Initial assessment of the COMPASS/BeiDou-3: New-generation navigation signals. J. Geod. 2017, 91, 1225–1240. [Google Scholar] [CrossRef]
- Xia, F.; Ye, S.; Chen, D.; Wu, J.; Wang, C.; Sun, W. Estimation of antenna phase center offsets for BeiDou IGSO and MEO satellites. GPS Solut. 2020, 24, 90. [Google Scholar] [CrossRef]
- Chen, Q.; Song, S.; Zhou, W. Accuracy Analysis of GNSS Hourly Ultra-Rapid Orbit and Clock Products from SHAO AC of iGMAS. Remote Sens. 2021, 13, 1022. [Google Scholar] [CrossRef]
- de Bakker, P.F.; van der Marel, H.; Tiberius, C.C.J.M. Geometry-free undifferenced, single and double differenced analysis of single frequency GPS, EGNOS and GIOVE-A/B measurements. GPS Solut. 2009, 13, 305–314. [Google Scholar] [CrossRef] [Green Version]
- He, L.; Ge, M.; Wang, J.; Wickert, J.; Schuh, H. Experimental study on the precise orbit determination of the BeiDou navigation satellite system. Sensors 2013, 13, 2911–2928. [Google Scholar] [CrossRef] [PubMed] [Green Version]
Publisher’s Note: MDPI stays neutral with regard to jurisdictional claims in published maps and institutional affiliations. |
© 2022 by the authors. Licensee MDPI, Basel, Switzerland. This article is an open access article distributed under the terms and conditions of the Creative Commons Attribution (CC BY) license (https://creativecommons.org/licenses/by/4.0/).