Article

Differences in Air and Sea Surface Temperatures in the Northern and Southern Part of the Adriatic Sea

by
Ognjen Bonacci
and
Adrijana Vrsalović
*
Faculty of Civil Engineering, Architecture and Geodesy, Split University, Matice Hrvatske 15, 21000 Split, Croatia
*
Author to whom correspondence should be addressed.
Atmosphere 2022, 13(7), 1158; https://doi.org/10.3390/atmos13071158
Submission received: 17 June 2022 / Revised: 8 July 2022 / Accepted: 20 July 2022 / Published: 21 July 2022
(This article belongs to the Special Issue Feature Papers in Atmosphere Science)

Abstract

:
The paper compares air and sea surface temperatures in recent years on two islands in the Adriatic Sea. The data measured at the climatological station Krk on the island of Krk and the main meteorological station Lastovo on the island of Lastovo are used. The island of Krk is located in the north of the Adriatic Sea and Lastovo in the south. Since a significant increase in air and sea surface temperatures has been observed over the last thirty years, the goal is to establish how they reflect at these two stations, 313 km apart. The goal of the analysis is to monitor the changes in these two islands to reduce the negative impacts they may cause. The analysis of sea temperatures showed that global warming has a greater impact in the northern Adriatic than in the southern Adriatic. Air and sea surface temperatures have a faster upward trend on Krk than on Lastovo. Similar to the Mediterranean Sea, a positive trend was observed in the Adriatic Sea for both sea surface temperature and air temperature.

1. Introduction

The total area of the Mediterranean Sea is 2.5 × 10⁶ km2 and has a volume of 3.75 × 10⁶ km3. The Mediterranean Sea is divided into the following 12 units: (1) the Alboran Sea; (2) the Mar Menor Sea; (3) the La Mar Chica Sea; (4) the Adriatic Sea; (5) the Ionian Sea; (6) the Libyan Sea; (7) the Cilician Sea; (8) the Levantine Sea; (9) the Ligurian Sea; (10) the Tyrrhenian Sea; (11) the Balearic Sea; and (12) the Aegean Sea.
The Mediterranean region has been identified as one of the most sensitive regions in the world to climate change [1]. Coll et al. [2] consider that the Mediterranean Sea displays some of the richest diversity in the world. According to analyses by Pascual et al. [3] the oceanographic barriers in the Mediterranean Sea seem to reduce gene flow globally. The Mediterranean area is considered one of the most vulnerable regions on the planet due to the uncontrolled and unsustainable development of tourism, vulnerable ecosystems, socio-economic instability, and the impact of climate change. A particular danger is the consequence of global warming, which affects the intensification of droughts and, thus, the reduction in agricultural productivity [4,5,6,7].
Pastor et al. [8] point out that the Mediterranean basin has been classified as a hot spot for climate change. The Mediterranean Sea plays a fundamental regulatory role in the broader regional climate. Although they found warming throughout the whole Mediterranean basin, the spatial variability found leads to the division of the basin into few distinct subareas regarding warming. This warming rate has the highest values in the eastern Mediterranean and the northern half of the western Mediterranean, and the lowest trend to the south of Italy.
The sea surface temperature in the Mediterranean results from an equilibrium dominated by energy generation due to solar radiation in subtropical high-pressure conditions that prevail over a large area in summer and significant heat losses during evaporation. As a result of the former interaction, the values of the sea surface temperature in the Mediterranean increase in the east and south direction [9].
With about 10,000 islands and islets, the Mediterranean Sea can be considered one of the largest archipelagos in the world [1]. Within Croatia’s territorial water in the Adriatic Sea, there are 79 islands, 525 islets, and 642 rocks, and rocks awash, which cover an area of 3259.56 km2 [10].The Adriatic Sea is a deep and shallow bay of the Mediterranean Sea. It covers an area of 138,595 km3 with a volume of 35 × 103 km3. On these bases, the Adriatic Sea is only 5.5% of the total area of the Mediterranean Sea and only 0.93% of its volume.
The physical properties and processes that occur in the Adriatic Sea are under the direct influence of atmospheric processes, the inflow of inland waters, and its specific topography. In the shallowest part on the north, the inflow of water from the river Po, as well as numerous strong karst springs and submerged rivers (the source of the Rječina River, the rivers Lika and Gacka, etc.) are particularly important for physicochemical processes. In the southernmost part, an important control factor is the interaction of the Adriatic and Ionian Seas. The Adriatic Sea has a lower level of salinity than other parts of the Mediterranean. It contains about a third of the freshwater that enters the entire Mediterranean Sea. Therefore, the Adriatic Sea is the only of the twelve aforementioned seas with the so-called positive water balance, i.e., more freshwater enters than is lost by the evaporation of seawater.
The climate in the entire Adriatic Sea is Mediterranean. The effects of the continental and maritime climate in the northern part are different from those in the central and southern part of the Adriatic. Therefore, according to the Köppen–Geiger climate classification, the northern part belongs to Cfa (moderately warm humid climate with hot summers), and the middle and southern part to Csa (Mediterranean climate with hot summers) and, to a lesser extent, to the Csb area (Mediterranean climate with warm summer) [11,12,13,14,15].
This paper will analyse the recent development of sea and air surface temperatures on two islands in the Croatian part of the Adriatic Sea: (1) Krk; (2) Lastovo. The island of Krk is located in its northern part, while the island of Lastovo is on the open sea in the southern part. The aim of this paper is to establish differences in the behaviour of recent air and sea surface temperatures on two small islands based on existing, unfortunately quite limited, data. Figure 1 shows a map of Croatia indicating positions of the islands and the air distance between the locations of the meteorological stations Krk and Lastovo.
The island is a landmass surrounded by water. Due to its separation from the continental landmass, each island is a climatologically and hydrologically limited unit with a unique local water balance. Due to the possible and expected negative consequences of variations and climate changes, and especially the effect of global warming, particularly endangered locations are small islands in the Mediterranean, covering less than 1000 km2 [16,17,18]. The fact is that each island reacts distinctively to climate change depending on its location, topography, geological structure, vegetation coverage, etc.
The statistical characteristics of recent air temperatures in Lastovo are described in detail in several articles [19,20,21]. Analysing the characteristic (minimum, mean, and maximum) annual and monthly air temperatures in 1948–2020, a statistically significant increase is observed in all three indicators. It is found that the sudden rise in the minimum annual air temperatures began at the earliest, i.e., in 1972, while the sharp rise in the maximum annual air temperatures began nine years later in 1981. The sharp jump in the mean annual temperatures measured at the meteorological station Lastovo began in 1992.
In some locations, almost identical behaviour of air temperatures is found on some other islands located in the central and southern Adriatic, such as: (1) Korčula [22,23]; (2) Hvar [24,25,26]; (3) Vis [20,26]; (4) Biševo [20]; and (5) Palagruža [20,27].
Sea surface temperature is one of the essential climate variables contributing to the characterization of the local, regional and global climate. The study and analysis of sea surface temperature and its influence on air temperature have been receiving growing interest in the last two decades [28,29,30]. The main mechanism by which the ocean interacts with the atmosphere is through heat and moisture exchanges. Those processes exert a major influence on the development of extreme weather events.
Sea surface temperature in the Adriatic has been studied less frequently than air temperature since these measurements are performed at a significantly smaller number of locations and the observations are performed in a much shorter time series with frequent interruptions. According to Iona et al. [31], insufficient spatial and temporal coverage of in situ data has led to large uncertainties and differences in the approaches used, especially for estimates at the scale of a large basin. Despite the sparse data, most scientists emphasize that there is a trend toward warming sea surface temperatures in the Mediterranean [8,30,31,32].
Analyses of recent sea surface temperatures of the central Adriatic islands Hvar, Vis, and Split show that the series of the mean annual sea surface temperatures behave similarly to air temperatures. At the three former locations, a difference in the beginnings of a sharp rise in temperature is observed. A sharp rise in air temperature began in 1992, while a sharp rise in sea surface temperatures began six years later, in 1998 [24,25,26]. Thus, processes of air and sea temperature change have been observed in several places and intensify throughout the Croatian part of the Adriatic, varying locally under the influence of local environmental conditions.
The fact is that research on existing and potential adverse consequences of climate change on the islands and coastal areas of the Republic of Croatia is insufficient concerning their national and regional significance. Benac et al. [33] emphasize that other coastal countries, members of the European Union, approach this crucial issue more systematically. This paper should serve as a contribution to efforts to understand in more detail the differences in air and sea temperature rises across the Adriatic and possibly mitigate the potential dangers of global warming. One of the measures is that the detection of changes may lead to a better awareness of the importance of continuous monitoring of key parameters, and hydrological and hydrogeological measurements that would give a more complete picture of the actual situation. It will also be possible to implement long-term sustainability measures in the form of reducing the vulnerability of karst aquifers and protecting existing water resources, especially on islands with unique and limited local water resources.

2. Materials and Methods

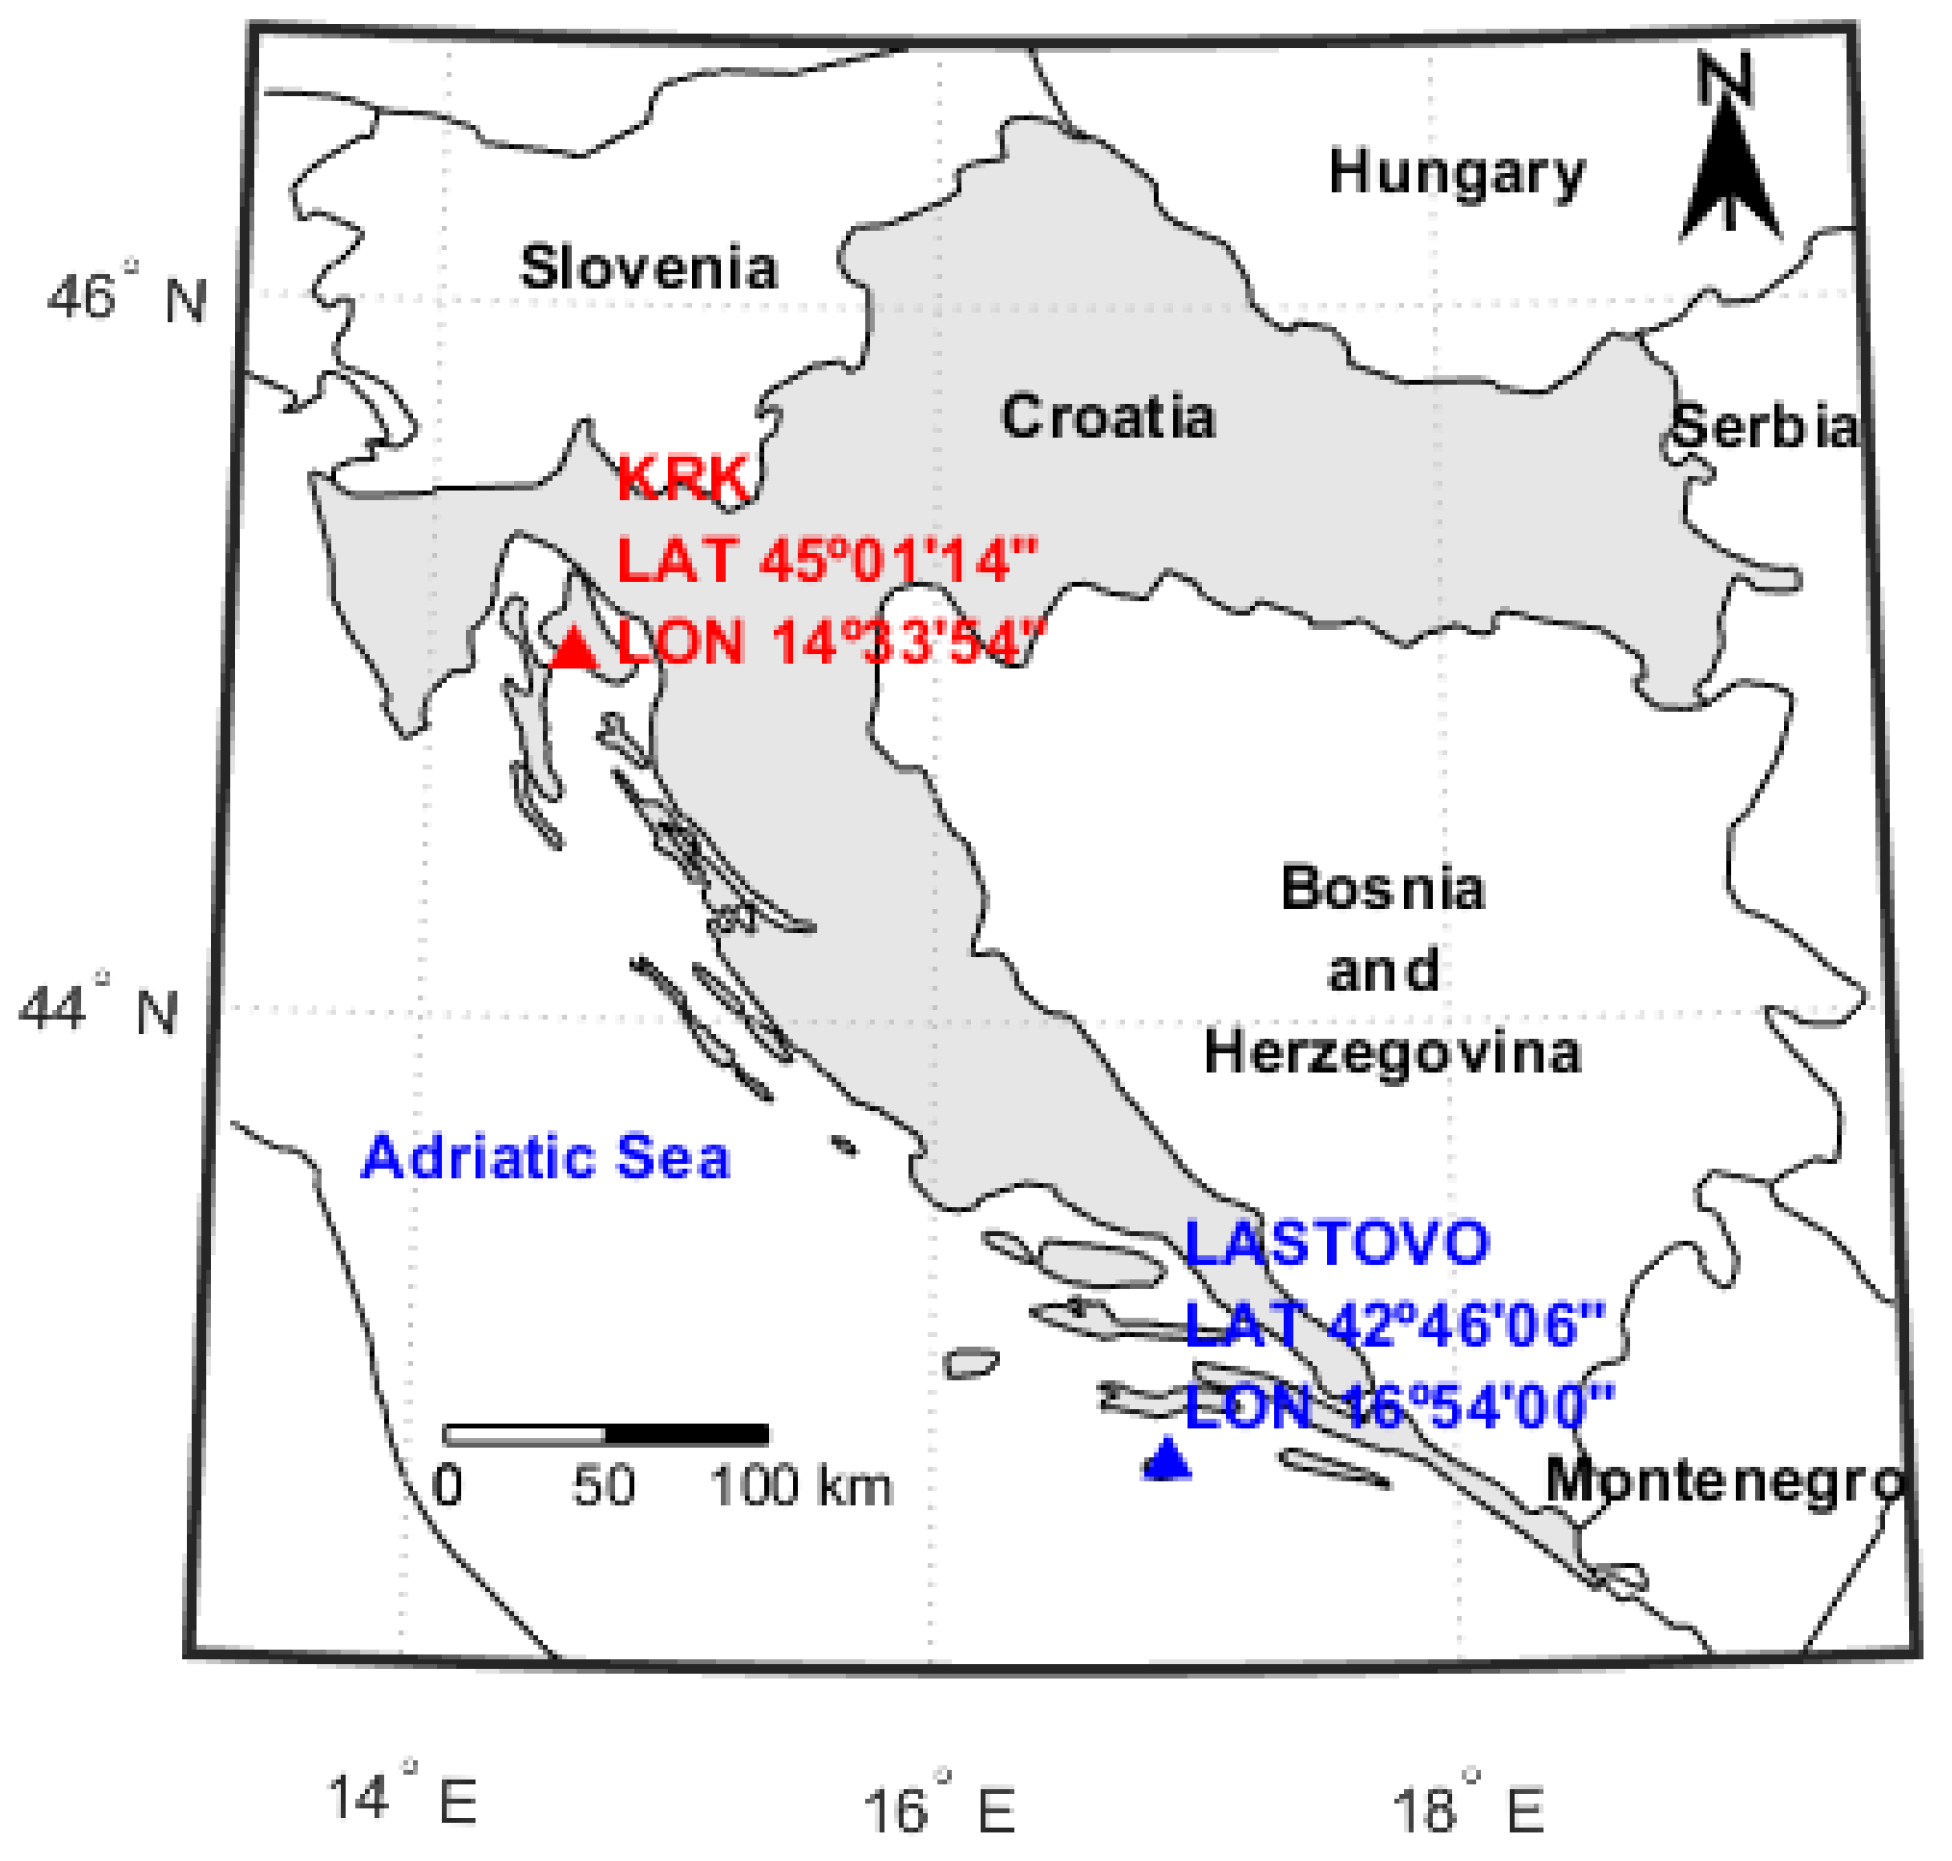
2.1. Description of Locations

The island of Krk, with an area of A = 405.22 km2, is the second largest island in the Adriatic Sea. Its coastline is 219.12 km long, and it consists of numerous bays, coves and natural harbours. The indentation coefficient of the coast of the island of Krk is 2.6 [10,34]. The indentation coefficient of an island is defined as the ratio between the coast and the circumference of a circle that encloses a space equal to the surface of the island. The highest peak of the island is 568 m above sea level (above sea level). According to the 2011 census, the island of Krk, with 19,374 inhabitants, is the most populated island in the Adriatic and one of the few with an increasing population.
The relief of the island is extremely diverse. There are three basic geomorphological units: (1) karst plateau in the northeast; (2) hilly southeaster part; and (3) lower undulating karst plateau in the west. It is composed mainly of carbonate rocks predominantly from the Cretaceous period. Limestone Paleogene breccia and foraminiferal limestone can be observed in smaller areas [33,34]. The vulnerability of the coast of the island of Krk will increase by further sea level rise due to global warming [33]. According to the Köppen–Geiger climate classification, Krk belongs to the Cfa climate type.
The coordinates of the climatological station Krk are 45°01′14″ north latitude and 14°33′54″ east longitude. The station is located near the city centre, and the altitude of the station is 28 m above sea level. It is about 20 m air distance from the sea and about 90 m from the location for measuring the sea surface temperature. Krk is a Mediterranean town with 6821 inhabitants and a large number of tourists during the summer. Krk and its wider surroundings are exposed to gusts of bora wind during the winter, which affects the temperatures of both the air and the sea surface.
Lastovo is located on the open sea in the middle of the southern part of the Adriatic Sea. Its location is ideal for studying the climate of the open part of the southern Adriatic. It is the most remote island in the Croatian part of the Adriatic Sea. The area of the island is A = 40.82 km2, and the length of the coastline is 48.97 km [10]. It is 10 km long and 5.8 km wide. The highest peak on the island, Hum, has an altitude of 417 m above sea level. The indentation coefficient of the shores of Lastovo is 2.10.
Lastovo is the fifteenth largest and eighteenth most populated Croatian island in the Adriatic. According to the 2011 census report, there were 792 inhabitants. It is surrounded by 46 islets, cliffs, and underwater reefs. Lastovo is composed of carbonate rocks. Limestone predominates, with dolomite in the western part. Numerous karst depressions are filled with sand accumulations and flag deposits mixed with humus soils [35].
According to Köppen–Geiger’s climate classification, the island of Lastovo belongs to the Csa climate type. This type of climate refers to the Mediterranean climate with hot summers, while in the coldest winter month the mean monthly temperature is never lower than 0 °C. The mean monthly temperature is higher than 22 °C in at least one month, while the air temperature is higher than 10 °C throughout at least 4 months. During the wet months of the year, at least three times more precipitation falls in autumn and winter than in the summer dry months, while in the driest month of the year, less than 30 mm of precipitation falls on average. Southeast (south) and northwest (mistral) winds dominate. The northeast (bora) wind blows less often, most commonly occurring during the winter months. It is very cold, thus affecting the cooling of the sea surface temperature. The vegetation of the island is well preserved and very rich in numerous Mediterranean species. Frequent droughts occur in this type of climate, so it is treated as a semi-arid variant of the Mediterranean climate. The term “olive climate” is also commonly used, characterized by mild, humid winters with plenty of rainfall and dry hot summers.
The small area of the island, the significant distance from the mainland, and the karst landscape make Lastovo very vulnerable, especially endangered by global climate change. Even small changes in air and sea surface temperatures, as well as a reduction in precipitation or their redistribution during the year, can cause significant negative consequences for both the environment and its socio-economic balance.
The main meteorological station Lastovo was founded in 1948. Its geographical coordinates are 42°46′06″ north latitude and 16°54′00″ east longitude. It is located at an altitude of 186 m above sea level on top of a hill above the village of Lastovo, so its climatic characteristics are not affected by any anthropogenic effects. The sea surface temperature on Lastovo is measured in the bay of Zaklopatica. The geographical coordinates of this location are 42°46′25″ north latitude and 16°52′24″ east longitude. This place is 2110 m air distance northwest from the main meteorological station Lastovo. The air distance between the climatological station Krk and the main meteorological station Lastovo is 313 km, while the distance between the central parts of these two islands is 320 km.

2.2. Data and Methods Used

The main goal of this paper is to analyse the differences in behaviour (primarily the intensity of the rise) between air temperature and sea surface temperature in the northern and central and southern parts of the Adriatic Sea. To fulfil this task, simultaneous reliable measurements of sea and air surface temperatures at two meteorological stations, at least, are required. Unfortunately, it was not possible to fully follow this assumption because the measurements of sea surface temperature for the entire Adriatic, and especially for the northern part, have been quite rare and with numerous interruptions. Notwithstanding this limiting fact, it seemed paramount not to begin by considering this issue to allow us to use the existing data as soon as possible, no matter how insufficient they may be.
The problem of data availability is the result of a sparse network of measurement stations, little investment in measurement infrastructure, and, most importantly, a lack of understanding of the benefits of climate observations for development [36]. This problem is even more pronounced in hard-to-reach and geographically remote areas. The lack of data also means a lack of available information for conducting an analysis of climate and the impacts of climate change in an area. Since science requires evidence [37], the focus must be on expanding measurement systems and data availability. In this way, timely solutions can be found to reduce sensitivity to climate change. Therefore, this paper should be considered as an incentive for colleagues of a wider Croatian and Mediterranean scientific community to deal with this issue in an interdisciplinary, more systematic, and organized manner.
All meteorological data used in this paper are official data obtained from the State Hydrometeorological Institute in Zagreb, for which we express our gratitude. For the climatological station Krk, the characteristic (minimum, mean and maximum) daily air temperatures in the period 1981–2020 are available, with downtime from 1987–1997. There were no interruptions at the main meteorological station Lastovo during the period 1948–2020.
Table 1 presents the data on available sea surface temperature measurements at the two analysed stations. Apparently, the measurement of sea surface temperature on Lastovo started in January 2007 and on Krk in August 2010. Measurement data over 113 months and eight full years are available for Lastovo and 78 months and five full years for Krk. Simultaneous measurements are available at both analysed stations over 76 months.
The conventional method of measuring sea surface temperature in Croatia is performed using a thermometer immersed at a depth of about 30 cm in a representative place where the water is not shallower than 1.8 m. The thermometer is kept at that depth for three minutes. When brought to the surface, it must be read quickly, minding not to make a reading error due to parallax. The sea surface temperature is measured three times, the same as the air temperature, i.e., at 7, 14, and 21 h (local time).
The mean daily air and sea surface temperature, Tmean, at climatological stations in Croatia is determined by the following expression:
Tmean = [T7 + T14 + (2 × T21)]/4,
where in, T7, T14, T21, temperatures were measured at 7, 14, 21 h (local time), respectfully. Among many other methods of calculating daily mean temperature [38], this method is most widely used in Central and Eastern European countries [39,40].
The relatively short series with interruptions in the observation limit the possibility for the application of more complex statistical analyses. Therefore, only the linear regression directions are calculated, as follows:
T = (a × t) + b,
where, T, denotes the analysed temperature, t, the year, or month in the analysed time series, while, a, b, represent the coefficients of the direction of linear regression defined by applying the theory of least squares. The coefficient, a, represents the slope of the regression direction whose dimension is °C per year or per month. It can serve as a good quantitative indicator of the average intensity of the trend of rising or falling values of temperatures of the analysed time series. In addition, the value of the square of the linear correlation coefficient, R2, is calculated for each regression direction. Due to the aforementioned shortness of the analysed time series of air and sea surface temperatures, as well as numerous interruptions in measurements, there is no use in checking the statistical significance of linear trends with some of the existing nonparametric tests (Mann–Kendall and/or Spearman Rank Order Correlation—SROC). However, F-test and t-test were used to calculate the statistical significance of differences between averages. The F-test was used to determine the statistical significance of differences in variance, while the t-test was used to quantitatively assess the statistical significance of mean value differences over two-time periods [41,42]. In both tests, the value of p < 0.01 was chosen as the level of significance of differences.

3. Results and Discussion

This chapter analyses the available series of air and sea surface temperatures on two small islands in the Adriatic Sea. As the island of Krk is in the northern part, and Lastovo in the south, it is realistic to assume that, based on analyses of temperatures measured at their locations, it will be possible to conclude, or at least make relatively reliable assumptions, about differences in global warming in the northern and southern parts of the Adriatic Sea. As previously stated, this paper aims to study the differences in the behaviour of the observed temperatures on the two islands in the Adriatic Sea, in pursuit of conclusions about the future development of the process.

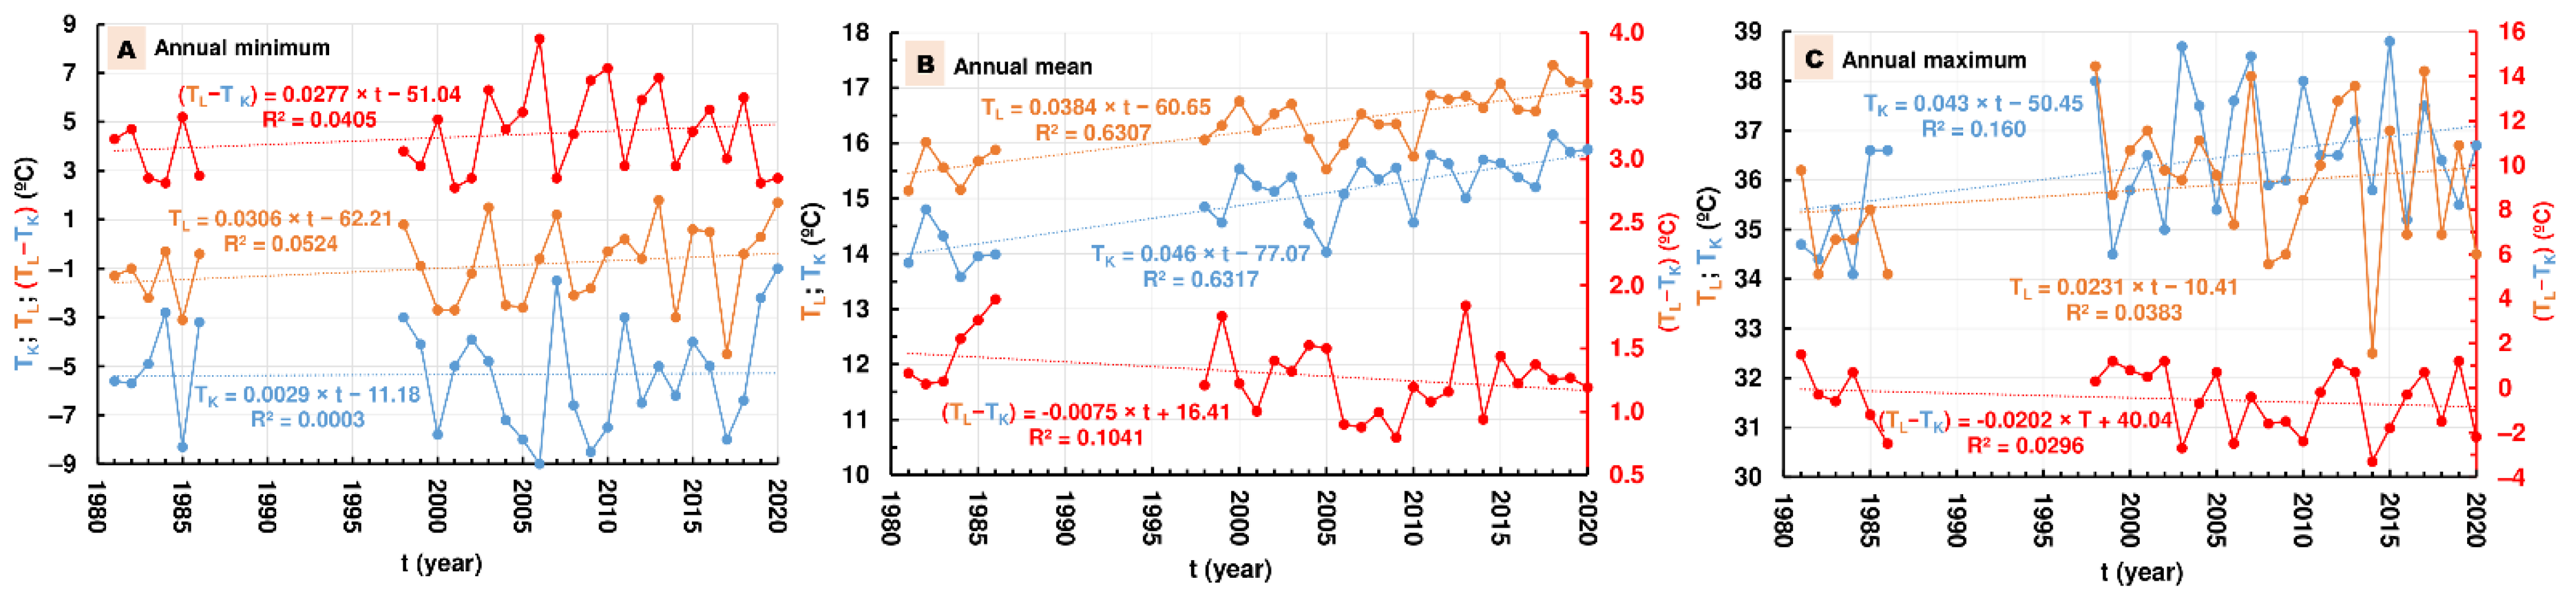
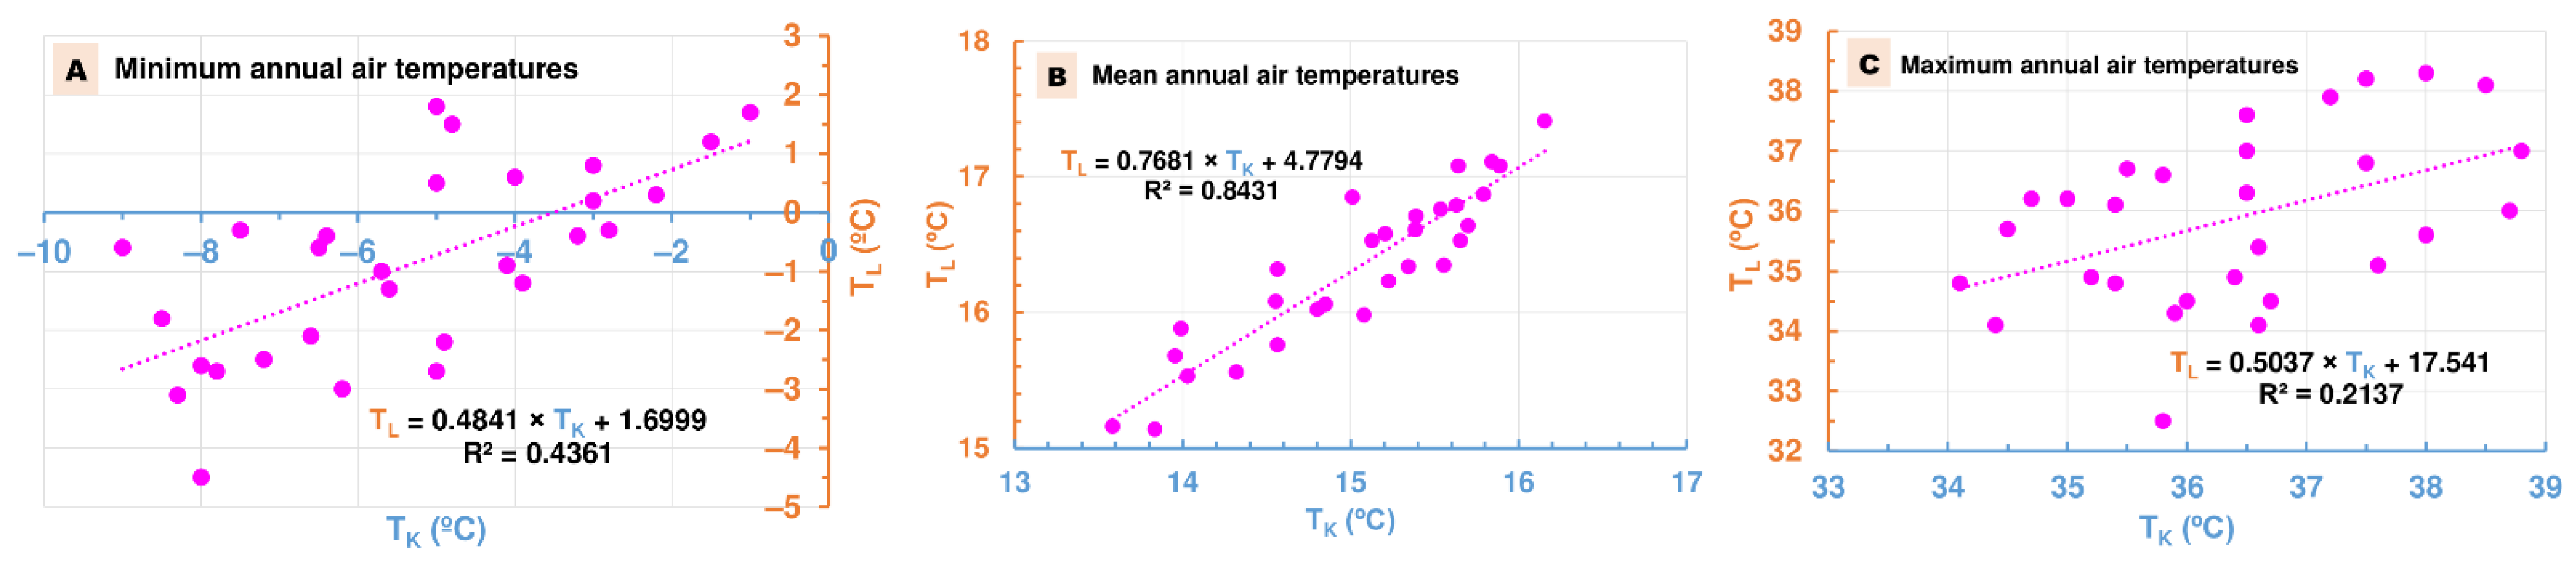
3.1. Analysis of Characteristic Annual Air Temperatures

At the climatological station Krk, the characteristic (minimum, mean, and maximum) annual air temperatures in the periods from 1981–1986 to 1998–2020 (hence a total of 29 years) are available. Due to this fact, the comparison is made only for these periods to the corresponding characteristic air temperatures observed at the main meteorological station Lastovo, which had a continuous series of 73 years in the period 1948–2020 [19,20,21].
In the analysed 29 years, the minimum annual air temperatures on the Krk ranged from −9.0 to −1.0 °C with an average value of −5.33 °C. At the same time, the average minimum annual air temperature on Lastovo was 4.45 °C higher and was −0.88 °C, ranging from −4.5 to 1.8 °C. Therefore, the average value of the difference between the minimum annual air temperatures of Lastovo and Krk is 4.45 °C and ranges from 2.3 to 8.4 °C. Based on the series of the minimum annual air temperatures shown in Figure 2A, it is possible to observe very slight trends of the minimum annual air temperatures increase at both analysed stations, more intense on Lastovo than on Krk, which resulted in a slight increase in differences between their annual minimum air temperatures. It seems there was no trend of the minimum annual air temperature increase at the two observed stations. The value of the square of the coefficient of linear correlation between the minimum annual air temperatures of Lastovo and Krk is R2 = 0.4361 (Figure 3A).
In the case of the mean annual air temperature series, shown in Figure 2B, the situation is substantially different. At both stations, a substantial trend of increases in the mean annual air temperatures is observed. The minimum and mean annual values between the two stations show a significant difference in the mean values (Table 2). The trend is slightly higher on Krk than on Lastovo, which resulted in a slight downward trend in the differences between the mean annual air temperatures on Lastovo and Krk. The mean annual air temperatures on Krk ranged from 13.58 to 16.16 °C with an average value of 15.04 °C. At the same time, the mean annual air temperature on Lastovo was 1.29 °C higher, i.e., 16.33 °C, and it ranged from 15.14 to 17.41 °C. Therefore, the differences between the mean annual air temperatures of Lastovo and Krk range from 0.79 to 1.89 °C with an average value of 1.29 °C. The value of the square of the coefficient of linear correlation between the mean annual air temperatures of Lastovo and Krk is high and amounts to R2 = 0.8431 (Figure 3B).
The analysis of the series of the maximum annual air temperatures shown in Figure 2C indicates the presence of a slight upward trend at both stations, yet more substantial on Krk, which causes a slight downward trend between the maximum annual air temperatures of Lastovo and Krk. Maximum annual air temperatures on the Krk ranged from 34.1 to 38.8 °C with an average value of 36.39 °C. On Lastovo, the maximum annual air temperatures ranged from 32.5 to 38.3 °C. The average mean annual air temperature on Lastovo was 35.87 °C, which is 0.52 °C lower than on Krk. For each year, the differences ranged from −3.3 to 1.5 °C. The value of the square of the coefficient of linear correlation between the maximum annual air temperatures of Lastovo and Krk is R2 = 0.2137 (Figure 3C).

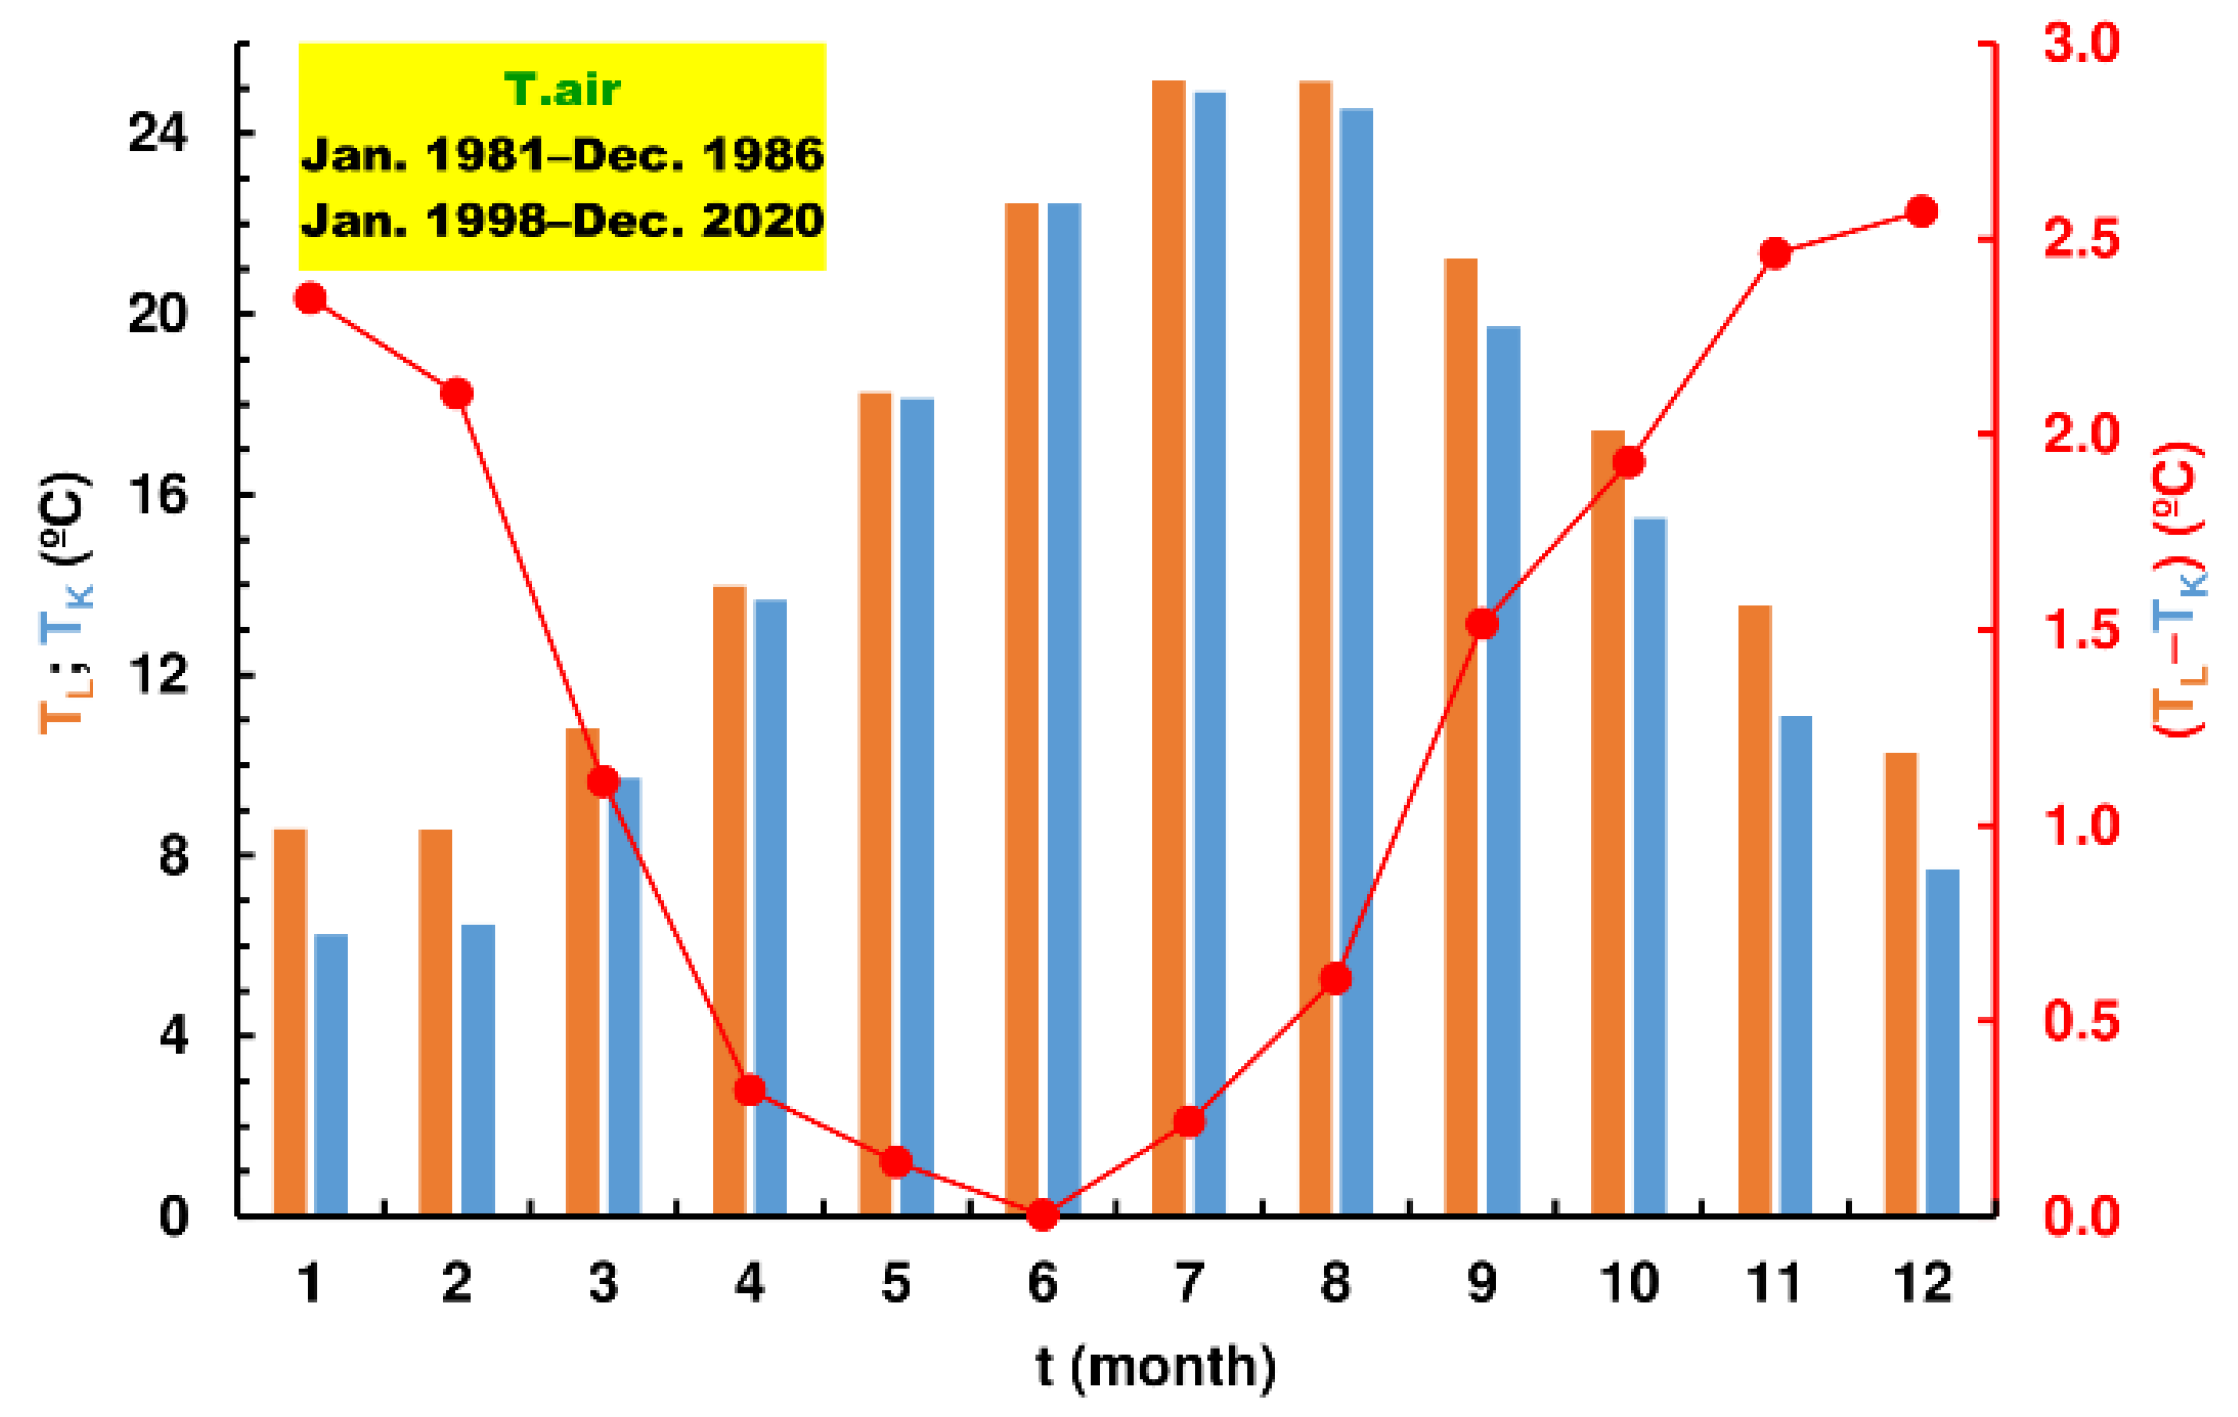
3.2. Analysis of the Mean Monthly Air Temperatures

The analysis of the ratio of the mean monthly air temperatures on Lastovo and Krk during the 12 months of the year provides a more detailed picture of their relationship, which changes in different parts of the year. Figure 4 shows histograms of average values of the mean monthly air temperatures of Lastovo (brown) and Krk (blue) and a number of their differences (red) in the period 1981–1986 and 1998–2020. From this presentation, it is possible to notice that the average mean air temperatures are always higher on Lastovo than on Krk, but the ration changes drastically within a year. The greatest differences occur during the cold parts of the year, most strongly in December, followed by November, then January, and February. The difference is lowest in June when the average mean monthly air temperatures are almost identical. In that month, the average mean air temperature on Lastovo was higher than on Krk, only by 0.004 °C. The differences increase from July to December and decrease from January to June.
From the ratio of mean monthly air temperatures of Lastovo (ordinate axis) and Krk (abscissa axis) in the period from January 1981 to December 1986 and from January 1998 to December 2020, shown in Figure 5, a high coincidence of mean monthly air temperatures is observed. The value of the square of the linear correlation coefficient is very high, that is R2 = 0.9805. For 61 months (17.5% of the total of 348 months considered), the mean monthly air temperatures on Krk are higher or equal to those on Lastovo. This mostly happens during June and less frequently in May and July.

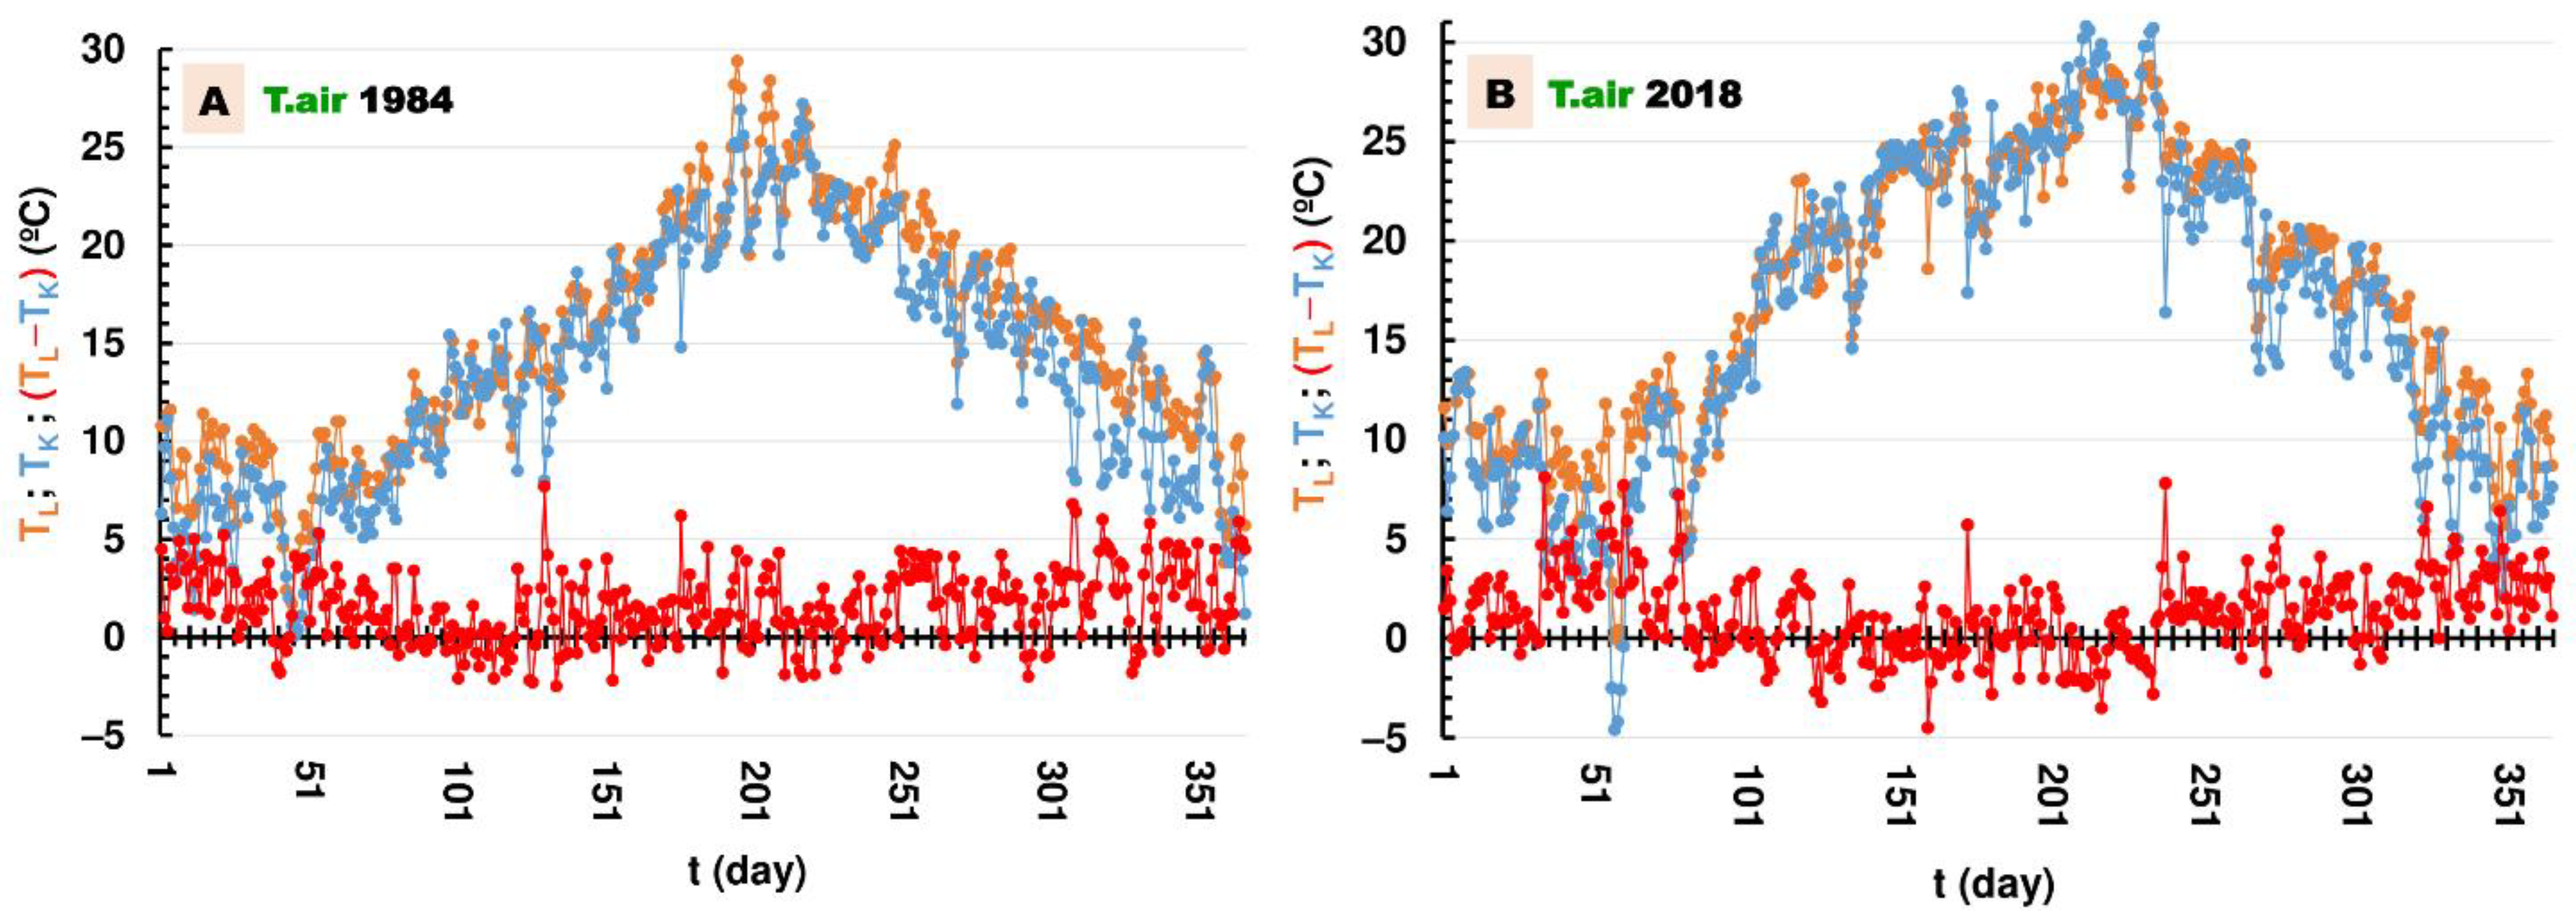
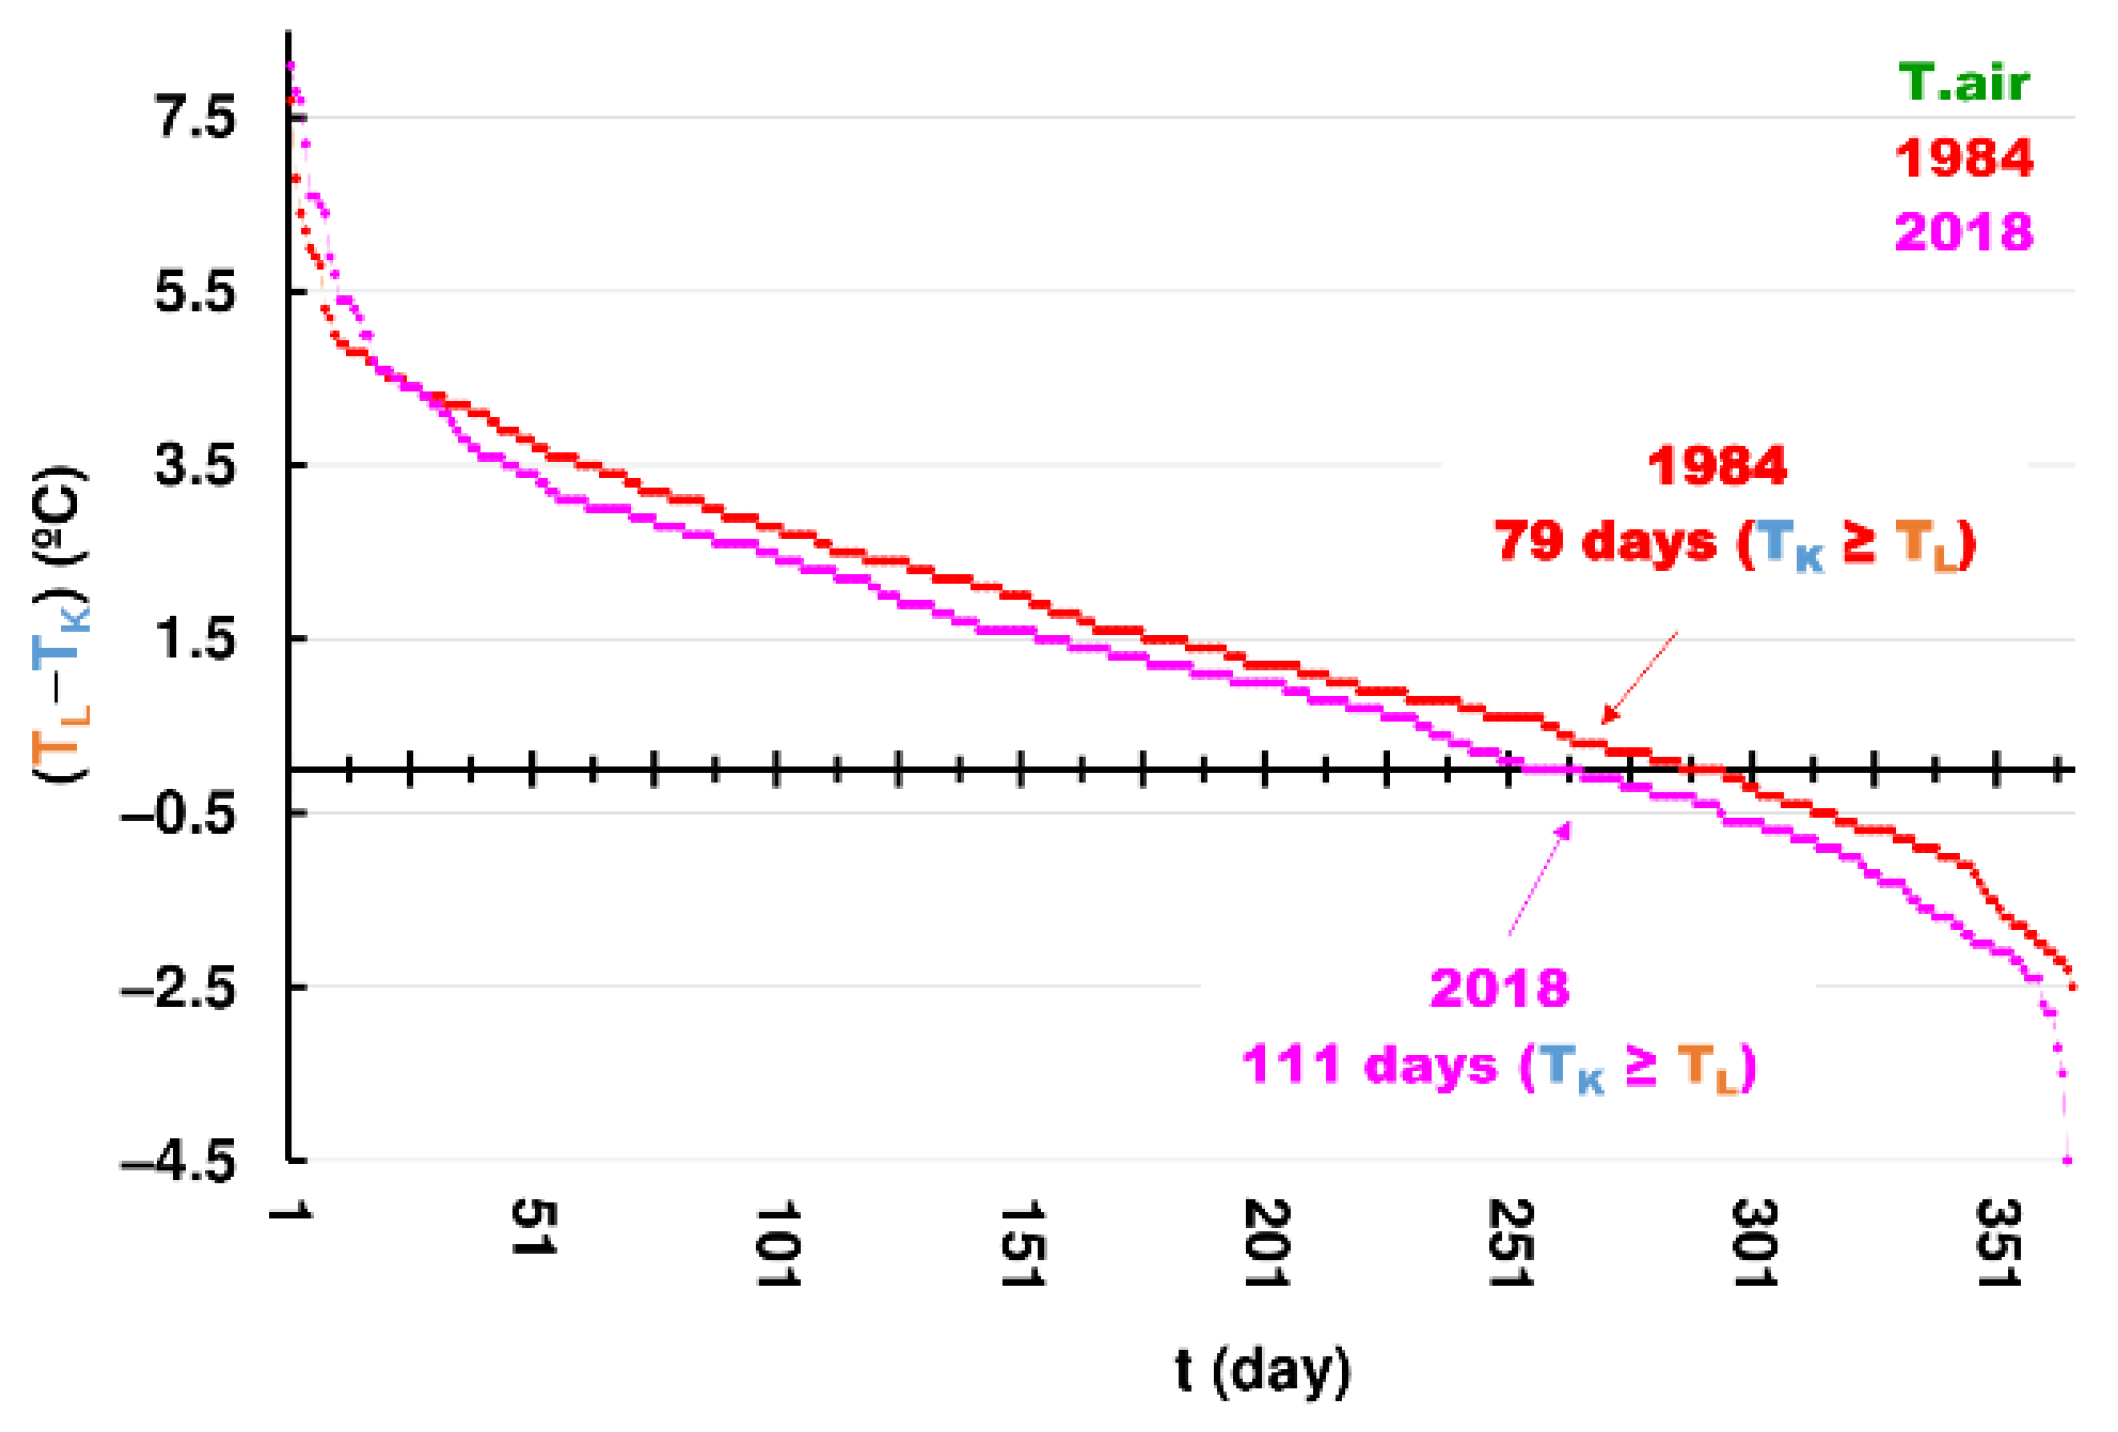
3.3. Analysis of the Mean Daily Air Temperatures

The analysis of the daily course of mean air temperatures at the two stations was performed in the period from 1984 to 2018. In the former, the mean annual air temperature was 13.58 °C on Krk and 15.16 °C on Lastovo. The year 1984 was the coldest of the observed 29-year period. In the warmest, 2018, the mean annual air temperature on Lastovo was 17.41 °C, and on Krk 16.16 °C. Graphic representations of mean daily temperatures of Lastovo (brown), Krk (blue) and their differences between the mean daily temperatures of Lastovo and Krk are shown in Figure 6A (for 1984) and Figure 6B (for 2018). Comparing data from the two stations in two different years revealed significant differences in variances and means (Table 3). Duration curves of the differences between the mean daily air temperatures are plotted in Figure 7. The duration curve indicates what percentage of the time (or a number of days) the observed variable equals or exceeds a certain value of interest. The red curve shows 1984 and the purple 2018. The number of days per year when the mean daily air temperatures on Krk are higher than those on Lastovo ranged between 79 (1984) and 111 (2018) days per year.

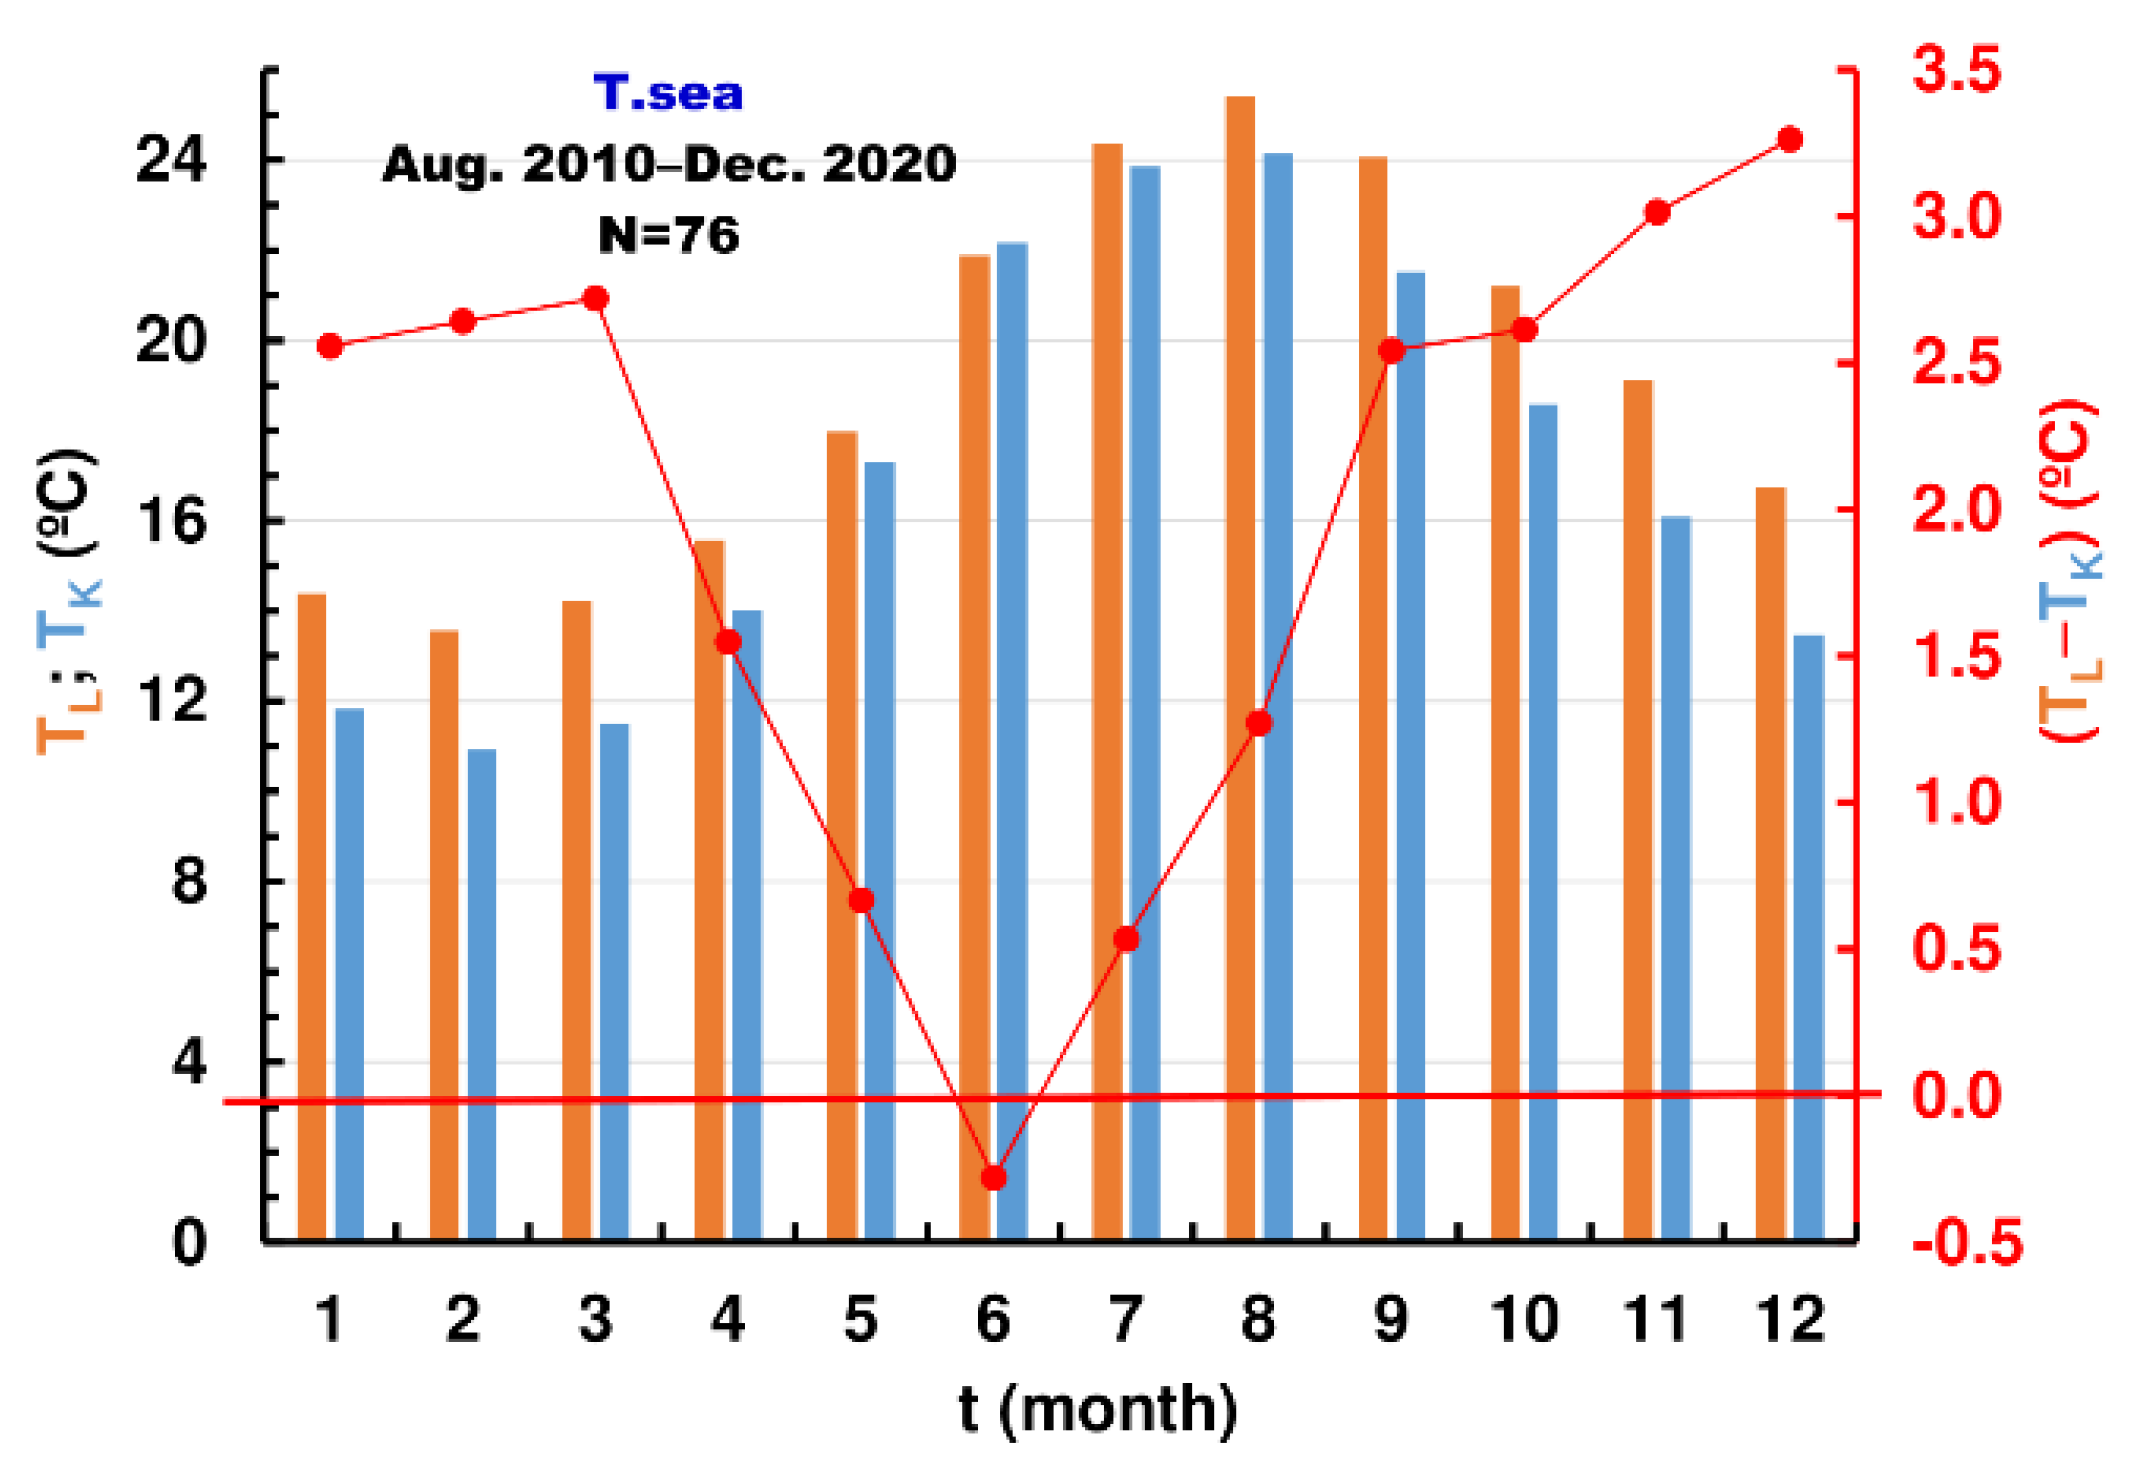
3.4. Analysis of the Mean Annual, Monthly and Daily Sea Surface Temperatures

Barbosa and Andersen [43] emphasize that sea surface temperature is a key climatic parameter important for monitoring, detecting, and predicting climatic variations in each region. In addition, the sea plays a fundamental role as a regulator of the climate system through interactions between the sea and the atmosphere, such as the exchange of energy and moisture [8].
The Adriatic Sea is considered a sea sensitive to climate change [44]. Studies in the Adriatic Sea have shown decadal variations in sea surface temperature [44,45,46]. Analysis of mean monthly sea surface temperatures revealed: (i) a cooling trend prior to 1979; and (ii) a significant warming thereafter, especially after 2008 [44]. The warming is more pronounced in the summer months, although the increasing trend is also observed in the winter months, with large variations from year to year. The variability is attributed to synoptic conditions, but also to energy transfer between subtropical and polar regions [44,47]. According to Grbec [44], sea surface temperature changes in the Adriatic are primarily a consequence of the simultaneous response to atmospheric influences and, to a lesser extent, to the spatial distribution of winds (bora) and the alternation between open and coastal waters. By analysing the surface temperature of the sea near Krk and Lastovo, we will try to determine the changes in the northern and southern parts of the Adriatic. Since the series of measurements considered are short and interrupted, reliable conclusions can be drawn only with long-term measurements. Long-term measurements are a prerequisite for the evaluation of long-term changes, especially when there is large decadal variability [46].
As already stated in the introduction, statistically significant trends of increase in mean annual sea surface temperatures, accompanied by statistically significant increases in air temperatures, were established at the stations in the central and southern Adriatic Hvar, Komiža, and Split. The short number of years and numerous interruptions in observations disenabled more detailed analyses of the change in mean annual sea surface temperatures at the Krk and Lastovo stations.
Table 4 records the values of the mean annual sea surface temperatures of Lastovo and Krk and their differences. On Lastovo, during the available eight years, the average annual temperatures ranged from 18.28 to 19.46 °C. On Krk, in the available five years, the average annual sea surface temperatures ranged between 16.76 and 17.84 °C. The average annual sea surface temperature was higher from 1.31 to 2.28 °C on Lastovo than on Krk. The differences in the mean annual air temperatures between Lastovo and Krk are also marked bold green in the last column. They are lower than the differences in the mean annual sea surface temperatures. They range from 0.94 to 1.84 °C.
A graphical representation of the series of the mean monthly sea surface temperatures of Lastovo (brown) and Krk (blue) and the series of their differences (red) for all available months is shown in Figure 8A, while Figure 8B shows the series of data only when measurements were taken at both stations. There is an apparent trend of the increase in average monthly values of sea surface temperature at both stations, while the differences between Lastovo and Krk are smaller.
Figure 9 presents histograms of average monthly sea surface temperatures of Lastovo (brown) and Krk (blue) and several differences (red) in the period from August 2010 to December 2020 for the months when measurements were made at both stations. The average values of sea surface temperature are higher on Lastovo than on Krk in all months, except June when the average mean sea surface temperature of Lastovo was lower by 0.25 °C than that on Krk. In December, the average mean sea surface temperature of Lastovo is higher than that on Krk by 3.26 °C, being the largest difference. It is possible to conclude that the sea around Krk warms up faster, but also cools down faster than around Lastovo.
Figure 10 shows the relationship between the pairs of the mean monthly sea surface temperatures on Lastovo (ordinate axis) and Krk (abscissa axis) in the period from July 2010 to December 2020, when there were measurements at both stations. The high value of the square of the linear correlation coefficient, R2 = 0.942, proves the similarities of the sea surface temperature regime at these two locations. In 76 pairs of values of the mean monthly sea surface temperatures, only in five months were the mean monthly sea surface temperatures higher on Krk than on Lastovo. This happened three times in June, and once in May and July. The relationship between the average values of the mean monthly sea surface temperatures on Krk (ordinate axis) and on Lastovo (abscissa axis) in the period from July 2010 to December 2020, for the months when there were measurements at both stations, is shown in Figure 11.
A series of the mean daily sea surface temperatures on Lastovo (brown) and Krk (blue) and a series of their differences (red) observed during 366 days in 2020 are plotted in Figure 12 to gain better insight into the ratio of the mean daily sea temperatures at the two locations. If we compare it to those in Figure 6A,B, which plot the mean daily air temperatures at those two locations, we can see that the variations in the mean daily sea surface temperatures are much milder than the variations in air temperatures, as expected, given the heat capacities of water and air. During 2020, the number of days with the sea surface temperature on Krk equal to or higher than that on Lastovo was N = 63 (17.2%). This phenomenon can be observed during the warm part of the year from late April to late August, most commonly occurring in June.

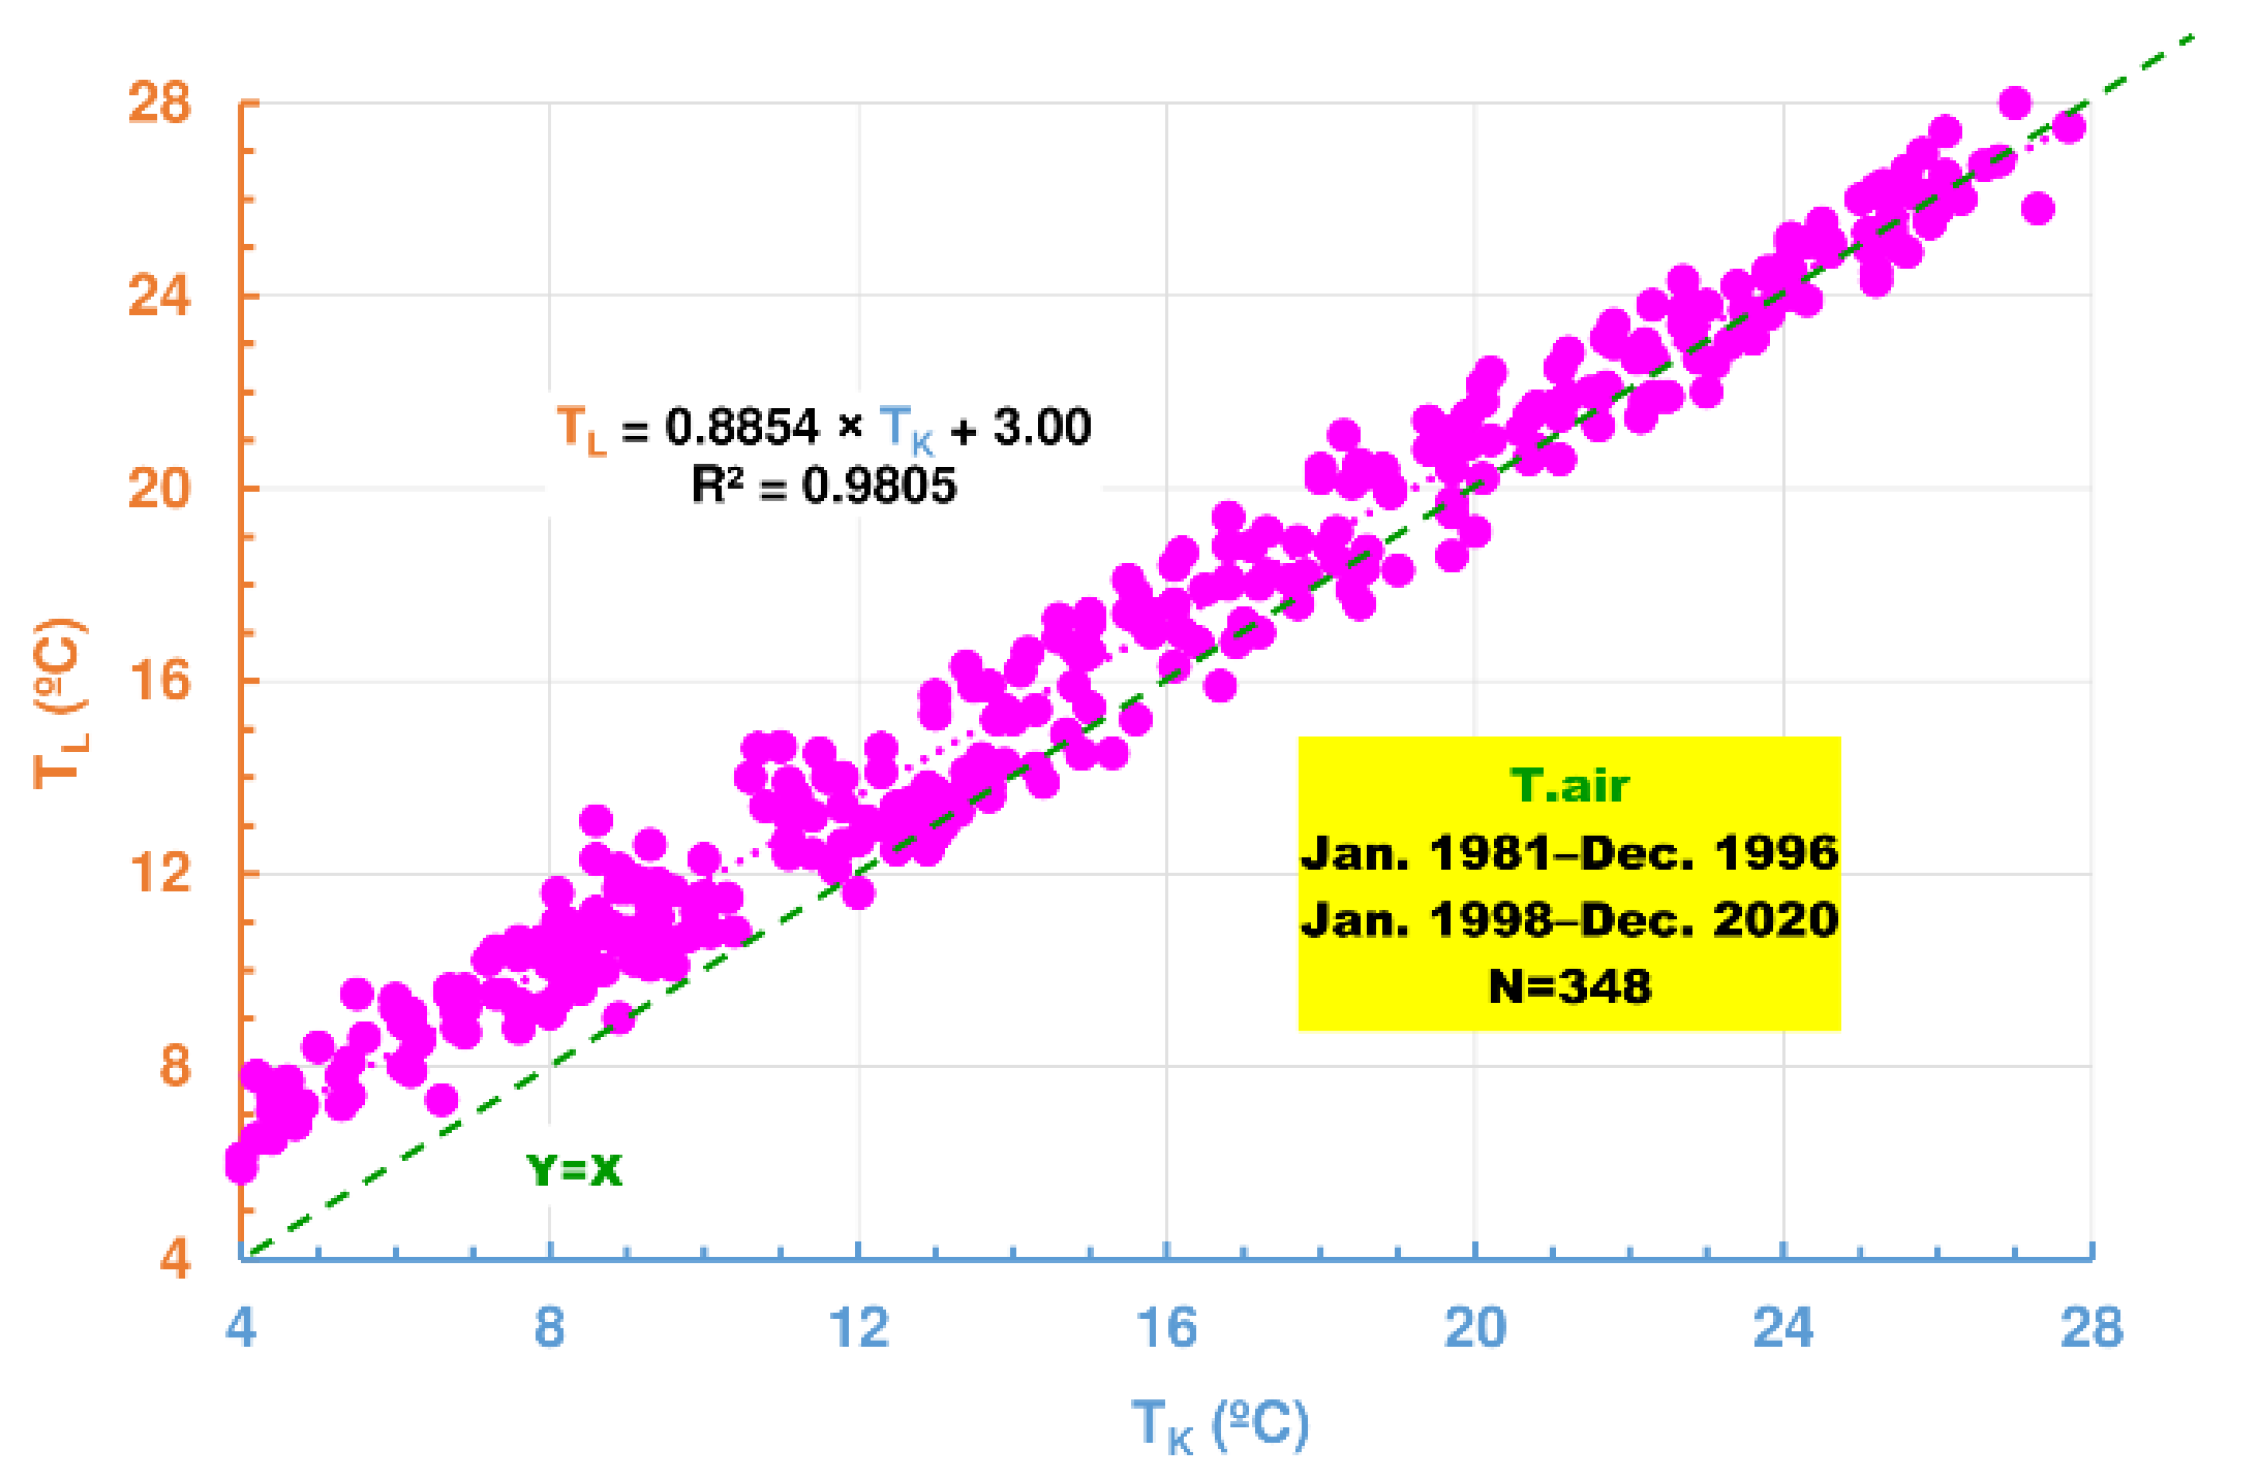
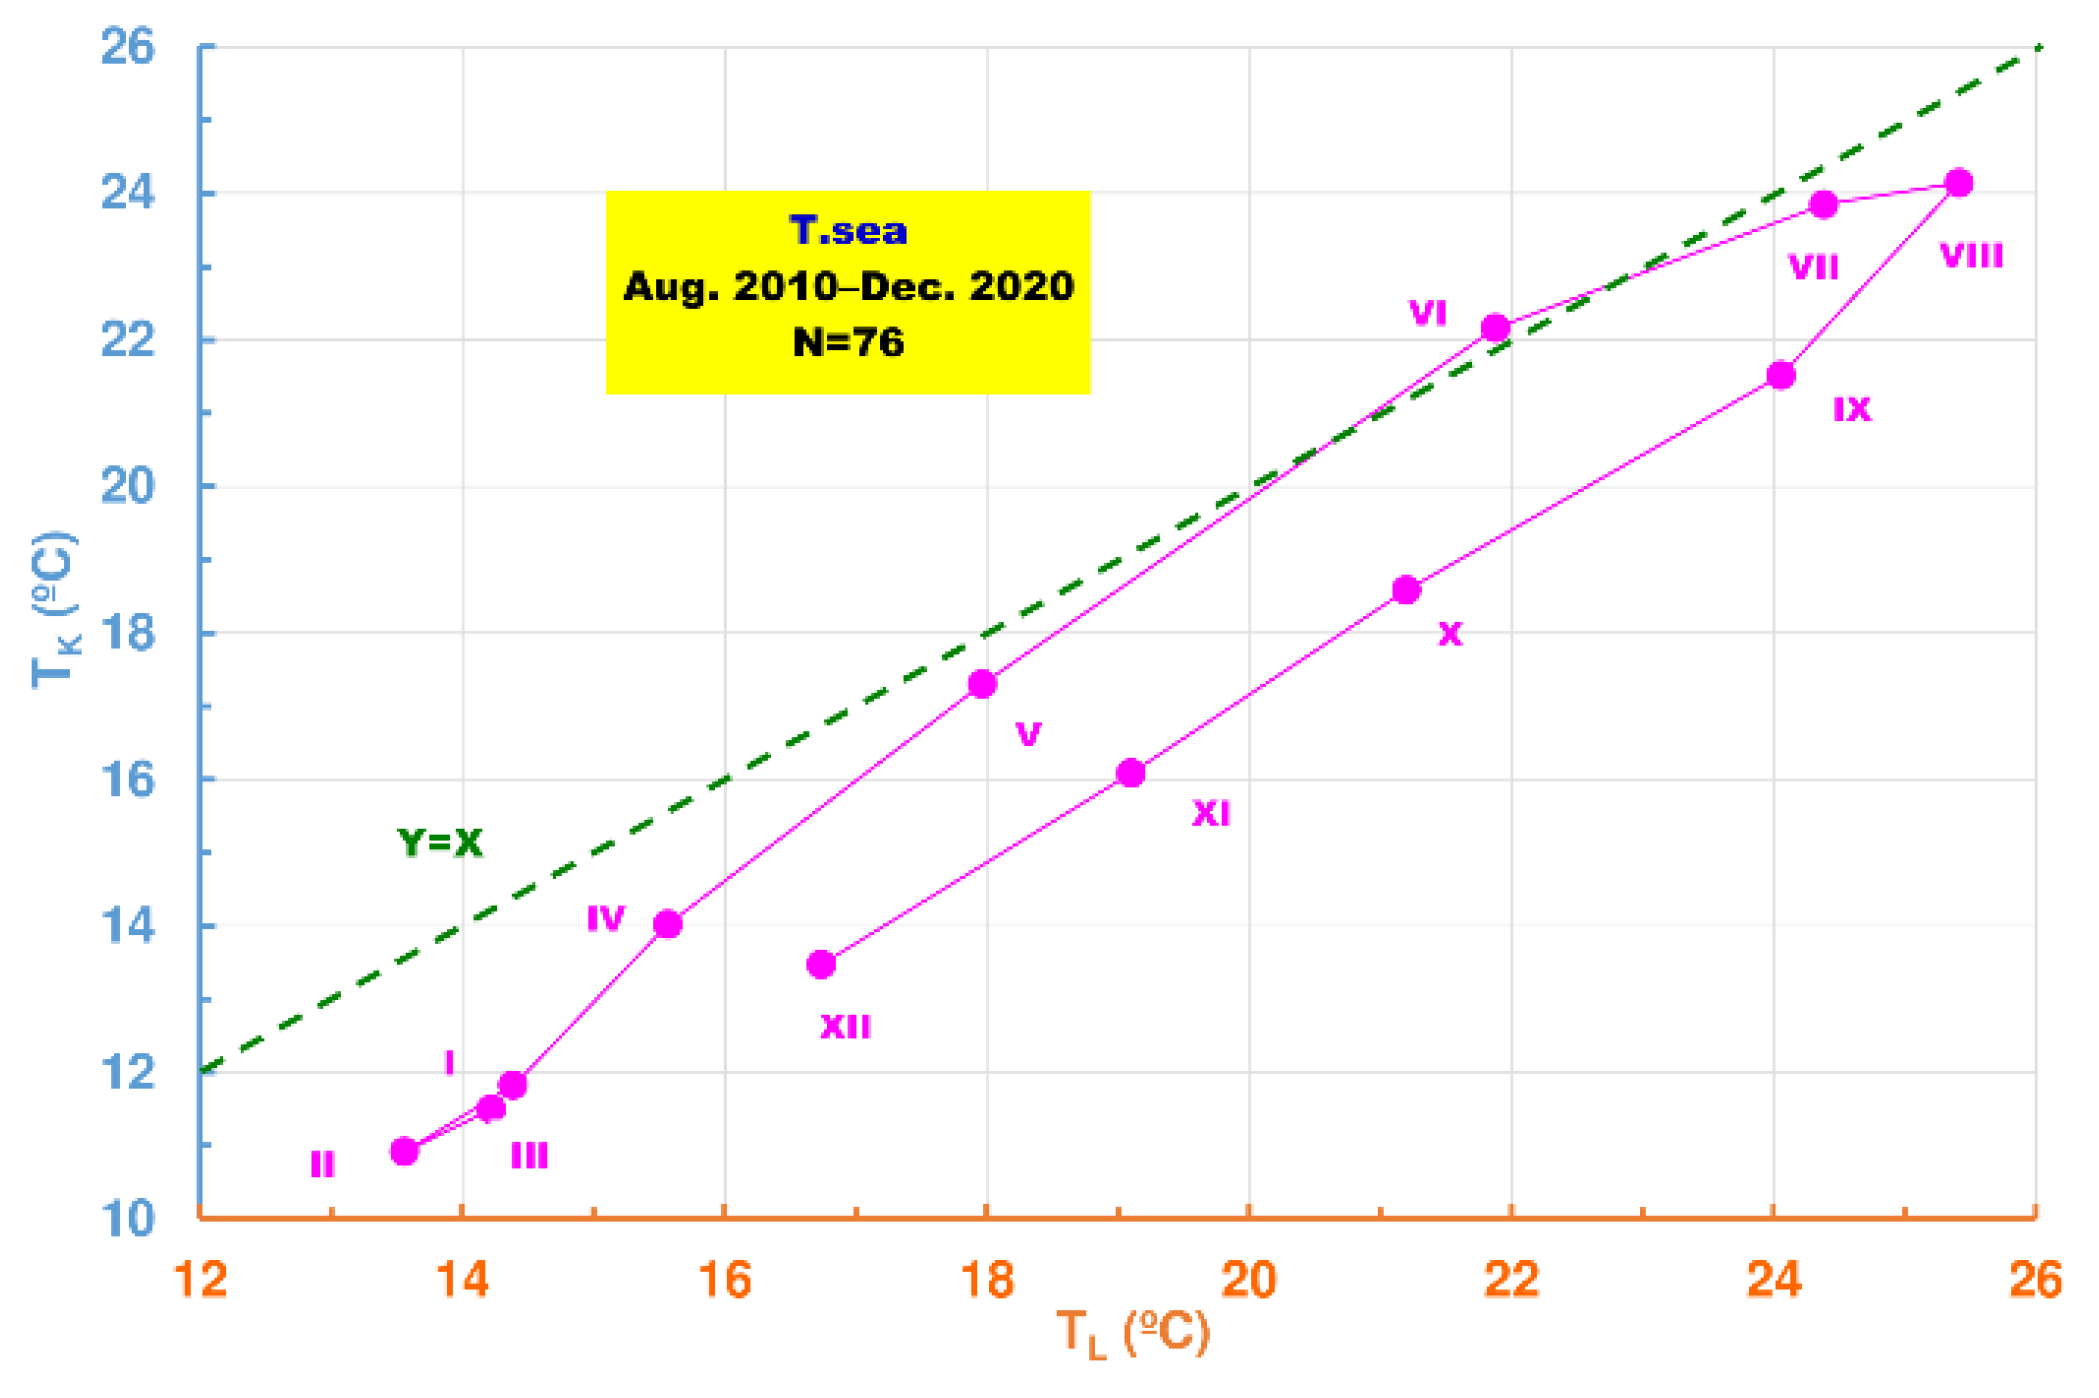
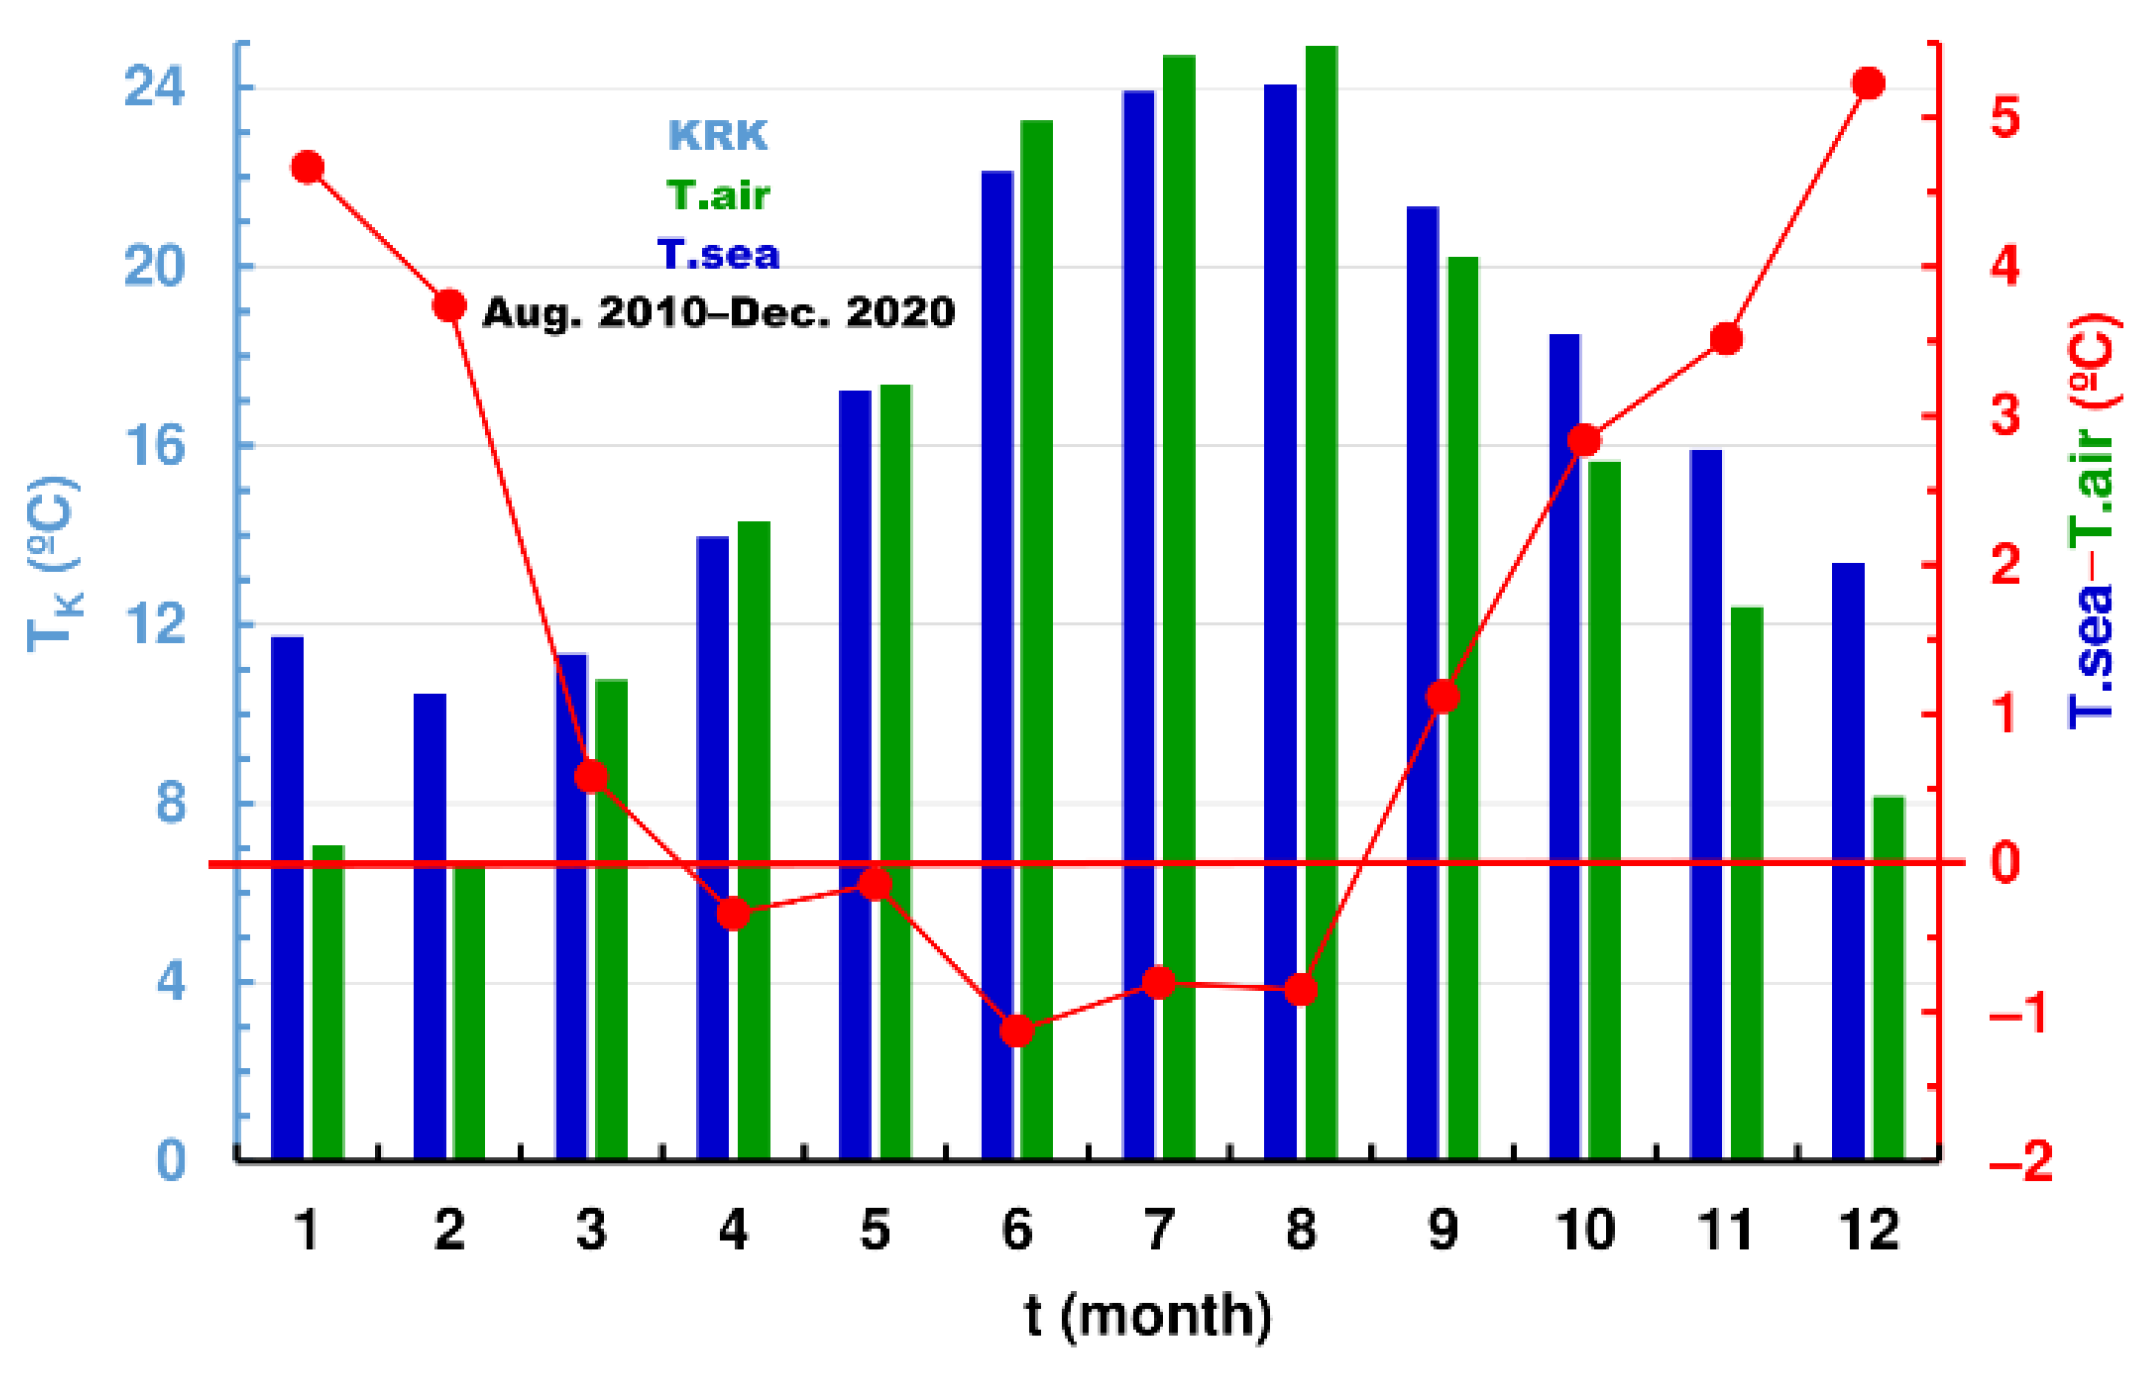
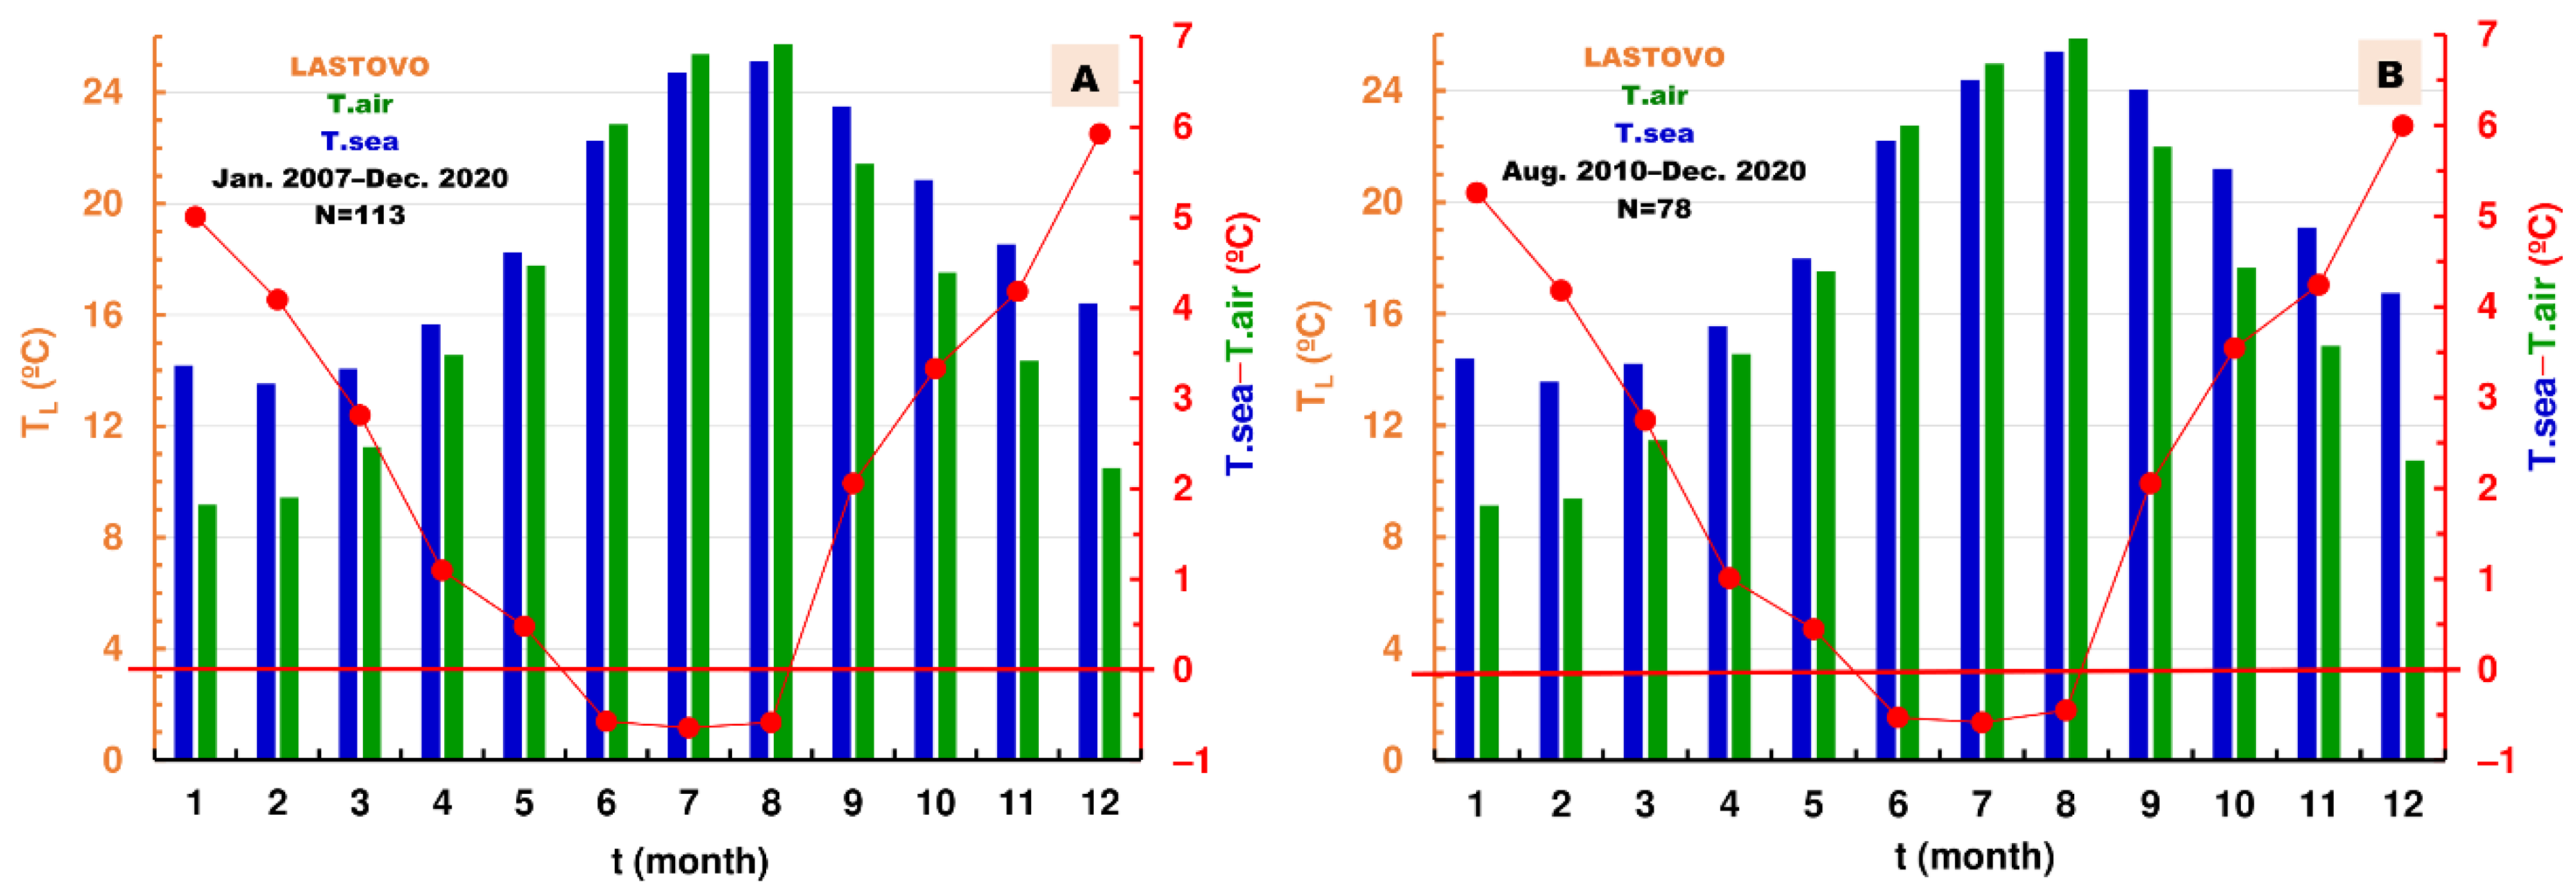
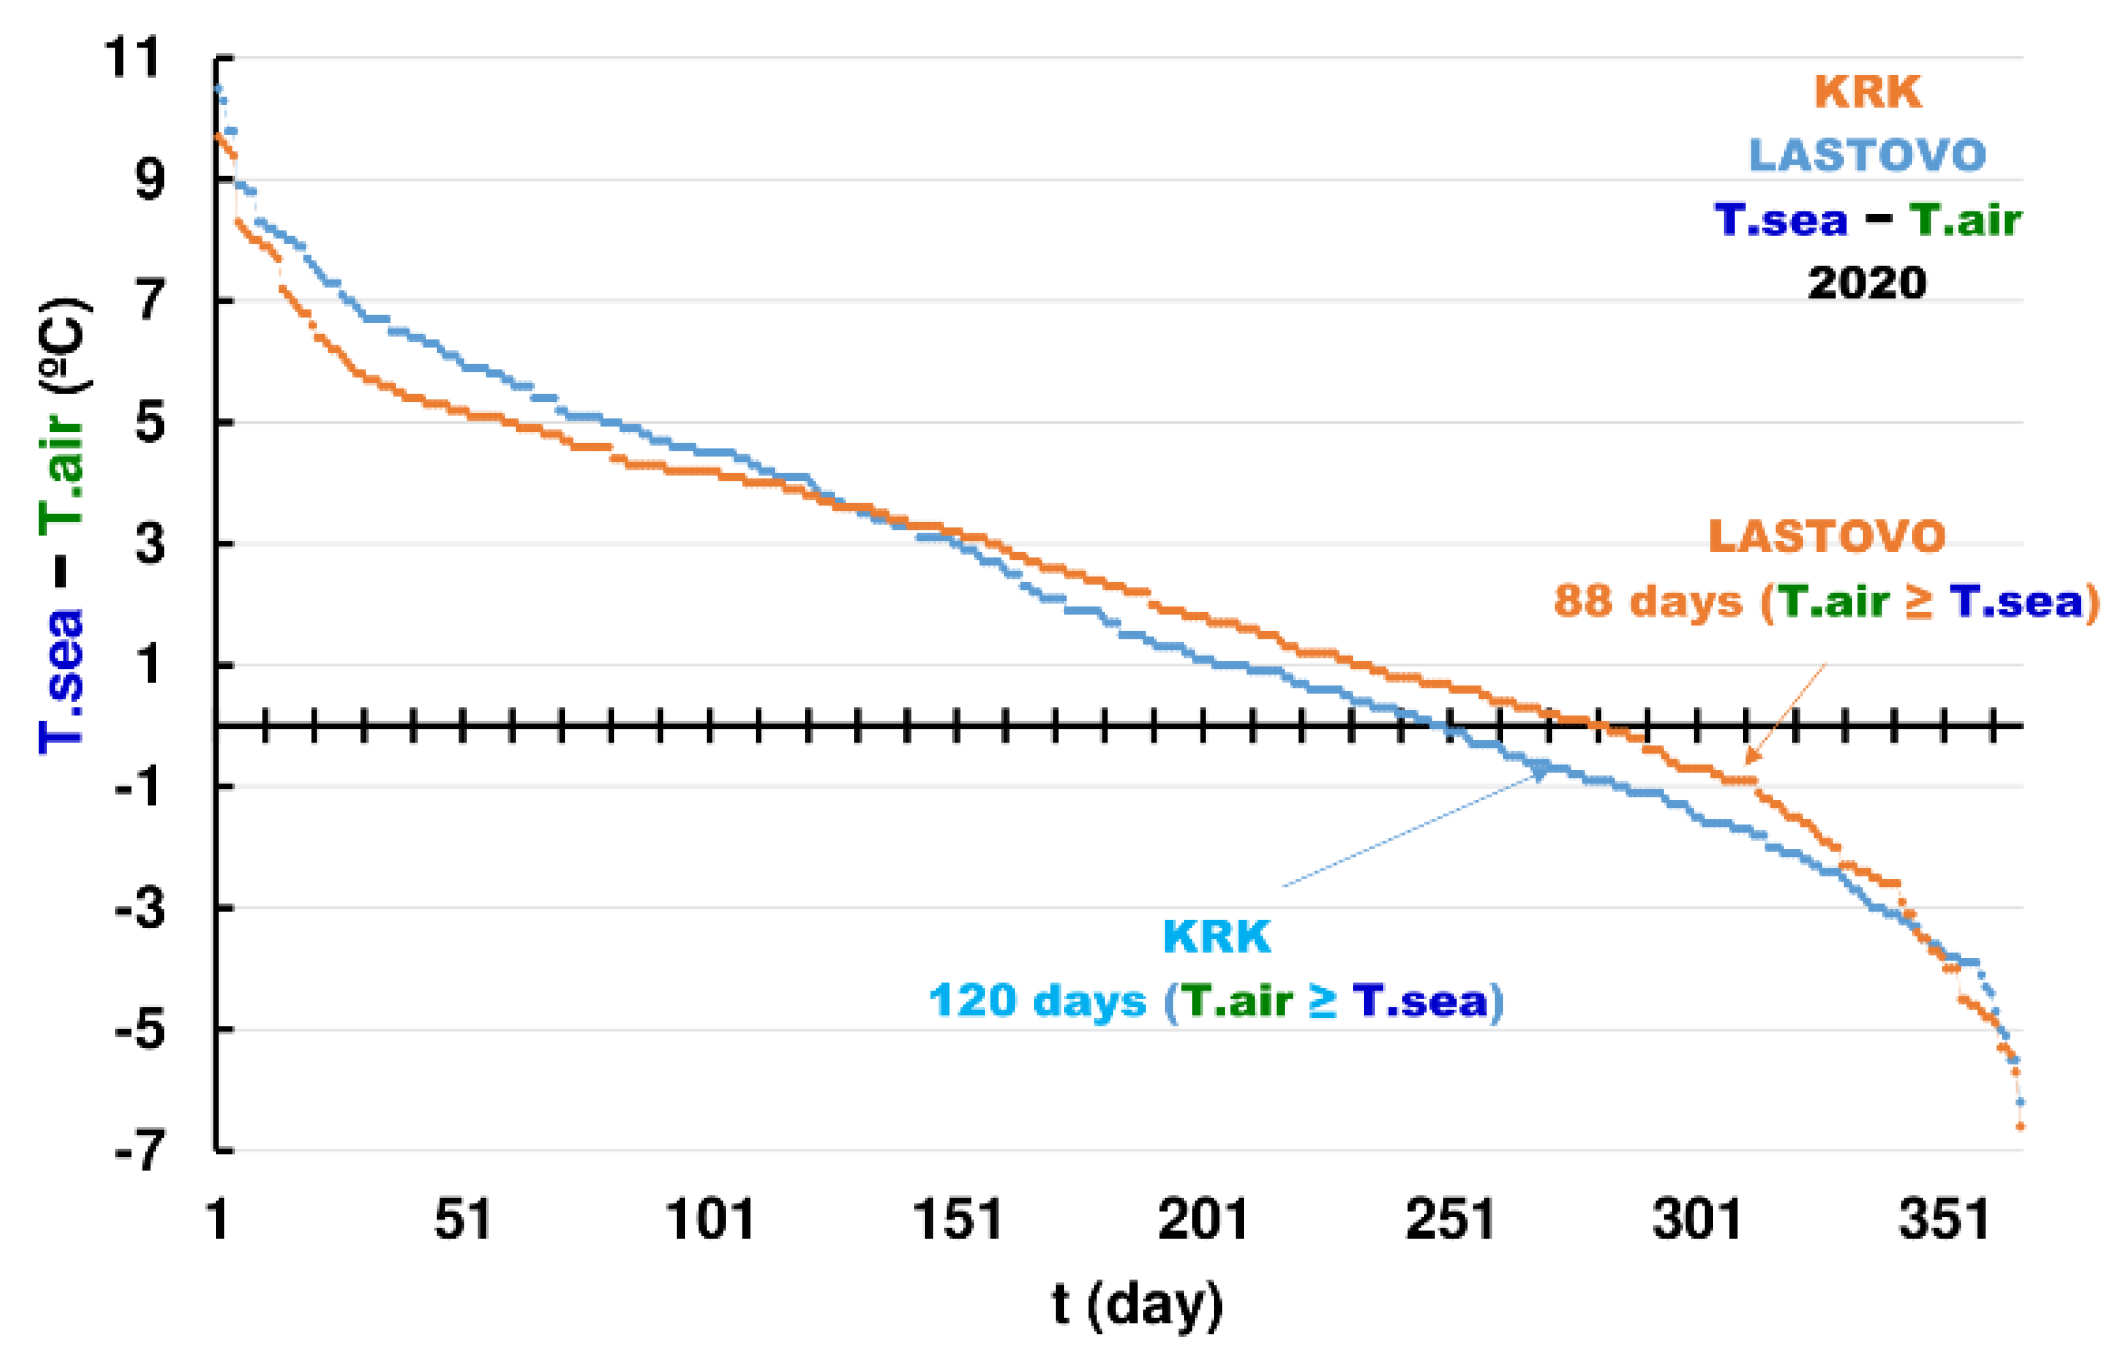
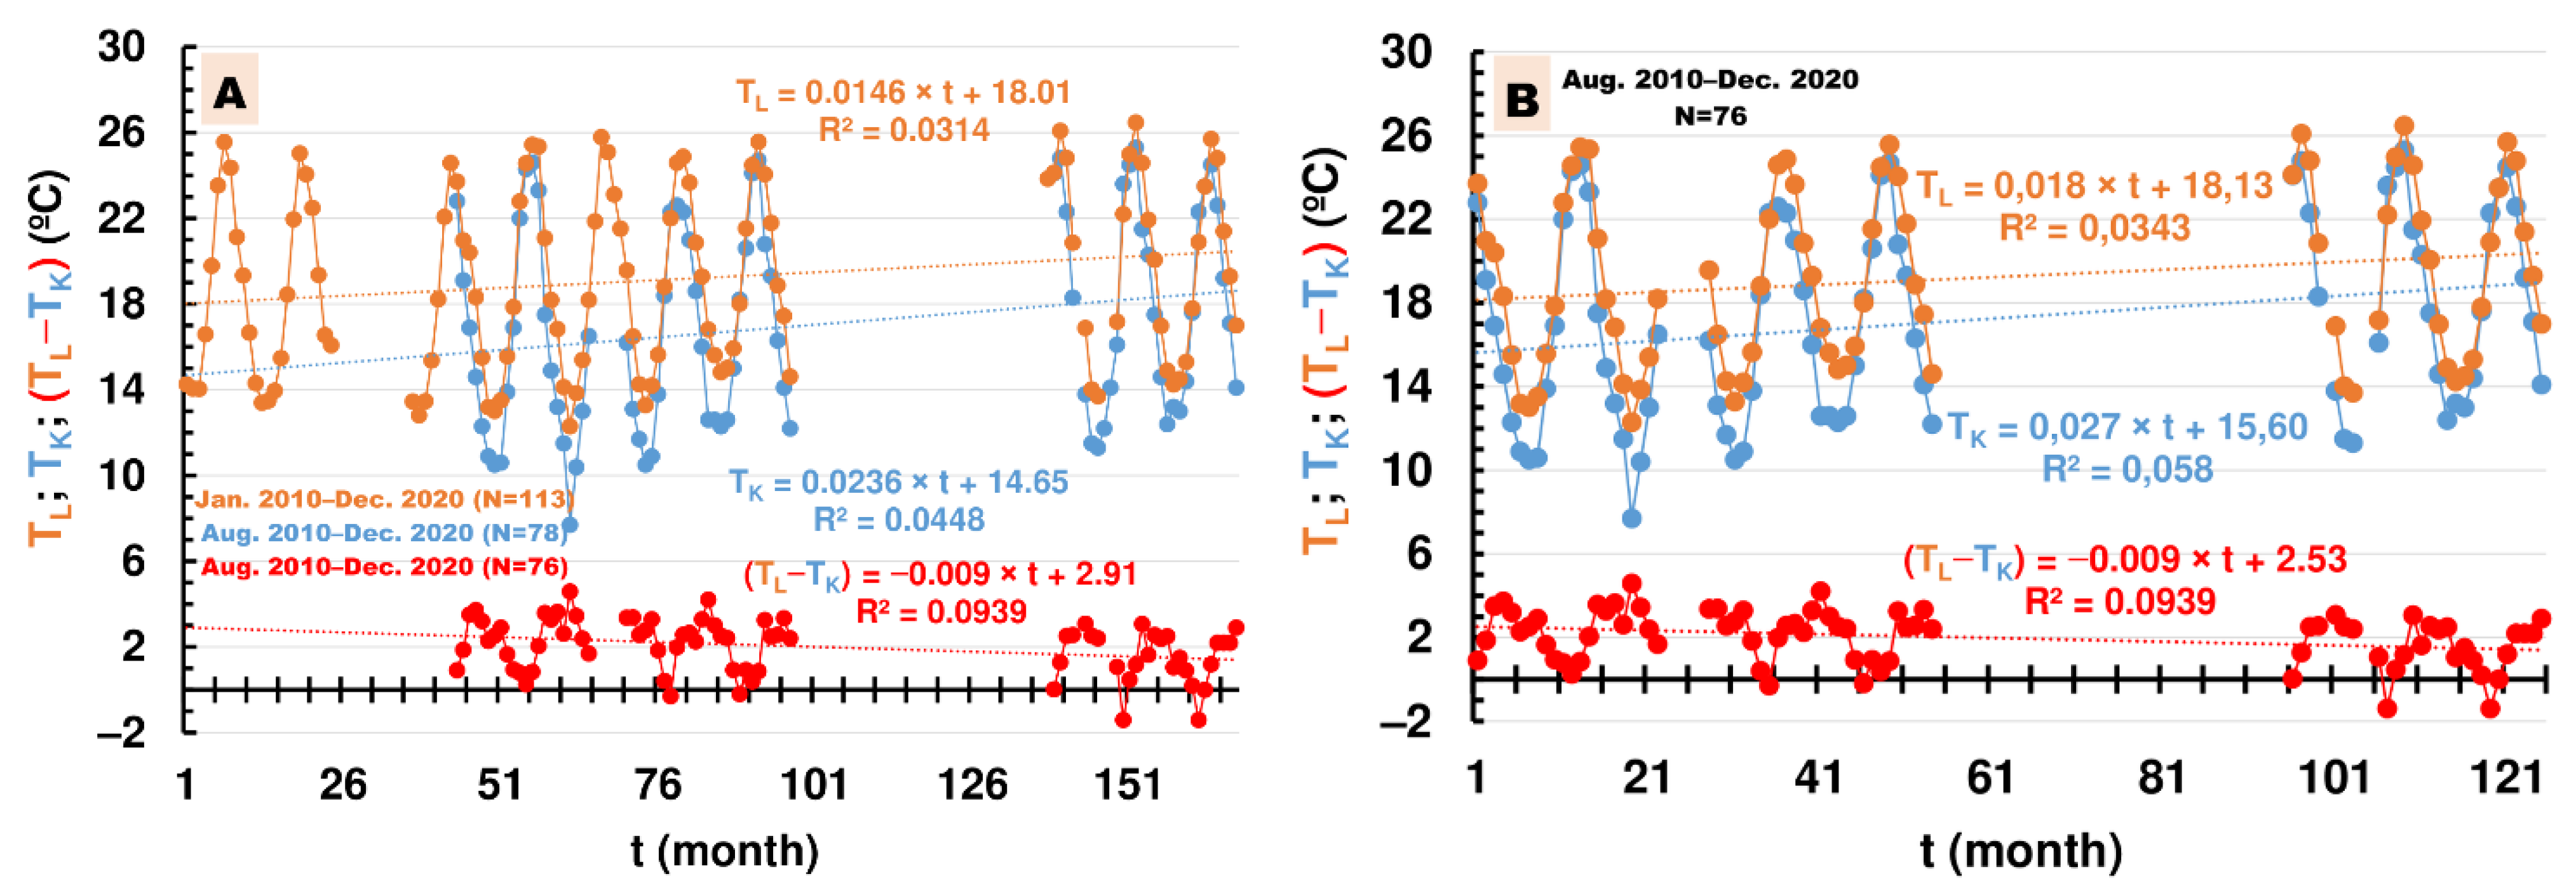
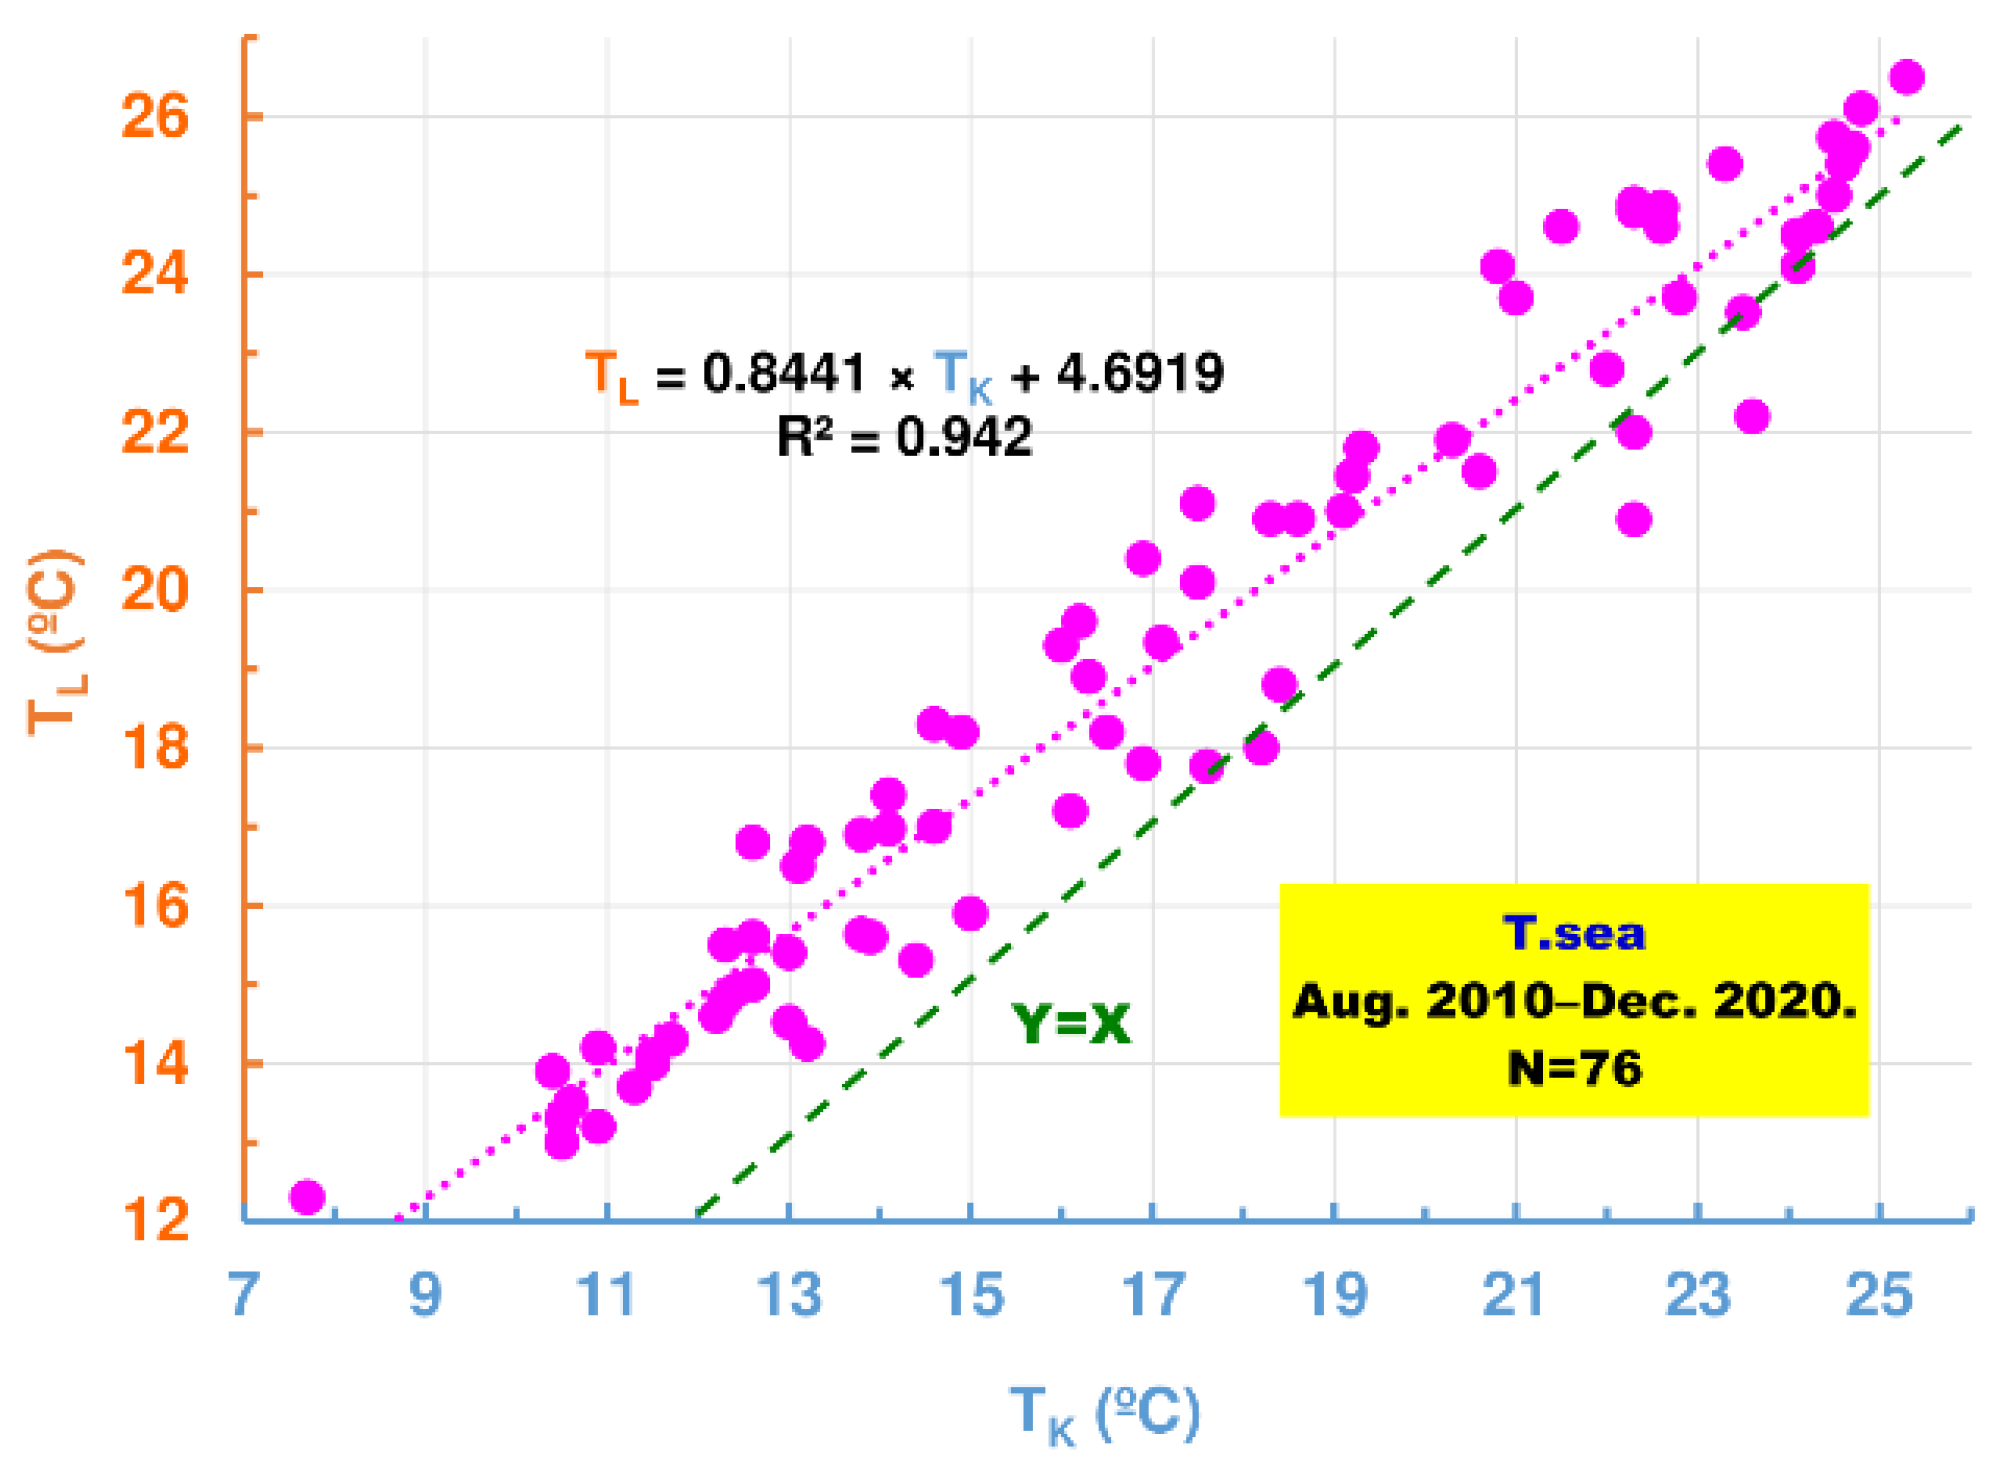
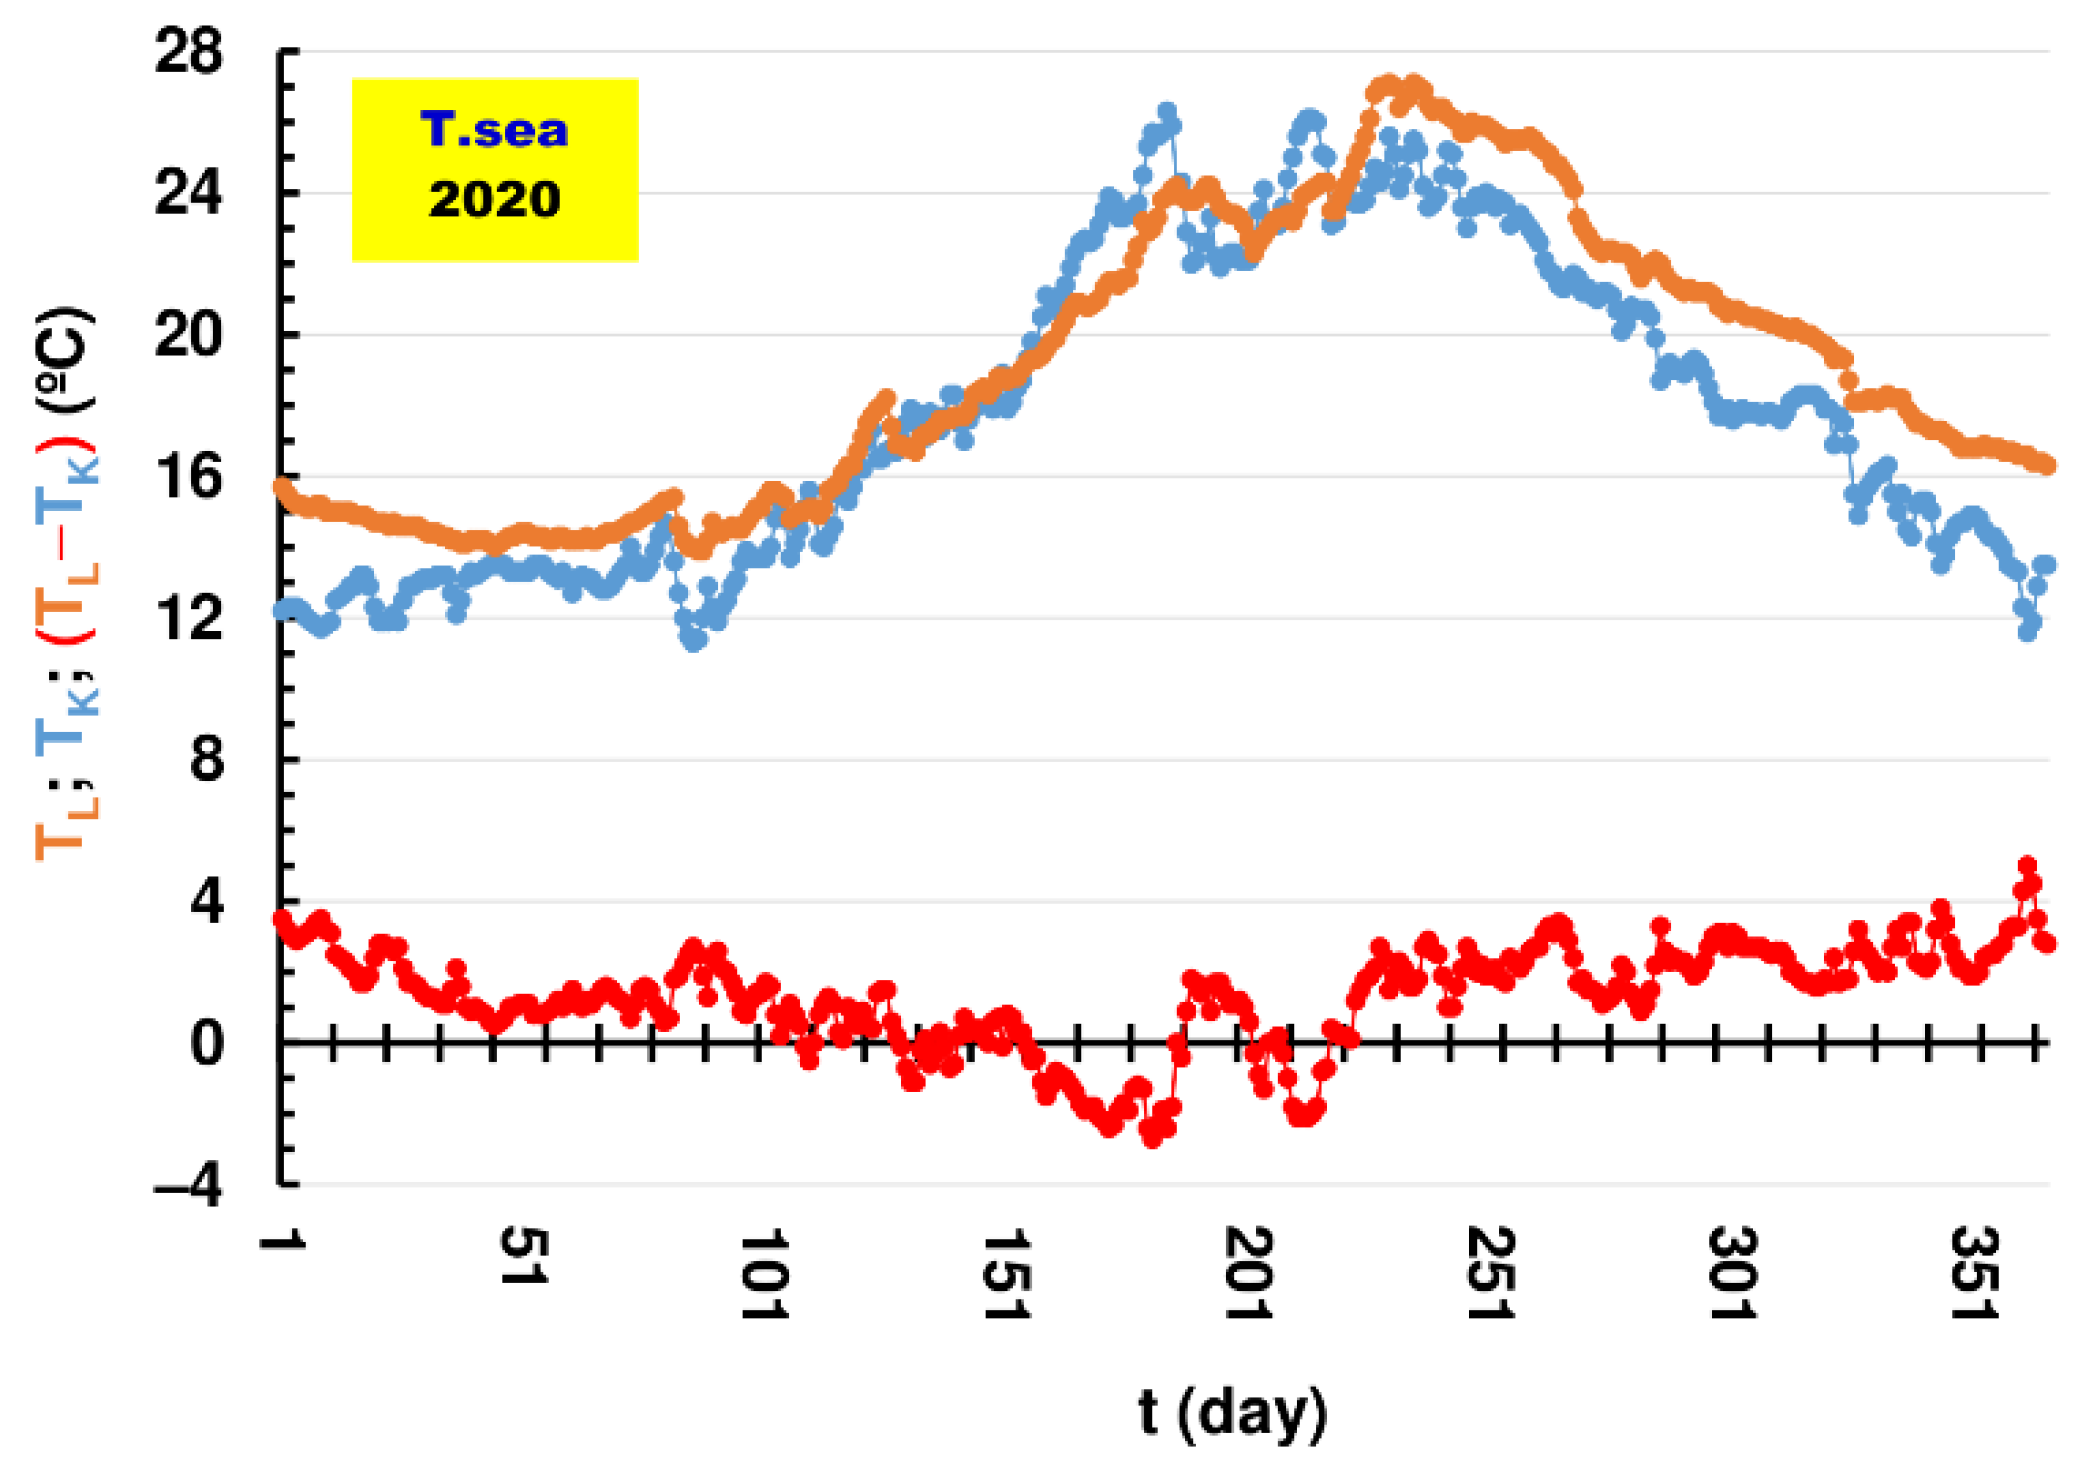
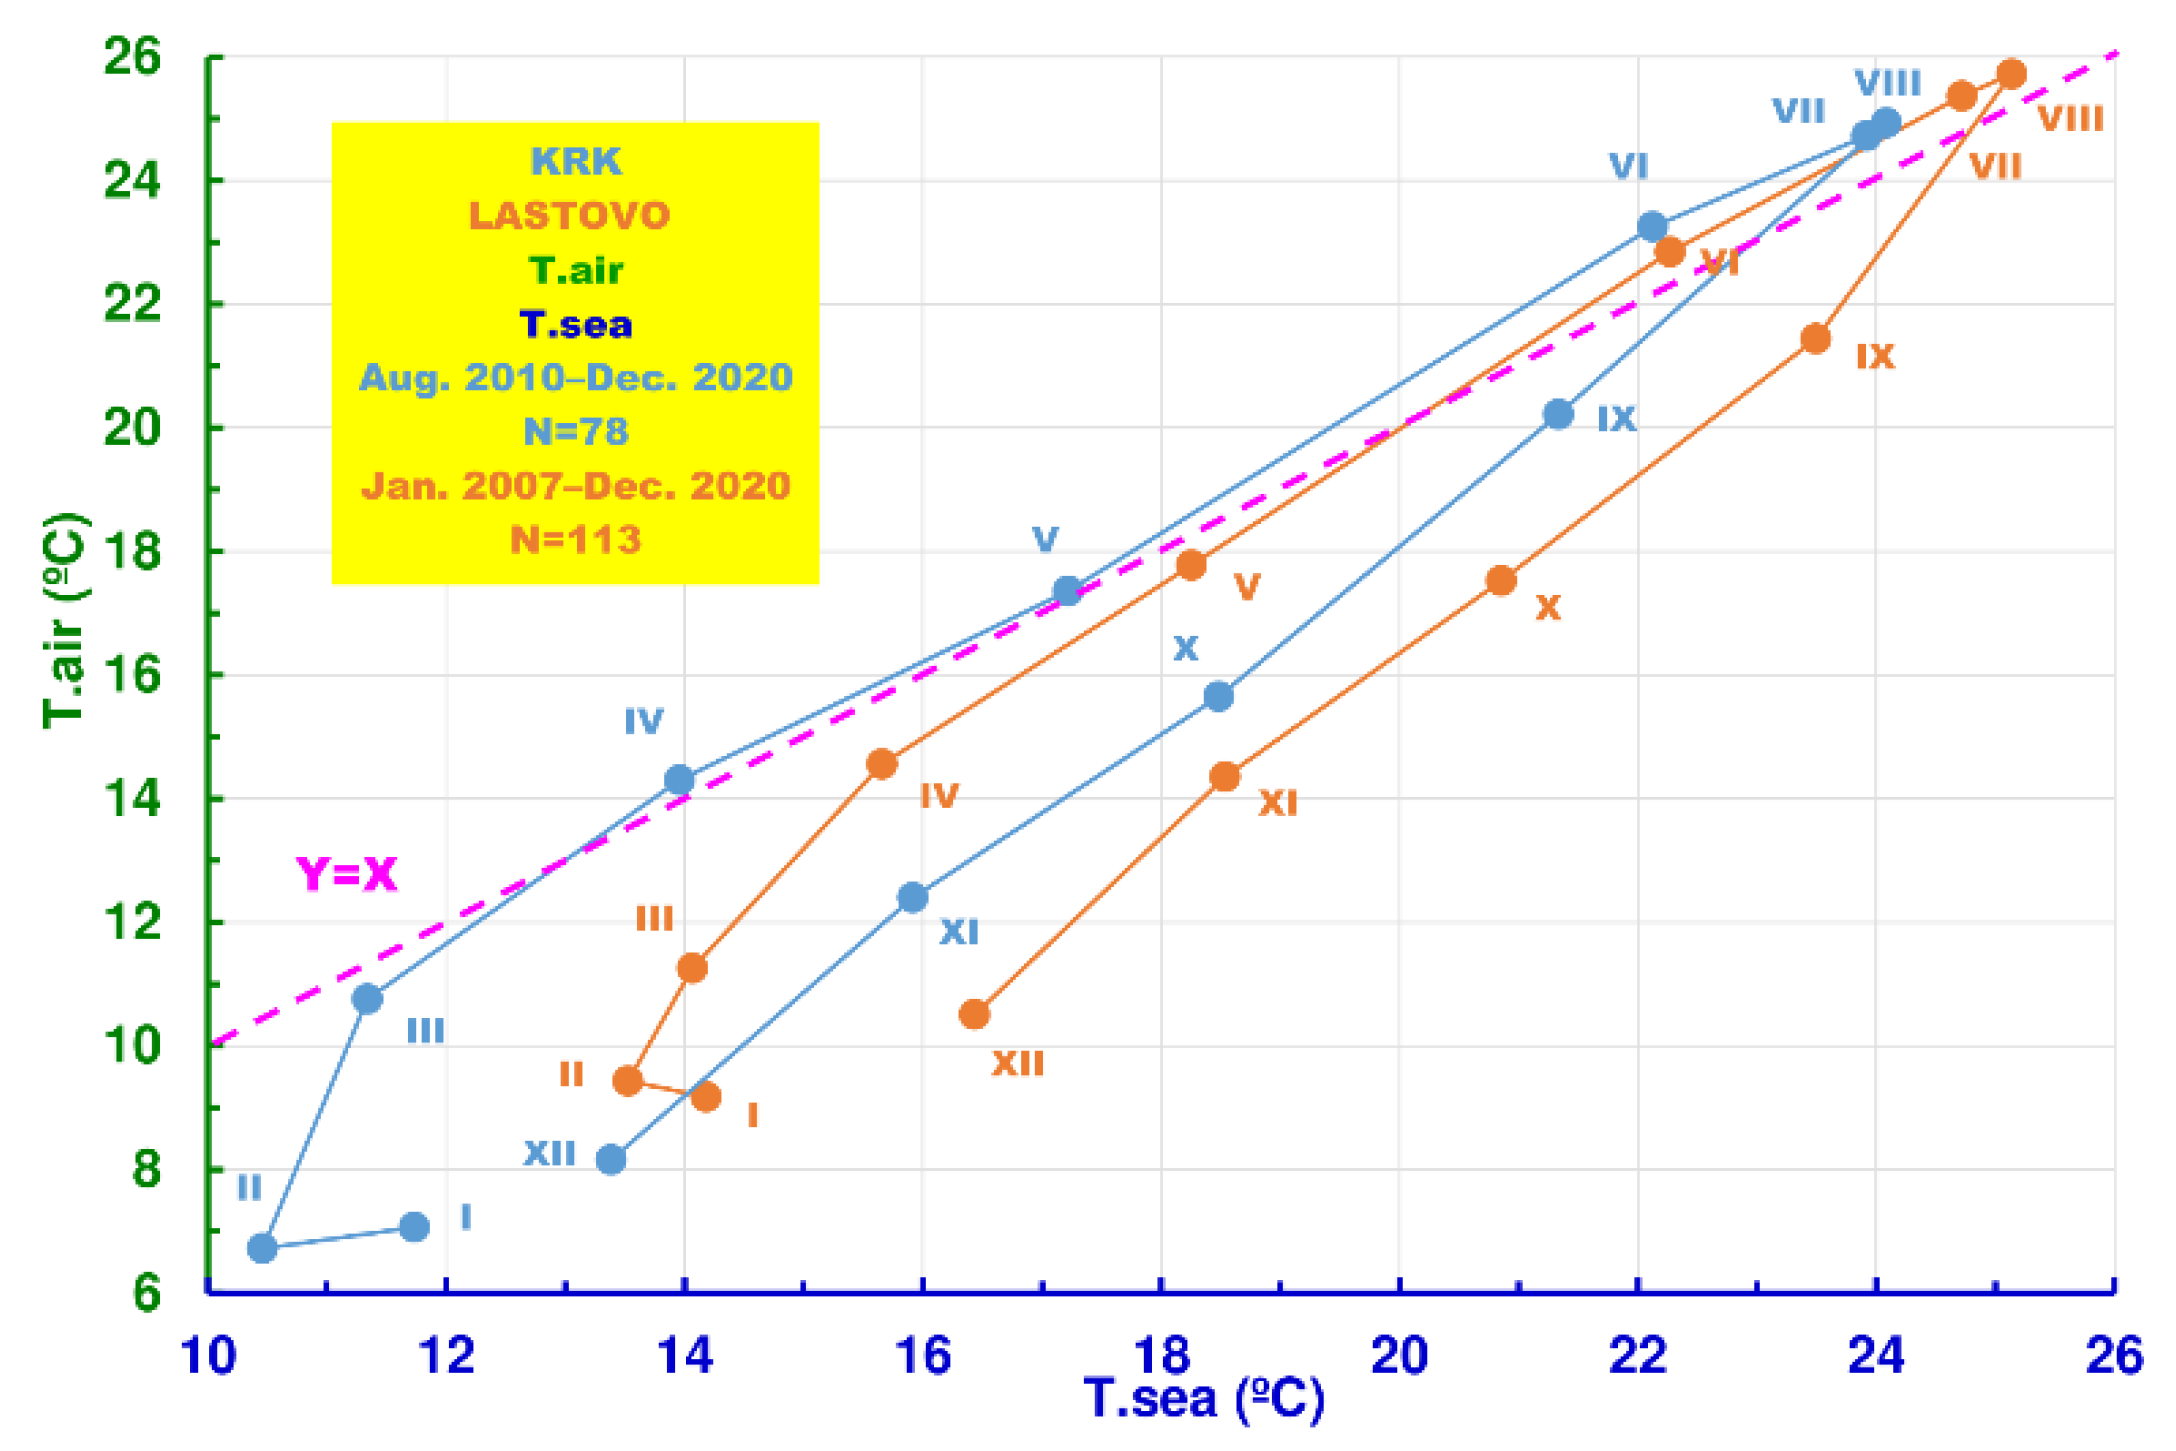
3.5. Analysis of the Relationship between the Mean Monthly and Daily Air Temperatures and Sea Surface Temperatures

This subchapter analyses the relationship between mean monthly and daily air temperatures and sea surface temperatures observed at the Krk and Lastovo stations. These analyses indicate differences in the behaviour of the air–sea temperature relationship in the northern and southern Adriatic. Figure 13 shows histograms of the average values of the mean monthly sea surface temperatures (blue) and air temperature (green), and a series of their differences (red) observed on Krk in the period from July 2010 to December 2020 for pairs of months (N = 78) when both climatological parameters were monitored.
Figure 14A,B show histograms of the average monthly mean sea surface temperatures (blue) and air temperatures (green) and the series of their differences (red) observed on Lastovo in the period from January 2007 to December 2020 (13A) (N = 113) and from July 2010 to December 2020 (13B) (N = 78). It is important to note that on Krk, the average monthly sea surface temperatures lower than the average monthly air temperatures occur over five months, from April to August. On Lastovo, this happens only over three months, from June to August. The previously stated conclusion is additionally and, in more detail, confirmed by the relationship between average monthly air temperatures (ordinate axis) and sea surface temperature (abscissa axis) at the stations Krk (blue colour) and Lastovo (brown colour) presented in Figure 15.
The duration curves of the differences between the mean daily sea surface temperatures of Lastovo (brown) and Krk (blue) calculated for 2020 are plotted in Figure 16. It is important to note that on Krk, the air temperature was 120 days (32.8% of the year) higher or equal to the sea surface temperature, while on Lastovo the sea surface temperature in the same year was lower or equal to the air temperature of 88 days or 24.0% of the year.

4. Conclusions

In a series of 29 analysed years, the minimum annual air temperatures were, on average, 4.45 °C higher on Lastovo than on Krk, while the maximum annual air temperatures on Krk were, on average, higher than those on Lastovo by 0.52 °C. The average value of the mean annual air temperatures on Lastovo was 1.29 °C higher than on Krk. The series of the minimum and maximum annual air temperatures at both locations showed a slight increase, while the series of the mean annual temperatures showed a more pronounced upward trend. It is important to note that the series of differences between all three characteristic air temperatures of Lastovo and Krk are slightly smaller. From the latter, it might be concluded that the global warming process has a stronger impact on air temperatures in the northern than in the southern Adriatic. The position of the measurement site also has a certain influence on the different behaviour of sea surface temperatures during the year. On Krk, it is measured in the port, while on Lastovo it is measured in an almost uninhabited bay.
The average mean monthly air temperatures on Lastovo are higher throughout the year than those on Krk. The greatest differences occur in the cold season (November to February), while the difference in June is insignificant. The situation is similar to the average mean monthly sea surface temperatures, which, in June, is lower on Lastovo than Krk.
Although, due to the different and incomplete available time series, it was impossible to draw reliable conclusions in this paper, it seems that both air temperature and sea surface temperature have a faster upward trend on Krk than on Lastovo. On Krk, the sea surface temperature heats up faster (at the end of May and the beginning of June), but it also cools down faster than on Lastovo. The cooling process on Krk starts at the end of July or the beginning of August, while on Lastovo it occurs at the end of August or even at the beginning of September, in some years.
On Krk, the average sea surface temperatures are lower than the average air temperatures during the five months from April to August, while on Lastovo this happens only during the three months from June to August.
The analysis performed in this paper should be a serious incentive for more detailed and complex interdisciplinary study of air and sea temperature throughout the Adriatic. A prerequisite for fulfilling this important task is the establishment of new locations for the sea surface temperature measurements to be performed.
In this paper, as well as in many others [8,30,31,32], a positive trend for both sea surface temperature and air temperature for the Mediterranean and Adriatic Sea had been detected, with a lag between them [48,49]. In addition to the increase in sea temperature, an increase in salinity has also been observed as a result of reduced river inflow and increased evaporation [50]. Substantial changes indicate a weakening of the Adriatic-Ionian thermohaline cell, especially in the north-western part and could be a consequence of the ongoing climate change in the Mediterranean [50,51]. This fact points to the impact that the long-term sea surface temperature warming trend in the Adriatic Sea has already had on marine fauna and the implications of climate change on the population and development of the Adriatic islands.
The small number of stations where sea surface temperature is measured and the short series of observation significantly affect the possibility of adopting reliable and effective measures to mitigate the negative effects of climate change on the islands and coast, not only of the Adriatic Sea but the entire Mediterranean [52]. Advancing knowledge about relationship between air and sea surface temperatures in different locations, especially small islands and coastal areas, can be of great help in analysing, understanding, and coping with the observed and expected future climate change in various sea–land environments and/or landscapes. Limited water and soil resources on our karst islands and coastline with insufficiently controlled and often unsustainable anthropogenic activities (e.g., mass tourism, land use conversion, excessive groundwater abstraction, urbanization, apartment zing, etc.) are increasingly reducing the possibility to adapt not only to existing but also to future climate changes.
It is important to state the conclusions regarding the behaviour of sea surface temperature in the south-eastern part of the Mediterranean Sea were obtained based on the analysis of the series measured in the period 1948–2008. Maiyza et al. [5] observed the presence of a cycle of changing upward and downward trends that fluctuated from 8 to 15 years and acknowledged the possibility that they might be associated with 11-year cycles of solar activity.
This paper pointed out the need to approach monitoring much more systematically, especially of the sea surface temperature in the Adriatic, and to intensify interdisciplinary scientific research on the relationship of air temperature and other climatic parameters with sea surface temperatures, in order to better prepare for an uncertain climate future, which carries several, potentially very dangerous, challenges.

Author Contributions

Conceptualization, data curation, formal analysis, investigation and writing—original draft preparation, O.B.; writing—review and editing, A.V. All authors have read and agreed to the published version of the manuscript.

Funding

This work is co-financed through the project “VODIME—Vode Imotske krajine” (KK.05.1.1.02.0024), a project funded by the Government of the Republic of Croatia and the European Union through the European Structural Funds, as part of the tender “Shema za jačanje primijenjenih istraživanja za mjere prilagodbe klimatskim promjenama (Scheme for strengthening of applied research for adaptation to climate change)” (CC.05.1.1.02.). This research is partly co-financed through the project KK.01.1.1.02.0027, co-financed by the Government of the Republic of Croatia and the European Union through the “European Regional Development Fund—the Competitiveness and Cohesion Operational Program”.

Institutional Review Board Statement

Not applicable.

Informed Consent Statement

Not applicable.

Data Availability Statement

Not applicable.

Conflicts of Interest

The authors declare no conflict of interest.

References

  1. Moatti, J.-P.; Thiébault, S. The Mediterranean Region under Climate Change. A Scientific Update: Abridged English/French Version; Allenvi: Marseille, France, 2016. [Google Scholar]
  2. Coll, M.; Piroddi, C.; Steenbeek, J.; Kaschner, K.; Ben Rais Lasram, F.; Aguzzi, J.; Ballesteros, E.; Bianchi, C.N.; Corbera, J.; Dailianis, T.; et al. The Biodiversity of the Mediterranean Sea: Estimates, Patterns, and Threats. PLoS ONE 2010, 5, e11842. [Google Scholar] [CrossRef] [Green Version]
  3. Pascual, M.; Rives, B.; Schunter, C.; Macpherson, E. Impact of life history traits on gene flow: A multispecies systematic review across oceanographic barriers in the Mediterranean Sea. PLoS ONE 2017, 12, e0176419. [Google Scholar] [CrossRef] [PubMed]
  4. Bouzinac, C.; Font, J.; Johannessen, J. Annual cycles of sea level and sea surface temperature in the western Mediterranean Sea. J. Geophys. Res. Earth Surf. 2003, 108, 1–20. [Google Scholar] [CrossRef] [Green Version]
  5. Maiyza, I.; Said, M.; Kamel, M. Sea Surface Temperature Anomalies in the South Eastern Mediterranean Sea. J. King Abdulaziz Univ. Sci. 2010, 21, 151–159. [Google Scholar] [CrossRef]
  6. Stocker, T.F.; Qin, D.; Plattner, G.-K.; Tignor, M.M.B.; Allen, S.K.; Boschung, J.; Nauels, A.; Xia, Y.; Bex, V.; Midgley, P.M. IPCC, 2013: Summary for Policymakers. In Climate Change 2013: The Physical Science Basis; Contribution of Working Group I to the Fifth Assessment Report of the IPCC; Cambridge University Press: Cambridge, UK, 2013. [Google Scholar]
  7. European Environment Agency. Mediterranean Sea Region Briefing—The European Environment—State and Outlook 2015; European Environment Agency: Copenhagen, Denmark, 2015. [Google Scholar]
  8. Pastor, F.; Valiente, J.; Khodayar, S. A Warming Mediterranean: 38 Years of Increasing Sea Surface Temperature. Remote Sens. 2020, 12, 2687. [Google Scholar] [CrossRef]
  9. Woodward, J. The Physical Geography of the Mediterranean; Woodward, J., Ed.; Oxford University Press: New York, USA, 2009; ISBN 9780199268030.2009. [Google Scholar]
  10. Duplačić Leder, T.; Ujević, T.; Čala, M. Coastline Lengths and Areas of Islands in the Croatian Part of the Adriatic Sea Determined from the Topographic Maps at the Scale of 1:25,000. Geoadria 2004, 9, 5–32. [Google Scholar]
  11. Filipčić, A. Razgraničenje Köppenovih Klimatskih Tipova Cf i Cs u Hrvatskoj. Acta Geogr. Croat. 2000, 35, 7–18. [Google Scholar]
  12. Geiger, R.; Pohl, W. Eine Neue Wandkarte der Klimagebiete der Erde Nach W. Köppens Klassifikation (A New Wall Map of the Climatic Regions of the World According to W. Köppen’s Classification). Erdkunde 1954, 8, 58–61. [Google Scholar]
  13. Šegota, T.; Filipčić, A. Köppenova podjela klima i hrvatsko nazivlje. Geoadria 2003, 8, 17–37. [Google Scholar] [CrossRef] [Green Version]
  14. Köppen, W. Klassifikation Der Klimate Nach Temperatur, Niederschlag Und Jahresablauf. Petermanns Geogr. Mitt. 1918, 64, 193–203. [Google Scholar]
  15. Köppen, W.; Geiger, R. Handbuch der Klimatologie: Das Geographische System der Klimate; Verlag vod Gebrüder Borntraeger: Berlin, Germany, 1936. [Google Scholar]
  16. Vlahakis, G.N.; Pollatou, R.S. Temporal variability and spatial distribution of Sea Surface Temperatures in the Aegean Sea. Theor. Appl. Climatol. 1993, 47, 15–23. [Google Scholar] [CrossRef]
  17. Bartolini, G.; di Stefano, V.; Maracchi, G.; Orlandini, S. Mediterranean Warming Is Especially Due to Summer Season Evidences from Tuscany (Central Italy). Theor. Appl. Climatol. 2012, 107, 279–295. [Google Scholar] [CrossRef]
  18. Grbec, B.; Morović, M.; Matić, F.; Ninčević Gladan, Ž.; Marasović, I.; Vidjak, O.; Bojanić, N.; Čikeš Keč, V.; Zorica, B.; Kušpilić, G.; et al. Climate Regime Shifts and Multi-Decadal Variability of the Adriatic Sea Pelagic Ecosystem. Acta Adriat. 2015, 56, 47–66. [Google Scholar]
  19. Bonacci, O. Air temperature and precipitation analyses on a small Mediterranean island: The case of the remote island of Lastovo (Adriatic Sea, Croatia). Acta Hydrotech. 2019, 32, 135–150. [Google Scholar] [CrossRef]
  20. Bonacci, O.; Patekar, M.; Pola, M.; Roje-Bonacci, T. Analyses of Climate Variations at Four Meteorological Stations on Remote Islands in the Croatian Part of the Adriatic Sea. Atmosphere 2020, 11, 1044. [Google Scholar] [CrossRef]
  21. Bonacci, O.; Bonacci, D.; Roje-Bonacci, T. Different air temperature changes in continental and Mediterranean regions: A case study from two Croatian stations. Theor. Appl. Climatol. 2021, 145, 1333–1346. [Google Scholar] [CrossRef]
  22. Bonacci, O. University of Split Faculty of Civil Engineering Architecture and Geodesy; Ljubenkov, I.; Roje-Bonacci, T. Different Climate Changes at Two Locations on a Small Karst Island Korčula (Adriatic Sea, Croatia). Nase More 2021, 68, 1–13. [Google Scholar] [CrossRef]
  23. Bonacci, O.; Ljubenkov, I. Različite Vrijednosti i Trendovi Temperatura Zraka Na Dvije Postaje Na Malom Otoku: Slučaj Meteoroloških Postaja Korčula i Vela Luke Na Otoku Korčuli. Hrvat. Vode 2020, 28, 183–196. [Google Scholar]
  24. Bonacci, O.; Bonacci, D.; Roje-Bonacci, T. Relationship between the Sea Surface and Surface Air Temperature: A Case of the Island of Hvar (Adriatic Sea, Croatia). Geoadria 2021, 26, 7–34. [Google Scholar] [CrossRef]
  25. Bonacci, O.; Bonacci, D.; Roje-Bonacci, T. Analize Temperatura Površine Mora i Zraka Mjerenih Na Tri Postaje u Hrvatskom Dijelu Srednjeg Jadrana. Hrvat. Vode 2021, 29, 113–126. [Google Scholar]
  26. Bonacci, O.; Bonacci, D.; Patekar, M.; Pola, M. Increasing Trends in Air and Sea Surface Temperature in the Central Adriatic Sea (Croatia). J. Mar. Sci. Eng. 2021, 9, 358. [Google Scholar] [CrossRef]
  27. Bonacci, O.; Bonacci, D. Analiza Temperatura Vazduha Na Ostrvu Palagruža Na Pučini Jadranskog Mora. Vodoprivreda 2020, 52, 215–221. [Google Scholar]
  28. Kavishe, G.M.; Limbu, P.T.S. Variation of October to December rainfall in Tanzania and its association with sea surface temperature. Arab. J. Geosci. 2020, 13, 534. [Google Scholar] [CrossRef]
  29. Eshetie, G.G. Impact of rainfall variability on crop yields and its relationship with sea surface temperature in northern Ethiopian Highlands. Arab. J. Geosci. 2021, 14, 2347. [Google Scholar] [CrossRef]
  30. Pastor, F. Sea Surface Temperature: From Observation to Applications. J. Mar. Sci. Eng. 2021, 9, 1284. [Google Scholar] [CrossRef]
  31. Iona, A.; Theodorou, A.; Sofianos, S.; Watelet, S.; Troupin, C.; Beckers, J.-M. Mediterranean Sea climatic indices: Monitoring long-term variability and climate changes. Earth Syst. Sci. Data 2018, 10, 1829–1842. [Google Scholar] [CrossRef] [Green Version]
  32. Pisano, A.; Marullo, S.; Artale, V.; Falcini, F.; Yang, C.; Leonelli, F.E.; Santoleri, R.; Nardelli, B.B. New Evidence of Mediterranean Climate Change and Variability from Sea Surface Temperature Observations. Remote Sens. 2020, 12, 132. [Google Scholar] [CrossRef] [Green Version]
  33. Benac, Č.; Tadić, A.; Petrović, V.; Jakupović, D.; Ljubičić, G.; Krvavica, N.; Ružić, I. Ranjivost Obala Otoka Krka. Hrvat. Vode 2021, 29, 187–200. [Google Scholar]
  34. Šegina, E.; Benac, Č.; Šušteršič, F.; Knez, M.; Čar, J. Linear features on karst surfaces: An example from Krk Island. Geol. Croat. 2021, 74, 139–151. [Google Scholar] [CrossRef]
  35. Riđanović, J. Prirodno-Geografske Značajke Otoka Lastova. Hrvat. Geogr. Glas. 1971, 33, 159–174. [Google Scholar]
  36. Dinku, T. Challenges with Availability and Quality of Climate Data in Africa. In Extreme Hydrology and Climate Variability; Elsevier: Amsterdam, The Netherlands, 2019; pp. 71–80. [Google Scholar]
  37. Huntington, H.P.; Archer, E.; Ashley, W.S.; Cutter, S.L.; Goldstein, M.A.; Roncoli, C.; Spero, T.L. Data Availability Principles and Practice. Weather Clim. Soc. 2020, 12, 647–649. [Google Scholar] [CrossRef]
  38. Weiss, A.; Hays, C.J. Calculating daily mean air temperatures by different methods: Implications from a non-linear algorithm. Agric. For. Meteorol. 2005, 128, 57–65. [Google Scholar] [CrossRef]
  39. Bonacci, O.; Željković, I.; Trogrlić, R.; Milković, J. Differences between true mean daily, monthly and annual air temperatures and air temperatures calculated with three equations: A case study from three Croatian stations. Theor. Appl. Climatol. 2013, 114, 271–279. [Google Scholar] [CrossRef]
  40. Bezak, N.; Cerović, L.; Šraj, M. Impact of the Mean Daily Air Temperature Calculation on the Rainfall-Runoff Modelling. Water 2020, 12, 3175. [Google Scholar] [CrossRef]
  41. Liang, G.; Fu, W.; Wang, K. Analysis of t-test misuses and SPSS operations in medical research papers. Burn. Trauma 2019, 7, 1–5. [Google Scholar] [CrossRef] [Green Version]
  42. Walpole, R.E.; Myers, R.H.; Myers, S.L.; Ye, K. Probability & Statistics for Engineers & Scientists, 9th ed.; Pearson, Prentice Hall: Boston, MA, USA, 2012. [Google Scholar]
  43. Barbosa, S.M.; Andersen, O.B. Trend patterns in global sea surface temperature. Int. J. Clim. 2009, 29, 2049–2055. [Google Scholar] [CrossRef]
  44. Grbec, B.; Matić, F.; Beg Paklar, G.; Morović, M.; Popović, R.; Vilibić, I. Long-Term Trends, Variability and Extremes of In Situ Sea Surface Temperature Measured Along the Eastern Adriatic Coast and Its Relationship to Hemispheric Processes. Pure Appl. Geophys. 2018, 175, 4031–4046. [Google Scholar] [CrossRef]
  45. Vilibić, I.; Dunić, N.; Peharda, M. Near-Surface Ocean Temperature Variations across Temporal Scales in the Coastal Eastern Adriatic. Cont. Shelf Res. 2022, 245, 104786. [Google Scholar] [CrossRef]
  46. Gačić, M.; Borzelli, G.L.E.; Civitarese, G.; Cardin, V.; Yari, S. Can Internal Processes Sustain Reversals of the Ocean Upper Circulation? The Ionian Sea Example. Geophys. Res. Lett. 2010, 37, LO9608. [Google Scholar] [CrossRef]
  47. Sousa, P.M.; Trigo, R.M.; Barriopedro, D.; Soares, P.M.M.; Santos, J.A. European Temperature Responses to Blocking and Ridge Regional Patterns. Clim. Dyn. 2018, 50, 457–477. [Google Scholar] [CrossRef]
  48. Ferrarese, S.; Cassardo, C.; Elmi, A.; Genovese, R.; Longhetto, A.; Manfrin, M.; Richiardone, R. Air-Sea Interactions in the Adriatic Basin: Simulations of Bora and Sirocco Wind Events. In Proceedings of the Geofizika; Andrija Mohorovicic Geophysical Institute: Zagreb, Croatia, 2009; Volume 26. [Google Scholar]
  49. Gačić, M.; Santoleri, R.; Bergamasco, A.; Marullo, S. Analysis of the seasonal and interannual variability of the sea surface temperature field in the Adriatic Sea from AVHRR data (1984–1992). J. Geophys. Res. Earth Surf. 1997, 102, 22937–22946. [Google Scholar] [CrossRef]
  50. Vilibić, I.; Šepić, J.; Proust, N. Weakening thermohaline circulation in the Adriatic Sea. Clim. Res. 2013, 55, 217–225. [Google Scholar] [CrossRef]
  51. Mihanović, H.; Vilibić, I.; Šepić, J.; Matić, F.; Ljubešić, Z.; Mauri, E.; Gerin, R.; Notarstefano, G.; Poulain, P.-M. Observation, Preconditioning and Recurrence of Exceptionally High Salinities in the Adriatic Sea. Front. Mar. Sci. 2021, 8, 834. [Google Scholar] [CrossRef]
  52. Al Sayah, M.J.; Abdallah, C.; Khouri, M.; Nedjai, R.; Darwich, T. A framework for climate change assessment in Mediterranean data-sparse watersheds using remote sensing and ARIMA modeling. Theor. Appl. Climatol. 2021, 143, 639–658. [Google Scholar] [CrossRef]
Figure 1. Study area location map.
Atmosphere 13 01158 g001
Figure 2. Time series of the minimum (A), mean (B), and maximum (C) annual air temperatures at Krk and Lastovo and their differences in the period 1981–1986 and 1998–2020.
Atmosphere 13 01158 g002
Figure 3. Relationship between the minimum (A), mean (B), and maximum (C) annual air temperatures at Lastovo (ordinate axis) and Krk (abscissa axis).
Atmosphere 13 01158 g003
Figure 4. Histograms of the average values of the mean monthly air temperatures at Lastovo (brown) and Krk (blue) and their differences (red) in the period 1981–1986 and 1998–2020.
Atmosphere 13 01158 g004
Figure 5. Relationship between the mean monthly air temperatures at Lastovo (ordinate axis) and Krk (abscissa axis) from January 1981 to December 1986 and from January 1998 to December 2020.
Atmosphere 13 01158 g005
Figure 6. Time series of the mean daily air temperatures at Lastovo (brown) and Krk (blue) and a series of their differences (red) observed in 1984 (A) and 2018 (B).
Atmosphere 13 01158 g006
Figure 7. Duration curves of the differences between the mean daily air temperatures at Lastovo and Krk calculated for 1984 (red) and 2018 (purple).
Atmosphere 13 01158 g007
Figure 8. Time series of the mean monthly sea surface temperatures at Lastovo (brown) and Krk (blue) and their differences (red) for all available data (A), and only for those when measurements were taken at both stations (B).
Atmosphere 13 01158 g008
Figure 9. Histograms of the average values of the mean monthly sea surface temperatures at Lastovo (brown) and Krk (blue) and their differences (red) from August 2010 to December 2020, for the months when measured at both stations.
Atmosphere 13 01158 g009
Figure 10. Relationship and trend between the pairs of the mean monthly sea surface temperatures at Lastovo (ordinate axis) and Krk (abscissa axis) from July 2010 to December 2020, when measured at both stations.
Atmosphere 13 01158 g010
Figure 11. Relationship between the average values of the mean monthly sea surface temperatures at Krk (ordinate axis) and Lastovo (abscissa axis) from July 2010 to December 2020, for the months (I–XII) when measured at both stations.
Atmosphere 13 01158 g011
Figure 12. Time series of the mean daily sea surface temperatures at Lastovo (brown) and Krk (blue) and their differences (red) observed during 366 days in 2020.
Atmosphere 13 01158 g012
Figure 13. Histograms of the average values of the mean monthly sea surface temperatures (blue colour) and air temperature (green) and their differences (red) observed at Krk from July 2010 to December 2020.
Atmosphere 13 01158 g013
Figure 14. Histograms of the average values of the mean monthly sea surface temperatures (blue) and air temperature (green) and their differences (red colour) observed at Lastovo from January 2007 to December 2020 (A), from July 2010 to December 2020 (B).
Atmosphere 13 01158 g014
Figure 15. Relationships between the average values of the mean monthly air (ordinate axis) and sea surface (abscissa axis) temperatures at Krk (blue) and Lastovo (brown) with marks of each month (I–XII).
Atmosphere 13 01158 g015
Figure 16. Duration curves of the differences between the mean daily sea surface temperatures at Lastovo (brown) and Krk (blue) calculated for 2020.
Atmosphere 13 01158 g016
Table 1. Available complete monthly sea surface temperatures measured at Krk and Lastovo.
YearKrk
Available Months
NLastovo
Available Months
N
2007-0I–XII12
2008-0I–XII12
2009-0-0
2010VIII–XII5I–XII12
2011I–XII12I–XII12
2012I–V; XI–XII7I–XII12
2013I–XII12I–XII12
2014I–XII12I–XII12
2015I1I1
2016-0-0
2017-0-0
2018VII–X; XII5VI–X; XII6
2019I–XII12I–II: V–XII10
2020I–XII12I–XII12
Σ78 months113 months
Red marks the year with complete measurements; I–XII months in a year.
Table 2. Results of probability, p, of the F-test and t-test between minimum, mean, and maximum annual air temperatures on Krk and Lastovo (Figure 2).
StationF-Testt-Test
MINKrk0.10629.8703 × 10−12
Lastovo
MEANKrk0.35044.2878 × 10−10
Lastovo
MAXKrk0.65310.1549
Lastovo
Red number means that, p < 0.01.
Table 3. Results of probability, p, of the F-test and t-test between mean daily air temperatures on Krk and Lastovo in 1984 and 2018 (Figure 6).
StationYearF-Testt-Test
Krk19847.2478 × 10−61.0908 × 10⁻⁶
2018
Lastovo19840.00771.5228 × 10−6
2018
Red number means that, p < 0.01.
Table 4. The mean annual sea surface temperature of Lastovo and Krk and their differences.
T. Sea (°C)LASTOVOKRKDifference
(Lastovo-Krk)
200718.66--
200818.73--
2009---
201018.28--
201118.9816.932.05 (1.08)
201218.97--
201319.0416.762.28 (1.84)
201419.4617.591.87 (0.94)
2015---
2016---
2017---
2018---
2019-17.76-
202019.1517.841.31 (1.19)
Differences between the mean annul sea surface temperatures.Differences between the mean annual air temperatures.
Publisher’s Note: MDPI stays neutral with regard to jurisdictional claims in published maps and institutional affiliations.

