Article

Is the Apparent Correlation between Solar-Geomagnetic Activity and Occurrence of Powerful Earthquakes a Casual Artifact?

by
Mehdi Akhoondzadeh
1 and
Angelo De Santis
2,*
1
Photogrammetry and Remote Sensing Department, School of Surveying and Geospatial Engineering, College of Engineering, University of Tehran, North Amirabad Ave., Tehran 1417614411, Iran
2
Istituto Nazionale di Geofisica e Vulcanologia, Via di Vigna Murata 605, 00143 Rome, Italy
*
Author to whom correspondence should be addressed.
Atmosphere 2022, 13(7), 1131; https://doi.org/10.3390/atmos13071131
Submission received: 21 June 2022 / Revised: 11 July 2022 / Accepted: 14 July 2022 / Published: 18 July 2022
(This article belongs to the Special Issue Lithosphere-Atmosphere Coupling during Natural Hazard )

Abstract

:
So far, many efforts have been made to provide a reliable and robust mechanism for the occurrence of large earthquakes. In recent years, different studies have been conducted on the possible correlation between solar-terrestrial interactions and the occurrence of earthquakes. In this paper, the hypothesis that there is a correlation between solar-geomagnetic activities and powerful earthquakes first is investigated in three case studies, and then it is discussed by studying the variations of indices, including F10.7, Kp, ap, and Dst, before 333 large earthquakes (Mw ≥ 7.0) that occurred between 1 January 2000 and 28 April 2022. As the time series of the solar index follows special cycles, in another scenario, after removing the non-linear variations with fitting a polynomial, the anomalous F10.7 variations above and below the median ± 1.25 × interquartile ranges were considered. Although anomalies in solar and magnetic indices are observed in 33% of earthquakes one day before the occurrence, by analyzing 100 simulated data sets, we find that analogous anomalies can be found. Therefore, it can be concluded that there is no significant correlation between solar and geomagnetic indices and the occurrence of strong earthquakes. These findings could be effective in better defining alternative robust mechanisms for the occurrence of earthquakes that are more of internal origin than external to the Earth system.

1. Introduction

Due to the many human and financial losses by powerful earthquakes, many efforts have been made to predict the principal parameters of earthquakes based on precursor behaviors [1,2,3,4,5]. Based on historical seismic data, a number of scientific reports and papers have indicated that there is a noticeable relationship between solar-terrestrial interactions and earthquake occurrence. Wolf (1853), as a great astronomer, claimed that sunspots could influence the occurrence of earthquakes [6]. Many papers have analyzed different time scales of global seismicity data and the results of some of them are contradictory [7,8,9,10,11,12,13,14,15,16,17,18,19,20,21,22,23,24,25,26,27].
Odintsov et al. (2006) reported that the number of earthquakes is highest during solar-cycle sunspot maximum [7], but Simpson (1967) and Huzaimy and Yumoto (2011) declared that the seismicity is highest in the declining phase and minimum of the solar cycle [8,9]. From the opposite results of these works, we can presume that probably the difference came from the different cyclicities of the global seismicity.
Love and Thomas (2013) did not find consistent and statistically significant distributional differences between the earthquake-number distributions and below and above the median of the solar-terrestrial averages [10]. They also considered time lags between the solar-terrestrial variables and the number of earthquakes, but again no statistically significant distributional difference was found. They did not reject the null hypothesis of no solar-terrestrial triggering of earthquakes.
In the next section, we recall the main results in favor of a correlation, mentioning some explanation of the possible coupling. Then, we present three case studies where the correlation seems apparent when the geomagnetic activity in the form of the Dst index in a short time scale of 100 days was considered. Then four different time series data, including earthquake catalog data and the daily average of F10.7, Kp, and ap indices, were analyzed during a long interval in time, including two solar cycles, i.e., from 1 January 2000 to 28 April 2022. Regarding global seismicity, this study focuses on M ≥ 7.0 earthquakes.
Finally, we compared the results obtained with those found when the correlation is made with a series of temporally randomized earthquake catalogs.

2. Some Previous Main Results in Favor of a Possible Correlation

In the ionosphere, the solar wind produces electrical currents. Then, on the Earth’s surface, these electrical currents cause magnetic field fluctuations. These fluctuations, penetrating the Earth’s interior, induce the electrical currents J and, in the presence of the Earth’s magnetic field B, generate electromagnetic force, known as Lorentz force F = J × B. To study the relation between earthquakes and the Lorentz force, acting at the near onset times of strong earthquakes, Urata et al. (2018) [11] examined the Kp index, a logarithmic measure of the magnetic field deviation. The time-varying Kp index gives J, which in turn determines F. The Lorentz force tilts the subtle force balance in the Earth’s crust towards triggering the release of stress-strain energy, initiating an earthquake in a similar way as a mountain climber’s step can trigger avalanches. The internal dynamics, however, are highly statistical. Urata et al. (2018) investigated variations of the Kp index for 28 days before and after three major seismic events of M ≥ 6 in 2016 and 2017. They statistically analyzed the Kp index for the times of earthquakes between 1932–2016. Stacking of thousands of Kp data shows an effect of the geomagnetic field on earthquake triggering. They found a distinct pattern of the Kp fluctuations prior to earthquakes, indicating the synchronization of geomagnetic surges and seismicity. These synchronizations are quite complex, reflecting the regional characteristics and the earthquake magnitude itself. M8 class earthquakes are associated with the Kp surge more than M6 class ones. The geomagnetic disturbance, typically the magnetic storm, is one of the major factors which synchronize with earthquakes [11]. Tarasov (2021) has shown that bursts of the intensity of ionizing electromagnetic radiation from the Sun, as well as geomagnetic storms, cause a statistically significant decrease in the total number of earthquakes on Earth. After bursts of ionizing radiation from the Sun, a statistically significant decrease in the total energy of earthquakes occurs, and after geomagnetic storms, its increase is observed. This is mainly due to an increase in the number of the strongest earthquakes with MS > 7 after geomagnetic storms and a decrease in the number of such earthquakes after bursts of ionizing electromagnetic radiation from the Sun. During geomagnetic storms and for several days after them, the probability of occurrence of strong earthquakes increases more than two times, and after bursts of ionizing electromagnetic radiation from the Sun, this probability decreases almost twice [12]. Guglielmi et al. (2021) declared that the correlation between earthquakes and magnetic storms exists objectively. The problem deserves further study using statistical hypothesis testing methods and special attention should be paid to distinguish between causal and acausal correlations clearly [13]. Sobolev (2021) compared the times of occurrence of the earthquakes with magnitudes M ≥ 6.5 all over the world with the commencement times of the strongest magnetic storms with the planetary Kp index above 7. In the interval from 1994 to 2017, 17 earthquakes occurred within two days after 50 storms which correspond to their non-random occurrence with a probability above 95% [14]. However, the recent paper of Marchitelli et al. (2020) reproposed an external origin of the triggering of earthquakes again. In their paper, Marchitelli et al. analyzed 20 years of proton density and velocity data, as recorded by the SOHO satellite, and the worldwide seismicity in the corresponding period, as reported by the ISC-GEM catalog. They reported a clear correlation between proton density and the occurrence of large earthquakes (M > 5.6), with a time shift of one day [15].
If we accept that there is a connection between the occurrence of large earthquakes and solar-terrestrial activities, therefore, there must be a coupling between the Sun, ionosphere, and lithosphere. Gribbin (1971) declared that this coupling could cause small changes in the Earth’s rotation rate and then result in seismic events [16]. Moreover, solar- geomagnetic activities might induce eddy electric currents in rocks along faults which results in heating them and reducing their shear resistance [17], or induced currents that might cause a piezoelectric increase in fault stress [14]. In such cases, an earthquake is likely to occur because, in the critical-point accumulation of stress along a fault, a small nudge might trigger an earthquake. What is to establish is whether this contribution is significant or not, i.e., if the occurrence of earthquakes is strongly or weakly affected by the solar conditions. In the latter case, the correlation would be within casual fluctuations. In other terms, we formulate a null H0 hypothesis, i.e., there is a cause-effect correlation between geomagnetic sun-induced activity and earthquakes, and an alternative Ha hypothesis that affirms that there is no correlation or that any apparent correlation is only due to chance. After a series of analyses also involving the simulation of 100 random earthquake catalogs, we rejected the null hypothesis in favor of the alternative casual Ha hypothesis.

3. Some Recent Case Studies

Before beginning the main analysis, we discuss some of the large earthquakes that were apparently preceded by anomalous changes in solar and geomagnetic indices.

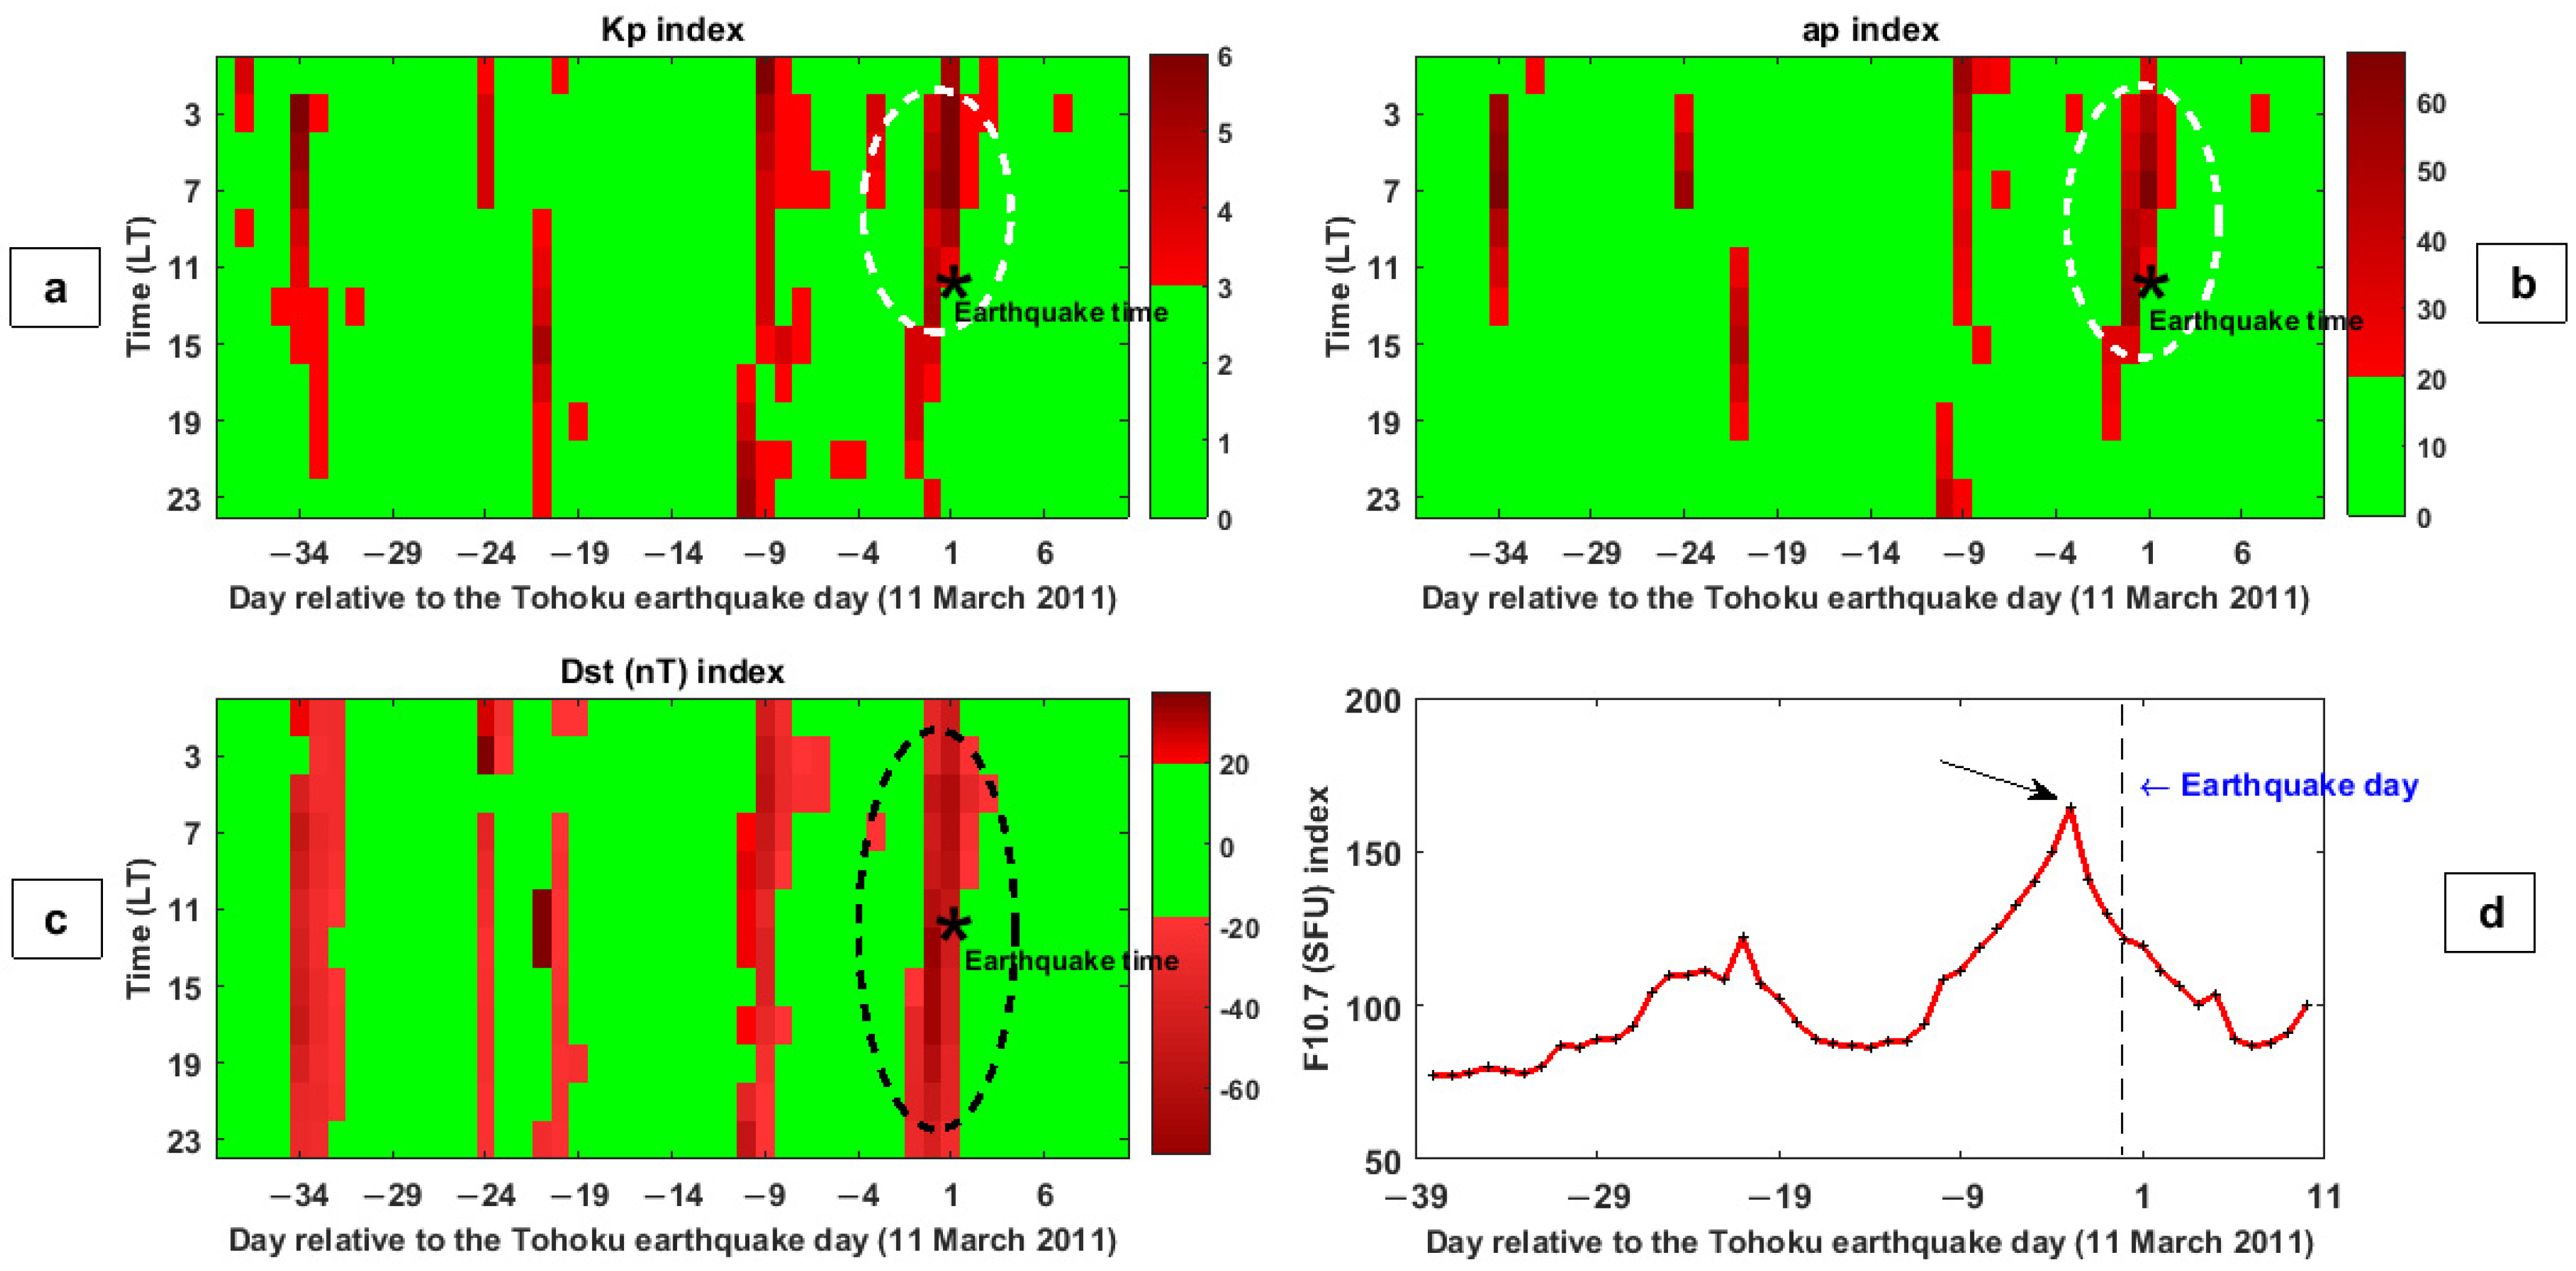
3.1. Tohoku Earthquake, 11 March 2011

The 4th largest earthquake ever recorded, with a magnitude of 9.0, occurred on 11 March 2011 at 14:46:23 LT (UTC = LT-9:00) near the northeast coast of Honshu in Japan (38.322° N, 142.369° E, Focal depth 29.0 km).
Figure 1a,b shows the variations of Kp and ap geomagnetic indices, respectively, during the period of 1 February to 21 March 2011. Please note we provide the values of the geomagnetic indices as binary, i.e., red for disturbed magnetic times and green for quiet magnetic times. The X-axis represents the days relative to the earthquake day. An asterisk indicates the earthquake time. The y-axis represents the local time. The choice of calm or perturbed magnetic times (and indices) was a-priori made and based on previous literature. It is seen that the Kp value reaches the values of 4, 4.5, and 5 between 02:00 and 06:00 LT on the earthquake day (the white dotted ellipsoid in Figure 1a). The ap value reaches the maximum value of 67 nT, 8 h before the main shock (the white dotted ellipsoid in Figure 1b). Figure 1c illustrates the variations of the Dst geomagnetic index during the period of 1 February to 21 March 2011. The Dst value exceeds the lower boundary value (i.e., −20 nT) at 16:00 LT, 1 day before the earthquake, and then gradually decreases and reaches the minimum value of −76.5 nT at earthquake time (the black dotted ellipsoid in Figure 1c). Figure 1d indicates the variations of solar radio flux (F10.7). F10.7 is often expressed in SFU or solar flux units. The F10.7 value gradually increased from about 14 days before the earthquake and reached the maximum value of 164.30 (SFU) on 8 March 2011 (the black arrow in Figure 1d), which is 3 days before the event. In addition to the notice that a few days before the large earthquake, there was a very disturbing magnetic period, we see that in the indices, there is an apparent cycle of around 10–15 days, which is practically half of the typical 27-day period of substorms. This relatively high frequency of occurrence of disturbed periods, with respect to the lower frequency of occurrence of large earthquakes, could produce an apparent correlation/anticipation of the disturbed magnetic days with the impending earthquakes.

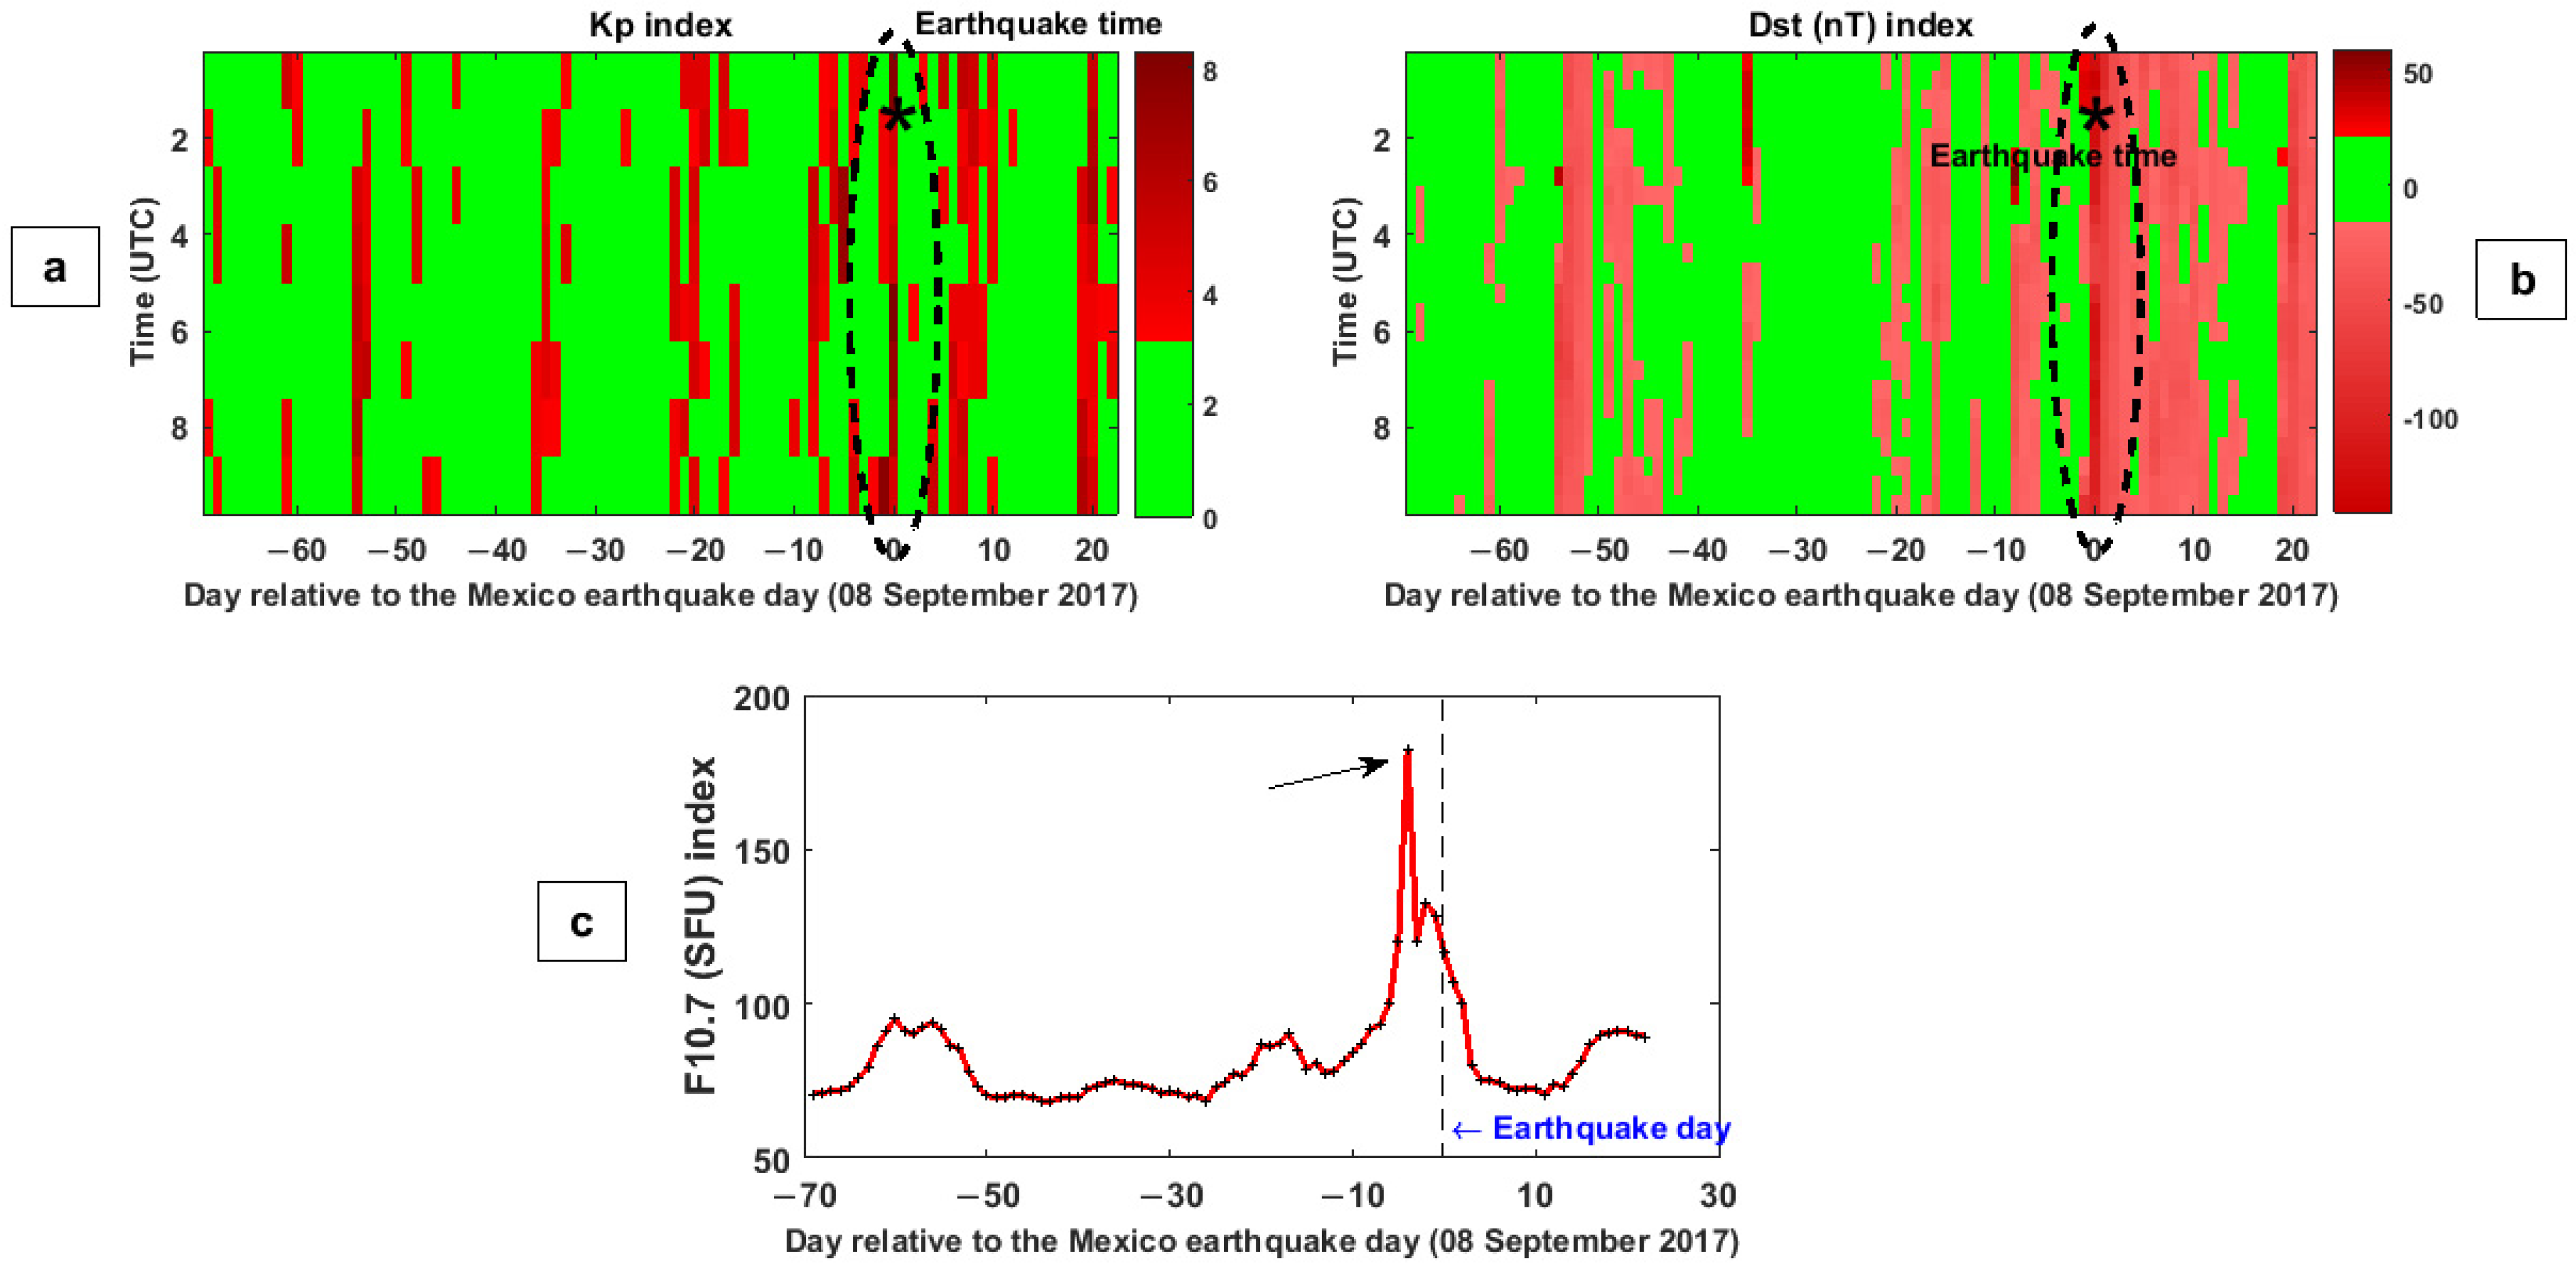
3.2. Mexico Earthquake, 8 September 2017

On 7 September (at 23:49:19 LT; 04:49:19 UTC on 8 September) 2017, a powerful earthquake of Mw = 8.2 happened 98 km SW of Tres Picos in Mexico (15.022° N, 93.899° W, 47.40 km depth).
Figure 2 illustrates the variations of Kp, Dst, and F10.7 indices, during the period of 1 April to 15 October 2017. An asterisk indicates the earthquake time. The X-axis represents the days relative to the earthquake day. The y-axis represents the universal time coordinate. Moreover, here the geomagnetic indices are represented with binary (green and red) values.
The high geomagnetic activities were clearly observed on 8 September 2017, when the Kp reached the maximum value of 8.3, between 12:00 and 15:00 UTC. The unusual variations of the Kp index are also seen on the earthquake day between 00:00 and 03:00 UTC with the value of 8.0. This index shows the highest geomagnetic activities on the earthquake date (the black dotted ellipsoid in Figure 2a). The abnormal Dst values are observed on the earthquake day when this parameter exceeds the lower boundary value (i.e., −20 nT), reaching the lowest hourly value of −142 nT and −128 nT at 02:00 and 03:00 UTC, respectively. Similar unusual variations are also seen at other times of earthquake date with the value of about −120 nT (the black dotted ellipsoid in Figure 2b). The F10.7 value gradually increased from about 14 days before the earthquake and reached the maximum value of 182.50 (SFU) on 4 September 2017, which is 4 days before the event (the black arrow in Figure 1c).

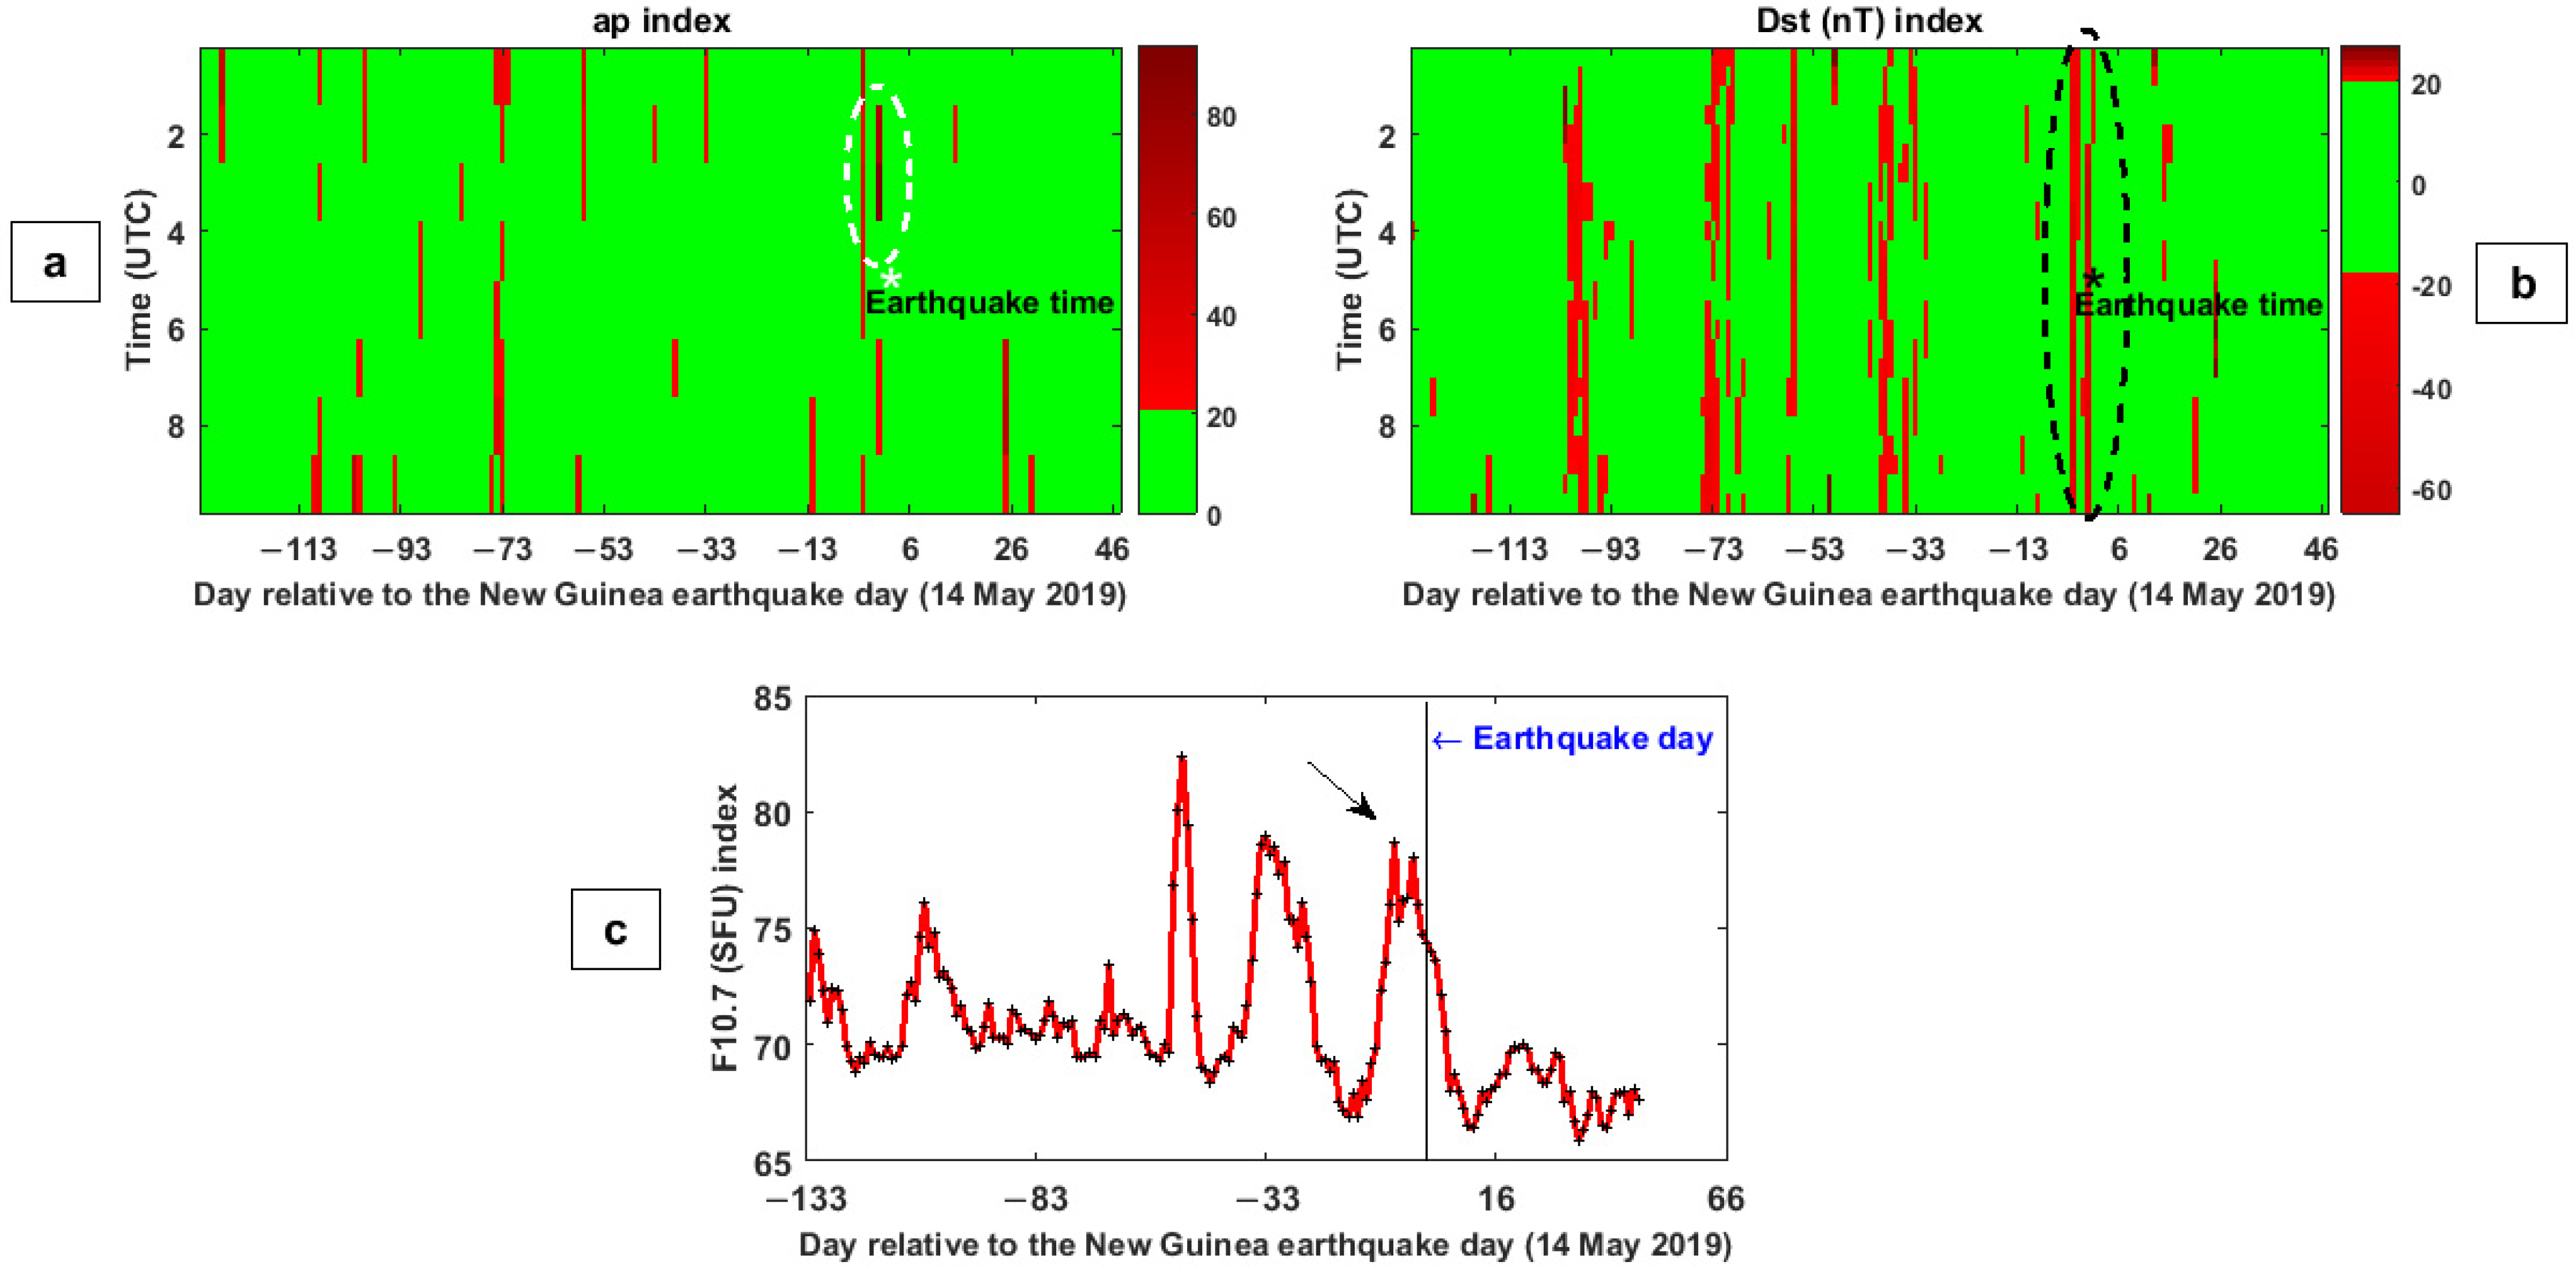
3.3. Papua New Guinea Earthquake, 14 May 2019

Papua New Guinea earthquake with a magnitude Mw = 7.6 took place at 12:58:25 UTC on 14 May 2019, 46 km SSE of Namatanai (4.051° S, 152.597° E) at a shallow depth estimated of about 10 km.
Figure 3 shows the variations of ap, Dst, and F10.7 indices during the period of 1 January to 30 June 2019. A star symbol shows the earthquake time. The x-axis indicates the day relative to the earthquake day. The y-axis represents the universal time in (a) and (b) and the F10.7 (SFU) value in (c). High geomagnetic activity is clearly seen on the earthquake date when the ap index reaches the unusual values of 67 nT and 94 nT between 04:00 and 09:00 UTC (the white dotted ellipsoid in Figure 3a). The unusual variations of the ap index are also seen 3 days before the earthquake. In addition, abnormal Dst values are observed 2 days before, on the earthquake date, and 1 day after the event. This parameter exceeds the lower boundary value (i.e., −20 nT) and reaches the value of −65 nT at 18:00 UTC on earthquake day, −51 nT at 8:00 on 2 days before, and −43 nT at 7:00 on the day after the event (the black dotted ellipsoid in Figure 3b). Figure 3c shows the normal variations of solar activities during the studied period, although the shock happened after a peak in the F10.7 time series (the black arrow in Figure 3c).
The above three case studies represent three large earthquakes preceded by a significant magnetic field disturbance. They would apparently support a possible coupling between solar and geomagnetic disturbances and earthquakes. This motivated us to analyze a longer period of earthquakes and the corresponding solar and magnetic disturbances to verify that systematically.

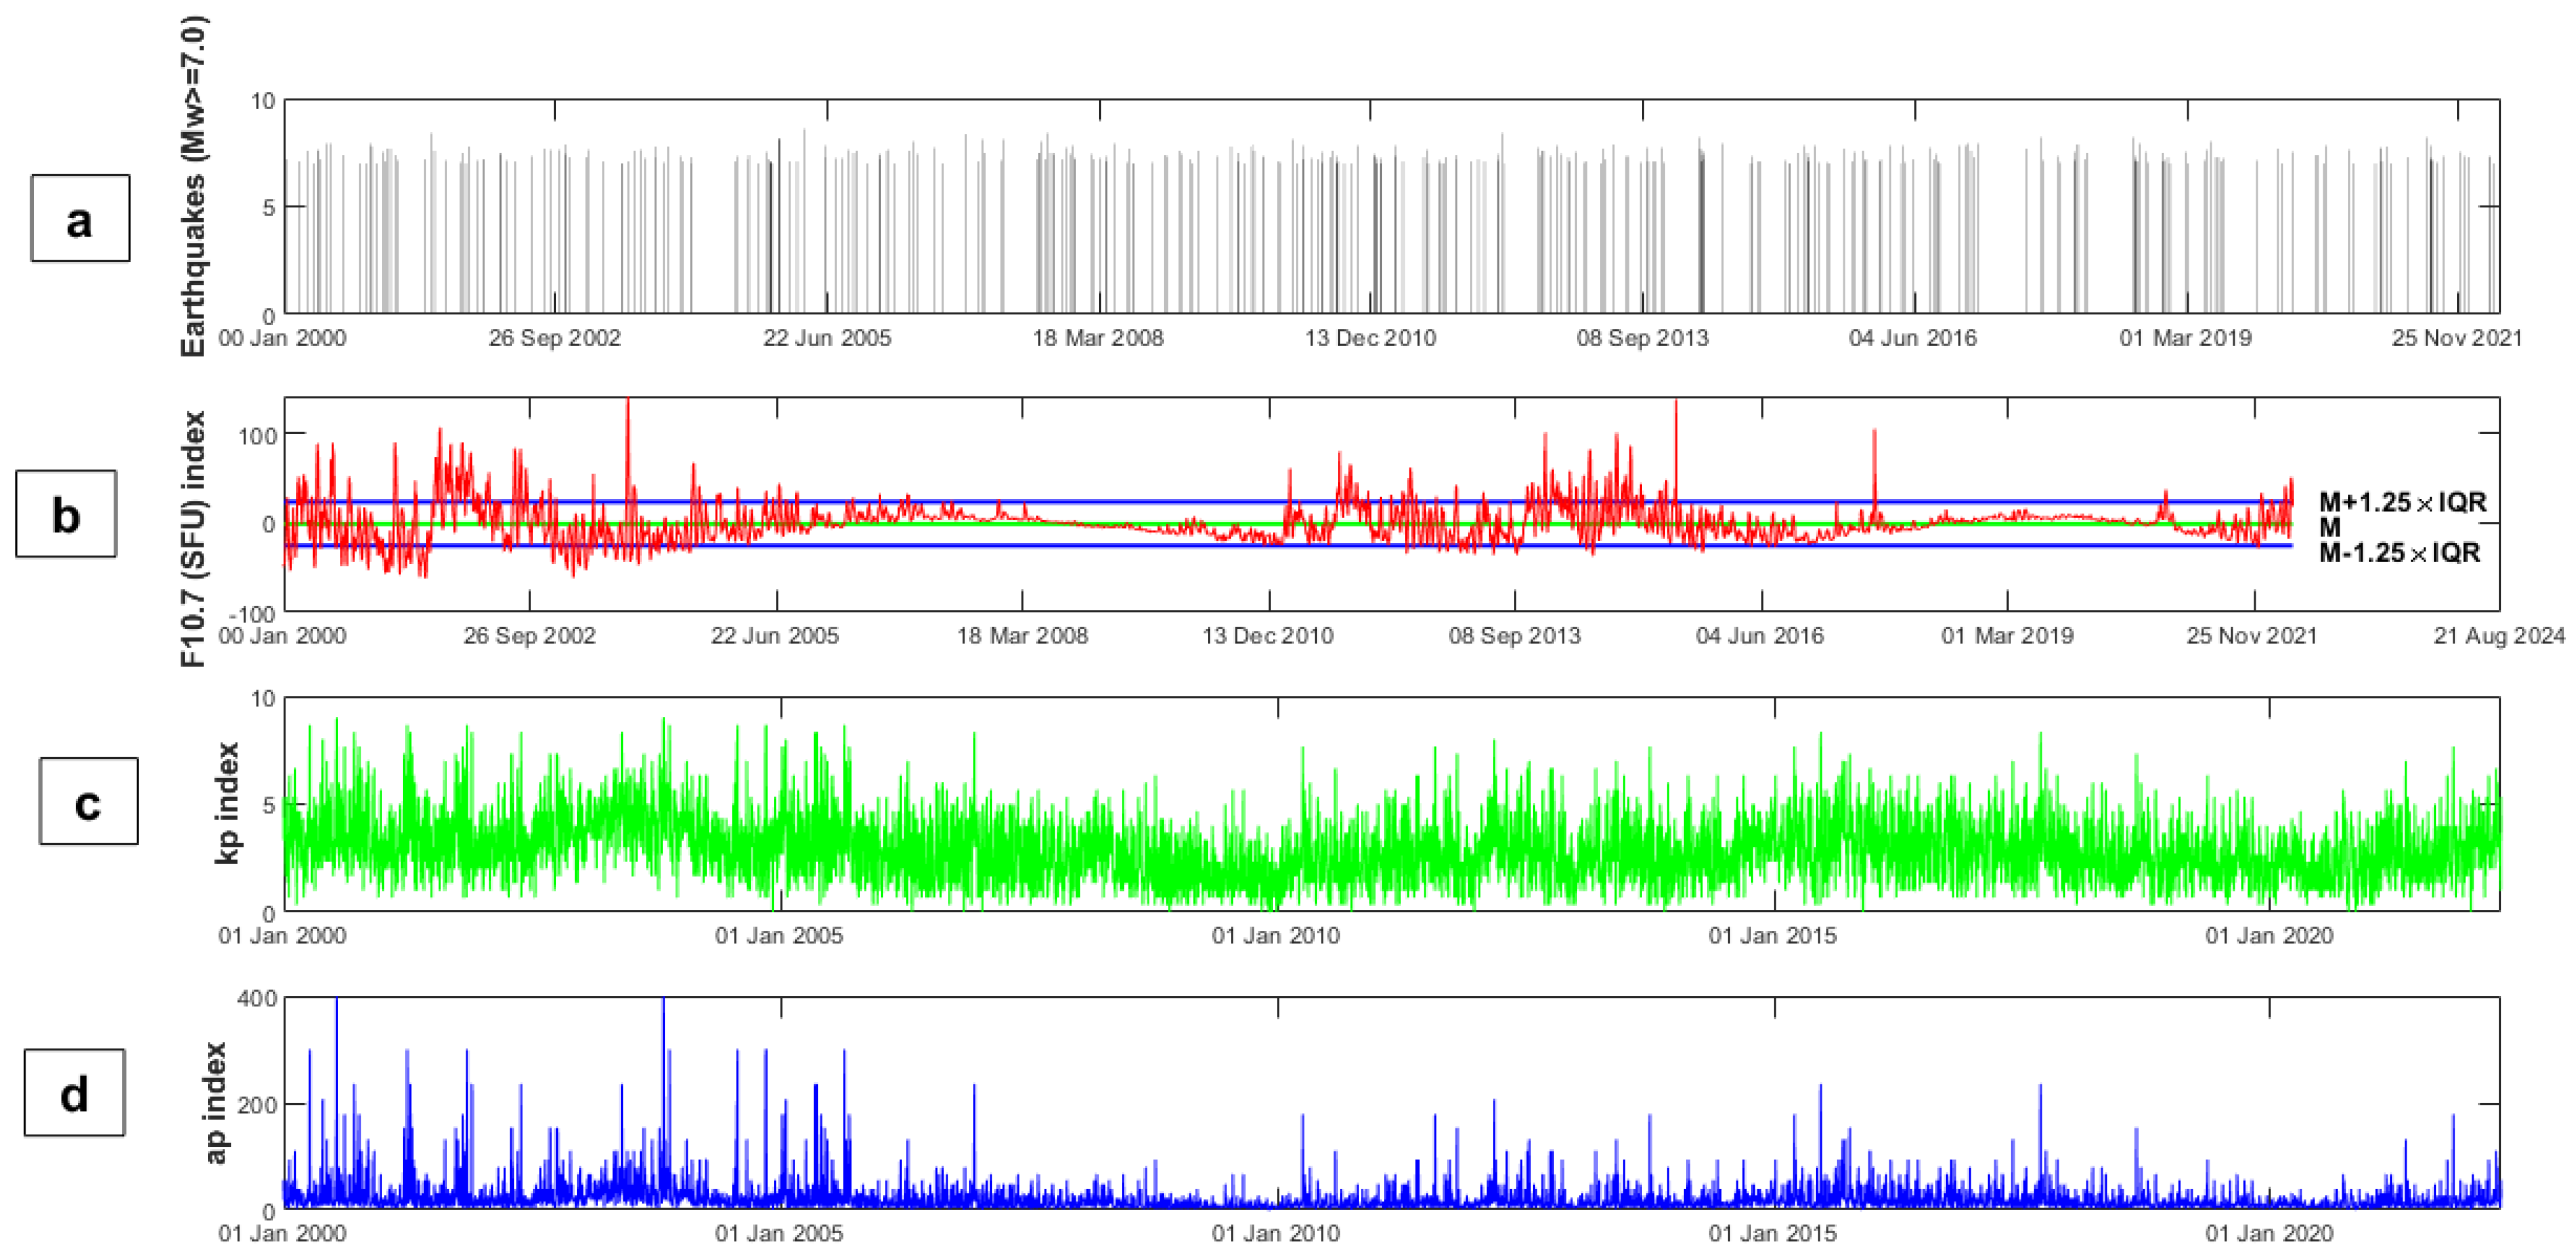
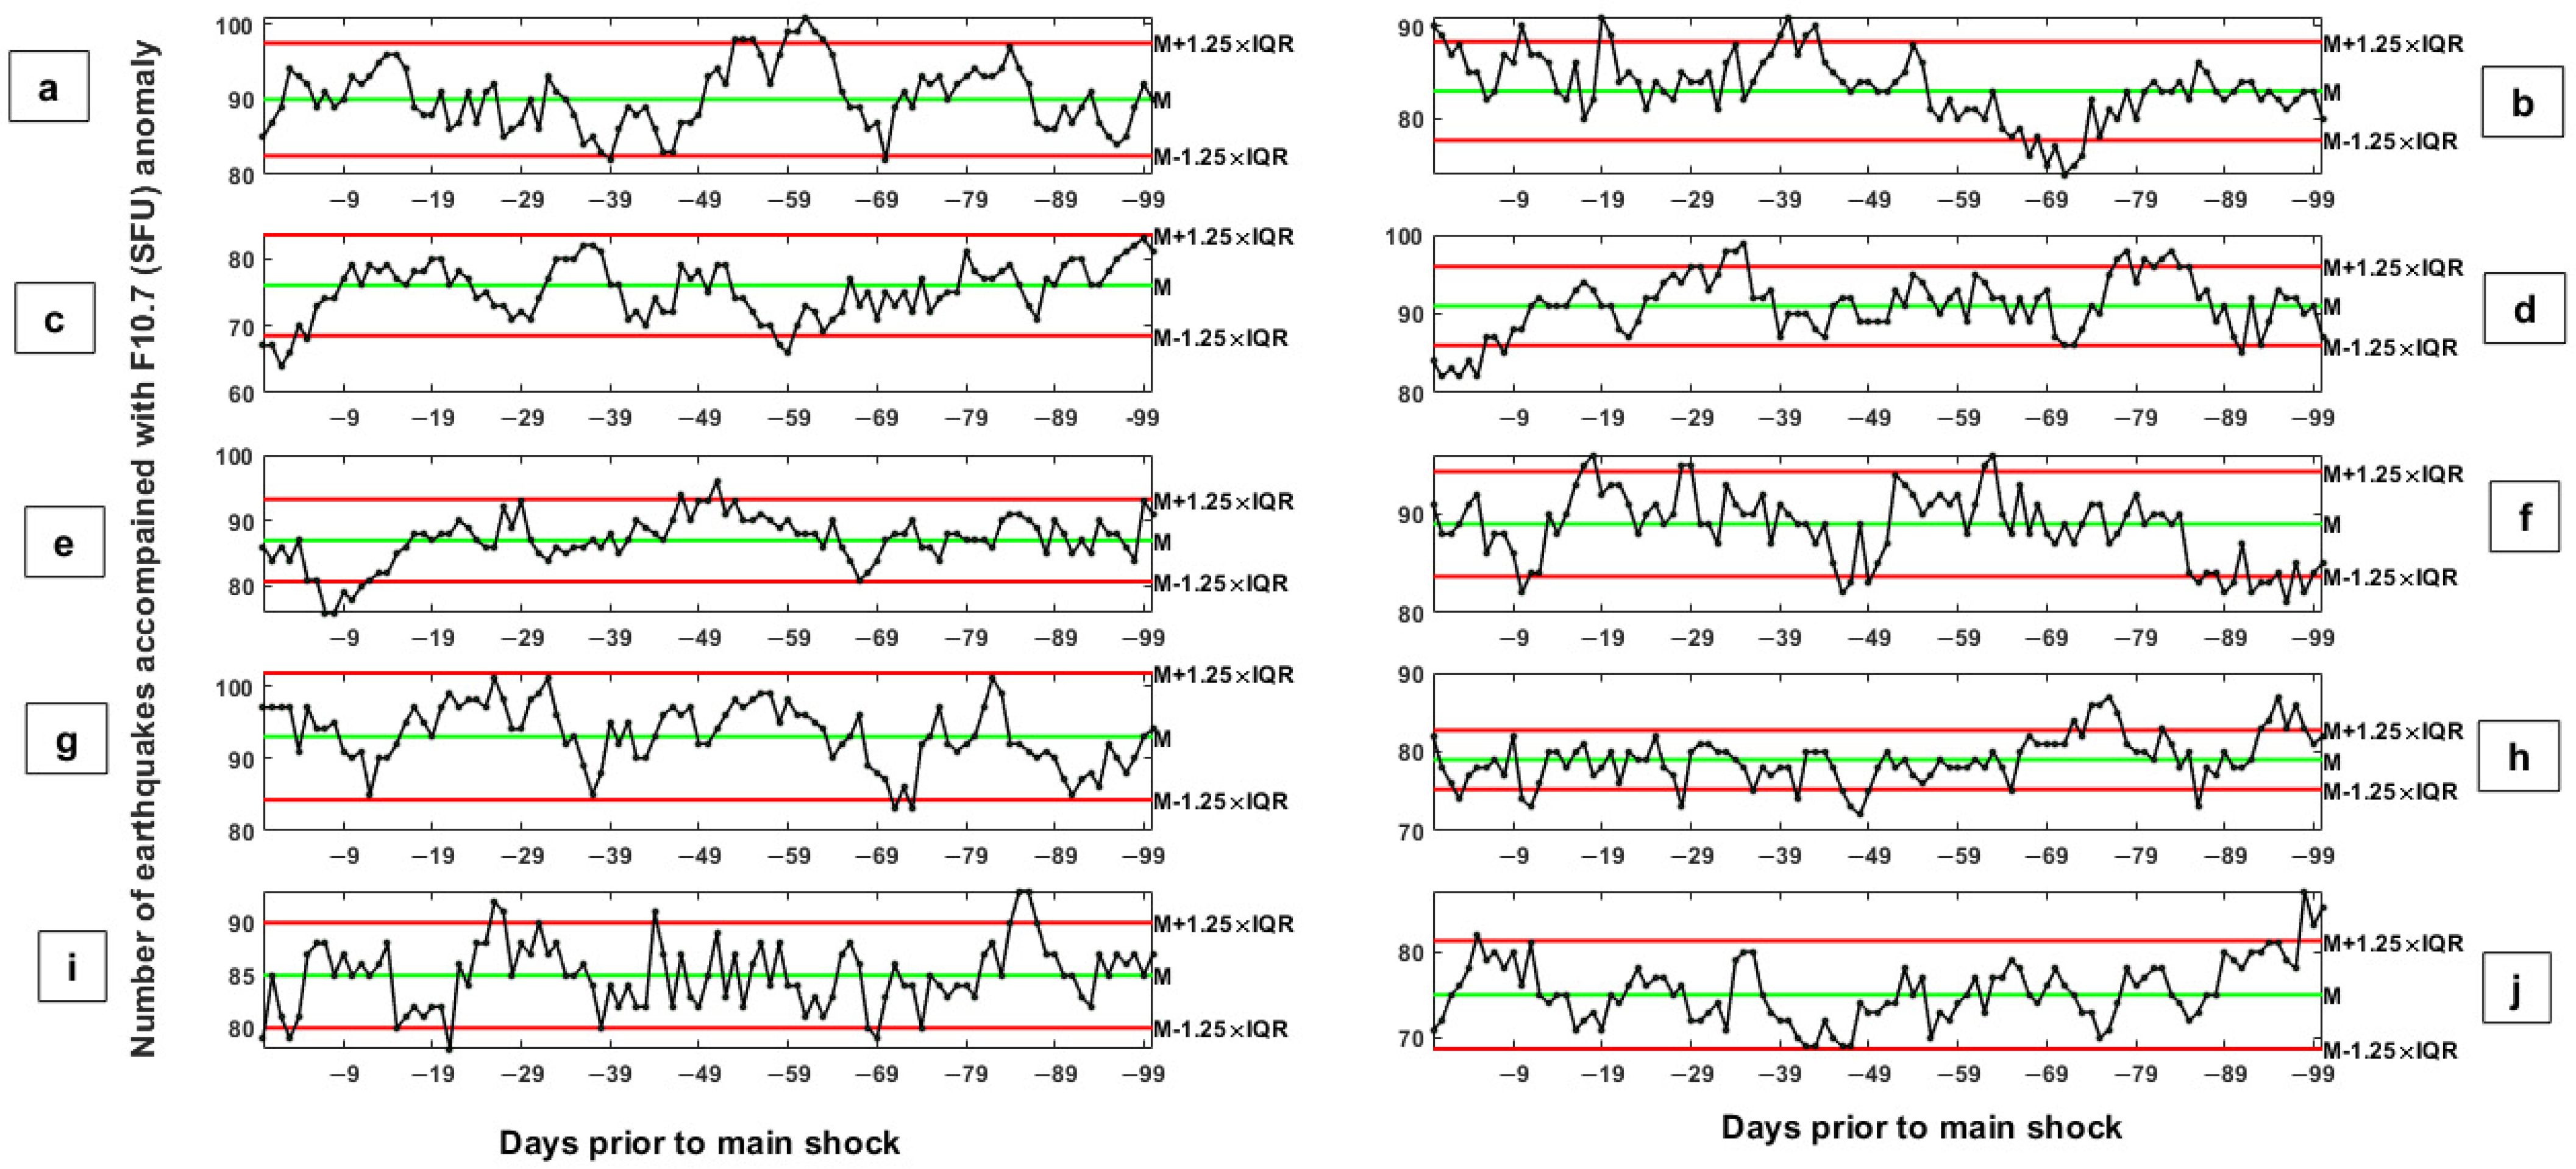
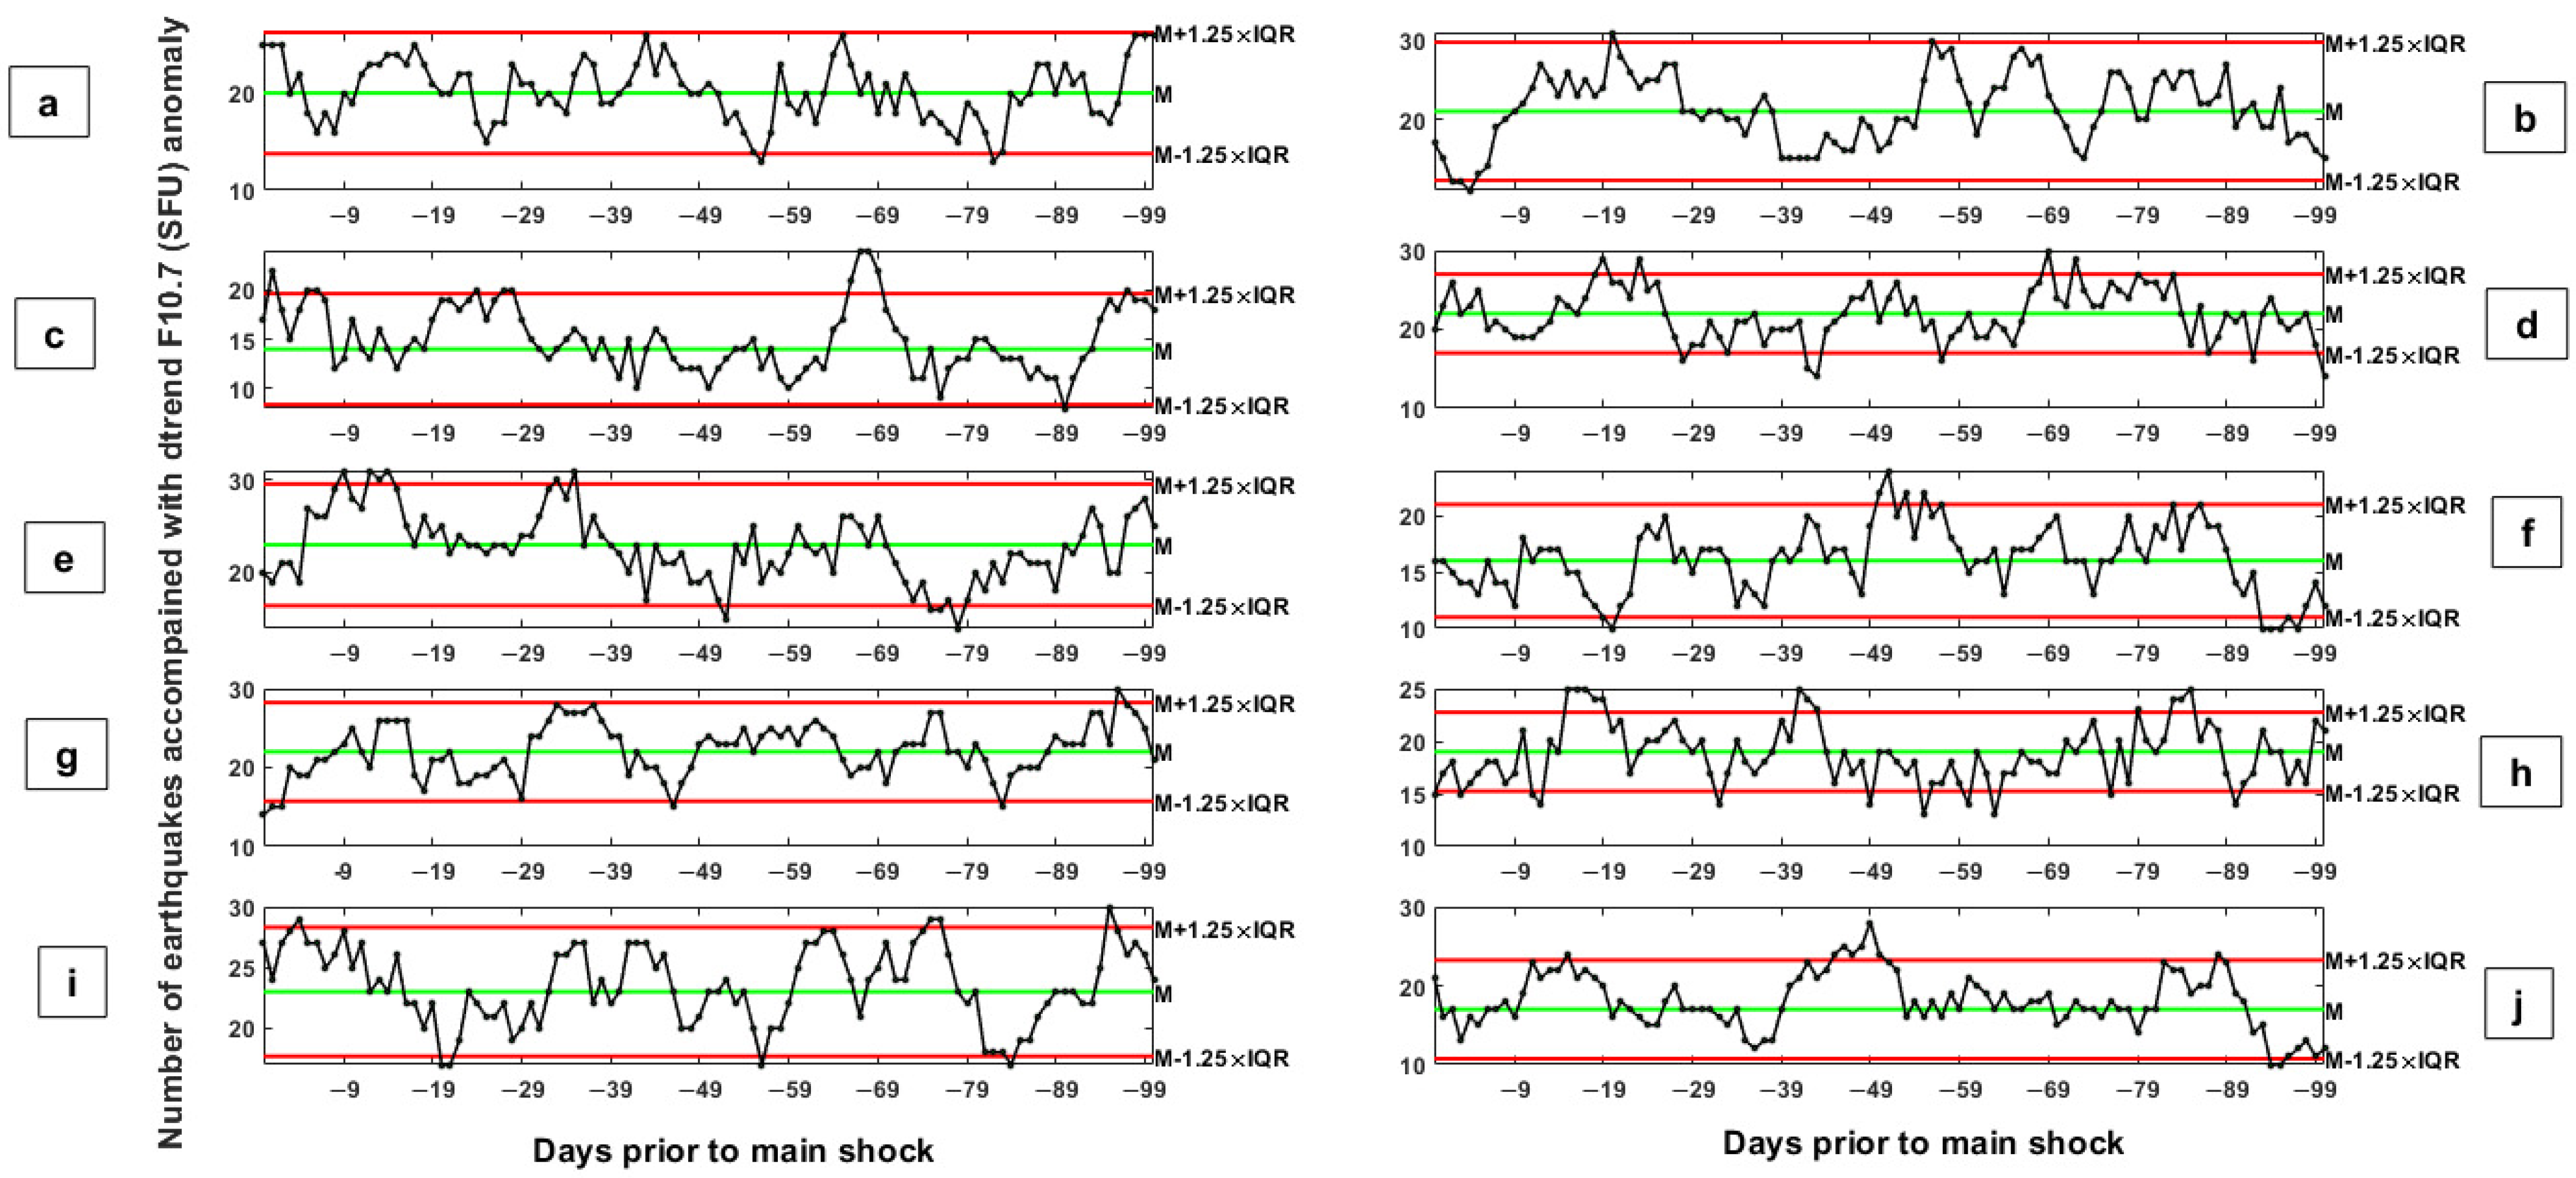
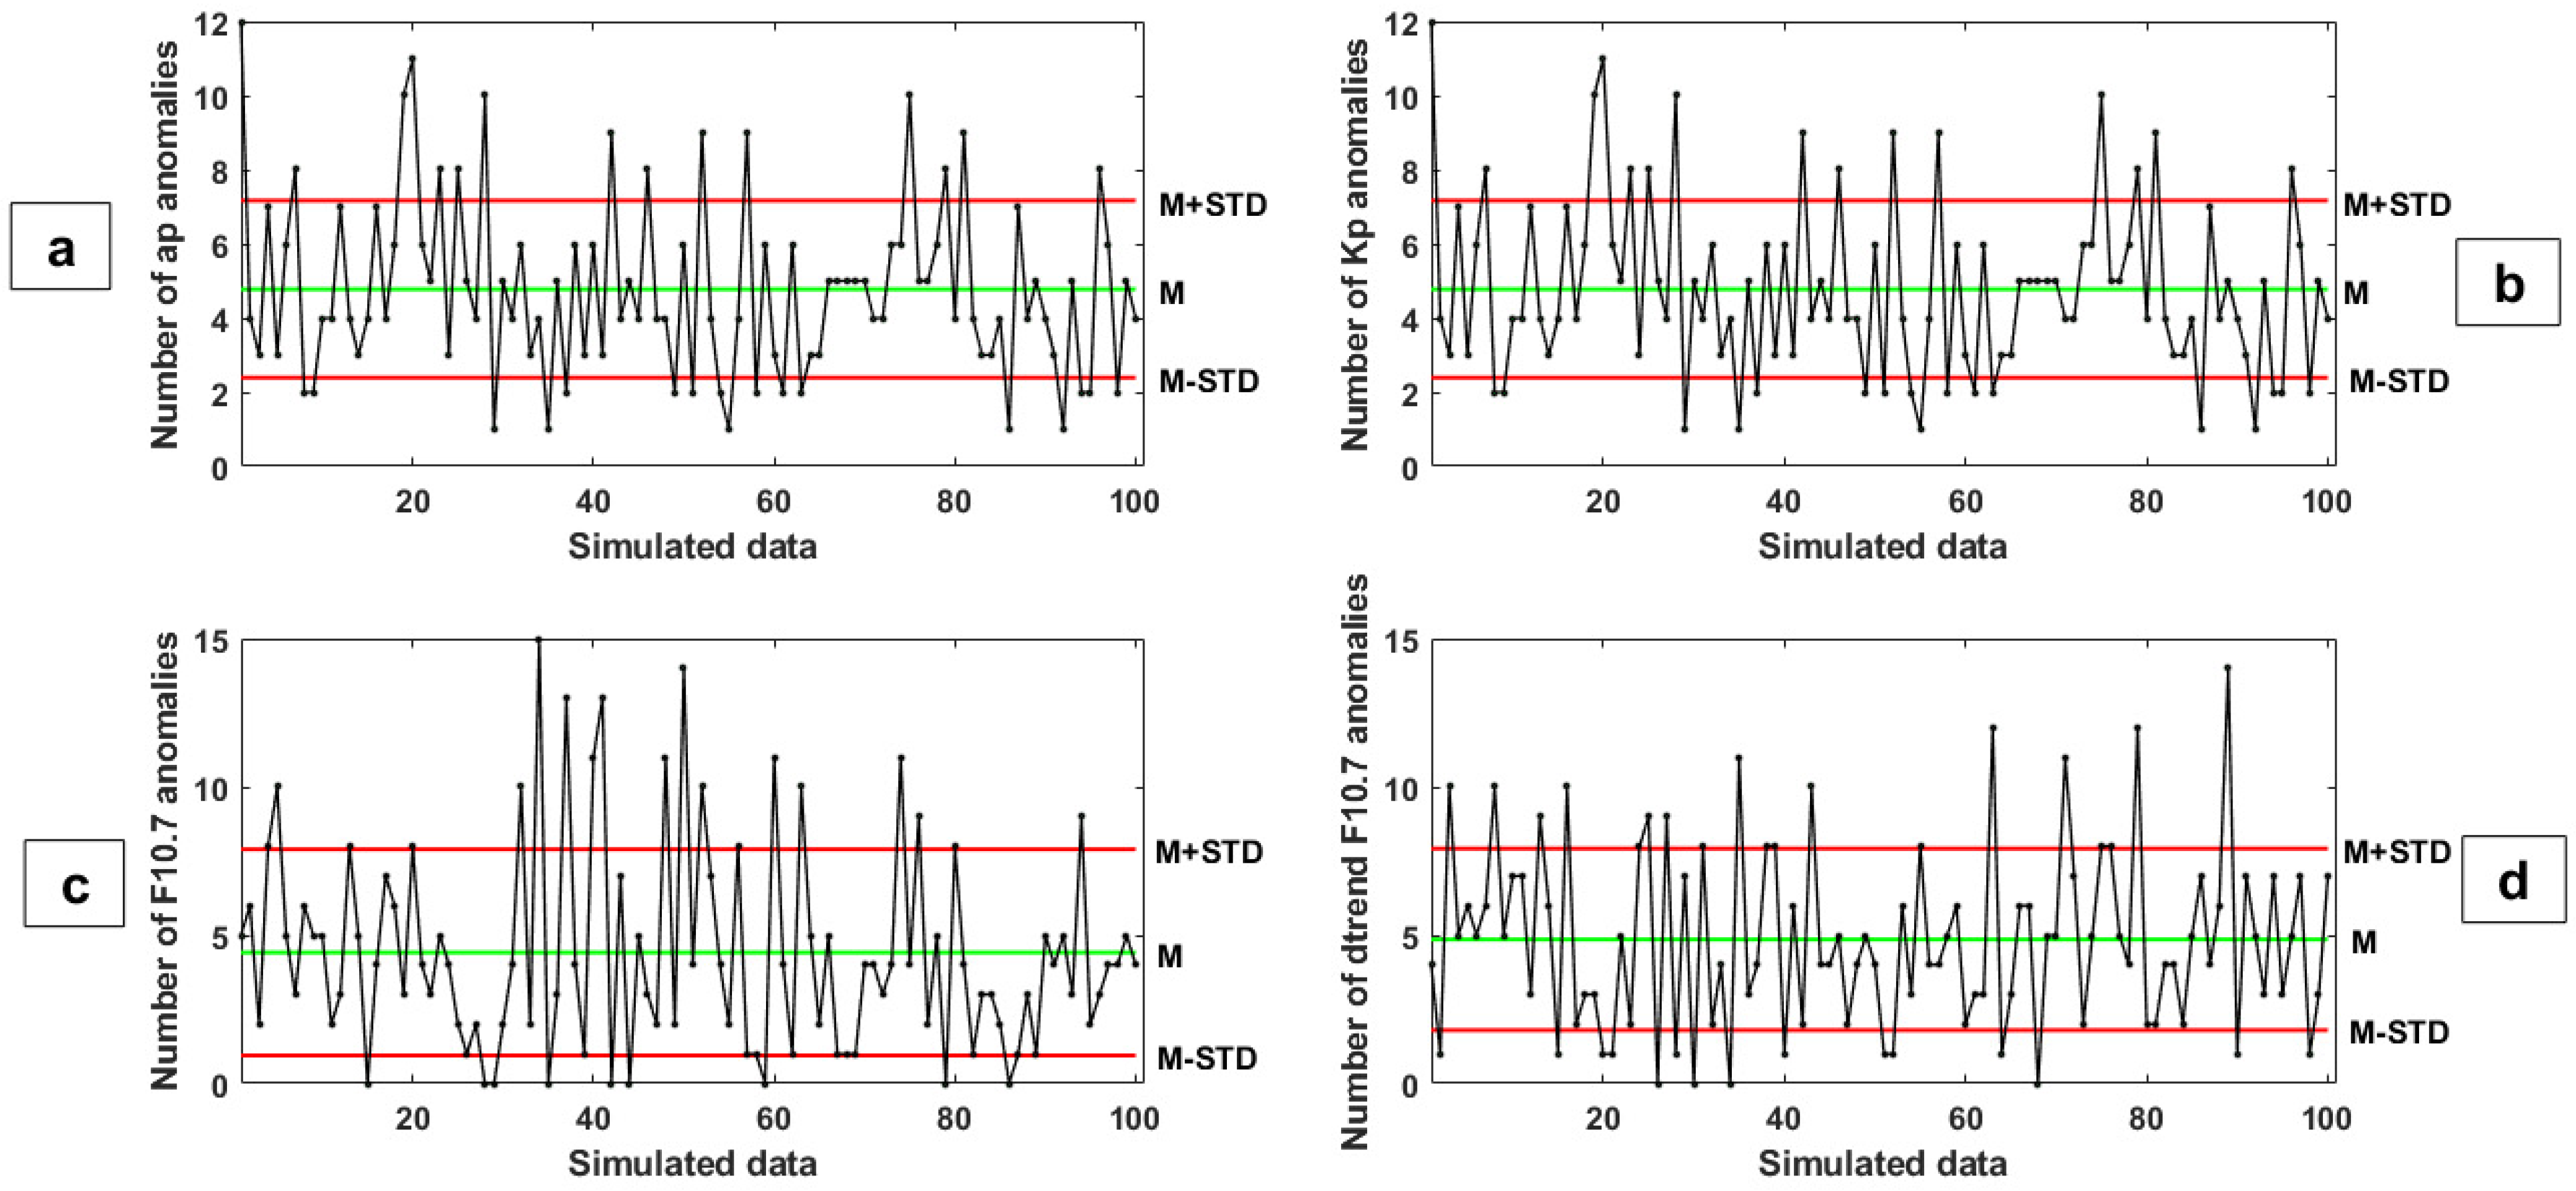
4. Main Analysis and Discussion

Using earthquake catalog data on the USGS website in the period from 1 January 2000 to 28 April 2022, we extracted 333 earthquakes with a magnitude equal to or greater than 7 with their date of occurrence. Figure 4a shows their time distribution. Figure 4b–d show the variations in the dtrend solar flux (F10.7), Kp, and ap indices in the period of studied strong earthquakes, respectively.
Two scenarios were implemented to investigate the relationship between abnormal changes in solar and geomagnetic indices at the time of earthquakes. In the first scenario, the main analysis was performed by examining which of the solar and magnetic indices had an abnormal change (F10.7 > 120, Kp > 3.5, ap > 20) in the time interval of 100 days before each earthquake occurrence. Although most of the previous literature supporting a causal correlation between magnetic indices and earthquakes were indicating only a few days of anticipation of the former with respect to the latter, we prefer to analyze a longer period of time in order to have a clearer distribution of the changes of the two kinds of variables under investigation.
Figure 5a illustrates the number of earthquakes in which anomalous changes occurred in the Kp index. The abscissa represents the days relative to the earthquake day. Median and higher and lower bounds are drawn as green and red horizontal lines, respectively. The allowed ranges are defined as M ± 1.25 × IQR, in which M and IQR are the median and the inter-quartile range parameters, respectively.
It is observed that within two weeks before the day of the earthquake, the highest number of earthquakes with the occurrence of anomalies (33%) in the mentioned index was recorded one day before the earthquake. But extending the period of investigation to 100 days before the earthquakes and defining the allowed upper and lower ranges, it is not seen any upper anomaly during the variations of the mentioned index. Similar results are observed in the ap index (Figure 5b).
Figure 5c illustrates the number of earthquakes in which anomalous changes in the solar index (F10.7) were observed from 100 days before the earthquake to the earthquake day. About 29% of the total strong earthquakes are accompanied by anomalous variations in the F10.7 index 35 days before the main shock. Figure 5d shows the number of earthquakes with abnormal changes in the F10.7 index in the time interval 100 days before the day of the earthquake according to the following second scenario: since the changes in the solar index have special cycles, first, we fit a 7th-degree polynomial, and then remove the trend from the time-series, and finally consider the difference between the two curves as the real change in the solar index. Then the median (M) and interquartile range (IQR) of this time series were calculated and the values crossed from the upper and lower limits were considered abnormal changes in the solar index. In this scenario, it is observed that about 32% of the studied earthquakes were accompanied by an abnormal change in the solar index between 60 and 64 days before the earthquakes. However, we could ask whether these anomalies are due to chance or are a real property of the correlation coupling between solar and geomagnetic disturbances and earthquakes.
After examining the relationship between the anomalies observed in the solar and geomagnetic indices with the occurrence of real earthquakes, we investigated an analogous relationship in the next part of the work by creating 100 new datasets of simulated earthquakes in the same time period with a random temporal distribution. To create this simulated data set, we randomized the dates of occurrence of the earthquakes in the existing data within the same interval of time.
Panels (a) to (j) in Figure 6 show an array of the first ten simulated earthquakes from the 100 simulations during the period of 1 January 2000 and 28 April 2022. The y-axis in each panel in Figure 7, Figure 8, Figure 9 and Figure 10 illustrates the number of simulated earthquakes accompanied by anomalous changes in Kp, ap, F10.7, and dtrend F10.7 indices, respectively, during the days prior to the 10 simulated earthquakes. Since in these first 10 simulated data sets, some anomalies are observed in the studied indices, therefore the degree of uncertainty in the existence of a relationship between the occurrence of strong earthquakes and anomalies in the solar and geomagnetic indices increases.
In the next scenario, we increased our investigation of the total number of simulated datasets to 100. Figure 11 shows the number of detected anomalous indices of (a) ap, (b) Kp, (c) F10.7, and (d) dtrend F10.7 after making 100 simulated earthquake datasets. The x-axis shows the simulated data set number from 1 to 100. It is observed that in most simulated data sets in the period of 100 days before the occurrence of the simulated earthquake, a significant number of anomalies are seen in different solar-geomagnetic indices, confirming that the apparent correlation found in the real case is only artificial. In Table 1, we compare the number of anomalies detected in the real data analyses with the same statistical value M (with its standard deviation, STD) estimated from the correlation analysis with the 100 simulated earthquakes. The number of anomalies obtained from real data analyses is always comparable with the statistical mean value within one standard deviation, indicating its casual occurrence.

5. Conclusions

In this study, we considered a possible correlation between solar-terrestrial indices and seismicity. More precisely, we formulated a null H0 hypothesis, i.e., there is a correlation between geomagnetic sun-induced activity and earthquakes; then, after a series of analyses, we rejected that hypothesis. Although it is observed that in about 33% of the studied powerful earthquake during the periods of 1 January 2000 and 28 April 2022, solar and geomagnetic indices show unusual variations one day before the main shock by defining allowed ranges during the periods of 100 days before the events, it is not observed any noticeable anomalies. In addition, by creating 100 simulated earthquake datasets (each obtained by shuffling just their date of occurrence) and observing analog anomalies, the possibility of being a significant correlation between powerful earthquakes and solar-geomagnetic interactions is questioned because the number of anomalies found considering the real earthquake catalog is comparable with the corresponding estimation of the mean number of anomalies, obtained by analyzing the geomagnetic and solar indices with 100 simulated earthquake datasets (Table 1), within one standard deviation.
As discussed in the introduction and section two, several studies have been conducted on the relationship between solar-terrestrial interactions and earthquakes, and examples have been discussed to confirm or disprove this hypothesis. However, the results of this study do not show a statistically significant relationship between sudden changes in solar-geomagnetic parameters and the occurrence of earthquakes, especially when compared with 100 simulated earthquake datasets. In addition, as with the subject of earthquake precursors, the mechanism of this association is unclear; our work would exclude those possibly proposed and based on the eventual triggering effect from external magnetic disturbances. Anyway, we cannot exclude that, in some special cases (but not in the majority), the increase in solar activity would produce that tiny additional energy that can move the critical lithospheric system, which is behind the preparation of an impending earthquake, from an unstable state to the fault rupture, maybe anticipating by a certain time, maybe a few days, the earthquake occurrence.

Author Contributions

Data curation, writing—original draft preparation, conceptualization, methodology and software, M.A.; conceptualization, writing—reviewing and editing, funding acquisition A.D.S. All authors have read and agreed to the published version of the manuscript.

Funding

This research was funded by the Italian Space Agency, grant number 2020-32-H.0 (Limadou-Scienza + Project) and by the European Space Agency in the framework of the TEMPO Project. The APC was funded by both ASI and ESA.

Institutional Review Board Statement

Not applicable.

Informed Consent Statement

Not applicable.

Data Availability Statement

Earthquake catalog data are freely available by the USGS https server at https://earthquake.usgs.gov/ (accessed on 15 May 2022); Solar and geomagnetic indices were downloaded via GFZ https server at ftp://ftp.gfz-potsdam.de/pub/home/obs/kp-ap/wdc/ (accessed on 15 May 2022).

Acknowledgments

The authors would like to acknowledge the GFZ for the solar and geomagnetic indices and USGS for earthquake catalog data. ADS thanks Italian Space Agency (ASI) for some funds provided within Limadou Science + Project and European Space Agency (ESA) for some funds provided within TEMPO Project.

Conflicts of Interest

The authors declare no conflict of interest. The funders had no role in the design of the study, in the collection, analyses, or interpretation of data, in the writing of the manuscript, or in the decision to publish the results.

References

  1. Akhoondzadeh, M. Anomalous TEC variations associated with the powerful Tohoku earthquake of 11 March 2011. Nat. Hazards Earth Syst. Sci. 2012, 12, 1453–1462. [Google Scholar] [CrossRef] [Green Version]
  2. Akhoondzadeh, M. A MLP neural network as an investigator of TEC time series to detect seismo-ionospheric anomalies. Adv. Space Res. 2013, 51, 2048–2057. [Google Scholar] [CrossRef]
  3. Marchetti, D.; Akhoondzadeh, M. Analysis of Swarm satellites data showing seismo-ionospheric anomalies around the time of the strong Mexico (Mw = 8.2) earthquake of 08 September 2017. Adv. Space Res. 2018, 62, 614–623. [Google Scholar] [CrossRef]
  4. Akhoondzadeh, M.; De Santis, A.; Marchetti, D.; Shen, X. Swarm-TEC satellite measurements as a potential earthquake precursor together with other Swarm and CSES data: The case of Mw7.6 2019 Papua New Guinea seismic event. Front. Earth Sci. 2022, 10, 1–17. [Google Scholar] [CrossRef]
  5. Sadeghi, Z.; Hossainali, M. Application of the T2-Hotelling test for investigating ionospheric anomalies before large earthquakes. J. Atmos. Sol.-Terr. Phys. 2019, 185, 7–21. [Google Scholar] [CrossRef]
  6. Wolf, R. On the periodic return of the minimum of sun-spots: The agreement between those periods and the variations of magnetic declination. Philos. Mag. 1853, 5, 67. [Google Scholar] [CrossRef]
  7. Odintsov, S.; Boyarchuk, K.; Georgieva, K.; Kirov, B.; Atanasov, D. Long-period trends in global seismic and geomagnetic activity and their relation to solar activity. Phys. Chem. Earth 2006, 31, 88–93. [Google Scholar] [CrossRef]
  8. Simpson, J.F. Solar activity as a triggering mechanism for earthquakes. Earth Planet. Sci. Lett. 1967, 3, 417–425. [Google Scholar] [CrossRef]
  9. Huzaimy, J.M.; Yumoto, K. Possible correlation between solar activity and global seismicity. In Proceedings of the 2011 IEEE International Conference on Space Science and Communication, Penang, Malaysia, 12–13 July 2011; pp. 138–141. [Google Scholar]
  10. Love, J.J.; Thomas, J.N. Insignificant solar-terrestrial triggering of earthquakes. Geophys. Res. Lett. 2013, 40, 1165–1170. [Google Scholar] [CrossRef]
  11. Urata, N.; Duma, G.; Freund, F. Geomagnetic Kp Index and Earthquakes. Open J. Earthq. Res. 2018, 7, 39–52. [Google Scholar] [CrossRef] [Green Version]
  12. Tarasov, N. Effect of solar activity on electromagnetic fields and seismicity of the Earth. IOP Conf. Ser. Earth Environ. Sci. 2021, 929, 012019. [Google Scholar] [CrossRef]
  13. Guglielmi, A.V.; Klain, B.I.; Kurazhkovskaya, N.A. On the Correlation of Earthquakes with Geomagnetic Storms. Izv. Phys. Solid Earth 2021, 57, 994–998. [Google Scholar] [CrossRef]
  14. Sobolev, G.A. The Effect of Strong Magnetic Storms on the Occurrence of Large Earthquakes. Izv. Phys. Solid Earth 2021, 57, 20–36. [Google Scholar] [CrossRef]
  15. Marchitelli, V.; Harabaglia, P.; Troise, C.; De Natale, G. On the correlation between solar activity and large earthquakes worldwide. Sci. Rep. 2020, 10, 11495. [Google Scholar] [CrossRef]
  16. Gribbin, J. Relation of sunspot and earthquake activity. Science 1971, 173, 558. [Google Scholar] [CrossRef]
  17. Han, Y.; Guo, Z.; Wu, J.; Ma, L. Possible triggering of solar activity to big earthquakes (Ms ≥ 8) in faults with near west–east strike in China. Sci. China Ser. B Phys. Mech. Astron. 2004, 47, 173–181. [Google Scholar] [CrossRef]
  18. Duma, G.; Ruzhin, Y. Diurnal changes of earthquake activity and geomagnetic Sq-variations. Nat. Hazards Earth Syst. Sci. 2003, 3, 171–177. [Google Scholar] [CrossRef] [Green Version]
  19. Rabeh, T.; Miranda, M.; Hvozdara, M. Strong earthquakes associated with high amplitude daily geomagnetic variations. Nat. Hazards 2010, 53, 561–574. [Google Scholar] [CrossRef]
  20. Sobolev, G.A.; Zakrzhevskaya, N.A.; Kharin, E.P. On the relation between seismicity and magnetic storms. Izvestiya Phys. Solid Earth 2001, 37, 917–927. [Google Scholar]
  21. Bakhmutov, V.; Sedova, F.I.; Mozgovaya, T.A. Geomagnetic disturbances and earthquakes in the Vrancea zone. Izv. Phys. Solid Earth 2007, 43, 931–937. [Google Scholar] [CrossRef]
  22. Mukherjee, S. 26th January 2001 Earthquake of Gujarat, India Was Triggered by Change in Kp and Electron Flux Induced by Sun, Earthquake Prediction; Mukherjee, S., Ed.; CRC Press: Boca Raton, FL, USA, 2006; pp. 163–195. [Google Scholar]
  23. Anagnostopoulos, G.C.; Papandreou, A. Space conditions during a month of a sequence of six M > 6.8 earthquakes ending with the tsunami of 26 December 2004. Nat. Hazards Earth Syst. Sci. 2012, 12, 1551–1559. [Google Scholar] [CrossRef]
  24. Jeffreys, H. Aftershocks and periodicities in earthquakes, Gerlands Beitr. Geophys. 1938, 53, 111–139. [Google Scholar]
  25. Meeus, J. Sunspots and earthquakes. Phys. Today 1976, 29, 11. [Google Scholar] [CrossRef]
  26. Stothers, R.B. A search for long-term periodicities in large earthquakes of southern and coastal central California. Geophys. Res. Lett. 1990, 17, 1981–1984. [Google Scholar] [CrossRef]
  27. Yesugey, S.C. Comparative evaluation of the influencing effects of geomagnetic storms on earthquakes in the Anatolian Peninsula. Earth Sci. Res. J. 2009, 13, 82–89. [Google Scholar]
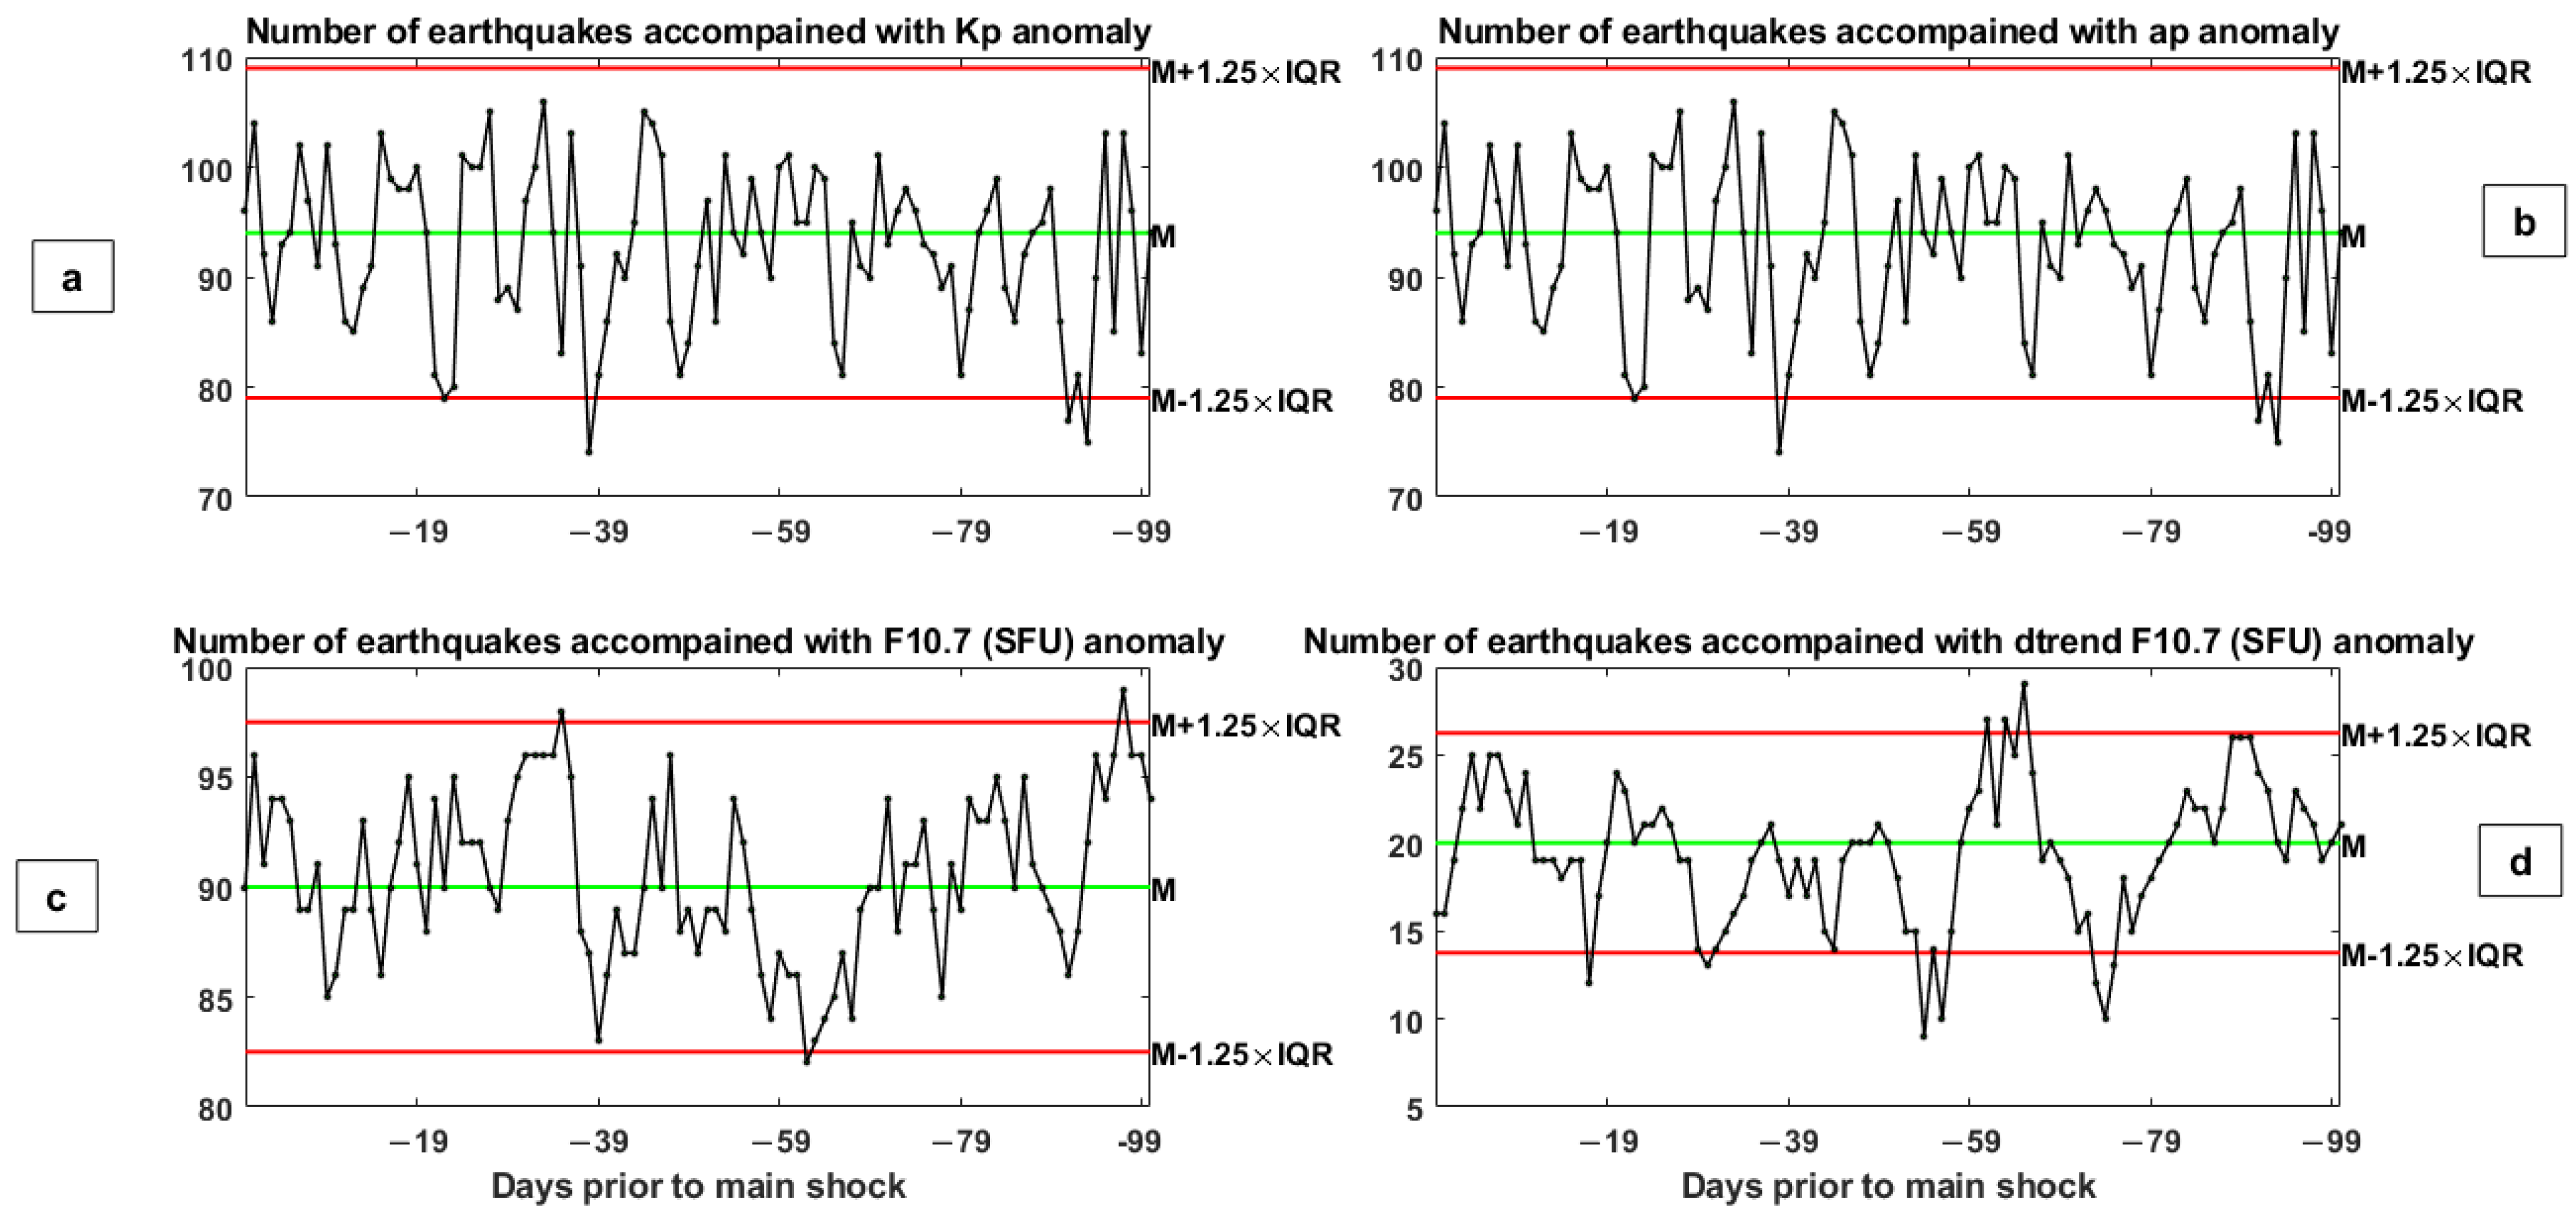
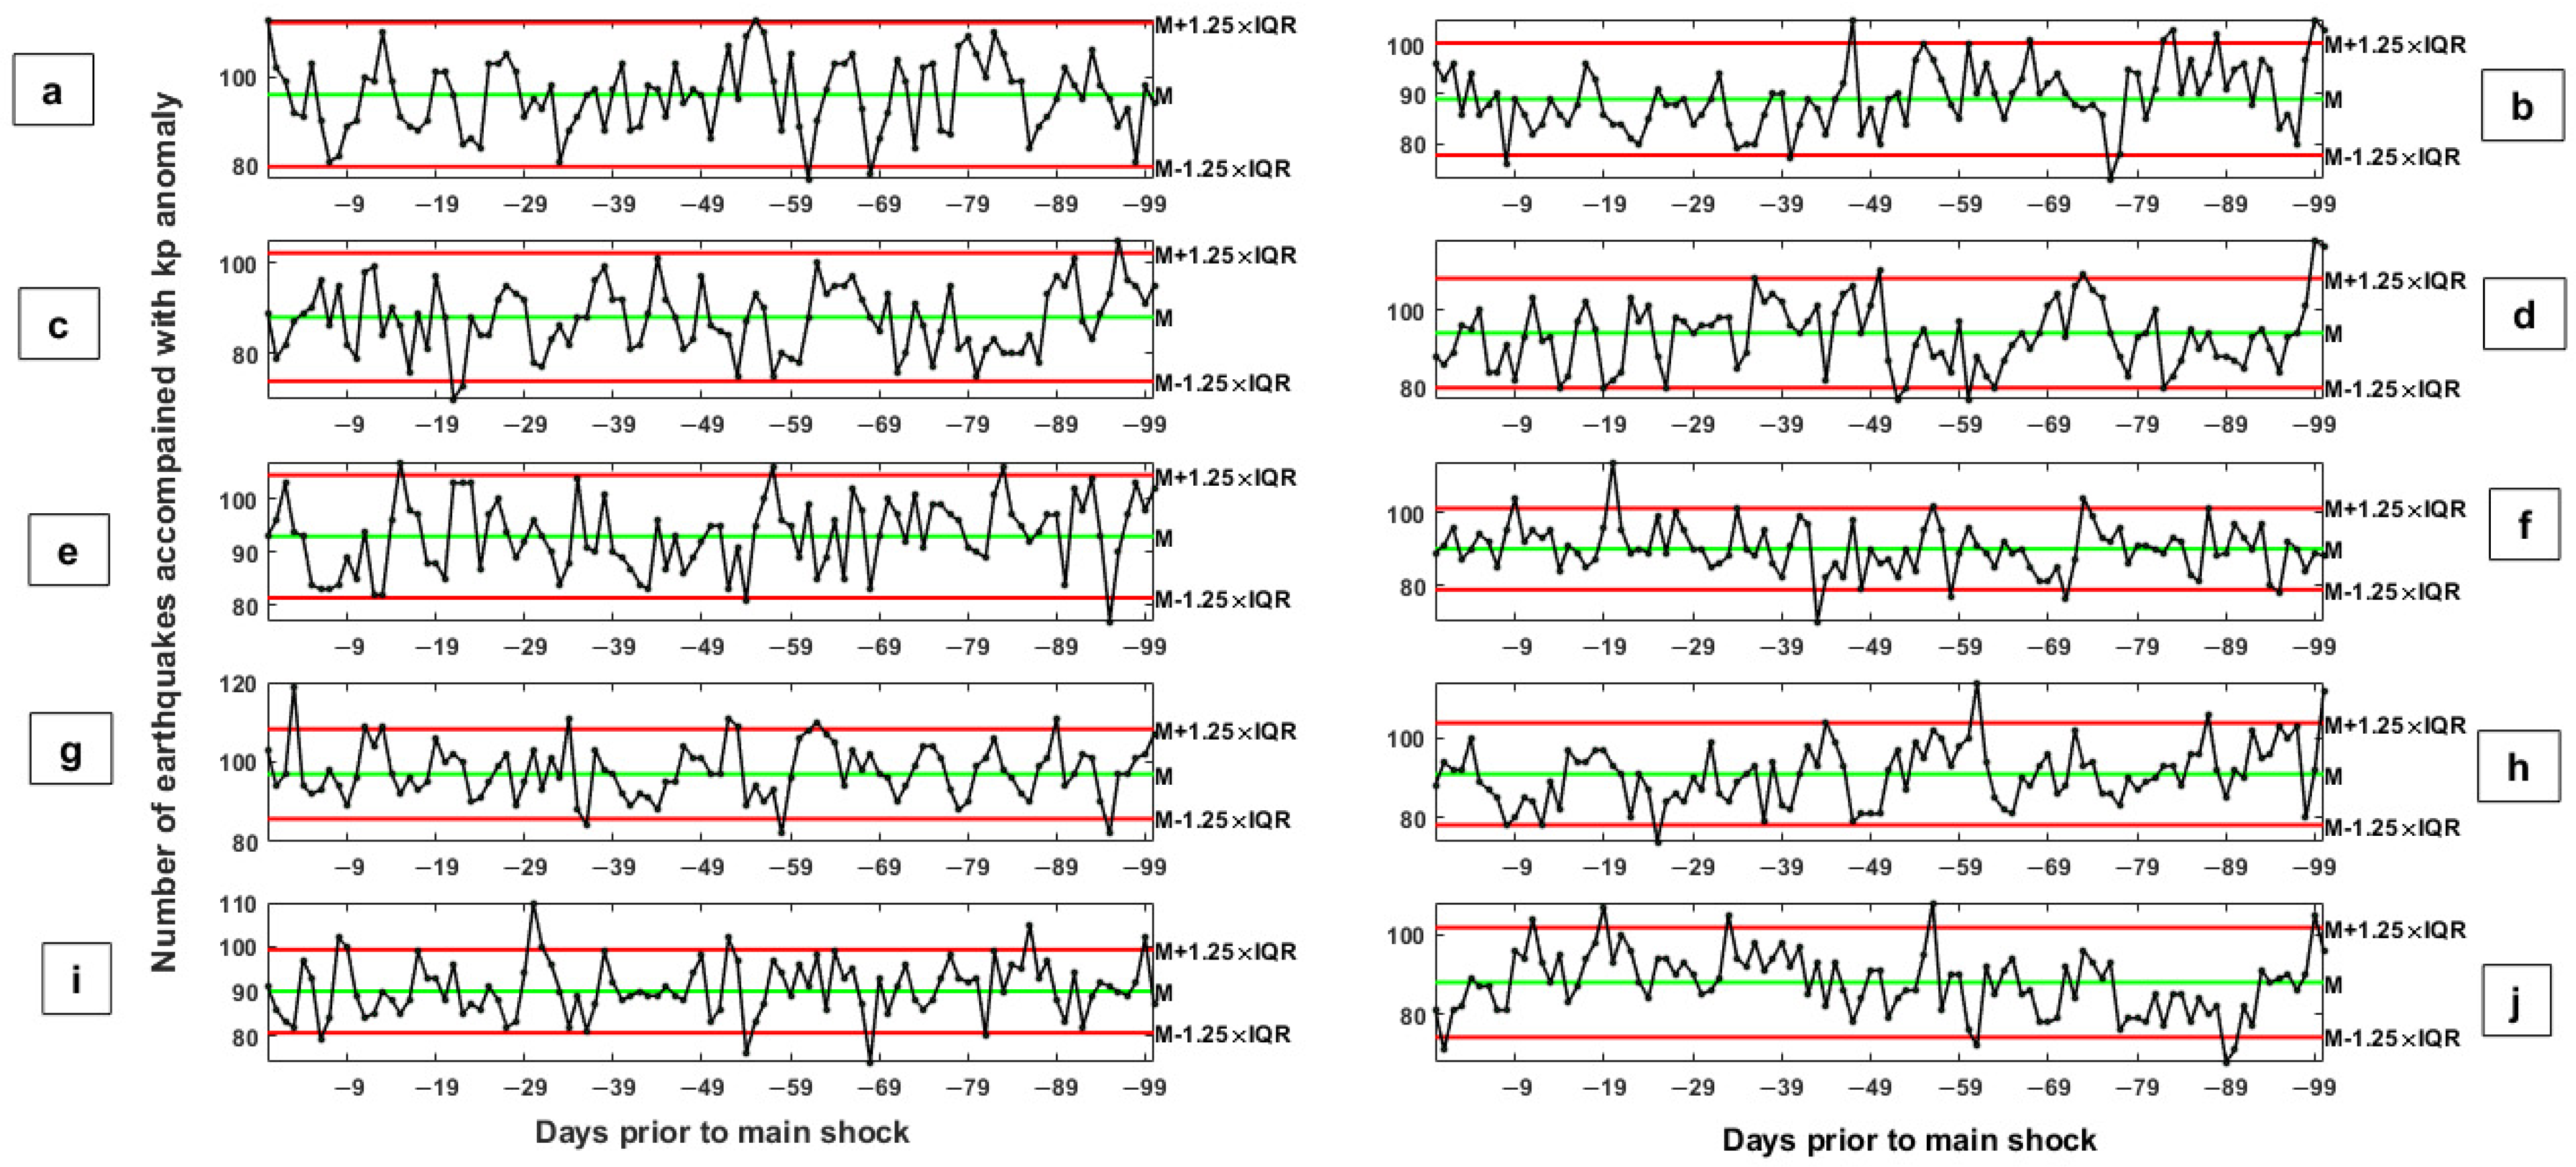
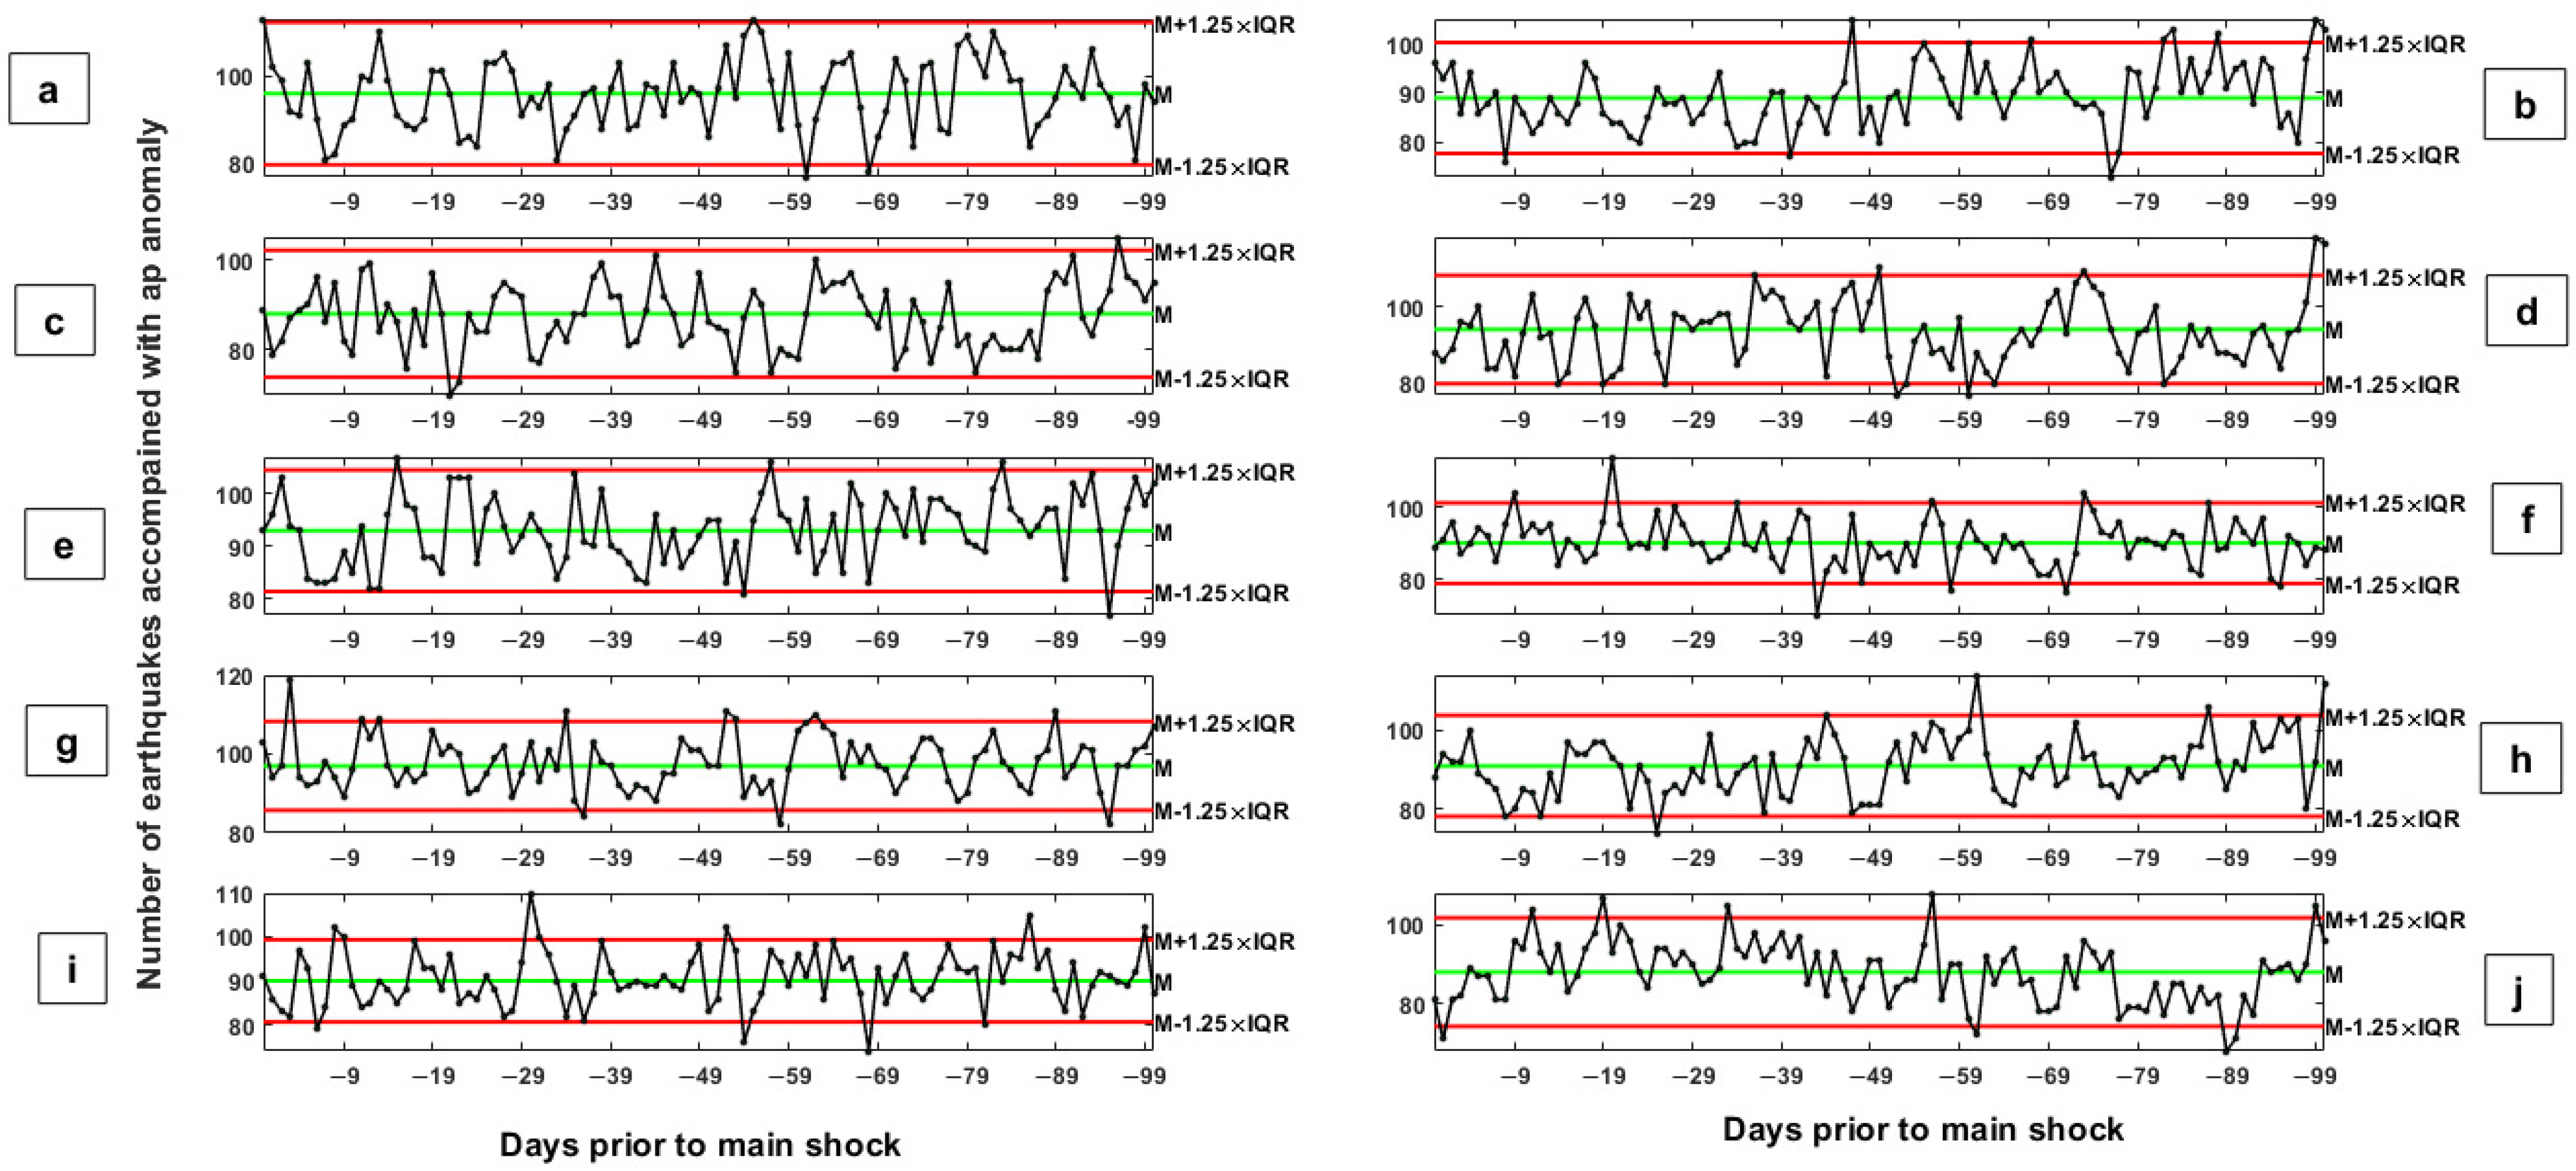
Figure 1. (ad) shows, respectively, the variations of Kp, ap, Dst, and F10.7 geomagnetic indices during the period of 1 January to 30 April 2011. An asterisk “*” indicates the earthquake time of Tohoku (11 March 2011). The dotted ellipsoids represent the conditions around the earthquake time. The dotted line represents the earthquake day. The x-axis represents the days relative to the earthquake day. The y-axis in a, b, and c represents the local time coordinate. The values of the geomagnetic indices are given as binary, i.e., red for disturbed magnetic times and green for quiet magnetic times.
Atmosphere 13 01131 g001
Figure 2. (ac) shows, respectively, the variations of Kp, Dst, and the solar radio flux (F10.7) indices during the period of 1 April to 15 October 2017. An asterisk “*” indicates the earthquake time of Mexico (8 September 2017). The dotted ellipsoids represent the conditions around the earthquake time. The dotted line represents the earthquake day. The values of the geomagnetic indices are given as binary, i.e., red for disturbed magnetic times and green for quiet magnetic times.
Atmosphere 13 01131 g002
Figure 3. (ac) shows, respectively, the variations of ap, Dst, and solar radio flux (F10.7) indices, respectively, during the period of 1 January to 30 June 2019. An asterisk “*” indicates the earthquake time. The dotted ellipsoids represent the conditions around the earthquake time. The dotted line represents the earthquake day. An asterisk indicates the earthquake time of New Guinea (14 May 2019). The values of the geomagnetic indices are given as binary, i.e., red for disturbed magnetic times and green for quiet magnetic times.
Atmosphere 13 01131 g003
Figure 4. Time series of (a) global earthquake magnitudes, shown here for M ≥ 7.0 (b) dtrend daily average F10.7 (SFU) index, (c) daily average Kp index, and (d) daily average ap index, during the periods of 1 January 2000 and 28 April 2022.
Atmosphere 13 01131 g004
Figure 5. The number of earthquakes accompanied by anomalous changes in (a) Kp, (b) ap, (c) F10.7, and (d) dtrend F10.7 indices during the days prior to the studied earthquakes.
Atmosphere 13 01131 g005
Figure 6. Panels (aj) show an array of the first 10 simulated earthquakes dataset (out of 100 simulations) during the period of 1 January 2000 and 28 April 2022.
Atmosphere 13 01131 g006
Figure 7. Panels (aj) show the results of 10 simulated earthquakes datasets. The y-axis in each panel indicates the number of simulated earthquakes accompanied by anomalous changes in the Kp index during the days prior to the simulated earthquakes. Median and higher and lower bounds are drawn as green and red horizontal lines, respectively. The allowed ranges are defined as M ± 1.25 × IQR, in which M and IQR are the median and the inter-quartile range parameters, respectively.
Atmosphere 13 01131 g007
Figure 8. Panels (aj) show results of 10 simulated earthquakes dataset. The y-axis in each panel indicates the number of simulated earthquakes accompanied by anomalous changes in the ap index during the days prior to the simulated earthquakes. Median and higher and lower bounds are drawn as green and red horizontal lines, respectively. The allowed ranges are defined as M ± 1.25 × IQR, in which M and IQR are the median and the inter-quartile range parameters, respectively.
Atmosphere 13 01131 g008
Figure 9. Panels (aj) show results of 10 simulated earthquakes dataset. The y-axis in each panel indicates the number of simulated earthquakes accompanied by anomalous changes in the F10.7 index during the days prior to the simulated earthquakes. Median and higher and lower bounds are drawn as green and red horizontal lines, respectively. The allowed ranges are defined as M ± 1.25 × IQR, in which M and IQR are the median and the inter-quartile range parameters, respectively.
Atmosphere 13 01131 g009
Figure 10. Panels (aj) show results of 10 simulated earthquakes dataset. The y-axis in each panel indicates the number of simulated earthquakes accompanied by anomalous changes in the dtrend F10.7 index during the days prior to the simulated earthquakes. Median and higher and lower bounds are drawn as green and red horizontal lines, respectively. The allowed ranges are defined as M ± 1.25 × IQR, in which M and IQR are the median and the inter-quartile range parameters, respectively.
Atmosphere 13 01131 g010
Figure 11. The number of detected anomalous anomalies for indices of (a) ap, (b) Kp, (c) F10.7, and (d) dtrend F10.7 after making 100 simulated earthquake datasets. Please note the x-axis here is the number of the simulation. “M” and “STD” are Mean and Standard Deviation parameters, respectively. Mean and higher and lower bounds are drawn as green and red horizontal lines, respectively. The allowed ranges are defined as M ± STD, in which M and STD are the mean and the standard deviation parameters, respectively.
Atmosphere 13 01131 g011
Table 1. The real number of anomalies (central columns) found considering each index (left column) and the real earthquake catalog compared with the statistical mean value Ns ± one standard deviation, sd (right column) obtained from 100 simulations (the anomalies are also indicated as positive or negative). Please note that M is not an integer number because it is calculated as a mean of a series of numbers (so as the standard deviation STD). The number of anomalies obtained from real data analyses is always comparable with the statistical mean value within one standard deviation, indicating its casual occurrence.
Real Number of AnomaliesM ± STD from Simulations
ap3 (<0)4.8 ± 2.4
Kp3 (<0)4.8 ± 2.4
F10.73 (2 > 0, 1 < 0)4.8 ± 3
Dtrend F10.78 (5 < 0, 3 > 0)5 ± 3
Publisher’s Note: MDPI stays neutral with regard to jurisdictional claims in published maps and institutional affiliations.

