Article

Impact of Sea Breeze on the Transport of Ship Emissions: A Comprehensive Study in the Bohai Rim Region, China

Key Laboratory of Beijing on Regional Air Pollution Control, Beijing University of Technology, Beijing 100124, China
*
Author to whom correspondence should be addressed.
Atmosphere 2022, 13(7), 1094; https://doi.org/10.3390/atmos13071094
Submission received: 26 April 2022 / Revised: 24 May 2022 / Accepted: 30 May 2022 / Published: 11 July 2022
(This article belongs to the Special Issue Atmospheric Shipping Emissions and Their Environmental Impacts)

Abstract

:
Air pollutants from ship exhaust have a negative impact on air quality in coastal areas, which can be greatly exacerbated by sea breeze circulation. However, our understanding of this issue is still limited, especially in coastal areas with a complex topography and winding coastlines, such as the Bohai Rim region in China. In order to fill this knowledge gap, the Weather Research and Forecast model coupled with the chemistry (WRF/Chem) modeling system was employed to investigate the influence of sea breeze circulation on the transport of PM2.5 emitted by ships from April to September in 2014. The major findings are as follows: (1) The concentration of PM2.5 due to ship emissions was 2.94 μg/m3 on days with a sea breeze and 2.4 times higher than on days without a sea breeze in coastal cities in the region. (2) The difference in the contribution of ship emissions during days with a sea breeze and days without a sea breeze decreases with increasing distance from the coastline but remains non-negligible up to 50 km inland. (3) The shape of the coastline, the topographic height of the land area, and the latitude have a significant impact on sea breeze circulation and thus on the transport of ship emissions. (4) The differences in the contribution of ship emissions under days with a sea breeze versus days without a sea breeze were more evident than those under onshore versus alongshore and offshore winds, indicating that sea breeze circulation can cause cyclic accumulation of pollutants and thus reinforce the impact of ship emissions on coastal air quality more than by onshore winds. It should be emphasized that during the switching from sea breeze to a non-sea breeze, the pollutants that have been transported to the land area by sea breeze have not yet been carried back to sea, resulting in the ship contribution value still not significantly reduced even if the wind is a non-sea breeze at that moment. In addition, other factors e.g., emissions, precipitation, and chemistry can also play an important role in the observed trends in this study.

1. Introduction

With the accelerating process of economic globalization and increasingly frequent international trade exchanges, global seaborne trade, which is an important component of international trade, has been growing continuously in the past decades. The booming ship transportation industry has caused significant energy consumption and air pollutant emissions that negatively affect air quality, climate change, and human health [1,2,3,4,5,6]. China is a major shipping country, with nearly 300,000 operating ships and thousands of ports [7]. In 2020, Chinese ships emitted 86,000 tons of hydrocarbons (HC), 1,391,000 tons of nitrogen oxides (NOx), and 58,000 tons of particulate matter (PM), which are about 19.8%, 28.2%, and 24.2% of the total national non-road mobile source emissions, respectively [8].
The transport and dispersion of pollutants in coastal areas are significantly influenced by wind direction [9,10,11,12]. In particular, ship emissions, as a marine source with high emission intensity [1,13,14,15,16], may have a more significant impact on land areas under the onshore wind, as pointed out in previous studies. Liu [17] reported that in the context of onshore wind, ship emissions were brought to inland areas and led to a higher contribution in most coastal urban regions, reaching 3–7 μg/m3 and accounting for 15–20% of the total PM2.5. When the wind shifted to non-onshore wind, only the coastal areas were affected, and the influence of ship emissions on the inland dropped sharply to less than 1 μg/m3, accounting for less than 5% of the total PM2.5. However, this conclusion is based on the case of only one event, and the characteristics of the influence of onshore compared with non-onshore wind on ship emissions over longer periods of time are not fully understood.
Sea breezes are one of the main causes of onshore wind and are one of the most prominent mesoscale features in coastal locations due to a thermal contrast between land and sea [18,19]. Studies have shown that in summer, sea breeze circulation occurs with a frequency of over 50% and can penetrate more than 100 km horizontally inland in China [20,21,22]. Many researchers have confirmed the adverse effects of sea breeze circulation on air quality in coastal areas [23,24,25,26,27,28,29,30,31,32]. The recirculation effect of sea breeze on pollutants and the formation of a thermal inner boundary layer limiting the vertical dispersion of pollutants were identified as the main reasons for the deterioration of air quality in coastal areas due to the sea breeze circulation [33]. In addition, the sea breeze circulation can cause atmospheric pollutants near the coast to disperse 20–60 km inland from the coastline [34,35,36]. Under this weather background, ship emissions may further aggravate air pollution in coastal cities more than usual. Therefore, it is necessary to investigate the effects of ship emissions on air quality in coastal cities under the sea breeze circulation.
Few studies have been conducted on the effects of sea breeze circulation on the transport of ship emissions. Shang et al. [37] investigated the influence of sea breeze circulation on the transport and evolution of ship emissions during an episode of the sea breeze at Tangshan port in the Bohai Rim region. Their results indicated that the dispersion of pollutants emitted from ships was significantly influenced by sea breeze circulation and that the pollutants could be transported inland to areas about 100 km away from the coastline, thus aggravating air pollution in ports and the surrounding cities.
The topography of the Bohai Rim region in China is complex, with two peninsulas (the Liaodong Peninsula and Jiaodong Peninsula) and a C-shaped coastline. Therefore, the influence of sea breeze circulation on ship emissions in the Bohai Rim region may be more complicated than that in those coastal areas with a straight coastline and flat topography and possibly with distinguishing geographical differences. However, this issue is not yet fully understood.
To fill this knowledge gap, we selected the Bohai Rim region as the research area and divided it into six sections according to the convexity and concavity of the coastline. The Weather Research and Forecast model coupled with the chemistry (WRF/Chem) modeling system was employed to investigate the influence of sea breeze circulation in the transport of ship emissions between April and September in 2014. The results of this study will help policymakers formulate more precise and effective control measures and policies to mitigate the impact of ship emissions on air quality.

2. Methodology

2.1. Study Area

The Bohai Rim region, surrounded by Beijing–Tianjin–Hebei, Shandong Province, and Liaoning Province, including the entire coastal area of the Bohai Sea and a portion of the coastal area of the Yellow Sea, is an important international gateway and is one of the busiest port clusters in the world. Two of the top ten ports in the world, namely Tianjin Port and Qingdao Port, are located in this region [38,39]. In this paper, the study area was set from 34.06° N to 43.37° N and 114.91° E to 125.92° E, covering all ports of the Bohai Rim region, as shown in Figure 1.

2.2. Input Data and Model Configuration

2.2.1. Input Data

In this study, the WRF/Chem modeling system was employed to investigate the impact of onshore wind, especially sea breeze circulation, on the transport of ship emissions in the summer half of 2014. The input data of the modeling system are described as follows:
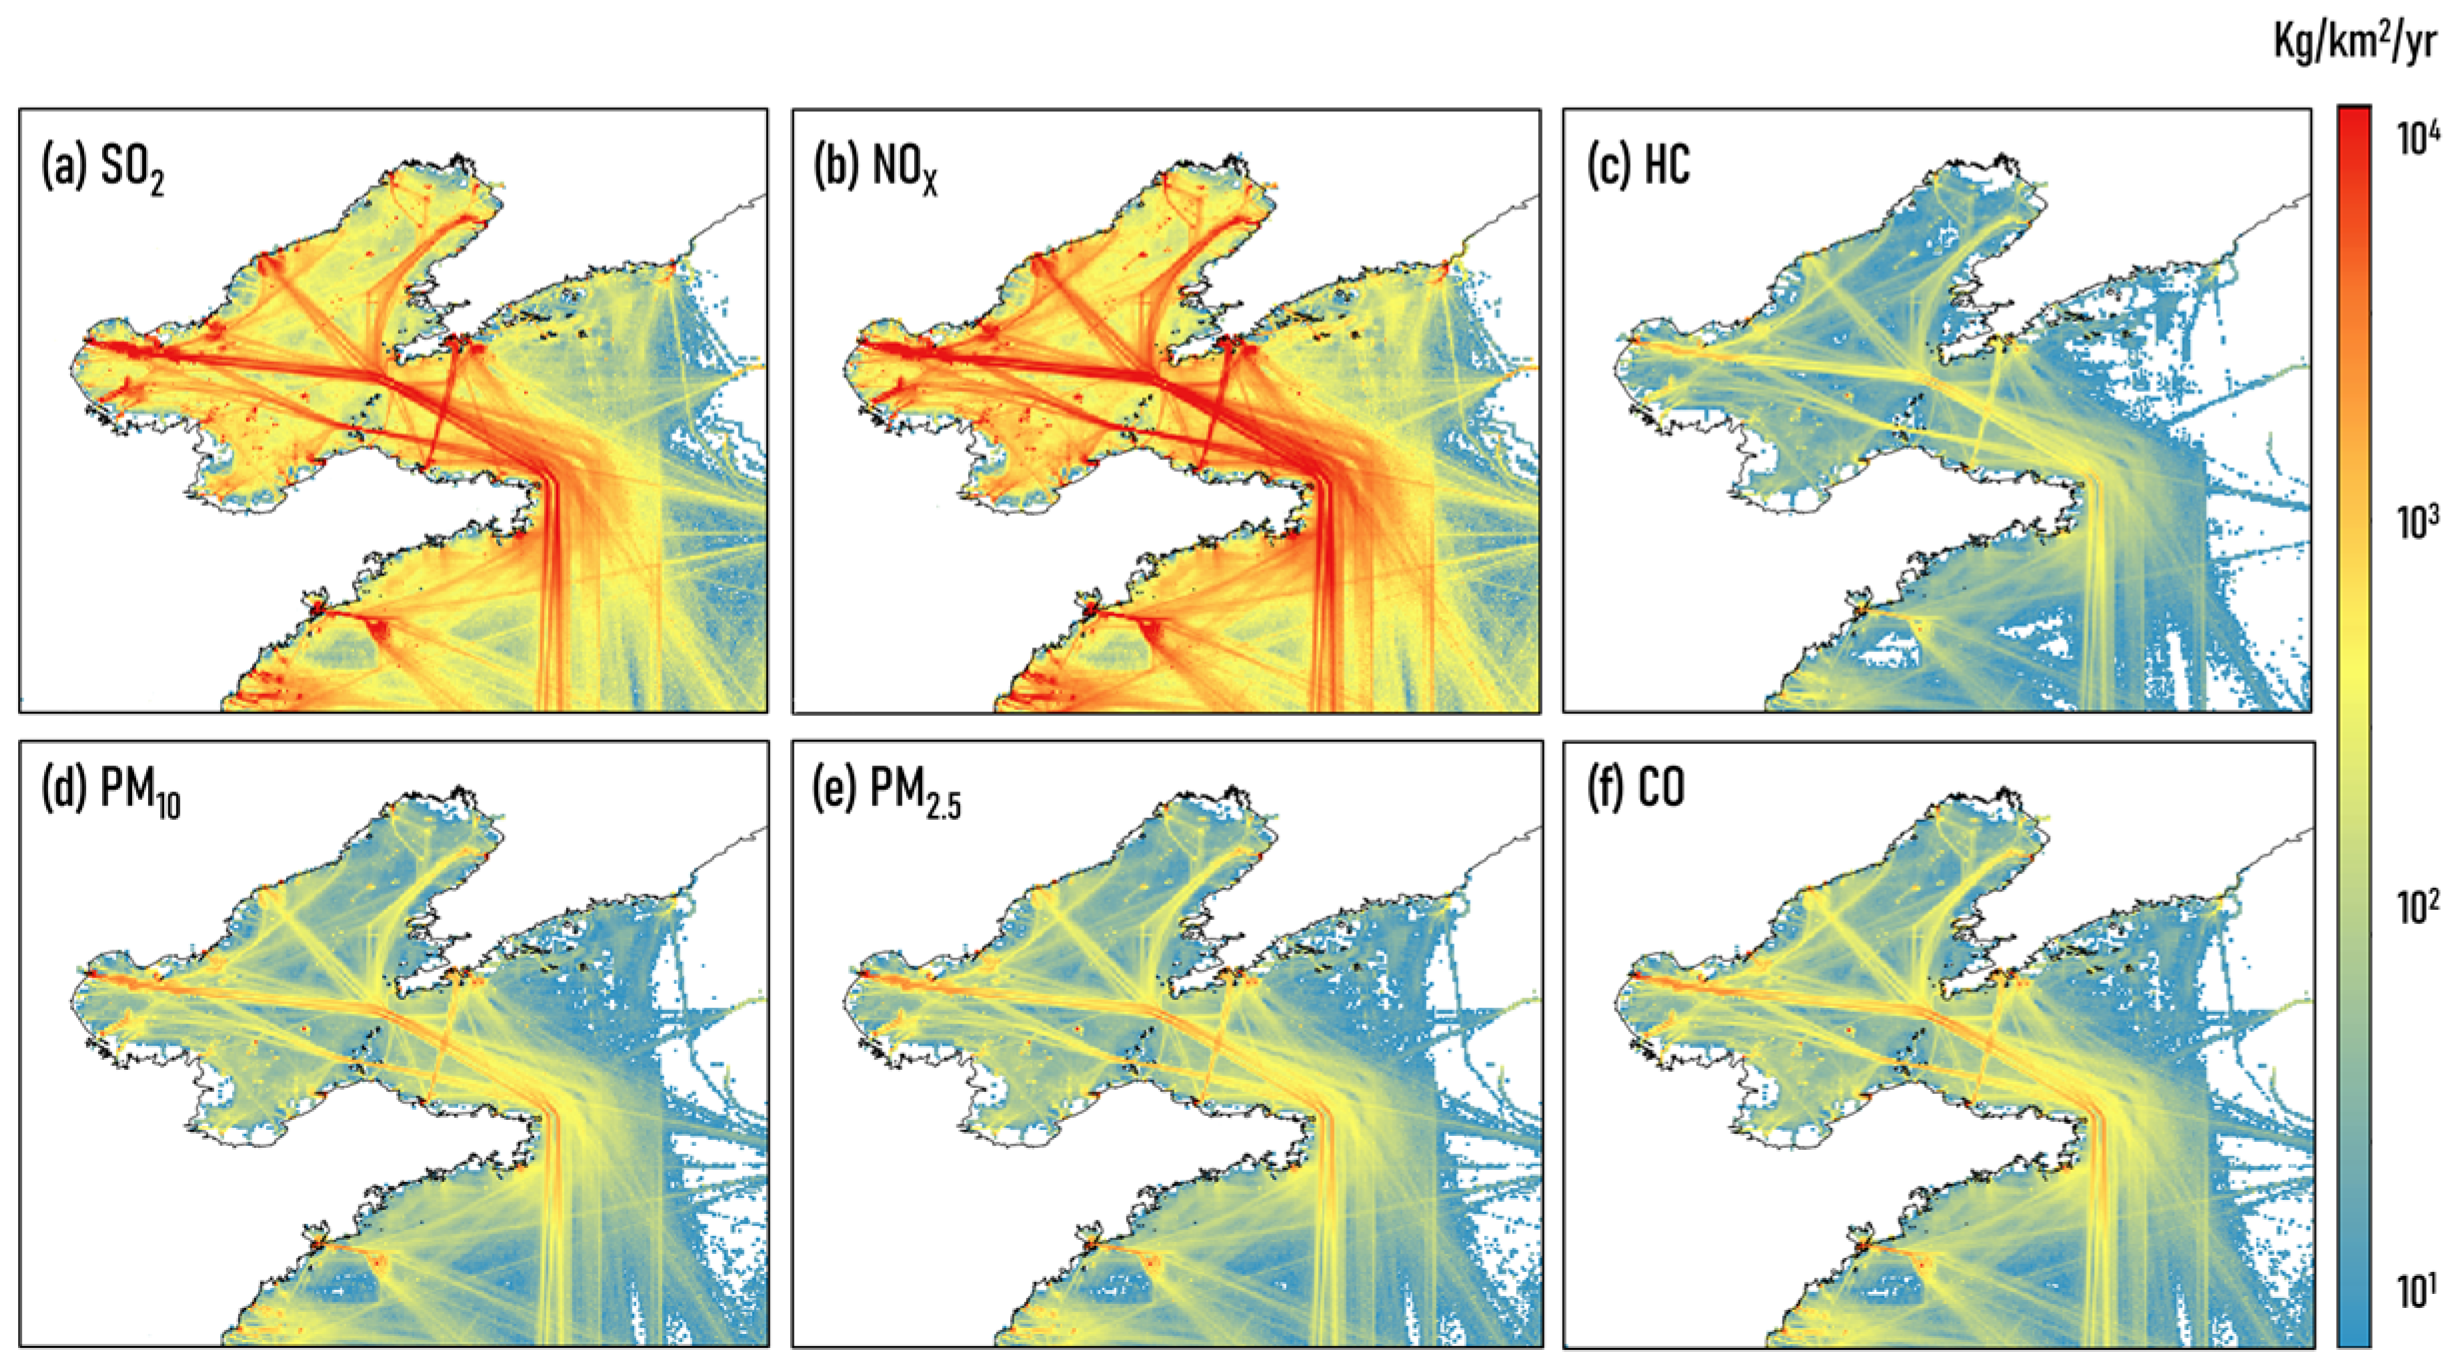
Emission from shipping. The ship emission inventory for the study was established by Chen et al. [40] with a high spatiotemporal resolution in China. Based on this inventory, the total ship emissions in this study area were 1.8 × 10⁵ (SO2), 28.9 × 10⁵ (NOx), 2.4 × 10⁴ (PM2.5), 2.6 × 10⁴ (PM10), 1.16 × 10⁴ (HC), and 2.46 × 10⁴ (CO) tonnes/yr. Figure 2 shows the spatial distribution of annual ship emissions for different pollutions in 2014 over the Bohai Rim region.
Emission from other anthropogenic and natural sources. Other anthropogenic emission inventories were obtained from the Multi-resolution Emission Inventory of China (MEIC) in 2014 [41,42,43,44]. The biomass burning emissions reported by Zhou et al. [45] were used in this study. The biogenic emissions were calculated by online version of the Model of Emissions of Gases and Aerosols from Nature (MEGAN) [46], based on the United States Geological Survey (USGS) land-use classification.
Meteorological data. The meteorological input for the WRF/Chem model was generated from the National Centers for Environmental Prediction (NCEP) Final Analysis (FNL) data with a spatial resolution of 1° × 1° and a temporal resolution of 6 h [47].

2.2.2. Model Configuration

Two scenarios (with and without ship emissions) were modeled separately in this study to evaluate the impact of sea breeze circulation on the onshore transport of PM2.5 emitted by ships. All configurations of the WRF/Chem model were kept consistent for the two scenarios except for the emission inputs. A two-level-nested domain was designed for the modeling system, as shown in Figure 1. Domain 1 covers most of China with a grid resolution of 27 km (174 rows and 152 columns). Domain 2 covers the Bohai Rim region with a grid resolution of 9 km (90 rows and 96 columns). In the vertical dimension, each domain has 30 vertical layers extending from the surface to the 100 hPa level, with 18 layers within 4 km, and the lowest layer has a thickness of approximately 40 m. As the background pressure field is more stable in China during the summer half-year, the thermal difference between the sea and the land is more obvious, which is more favorable for sea breeze formation [20,21,48]. Therefore, in this paper, April–September was selected to investigate the effect of sea breeze circulation on ship emissions. A spin-up period of three days was used for the WRF/Chem model for each month. Detailed physical and chemical schemes used in the model are listed in Table 1.

2.3. Model Evaluation

The WRF/Chem model has been extensively applied and evaluated in our previous studies [15,37,56] and in those of other researchers [57,58,59,60,61]. In this study, we used similar evaluation methods to those employed by Chen et al. [37]. The correlation coefficient(R), the mean absolute error (MAE), the normalized mean bias (NMB), the normalized mean error (NME), the mean fractional bias (MFB), and the mean fractional error (MFE) statistical indicators were used to evaluate the performance of the model.
The simulated results of meteorological factors (including temperature at 2 m, T2; relative humidity at 2 m, RH2; wind speed at 10 m, WS10; wind direction at 10 m, WD10) were compared with ground-based meteorological observations (Table 2). The monitoring data at every 1 or 3 h (most at 3 h) from 161 meteorological stations located in or near the core coastal cities were obtained from the National Climate Data Center [62]. In general, the simulation results were in close accordance with the observations, with a high correlation coefficient (R), i.e., 0.71–0.92 (statistically significant at a 95% confidence level) and relatively low mean absolute error (MAE) values for temperature (0.66–1.33 °C), relative humidity (5.22–9.52%), wind speed (0.9–1.06 m/s), and wind direction (15.26–28.24°).
The simulation results of PM2.5 concentration were compared with the average surface observation values (per hour) of all monitoring stations in 140 sites. The surface observations were obtained from the local Environmental Protection Bureaus (Table 3). A high correlation coefficient (from 0.76 to 0.95) was shown between the simulated concentrations and the observed concentrations. The value of NMB and NME ranged from −21.46% to 13.66% and from 10.56% to 34.05%, respectively, which are within the suggested criteria (MFB ± 60% and MFE ± 75%) for particulate matter modeling by Boylan and Russell [63].
The results indicate that the simulated values generally agreed with the observations, but differences were also found between the simulation results and the observational data. These deviations might be explained by the inherent uncertainty of the meteorological input, emission inventory, and the unavoidable deficiencies of the meteorological and air quality models [64].

2.4. Identification of Onshore Wind

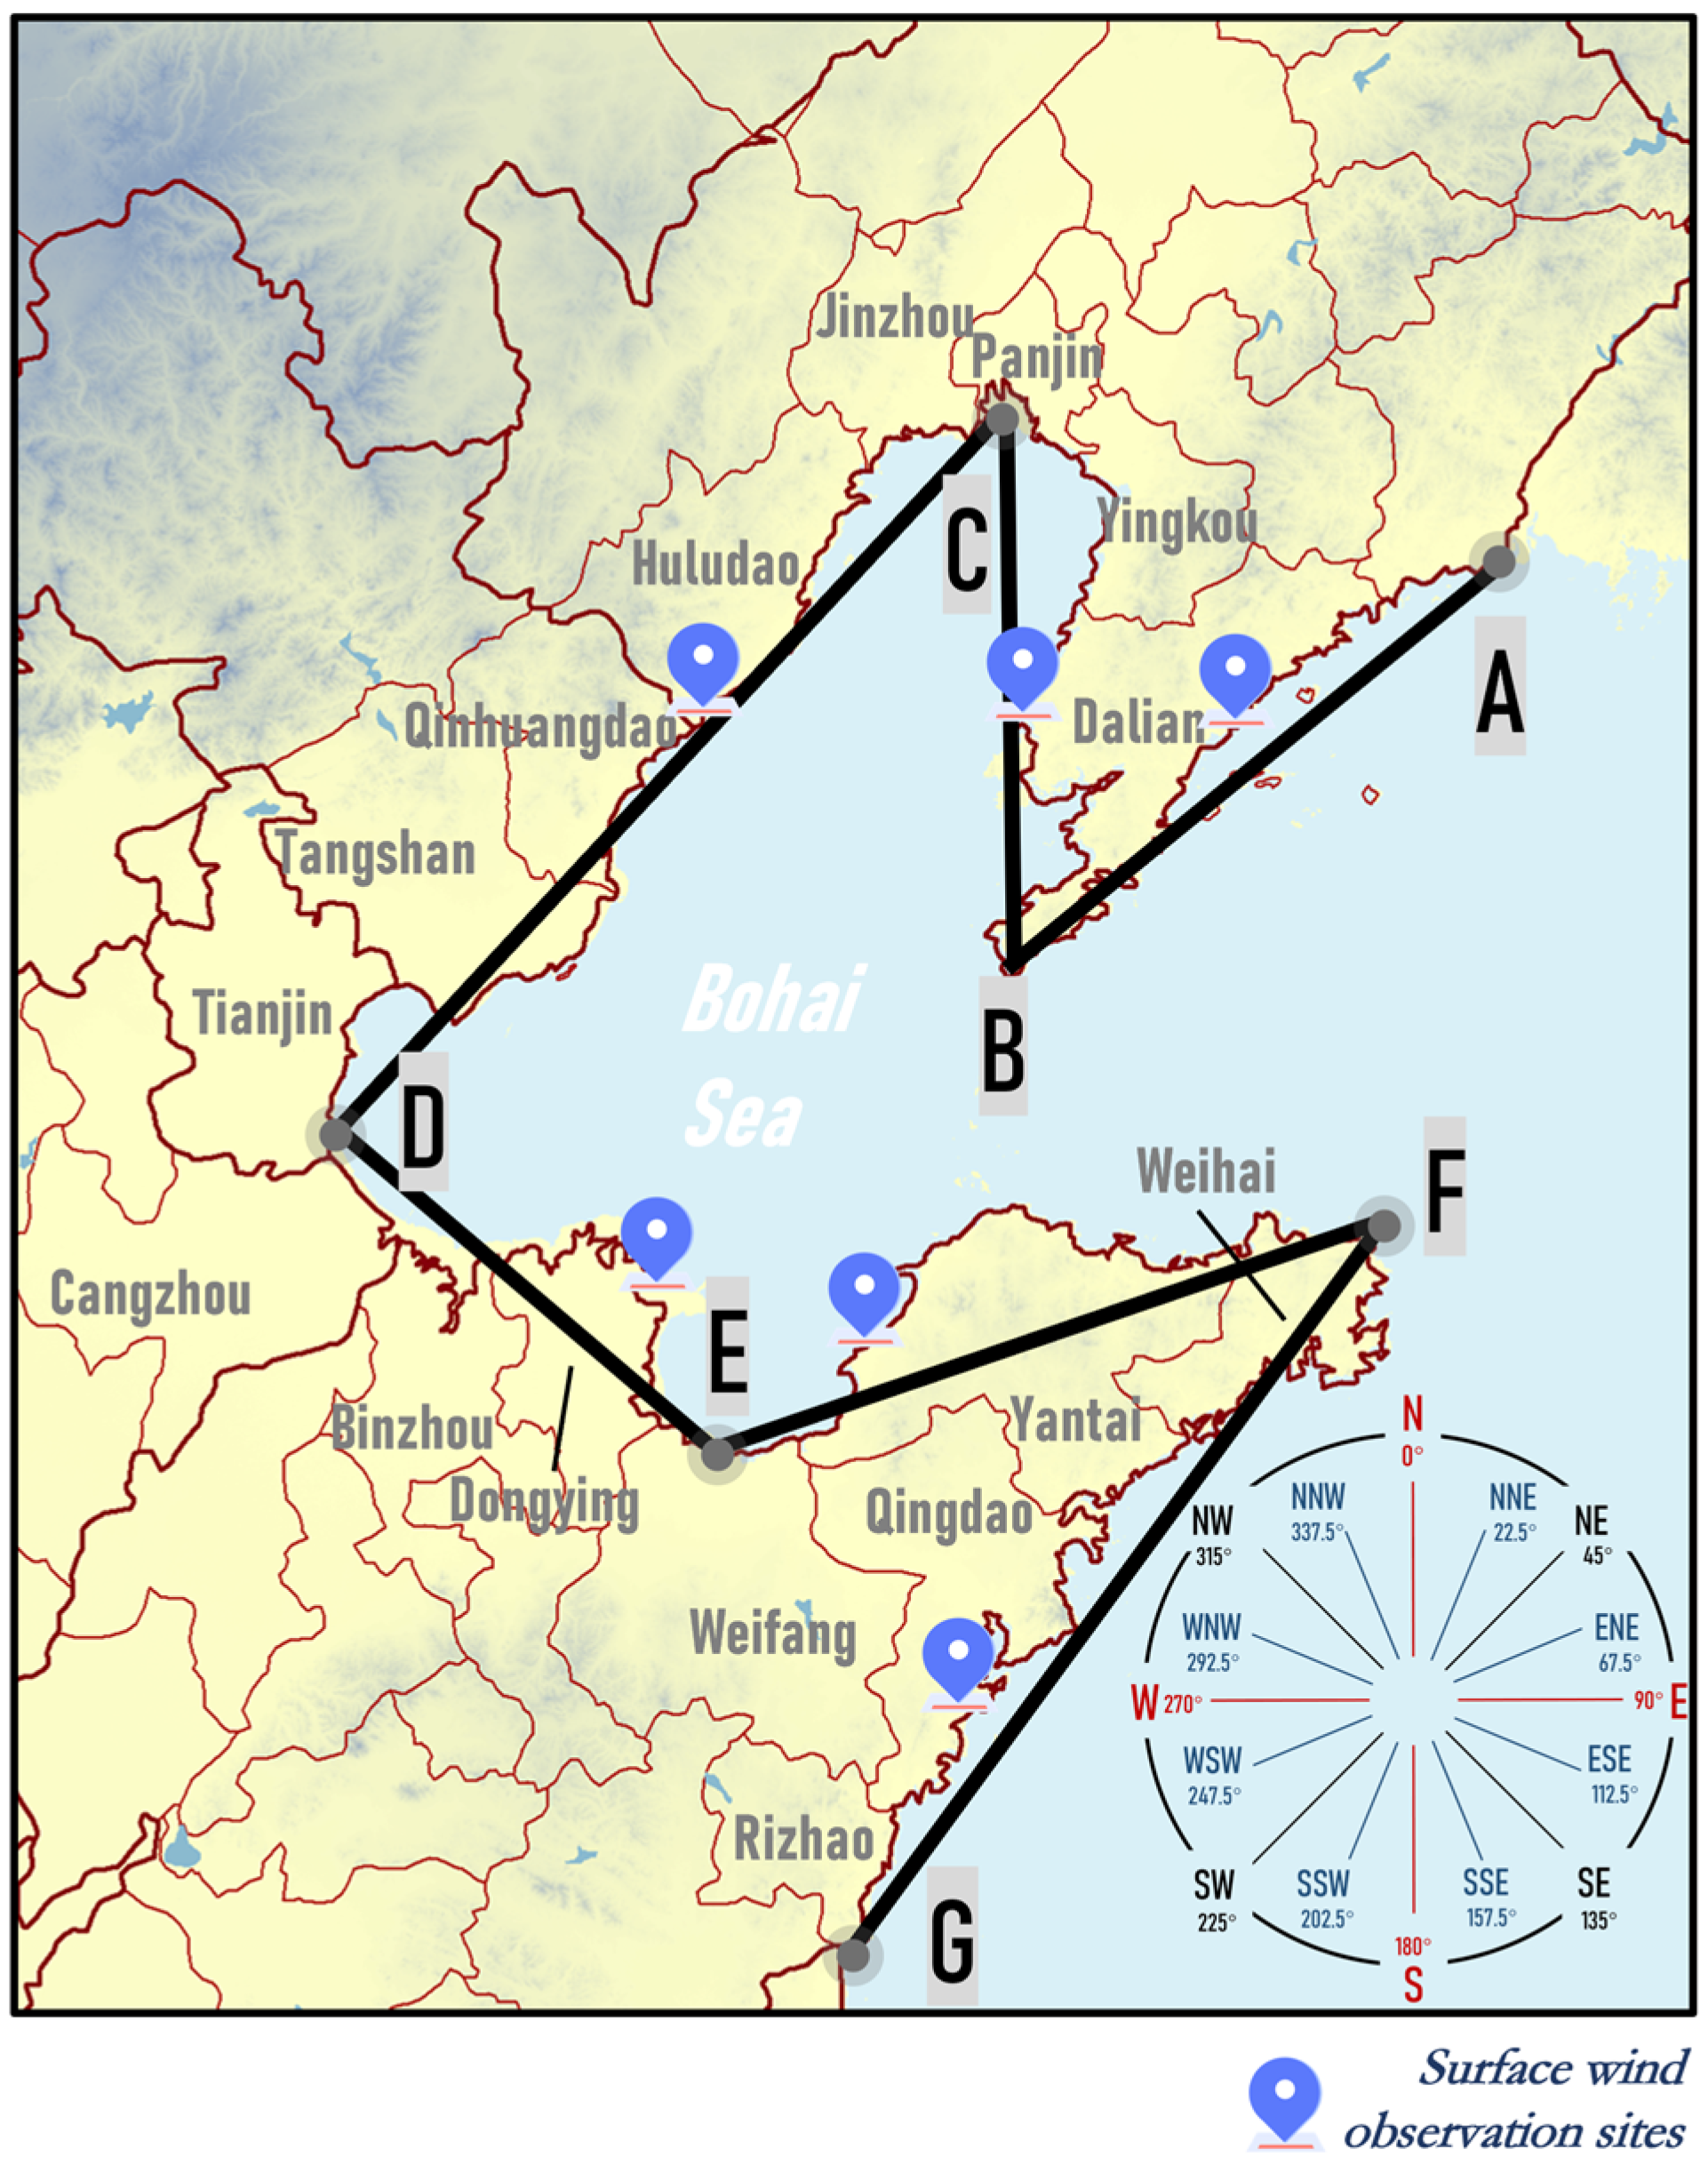
In this study, the Bohai Rim region was divided into six sections based on its geographical features and coastline orientation. Six representative stations near the coastline were selected to represent the average wind direction of each section, as shown in Figure 3.
The wind direction is classified into three categories based on the method proposed by Sethuraman and Rayno [65]: (1) When the wind direction is in one direction (22.5°) on each side of the coastline, it is defined as alongshore wind. (2) When the wind direction is outside the coastal wind range and blows from the land to the sea, it is defined as offshore wind. (3) When the wind direction is outside the coastal wind range and blows from the ocean to the land, it is defined as onshore wind. In this paper, we focus more on the impact of ship emissions on coastal cities driven by onshore winds, so we combine offshore and alongshore winds as non-onshore winds. The onshore wind range in each section is shown in Table 4.

2.5. Identification of the Sea Breeze

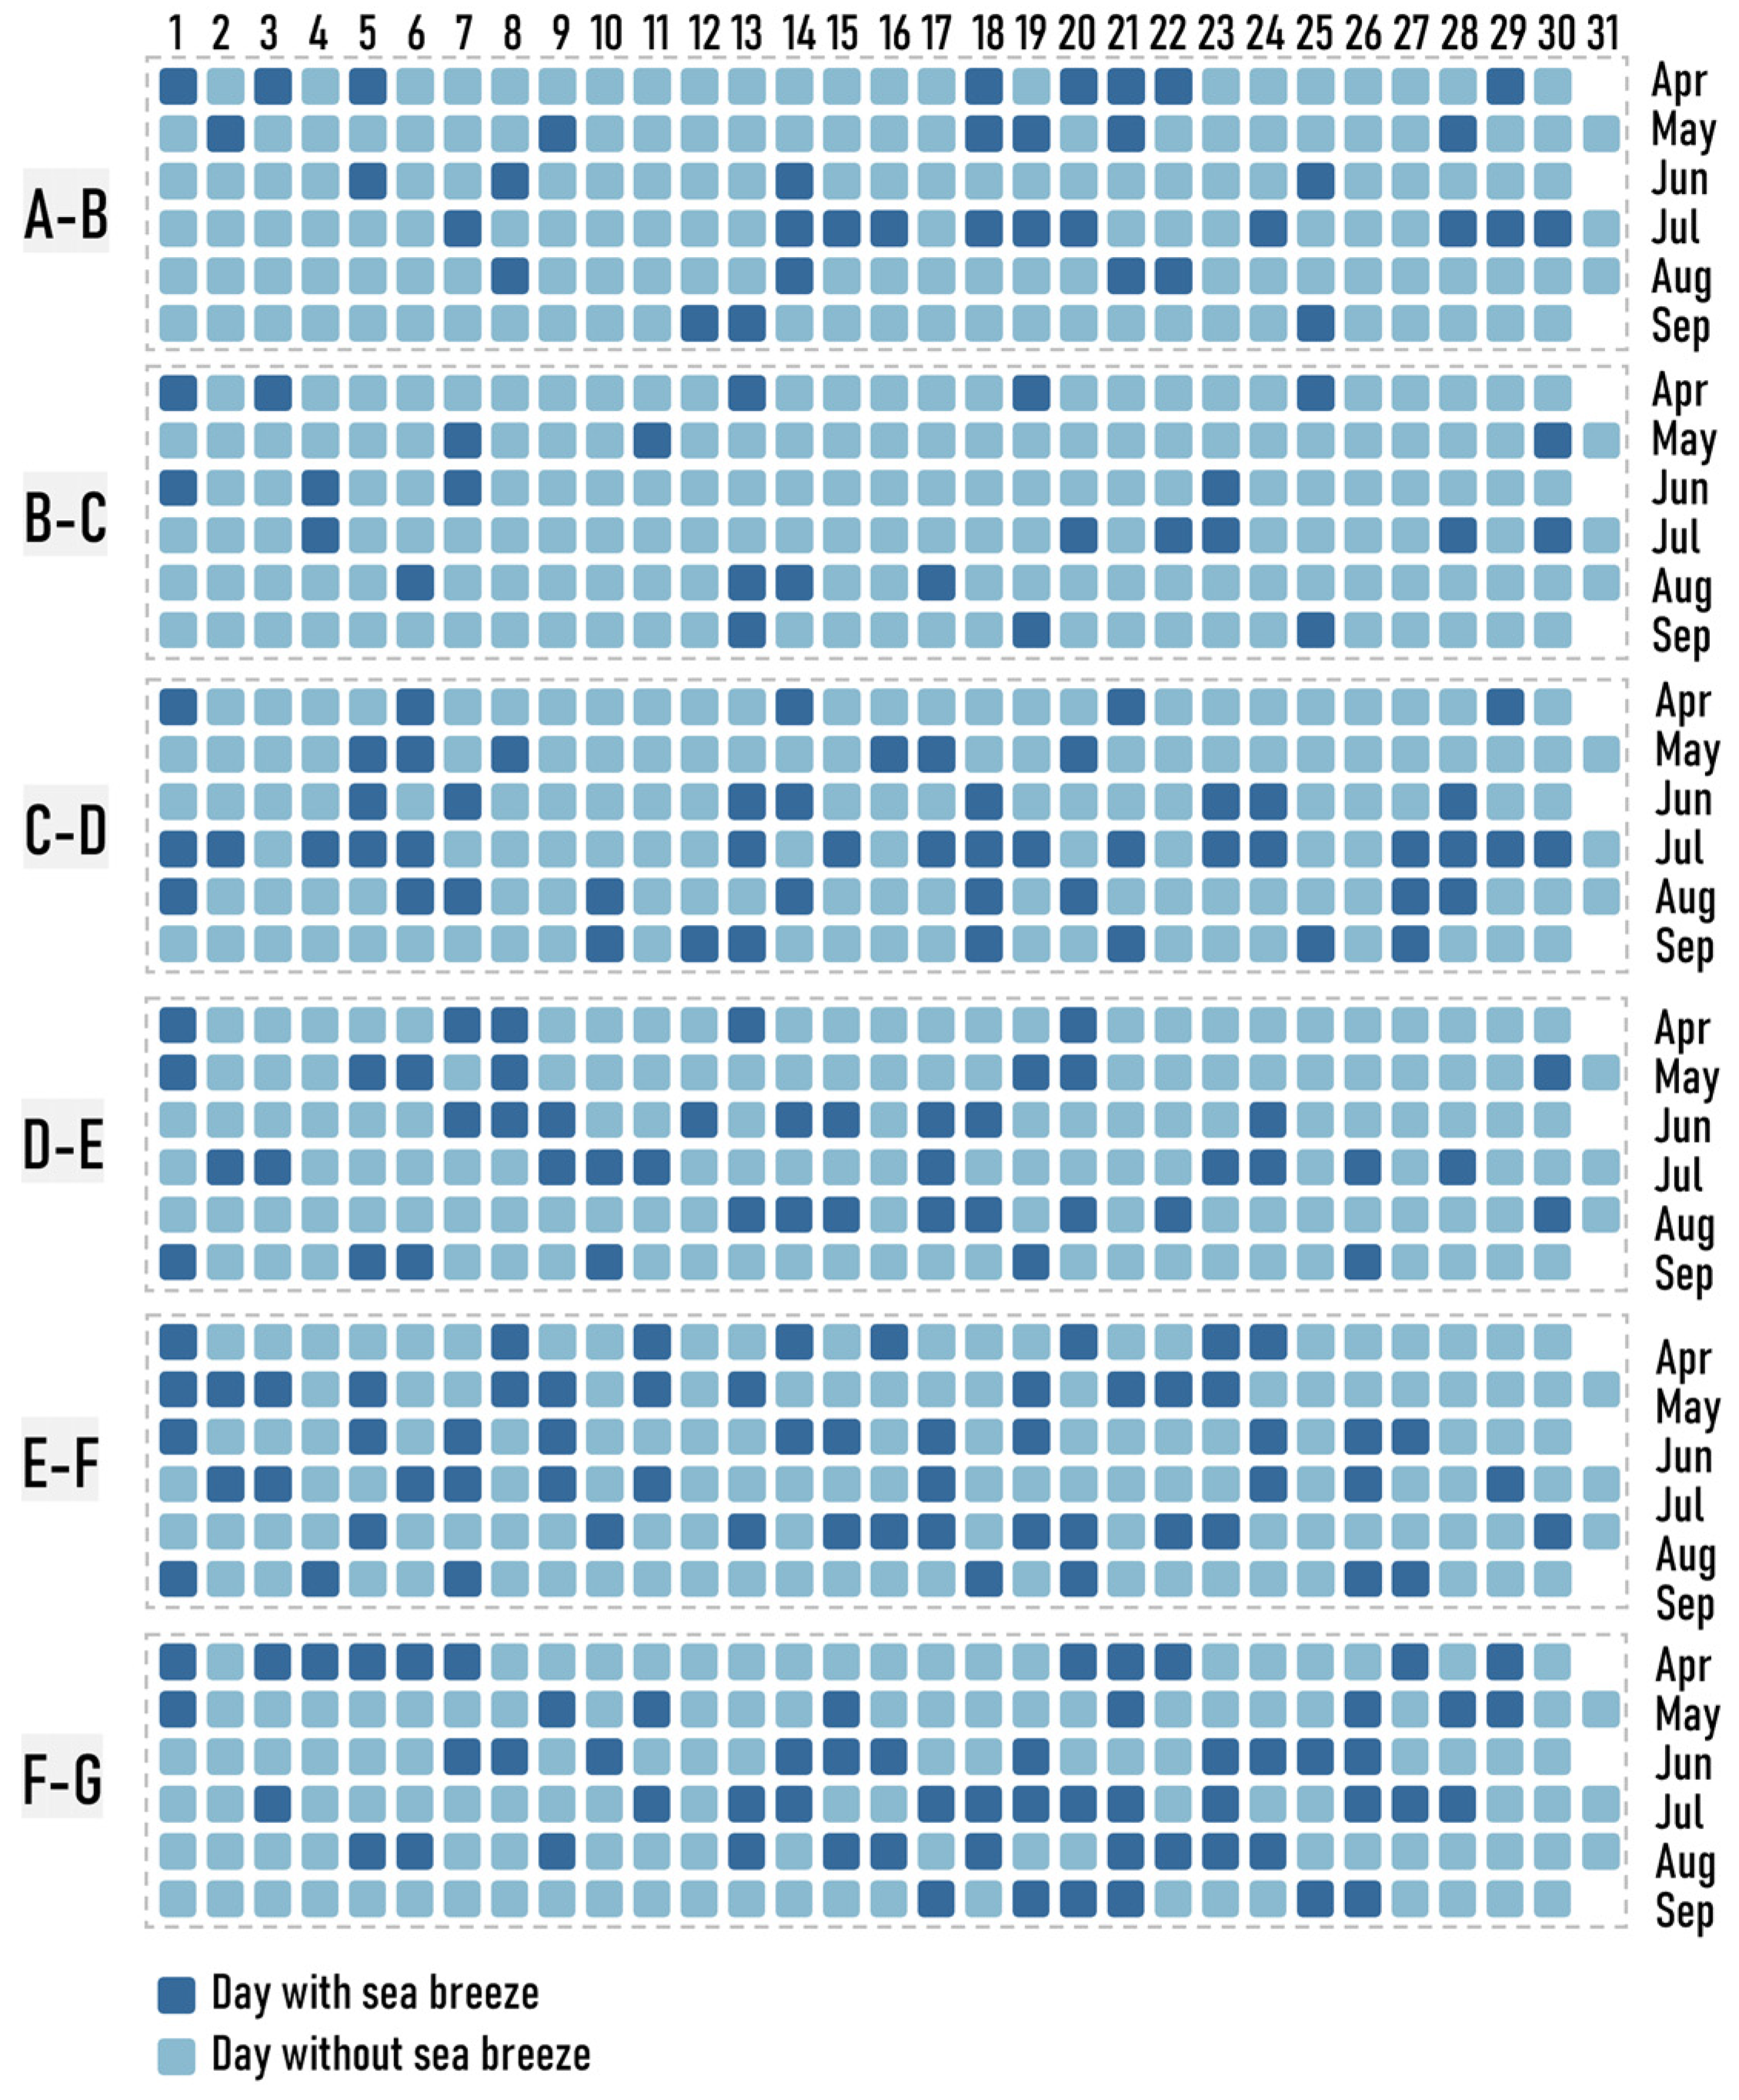
To investigate the influence of sea breeze circulation on ship emissions, it is critical to first understand how to effectively identify the sea breeze. Previous studies have proposed four prime criteria: large-scale background wind field, temperature difference between the land and sea, near-surface wind direction, and wind speed [66,67,68,69,70,71]. In this study, the following methods were adopted for the identification of sea breeze based on the above four indicators and the location of the study area: (1) after sunrise and before sunset, there is a continuous onshore wind of more than 3 h; (2) after sunrise, the sudden change in wind direction is greater than 40°; (3) the difference between the daily maximum air temperature over land and sea surface temperature is at least 3 °C; (4) the wind at the 850 hPa pressure level blows offshore during the daytime; (5) there is no precipitation prior to the onset of the sea breeze, and then, the temperature decreases and the relative humidity increases significantly after the initiation of the sea breeze. The first and second criteria, which are considered the most important, were used to ensure that the wind was turning from offshore to onshore at the onset of the sea breeze. The third criterion was used to ensure that the physical mechanism driving the sea breeze was active. The fourth criterion was used to exclude onshore wind that was caused by synoptic forcing. The fifth criterion denotes supplemental features for finding the sea breeze. Based on the above criteria for identifying days with a sea breeze, the data set of days with a sea breeze in the Bohai Rim region was established by the results of the meteorological simulation of each section of the coastline area (Figure 4).

3. Results

In this study, the impacts of shipping on PM2.5 were estimated based on modeling results from two scenarios, i.e., with and without ship emissions. In the following sections, we discuss the contribution of ship emissions to the concentration of PM2.5 in coastal cities of the Bohai Rim region, the difference in contribution under the onshore and non-offshore wind, and the influence of sea breeze circulation.

3.1. Contribution of Ship Emissions to Concentration of PM2.5

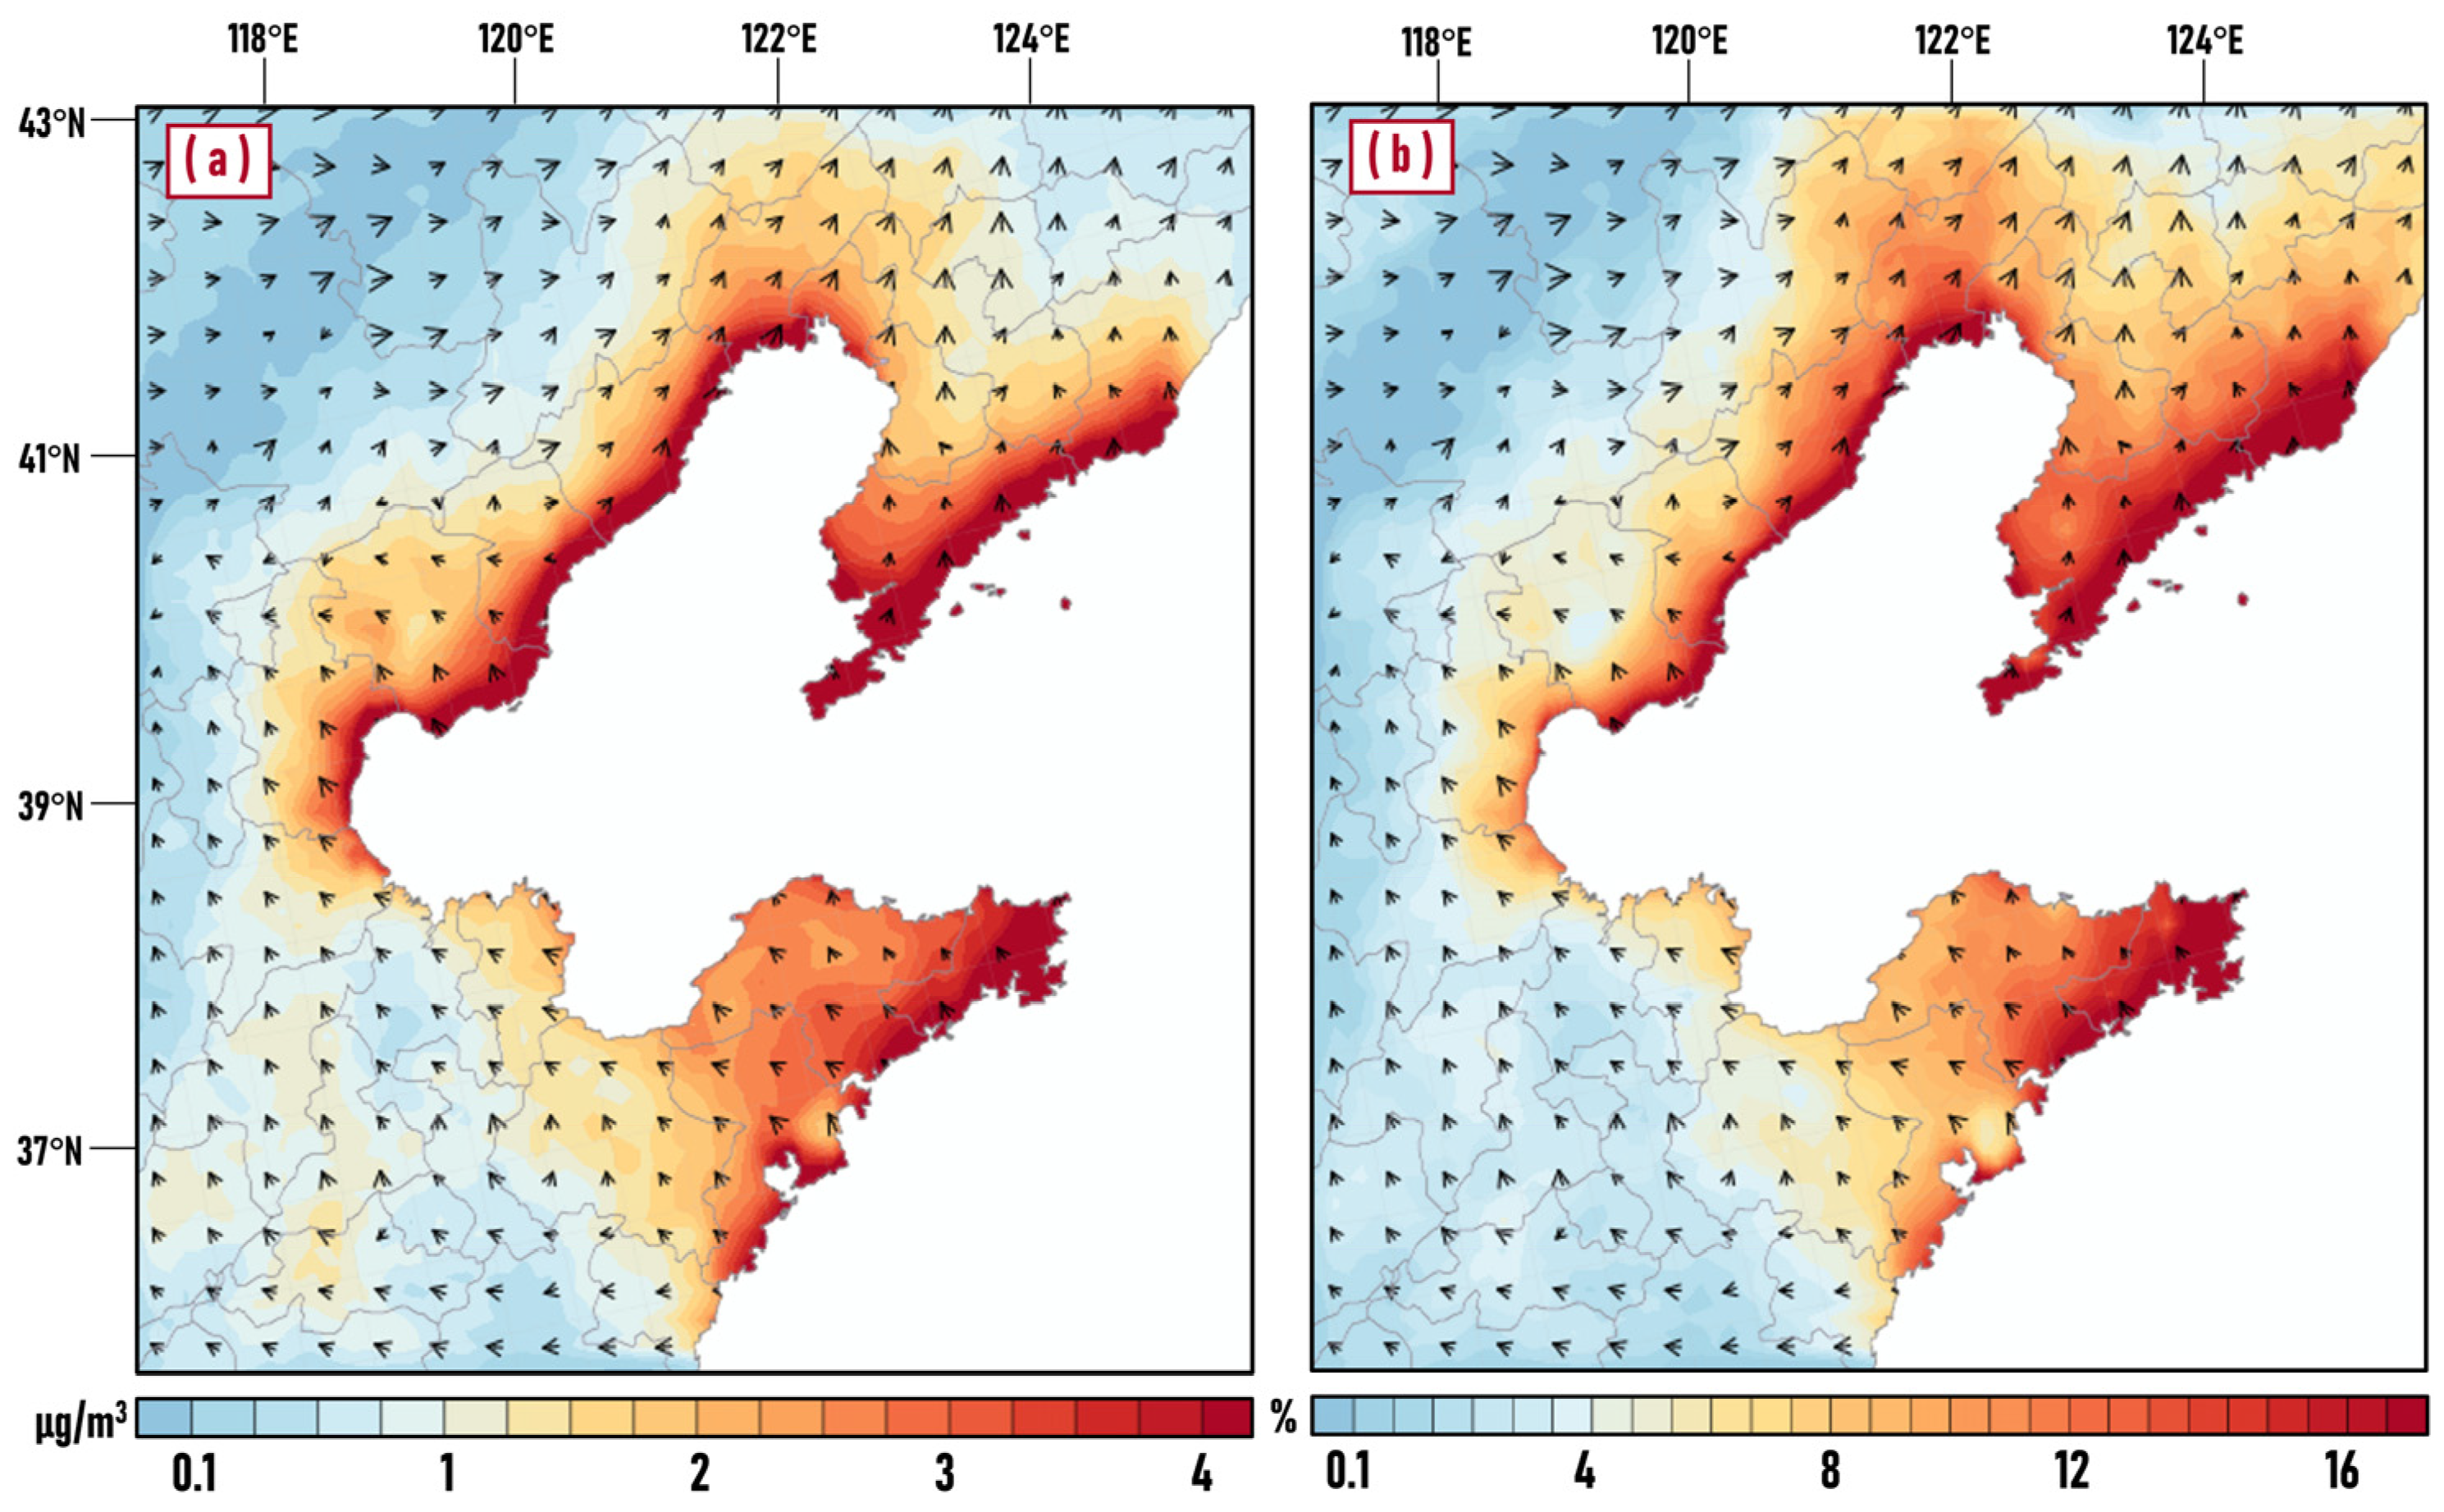
Figure 5a,b respectively show the average concentration of PM2.5 due to ship emissions in micrograms per cubic meter (with ship-no ship) and as a percentage ((with ship-no ship) × 100%/(with ship)) in summer over the Bohai Rim region. Through the analysis of the simulation results, we found that: (1) Ship emissions caused an evident increase in PM2.5, with an average contribution of 1.13 μg/m3 (~6.5%) over the land area in the study area. (2) The increase in ship emissions was mainly concentrated near the coastline, especially in coastal cities where ports were located, with a contribution value of up to 6.53 μg/m3. (3) The peninsula was more significantly affected by ship emissions than the other areas in the Bohai Rim region. As can be seen from the figure, the eastern Jiaodong Peninsula and the southern Liaodong Peninsula were more significantly influenced by ship emissions, with an average contribution of more than 2 μg/m3 (~9%). This could be attributed to its being closer to the area with high-intensity ship emissions (main channel, as shown in Figure 2) and the accumulation of pollutants caused by both sides of the peninsula is affected by ships. (4) With the increase in distance from the coastline, the contribution of ship emissions to PM2.5 concentration gradually decreased, with different decay degrees in each region. At the Jiaodong Peninsula, the value of the contribution at a distance of 50 km from the coastline was still in the range of 2~3 μg/m3, but it had dropped to about 1 μg/m3 at the Liaodong Peninsula, which may be related to the dominant wind direction and sea breeze circulation.

3.2. The Reinforcing Effect of Onshore Wind on the Transport of Ship Emissions

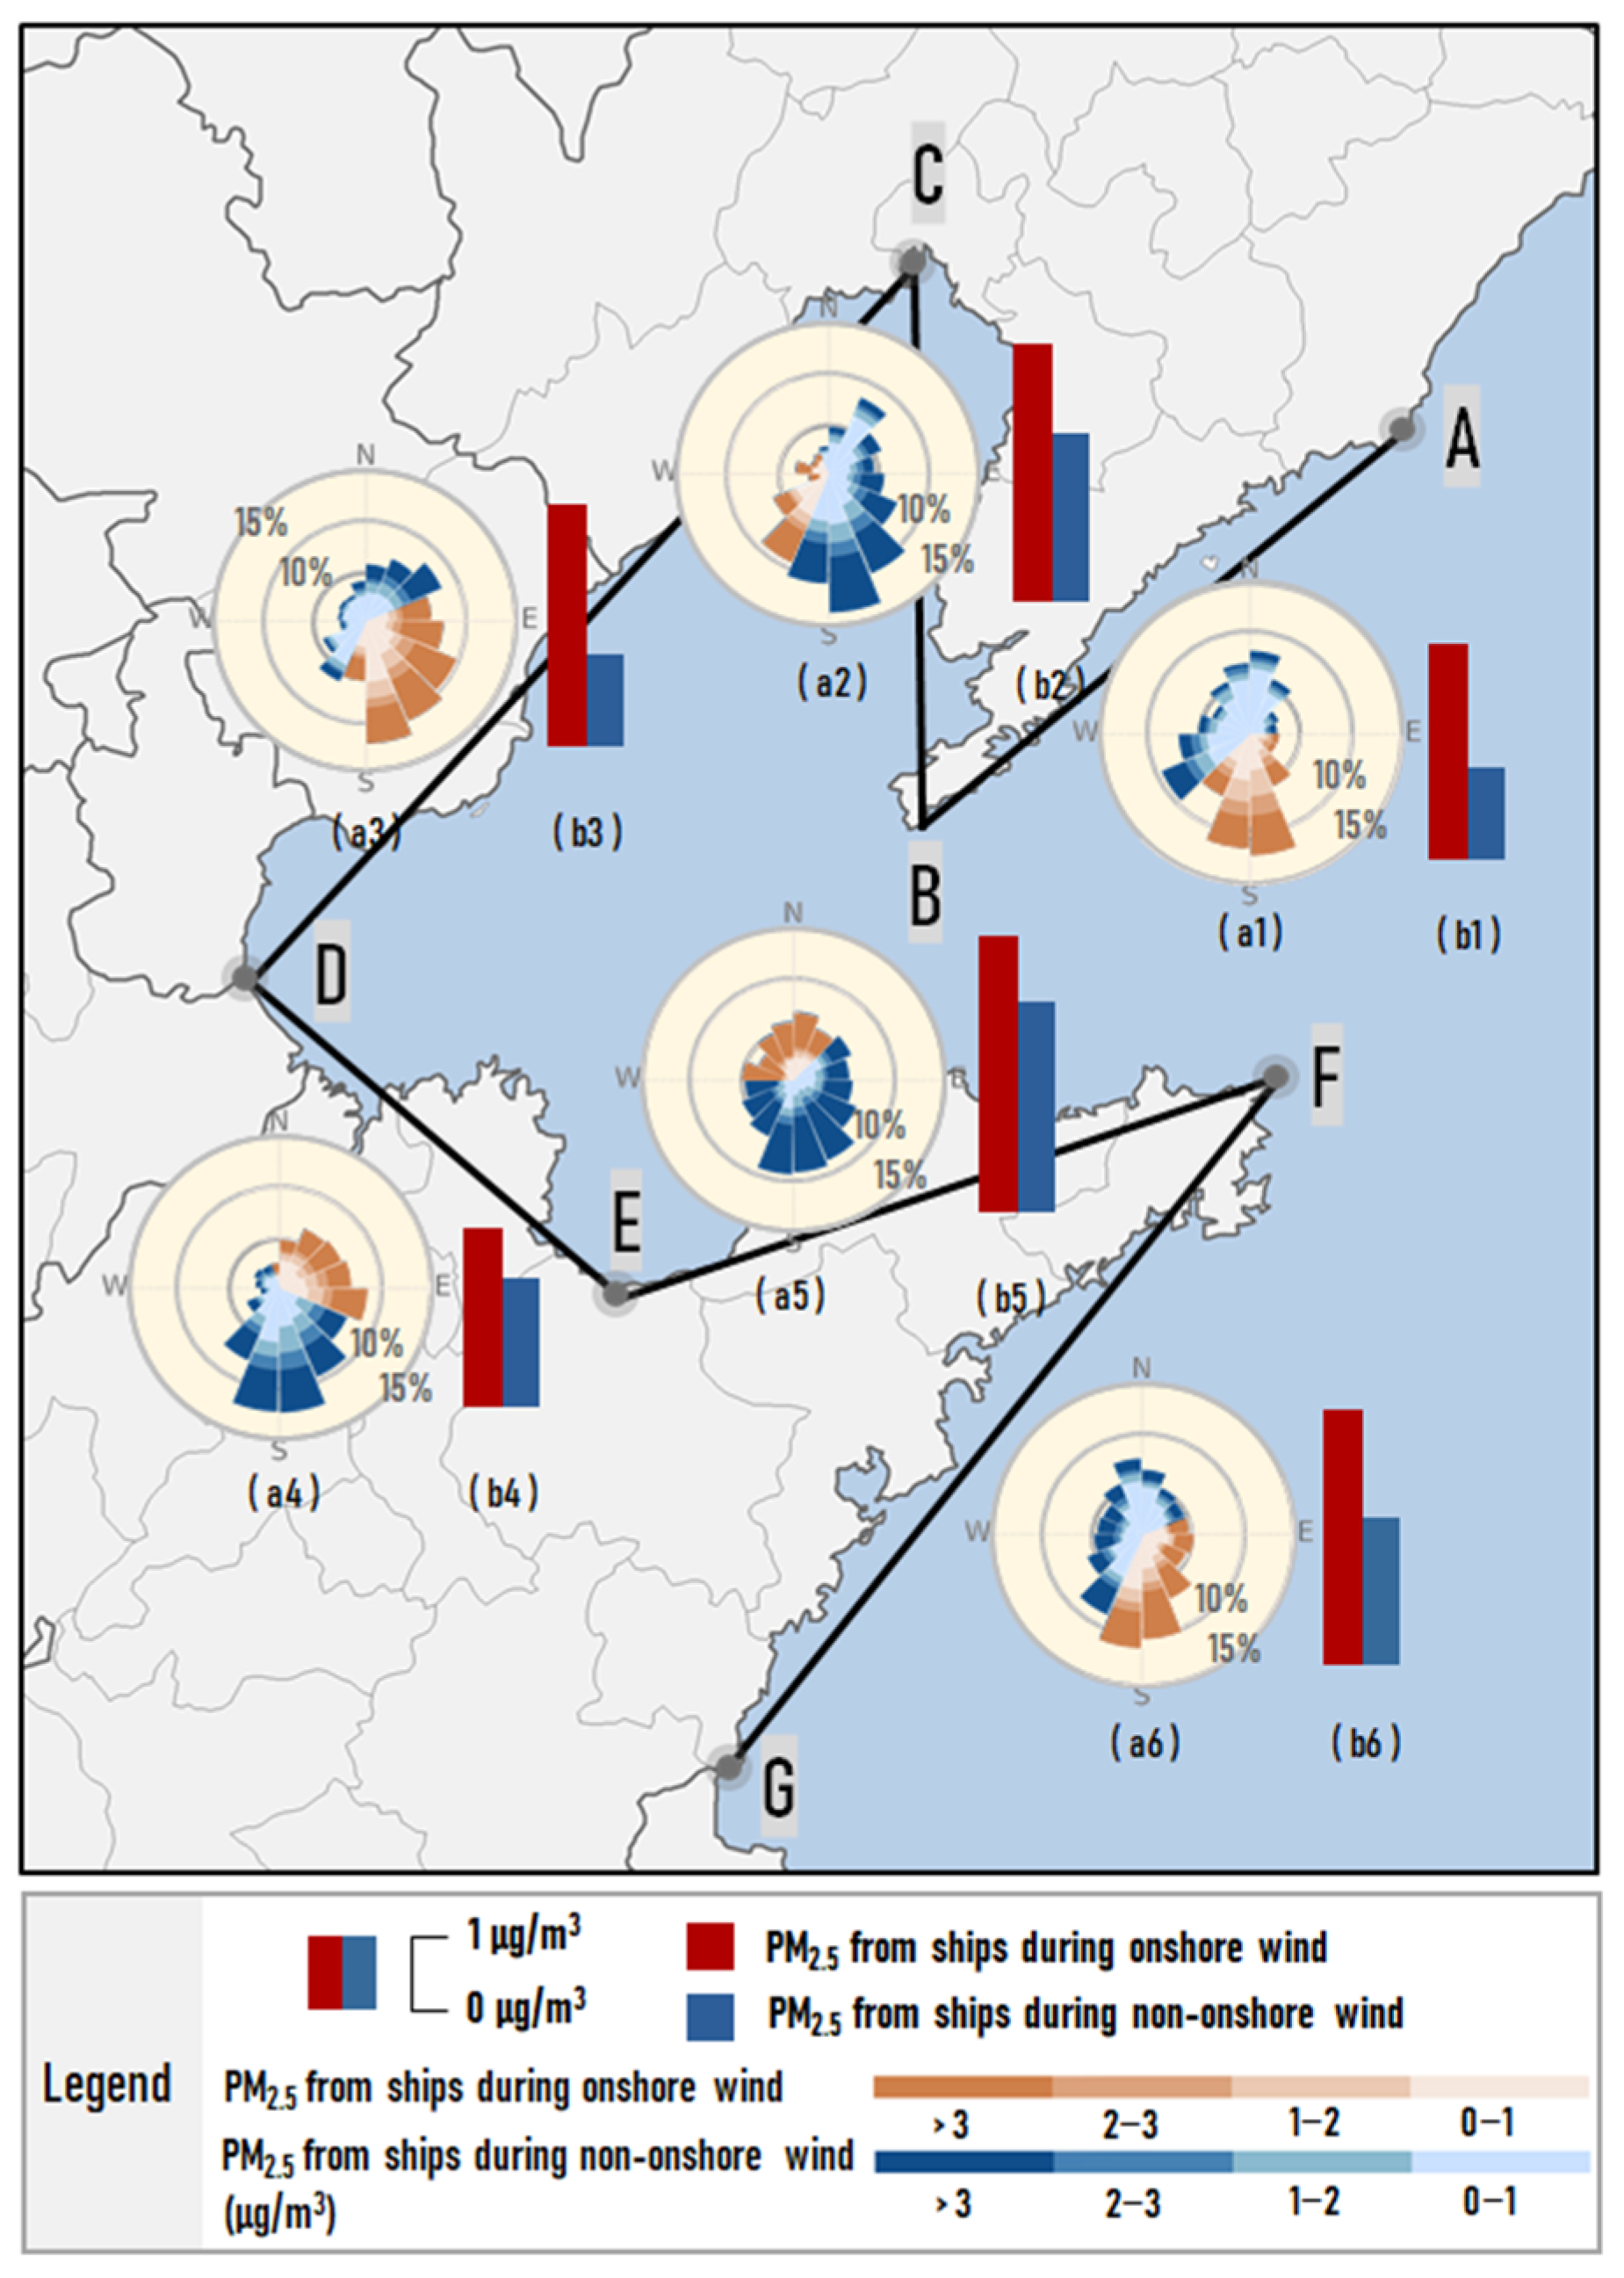
In this section, based on the identification of onshore wind discussed in Section 2.4, the hourly wind direction of each section around the Bohai Rim region and the corresponding average PM2.5 concentration contributed by ships in the land area at 10 km from the coastline were calculated and classified, as shown in Figure 6. It can be seen that the concentration of PM2.5 due to ship emissions in the context of onshore wind was significantly higher than that with the non-onshore wind. The concentration of PM2.5 due to ship emissions in all regions was 3.17 μg/m3 during onshore wind, while it was only 1.87 μg/m3 with the non-onshore wind.
It was found that the contribution of ships during non-onshore wind was significantly lower than that during onshore wind, but it still has a degree of contribution to the PM2.5 in the coastal region. This can be explained by the following reasons. As the direction of the local wind is constantly switching, and during the switching from onshore to non-onshore wind, the pollutants that have been transported to the land area by the onshore wind have not yet been carried back to sea by the non-onshore wind, resulting in the ship contribution value not significantly reducing even if the wind is non-onshore at that moment. Consequently, we were unable to completely distinguish these wind transition moments in our statistics, as some areas still had ship contribution values during the non-onshore wind.
By comparing the differences in ship emissions among six sections, it was found that they were more evident in sections A-B, C-D, and F-G, with 1.41 to 2.03 μg/m3, while the others were only 0.65 to 1.2 μg/m3. Figure 6(a1–a6) shows that the frequency of onshore wind in these regions was relatively high, ranging from 37% to 52%. Once emitted, pollutants from ships were transported to land-based areas by frequent onshore wind, resulting in significantly higher ship contributions in these areas during onshore wind hours than during non-onshore wind hours. While in section E-F, not only the high contribution from ships during onshore wind but also at a high level during the non-onshore wind. This is primarily due to this region being in the peninsula region, which may coincide with the onshore flows in section F-G when section E-F is in the non-onshore flow period, making the pollutants emitted from the Qingdao and Rizhao ports (whose total cargo throughputs are in the top 10 in China [38]), which are located to the southeast, vulnerable to the influence of such flows across the peninsula to section E-F. Therefore, the ship contribution values were higher than 3 μg/m3 for 90% of the moments in the east-south wind hours, resulting in their higher ship contribution values in the non-onshore wind hours.
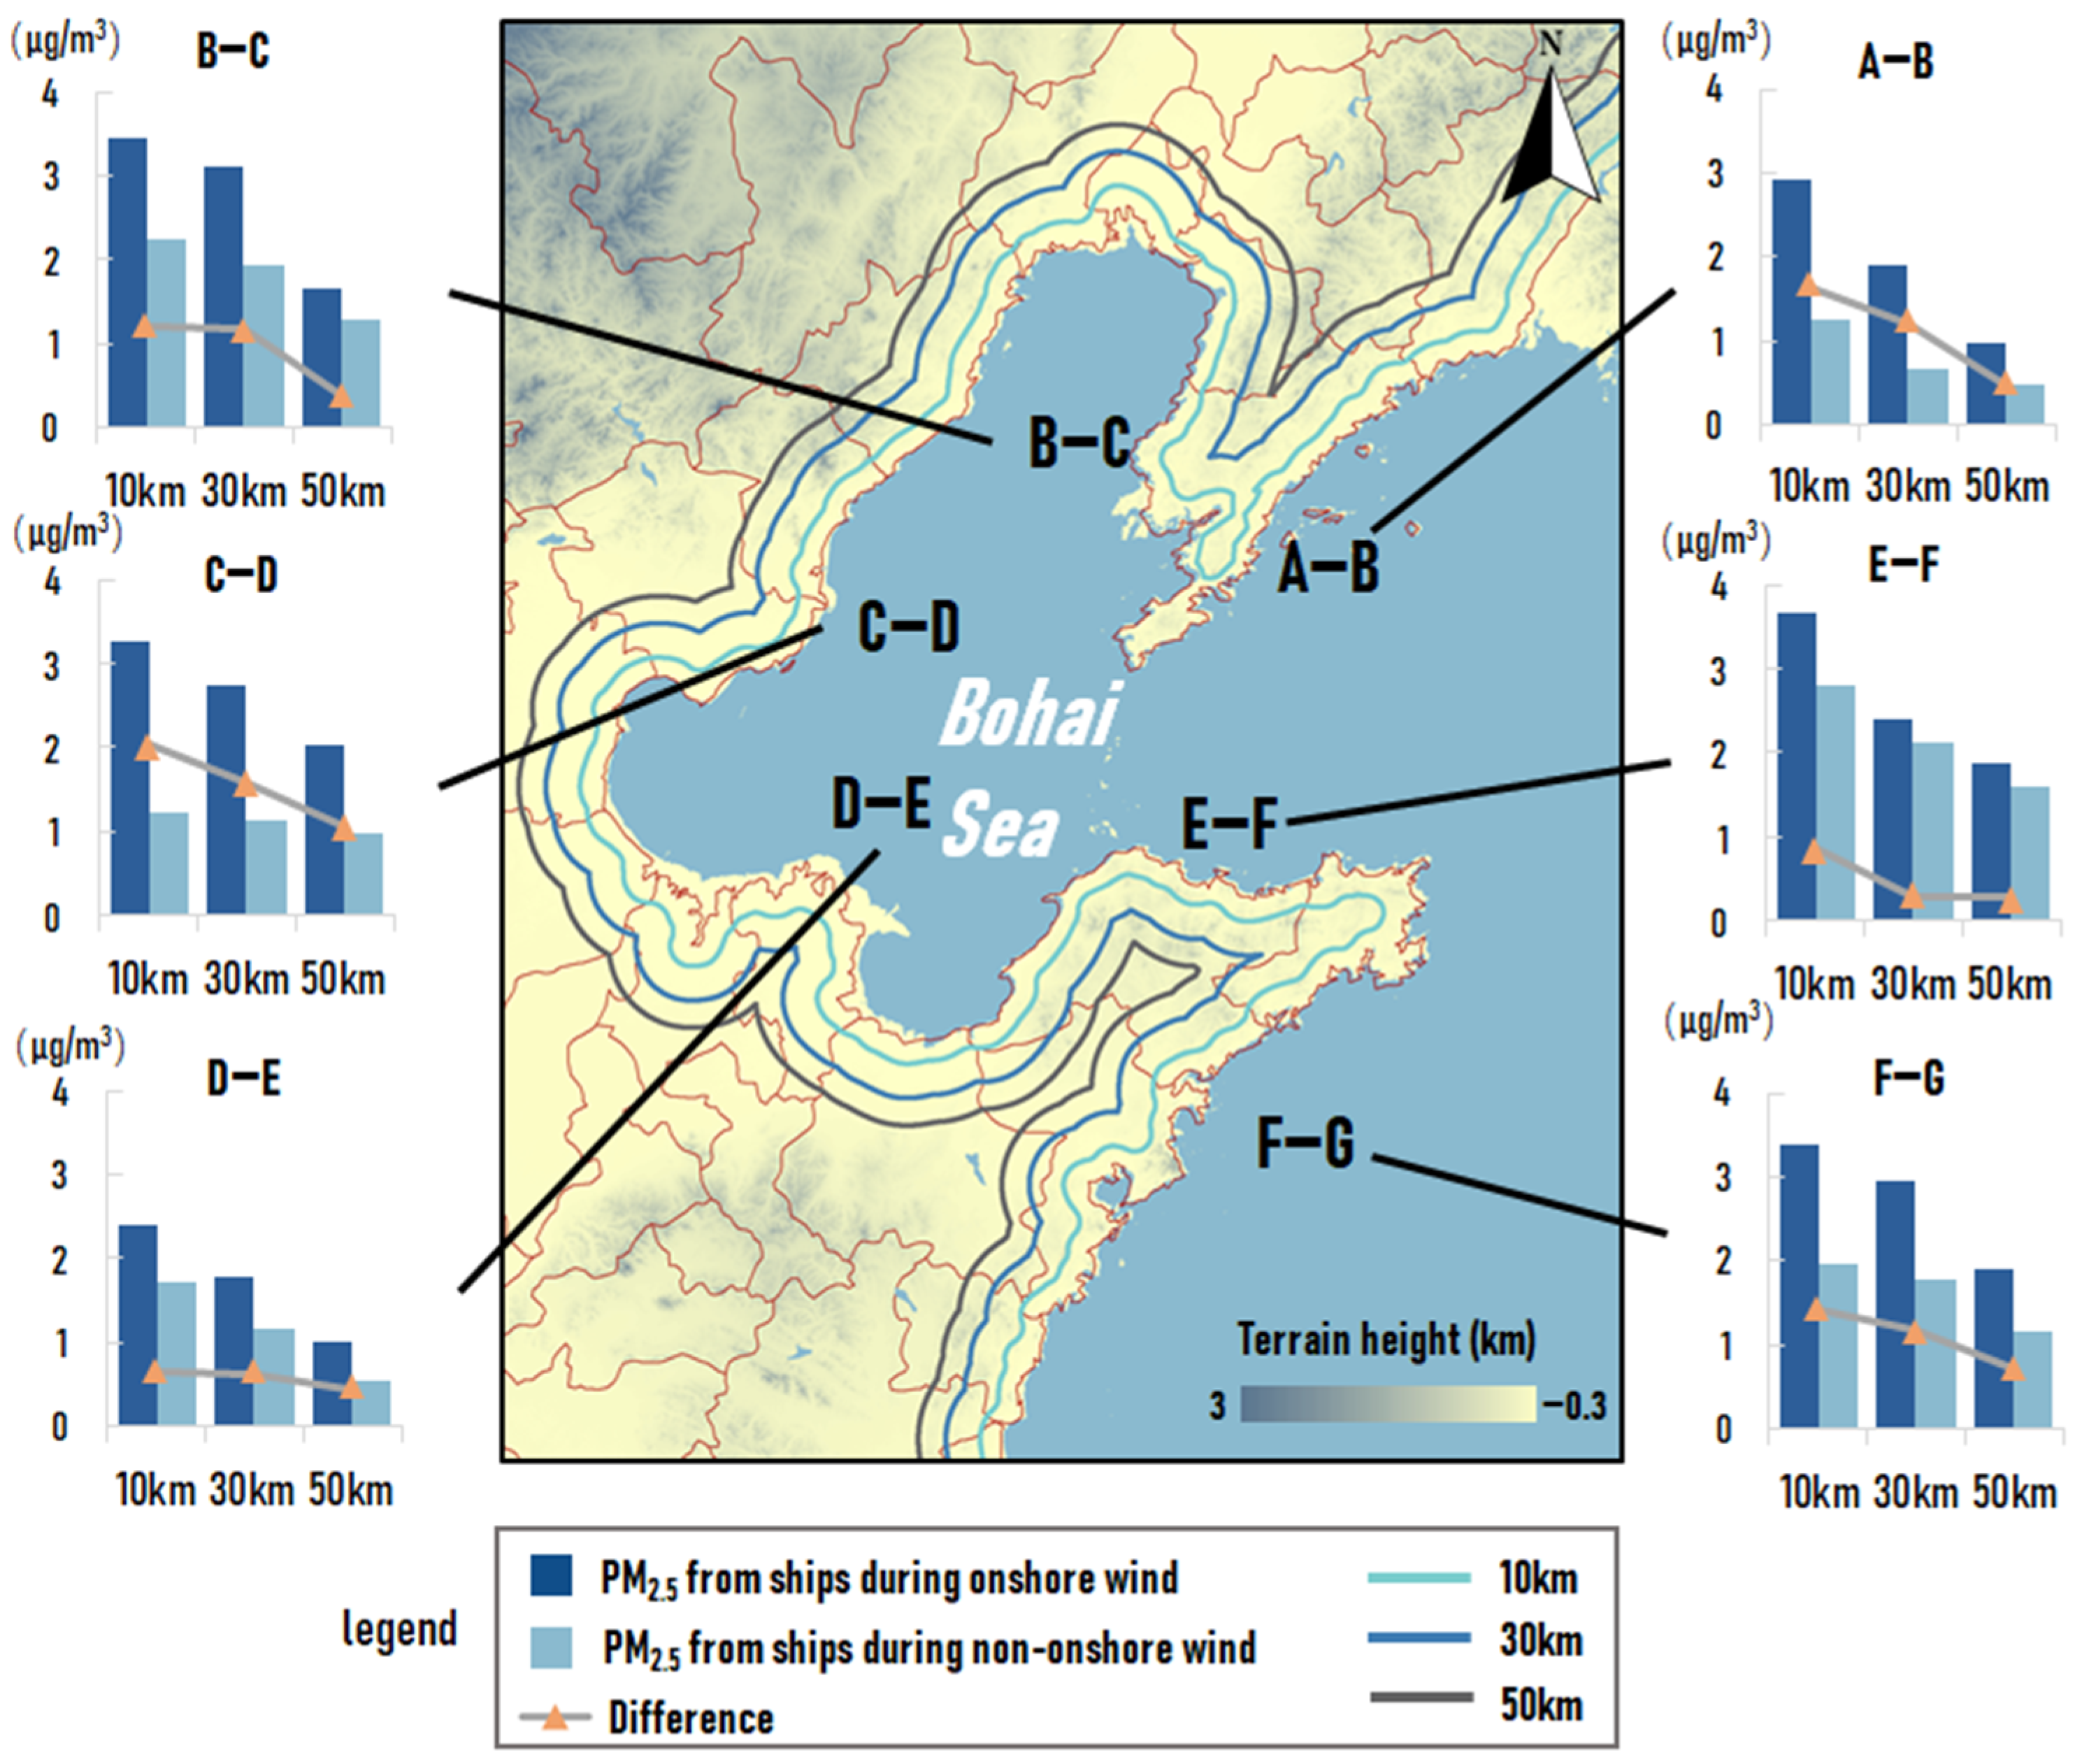
In order to further analyze the impact range of onshore wind on the transport of ship emissions (the impact on the penetration of ship emissions), the concentration of PM2.5 due to ship emissions in the land area at 10 km, 30 km, and 50 km from the coastline during onshore wind and non-onshore wind were calculated, as shown in Figure 7.
The contribution of ships at different distances from the coastline with the onshore wind was higher than that during the non-onshore wind period, and the average difference in values of contribution between the two cases became lower with increasing distance from the coastline. This means that the ship’s contribution values were less affected by onshore wind in the further inland areas from the coastline. The difference in the average contribution value at 10 km from the coastline was 1.3 μg/m3, with a value of 1.7 and 2.44 times as high as that at 30 km and 50 km from the coastline. A similar situation found in section A-B was significant, with the difference in contribution at 10 km from the coastline being 1.37 and 3.43 times as high as at 30 km and 50 km, respectively. The wind vectors in Figure 5 showed that the average wind speed in the region was low, which was not favorable for onshore wind to penetrate the ship emissions. On this basis, the more deeply inland region was more susceptible to emissions from ships on the opposite shore, which led to a larger decrease in the difference in its contribution. However, the difference in ship emissions in section D-E did not show a clear trend of decreasing with increasing distance, which may be related to the relatively flat topography of the region.
These results were basically in the same scope as the results in a previous study in Shanghai by Liu et al. [17], where the average contribution of ship emissions during onshore wind in most coastal urban regions reached 3–7 μg/m3. The difference between this study and Liu et al. [17] may result from two aspects: one is the difference between the geography of the Bohai Rim region and Shanghai, and the other is that the time span in Liu et al. [17] is relatively shorter, whereas, in this paper, six months of simulation results are selected for analysis. Therefore, a longer simulation period may reduce the uncertainty of the results to some extent.

3.3. Impact of Sea Breeze on the Transport of Ship Emissions

As shown in Figure 2, there is a dense distribution of ship emissions along the coastline of the Bohai Rim region, and the sea breeze circulation may cause the recirculation and accumulation of pollutants and favors the production of secondary pollutants, increasing the concentration of pollutants during days with a sea breeze.
Based on the data set of days with a sea breeze established in Section 2.5, the entire study period was divided into days with a sea breeze and days without a sea breeze, and the average contribution from ships in days with a sea breeze and days without a sea breeze was calculated based on the respective simulation results. The time period for averaging was set as 12:00 noon to 0:00 midnight daily.
As shown in Figure 8, an evident increase can be found in the contribution of ship emissions to PM2.5 concentrations in the land areas during days with a sea breeze compared to days without a sea breeze in each section of the study area. Among them, the values of ships’ contribution values in section C-D were more significantly influenced by the sea breeze circulation. On days with a sea breeze, the values of ships’ contribution were still more than 2 μg/m3 in some land areas at 100 km from the coastline, while on days without a sea breeze, the contribution of ships was only concentrated near the coastline.
Since coastal zones were more affected by sea breeze circulation than inland areas, we selected 15 cities along the coastline of the Bohai Rim region to investigate the disparities in ship emissions between days with a sea breeze and days without a sea breeze. Figure 9a shows the spatial distribution of the differences in ship contribution values for coastal cities, and Figure 9b shows the ship contribution values and the differences between them on days with a sea breeze and days without a sea breeze in 15 cities. Among them, Panjin, Yingkou, Dalian, Weihai, Yantai, and Qingdao are located in the peninsula region and are influenced by the sea breeze circulation on both coasts; thus, the differences on both coasts are averaged in this paper.
The contribution of ship emissions was significantly higher on days with a sea breeze than days without a sea breeze in coastal cities. On days with a sea breeze, the average contribution in 15 coastal cities was 2.94 μg/m3, 2.4 times higher than on days without a sea breeze. The Jiaodong Peninsula (sections E-F and F-G) was most significantly affected by the sea breeze, followed by section C-D and Liaodong Peninsula (sections A-B and B-C), and section D-E was the least. Among the coastal cities that were more significantly affected by the sea breeze circulation, Dalian and Weihai, which are located in the peninsula region and surrounded by the sea on three sides, were the most affected by the sea breeze circulation, and the differences in values of contribution are 2.65 μg/m3 and 3.05 μg/m3, respectively. The five coastal cities in section C-D were also strongly affected by the sea breeze, and the differences in the contribution values were all around 2 μg/m3 and decreased from the northern part to the southern part. On days without a sea breeze, the dominant wind direction was more perpendicular to the coastline from north to south in order. Under the influence of such a wind field, ship emissions from the southern coastal regions were more favorable to inland transport, resulting in a lower difference in contribution values than those in the north during days with a sea breeze.
However, the concentration of PM2.5 due to ship emissions in section D-E was less influenced by the sea breeze circulation, with the difference in contributions reaching 0.97 μg/m3 only in Dongying. The other cities were less affected by the sea breeze circulation, with the difference being below 0.4 μg/m3. The frequency of sea breeze in this region was low, which was not conducive to the recirculation of pollutants emitted from ships. Nevertheless, the Liaodong Peninsula, for which sea breeze circulation occurred less frequently, was affected by sea breeze circulation more significantly than section D-E.
The shape of the coastline around the Bohai Rim region helps to explain this phenomenon, which has a significant impact on the sea breeze [72,73,74]. The coastline of Liaodong Peninsula is shaped convexly, and the low-level onshore flows on both sides of the convex coastline tended to form a convergence that strengthened the sea breeze, which increased the transportation capacity of pollutants to the shore. However, the coastline of section D-E is concave in general, which makes the low-level onshore flows favorable to divergence, thereby weakening the sea breeze circulation, resulting in the ship emissions in this region being influenced by the sea breeze circulation even less than the Liaodong Peninsula where the frequency of sea breeze was lower.
Through this finding, we further probe the pattern of ships’ contributions in the peninsula region influenced by the sea breeze circulation. The Jiaodong Peninsula at lower latitudes was more significantly affected by sea breeze than the Liaodong Peninsula at higher latitudes. A systematic review of global studies concerning sea breeze circulation reveals that the frequency, intensity, distance inland, and duration of sea breeze circulation are generally higher at low latitudes than at higher latitudes [21,22,23,32,75,76,77,78,79,80,81]. Consequently, the influence of sea breeze circulation on the transport of ship emissions may be more significant in lower latitudes.
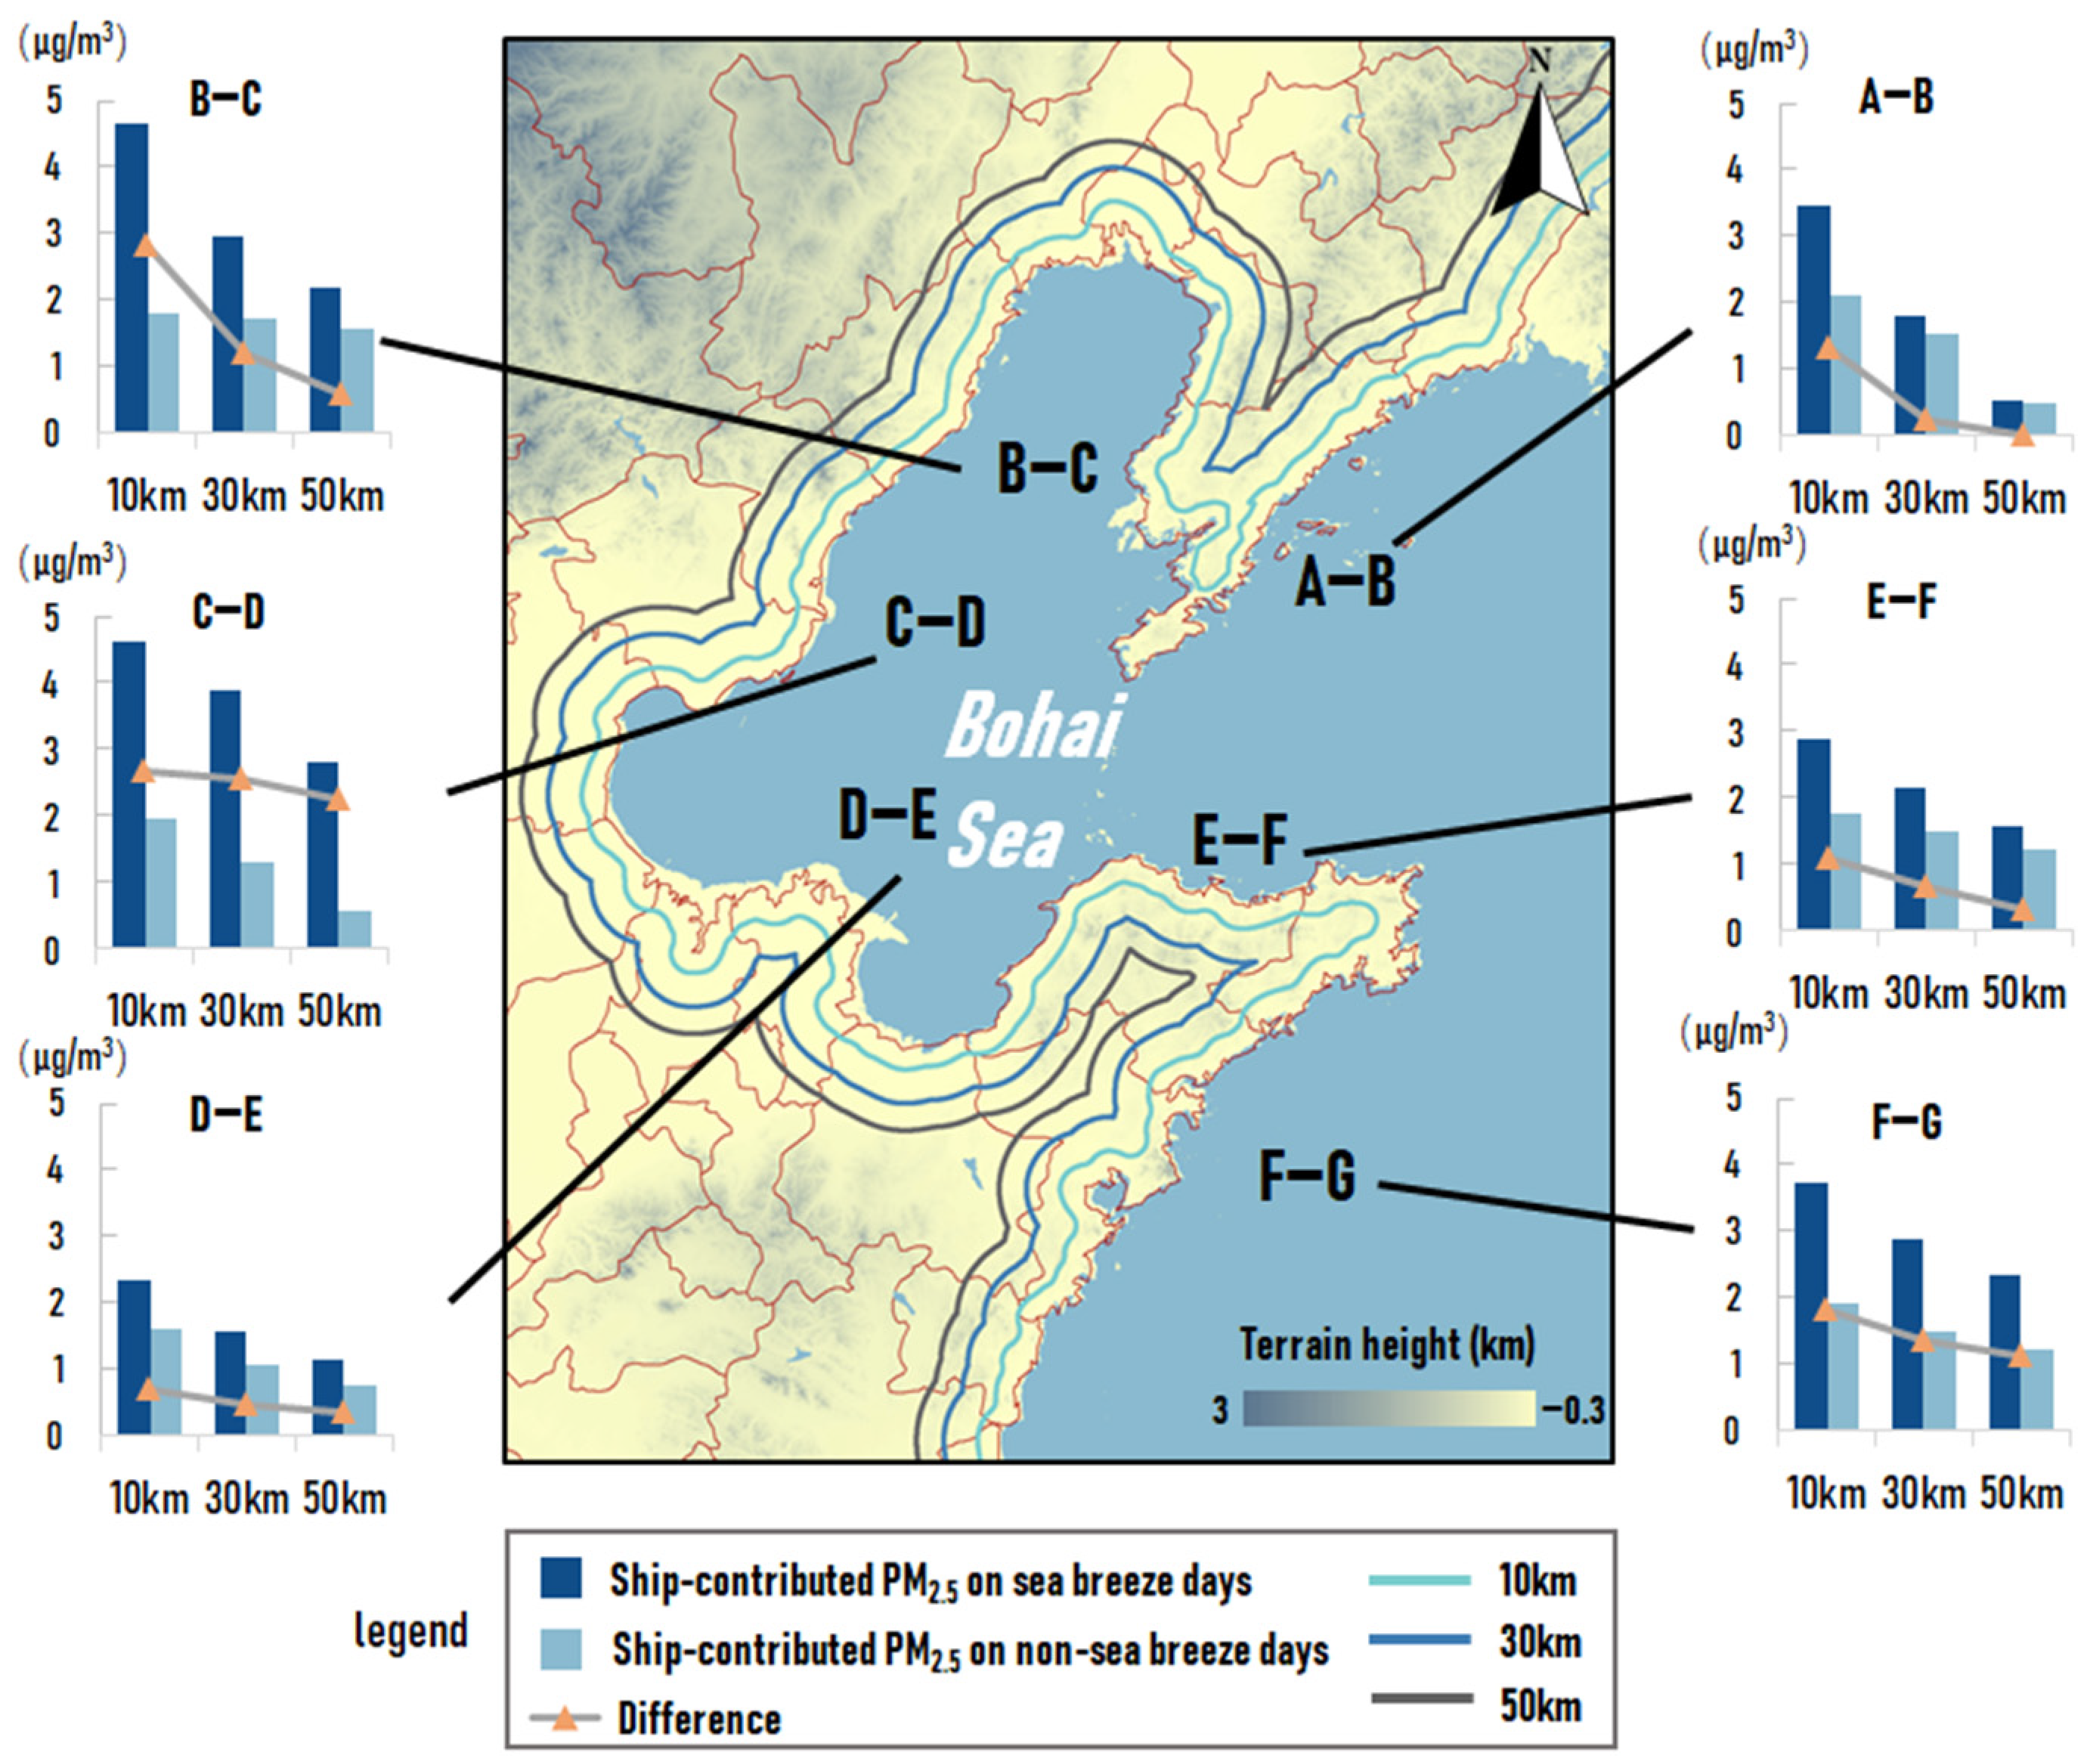
To further analyze the effect of sea breeze circulation on the penetration of ship emissions, the concentration of PM2.5 due to ship emissions at 10 km, 30 km, and 50 km from the coastline on land on days with a sea breeze and days without a sea breeze was calculated, as shown in Figure 10. On days with a sea breeze, the concentration of PM2.5 due to ship emissions at 10 km from the coastline was 3.61 μg/m3, 2.1 times higher than that at 50 km. However, on days without a sea breeze, the concentration of PM2.5 due to ship emissions at 10 km was only 1.87 μg/m3, which was 1.9 times higher than that at 50 km. The average difference of the contribution of PM2.5 due to ship emissions between days with a sea breeze and days without a sea breeze also decreased significantly with increasing distance from the coastline. The difference in contribution at 10 km from the coastline was 1.6 and 2.2 times higher than that at 30 km and 50 km from the coastline. It can be concluded that the influence of sea breeze circulation on the value of ship emissions’ contributions decreases with the increase in distance from the coastline but still has a non-negligible influence at a further 50 km inland.
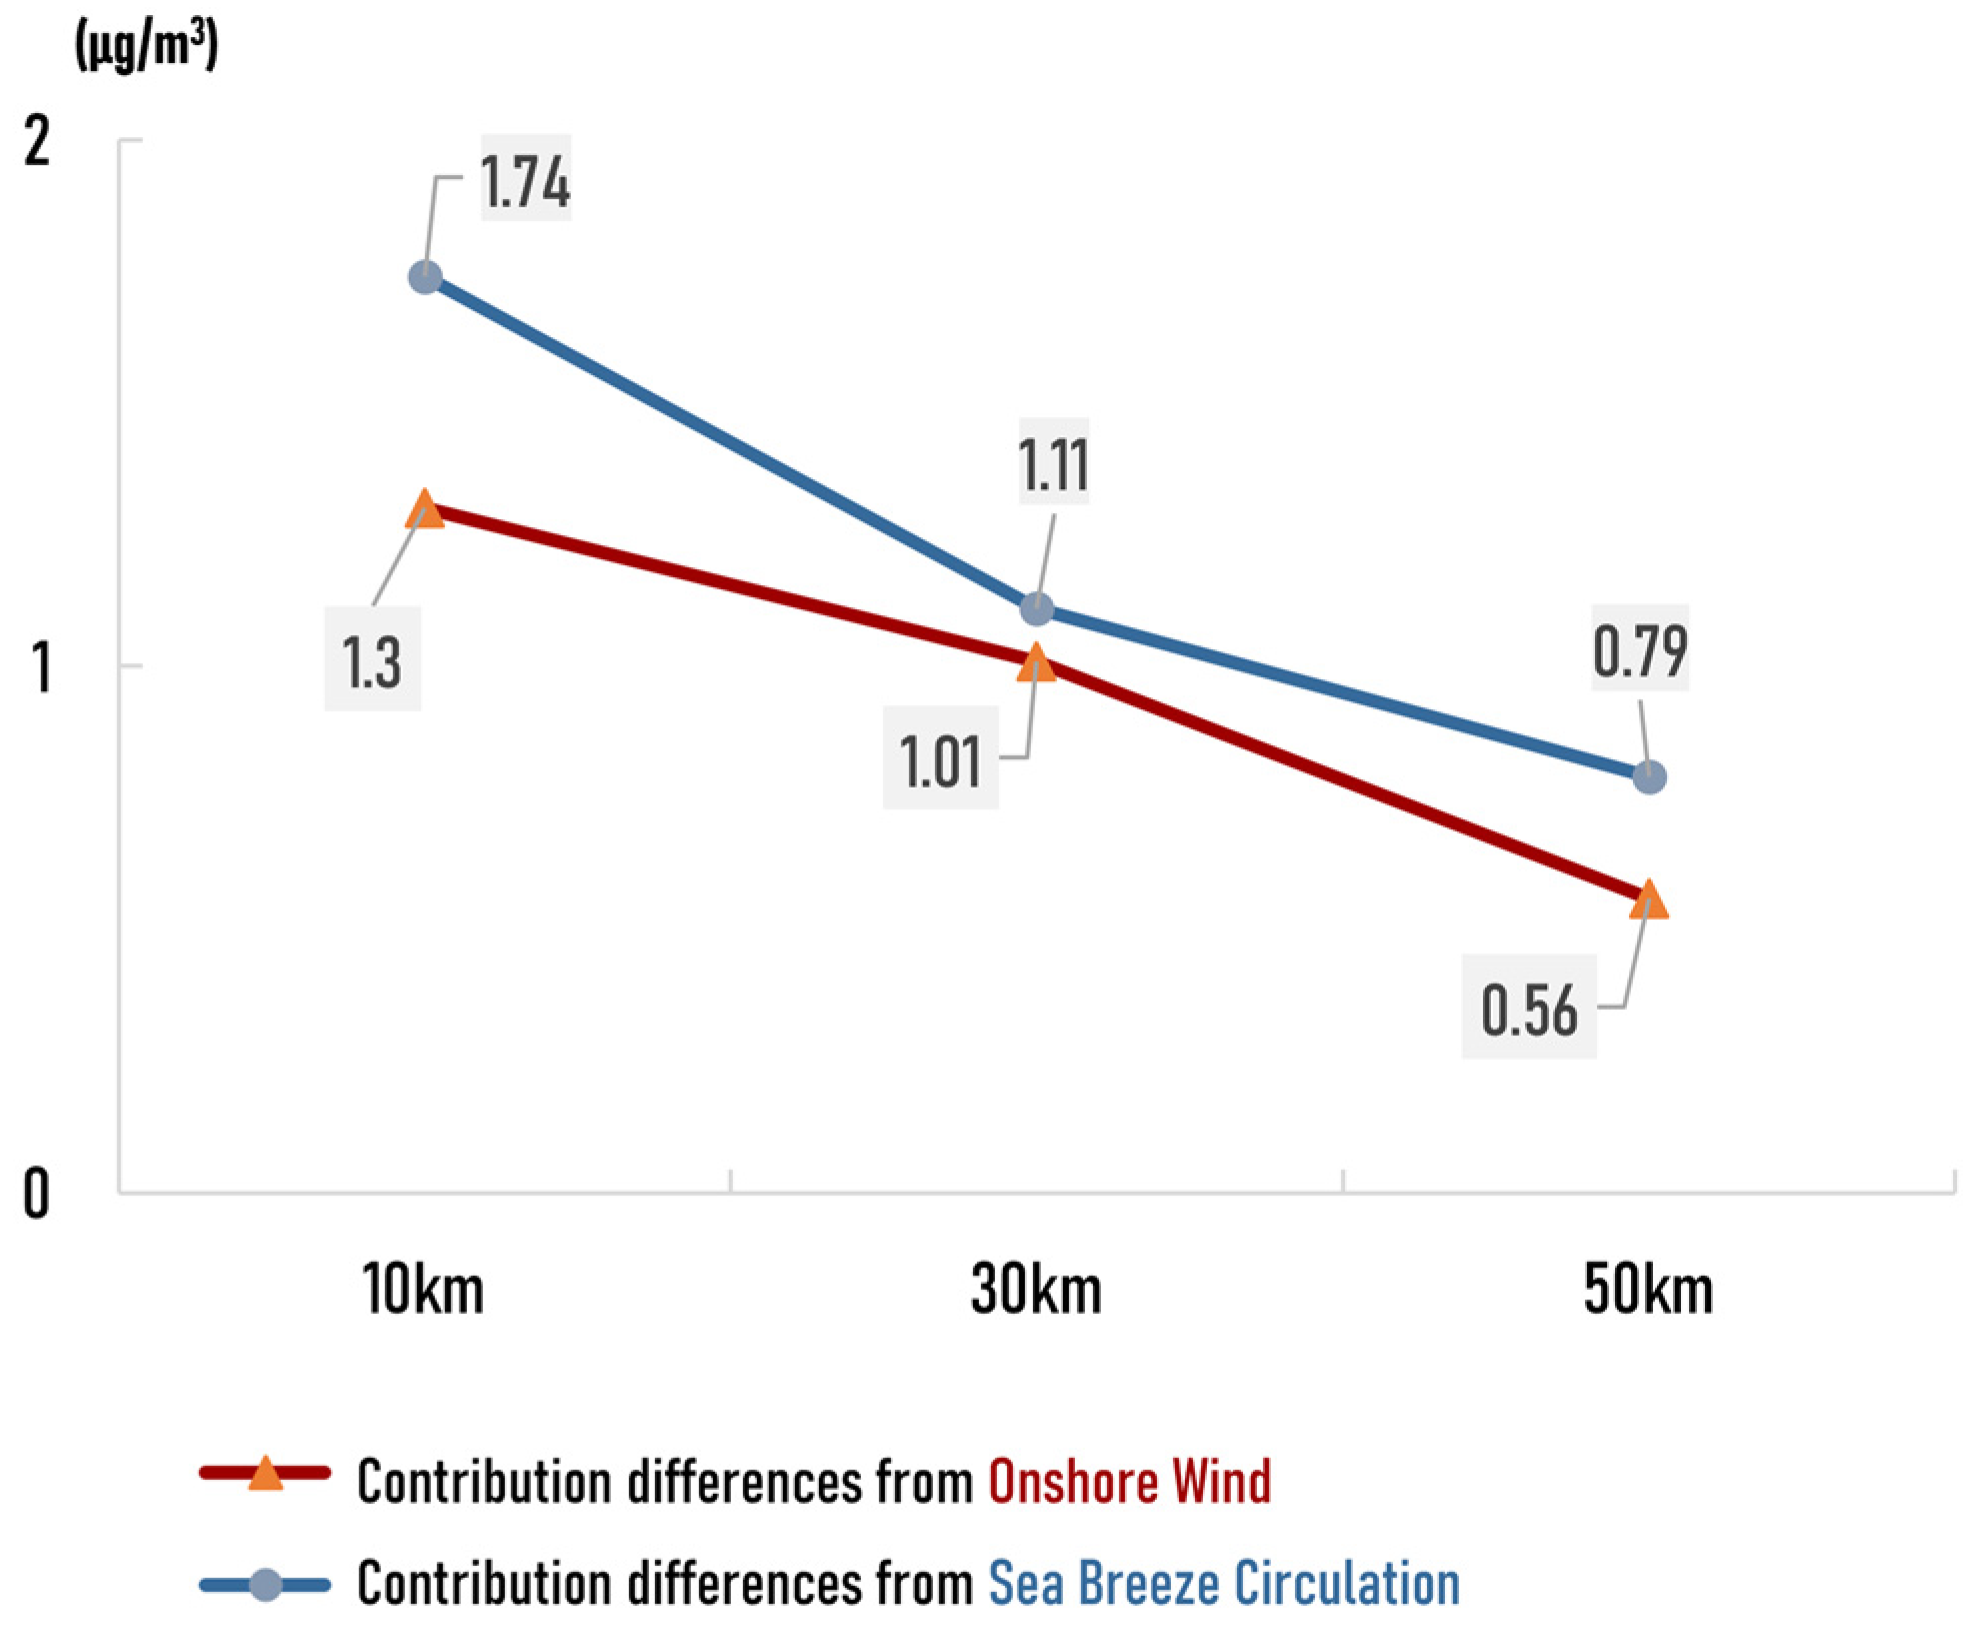
As Levy et al. [82] reported, sea breezes can cause pollutants to recirculate over the same airshed as much as three times per day, and the air pollution over coastal areas may thus be aggregated. Therefore, the effect of recirculation due to the sea breeze circulation makes the pollutants from ships accumulate, increasing the contributed concentration. As shown in Figure 11, the differences in the contribution of ship emissions under onshore versus non-offshore winds were less than those on days with a sea breeze versus days without a sea breeze at 10 km, 30 km, and 50 km from the coastline. This result confirms that the circulation of sea breeze can cause the cyclic accumulation of pollutants and thus reinforce the impact of ship emissions on coastal air quality more than simple onshore winds.

4. Conclusions

In this study, the WRF/Chem model was employed to investigate the influence of sea breeze circulation on the transport of PM2.5 emitted by ships from April to September 2014 in the Bohai Rim region, China. The results indicate that ship emissions caused an evident increase in PM2.5, with a simulated average ship contribution of PM2.5 to the whole study area of 1.13 μg/m3. This value was 6.53 μg/m3 in coastal cities where ports were located.
The concentration of PM2.5 due to ship emissions during onshore wind was significantly higher than that during the non-onshore wind. The concentration of PM2.5 due to ship emissions in all regions was 3.17 μg/m3 during onshore wind in the land area at 10 km from the coastline, while it was only 1.87 μg/m3 during the non-onshore wind. With increasing distance from the coastline, the difference in values of contribution between the two cases decreased, and the difference in contribution in the land area at 10 km from the coastline was 1.7 and 2.44 times higher than that at 30 km and 50 km from the coastline.
In most coastal cities, the average contribution of ship emissions to PM2.5 was 2.94 μg/m3 on days with a sea breeze, 2.4 times higher than that on days without a sea breeze. A downward trend was also found in the effect of sea breeze circulation on the contribution of ship emissions to PM2.5 concentrations. The difference of contribution at 10 km from the coastline between days with a sea breeze and days without a sea breeze were 1.6 and 2.2 times higher than those at 30 km and 50 km from the coastline. In addition, the shape of the coastline, the topographic height of the land area, and the latitude have a significant impact on the circulation of sea breeze and, thus, on the transport of ship emissions.
It should be noted that the above conclusions are entirely based on the simulation results, which are subject to unavoidable uncertainties due to the bias in the simulation results, especially in the wind direction. Follow-up studies based on improved models are needed to reduce these uncertainties. In addition, as the direction of the local wind is constantly switching, and during the switching from sea breeze to a non-sea breeze, the pollutants that have been transported to the land area by sea breeze have not yet been carried back to sea, resulting in the ship contribution value still not significantly reduced even if the wind is a non-sea breeze at that moment. At present, it is difficult to completely distinguish these wind transition moments in our statistics, which also require more comprehensive and in-depth follow-up research to address this issue in the future.
Furthermore, other factors e.g., emissions, precipitation, and chemistry can also play an important role in the observed trends in this study. Taking emissions as an example, the variability in emissions may have evident effect on the results during shorter periods (e.g., a few hours to days). However, over the long term (e.g., several months), the changes in emissions may offset each other positively and negatively. Thus, the uncertainty associated with changes in emissions is limited. In order to exclude the influence of these factors, a follow-up study could choose a typical case of sea breeze process by setting the same meteorological conditions, the same other emissions (except for ship emissions), and the same chemical mechanisms to highlight the contribution of ship emissions to coastal air quality under the influence of sea breeze circulation.

Author Contributions

Conceptualization, D.C.; Methodology, D.C.; Project administration, D.C.; Validation, X.G., Y.Z. and J.L.; Formal Analysis, Y.M.; Investigation, Y.M.; Data Curation, X.F.; Writing—Original Draft Preparation, Y.M. and F.S.; Writing—Review and Editing, D.C.; Visualization, Y.M. All authors have read and agreed to the published version of the manuscript.

Funding

This research was funded by National Natural Science Foundation of China (51978011).

Institutional Review Board Statement

Not applicable.

Informed Consent Statement

Not applicable.

Data Availability Statement

The data presented in this study are openly available in references [7,8,40,43,58].

Acknowledgments

The authors are grateful to the anonymous reviewers for their insightful comments.

Conflicts of Interest

The authors declare no conflict of interest.

References

  1. Bie, S.; Yang, L.; Zhang, Y.; Huang, Q.; Li, J.; Zhao, T.; Zhang, X.; Wang, P.; Wang, W. Source appointment of PM2.5 in Qingdao Port, East of China. Sci. Total Environ. 2021, 755, 142456. [Google Scholar] [CrossRef] [PubMed]
  2. Corbett, J.J.; Fischbeck, P. Emissions from Ships. Science 1997, 278, 823–824. [Google Scholar] [CrossRef]
  3. Endresen, Ø.; Sørgård, E.; Sundet, J.K.; Dalsøren, S.B.; Isaksen, I.S.A.; Berglen, T.F.; Gravir, G. Emission from international sea transportation and environmental impact. J. Geophys. Res. Atmos. 2003, 108, 4560. [Google Scholar] [CrossRef]
  4. Lv, Z.; Liu, H.; Ying, Q.; Fu, M.; Meng, Z.; Wang, Y.; Wei, W.; Gong, H.; He, K. Impacts of shipping emissions on PM2.5 pollution in China. Atmos. Chem. Phys. 2018, 18, 15811–15824. [Google Scholar] [CrossRef] [Green Version]
  5. Ramacher, M.O.P.; Tang, L.; Moldanova, J.; Matthias, V.; Karl, M.; Fridell, E.; Johansson, L. The impact of ship emissions on air quality and human health in the Gothenburg area—Part II: Scenarios for 2040. Atmos. Chem. Phys. 2020, 20, 10667–10686. [Google Scholar] [CrossRef]
  6. Sorte, S.; Rodrigues, V.; Borrego, C.; Monteiro, A. Impact of harbour activities on local air quality: A review. Environ. Pollut. 2020, 257, 113542. [Google Scholar] [CrossRef]
  7. Ministry of Ecology and Environmental of the People’s Republic. Available online: http://www.mee.gov.cn/hjzl/sthjzk/ydyhjgl/201806/P020180604354753261746.pdf (accessed on 25 April 2022).
  8. Ministry of Ecology and Environmental of the People’s Republic. Ecological and Environmental Bulletin. Available online: http://www.mee.gov.cn/hjzl/ (accessed on 25 April 2022).
  9. Camps, J.; Massons, J.; Soler, M.R.; Nickerson, E.C. Pollutant transport in coastal areas with and without background wind. Ann. Geophys. 1997, 15, 476–486. [Google Scholar] [CrossRef]
  10. Xu, J.; Jia, H.; Zhou, H.; Kang, Y.; Zhong, K. Influences of offshore background wind on the formation of sea-land breeze and the characteristics of pollutant diffusion. Environ. Sci. Pollut. Res. 2021, 28, 68318–68329. [Google Scholar] [CrossRef]
  11. Yang, Z.Z.; Zhang, X.F.; Bao, X.J.; Chen, S.Y. Numerical Simulation and Analysis of Characteristics of Atmospheric Diffusion in Coastal Area of a Site. In Proceedings of the International Symposium on Resource Exploration and Environmental Science, Ordos, China, 14–16 April 2017. [Google Scholar]
  12. Zhou, H.; Xie, Y.; Ni, Y.; Shi, Y.; Huang, S. Diffusion acid pollutant driven by wind wave in coastal area. Mar. Environ. Sci. 2012, 31, 16–19. [Google Scholar]
  13. Chen, D.S.; Tian, X.L.; Lang, J.L.; Zhou, Y.; Li, Y.; Guo, X.R.; Wang, W.L.; Liu, B. The impact of ship emissions on PM2.5 and the deposition of nitrogen and sulfur in Yangtze River Delta, China. Sci. Total Environ. 2019, 649, 1609–1619. [Google Scholar] [CrossRef]
  14. Chen, D.S.; Liang, D.Y.; Li, L.; Guo, X.R.; Lang, J.L.; Zhou, Y. The Temporal and Spatial Changes of Ship-Contributed PM2.5 Due to the Inter-Annual Meteorological Variation in Yangtze River Delta, China. Atmosphere 2021, 12, 722. [Google Scholar] [CrossRef]
  15. Chen, D.S.; Zhang, Y.; Lang, J.L.; Zhou, Y.; Li, Y.; Guo, X.R.; Wang, W.L.; Liu, B. Evaluation of di erent control measures in 2014 to mitigate the impact of ship emissions on air quality in the Pearl River Delta, China. Atmos. Environ. 2019, 216, 116911. [Google Scholar] [CrossRef]
  16. Chen, D.S.; Fu, X.Y.; Guo, X.R.; Lang, J.L.; Zhou, Y.; Li, Y.; Liu, B.; Wang, W.L. The impact of ship emissions on nitrogen and sulfur deposition in China. Sci. Total Environ. 2020, 708, 124636. [Google Scholar] [CrossRef] [PubMed]
  17. Liu, Z.; Lu, X.; Feng, J.; Fan, Q.; Zhang, Y.; Yang, X. Influence of Ship Emissions on Urban Air Quality: A Comprehensive Study Using Highly Time-Resolved Online Measurements and Numerical Simulation in Shanghai. Environ. Sci. Technol. 2017, 51, 202–211. [Google Scholar] [CrossRef]
  18. Hawkins, J.D. Study of the Mesoscale Wind Circulation in a Land-Sea Breeze Regime. Bull. Am. Meteorol. Soc. 1977, 58, 1289–1295. [Google Scholar] [CrossRef] [Green Version]
  19. Kozo, T.L. An Observational Study of Sea Breezes along the Alaskan Beaufort Sea Coast: Part I. J. Appl. Meteorol. 1982, 21, 891–905. [Google Scholar] [CrossRef] [Green Version]
  20. Han, S.Q.; Cai, Z.Y.; Liu, J.L.; Zhang, M.; Chen, J.; Lin, Y. Comparison on aerosol physicochemical properties of sea and land along the coast of Bohai, China. Sci. Total Environ. 2019, 673, 148–156. [Google Scholar] [CrossRef]
  21. Huang, M.; Gao, Z.; Miao, S.; Xu, X. Characteristics of sea breezes over the Jiangsu coastal area, China. Int. J. Climatol. 2016, 36, 3908–3916. [Google Scholar] [CrossRef]
  22. Zhang, Z.Z.; Cao, C.X.; Song, Y.; Kang, L.; Cai, X.H. Statistical Characteristics and Numerical Simulation of Sea-Land Breezes in Hainan Island. J. Trop. Meteorol. 2014, 20, 267–278. [Google Scholar]
  23. Lu, X.; Chow, K.-C.; Yao, T.; Fung, J.C.H.; Lau, A.K.H. Seasonal variation of the land-sea breeze circulation in the Pearl River Delta region. J. Geophys. Res. Atmos. 2009, 114, D17. [Google Scholar] [CrossRef]
  24. Zhao, D.; Xin, J.; Wang, W.; Jia, D.; Wang, Z.; Xiao, H.; Liu, C.; Zhou, J.; Tong, L.; Ma, Y.; et al. Effects of the sea-land breeze on coastal ozone pollution in the Yangtze River Delta, China. Sci. Total Environ. 2021, 807, 150306. [Google Scholar] [CrossRef] [PubMed]
  25. Pokhrel, R.; Lee, H. Estimation of the effective zone of sea/land breeze in a coastal area. Atmos. Pollut. Res. 2011, 2, 106–115. [Google Scholar] [CrossRef] [Green Version]
  26. Kitada, T.; Sofyan, A.; Kurata, G. Numerical Simulation of Air Pollution Transport under Sea/Land Breeze Situation in Jakarta, Indonesia in Dry Season. In Air Pollution Modeling and Its Application XIX. NATO Science for Peace and Security Series Series C: Environmental Security; Borrego, C., Miranda, A.I., Eds.; Springer: Dordrecht, The Netherlands, 2008; pp. 243–251. [Google Scholar]
  27. Kitada, T. Turbulence structure of sea breeze front and its implication in air pollution transport? Application of k-? turbulence model? Bound. Layer Meteorol. 1987, 41, 217–239. [Google Scholar] [CrossRef]
  28. Liu, J.X.; Song, X.Q.; Long, W.R.; Fu, Y.Y.; Yun, L.; Zhang, M.D. Structure Analysis of the Sea Breeze Based on Doppler Lidar and Its Impact on Pollutants. Remote Sens. 2022, 14, 324. [Google Scholar] [CrossRef]
  29. Lin, C.Y.; Sheng, Y.F.; Chen, W.C.; Chou, C.C.K.; Chien, Y.Y.; Chen, W.M. Air quality deterioration episode associated with a typhoon over the complex topographic environment in central Taiwan. Atmos. Chem. Phys. 2021, 21, 16893–16910. [Google Scholar] [CrossRef]
  30. Colbeck, I.; Chung, M.-C.; Eleftheriadis, K. Formation and Transport of Atmospheric Aerosol over Athens, Greece. Water Air Soil Pollut. Focus 2002, 2, 223–235. [Google Scholar] [CrossRef]
  31. Nie, X.L.; Mao, H.T.; Li, P.Y.; Li, T.; Zhou, J.; Wu, Y.; Yang, M.M.; Zhen, J.B.; Wang, X.L.; Wang, Y. Total gaseous mercury in a coastal city (Qingdao, China): Influence of sea-land breeze and regional transport. Atmos. Environ. 2020, 235, 117633. [Google Scholar] [CrossRef]
  32. Oh, I.B.; Kim, Y.K.; Lee, H.W.; Kim, C.H. An observational and numerical study of the effects of the late sea breeze on ozone distributions in the Busan metropolitan area, Korea. Atmos. Environ. 2006, 40, 1284–1298. [Google Scholar] [CrossRef]
  33. Miller, S.T.K.; Keim, B.D.; Talbot, R.W.; Mao, H. Sea breeze: Structure, forecasting, and impacts. Rev. Geophys. 2003, 41, 31. [Google Scholar] [CrossRef] [Green Version]
  34. Cheng, W.L. Ozone distribution in coastal central Taiwan under sea-breeze conditions. Atmospheric Environ. 2002, 36, 3445–3459. [Google Scholar] [CrossRef]
  35. Kambezidis, H.D.; Weidauer, D.; Melas, D.; Ulbricht, M. Air quality in the Athens basin during sea breeze and non-sea breeze days using laser-remote-sensing technique. Atmos. Environ. 1998, 32, 2173–2182. [Google Scholar] [CrossRef]
  36. Maalej, A.; Suhre, K.; Rosset, R. Numerical Analysis of the ROLE of Sea-Breeze Fronts on Air Quality in Coastal and Inland Polluted Areas of Sfax (Tunisia) Sfax; WIT Press: Ashurst, UK, 1997. [Google Scholar]
  37. Shang, F.; Chen, D.; Guo, X.; Lang, J.; Zhou, Y.; Li, Y.; Fu, X. Impact of Sea Breeze Circulation on the Transport of Ship Emissions in Tangshan Port, China. Atmosphere 2019, 10, 723. [Google Scholar] [CrossRef] [Green Version]
  38. World Shipping Council. Available online: https://www.worldshipping.org/ (accessed on 25 April 2022).
  39. Available online: http://www.gov.cn/gzdt/2007-07/20/content_691642.htm (accessed on 25 April 2022).
  40. Chen, D.S.; Wang, X.T.; Li, Y.; Lang, J.L.; Zhou, Y.; Guo, X.R.; Zhao, Y. High-spatiotemporal-resolution ship emission inventory of China based on AIS data in 2014. Sci. Total Environ. 2017, 609, 776–787. [Google Scholar] [CrossRef] [PubMed]
  41. Liu, F.; Zhang, Q.; Tong, D.; Zheng, B.; Li, M.; Huo, H.; He, K.B. High-resolution inventory of technologies, activities, and emissions of coal-fired power plants in China from 1990 to 2010. Atmos. Chem. Phys. 2015, 15, 13299–13317. [Google Scholar] [CrossRef] [Green Version]
  42. Zheng, B.; Huo, H.; Zhang, Q.; Yao, Z.L.; Wang, X.T.; Yang, X.F.; Liu, H.; He, K.B. High-resolution mapping of vehicle emissions in China in 2008. Atmos. Chem. Phys. 2014, 14, 9787–9805. [Google Scholar] [CrossRef] [Green Version]
  43. Li, M.; Zhang, Q.; Streets, D.G.; He, K.B.; Cheng, Y.F.; Emmons, L.K.; Huo, H.; Kang, S.C.; Lu, Z.; Shao, M.; et al. Mapping Asian anthropogenic emissions of non-methane volatile organic compounds to multiple chemical mechanisms. Atmos. Chem. Phys. 2014, 14, 5617–5638. [Google Scholar] [CrossRef] [Green Version]
  44. Zhang, Q.; Streets, D.G.; Carmichael, G.R.; He, K.B.; Huo, H.; Kannari, A.; Klimont, Z.; Park, I.S.; Reddy, S.; Fu, J.S.; et al. Asian emissions in 2006 for the NASA INTEX-B mission. Atmos. Chem. Phys. 2009, 9, 5131–5153. [Google Scholar] [CrossRef] [Green Version]
  45. Zhou, Y.; Xing, X.; Lang, J.; Chen, D.; Cheng, S.; Wei, L.; Wei, X.; Liu, C. A comprehensive biomass burning emission inventory with high spatial and temporal resolution in China. Atmos. Chem. Phys. Discuss. 2017, 2839–2864. [Google Scholar] [CrossRef] [Green Version]
  46. NCAR. Available online: https://www2.acom.ucar.edu/wrf-chem/wrf-chem-tools-community#download/ (accessed on 19 May 2022).
  47. NCEP. Available online: https://rda.ucar.edu/datasets/ds083.2/ (accessed on 12 February 2020).
  48. You, C.; Chi-Hung Fung, J. Characteristics of the Sea-Breeze Circulation in the Pearl River Delta Region and Its Dynamical Diagnosis. J. Appl. Meteorol. Clim. 2019, 58, 741–755. [Google Scholar] [CrossRef]
  49. Stockwell, W.R.; Middleton, P.; Chang, J.S.; Tang, X.Y. The second generation regional acid deposition model chemical mechanism for regional air quality modeling. J. Geophys. Res. Atmos. 1990, 95, 16343–16367. [Google Scholar] [CrossRef]
  50. Ackermann, I.J.; Hass, H.; Memmesheimer, M.; Ebel, A.; Binkowski, F.S.; Shankar, U. Modal aerosol dynamics model for Europe: Development and first applications. Atmos. Environ. 1998, 32, 2981–2999. [Google Scholar] [CrossRef]
  51. Hong, S.-Y.; Noh, Y.; Dudhia, J. A new vertical diffusion package with an explicit treatment of entrainment processes. Mon. Weather Rev. 2006, 134, 2318–2341. [Google Scholar] [CrossRef] [Green Version]
  52. Fels, S.B.; Schwarzkopf, M.D. An efficient, accurate algorithm for calculating CO2 15 μm band cooling rates. J. Geophys. Res. 1981, 86, 1205–1232. [Google Scholar] [CrossRef] [Green Version]
  53. Chou, M.S.; Suarez, M.J. A solar radiation parameterization for atmospheric studies. NASA Tech. Memo. 1995, 15, 40. [Google Scholar]
  54. Lin, Y.F.; Farley, R.D.; Orville, H. Bulk Parameterization of the snow field in a cloud model. Clim. Appl. Meteorol. 1983, 22, 1065–1092. [Google Scholar] [CrossRef] [Green Version]
  55. Ek, M.B.; Mitchell, K.E.; Lin, Y.; Rogers, E.; Grunmann, P.; Koren, V.; Gayno, G.; Tarpley, J.D. Implementation of Noah land surface model advances in the National Centers for Environmental Prediction operational mesoscale Eta model. J. Geophys. Res. Atmos. 2003, 108, 8851. [Google Scholar] [CrossRef]
  56. Chen, D.S.; Zhao, N.; Lang, J.L.; Zhou, Y.; Wang, X.T.; Li, Y.; Zhao, Y.H.; Guo, X.R. Contribution of ship emissions to the concentration of PM2.5: A comprehensive study using AIS data and WRF/Chem model in Bohai Rim Region, China. Sci. Total Environ. 2018, 610–611, 1476–1486. [Google Scholar] [CrossRef]
  57. Xu, Z.; Liu, M.; Zhang, M.; Song, Y.; Wang, S.; Zhang, L.; Xu, T.; Wang, T.; Yan, C.; Zhou, T.; et al. High efficiency of livestock ammonia emission controls in alleviating particulate nitrate during a severe winter haze episode in northern China. Atmos. Chem. Phys. 2019, 19, 5605–5613. [Google Scholar] [CrossRef]
  58. Liu, M.; Huang, X.; Song, Y.; Xu, T.; Wang, S.; Wu, Z.; Hu, M.; Zhang, L.; Zhang, Q.; Pan, Y.; et al. Rapid SO2 emission reductions significantly increase tropospheric ammonia concentrations over the North China Plain. Atmos. Chem. Phys. 2018, 18, 17933–17943. [Google Scholar] [CrossRef] [Green Version]
  59. Yao, H.; Song, Y.; Liu, M.; Archer-Nicholls, S.; Lowe, D.; Mcfiggans, G.; Xu, T.; Du, P.; Li, J.; Wu, Y.; et al. Direct radiative effect of carbonaceous aerosols from crop residue burning during the summer harvest season in East China. Atmos. Chem. Phys. 2017, 17, 5205–5219. [Google Scholar] [CrossRef] [Green Version]
  60. Liu, L.; Huang, X.; Ding, A.; Fu, C. Dust-induced radiative feedbacks in north China: A dust storm episode modeling study using WRF-Chem. Atmos. Environ. 2016, 129, 43–54. [Google Scholar] [CrossRef]
  61. Gao, M.; Carmichael, G.R.; Saide, P.E.; Lu, Z.; Yu, M.; Streets, D.G.; Wang, Z. Response of winter fine particulate matter concentrations to emission and meteorology changes in North China. Atmos. Chem. Phys. 2016, 16, 11837–11851. [Google Scholar] [CrossRef] [Green Version]
  62. NCEI. Available online: https://gis.ncdc.noaa.gov/maps/ncei/cdo/hourly/ (accessed on 20 July 2020).
  63. Boylan, J.W.; Russell, A.G. PM and light extinction model performance metrics, goals, and criteria for three-dimensional air quality models. Atmos. Environ. 2006, 40, 4946–4959. [Google Scholar] [CrossRef]
  64. Fu, M.; Ding, Y.; Ge, Y.; Yu, L.; Yin, H.; Ye, W.; Liang, B. Real-world emissions of inland ships on the Grand Canal, China. Atmos. Environ. 2013, 81, 222–229. [Google Scholar] [CrossRef]
  65. Sethuraman, S.; Raynor, G.S. Comparison of Mean Wind Speeds and Turbulence at a Coastal Site and an Offshore Location—Reply. J. Appl. Meteorol. Clim. 1981, 20, 838–839. [Google Scholar] [CrossRef] [Green Version]
  66. Papanastasiou, D.K.; Melas, D. Climatology and impact on air quality of sea breeze in an urban coastal environment. Int. J. Climatol. 2009, 29, 305–315. [Google Scholar] [CrossRef]
  67. Borne, K.; Chen, D.; Nunez, M. A method for finding sea breeze days under stable synoptic conditions and its application to the Swedish West Coast. Int. J. Climatol. 1998, 18, 901–914. [Google Scholar] [CrossRef]
  68. Azorin-Molina, C.; Tijm, S.; Chen, D. Development of selection algorithms and databases for sea breeze studies. Theor. Appl. Climatol. 2011, 106, 531–546. [Google Scholar] [CrossRef]
  69. Furberg, M.; Steyn, D.G.; Baldi, M. The climatology of sea breezes on Sardinia. Int. J. Climatol. 2002, 22, 917–932. [Google Scholar] [CrossRef]
  70. Prtenjak, M.T.; Grisogono, B. Sea/land breeze climatological characteristics along the northern Croatian Adriatic coast. Arch. Meteorol. Geophys. Bioclimatol. Ser. B 2007, 90, 201–215. [Google Scholar] [CrossRef]
  71. Saaroni, H.; Maza, E.; Ziv, B. Summer sea breeze, under suppressive synoptic forcing, in a hyper-arid city: Eilat, Israel. Clim. Res. 2004, 26, 213–220. [Google Scholar] [CrossRef]
  72. Gilliam, R.C.; Raman, S.; Niyogi, D.D.S. Observational and numerical study on the influence of large-scale flow direction and coastline shape on sea-breeze evolution. Bound. Layer Meteorol. 2004, 111, 275–300. [Google Scholar] [CrossRef]
  73. Arritt, R.W. Numerical modelling of the offshore extent of sea breezes. Q. J. R. Meteorol. Soc. 1989, 115, 547–570. [Google Scholar] [CrossRef]
  74. Yin, S.Q.; Chen, D.L.; Xie, Y. Diurnal variations of precipitation during the warm season over China. Int. J. Climatol. 2009, 29, 1154–1170. [Google Scholar] [CrossRef]
  75. Bouchlaghem, K.; Nsom, B.; Lattrache, N.; Haj, H. Characterization of sea breezes and their effects on Air Pollution in the Tunisian Mediterranean region. New Asp. Eng. Mech. Struct. Eng. Geol. 2008, 4, 475–486. [Google Scholar]
  76. Eager, R.E.; Raman, S.; Wootten, A.; Westphal, D.L.; Reid, J.S.; Al Mandoos, A. A climatological study of the sea and land breezes in the Arabian Gulf region. J Geophys. Res. Atmos. 2008, 113, D15. [Google Scholar] [CrossRef] [Green Version]
  77. Grønås, S.; Sandvik, A.D. Numerical simulations of sea and land breezes at high latitudes. Tellus A Dyn. Meteorol. Oceanogr. 2016, 50, 468–489. [Google Scholar] [CrossRef]
  78. Prtenjak, M.T.; Viher, M.; Jurkovic, J. Sea-land breeze development during a summer bora event along the north-eastern Adriatic coast. Q. J. R. Meteorol. Soc. 2010, 136, 1554–1571. [Google Scholar] [CrossRef]
  79. Rani, S.I.; Ramachandran, R.; Subrahamanyam, D.B.; Alappattu, D.P.; Kunhikrishnan, P.K. Characterization of sea/land breeze circulation along the west coast of Indian sub-continent during pre-monsoon season. Atmos. Res. 2010, 95, 367–378. [Google Scholar] [CrossRef]
  80. Wang, Y.; Di Sabatino, S.; Martilli, A.; Li, Y.; Wong, M.S.; Gutierrez, E.; Chan, P.W. Impact of land surface heterogeneity on urban heat island circulation and sea-land breeze circulation in Hong Kong. J. Geophys. Res. Atmos. 2017, 122, 4332–4352. [Google Scholar] [CrossRef]
  81. Ji, H.E.; Lee, S.H.; Lee, H.W. Characteristics of sea breeze front development with various synoptic conditions and its impact on lower troposphere ozone formation. Adv. Atmos. Sci. 2013, 30, 1461–1478. [Google Scholar] [CrossRef]
  82. Levy, I.; Mahrer, Y.; Dayan, U. Coastal and synoptic recirculation affecting air pollutants dispersion: A numerical study. Atmos. Environ. 2009, 43, 1991–1999. [Google Scholar] [CrossRef]
Figure 1. Map of the study area and two nested domains established for modeling.
Atmosphere 13 01094 g001
Figure 2. Spatial distribution of annual ship emissions for different pollutions (kg/km2/yr) in 2014 over the Bohai Rim region.
Atmosphere 13 01094 g002
Figure 3. Schematic diagram of study area division. A, B, C, D, E, F, G are the separation points for each section of the coastline.
Atmosphere 13 01094 g003
Figure 4. Calendar chart of Sea Breeze Day.
Atmosphere 13 01094 g004
Figure 5. Spatial distribution of average contribution of ship emissions to PM2.5 overlapped by wind vectors in μg/m3 (a) and in % (b) in summer half year over the Bohai Rim region.
Atmosphere 13 01094 g005
Figure 6. The frequency (%) distribution of each wind direction with the corresponding PM2.5 concentration (μg/m3, indicated by color) (a1a6) and the concentration of PM2.5 due to ship emissions (μg/m3) during onshore wind and non-onshore wind (b1b6) in summer half year over the Bohai Rim region.
Atmosphere 13 01094 g006
Figure 7. The concentration of PM2.5 due to ship emissions (μg/m3) during onshore wind and non-onshore wind in summer half year at different distances from the coastline.
Atmosphere 13 01094 g007
Figure 8. The concentration of PM2.5 due to ship emissions (μg/m3) with overlapping wind vectors on days with a sea breeze (right column) and days without a sea breeze (left column) in summer-half year in each section of Bohai Rim region.
Atmosphere 13 01094 g008
Figure 9. (a) The spatial distribution of ship contribution values for coastal cities (μg/m3). (b) The average contribution and difference of the contribution of PM2.5 due to ship emissions (μg/m3) in coastal cities on days with a sea breeze and days without a sea breeze.
Atmosphere 13 01094 g009
Figure 10. The concentration of PM2.5 due to ship emissions (μg/m3) on days with a sea breeze and days without a sea breeze in the summer half year at different distances from the coastline.
Atmosphere 13 01094 g010
Figure 11. Comparison of the difference contributed by the onshore wind and the difference contributed by the sea-breeze circulation.
Atmosphere 13 01094 g011
Table 1. WRF/Chem configurations for physical and chemical schemes.
Chemical and Pysics OptionsSchemesReference
Chemical SchemesGas-phaseThe Regional Acid Deposition Model version 2 (RMD2)Stockwell et al. [49]
AerosolThe Modal Aerosol Dynamics Model for Europe (MADE/SORGAM)Ackermann et al., 1998; Schell et al. [50]
Physics SchemesPlanetary Boundary layerYonsei University (YSU)Hong et al. [51]
Long-wave RadiationEta Geophysical Fluid Dynamics Laboratory (GFDL)Fels and Schwarzkopf [52]
Shortwave RadiationGoddardChou and Suarez [53]
MicrophysicsPurdue LinLin et al. [54]
Land Surface ModelNoahEk et al. [55]
Table 2. Performance statistics for temperature at 2 m (T2), relative humidity at 2 m (RH2), wind speed at 10 m (WS10) and wind direction at 10 m (WD10) at 161 sites within the study area.
SpeciesMonthMB 1MAE 2NMB 3 (%)NME 4 (%)R 5
T2
°C
April−0.511.40−4.044.810.90
May−0.151.27−0.714.410.91
June−0.290.96−1.334.040.89
July0.030.95−0.491.520.86
August0.120.660.472.670.91
September0.731.333.996.570.92
RH2
%
April0.819.520.295.530.83
May1.277.340.648.380.86
June2.257.242.374.540.83
July−0.197.956.7412.380.85
August2.785.613.306.720.86
September1.305.221.566.870.87
WS10
m/s
April0.810.9830.2336.780.71
May0.650.9517.8626.180.74
June0.420.902.1722.860.73
July0.490.918.0928.140.75
August0.880.9910.1226.520.73
September0.791.0611.3827.790.75
WD10
°
April5.3225.7117.9828.980.73
May8.8619.453.287.210.76
June14.7921.965.608.320.76
July15.8223.006.028.750.76
August6.3115.262.315.600.77
September19.1628.247.3810.880.78
1 MB indicates the mean bias. 2 MAE indicates the mean absolute error. 3 NMB indicates the normalized mean bias. 4 NME indicates the normalized mean error. 5 R indicates the correlative coefficient.
Table 3. Performance statistics for PM2.5 concentrations at 140 sites within study area.
MonthNMB (%)NME (%)MFB 1 (%)MFE 2 (%)R
April−13.4834.05−23.5926.260.85
May−21.4628.35−12.2916.720.81
June−2.0128.59−1.9620.960.81
July−15.1110.56−7.4716.610.81
August10.8629.586.4719.320.76
September13.6633.305.4017.950.80
1 MFB: indicates the mean fractional bias. 2 MFE: indicates the mean fractional error.
Table 4. Onshore wind range of each section.
AreaOnshore Wind Range
Section A-BENE-SSW 1
Section B-CSSW-NNW
Section C-DENE-SSW
Section D-ENNW-ESE
Section E-FW-NE
Section F-GENE-SSW
1 ENE-SSW indicates that the wind direction is in the range of 67.5–202.5° (clockwise) and the angle measured in a clockwise direction, between true north and the direction from which the wind is blowing. Please refer to Figure 3 for the division of wind directions.
Publisher’s Note: MDPI stays neutral with regard to jurisdictional claims in published maps and institutional affiliations.