Abstract
Unusually long duration and heavy rainfall from 5 to 6 February 2021 caused widespread and devastating floods in Semarang, Central Java, Indonesia. The heavy rainfall was produced by two mesoscale convective systems (MCSs). The first MCS developed at 13Z on 5 February 2021 over the southern coast of Sumatra and propagated towards Semarang. The second MCS developed over the north coast of Semarang at 18Z on 5 February 2021 and later led to the first peak of precipitation at 21Z on 5 February 2021. These two MCSs eventually merged into a single MCS, producing the second peak of precipitation at 00Z on 6 February 2021. Analysis of the moisture transport indicates that the strong and persistent north-westerly wind near the surface induced by CENS prior to and during the event created an intensive meridional (southward) tropospheric moisture transport from the South China Sea towards Semarang. In addition, the westerly flow induced by low-frequency variability associated with La Nina and the tropical depression over the North of Australia produced an intensive zonal (eastward) tropospheric moisture transport from the Indian Ocean towards Semarang. The combined effects of the zonal and meridional moisture transport provided favorable conditions for the development of MCSs, and hence extreme rainfall over Semarang. These results provide useful precursors for extreme weather-driven hazard prediction in Semarang and the surrounding regions in the future.
1. Introduction
Semarang is the capital of Central Java province and is one of the largest cities in Indonesia. It is particularly prone to damaging flooding, due to tidal flooding from the sea and flash floods from the upper inland area [1]. This city is located on the northern coast of Java Island at 658 S 11025 E (Figure 1). On Saturday, 6 February 2021, the city was hit by the flash floods triggered by extreme rainfall that inundated Semarang City and various areas of 10 subdistricts from Friday to Saturday [2]. According to the Agency for Meteorology, Climatology, and Geophysics (BMKG), the daily extreme rainfall intensity on 5 February 2021 was recorded up to 163.7 mm and 183 mm at the Klimatologi and Beringin Asri local weather stations, respectively. The flash floods triggered by this extreme rainfall were one of the most damaging flood events in the last 10 years. It is estimated that 972 residents were evacuated from their homes, and many more reported severe property damages [3].
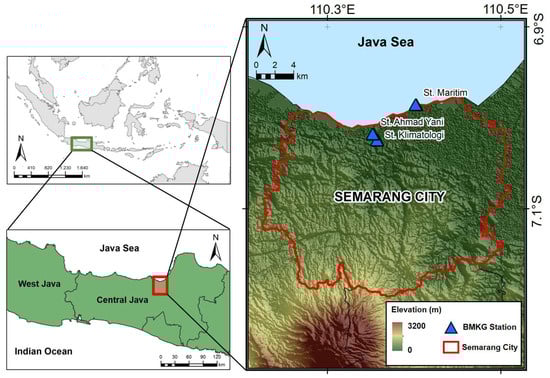
Figure 1.
Area of study of Semarang, located in Central Java province of Indonesia. The blue triangle is the rain gauge station that was used in this study. The color shading shows the topography profile. The red line is the administration boundary of Semarang.
Previous studies have investigated the atmospheric mechanisms that have driven several flash floods in Semarang. For example, Gernowo et al. [4] show that strong convection produced a convective cloud (Cumulonimbus) that triggered heavy rainfall and floods in Semarang in January 2013 and July 2016. Similarly, Faridatussafura and Wandala [5] used a weather forecast model with different convective and microphysics schemes and found the same driving mechanism for the heavy rainfall in Semarang on 15 January 2013. Nonetheless, the role of large-scale meteorological drivers for the flash flood and extreme precipitation in Semarang is not well understood and has rarely been studied.
Extreme rainfall events that lead to flash floods are often associated with mesoscale convective systems (MCSs) [6,7,8]. Nuryanto et al. [9] studied MCSs over Jakarta by focusing on the distribution of MCSs using satellite data. They found that temporal variability of the MCS is often associated with a flood-producing storm. Furthermore, extreme precipitation over the northern part of Java Island has also been linked to large-scale atmospheric variability on weekly to inter-seasonal timescales, such as Cold Surge (CS) and Cross Equatorial Northerly Surge (CENS) [10,11,12] and Madden Julian Oscillation (MJO) [13,14,15,16,17]. More recently, studies have found that equatorially-trapped waves—including Kelvin waves, tropical-depression (TD)-type waves, eastward Inertio-Gravity (EIG) waves, mixed Rossby-Gravity (MRG) waves, and equatorial Rossby waves—play a major role in organizing tropical convection and triggering floods [18,19,20,21]. In particular, Lubis and Respati [19] show that the convectively active phases of Kelvin waves can increase the probability of extreme rainfall over Java Island by up to 30–60%. Other studies also show the importance of tropical depression-type disturbances in organizing deep convection and precipitation in the tropics [18,22]. For example, Lubis and Jacobi [18] found that they exhibit more predominant impacts than other waves in the tropics. However, how this tropical depression-type disturbance affects Indonesia’s extreme rainfall remains unclear.
In this study, we investigate the atmospheric driving mechanisms of the extreme rainfall and floods that were experienced in Semarang from 5 to 6 February 2021. We focus on the effects of large-scale meteorological phenomena that support the development of deep convection and heavy rainfall using in situ data, reanalysis, and satellite data. In addition, moisture transport and sources for extreme precipitation over Semarang on 5 to 6 February 2021 remain uncertain. Here, a backward tracking simulation using the Hybrid Single-Particle Lagrangian Integrated Trajectory (HYSPLIT) model is performed to search for the moisture transport that is associated with the extreme rainfall event. The materials and methods that we used in this study are described in Section 2. In Section 3, we present the results and discussion. This is followed by the conclusions and recommendations for future works in Section 4.
2. Materials and Methods
2.1. In Situ Data and ERA5
The observational data that were used in this study included in-situ hourly measured rainfall data from rain-gauge observations operated by Meteorology, Climatology, and Geophysics Agency (BMKG). The data for the period of 5 February 2021 14Z to 6 February 2021 07Z were collected from three different local weather stations in Semarang, namely Maritime station, Ahmad Yani station, and Climatology Station (Figure 1 and Supplementary Table S1).
In addition to in-situ observation data, this study also used the fifth generation European Centre for Medium-Range Weather Forecasts (ECMWF) atmospheric reanalysis of the global climate (ERA5) [23]. This study included all of the parameters on single surface levels and pressure levels on a 0.25 × 0.25 latitude-longitude grid. The ERA5 was used as the input data for the HYSPLIT model to track the moisture source of heavy precipitation. Table 1 describes the parameters that were needed by the HYSPLIT model as input data on pressure level and surface data, from 1 to 6 February 2021. These data were accessed from the Copernicus Climate Change Service Climate Data Store (https://cds.climate.copernicus.eu/, accessed on 6 April 2022). The original data were in GRIB format data, which was then converted into ARL format data and adjusted with the HYSPLIT configuration.

Table 1.
ERA5 parameters for HYSPLIT input data.
The horizontal wind, mean sea level pressure, and potential vorticity parameters obtained from hourly temporal resolution at 925 hPa and 850 hPa pressure levels at the same period were also used to analyze CS, CENS, equatorial waves, and synoptic analysis.
2.2. Satellite Data
This study used Himawari-8 satellite top brightness temperature (TBB) data at 10.4 m infrared channel (Band 13) to identify the MCS, which were obtained from the Himawari Cast receiver operated by the National Agency of Research and Innovation (BRIN) installed at Bandung, Indonesia. The data have a spatial resolution of 4 × 4 km and an hourly temporal resolution to track the movement of the convective clouds. The Advance Himawari Imager (AHI), which is the only payload onboard the satellite, has the capability to cover the Asia Pacific and Australia regions, including Indonesia, with up to every 10-minutes near real-time observation [24]. This allowed us to monitor the movement of the clouds and their growth. The 10.4 m channel detects the surface body temperature of the Earth. In addition, the Global Satellite Mapping of Precipitation (GSMaP) gauge-corrected version-7 standard precipitation product was used in this study to investigate the spatial distribution of rainfall associated with the MCS. We used an hourly rain rate with a horizontal resolution of 0.1 × 0.1 degrees (https://sharaku.eorc.jaxa.jp/GSMaP/, accessed on 6 November 2021).
2.3. Sea Surface Temperature Data
Sea surface temperature (SST) daily anomaly data were retrieved from the NOAA high-resolution blended analysis of daily SST and ice dataset [25] on a 0.25 × 0.25 latitude–longitude grid for the period from 4 to 6 February 2021.
2.4. MCS Identification
The MCS was identified in this study based on the “Grab ‘em, Tag ‘em, Graph ‘em” (GTG) algorithm [26]. This method has been applied to previous studies of MCSs in Indonesia [27], such as for analysing heavy precipitation events in Jakarta [9,28]. The GTG algorithm can resolve the complex evolution of MCS [26] because it allows multiple convective cells to merge simultaneously to form a larger convective system. MCS is defined by the convective cloud cluster, which has to meet the criteria that are described in Table 2. A detailed description of the GTG algorithm can be found in [26,27].
Table 2.
Criteria of MCS defined in this study.
2.5. HYSPLIT Model and Backward Trajectories
The HYSPLIT model version 5.1, which was developed by the Air Resources Laboratory (ARL) and the National Oceanic and Atmospheric Administration (NOAA) [29,30], was used to calculate backward trajectories of moisture and its complex transport. This model combines a hybrid of Lagrangian and Eulerian methodology. However, in this study we tracked a moving air parcel by considering the advection calculations, therefore we only applied the Lagrangian model. We tracked the moisture source and transport that led to high precipitation amounts over Semarang during the flood event from 5 to 6 February 2021. This Lagrangian approach considers the advection calculation as the trajectory of the parcel air moving from the initial place. The trajectory is determined by the calculation of the new position at a time step (t + t) as a result of wind advection. The change in the position air parcel vector with time is calculated from the average velocity vectors at their initial and first-guess positions [31].
We ran the model for 35 different trajectory points in Semarang (between 6.89–7.49 S and 110.22–110.62 E) at two peaks of precipitation events during the Semarang flood; the first peak was at 5 February 2021 at 21Z and the second peak was at 6 February 2021 at 00Z. We ran the model to generate 72 h backwards trajectories. Furthermore, to better understand the source of the moisture transport as a function of height, we ran the model on three different atmospheric layers: (1) lower layer () hPa; (2) middle layer () hPa; and (3) the upper layer () hPa. As we will show in the results section, the transport of moisture that causes heavy rainfall over Semarang is driven by the different phenomena that are dominant at certain atmospheric layers.
2.6. Water Vapor Transport and Moisture Flux Convergence
The integrated vertical water vapor transport (IVT) and vertically integrated moisture flux convergence (VIMFC) were calculated for the three different atmospheric layers (i.e., lower layer () hPa, middle layer () hPa and upper layer () hPa) using the following equations [19,20,32]:
where u and v represent zonal and meridional wind velocity (m/s), q is specific humidity (g/kg), p is pressure (Pa), a is the upper limit of each layer, and b is the bottom limit of each layer.
2.7. CENS and CS Indices
The cross equatorial northerly surge (CENS) index is defined as an area-averaged of near-surface level meridional wind magnitude over 105–115 E and 0–5 S [33]. The active phase of CENS is signified by its value exceeding 5 m/s, which indicates a strengthening northerly flow over the Java Sea. Furthermore, cold surge (CS) is defined as an area average of meridional wind at 925 hPa between 110–117.5E, 15 N exceeding 8 m/s [34].
3. Results
3.1. Characteristics of Extreme Rainfall
On 5 February 2021, prolonged heavy rainfall occurred in Semarang from 16Z to 00Z. The highest mean rainfall intensity was recorded at 21Z of up to 48 mm.hr (averaged over three rain gauge stations) and followed by a second peak up to 32 mm.hr at 00Z on 6 February 2021 (Figure 2). Heavy rains continued until 06Z and started to decrease thereafter. The total amount of precipitation from 16Z 5 February to 06Z 6 February reached up to 218 mm, which meets the definition of extreme rainfall by BMKG, where the accumulated rainfall is more than 150 mm within a 24 h period.
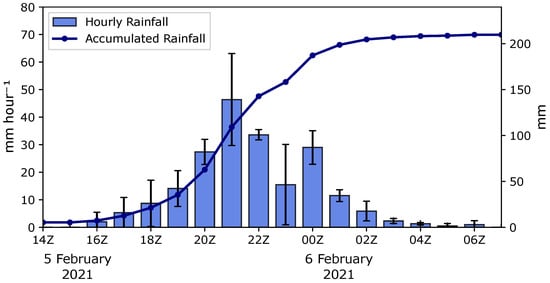
Figure 2.
Time series of hourly rainfall averaged from three rain gauge stations. The vertical line indicates a standard deviation and the contour line indicates accumulated precipitation from 00Z 5 February to 07Z 6 February 2021.
3.2. Evolution of the Mesoscale Convective System (MCS)
Figure 3 shows the three-hourly evolution of the MCS during the period of heavy rainfall (see Supplementary Figure S1 for a hourly evolution of MCS). Two MCSs were identified prior to and during the occurrence of heavy rainfall, which triggered the flood event in Semarang on 6 February 2021. The first MCS developed over the southern coast of Sumatra and was initiated at 13Z on 5 February 2021 (Figure S1b). The size of this cloud cluster was 8704 km2 and it grew steadily until it reached a size of 23,552 km2 after two hours (Figure 3b). The second MCS developed over the north coast of Semarang at 18Z on 5 February 2021. While the first MCS propagated eastward towards Semarang, the second MCS grew and became more mature, resulting in heavy precipitation over the region at 21Z on 5 February 2021 (Figure 3c). Therefore, the first peak of rainfall in Semarang is associated with the local development of the second MCS (Figure 3d). At 00Z on 6 February 2021, the second MCS eventually merged with the first MCS after three hours (Figure 3e), which resulted in a single deep MCS. This MCS in its mature stage was responsible for the increased precipitation at 00Z on 6 February 2021, marking the second peak of precipitation. Thereafter, the MCS gradually dissipated, followed by a decrease in the rainfall intensity. In general, the spatial evolution of rain rates from GSMaP is consistent with the development of MCSs, which suggests that they play an important role in the formation of extreme rainfall over this region.
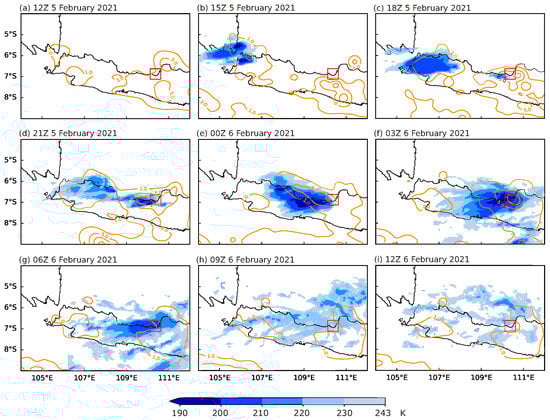
Figure 3.
Three-hourly evolution of the MCS (K, shaded) from Himawari-8 satellite superimposed with rainfall rate from GSMaP (mm.h, contour) for the period of 5 February at 12Z to 6 February 2021 at 12Z. The location of Semarang is denoted by a red box.
3.3. Moisture Sources and Transport for Extreme Precipitation
Our results so far indicate that two MCS that were initially identified over the southern coast of Sumatra and the north coast of Semarang (Figure 3) are responsible for the extreme rainfall over Semarang. Previous studies show that the initiation and development of the MCS that resulted in heavy precipitation are associated with higher moisture supply [9,35,36]. Here, we analyse the moisture supply that supports the development of these MCSs for the period 72-h prior to the peaks of precipitation.
To determine the sources of moisture for the devastating precipitation event in Semarang in early-February 2021, moisture transport was tracked using a Lagrangian approach with a HYSPLIT model at the two rainfall peaks (i.e., 21Z on 5 February 2021 and 00Z on 6 February 2021). In general, the moisture transport towards the flooding region can be grouped into three clusters: the bottom/near surface layer () hPa, the middle layer () hPa, and the upper layer () hPa. Figure 4 shows the backward trajectories of moisture calculated for each of the layers that were defined above. In the upper layer, the moisture transport over Semarang is mostly dominated by the zonal transport originating from the Indian Ocean (Figure 4a,b). In the middle layer, enhanced moisture over Semarang is a combination of the meridional transport from the South China Sea and the zonal transport from the Indian Ocean (Figure 4c,d). Tracking over the bottom layer indicates that moisture is transported from the South China Sea towards Semarang (Figure 4e,f). In particular, the specific humidity (q) along pathways is considerably higher (around 16 to 18 g/kg) over the MCS formation location (Figure 4e,f). Moreover, moisture content over the middle and upper layers is quite comparable.
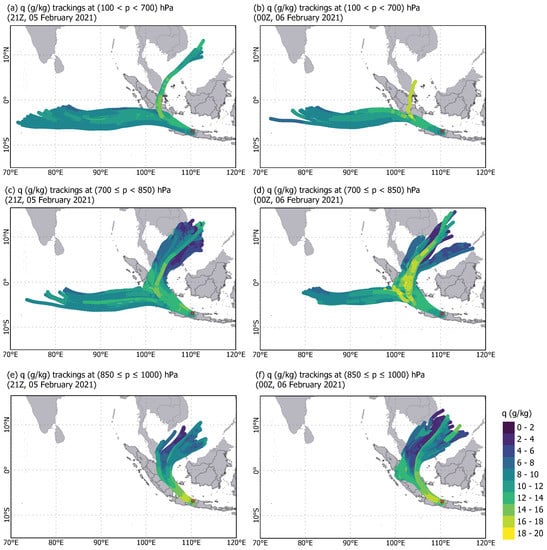
Figure 4.
Characteristics of moisture transport prior to and during the period of maximum precipitation events in Semarang. The 72-hr backward moisture trajectories (lines) of the two peaks of precipitation events: (a,c,e) 21Z 05 February 2021 and (b,d,f) 00Z 06 February 2021 are shown at the three different layers: (a,b) () hPa, (c,d) () hPa, and (e,f) () hPa. Colors on the pathways indicate the average specific humidity of air parcels along the trajectories (g/kg). The location of Semarang is denoted by a red box.
The results of the trajectory analysis are consistent with the Eulerian approach based on IVT analysis. Figure 5 shows the time-integrated IVT for 72-h prior to the period of maximum precipitation events at these three layers. It is evident that water vapor is more abundant in the bottom layer than in the other two layers. In this layer, the highest moisture content (more than 700 × 10 kg·m in 3 days) can be found over the oceans around Java Island and over the South China Sea (Figure 5e,f). At this layer, the transports of moist air are dominated by the meridional transport from the South China Sea, and the zonal transport from the Indian Ocean. The abundance of moisture over the Indian Ocean seems to be supported by the cyclonic flow that carried moist air from the north to the southern part of the Indian Ocean. Moreover, moisture content over the middle and upper layers is quite comparable, with the highest moisture transport (400–600 × 10 kg·m within 3 days) over Java Island and its surroundings (Figure 5a–d) At these two layers, the transports of moisture are more dominated by the zonal transport from the Indian Ocean.
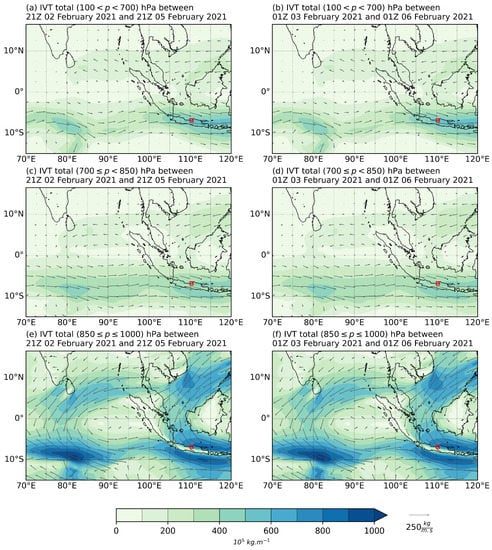
Figure 5.
Time-integrated IVT for 72 h prior to the period of maximum precipitation events: (a,c,e) 21Z 02 to 21Z 05 February 2021 and (b,d,f) 00Z 03 to 00Z 06 February 2021 over three different layers: (a,b) () hPa, (c,d) () hPa, and (e,f) () hPa. The location of Semarang is denoted by a red box.
The enhanced moisture transport can lead to an increase in precipitation because of the convergence of the moisture flux [19,20]. Figure 6 shows the hourly time evolution of the vertically integrated moisture flux convergence (VIMFC) over Semarang, similar to Figure 2. It is evident that the time evolution of precipitation during the period of heavy rainfall over Semarang (Figure 2) can be explained by the time evolution of the VIMFC. This suggests that the enhanced moisture transport towards Semarang leads to increased precipitation through the convergence of the moisture fluxes (Figure 6a). Furthermore, by decomposing the VIMFC into three layers, it is evident that the first peak of rainfall (21Z, 5 February 2021) is mainly attributed to the enhanced VIMFC on the bottom layer (Figure 6b), while the second rainfall peak (00Z, 6 February 2021) is dominated by the moisture in the middle layer (Figure 6b).
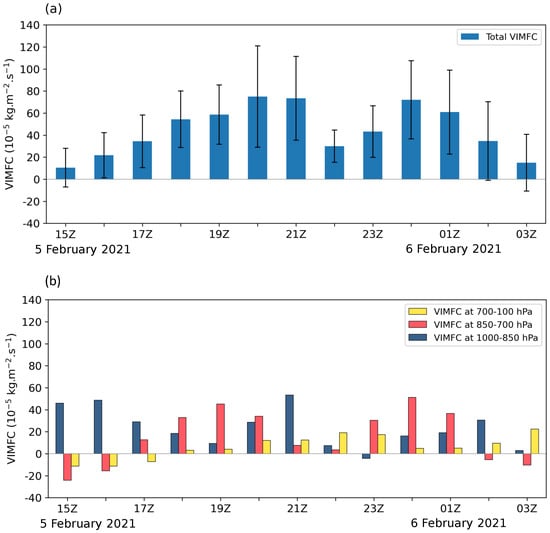
Figure 6.
Hourly time evolution of the vertically integrated moisture flux convergence (VIMFC, 10−5 kg·m−2.s−1) over the Greater Semarang area (6.625 S–7.125 S and 110.125 E–110.625 E) calculated for (a) the total atmospheric columns with its standard deviation, and (b) the three layers defined in the study; that is, upper-layer () hPa; middle-layer () hPa; and bottom-layer () hPa during 15Z 5 February 2021 to 03Z 6 February 2021.
Our results indicate that zonal (eastward) and meridional (southward) transport of moisture towards Semarang play an important role in the development of MCS and the extreme rainfall (Figure 4 and Figure 5). It is also shown that enhanced moisture transport can lead to an increase in precipitation because of the convergence of the moisture/water vapor fluxes (Figure 6). The question now is what mechanisms drive this transport. As seen in Figure 4e,f and Figure 5e,f, the cross-equatorial moisture transport is detected at the bottom and middle layers from both trajectory and IVT analysis. This near surface meridional transport of moisture is consistent with the strong northerly moisture transported from the South China Sea towards the northern part of Java Island (vector in Figure 5e,f). Several studies have shown that moisture transported from this area contributes to the enhancement of rainfall over the northern part of Java Island [33,37], which is correlated with CENS and CS. Therefore the northerly moisture transport in the Semarang flood is suspected to be associated with CENS (see Section 3.4.1 for further discussion). Furthermore, the zonal moisture transport is also responsible for the additional moisture supply. The moisture is advected from the Indian Ocean at the middle and upper layers of Semarang (Figure 4a–d). The zonal transport of moisture is suspected to be associated with zonal circulation associated with the active phase of La Nina and tropical depression (TD), due to TC formation over the North of Australia (see Section 3.4.2 for further discussion).
3.4. Large-Scale Atmospheric Circulation Responsible for Extreme Precipitation
In this section, we will investigate the mechanisms responsible for driving zonal and meridional moisture transport towards Semarang. Here, we focus on the role of large-scale atmospheric drivers such as CENS, low-frequency variability, and synoptic activity during the period of the extreme rainfall.
3.4.1. The Role of the Cross Equatorial Northerly Surge (CENS)
Figure 7 shows the time evolution of CENS from 12Z 2 February to 03Z 7 February 2021. It is evident that a strong and persistent CENS had started on 21Z 2 February 2021 with an amplitude between −7 m/s to −5 m/s. The occurrence of the CENS is preceded by CS due to the cold temperature over the South China Sea Figure 7. This indicates that the strengthening of the near surface meridional wind (at 925 hPa) from the South China Sea all the way to Semarang is associated with CENS. On 21Z 5 February 2021, CENS reached its maximum strength and the rainfall reached the first and second of peaks rainfall intensity. Although the prevailing monsoon wind pattern had already formed prior to the extreme rainfall event, its strength is relatively weak and it had not yet reached the northern coast of Central Java. Therefore, the strong northerly moisture transported from the South China Sea towards the northern part of Java Island (as shown in the bottom and middle layers of moisture transports/trajectories in Figure 5 and Figure 6) is associated with strong and persistent CENS.
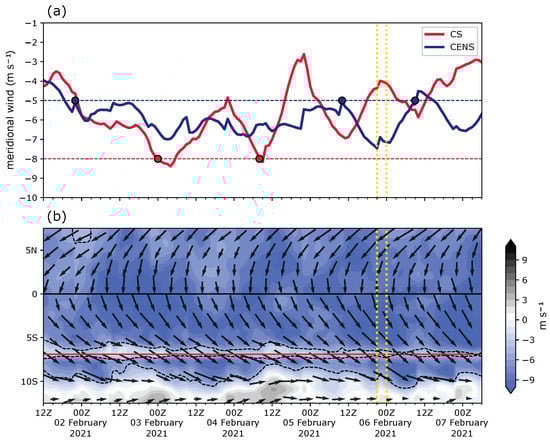
Figure 7.
(a) Time series of cross equatorial northerly surge (CENS) (blue line) and cold surge (CS) (red line), the horizontal-dashed line indicates the threshold of an activated mode of CENS and CS. (b) Time-latitude of 925 hPa horizontal wind magnitude and direction (arrows), contour-fill represents meridional wind and the dotted line shows the value of 5 m/s, the red line marks the latitude of Semarang coastline, the vertical yellow line marks the rainfall peaks. Both (a) and (b) x-axis span from 12Z 2 February to 03Z 7 February 2021.
3.4.2. The Role of Low-Frequency Variability and Tropical Depression
To understand the mechanisms that drive the zonal (eastward) transport of moisture towards Semarang prior to and during the extreme events, we analyzed the daily evolution of the zonal wind anomaly (color shading) and the total wind anomaly (vectors) at 850 hPa. We decomposed the wind anomalies into the contribution of MJO, low-frequency variability (>120 days) and the residual. During the period of extreme rainfall, the MJO was in its dry phase 7 (see RMM index in Figure S2), indicating that MJO did not contribute directly to the enhanced moisture over Semarang through increasing low-level convergence. Nonetheless, we hypothesize that the indirect effect of MJO through the circulation may affect the zonal transport of the moisture during the MJO phase 7. Our finding, however, showed that the indirect effect of MJO through the circulation did not contribute significantly to the zonal component of the horizontal wind around Semarang during the period of extreme precipitation (see vectors and color shading in Figure 8a,d). The indirect effect of MJO on zonal circulation was more confined over the equator between 5 N–5 S.
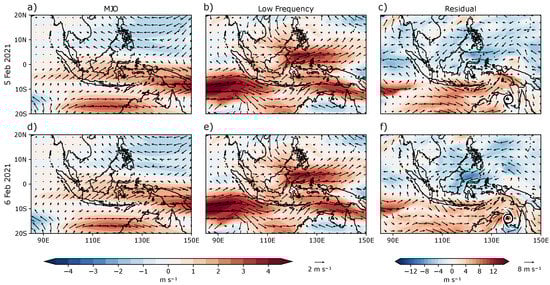
Figure 8.
Daily evolution of 850 hPa zonal wind (color shading) and total wind anomalies (vector) anomalies during the Semarang flood event on 5 February 2021 (a–c) and on 6 February 2021 (d–f). Wind anomalies filtered for (a,d) Madden–Julian oscillation (MJO), (b,e) the low-frequency oscillation (>120 days), and (c,f) residuals (total–(MJO + low frequency)). Note that the amplitude used for the residuals is different from MJO and low-frequency variability.
Low-frequency variability has a greater contribution to strengthening the westerly wind in the Java Island and area around Semarang (Figure 8b,e). The active La Nina caused a stronger zonal wind circulation, especially over the southern part of the maritime continent region, due to the formation of the warm pool over the West Pacific (see also Figure 9a). The water vapor content transported by this westerly wind explains the source of moisture from the Indian Ocean heading to the Semarang. The low-frequency variability also plays a role in strengthening the north-westerly flow that brings moisture towards Semarang.
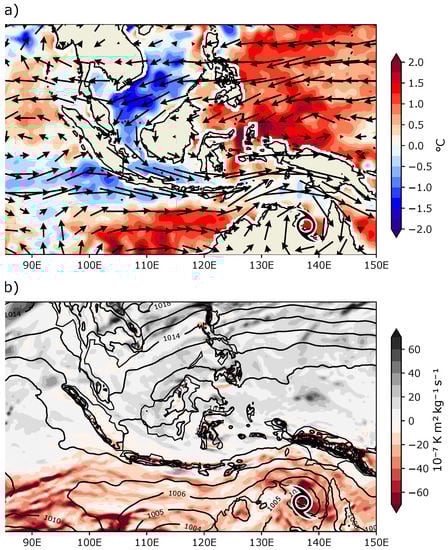
Figure 9.
(a) SST anomalies superimposed with 850 hPa horizontal wind anomalies (vectors) averaged from 4 to 6 February 2021. (b) 850 hPa potential vorticity (PV) anomalies superimposed with mean sea level pressure anomalies averaged from 4 to 6 February 2021.
The zonal circulation driven by synoptic activity associated with the tropical depression over the North of Australia is another driving factor that supports the zonal transport of moisture from the Indian Ocean heading to Semarang. It can be seen that the residual anomaly in Figure 8 is mainly associated with this phenomenon with a time scale of less than 30 days (Figure 8c,f). During this period of time, there was a tropical depression over the North of Australia with strong easterly winds of up to 20 m/s. This tropical depression was formed over the coastal region of the Northern Australia on 28 January, with the low proceeding to move southwestward, overland. This tropical depression associated with the formation of tropical cyclone causes a fairly strong air pressure gradient (see later in Figure 9b) and attracts the moisture to flow from the west to the east. On 8 February, the tropical depression decayed and left the coast of Australia, before being absorbed into another extratropical storm a day later.
The influence of the CENS, low-frequency variability and tropical depression on the moisture transport is consistent with the background SST condition during the period of extreme rainfall in Semarang (Figure 9a). Colder SST anomalies were observed in the South China Sea region lower to −2 C and the Indian Ocean region to the west of Java Island lower to −1 C. Meanwhile, positive anomalies are seen in the seas of the Maritime Continent to the east and the south of Java, with an anomaly of 2 C spreading extensively. The meridional SST gradient between the South China Sea region and Java drive the development of CENS. Meanwhile, the zonal SST gradient between the Indian Ocean and West Pacific warm pool drive the zonal circulation that is associated with the low-frequency variability (La Nina). In addition, the formation of a tropical depression over the North of Australia is consistent with the high positive potential vorticity and low-pressure anomalies (Figure 9b). This low-pressure system is associated with the tropical depression and is also likely to be responsible for the strengthening zonal wind from the Indian Ocean towards Semarang.
4. Conclusions and Discussion
This study has investigated the mechanisms driving the extreme precipitation events produced by two MCSs during the devastating flood event in Semarang from 5 to 6 February 2021, using ERA5 reanalysis, satellite data and in-situ data. The key findings of our results can be summarized as follows:
- Three large-scale meteorological drivers contributed to the flooding event triggered by the extreme rainfall over Semarang, namely: CENS, the low-frequency variability associated with La Nina and a tropical depression over the North of Australia;
- A strong and persistent CENS prior to and during the extreme event contributed significantly to the deep convection over Semarang. CENS drove the meridional (southward) low-level transport of moist air from the South China Sea towards the northern part of Java Island, which supported the development of the two MCSs that produced extreme precipitation over Semarang;
- The low-frequency variability associated with La Nina and the synoptic activity associated with the tropical depression contributed to the development of the zonal propagation of the MCS and the enhanced moisture over Semarang. They both play an important role in the eastward transport of moist air from the Indian Ocean to Semarang.
These main results are summarized in a conceptual diagram in Figure 10. This diagram shows that the influence of CENS is dominant at the bottom/near surface layer () hPa and partly at the middle layer () hPa. The effects of La Nina transport moisture from the Indian Ocean to Semarang, mainly in the upper layer () hPa. In addition, a low pressure located in the north of Australia was associated with a tropical depression and strengthened the westerly winds to supply the moisture in the MCS development over the region.
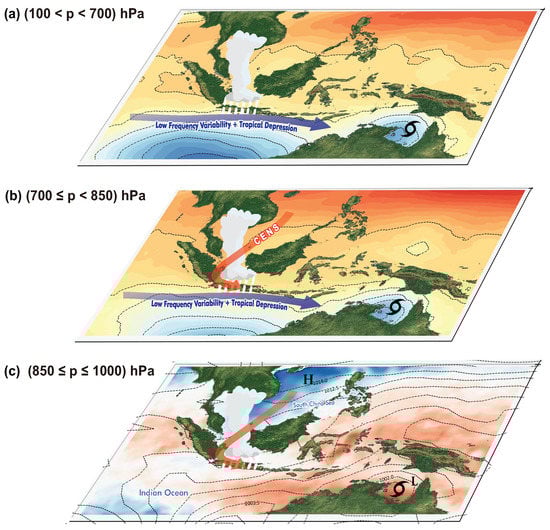
Figure 10.
A schematic diagram of large-scale meteorological drivers behind the extreme precipitation during the Semarang Flood Event, 5 to 6 February 2021 at (a) () hPa, (b) () hPa, and (c) () hPa. Color shading and contour line in (a,b) denotes geopotential height. In (c), color shading denotes SST, while the contour line denotes mean sea-level pressure.
Previous studies have revealed that CENS is a prominent feature in the development of MCS over the tropical region, and enhances the convective activities over the Java Sea and the northern part of Java Island [28,33]. However, to what extent CENS can exert its influence further to the east of the north coast of Java Island is not yet known. Given that the north coast of Central Java is located slightly further south than the north coast of West Java, there must be very strong and persistent northerly winds to have a significant influence on Central Java. This is the case here for the extreme rainfall in Semarang, in which northerly winds were observed in a very strong and persistently condition of up to 3 days in the Java Sea before the event took place. In addition, in this particular flooding case, both westerly and northerly winds persistently transported moisture from the Indian Ocean and the South China Sea. Together, they created a favorable deep convective environment for the development of MCSs, and hence extreme rainfall over the region.
This is the first study to demonstrate the role of large-scale meteorological drivers for the extreme precipitation that caused the widespread flooding in Semarang from 5 to 6 February 2021. It is possible that other roles of large-scale atmospheric phenomena can also initiate the occurrence of extreme precipitation in other major flood cases in Semarang, such as the Indian Ocean Dipole (IOD) [38,39] and equatorial waves [18,19,20,40]. Our analysis showed that the IOD is in its neutral phase and no equatorial waves were observed during the periods of extreme rainfall except the low-frequency variability (see Figure S2). Therefore, IOD and equatorial waves did not contribute to the case in our study. In addition, the unique interaction between small-scale atmospheric variability such as gravity waves with the topography or land-sea thermal contrast could also affect the increased local precipitation. This aspect should be addressed using high-resolution climate model simulations and will be a subject for future research.
Overall, our study suggests that the main meteorological factors that produced unusual heavy rainfall during the flood event in Semarang from 5 to 6 February 2021 were the intensive low-level wind that was induced by CENS and the westerly flow that was modulated by the La Nina circulation and tropical depression. The present study advances our understanding of the role of large-scale circulation on the development of deep convection systems (e.g., MCSs) and hence the extreme precipitation and major flooding in Semarang. Therefore, the complex, large-scale circulation regimes responsible for these linkages can provide useful precursors for extreme weather-driven hazard prediction in Semarang and the surrounding regions in the future. This, therefore, can potentially improve the current state of the numerical weather prediction (NWP) models used for disaster mitigation in Semarang, Central Java, Indonesia.
Supplementary Materials
The following supporting information can be downloaded at: https://www.mdpi.com/article/10.3390/atmos13071092/s1. Figure S1. Hourly evolution of the MCS (K, shaded) from Himawari-8 satellite superimposed with rainfall rate from GSMaP (mm.hr, contour) for the period of 5 February at 12Z to 6 February 2021 at 12Z. The location of Semarang is denoted by a red star, Figure S2. Tropical monitoring and climate indices during the extreme precipitation 5–6 February 2021 (a). Time-longitude diagram of 15°S–5°S Outgoing Longwave Radiation (OLR) (source: https://ncics.org/pub/mjo/archive/, accessed on 1 May 2022) (b). The phase space diagram of Madden-Julian Oscillation (MJO) (source: http://www.bom.gov.au/climate/mjo/, accessed on 1 May 2022), and (c). Indian Ocean Dipole (IOD) index (source: http://www.bom.gov.au/climate/ocean/outlooks/#region=IOD, accessed on 1 May 2022); Table S1. Rain gauge station used in the study.
Author Contributions
E.H., S.W.L. and T.H. are the main contributors. Conceptualization, S.W.L. and E.H.; methodology, S.W.L., A.P., R., A.R. and D.F.A.; software, A.R., A.P. and R.; validation, A.R.; formal analysis, S.W.L., A.P., R., A.R. and D.F.A.; Data, R.W., A.P., R., A.R. and D.F.A. writing—original draft preparation, D.N.R., A.P., R., A.R. and D.F.A.; writing—review and editing, S.W.L. and D.N.R.; visualization, A.P., R., A.R. and D.F.A.; funding acquisition, E.H. All authors have read and agreed to the published version of the manuscript.
Funding
This research was supported by the Budget Execution (Allotment) Document, National Research and Innovation Agency (BRIN) 2022 (grant No. SP DIPA-124.01.1.690504/2022).
Institutional Review Board Statement
No applicable.
Informed Consent Statement
No applicable.
Data Availability Statement
The ERA-5 meteorological reanalysis dataset used in this study is available from the European Centre for Medium-Range Weather Forecasts (https://www.ecmwf.int/en/forecasts/datasets/reanalysis-datasets/era5, accessed on 2 November 2021 ). The SST data are publicly available online at the NOAA web page (https://psl.noaa.gov/data/gridded/data.ncep.reanalysis2.html, accessed on 6 Maret 2022). The hourly rainfall data from the Global Satellite Mapping of Precipitation (GSMaP) can be accessed freely through https://sharaku.eorc.jaxa.jp/GSMaP/ (accessed on 6 November 2021). The Himawari-8 satellite top brightness temperature (TBB) data and in-situ hourly rainfall data presented in this study are available upon request from the corresponding authors.
Acknowledgments
The authors would like to thank all of the staff at the Meteorological Station in Semarang for providing the in-situ observational data for this study.
Conflicts of Interest
The authors declare no conflict of interest.
References
- Marfai, M.A.; King, L. Coastal flood management in Semarang, Indonesia. Environ. Geol. 2008, 55, 1507–1518. [Google Scholar] [CrossRef]
- antaranews.com. Semarang’s Flooding Caused by Extreme Rainfall, Tidal Flooding: Govt—ANTARA News—en.antaranews.com. Available online: https://en.antaranews.com/news/167488/semarangs-flooding-caused-by-extreme-rainfall-tidal-flooding-govt (accessed on 4 June 2022).
- Flood in Semarang and Three Alternative Solutions—Flows.hypotheses.org. Available online: https://flows.hypotheses.org/6071 (accessed on 3 June 2022).
- Gernowo, R.; Adi, K.; Yulianto, T.; Seniyatis, S.; Yatunnisa, A. Hazard mitigation with cloud model based rainfall and convective data. J. Phys. Conf. Ser. 2018, 1025, 012023. [Google Scholar] [CrossRef]
- Faridatussafura, N.; Wandala, A. Convective and microphysics parameterization impact on simulating heavy rainfall in Semarang (case study on February 12supth/sup, 2015). J. Phys. Conf. Ser. 2018, 1025, 012027. [Google Scholar] [CrossRef]
- Doswell, C.A. III Seeing supercells as heavy rain producers. In Proceedings of the 14th Conference on Hydrology, Dallas, TX, USA, 10–15 January 1998; pp. 73–79. [Google Scholar]
- Schumacher, R.S.; Johnson, R.H. Mesoscale processes contributing to extreme rainfall in a midlatitude warm-season flash flood. Mon. Weather Rev. 2008, 136, 3964–3986. [Google Scholar] [CrossRef]
- Hu, H.; Feng, Z.; Leung, L.Y.R. Linking flood frequency with mesoscale convective systems in the US. Geophys. Res. Lett. 2021, 48, e2021GL092546. [Google Scholar] [CrossRef]
- Nuryanto, D.E.; Pawitan, H.; Hidayat, R.; Aldrian, E. The occurrence of the typical mesoscale convective system with a flood-producing storm in the wet season over the Greater Jakarta area. Dyn. Atmos. Oceans 2021, 96, 101246. [Google Scholar] [CrossRef]
- Wu, P.; Hara, M.; Fudeyasu, H.; Yamanaka, M.D.; Matsumoto, J.; Syamsudin, F.; Sulistyowati, R.; Djajadihardja, Y.S. The Impact of Trans-equatorial Monsoon Flow on the Formation of Repeated Torrential Rains over Java Island. SOLA 2007, 3, 93–96. [Google Scholar] [CrossRef]
- Trilaksono, N.J.; Otsuka, S.; Yoden, S.; Saito, K.; Hayashi, S. Dependence of Model-Simulated Heavy Rainfall on the Horizontal Resolution during the Jakarta Flood Event in January-February 2007. SOLA 2011, 7, 193–196. [Google Scholar] [CrossRef]
- Trilaksono, N.J.; Otsuka, S.; Yoden, S. A Time-Lagged Ensemble Simulation on the Modulation of Precipitation over West Java in January–February 2007. Mon. Weather Rev. 2012, 140, 601–616. [Google Scholar] [CrossRef]
- Hidayat, R.; Kizu, S. Influence of the Madden—Julian Oscillation on Indonesian rainfall variability in austral summer. Int. J. Climatol. 2010, 30, 1816–1825. [Google Scholar] [CrossRef]
- Wu, P.; Arbain, A.A.; Mori, S.; Hamada, J.I.; Hattori, M.; Syamsudin, F.; Yamanaka, M.D. The Effects of an Active Phase of the Madden-Julian Oscillation on the Extreme Precipitation Event over Western Java Island in January 2013. SOLA 2013, 9, 79–83. [Google Scholar] [CrossRef]
- Muhammad, F.R.; Lubis, S.W.; Setiawan, S. Impacts of the Madden—Julian oscillation on precipitation extremes in Indonesia. Int. J. Climatol. 2021, 41, 1970–1984. [Google Scholar] [CrossRef]
- Fathurochman, I.; Lubis, S.W.; Setiawan, S. Impact of Madden-Julian Oscillation (MJO) on global distribution of total water vapor and column ozone. IOP Conf. Ser. Earth Environ. Sci. 2017, 54, 012034. [Google Scholar] [CrossRef]
- Muhammad, F.R.; Lubis, S.W.; Setiawan, S. The Influence of Boreal Summer Madden-Julian Oscillation on Precipitation Extremes in Indonesia. arXiv 2021, arXiv:2112.00001. [Google Scholar]
- Lubis, S.W.; Jacobi, C. The modulating influence of convectively coupled equatorial waves (CCEWs) on the variability of tropical precipitation. Int. J. Climatol. 2015, 35, 1465–1483. [Google Scholar] [CrossRef]
- Lubis, S.W.; Respati, M.R. Impacts of convectively coupled equatorial waves on rainfall extremes in Java, Indonesia. Int. J. Climatol. 2021, 41, 2418–2440. [Google Scholar] [CrossRef]
- Latos, B.; Lefort, T.; Flatau, M.K.; Flatau, P.J.; Permana, D.S.; Baranowski, D.B.; Paski, J.A.; Makmur, E.; Sulystyo, E.; Peyrillé, P.; et al. Equatorial waves triggering extreme rainfall and floods in southwest Sulawesi, Indonesia. Mon. Weather Rev. 2021, 149, 1381–1401. [Google Scholar] [CrossRef]
- Peatman, S.C.; Schwendike, J.; Birch, C.E.; Marsham, J.H.; Matthews, A.J.; Yang, G.Y. A local-to-large scale view of Maritime Continent rainfall: Control by ENSO, MJO and equatorial waves. J. Clim. 2021, 34, 8933–8953. [Google Scholar] [CrossRef]
- Feng, T.; Yang, X.Q.; Yu, J.Y.; Huang, R. Convective Coupling in Tropical-Depression-Type Waves. Part I: Rainfall Characteristics and Moisture Structure. J. Atmos. Sci. 2020, 77, 3407–3422. [Google Scholar] [CrossRef]
- Hersbach, H.; Bell, B.; Berrisford, P.; Hirahara, S.; Horányi, A.; Muñoz-Sabater, J.; Nicolas, J.; Peubey, C.; Radu, R.; Schepers, D.; et al. The ERA5 global reanalysis. Q. J. R. Meteorol. Soc. 2020, 146, 1999–2049. [Google Scholar] [CrossRef]
- Bessho, K.; Date, K.; Hayashi, M.; Ikeda, A.; Imai, T.; Inoue, H.; Kumagai, Y.; Miyakawa, T.; Murata, H.; Ohno, T.; et al. An Introduction to Himawari-8/9— Japan’s New-Generation Geostationary Meteorological Satellites. J. Meteorol. Soc. Jpn. Ser. II 2016, 94, 151–183. [Google Scholar] [CrossRef]
- Huang, B.; Liu, C.; Banzon, V.; Freeman, E.; Graham, G.; Hankins, B.; Smith, T.; Zhang, H.-M. Improvements of the Daily Optimum Interpolation Sea Surface Temperature (DOISST) Version 2.1. J. Clim. 2021, 34, 2923–2939. [Google Scholar] [CrossRef]
- Whitehall, K.; Mattmann, C.A.; Jenkins, G.; Rwebangira, M.; Demoz, B.; Waliser, D.; Kim, J.; Goodale, C.; Hart, A.; Ramirez, P.; et al. Exploring a graph theory based algorithm for automated identification and characterization of large mesoscale convective systems in satellite datasets. Earth Sci. Inform. 2015, 8, 663–675. [Google Scholar] [CrossRef]
- Putri, N.S.; Hayasaka, T.; Whitehall, K.D. The Properties of Mesoscale Convective Systems in Indonesia Detected Using the Grab ‘Em Tag ‘Em Graph ‘Em (GTG) Algorithm. J. Meteorol. Soc. Jpn. Ser. II 2017, 95, 391–409. [Google Scholar] [CrossRef][Green Version]
- Nuryanto, D.E.; Pawitan, H.; Hidayat, R.; Aldrian, E. Characteristics of two mesoscale convective systems (MCSs) over the Greater Jakarta: Case of heavy rainfall period 15–18 January 2013. Geosci. Lett. 2019, 6, 1. [Google Scholar] [CrossRef]
- Chock, D.P.; Winkler, S.L. A particle grid air quality modeling approach: 2. Coupling with chemistry. J. Geophys. Res. 1994, 99, 1033–1041. [Google Scholar] [CrossRef]
- Stein, A.F.; Draxler, R.R.; Rolph, G.D.; Stunder, B.J.B.; Cohen, M.D.; Ngan, F. NOAA’s HYSPLIT Atmospheric Transport and Dispersion Modeling System. Bull. Am. Meteorol. Soc. 2015, 96, 2059–2077. [Google Scholar] [CrossRef]
- Draxler, R.R.; Hess, G.D. An overview of the HYSPLIT_4 modelling system for trajectories, dispersion, and deposition. Aust. Meteorol. Mag. 1998, 47, 295–308. [Google Scholar]
- van Zomeren, J.; van Delden, A. Vertically integrated moisture flux convergence as a predictor of thunderstorms. Atmos. Res. 2007, 83, 435–445. [Google Scholar] [CrossRef]
- Hattori, M.; Mori, S.; Matsumoto, J. The Cross-Equatorial Northerly Surge over the Maritime Continent and Its Relationship to Precipitation Patterns. J. Meteorol. Soc. Jpn. 2011, 89A, 27–47. [Google Scholar] [CrossRef]
- Schumacher, R.S.; Johnson, R.H. Synoptic disturbances over the equatorial South China Sea and western maritime continent during boreal winter. Mon. Weather Rev. 2005, 133, 489–503. [Google Scholar]
- Song, F.; Feng, Z.; Leung, L.R.; Pokharel, B.; Wang, S.Y.S.; Chen, X.; Sakaguchi, K.; Wang, C.C. Crucial Roles of Eastward Propagating Environments in the Summer MCS Initiation Over the U.S. Great Plains. J. Geophys. Res. Atmos. 2021, 126, e2021JD034991. [Google Scholar] [CrossRef]
- Hu, H.; Leung, L.R.; Feng, Z. Early warm-season mesoscale convective systems dominate soil moisture precipitation feedback for summer rainfall in central United States. Proc. Natl. Acad. Sci. USA 2021, 118, e2105260118. [Google Scholar] [CrossRef]
- Saufina, E.; Trismidianto; Risyanto; Fathrio, I.; Harjupa, W. Impact of cross equatorial northerly surge (CENS) on Jakarta heavy rainfall and its interaction with tropical cyclone (Case study: 18-25 February 2020). AIP Conf. Proc. 2021, 2366, 050002. [Google Scholar] [CrossRef]
- Hamada, J.I.; Mori, S.; Kubota, H.; Yamanaka, M.D.; Haryoko, U.; Lestari, S.; Sulistyowati, R.; Syamsudin, F. Interannual Rainfall Variability over Northwestern Jawa and its Relation to the Indian Ocean Dipole and El Niño-Southern Oscillation Events. SOLA 2012, 8, 69–72. [Google Scholar] [CrossRef]
- Muhammad, F.R.; Lubis, S.W.; Tiarni, I.; Setiawan, S. Influence of the Indian Ocean Dipole (IOD) on Convectively Coupled Kelvin and Mixed Rossby-Gravity Waves. IOP Conf. Ser. Earth Environ. Sci. 2019, 284, 012012. [Google Scholar] [CrossRef]
- Baranowski, D.B.; Flatau, M.K.; Flatau, P.J.; Karnawati, D.; Barabasz, K.; Labuz, M.; Latos, B.; Schmidt, J.M.; Paski, J.A.I.; Marzuki. Social-media and newspaper reports reveal large-scale meteorological drivers of floods on Sumatra. Nat. Commun. 2020, 11, 2503. [Google Scholar] [CrossRef]
Publisher’s Note: MDPI stays neutral with regard to jurisdictional claims in published maps and institutional affiliations. |
© 2022 by the authors. Licensee MDPI, Basel, Switzerland. This article is an open access article distributed under the terms and conditions of the Creative Commons Attribution (CC BY) license (https://creativecommons.org/licenses/by/4.0/).