Article

Spatiotemporal Changes in Precipitation during the Summer Maize Growing Season in the North China Plain and Analysis of Its Causes

1
National Institute of Natural Hazards, Ministry of Emergency Management of China, Beijing 100085, China
2
General Institute of Water Resources and Hydropower Planning and Design, Ministry of Water Resources, Beijing 100120, China
3
Zhejiang Design Institute of Water Conservancy and Hydroelectric Power (ZDWP), Hangzhou 310002, China
*
Author to whom correspondence should be addressed.
Atmosphere 2022, 13(8), 1288; https://doi.org/10.3390/atmos13081288
Submission received: 25 July 2022 / Revised: 8 August 2022 / Accepted: 12 August 2022 / Published: 13 August 2022
(This article belongs to the Special Issue Characteristics and Attribution of Extreme Rainfall Events)

Abstract

:
The North China Plain is an important summer maize production region in China. Investigating spatiotemporal variation patterns of precipitation during the summer maize growing season will guide the prevention of droughts and floods and ensure food production. Daily precipitation data during the summer maize growing season in the North China Plain from 1960–2020 were used to analyze spatiotemporal changes in precipitation, examine the migration patterns of precipitation barycenters, and quantitatively analyze the effects of ENSO (El Niño-Southern Oscillation) warm and cold events on precipitation variation characteristics. Results revealed that in the past 61 years, precipitation showed an insignificant decreasing trend; however, there were considerable differences detected in the spatial distribution layouts of precipitation between different developmental stages. The precipitation distribution layout during the sowing–jointing stage was mainly “North–South”, the zero contour was near 36° N, and the other developmental stages were mainly “global” with phases that were the opposite of one another. Moreover, the precipitation barycenter during the jointing–flowering stage showed a significant southward migration. Precipitation during the three developmental stages negatively correlated with warm events, precipitation during the flowering–maturation stage positively correlated with cold events, the relationship between precipitation changes during warm and cold events and the intensity of warm and cold events was not significant, and Pacific Decadal Oscillation (PDO) was the main climatic factor that affected precipitation changes during the summer maize-growing season in the North China Plain.

1. Introduction

The Sixth Assessment Report of the Intergovernmental Panel on Climate Change (IPCC AR6) predicts that the rate of global warming will accelerate and the magnitude of increasing global temperatures is expected to reach or exceed 1.5 °C. In this scenario, global water cycle changes will accelerate in the future, resulting in stronger precipitation, floods, increased evapotranspiration, and more severe droughts [1,2,3]. Precipitation is an important part of the hydrologic cycle and understanding its spatiotemporal characteristics has far-reaching importance, particularly in countries that rely on rainfed agriculture. Frich et al. [4] used global daily precipitation indicators to investigate its variation through a model and found that the effects of extreme climate on precipitation in most regions during the second half of the 20th century were becoming more intense with more frequent heavy rainfall events. New et al. [5] analyzed the daily precipitation data of 14 countries throughout southern and western Africa from 1961–2000 and found that the mean precipitation intensity and drought duration showed significant increasing trends and extreme precipitation indicators, including the maximum annual five-day and one-day rainfall, also showed increasing trends. In China, changes in precipitation are important climatic factors that affect surface water resources and social development. Wang et al. [6] at the National Institute of Natural Hazards, Ministry of Emergency Management of China found that precipitation changes in China are complex and detected large differences among regions between eastern and western China, which showed opposite trends. Ren et al. [7] comprehensively summarized long-term precipitation pattern variations in modern China and found that the changes were not significant, but there were significant spatial differences. Precipitation in the southern parts of northeast, northern, and southwest China showed decreasing trends, while precipitation in the southeastern coastal regions, lower reaches of the Yangtze River, and northwest China showed significant increasing trends. Yao et al. [8] employed a dynamic Thiessen polygon model to analyze the spatiotemporal distribution of precipitation in China on different time scales. Results showed that the precipitation in China in recent years showed a southward migration trend at the 600 mm contour in the Bohai Bay and areas west of longitude 100° showed an increasing trend.
The North China Plain is located in eastern China. It has a warm temperate monsoon climate, rainfall and heat occur during the same period, and it is an important maize-producing area. Due to the effects of climate change, precipitation in the North China Plain has showed a decreasing trend and increased spatiotemporal variation. Large amounts of groundwater have been used for irrigation to maintain stable agricultural production, which has resulted in decreased groundwater levels, further worsening the arid situation of that region [9,10,11]. Maize is a typical thermophilic crop that consumes large amounts of water. The entire life cycle of maize has high temperature and precipitation requirements [12,13]. Therefore, the occurrence of droughts and floods will inevitably affect maize growth and development, thereby affecting crop yields and economic losses. Thus, there is an urgent need to understand spatiotemporal changes in precipitation under future climate change scenarios and its underlying mechanism to ensure food security in the North China Plain. Precipitation barycenters can reveal the distribution characteristics of regional precipitation and the dynamic trajectories reflect precipitation dispersion, transfer, and dominance distribution. Only a few studies have investigated the precipitation barycenter migration trajectories in the North China Plain; thus, our understanding of the main influencing factors is lacking [14,15]. In this study, the daily precipitation data during the summer maize growing season in the North China Plain from 1960 to 2020 were used to analyze the spatiotemporal evolution characteristics of precipitation. We examine the migration patterns of precipitation barycenters and quantitatively analyze the effects of ENSO (El Niño–Southern Oscillation) warm and cold events on precipitation variation characteristics. Our findings will serve as an important reference for North China Plain water resource planning and management to prevent floods and droughts.

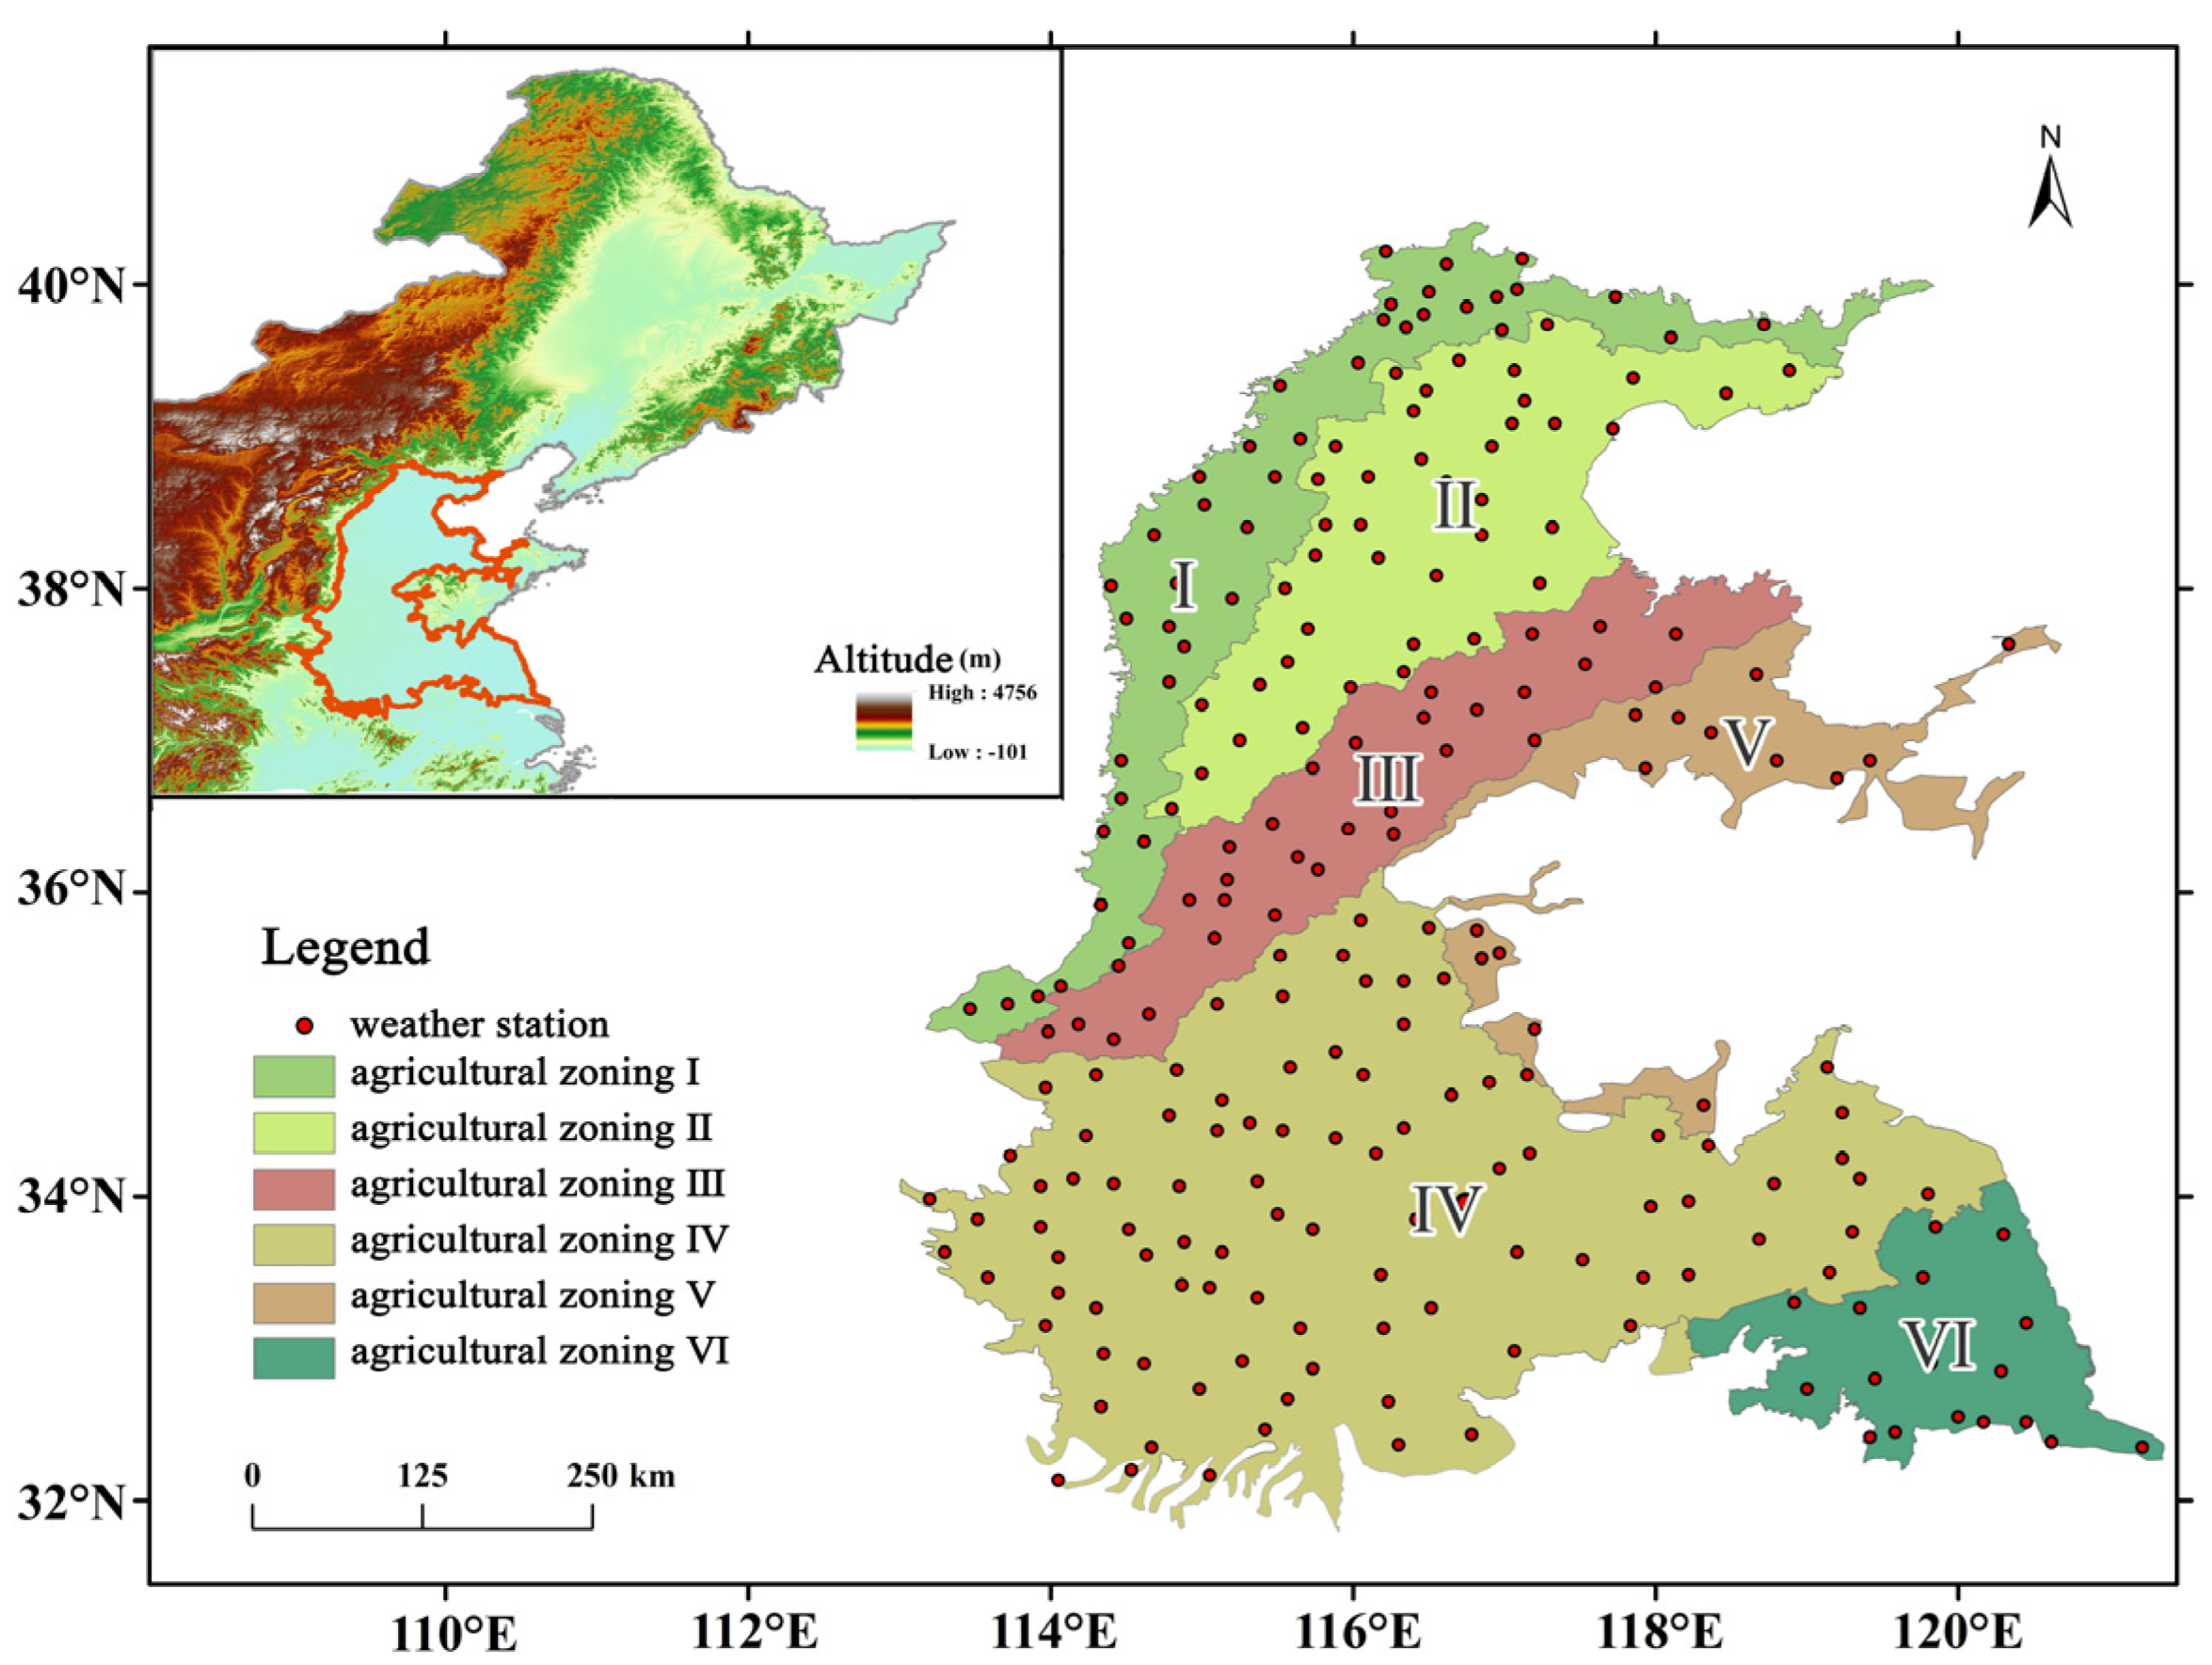
2. Overview of the Study Area

The North China Plain (31–43° N, 110–123° E) is connected to the southern part of the Yan Mountains in the north, the Huai River in the south, the Taihang and Funiu Mountains in the west, and Bohai and Yellow Sea in the east. The North China Plain contains the Beijing, Tianjin, Hebei, Shandong, Henan, Jiangsu, and Anhui provinces. The area has a warm temperate continental monsoon climate. Due to the effects of the monsoon, the winters are frigid and dry, while the summers are hot and rainy. There is sufficient sunshine with an annual sunshine duration of 2800 h. The annual mean precipitation ranges from 500 to 900 mm and rainfall is mostly concentrated from the end of June to early September [16]. Rainfall and heat occur during the same period. The natural conditions are extremely favorable for maize growth and development; thus, this area is a primary maize cultivation area and the maize irrigation accounts for >50% of the area [9,17]. The North China Plain is a region in China with the most severe water deficiency and the water resources per capita comprise 1/6 of the country’s resources [18]. Accordingly, the groundwater has been severely overexploited, which has resulted in the largest groundwater funnel area in the world [19,20]. As an important winter wheat and summer maize producing area of China, precipitation in the North China Plain is of great concern for agricultural development and food security. Frequent droughts and floods severely limit the utilization of resource advantages in this region. Figure 1 shows the distribution of meteorological stations and agricultural regions [21,22,23] in the North China Plain.

3. Data and Methods

3.1. Data Sources

The daily precipitation data of 238 meteorological stations in the North China Plain from 1960–2020 were selected for this study. The data were obtained from the “Monthly Surface Meteorological Record Report” and underwent preliminary quality control by the National Meteorological Center. The data had good quality. Five climatic factors, including Arctic Oscillation (AO), Pacific Decadal Oscillation (PDO), North Atlantic Oscillation (NAO), Southern Oscillation Index (SOI), and Oceanic Niño Index (ONI) were obtained from the US National Oceanic and Atmospheric Administration (NOAA) official website.

3.2. Determination of the Summer Maize Growing Season

The main growing season of summer maize in the North China Plain was obtained by referencing crop growth and development with the field soil moisture 10-day value dataset obtained from the China Meteorological Data Service Center. The North China Plain was divided into six regions based on agricultural cropping region grades. In this study, summer maize cultivation characteristics and temperature required for growth and development were used to divide the developmental stages of summer maize into three stages: the sowing–jointing, jointing–flowering, and flowering–maturation stages. Table 1 shows the mean growing season period of summer maize in the North China Plain over time.

3.3. Study Methods

3.3.1. Mann–Kendall Trend Test

The Mann–Kendall (M-K) trend test is a non-parametric statistical method that does not need to consider sample distribution patterns or the presence of outliers. It is suitable for testing non-normally distributed data, such as hydrological and meteorological data [24]. The specific calculation formula is as follows:
s = i = 1 n j = 1 i 1 sign ( x i x j )
s i g n ( x i x j ) = { 1   ( x i x j ) < 0 0 ( x i x j ) = 0 1 ( x i x j ) > 0
Z = { ( s 1 ) / n ( n 1 ) ( 2 n + 5 ) / 18 S > 0 0       S = 0 ( s + 1 ) / n ( n 1 ) ( 2 n + 5 ) / 18 S < 0
where Z > 0 indicates that the sample data exhibited an increasing trend and Z < 0 indicates a decreasing trend. If | Z | was >1.28, 1.64, and 2.32, then the sample passed significance testing with 90%, 95%, and 99% confidence, respectively.

3.3.2. Precipitation Barycenter

The barycenter refers to the point where the resultant force of the gravitational force of each fulcrum passes through an object in any orientation. The concept of the barycenter was expanded to regions (i.e., regional barycenters, also known as the spatial mean), which helps with analyzing the developmental history, status, and trends of regional elements and reflects the mobility and aggregation of regional elements in space. Regional barycenters are obtained through the calculation of barycenter models [14], as follows:
X ¯ = i = 1 n X i P i i = 1 n P i ,     Y ¯ = i = 1 n Y i P i i = 1 n P i  
where X ¯ and Y ¯ represent the longitude and latitude coordinates of the annual precipitation barycenters, respectively, X i and Y i represent the longitude and latitude coordinates of the ith meteorological station, respectively, P i is the annual precipitation of the ith meteorological station, and n is the total number of meteorological stations in the region.

4. Results and Discussion

4.1. Temporal Variation Characteristics of Precipitation

4.1.1. Precipitation Trend Analysis

The M-K trend test was used to analyze the variation trend of precipitation during the summer maize growing season in the North China Plain from 1960 to 2020 and significance testing was performed. The sowing–jointing stage was the developmental stage where precipitation was more concentrated, which ranged from 78.3–276.0 mm; the mean precipitation was 169.5 mm (Table 2). Over time, it can be seen that precipitation showed a stable trend during the sowing–jointing stage. Precipitation was the lowest during the jointing–flowering stage, which ranged from 27.8–184.7 mm; the mean precipitation was 108.8 mm. Precipitation showed a decreasing trend and the normally distributed M-K statistic was −1.08, which was not significant. Precipitation during the flowering–maturation stage was comparable to the jointing–flowering stage, ranging from 42.7–272.7 mm; the mean precipitation was 156.9 mm. Precipitation showed a slight decreasing trend and the normally distributed M-K statistic was −0.14, which was not significant.
Figure 2 shows the decadal mean precipitation during different developmental stages of summer maize in the North China Plain. Overall, precipitation during the jointing–flowering stage was the lowest of the three developmental stages across the six recent periods. In four continuous periods from the 1970s to 2000s, precipitation during the sowing–jointing stage was the highest of the three developmental stages. In the last 10 years, precipitation was the highest during the flowering–maturation stage. Moreover, during the sowing–jointing stage, precipitation showed an increasing trend from the 1980s to 2000s and peaked in the 2000s. Precipitation during the jointing–flowering stage was the highest in the 1970s, showed a decreasing trend from the 1970s to 1990s with a large reduction, and was the lowest in the 1990s out of the six recent decades. Precipitation during the flowering–maturation stage was the highest in the 1960s out of the six recent decades and subsequently showed a decreasing trend from the 1960s to 1990s. From 1990–2020, precipitation showed an increasing trend.

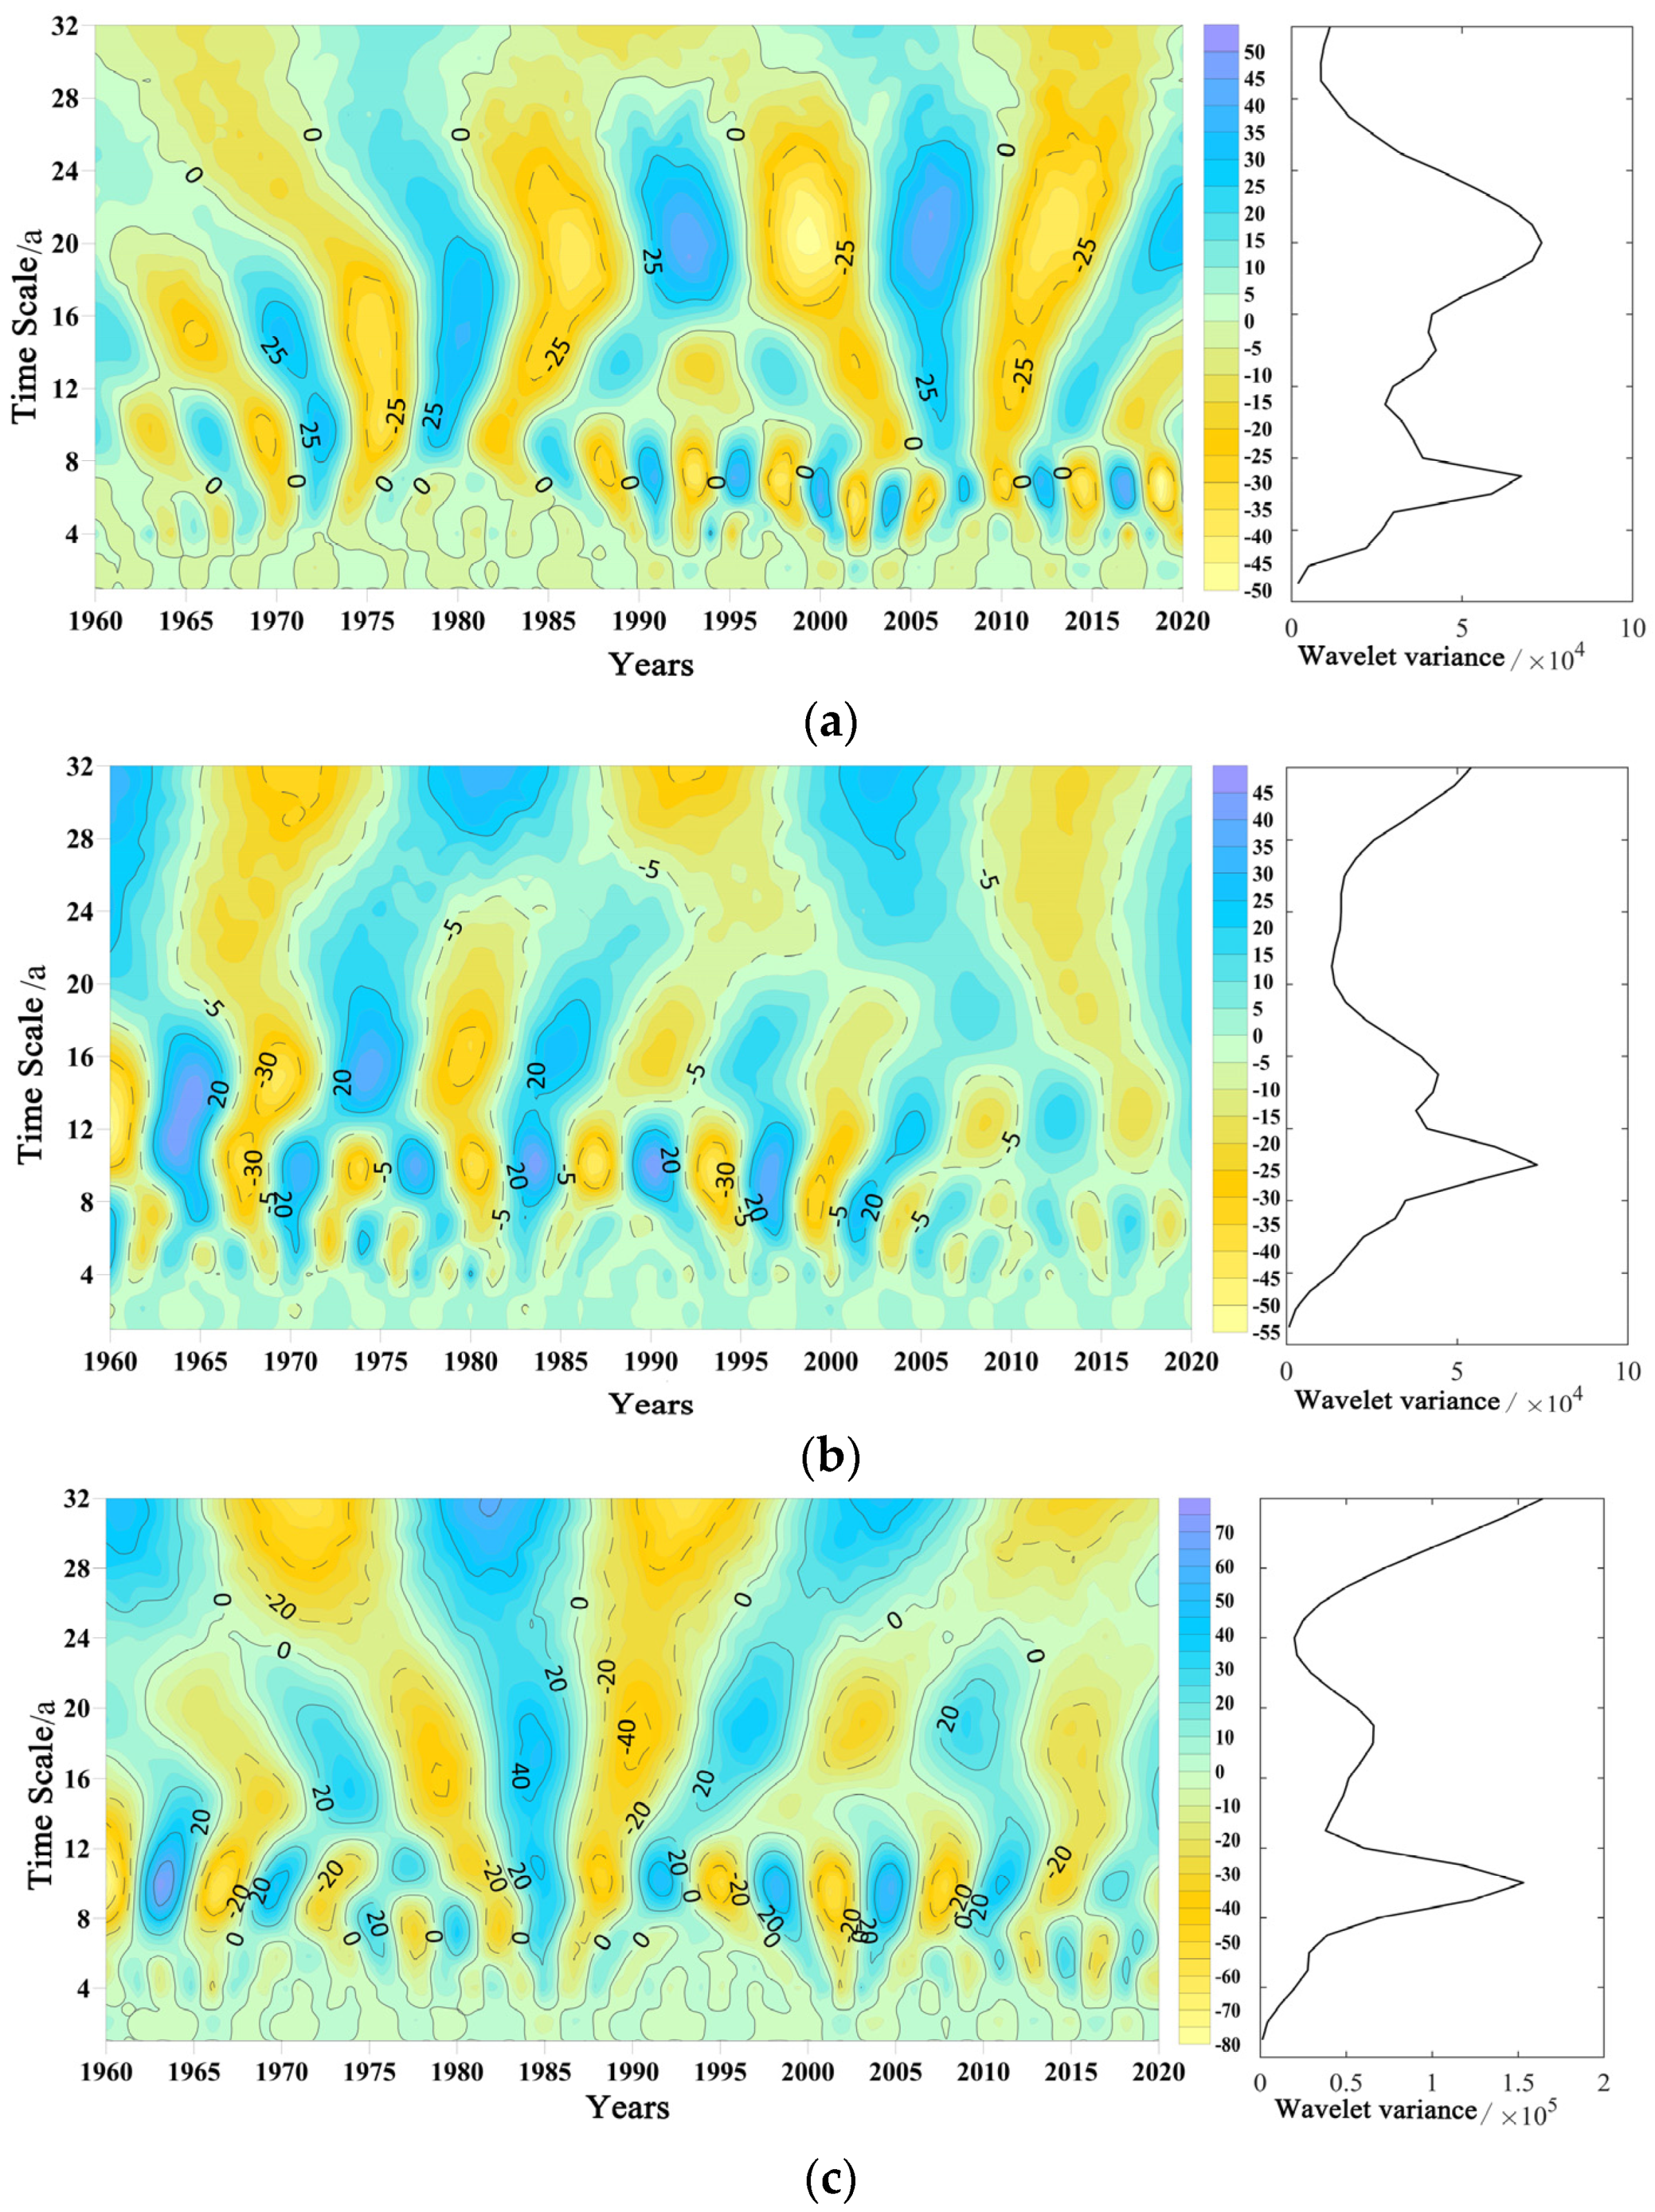
4.1.2. Precipitation Cyclicity Analysis

To filter the one-year natural cycle, the North China Plain summer maize-growing season precipitation data underwent pre-processing using the anomaly identification method before wavelet transformation [25]. Morlet wavelet analysis [26] was used to analyze the cyclicity characteristics of precipitation during the summer maize-growing season in the North China Plain (Figure 3; blue represents cycles with high rainfall and yellow represents cycles with low rainfall). The wavelet coefficient variance graph can be used to confirm the relative intensity of disturbances at various scales in a time series and the corresponding peak is the main time scale of the series. Precipitation during the summer maize growing season in the North China Plain showed dry–wet alternations and the precipitation anomaly series showed cyclical characteristics on multiple time scales. The precipitation anomaly series during the sowing–jointing stage showed significant cyclical changes at the 17–25a scale. After undergoing 2.5 dry–wet alternations, a significant peak was present at 20a in the wavelet variance graph of the precipitation anomaly series during the sowing–jointing stage, showing that fluctuations in the 20a cycle were the strongest, which was considered the first main cycle. This finding reflects the variation characteristics of precipitation during the summer maize sowing–jointing stage in the North China Plain across the entire time scale. Significant cyclical changes were present at the 8–12a and 13–18a scales in the precipitation anomaly series during the jointing–flowering stage, wherein three and four dry–wet alternations occurred, respectively. The first main cycle was at 10a. There were significant cyclical changes at the 8–12a and 15–22a scales in the precipitation anomaly series during the flowering–maturation stage, wherein 2.5 and three dry–wet alternations occurred, respectively. The first main cycle was at 10a.

4.2. Spatial Distribution Characteristics of Precipitation

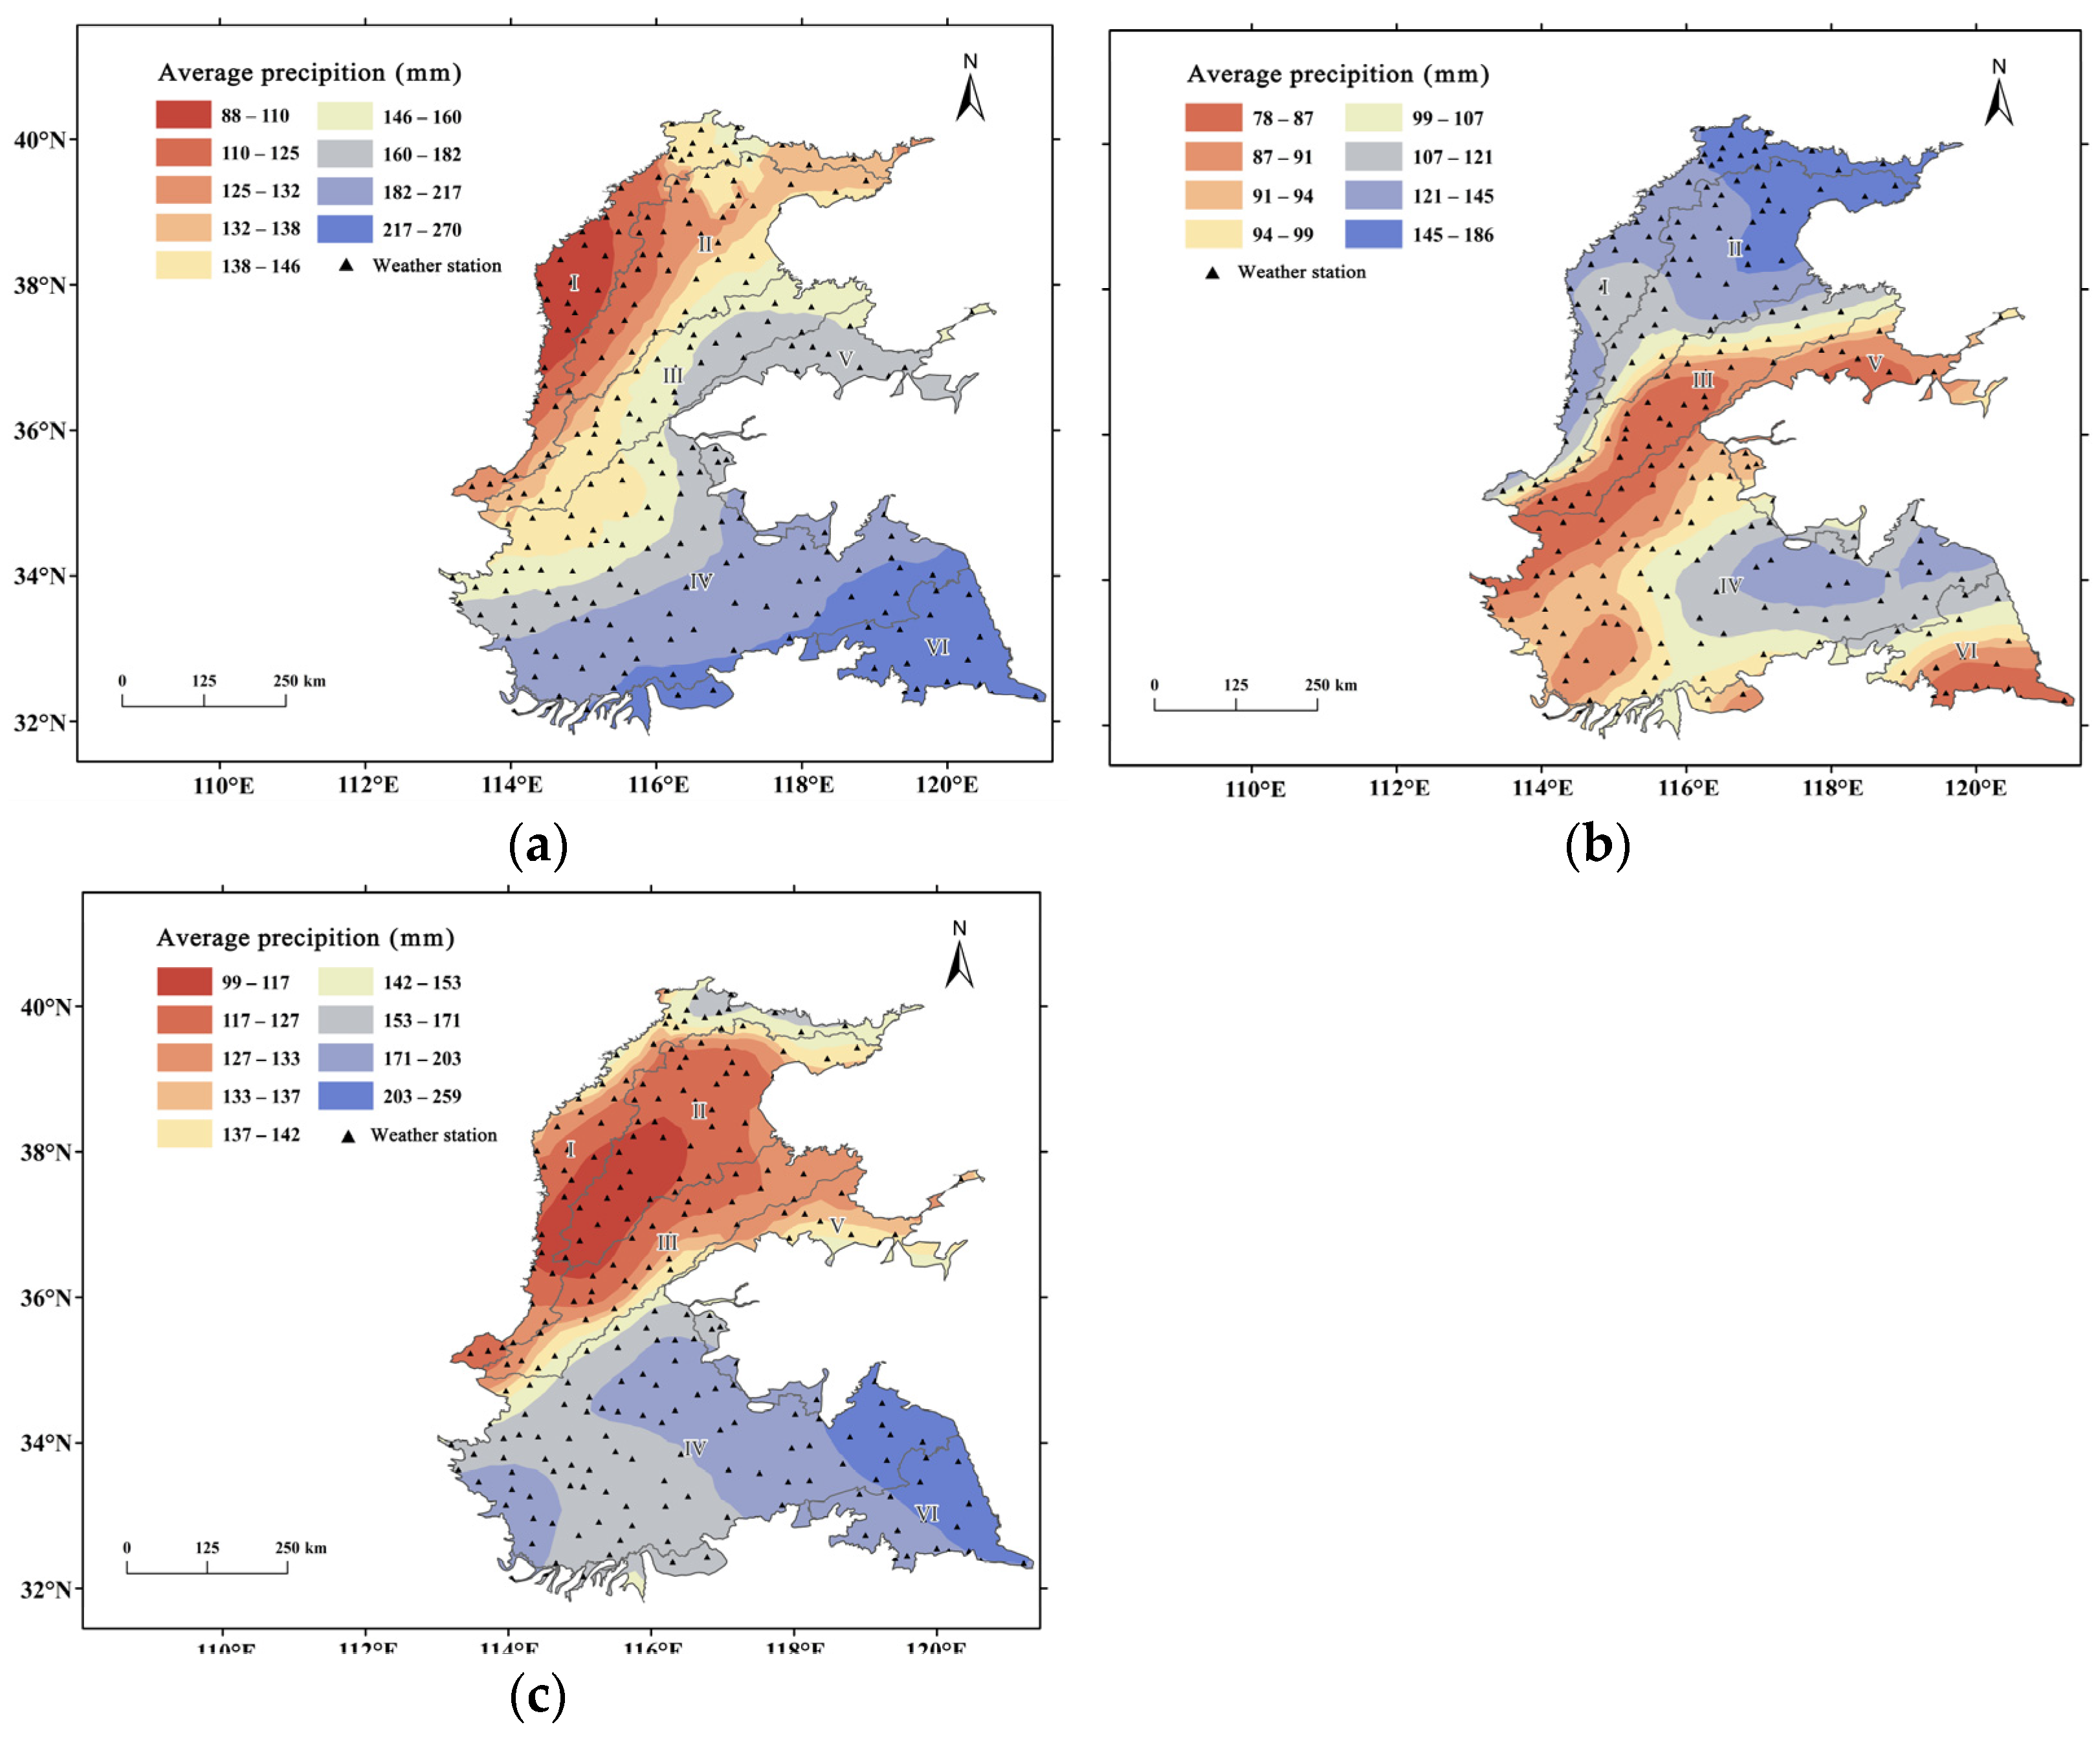
4.2.1. Spatial Distribution of Precipitation

The spatial distribution of precipitation during the sowing–jointing stage of summer maize in the North China Plain was not uniform, with more precipitation occurring in the southeast and less in the northwest (Figure 4a). Precipitation showed a banded decreasing distribution from the southeast to northwest and reflected the effects of the East Asian Monsoon. The high precipitation area during the sowing–jointing stage was mainly located in agricultural region VI and ranged from 217 to 270 mm. Precipitation at the Dafeng station in Jiangsu province was 256.3 mm, which was the highest during the sowing–jointing stage. The low precipitation area during the sowing–jointing stage was mainly located in agricultural region I and ranged from 88 to 110 mm. Precipitation at the Xinle station in Hebei province was 88.1 mm, which was the lowest during the sowing–jointing stage. The precipitation during the jointing–flowering stage showed a banded increasing distribution from the center to two sides (Figure 4b). Based on the agricultural regions, it can be seen that the precipitation in southeastern agricultural regions I, II, and IV was high, but low in northwestern agricultural regions III, V, and VI. The high precipitation area was mainly located in agricultural regions I and II of the northeast and ranged from 145 to 186 mm. Precipitation at the Tongzhou station in Beijing was 256.2 mm, which was the highest during the jointing–flowering stage. The low precipitation areas during the jointing–flowering stage were mainly located in agricultural regions III and V, which ranged from 78 to 87 mm. Precipitation at the Yuanyang station in Henan province was 64.7 mm, which was the lowest during the jointing–flowering stage. The precipitation during the flowering–maturation stage showed a south–north distribution (high precipitation in the south and low in the north) (Figure 4c). The high precipitation areas were mainly located in agricultural regions IV and VI in the east and ranged from 203 to 259 mm. Precipitation at the Binghai station in Jiangsu province was 233.6 mm, which was the highest during the flowering–maturation stage. The low precipitation areas were mainly located in agricultural regions I and II and ranged from 99 to 117 mm. Precipitation at the Feixiang station in Hebei province was 98.7 mm, which was the lowest during the flowering–maturation stage.

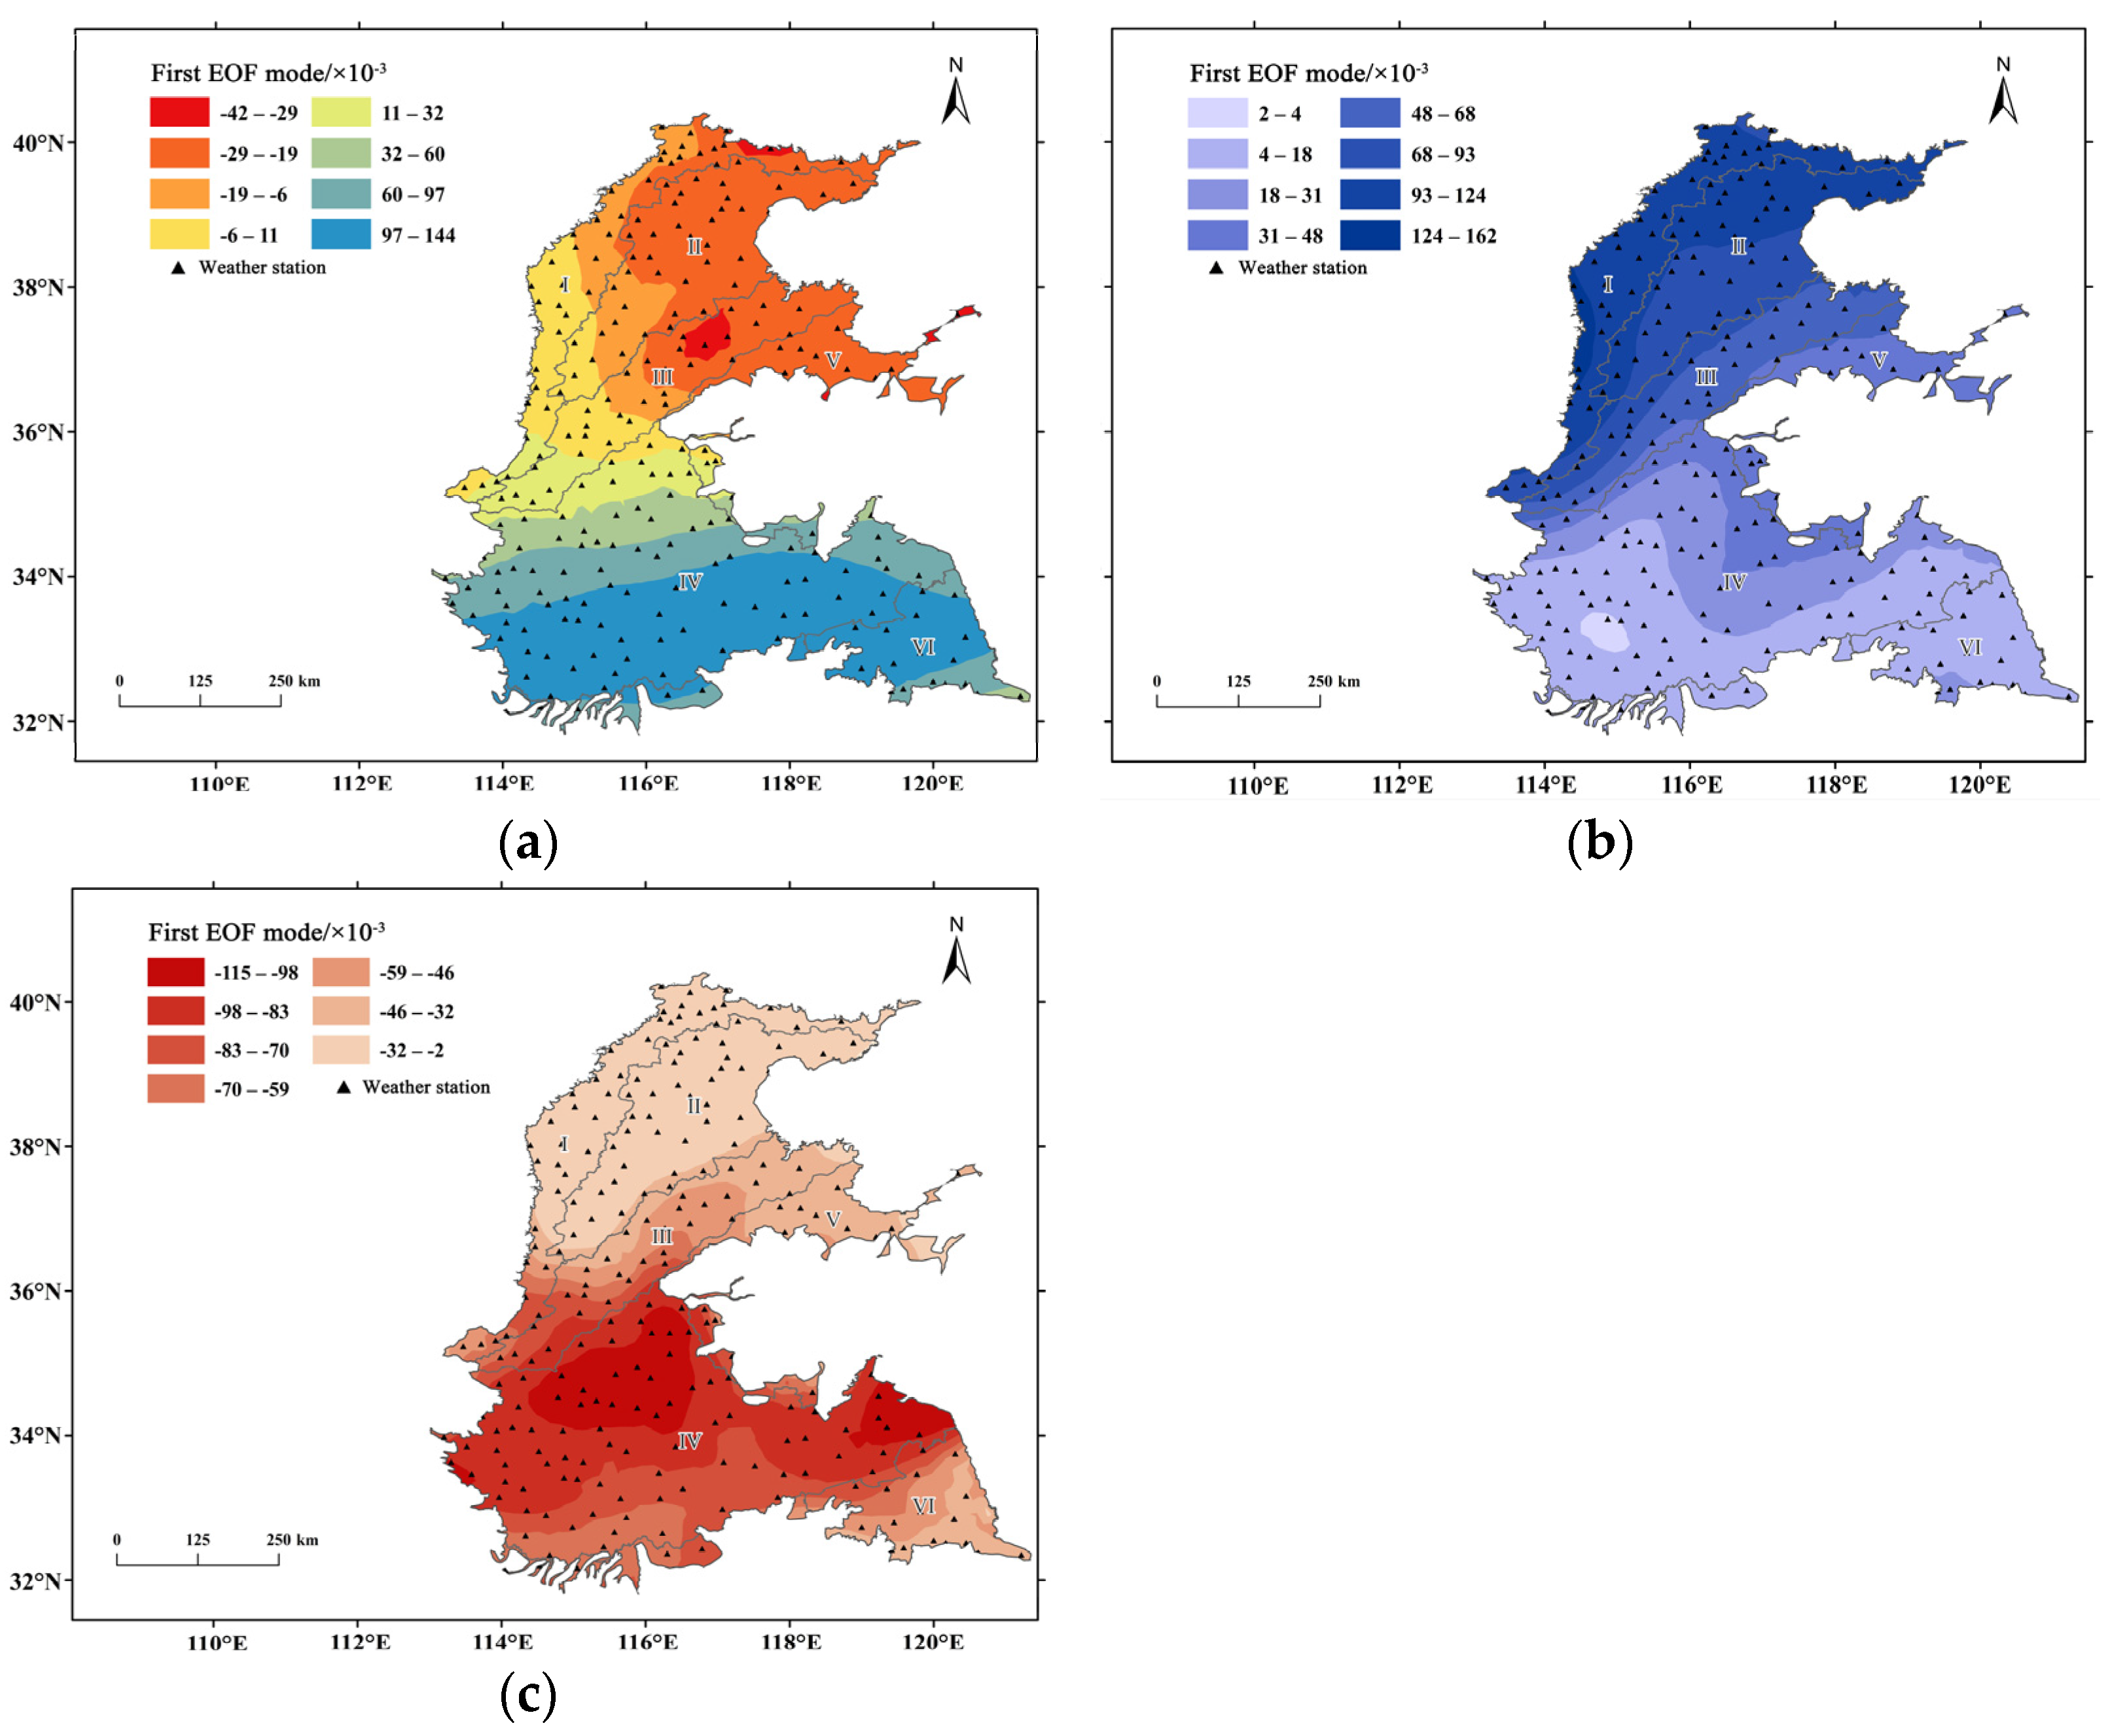
4.2.2. Precipitation Spatial Distribution Types

To further analyze the spatial distribution characteristics of precipitation during the summer maize-growing season in the North China Plain, EOF (Empirical Orthogonal Function) decomposition was conducted on precipitation anomalies (Table 3) [27]. The variance contribution of the first eigenvector was greater than other eigenvectors and had a deterministic mode. Therefore, the focused analysis was carried out on the distribution of the first eigenvector field, as it better reflected the main spatial distribution characteristics of precipitation. Figure 5 shows the EOF decomposition of the first mode spatial distribution during different summer maize development stages.
The precipitation characteristics during the sowing–jointing stage showed a south–north reverse distribution pattern, indicating that the spatial distribution had a “South–North pattern” (i.e., precipitation decreased in the north (increased) and increased (decreased) in the South) (Figure 5a). The zero contour was near 36° N. The positive high value areas of this pattern were mainly located in agricultural regions IV and VI, while negative high value areas were located in Dezhou of agricultural region III. A possible reason for this spatial distribution is that the North China Plain has a monsoon climate, which is coupled with the obstruction and elevating effects of mountain ranges. The prevailing wind during the winter is a northerly wind and tends to cause precipitation in southern regions. The South–North spatial distribution of precipitation changes in the North China Plain reflects the monsoon climate characteristics of that region to some extent. The spatial distribution of precipitation was consistently positive and exhibited same phase distribution, indicating that the spatial distribution of precipitation changes during the jointing–flowering stage had a “global” pattern (i.e., global high (low) precipitation distribution characteristic) (Figure 5b). Additionally, the precipitation during the jointing–flowering stage was largely affected by large-scale weather systems. The first mode spatial distribution of precipitation during the jointing–flowering stage was the reverse, consistently negative, and exhibited same phase distribution, indicating that the spatial distribution had a “global” pattern (i.e., global low (high) precipitation distribution characteristic) (Figure 5c). Additionally, when precipitation during the jointing–flowering stage has global high (low) rainfall, there will be global low (high) rainfall during the flowering–maturation stage.

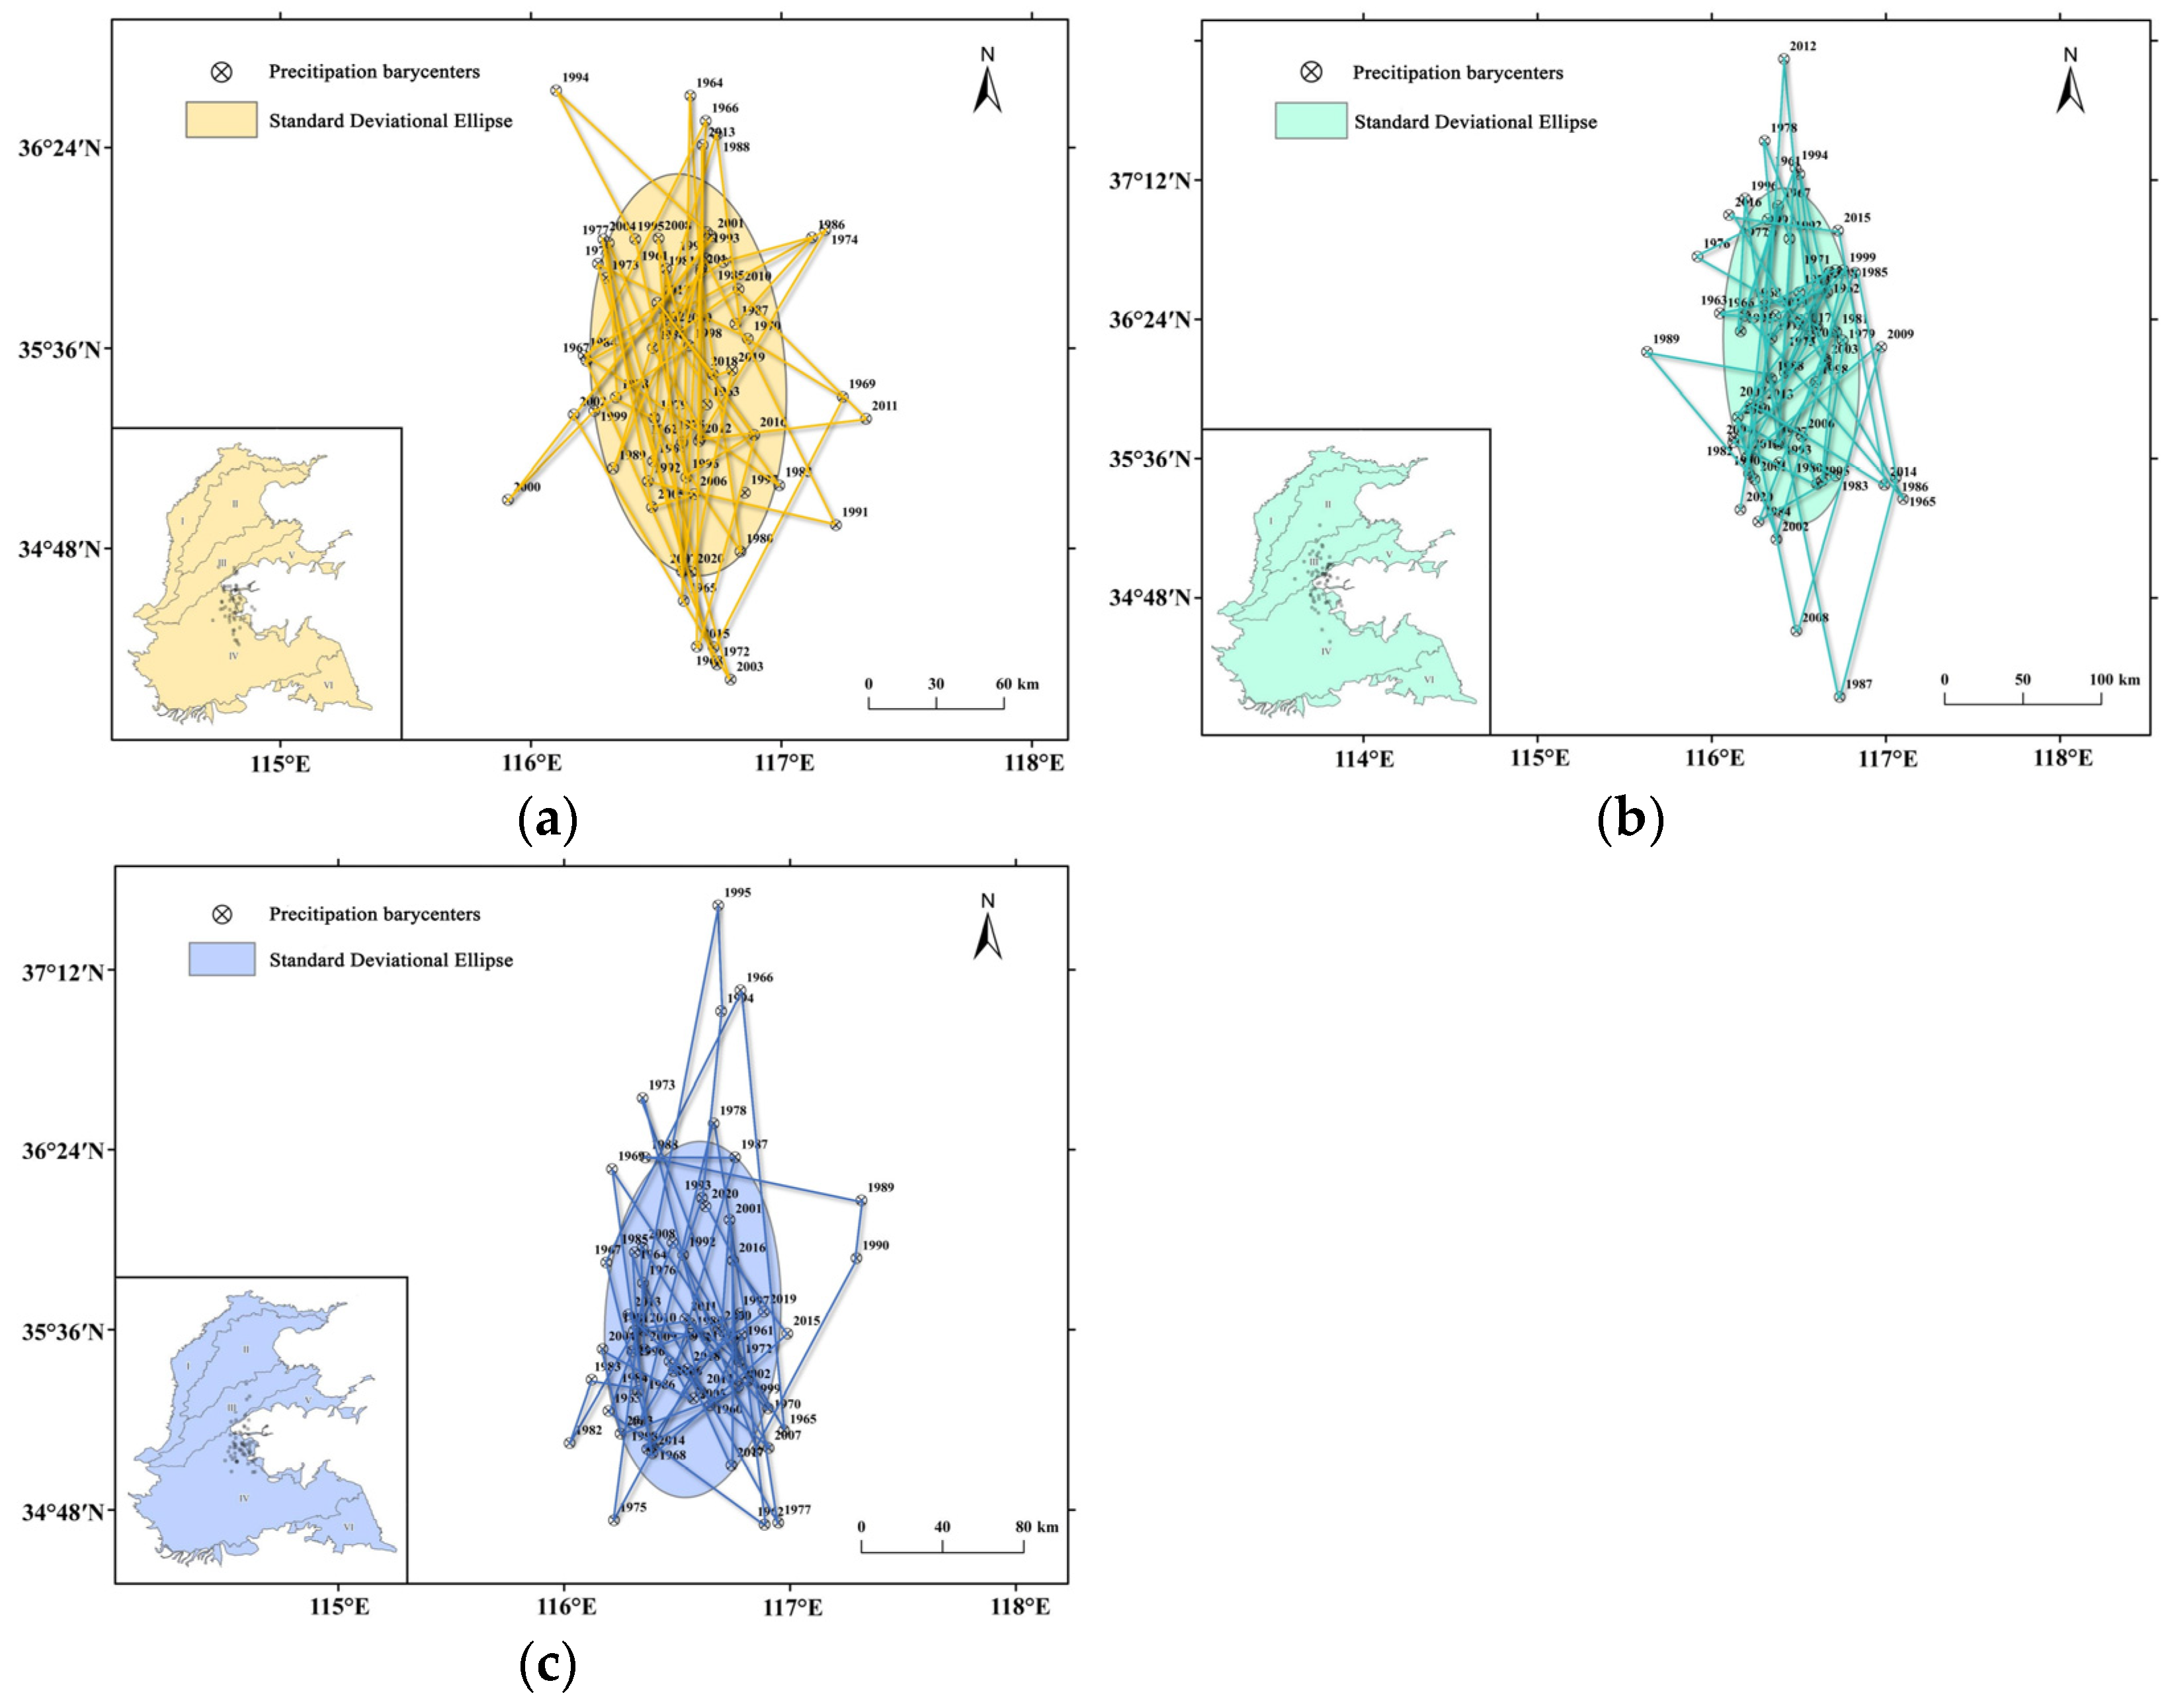
4.2.3. Precipitation Barycenter

The precipitation during the summer maize growing season in the North China Plain from 1960–2020 was used to calculate the coordinates of the precipitation barycenter. The precipitation barycenter migration trajectory was subsequently plotted (Figure 6). The precipitation barycenters during the sowing–jointing stage were mainly distributed in Jining and Tai’an of Shandong province, which are located to the east of the center of the North China Plain (Figure 6a). The ArcGIS standard deviation ellipse tool was used to create grade one standard deviation ellipses for 61 precipitation barycenters. The direction of the standard deviation ellipse was 3.94° west of north. The long axis was close to the south–north direction and the short axis was close to the east–west direction. The ellipse flattening was 0.61, indicating that the dispersion of the precipitation barycenter was low; the directionality was significant. Additionally, the fluctuation of the precipitation barycenter during the sowing–jointing stage was more significant in the south–north direction. From the preceding sections, it can be seen the precipitation barycenter during the sowing–jointing stage showed a pattern of more precipitation barycenters in the southeast and fewer in the northwest. Precipitation in the southern region ranged from 180–270 mm and accounted for a higher weightage. Moreover, the difference in south–north latitudes was great. Therefore, fluctuations of the North Asian Monsoon were greater, which may have caused the spatial distribution layout of precipitation barycenters to be in a South–North direction. From 1960–2020, the latitudes of the precipitation barycenters during the sowing–jointing stage showed an insignificant decreasing trend and the M-K statistic was −0.63. The longitudes of the precipitation barycenters showed an insignificant increasing trend and the M-K statistic was 0.59. From this, it can be seen that the precipitation barycenters during the sowing–jointing stage of summer maize in the North China Plain from 1960–2020 showed a southeast movement, but the overall trend was not significant.
The precipitation barycenters during the jointing–flowering stage were mainly distributed in Jining, Dezhou, and Liucheng of Shandong province, which was northwards when compared to the sowing–jointing stage (Figure 6b). The direction of the standard deviation ellipses during jointing–flowering stage was 3.04° west of north, which was identical to the spatial distribution layout of precipitation barycenters during the sowing–jointing stage, which showed a south–north distribution direction. From 1960–2020, the latitudes of the precipitation barycenters during the jointing–flowering stage showed a significant decreasing trend and the M-K statistic was −1.6. The longitudes of the precipitation barycenters showed an insignificant decreasing trend and the M-K statistic was −0.65. From this, it can be seen that the precipitation barycenters during the jointing–flowering stage of summer maize in the North China Plain from 1960–2020 showed a significant southward movement trend.
The precipitation barycenters during the flowering–maturation stage were also mainly distributed in Jining and Tai’an of Shandong province (Figure 6c). The direction of the standard deviation ellipses during the flowering–maturation stage was 3.16° east of north, which was identical to the two preceding developmental stages, which showed a south–north distribution direction. From 1960–2020, the latitudes of the precipitation barycenters during the flowering–maturation stage showed an insignificant increasing trend and the M-K statistic was 0.22. The longitudes of the precipitation barycenters showed an insignificant increasing trend and the M-K statistic was 0.49. From this, it can be seen that the precipitation barycenters during the flowering–maturation stage of summer maize in the North China Plain from 1960–2020 showed a northeast movement, but the overall trend was not significant.

4.3. Effects of Climate Change on Precipitation

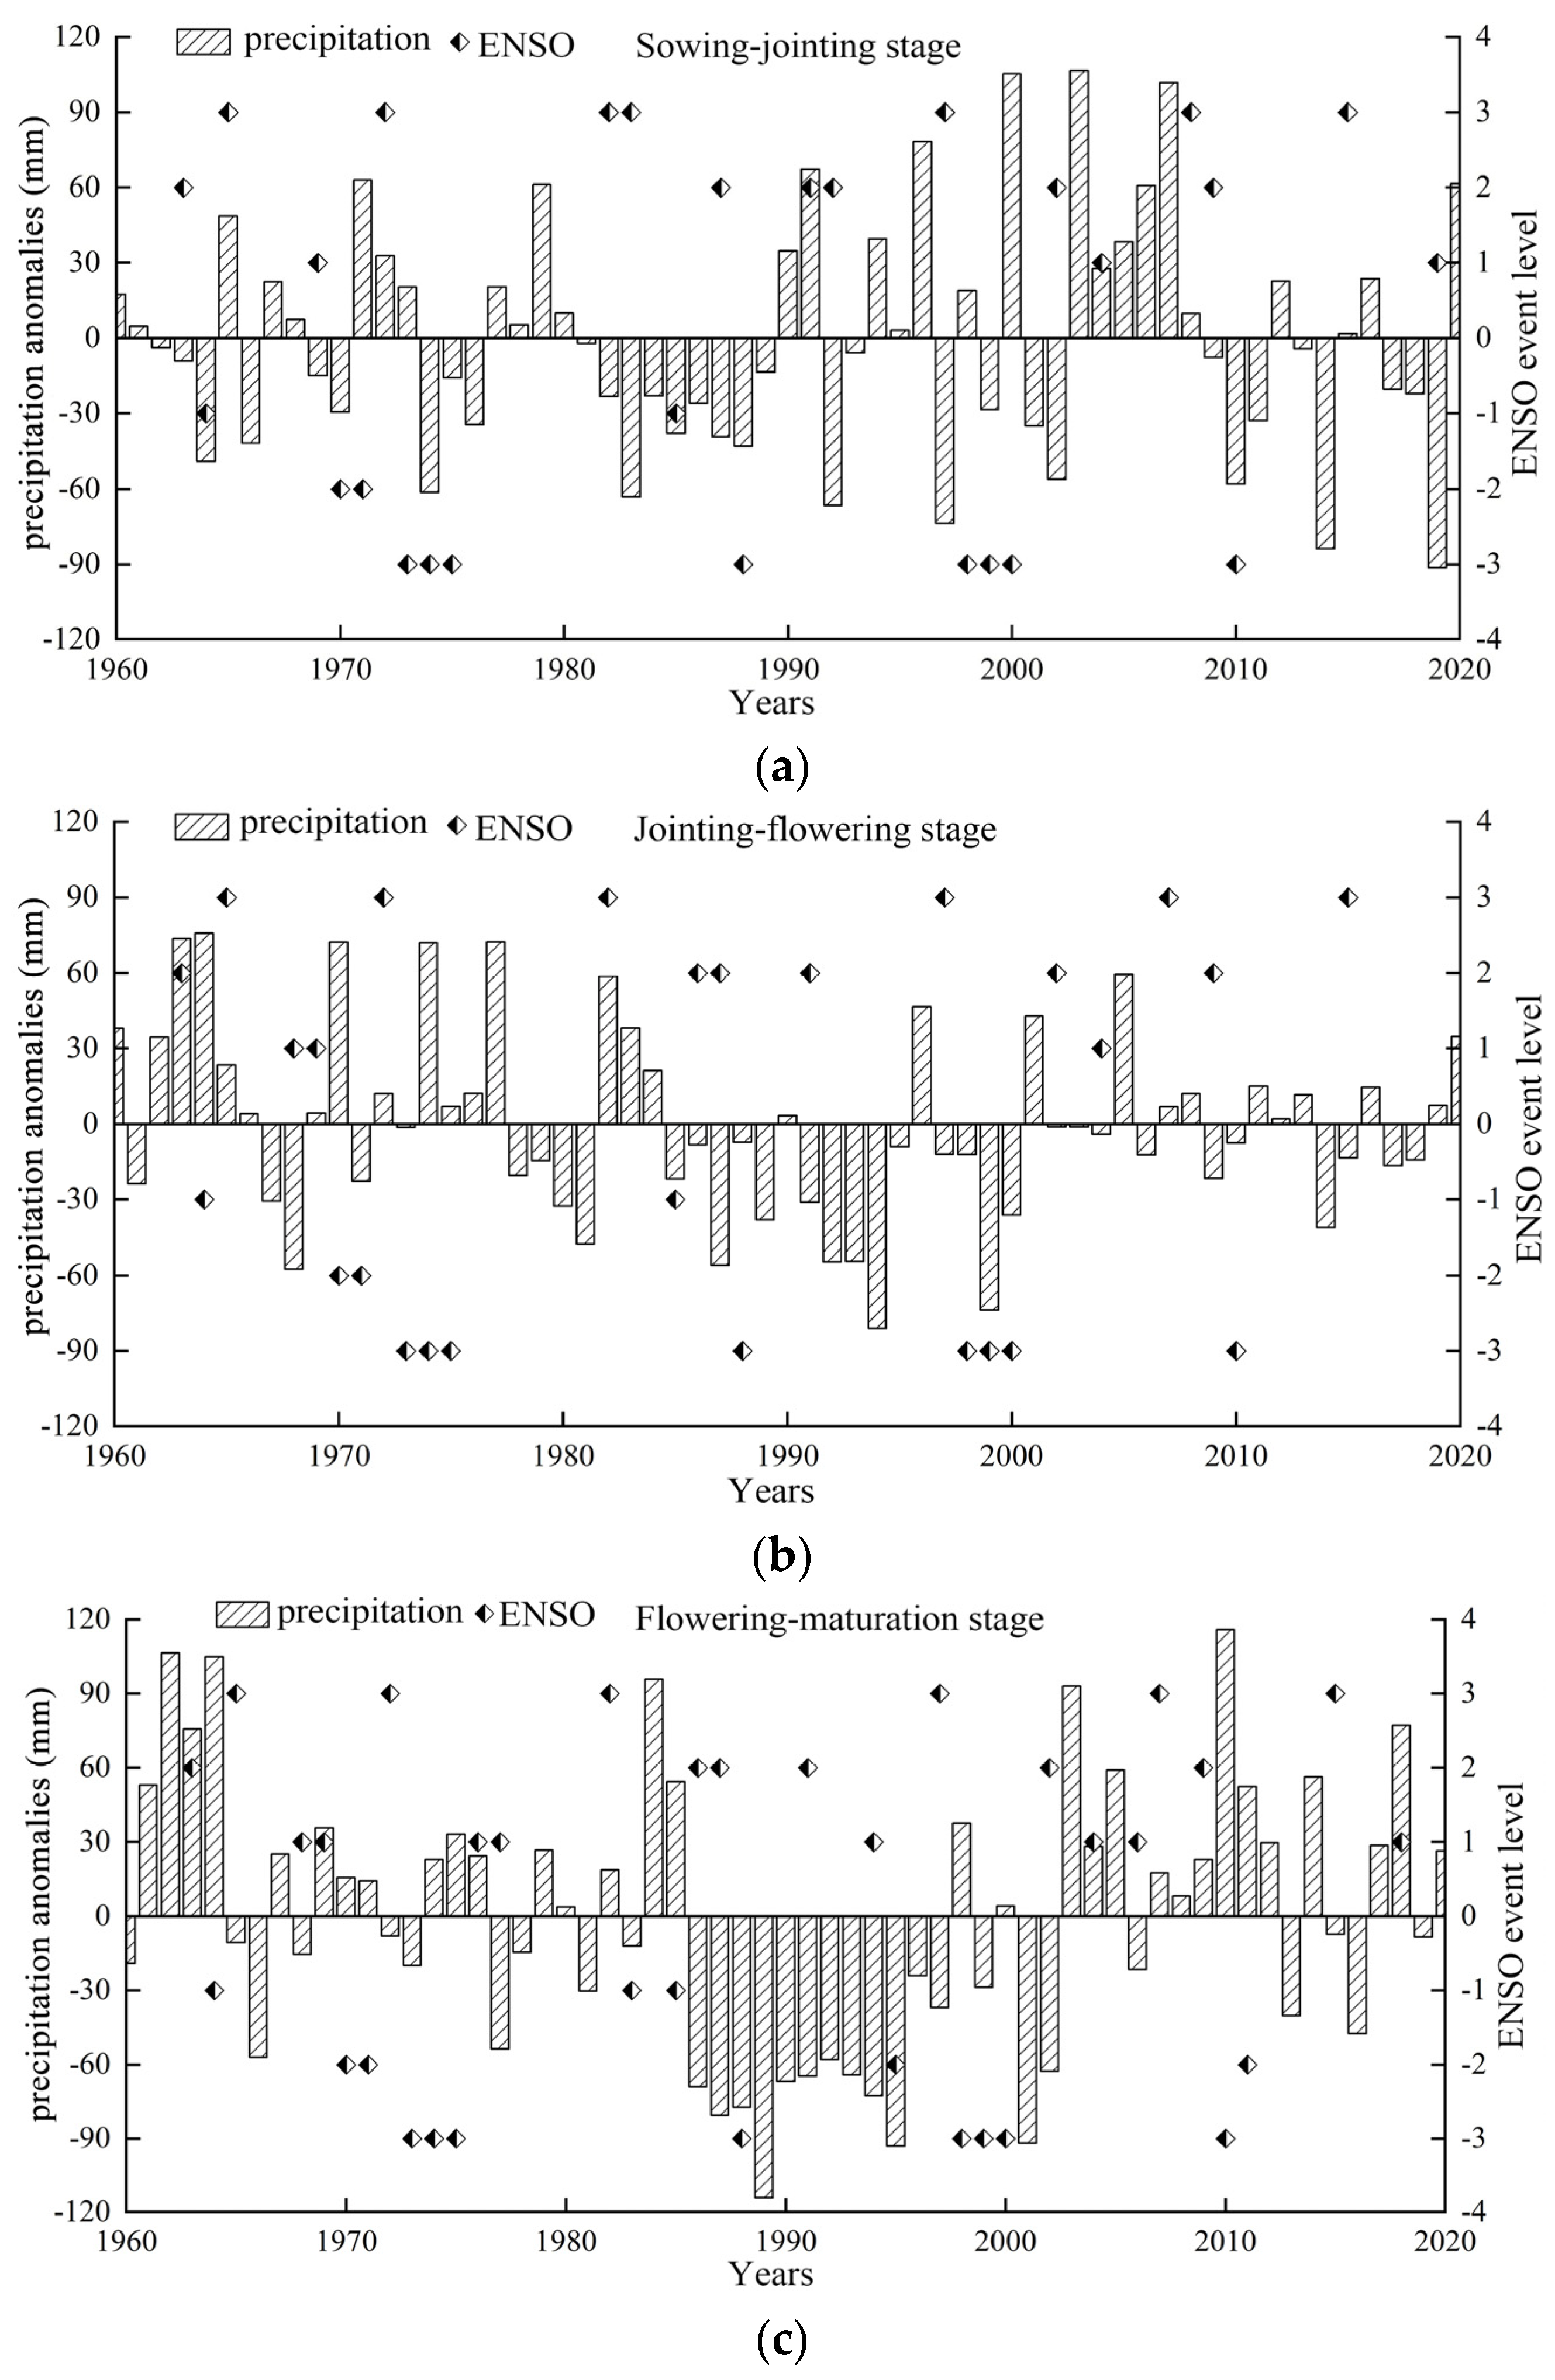
4.3.1. Effects of ENSO Warm and Cold Events on Precipitation

The precipitation during different summer maize developmental stages in the North China Plain from 1960–2020 was used to calculate precipitation anomalies during the growing season. The precipitation anomalies were linked to ENSO warm and cold events and used to plot a relationship map (Figure 7). Most precipitation anomalies during the sowing–jointing stage the year of or following ENSO warm events were negative. This was particularly the case during the 1980s and 1990s when six warm events occurred, which resulted in a drastic decrease in precipitation the year of or following the events. During the jointing–flowering stage, most precipitation anomalies the year of or following warm events were negative. Compared to the sowing–jointing stage, the effects of warm events on the jointing–flowering stage were broader. Since 1986, nine warm events occurred, resulting in eight instances of decreased precipitation the year of or following the events. Due to the effects of ENSO cold events, most precipitation anomalies during the jointing–flowering stage in the 1960s and 1970s were positive. However, when cold events occurred in the recent 40a, most precipitation anomalies were negative. This may be because more warm events occurred after the 1980s and there were lagging effects after the warm events [28]. Most precipitation anomalies during the flowering–maturation stage the year of or following warm events were negative, particularly from 1986–2002 when six warm events occurred, which resulted in a drastic decrease in precipitation for 10 consecutive years and had a huge effect on the growth and tillering of summer maize. Due to the effects of cold events, most precipitation anomalies during the jointing–flowering stage the year of or following the events were positive. This was particularly the case in 1964 and 2010 when precipitation showed a drastic increase. In summary, from 1960–2020, precipitation during the summer maize growing season in the North China Plain and ENSO events were related. The probability of reduced precipitation during the summer maize growing season the year of or following warm events was higher. When cold events occurred, the probability of increased precipitation during the flowering–maturation stage the year of or following these events was higher.
To further analyze the effects of ENSO warm and cold events on precipitation, we calculated the mean number of precipitation anomalies at every intensity level to study the relationship between different intensities of ENSO warm and cold events and the affected precipitation anomalies (Table 4). Due to the effects of warm events, the precipitation anomalies were generally negative, but due to the effects of cold events, the precipitation anomalies were generally positive, which was consistent with the conclusion obtained in the preceding text. Based on the grade of warm and cold events, the relationship between increase (decrease) in precipitation and the intensity of warm and cold events was not significant. Additionally, the significant negative anomaly values during the sowing–jointing and jointing–flowering stages under the effects of cold events revealed that weak cold events had significant effects on high precipitation and tended to be affected by the lagging effects of the previous warm event in the North China Plain.

4.3.2. Teleconnection between Climatic Factors and Precipitation Changes

The spatiotemporal evolution of the characteristics of precipitation are related to sea surface temperature. Climatic factors affect the atmospheric circulation system through “teleconnection”, thereby affecting floods and droughts in the North China Plain. To examine the link between precipitation variation characteristics and climatic factors during the summer maize-growing season in the North China Plain, we selected five climatic factors (AO, PDO, NAO, SOI, and ONI) and the Pearson correlation coefficient (Pearson correlation coefficient is widely used to analyze the correlation between two time series, which can quantitatively describe the degree of correlation between climate factors and drought indices) to analyze the teleconnection between climactic factors in the past 61 years and precipitation anomalies (Table 5). AO, PDO, and ONI highly correlated with precipitation anomalies during the sowing–jointing stage, which positively correlated with AO and negatively correlated with PDO, and the correlation between the three factors was weak (0.1–0.3) [29,30]. Among them, the correlation with PDO was the greatest and the correlation relationship was significant (p < 0.1). During the jointing–flowering stage, only PDO highly correlated with the precipitation anomalies, but it was a weak and insignificant negative correlation. During the flowering–maturation stage, PDO, SOI, and ONI highly correlated with precipitation anomalies, of which, PDO and ONI had weak negative correlations and PDO was significant (p < 0.1). SOI positively correlated with precipitation anomalies (0.3–0.5), which was significant (p < 0.1). In summary, the main climatic factors that affected precipitation during the three developmental stages of summer maize in the North China Plain were PDO, PDO and SOI, of which, PDO was negatively correlated and SOI was positively correlated with precipitation. Throughout the entire summer maize growing season in the North China Plain from 1960–2020, the correlation between precipitation and PDO was the strongest. The main factor that affected precipitation changes was PDO.

5. Conclusions

(1)
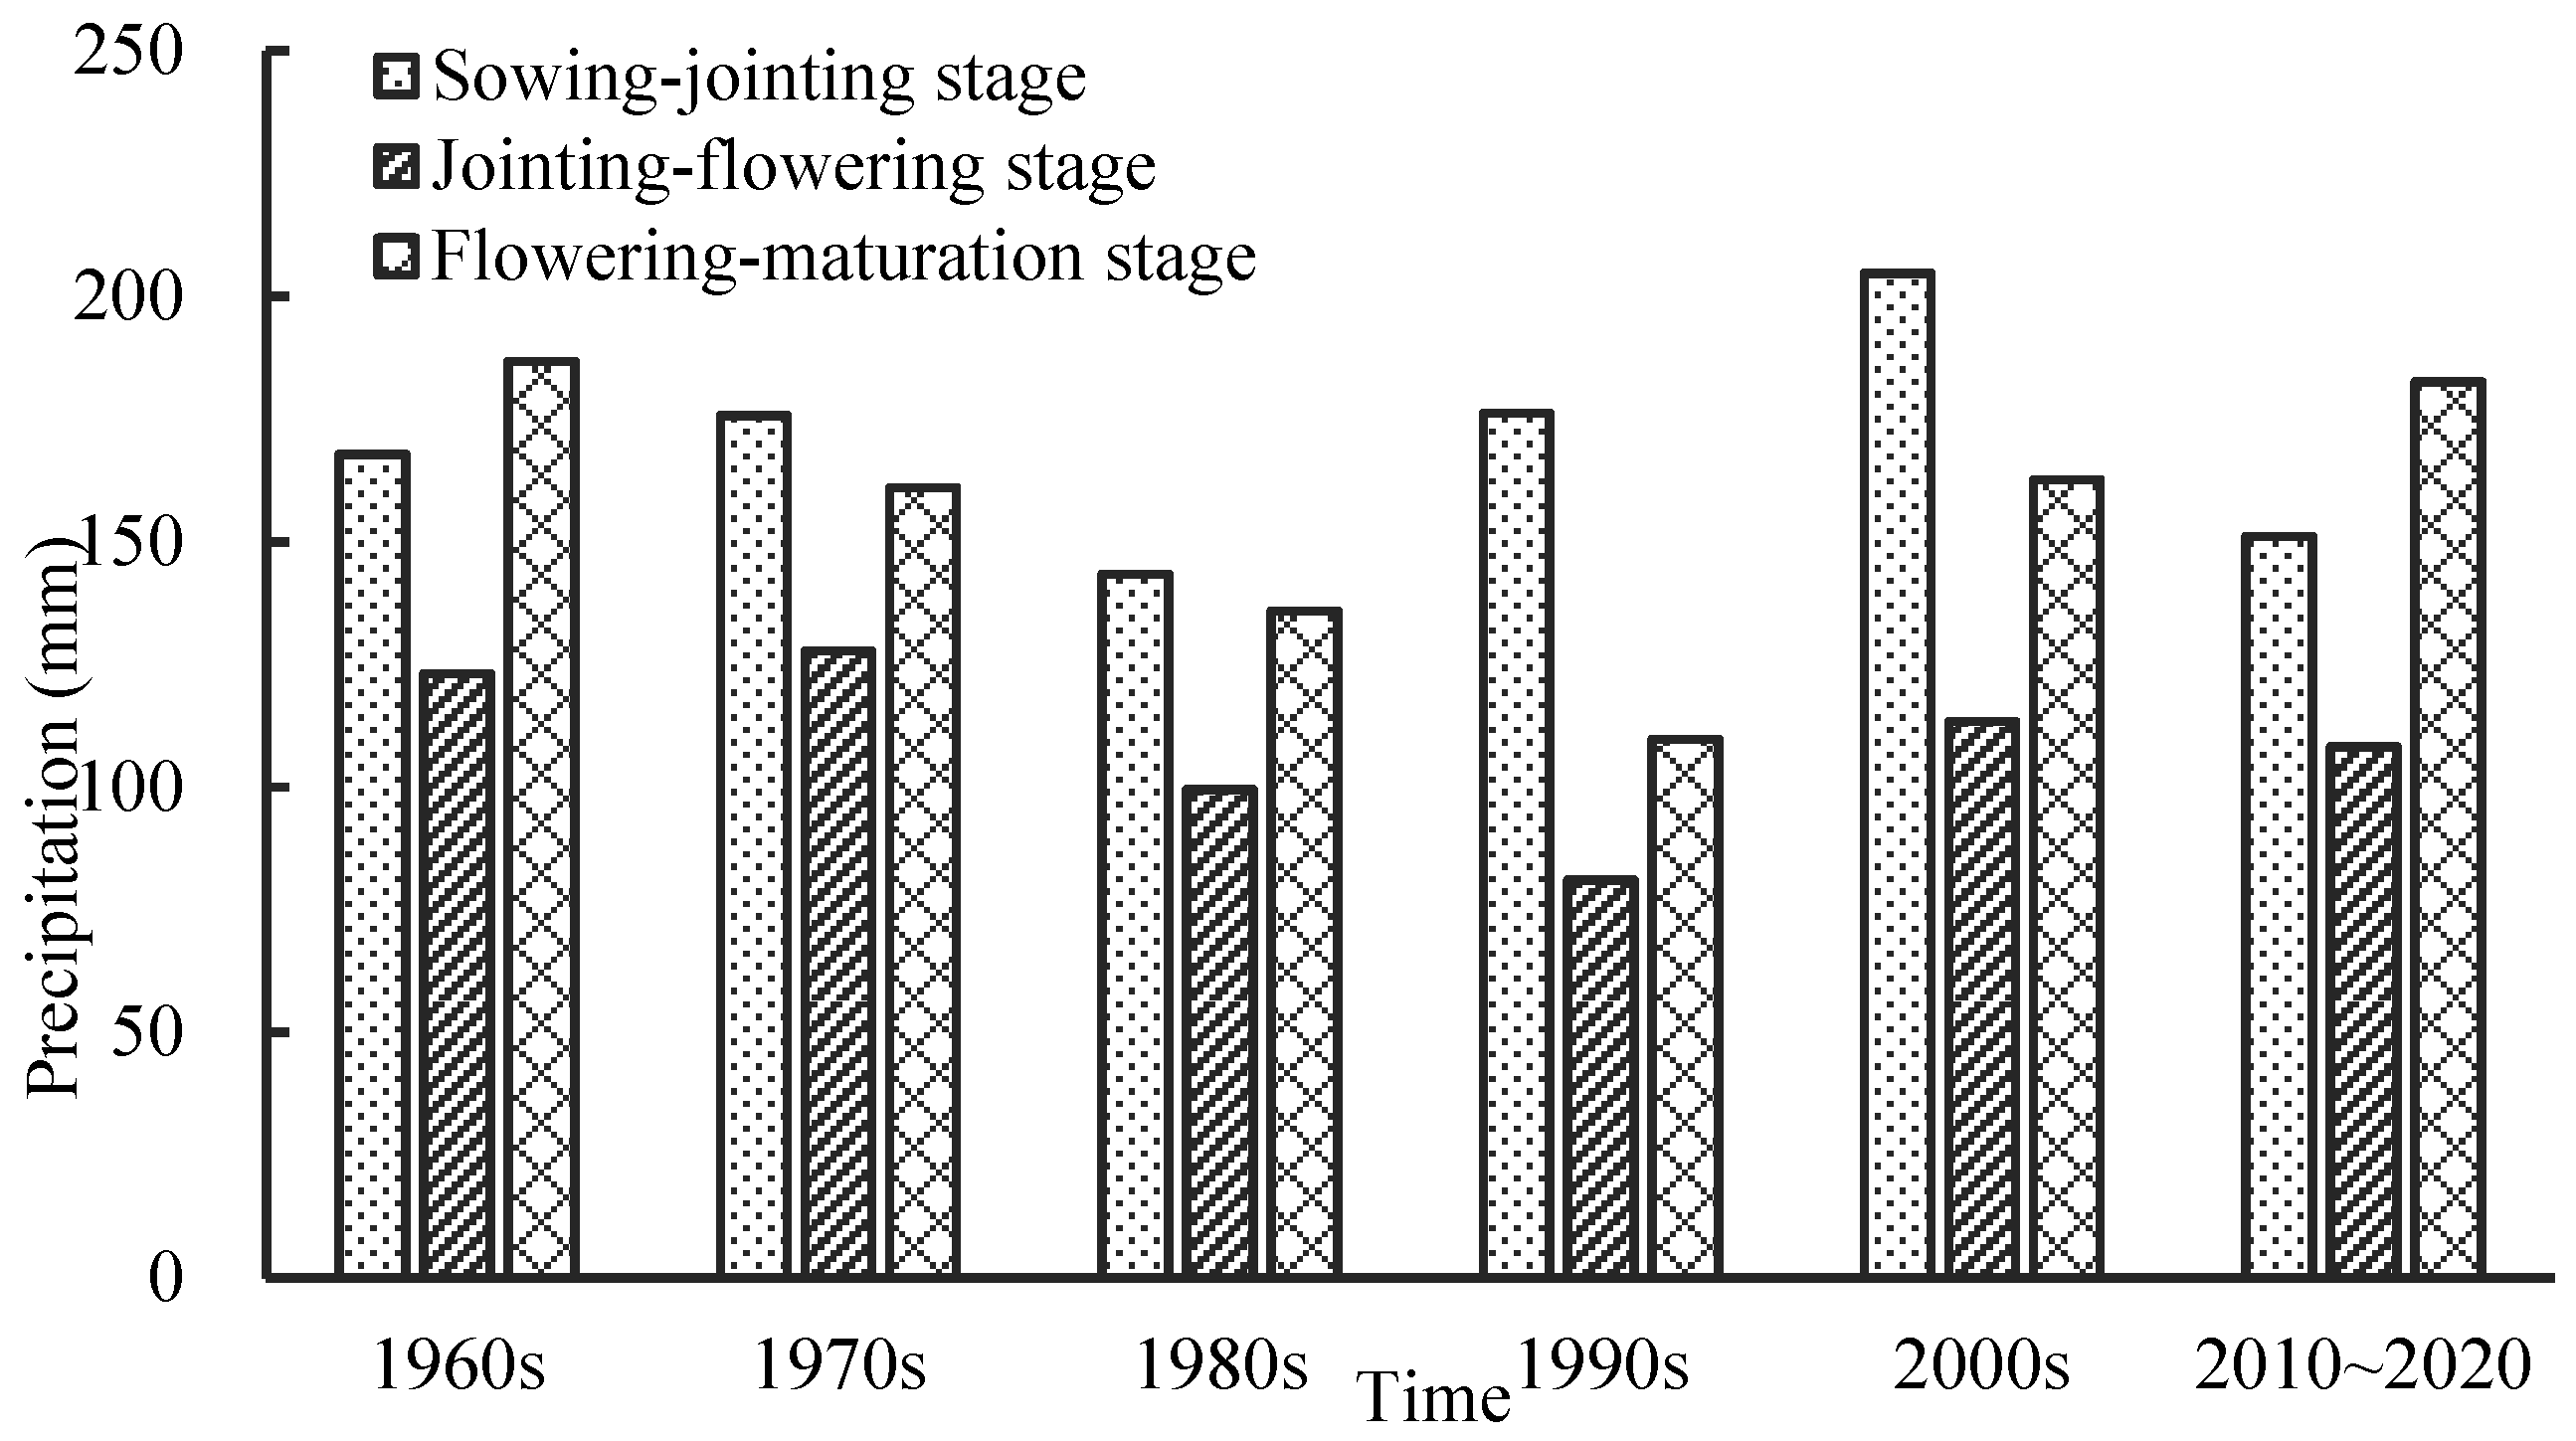
Annual precipitation fluctuations during the summer maize growing season in the North China Plain from 1960–2020 were high and showed an insignificant decreasing trend. Among the three developmental stages, precipitation during the jointing–flowering stage was the lowest and the decreasing trend was the highest. Dry–wet alternations in precipitation were detected during the summer maize growing season in the North China Plain and most years underwent 2.5 or three dry–wet alternations.
(2)
The spatial distribution of precipitation during the summer maize growing season in the North China Plain was not uniform and there were large differences detected between the three developmental stages. The precipitation distribution pattern of the sowing–jointing stage was mainly “North–South”, the zero contour was near 36° N, and the jointing–flowering and flowering–maturation stages were mainly “global” with phases that were the opposite of one another. The spatial distribution layout of precipitation barycenters during the three developmental stages of summer maize showed a South–North direction with low dispersion and significant directionality. Precipitation barycenters in the recent 61 years during the jointing–flowering stage showed a significant southward migration trend. The precipitation barycenters during the sowing–jointing and flowering–maturation stages showed southeast and northeast migration, respectively, but these trends were not significant.
(3)
A negative correlation was detected between the precipitation of different summer maize developmental stages in the North China Plain and the occurrence of warm events. A positive correlation was detected between the precipitation during the flowering–maturation stage and cold events. Precipitation changes under warm and cold events did not have significant relationships with the grades of warm and cold events. During the entire growing season, PDO and precipitation had the highest correlation. PDO was the main factor that affected precipitation changes during the summer maize growing season in the North China Plain in the past 61 years.

Author Contributions

W.W.: conceptualization, funding acquisition, review, and editing. W.W. and H.H.: data curation, writing—original draft. S.T., Y.X. and W.W.: supervision, review and editing. All authors have read and agreed to the published version of the manuscript.

Funding

This research was funded by National Institute of Natural Hazards, Ministry of Emergency Management of China (Grant Number: ZDJ2021-05).

Institutional Review Board Statement

Not applicable.

Informed Consent Statement

Not applicable.

Data Availability Statement

The data that support the findings of this study are available from Corresponding author W.W., upon reasonable request.

Conflicts of Interest

The authors declare no conflict of interest.

References

  1. Shi, W.; Huang, S.; Liu, D.; Huang, Q.; Han, Z.; Leng, G.; Wang, H.; Liang, H.; Li, P.; Wei, X. Drought-flood abrupt alternation dynamics and their potential driving forces in a changing environment. J. Hydrol. 2021, 597, 126179. [Google Scholar] [CrossRef]
  2. Han, L.; Zhang, Q.; Ma, P.; Wang, Y.; Huang, T.; Jia, J.; Wang, X.; Wang, X.; Liu, W.; Li, D.; et al. Characteristics of drought disasters risk in the Yellow River Basin under the climate warming. J. Desert Res. 2021, 41, 225–234. [Google Scholar]
  3. Pascolini-Campbell, M.; Reager, J.T.; Chandanpurkar, H.A.; Rodell, M. A 10 percent increase in global land evapotranspiration from 2003 to 2019. Nature 2021, 593, 543–547. [Google Scholar] [CrossRef] [PubMed]
  4. Frich, P.L.; Lv, A.; Della-Marta, P.; Gleason, B.; Haylock, M.; Tank, A.M.G.K. Observed coherent changes in climatic extremes during 2nd half of the 20th century. Clim. Res. 2002, 19, 193–212. [Google Scholar] [CrossRef]
  5. New, M.; Hewitson, B.; Stephenson, D.B.; Tsiga, A.; Kruger, A.; Manhique, A.; Gomez, B.; Coelho, C.A.S.; Masisi, D.N.; Kululanga, E.; et al. Evidence of trends in daily climatic extremes over southern and west Africa. J. Geophys. Res. Atmos. 2006, 111, D14102. [Google Scholar] [CrossRef]
  6. Wang, Y.; Chen, X.; Yan, F. Spatial and temporal variations of annual precipitation during 1960–2010 in China. Quat. Int. 2015, 380, 5–13. [Google Scholar] [CrossRef]
  7. Ren, G.; Ren, Y.; Zhan, Y.; Sun, X.; Liu, Y.; Chen, Y.; Wang, T. Spatial and temporal patterns of precipitation variability over China’s Mainland II: Recent trends. Adv. Water Sci. 2015, 26, 451–465. [Google Scholar]
  8. Yao, H.M.; Wu, Y.X.; Guan, T.S. Diagnose of precipitation evolution trend in China and new facts. Adv. Water Sci. 2013, 24, 1–10. [Google Scholar]
  9. Zhou, D. Analysis of Spatiotemporal Changes during Droughts in Northern China in 1961–2013 and Analysis of Its Causes; Northwest Normal University: Lanzhou, China, 2015. [Google Scholar]
  10. Guo, H.; Li, M.; Wang, L.; Wang, Y.; Zang, X.; Zhao, X.; Wang, H.; Zhu, J. Evaluation of Groundwater Suitability for Irrigation and Drinking Purposes in an Agricultural Region of the North China Plain. Water 2021, 13, 3426. [Google Scholar] [CrossRef]
  11. Cui, Y.; Zhang, B.; Huang, H.; Wang, X.; Zeng, J.; Jiao, W.; Yao, R. Identification of Seasonal Sub-Regions of the Drought in the North China Plain. Water 2020, 12, 3447. [Google Scholar] [CrossRef]
  12. Wang, L.J. Drought and High Temperature Occurrence Characteristics and Effects on Yield in Summer Maize Season in the North China Plain; China Agricultural University: Beijing, China, 2018. [Google Scholar]
  13. Cao, Y.Q.; Wang, Y.H.; Feng, X.X.; Qiao, H. Spatial and temporal analysis of drought in different growth stages of summer corn in hebei province. J. North China Univ. Water Resour. Electr. Power 2020, 41, 1–9. [Google Scholar] [CrossRef]
  14. Zhao, Z.L.; Luo, Y.; Yu, J.L.; Luo, X.Q.; Yang, Y.Y. Analysis of precipitation variation characteristics and barycenter shift in Guizhou Plateau during 1960–2016. J. Geo-Inf. Sci. 2018, 20, 1432–1442. [Google Scholar]
  15. Wu, K.; Wang, X.L.; Xu, Y.; Wang, G.X.; Wu, Y.X. New facts about evolution of spatial and temporal pattern of precipitation over Chinese mainland. South-North Water Transf. Water Sci. Technol. 2017, 15, 30–36. [Google Scholar]
  16. Fan, L.; Lu, C.; Yang, B.; Chen, Z. Long-term trends of precipitation in the North China Plain. J. Geogr. Sci. 2012, 22, 989–1001. [Google Scholar] [CrossRef]
  17. Yang, J.; Gong, D.; Wang, W.; Hu, M.; Mao, R. Extreme drought event of 2009/2010 over southwestern China. Meteorol. Atmos. Phys. 2012, 115, 173–184. [Google Scholar] [CrossRef]
  18. Zhou, C.C.; Zhang, Q.T. The connotations of water resources crisis and the analysis of Huang-huai-hai Plain. Territ. Nat. Resour. Study 2004, 1, 79–80. [Google Scholar] [CrossRef]
  19. Tian, Y.M.; Bao, Z.X.; Song, X.M.; Mo, Y.C.; Wang, G.Q.; Liu, C.S. Analysis of variation characteristics of groundwater reserves and buried depth in Huang-huai-hai Plains. China Rural Water Hydropower 2021, 12, 115–121. [Google Scholar]
  20. Xia, Y.; Li, H.; Wang, B.; Ma, Z.; Guo, X.; Zhao, K.; Zhao, C. Characterization of Shallow Groundwater Circulation Based on Chemical Kinetics: A Case Study of Xiong’an New Area, China. Water 2022, 14, 1880. [Google Scholar] [CrossRef]
  21. Liu, X.H. Farming system and farming system regional planning in China. J. China Agric. Resour. Reg. Plan. 2002, 23, 11–15. [Google Scholar] [CrossRef]
  22. Gao, P.; Geng, G.P.; Wang, H.W.; Li, Z.J.; Ning, T.Y. Study on the Partitions of Modern Farming System and Its Structural Characteristics in Shandong Province. Crops 2010, 3, 11–14. [Google Scholar]
  23. Chen, F.; Jiang, Y.L.; Yin, X.G. Development of China’s farming system and adjustment of zoning scheme. Chin. J. Agric. Resour. Reg. Plan. 2021, 42, 1–6. [Google Scholar]
  24. Pirnia, A.; Golshan, M.; Darabi, H.; Adamowski, J.; Rozbeh, S. Using the Mann-Kendall test and double mass curve method to explore stream flow changes in response to climate and human activities. J. Water Clim. Chang. 2018, 10, 725–742. [Google Scholar] [CrossRef]
  25. Cazelles, B.; Chavez, M.; Berteaux, D.; Ménard, F.; Vik, J.O.; Jenouvrier, S.; Stenseth, N.C. Wavelet analysis of ecological time series. Oecologia 2008, 156, 287–304. [Google Scholar] [CrossRef]
  26. Nourani, V.; Behfar, N.; Dabrowska, D.; Zhang, Y. The Applications of Soft Computing Methods for Seepage Modeling: A Review. Water 2021, 13, 3384. [Google Scholar] [CrossRef]
  27. Sun, M.D.; Kim, G.; Lei, K.; Wang, Y. Evaluation of Technology for the Analysis and Forecasting of Precipitation Using Cyclostationary EOF and Regression Method. Atmosphere 2022, 13, 500. [Google Scholar] [CrossRef]
  28. Huang, T.T.; Lin, Q.X.; Wu, Z.Y.; Wang, Y.Q. Spatial and Temporal Characteristics of Drought in the Yellow River Basin and Their Correlation with ENSO. Yellow River 2021, 43, 52–58. [Google Scholar]
  29. Wu, K. SPEI-Based Study on the Effects of ENSO Events on Droughts in Various Areas in Liaoning Province; Shenyang Agricultural University: Shenyang, China, 2018. [Google Scholar]
  30. Hu, Q.Y. Impacts of Climate Change and Human Activities on Dryness and Wetness in Different Sub-Regions of China; Northwest A & F University: Xianyang, China, 2021. [Google Scholar]
Figure 1. Distribution of meteorological stations and agricultural regions in the North China Plain.
Atmosphere 13 01288 g001
Figure 2. Decadal mean precipitation changes during the summer maize growing season in the North China Plain.
Atmosphere 13 01288 g002
Figure 3. Wavelet analysis precipitation fluctuations during the summer maize growing season in the North China Plain. (a) Sowing–jointing stage; (b) Jointing–flowering stage; (c) Flowering–maturation stage.
Atmosphere 13 01288 g003
Figure 4. Spatial distribution of precipitation during the summer maize growing season in the North China Plain. (a) Sowing–jointing stage; (b) Jointing–flowering stage; (c) Flowering–maturation stage.
Atmosphere 13 01288 g004
Figure 5. EOF decomposition of first mode spatial distribution during different development stages of summer maize in the North China Plain. (a) Sowing–jointing stage; (b) Jointing–flowering stage; (c) Flowering–maturation stage.
Atmosphere 13 01288 g005
Figure 6. Precipitation barycenter migration trajectories during the summer maize growing season in the North China Plain. (a) Sowing–jointing stage; (b) Jointing–flowering stage; (c) Flowering–maturation stage.
Atmosphere 13 01288 g006
Figure 7. Relationship between precipitation anomalies and ENSO event level during the summer maize growing season in the North China Plain. (a) Sowing–jointing stage; (b) Jointing–flowering stage; (c) Flowering–maturation stage.
Atmosphere 13 01288 g007
Table 1. Mean growing season period of summer maize in the North China Plain over time.
Agricultural Cropping Region gradeDate of SowingDate of JointingDate of FloweringDate of Maturation
I11 June14 July7 August24 September
II14 June18 July10 August28 September
III15 June23 July8 August23 September
IV12 June16 July2 August20 September
V16 June23 July9 August21 September
VI20 June20 July8 August25 September
Table 2. Precipitation trends during the summer maize growing season in the North China Plain from 1960–2020.
Developmental StagePrecipitation Range (mm)Mean (mm)Normally Distributed Statistical Variable (Z)Variation TrendWas it Significant (α = 0.1)
Sowing–jointing stage78.3–276.0169.5−0.05StableNo
Jointing–flowering stage27.8–184.7108.8−1.08DecreasedNo
Flowering–maturation stage42.7–272.7156.9−0.14DecreasedNo
Note: |z| ≥ 1.28, 1.64, and 2.32 represent 90%, 95%, and 99% confidence, respectively.
Table 3. Variance explained by the first eigenvector during different developmental stages of summer maize in the North China Plain.
Sowing–Jointing StageJointing–Flowering StageFlowering–Maturation Stage
Eigenvalue745,861424,573808,340
Variance explained (%)31.625.938.0
Table 4. Relationship between ENSO warm and cold event occurrence grades and precipitation anomalies from 1960–2020.
Developmental StageENSO Warm EventENSO Cold Event
AnomalyGradeFrequencyDeviationGradeFrequency
Sowing–jointing stage−26.15Weak3−43.51Weak2
−18.57Medium616.78Medium2
−9.55Strong77.74Strong8
Jointing–flowering stage−19.06Weak3−27.12Weak2
−7.34Medium624.85Medium2
12.62Strong67.34Strong8
Flowering–maturation stage0.31Weak849.10Weak3
−29.68Medium6−2.65Medium4
−4.34Strong611.00Strong8
Table 5. Correlation relationship between climatic factors and North China Plain precipitation anomalies from 1960–2020.
Developmental stageAOPDONAOSOIONI
Sowing–jointing stage0.19−0.23 *0.010.08−0.11
Jointing–flowering stage0.09−0.120.050.01−0.07
Flowering–maturation stage−0.10−0.23 *−0.090.32 *−0.19
Note: * p < 0.1.
Publisher’s Note: MDPI stays neutral with regard to jurisdictional claims in published maps and institutional affiliations.

