Article

Evaluation of Water Vapor Product from TROPOMI and GOME-2 Satellites against Ground-Based GNSS Data over Europe

1
Departamento de Física, Instituto Universitario de Investigación del Agua, Cambio Climático y Sostenibilidad (IACYS), Universidad de Extremadura, Avenida de Elvas s/n, 06006 Badajoz, Spain
2
German Aerospace Center (DLR), Remote Sensing Technology Institute (IMF), Oberpfaffenhofen, 82234 Weßling, Germany
*
Author to whom correspondence should be addressed.
Atmosphere 2022, 13(7), 1079; https://doi.org/10.3390/atmos13071079
Submission received: 27 May 2022 / Revised: 5 July 2022 / Accepted: 6 July 2022 / Published: 8 July 2022
(This article belongs to the Special Issue Research on Atmospheric Water Vapor: Monitoring and Characteristics)

Abstract

:
A novel integrated water vapor (IWV) product from TROPOspheric Monitoring Instrument (TROPOMI) is validated together with a Global Ozone Monitoring Instrument-2 (GOME-2) standard product. As reference, ground-based Global Navigation Satellite Systems (GNSS) IWV data in 235 European stations from May 2018 to May 2019 are used. Under cloud free situations, a general comparison is carried out. It suggests that TROPOMI IWV exhibits less bias than GOME-2 and better results in the dispersion and regression parameters. Moreover, TROPOMI presents more homogeneous results along the different stations. However, TROPOMI is found to be overestimating the IWV uncertainties and being, therefore, too conservative in the confidence interval considered. The dependence of satellite product performance on several variables is also discussed. TROPOMI IWV shows wet bias of 5.7% or less for IWV < 10 mm (TROPOMI) and dry bias of up to −3% (TROPOMI). In contrast, GOME-2 shows wet bias of 30% or less for IWV < 25 mm (GOME-2) and dry bias of −12.3% for IWV > 25 mm. In addition, relative standard deviation (rSD) increases as IWV increases. In addition, the dependence on solar zenith angle (SZA) was also analyzed, as solar radiation bands are used in the retrieval algorithm of both instruments. Relative mean bias error (rMBE) shows positive values for GOME-2, slightly increasing with SZA, while TROPOMI shows more stable values. However, under high SZA, GOME-2 IWV exhibits a steep increase in rMBE (overestimation), while TROPOMI IWV exhibits a moderate decrease (underestimation). rSD is slightly increasing with SZA. The influence of cloudiness on satellite IWV observations is such that TROPOMI tends to overestimate IWV more as cloudiness increases, especially for high IWV. In the case of GOME-2, the rSD slightly increases with cloudiness, but TROPOMI rSD has a marked increase with increasing cloudiness. TROPOMI IWV is an important source of information about moisture, but its algorithm could still benefit from further improvement to respond better to cloudy situations.

1. Introduction

Atmospheric water vapor is deeply acknowledged for its role in many climate processes. It is the main absorbent of infrared radiation emitted by the earth, and it is obviously a fundamental part of the hydrological cycle [1]. Moreover, the main natural greenhouse gas is water vapor, and an important contributor to the Earth’s energy transport. Water vapor is considered a positive feedback in the climate system [2,3].
Hence, the scientific community shows a great interest in the acquisition of high quality, reliable, and redundant water vapor information. However, the strong variability both in the spatial and temporal domains makes monitoring water vapor a difficult task. Fortunately, there are many kinds of instruments and techniques to obtain information of water vapor. Among ground-based techniques, Global Navigation Satellite Systems (GNSS) are acknowledged as a reliable, stable source, with high temporal resolution [4]. Ground-based GNSS has been widely used as a reference in validation exercises [5,6,7,8,9,10,11]. Guerova et al. [12], in a review including several inter-technique comparisons, concluded that ground-based GNSS has root mean squared errors corresponding to 0.4–0.6 mm in integrated water vapor (IWV). The presence of systematic errors can be due to satellite and receiver instrumentation effects, in situ environmental effects, and modelling approximations. Therefore, they are very dependent on the specifics of the station and period of study. The advantages of GNSS techniques are dense networking, high temporal resolution (5-min to 2 h), all-weather availability and high accuracy. Other instruments lack these features, for example: radiosondes are launched between 1 and 4 times a day; sun-photometers are not available at night; water vapor radiometers are problematic under heavy rain.
Nevertheless, GNSS dense networks are not available in all zones. They are especially scarce in less-developed countries or depopulated regions, not to mention oceans, where it is not possible to build GNSS stations. In addition, even with dense networks, the horizontal spatial resolution is relatively low. Therefore, satellite imagery is fundamental in many tasks, like climate monitoring or weather forecasts. Polar orbiting satellite measurements usually provide global information of water vapor with low temporal resolution. Typically, they provide one or two measurements a day, more for polar regions.
The European Organisation for the Exploitation of Meteorological Satellites (EUMETSAT) has launched several missions to monitor atmospheric components. Global Ozone Monitoring Experiment-2 (GOME-2) sensors on board MetOp satellites were mainly designed for ozone monitoring. However, they are capable of retrieving many more chemical species (among them, water vapor). GOME-2 water vapor retrieval has shown an adequate correlation against ground-based measurements [8,13,14].
In this context, the European Space Agency, as part of the Copernicus Program, has launched the Sentinel-5 Precursor (S5P) mission to carry the TROPOspheric Monitoring Instrument [TROPOMI], [15]. This spectrometer can measure the presence of a wide variety of compounds, including atmospheric water vapor. S5P was developed to reduce data gaps between SCanning Imaging Absorption SpectroMeter for Atmospheric CHartographY (SCIAMACHY) on-board the Environmental Satellite (ENVISAT) and the launch of Sentinel-5, and to complement GOME-2. To date, there is no official TROPOMI water vapor product. However, some scientific IWV products exist for TROPOMI, like those presented in Schneider et al. [16], Borger et al. [17], Küchler et al. [18]. In this work, an algorithm already applied to GOME-2 successfully [19] is applied to TROPOMI data to retrieve IWV from it. This dataset was already reported in [20].
The objective of this paper is to validate this TROPOMI IWV product, along with the GOME-2 standard IWV product, against GNSS data from 235 European stations. This allows us to retrieve information on the ability of TROPOMI to produce high quality water vapor information in comparison with an already established data product like the GOME-2 IWV product. Since TROPOMI is expected to complement GOME-2, it is very interesting to compare the IWV product from the two instruments and compare them.
Section 2 explains the sources of data and the methodology used. Section 3 presents and discusses the results, while Section 4 depicts the main conclusions.

2. Data and Methods

2.1. GNSS Data

Sites selected for this work are 235 GNSS stations over Europe which belong to the International GNSS Service (IGS) network. The period covers from May 2018 to May 2019. For a precise positioning strategy, GNSS need to account for the effect of the troposphere in the signal travel time. This is known as the tropospheric delay, which is converted to zenith tropospheric delay (ZTD). ZTD is independent of the observation geometry (i.e., elevation angle) of the satellite–receiver–zenith relative positions. ZTD is obtained as an unknown variable, together with position coordinates and other variables, in the GNSS data processing. In our case, IGS ZTD files are downloaded from the IGS webpage https://igs.bkg.bund.de/root_ftp/EUREF/products/ (acessed on 20 March 2020). ZTD can be converted to IWV according to the approach by Bevis et al. [21]. First, it is necessary to separate the contribution from other tropospheric gases and water vapor:
ZTD = ZHD + ZWD ,
where ZHD is the hydrostatic delay and ZWD the wet (exclusively due to water vapor) delay. The ZHD can be computed from pressure at the station level, according to Saastamoinen [22]:
ZHD = c 1 P 0 1 c 2 cos 2 λ c 3 H .
Here, c 1 , c 2 and c 3 are constants whose values can be found in Bevis et al. [21], P 0 is the atmospheric pressure at the station level, λ the station latitude and H the station’s height over the reference geoid. Once the ZHD is obtained, it can be subtracted from ZTD to obtain ZWD. To convert ZWD into IWV, it is necessary to compute the mean weighted atmospheric temperature ( T m ) [21]:
T m = P v T d z P v T 2 d z = i = 1 N P v i T i Δ z i i = 1 N P v i T i 2 Δ z i ,
where P v is the partial pressure of water vapor, T is the atmospheric temperature and i indicates the pressure/height level. For this, European Centre for Medium-Range Weather Forecasts (ECMWF) ReAnalisys-5 (ERA5) [23], products have been downloaded and processed, following Wang et al. [24] methodology (see Figure 1 in the mentioned reference). ERA5 has hourly data with 31 km resolution. T m is calculated for the four pixels surrounding the station and then bilinearly interpolated to the pressure station. The pressure at station level is obtained from ERA5 as well, as indicated by Wang et al. [24]. The obtained GNSS IWV product has a temporal resolution of 1 h (at XX:30 h UTC). Some filters have been applied as quality controls: GNSS ZTD uncertainty has to be below 6 mm, T m standard deviation of the four pixels had to be less than 0.6 K, and standard deviation of pressure from the four pixels had to be below 30 hPa.

2.2. Satellite Products

2.2.1. GOME-2

GOME-2 [25,26] is a medium-resolution UV-VIS-NIR spectrometer, which is on-board MetOp satellites (A, B, and C). Although its main function is to monitor the total atmospheric content and vertical profile of ozone, it provides additional information about other trace gases (including water vapor). GOME-2 sensors are on-board the MetOp-B and MetOp-C satellites in the present, while MetOp-A is no longer operational. The passing time at the ascending node is 9:30 p.m. local time (LT). The default scan width is 1920 km, with a ground pixel of 80 km × 40 km .
The IWV data used in this work, obtained from GOME-2 MetOp-B and MetOp-C, were derived from the GOME Data Processor version 4.8 by the German Aerospace Center, Remote Sensing Technology Institute in the framework of the EUMETSAT satellite Application Facility on Atmospheric Chemistry Monitoring. The retrieval method is based on Differential Optical Absorption Spectrography [DOAS], [27] applied in the wavelength interval 614–683 nm [28]. This algorithm, described in detail in [29,30], consists of three steps:
  • DOAS fitting: water vapor, O 2 and O 4 absorptions are taken into account. H 2 O cross section uses line-by-line computations with HITRAN H 2 O line parameter for fixed conditions (temperature and pressure). The broadband filtering is improved by the inclusion of three types of vegetation spectra as a correction for the Ring effect [31];
  • Saturation effect correction: GOME-2 cannot spectrally resolve the water vapor absorption bands. Therefore, the water vapor slant column density (SCD) is not linear with vertical column density (VCD), and a correction must be applied. The correction is calculated by mathematical convolution of H 2 O spectrum with the instrument slit function. This correction is more important for larger water vapor SCD, and in the tropics;
  • Vertical column density calculation: The corrected SCD must be converted to VCD to make it geometry-independent. This is achieved by dividing SCD by a convenient air mass factor (AMF), which is derived from oxygen absorption. AMF is calculated by dividing O 2 SCD by the O 2 VCD for a standard atmosphere, since water vapor’s and oxygen’s AMF are assumed to be similar, which can lead to systematic errors [12–18% under a clear sky, but it can reach 50% under cloudy conditions, see [30]]; O 2 AMF is expected to be larger than water vapor’s, since scale height of O 2 is larger than the one of H 2 O . This is corrected using a look-up table with correction factors, which depends on solar zenith angle (SZA), line of sight angle, relative azimuth and surface albedo. The correction factors are calculated through radiative transfer calculations.
The fitting algorithm uses the wavelength region between 614 and 683 nm, where the spectral resolution is about 0.54 nm . The main advantages of this method are: it does not need external calibration sources and the lack of assumptions on atmospheric pressure, temperature, radiative transfer, or other a priori information, and its accuracy over land and ocean.

2.2.2. TROPOMI

The TROPOMI on-board Sentinel 5 Precursor and the upcoming Sentinel 5 missions will provide global observations of radiance in the UV and Vis ranges. The TROPOMI pixels are 3.6 km × 7.2 km . Since other variables needed to obtain IWV (i.e., surface albedo) are also retrieved from TROPOMI measurements, the data-set has the advantage that it is independent from other data sources.
TROPOMI IWV retrieval used in this work was reported by Chan et al. [20]. It is based on the retrieval for GOME-2 at the blue spectral band reported in Chan et al. [19] with some improvements in the spectral retrieval and AMF calculations. Here, the algorithm is briefly described. For more details about it, please refer to Chan et al. [20]. This retrieval has two steps. The first one consists of analyzing the spectra to obtain the slant column water vapor. The second step is to convert the slant column into a vertical column using the AMF.
The DOAS technique is applied in the fitting window 435–455 nm with a daily solar irradiance spectrum as reference. This results in the determination of water vapor SCD. Some absorption cross sections from different species are included in the analysis. The Ring spectrum is also included to compensate for the Raman scattering effect. A 4th order polynomial fit is used to correct some broad band spectral structures.
The AMF is then used to convert the SCD to VCD. Since the fitting window is quite narrow ( 20 nm ), AMF can be calculated at a single, representative wavelength ( 442 nm in this case). The AMF is calculated through a look-up table based on radiative transfer calculations (with VLIDORT version 2.7) to retrieve the contribution of water vapor in the different atmospheric layers. However, to compute the total AMF, the water vapor distribution is necessary. An optimal, iteratively improved, a priori water vapor profile is used. This profile is based on the fact that water vapor profiles are strongly dependent on the water vapor total column. Another important input to AMF calculation is the surface albedo. It is retrieved using TROPOMI bands and a full-physics inverse learning machine algorithm [32]. The surface albedo input has been improved [20] with respect to the previous version of this algorithm [19], which used GOME-2 surface albedo as input.
The TROPOMI IWV retrieval models clouds as opaque Lambertian surfaces. The cloud information is obtained from the TROPOMI operational cloud product. The cloudy pixels are treated separately as if they were fully covered with cloud and fully cloud-free. The AMF in the cloudy part is calculated setting the contributions below the cloud to 0, and replacing the surface pressure with cloud top pressure, as well as surface albedo with cloud albedo. The cloud-free part is calculated integrating the water vapor profile from surface to the top of the atmosphere. As the part below the cloud can not be detected, it is therefore calculated from the a priori profile. Then, the AMF is calculated as a weighted average between these two AMF. The weight is known as effective cloud fraction or radiance cloud fraction.
The error in VCD is estimated following variance propagation:
σ VCD 2 = VCD 2 σ SCD SCD 2 + σ AMF AMF 2 ,
where σ are the uncertainty of VCD, SCD and AMF.

2.3. Data Matching and Statistical Treatment

To merge the validated and reference data-sets (TROPOMI and GNSS; GOME-2 and GNSS), some criteria have been applied. First, for each satellite image, the closest point to each station is selected in the case of GOME-2. However, TROPOMI pixels are quite smaller than GOME-2’s. Therefore, in the case of TROPOMI, an aggregation of 11 × 11 pixels is averaged to compute the matching value. This results in a resolution similar to that of GOME-2. Among the 11 × 11 aggregation, only those pixels with a qa value greater than 0.5 are used in the average. Then, the closest GNSS data in time is matched to each satellite measurement in each station. Only data with a maximum time difference of ± 30 min and satellite estimated error of less than 10 mm are considered. Cloudy scenes ( CF > 5 % ) are only considered in Section 3.2.3. Therefore, the rest of the analysis only considered cloud-free ( CF < 5 % ) data. In addition, to compute general statistical parameters (see Section 3.1), only one match is selected per day (the closest to the midday UTC). This is done to avoid having more data in the northern stations than in the southern ones, since satellite overpasses regions closer to the poles more frequently than those closer to the equator. In addition, stations with less than 100 data points are discarded.
Regarding statistical treatment, we follow a similar approach to other works [8,9,10,11,33]. This approach consists of calculating the differences (satellite-GNSS IWV values, see Equation (5)) and relative differences (the previous difference divided by the GNSS IWV, see Equation (6)) between both instruments:
δ i = IWV ( satellite ) IWV ( GNSS ) ,
δ i ( % ) = δ i IWV ( GNSS ) .
In the differences and relative differences, distribution can be analyzed through several statistical parameters. Typically, there are some parameters regarding the accuracy, like mean bias error, MBE (Equation (7)). Others deal with precision, such as standard deviation of differences, SD (Equation (9)), and mean absolute bias error, MABE (Equation (8)). MABE is computed as mean of differences in absolute value. Finally, linear regression (satellite against GNSS IWV) parameters, like slope, intercept (y0), and determination coefficient (R2), are also computed:
MBE = 1 N i = 1 N δ i
MABE = 1 N i = 1 N δ i
SD = 1 N 1 i = 1 N ( δ i MBE ) 2
In Equations (7)–(9), N is the number of data pairs. All these parameters have been calculated for each site. Then, the distribution of values of these parameters is analyzed. Additionally, the dependence of the satellite-GNSS differences on several variables (IWV, SZA, cloudiness) is analyzed. This is achieved by splitting data into bins of those variables and analyzing the aforementioned statistics of those bins.

3. Results and Discussion

3.1. Statistical Parameters

Figure 1 shows the distribution of some statistical parameters of the comparison between satellite and GNSS data for all stations in whole. The parameters are: MBE, MABE, and SD, all derived from both satellite-GNSS differences and relative differences and parameters about the linear regression of satellite against GNSS: slope, y0 (intercept) and R2. Each of these parameters has been calculated for each of the 235 sites and for each satellite instrument. The parameters related to relative differences are marked with a prefix “r”. The distribution of the values of the site-wise parameters is presented in Figure 1. TROPOMI and GOME-2 MBE central values are of the same order ( 0.6 mm ) but have a different sign. TROPOMI MBE values are prone to negative values (i.e., underestimation of IWV) while GOME-2 MBE values are positive more often. GOME-2 MBE values are more spread through different values, while TROPOMI are more constrained. MABE and SD are smaller in the case of TROPOMI compared with GOME-2, which also has more spread values. To show this, it must be noted that mean ± standard deviations are: ∼ 2.7 ± 0.9 mm for GOME-2 MABE, ∼ 1.6 ± 0.5 mm for TROPOMI MABE, ∼ 2.9 ± 0.7 mm for GOME-2 SD, ∼ 1.8 ± 0.3 mm for TROPOMI SD. rMABE and rSD are larger in GOME-2 (∼22% and ∼ 23 % ) than in TROPOMI (∼ 11 % and ∼ 14 % ), and with more variability. Regarding rMBE, it is better for TROPOMI (−1.9%) than GOME-2 (+10.5%). This result for TROPOMI is similar to the one obtained by Garane et al. [34] (−4.7%), in a comparison against sun-photometers for the Northern Hemisphere. The different bias sign in both satellite instruments could be due to the use of different wavelength windows (614–683 nm for GOME-2 and 435–455 nm for TROPOMI) for the water vapor retrieval. GOME-2 and TROPOMI data sets are retrieved in completely different spectral bands with different techniques. Chan et al. [19] showed that the bias between blue and red retrieval in the case of GOME-2 could be up to 2 mm. In addition, GOME-2 and TROPOMI measure water vapor at different passing times, and this could also have some influence in the reported bias. Regarding linear fit statistics, intercept values are similar in both instruments, with, again, more variability in the case of GOME-2. Mean values are positive in both cases and below 1 mm (0.75 for GOME-2 and 0.61 for TROPOMI). TROPOMI slope is typically lower than GOME-2 one. The mean and median slope are slightly below 1 for both instruments. Moreover, determination coefficient R2 is generally higher for TROPOMI (0.93 as average) than GOME-2 (0.84 as average). This value is in agreement with the global 0.91 obtained by Garane et al. [34]. Moreover, prob and times panels in Figure 1 provide information about the usefulness of the error estimation. On the one hand, the row prob shows the percentage of data-points that fall into the interval of confidence of the satellite measurement (satellite water vapor estimate ± twice the nominal error). While GOME-2 shows some scatter in the values, TROPOMI values of prob are very close to 100%, meaning that probably TROPOMI uncertainty estimation is too conservative. On the other hand, the row times exhibits the mean ratio between the difference Satellite-GNSS and the nominal confidence interval (twice the reported error estimation, according to Equation (4)). In both cases, the maximum mean value of times is below unity. However, TROPOMI’s times are, in most of the cases, below 0.25, meaning that uncertainties from the TROPOMI algorithm are overestimated.
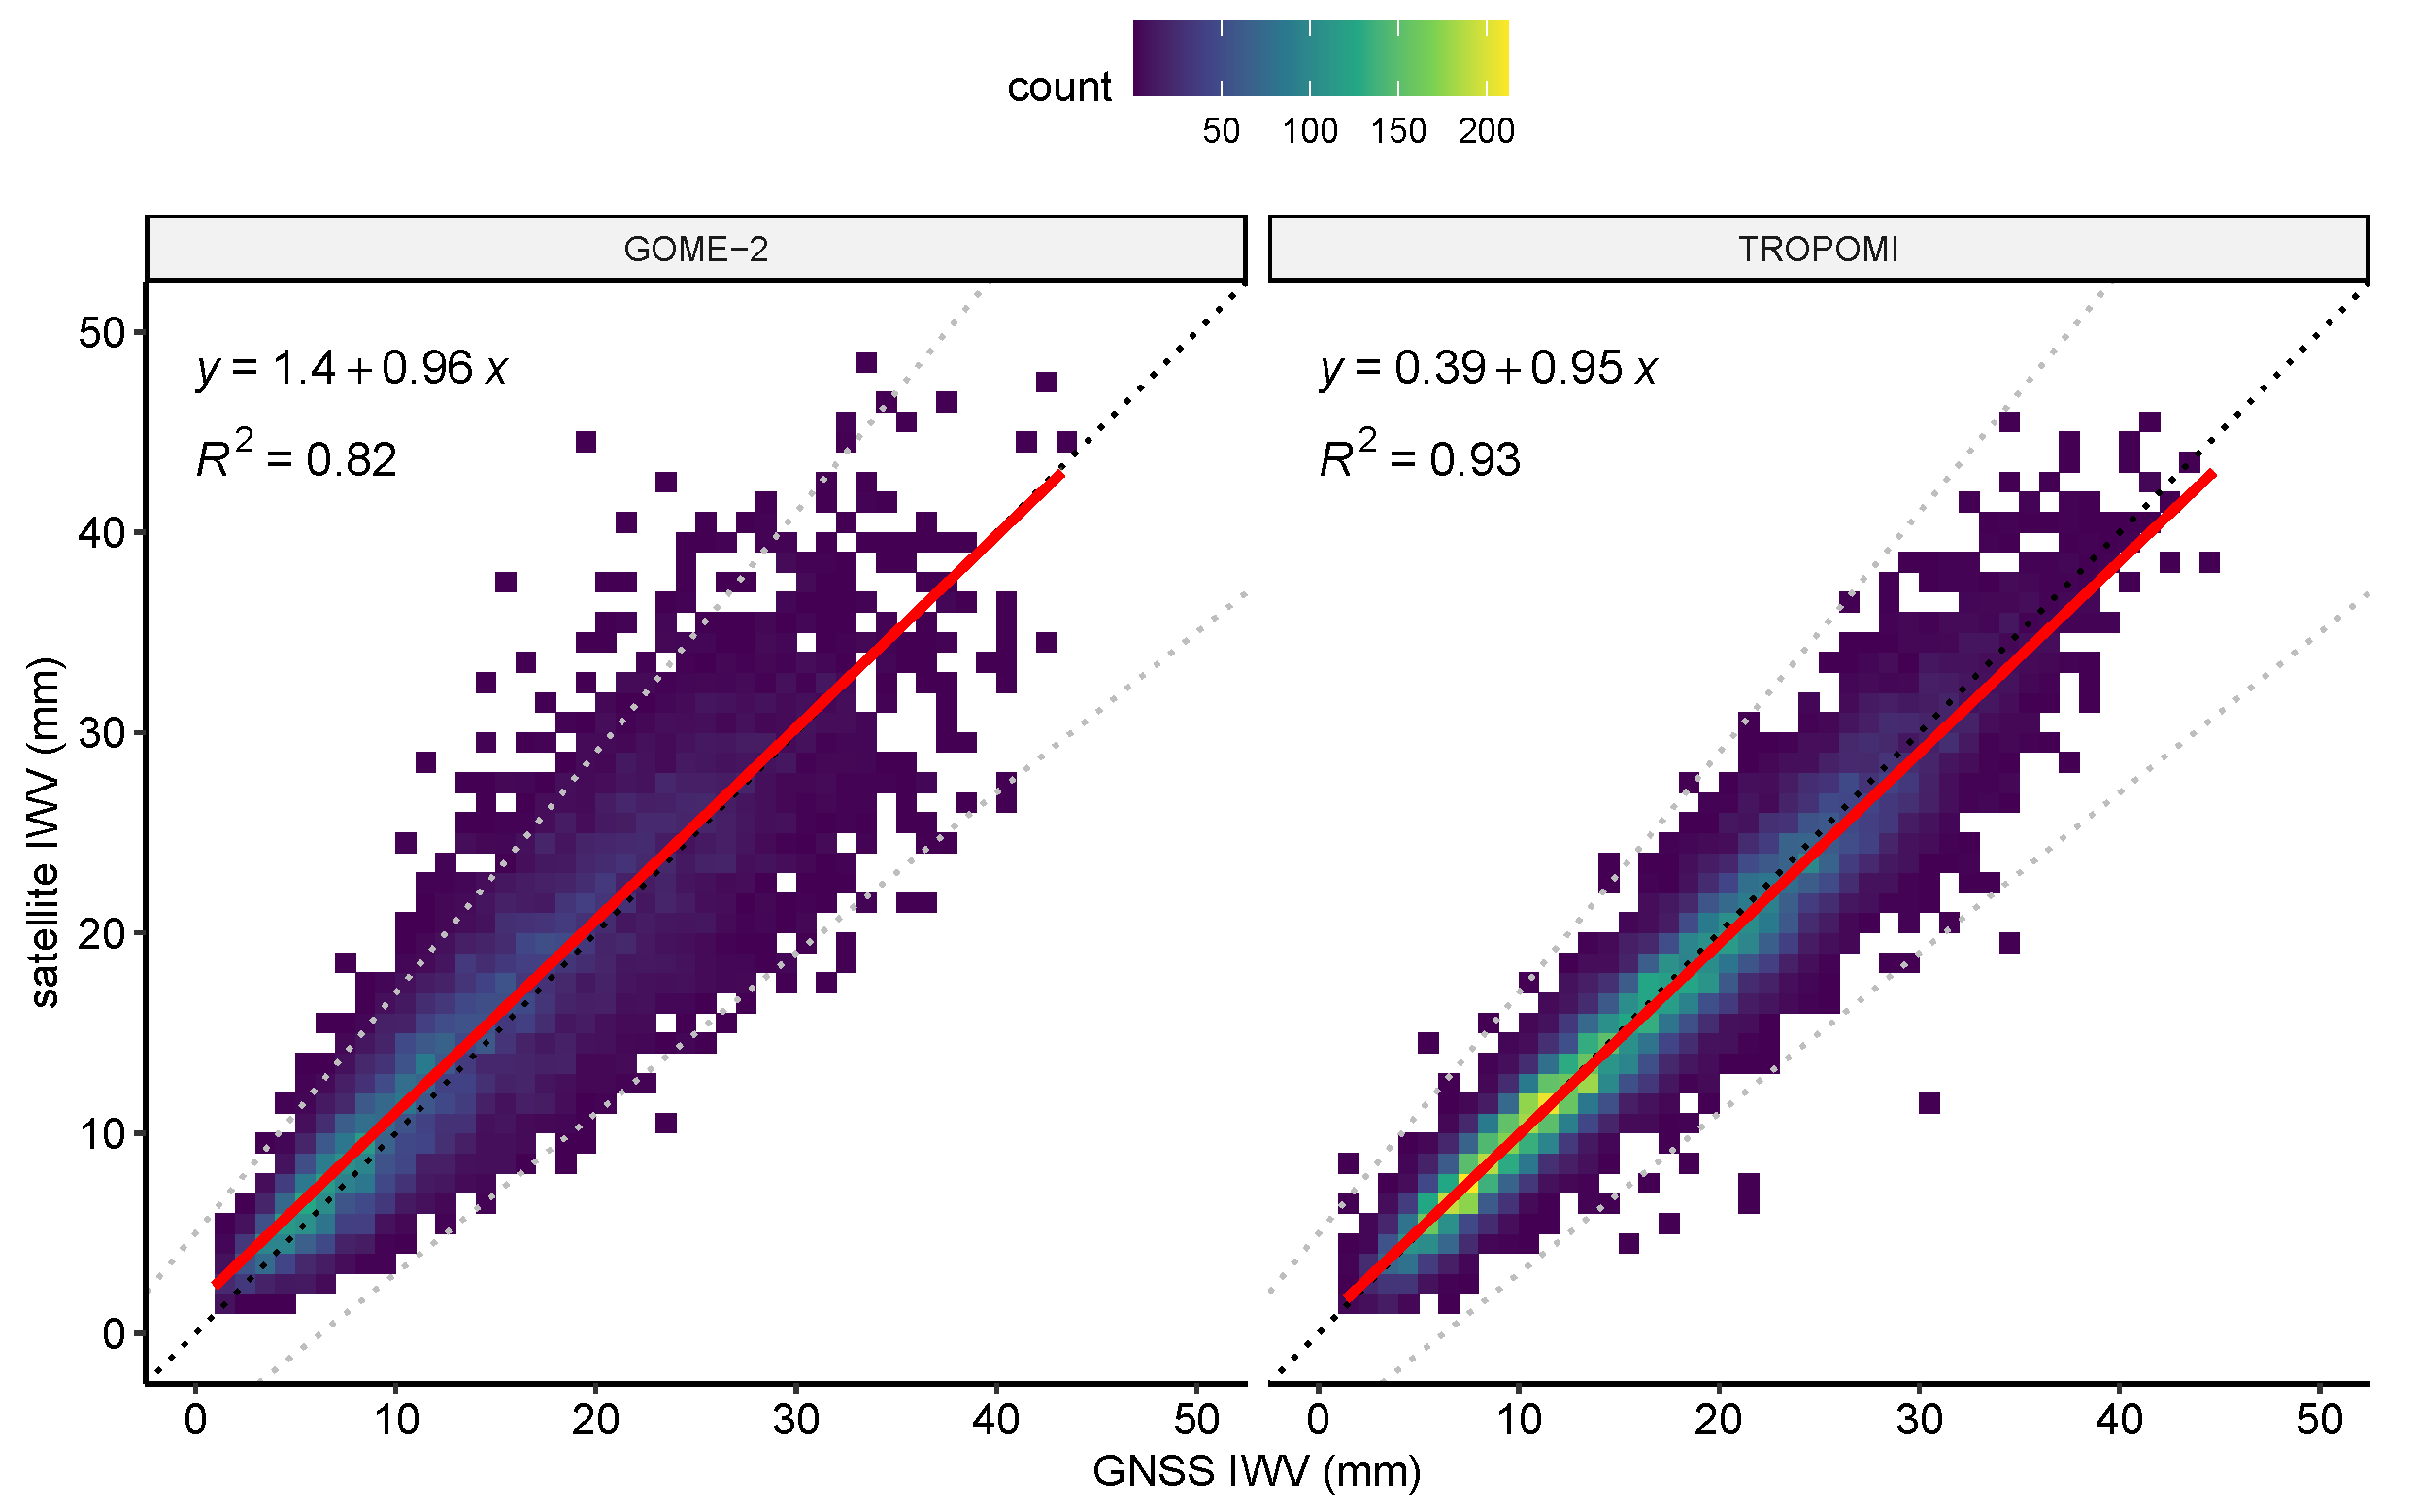
Additionally, a scatter-plot of all the cloud-free pairs from all stations is depicted in Figure 2. Although both satellite instruments adequately follow the ideal 1:1 line, GOME-2 has slightly more dispersion, and the regression line has a lower slope for TROPOMI. This is confirmed by the results of slope in Figure 1. To study the geographical distribution of the performance of both satellite instruments, Figure 3 shows the value of relative MBE (top panels), relative SD (medium panels) and R2 (bottom panels) on a per site basis. The distribution is relatively uniform. It is interesting to note that some coastal sites, especially in the Baltic Sea, with overestimations over +40% of rMBE in GOME-2, are not so overestimated by TROPOMI (all of them in the range ± 20 % ). TROPOMI also tends to overestimation in the coastal stations and to underestimation in the inland stations. In fact, some inland stations around the mediterranean basin show more underestimation than in the rest of Europe, as well as two stations in the north of Norway. rSD is also generally lower in TROPOMI, with most stations below 20%, with only two stations over 40% in northeastern Europe. GOME-2 seems to show smaller values in the southwest of Europe than in the northeast. R2 is also improved in TROPOMI with respect to GOME-2 in most stations, except one in Iceland and two in the east of Norway. GOME-2 also shows lower values of R2 in some coastal stations, especially in the Iberian Peninsula.

3.2. Dependences

This section aims to shed light on what variables or situations decrease GOME-2 and/or TROPOMI IWV estimation performance. For this, relative accuracy (rMBE) and precision (rSD) are evaluated along bins of each variable considered using all measurement pairs from all stations.

3.2.1. Dependence on IWV

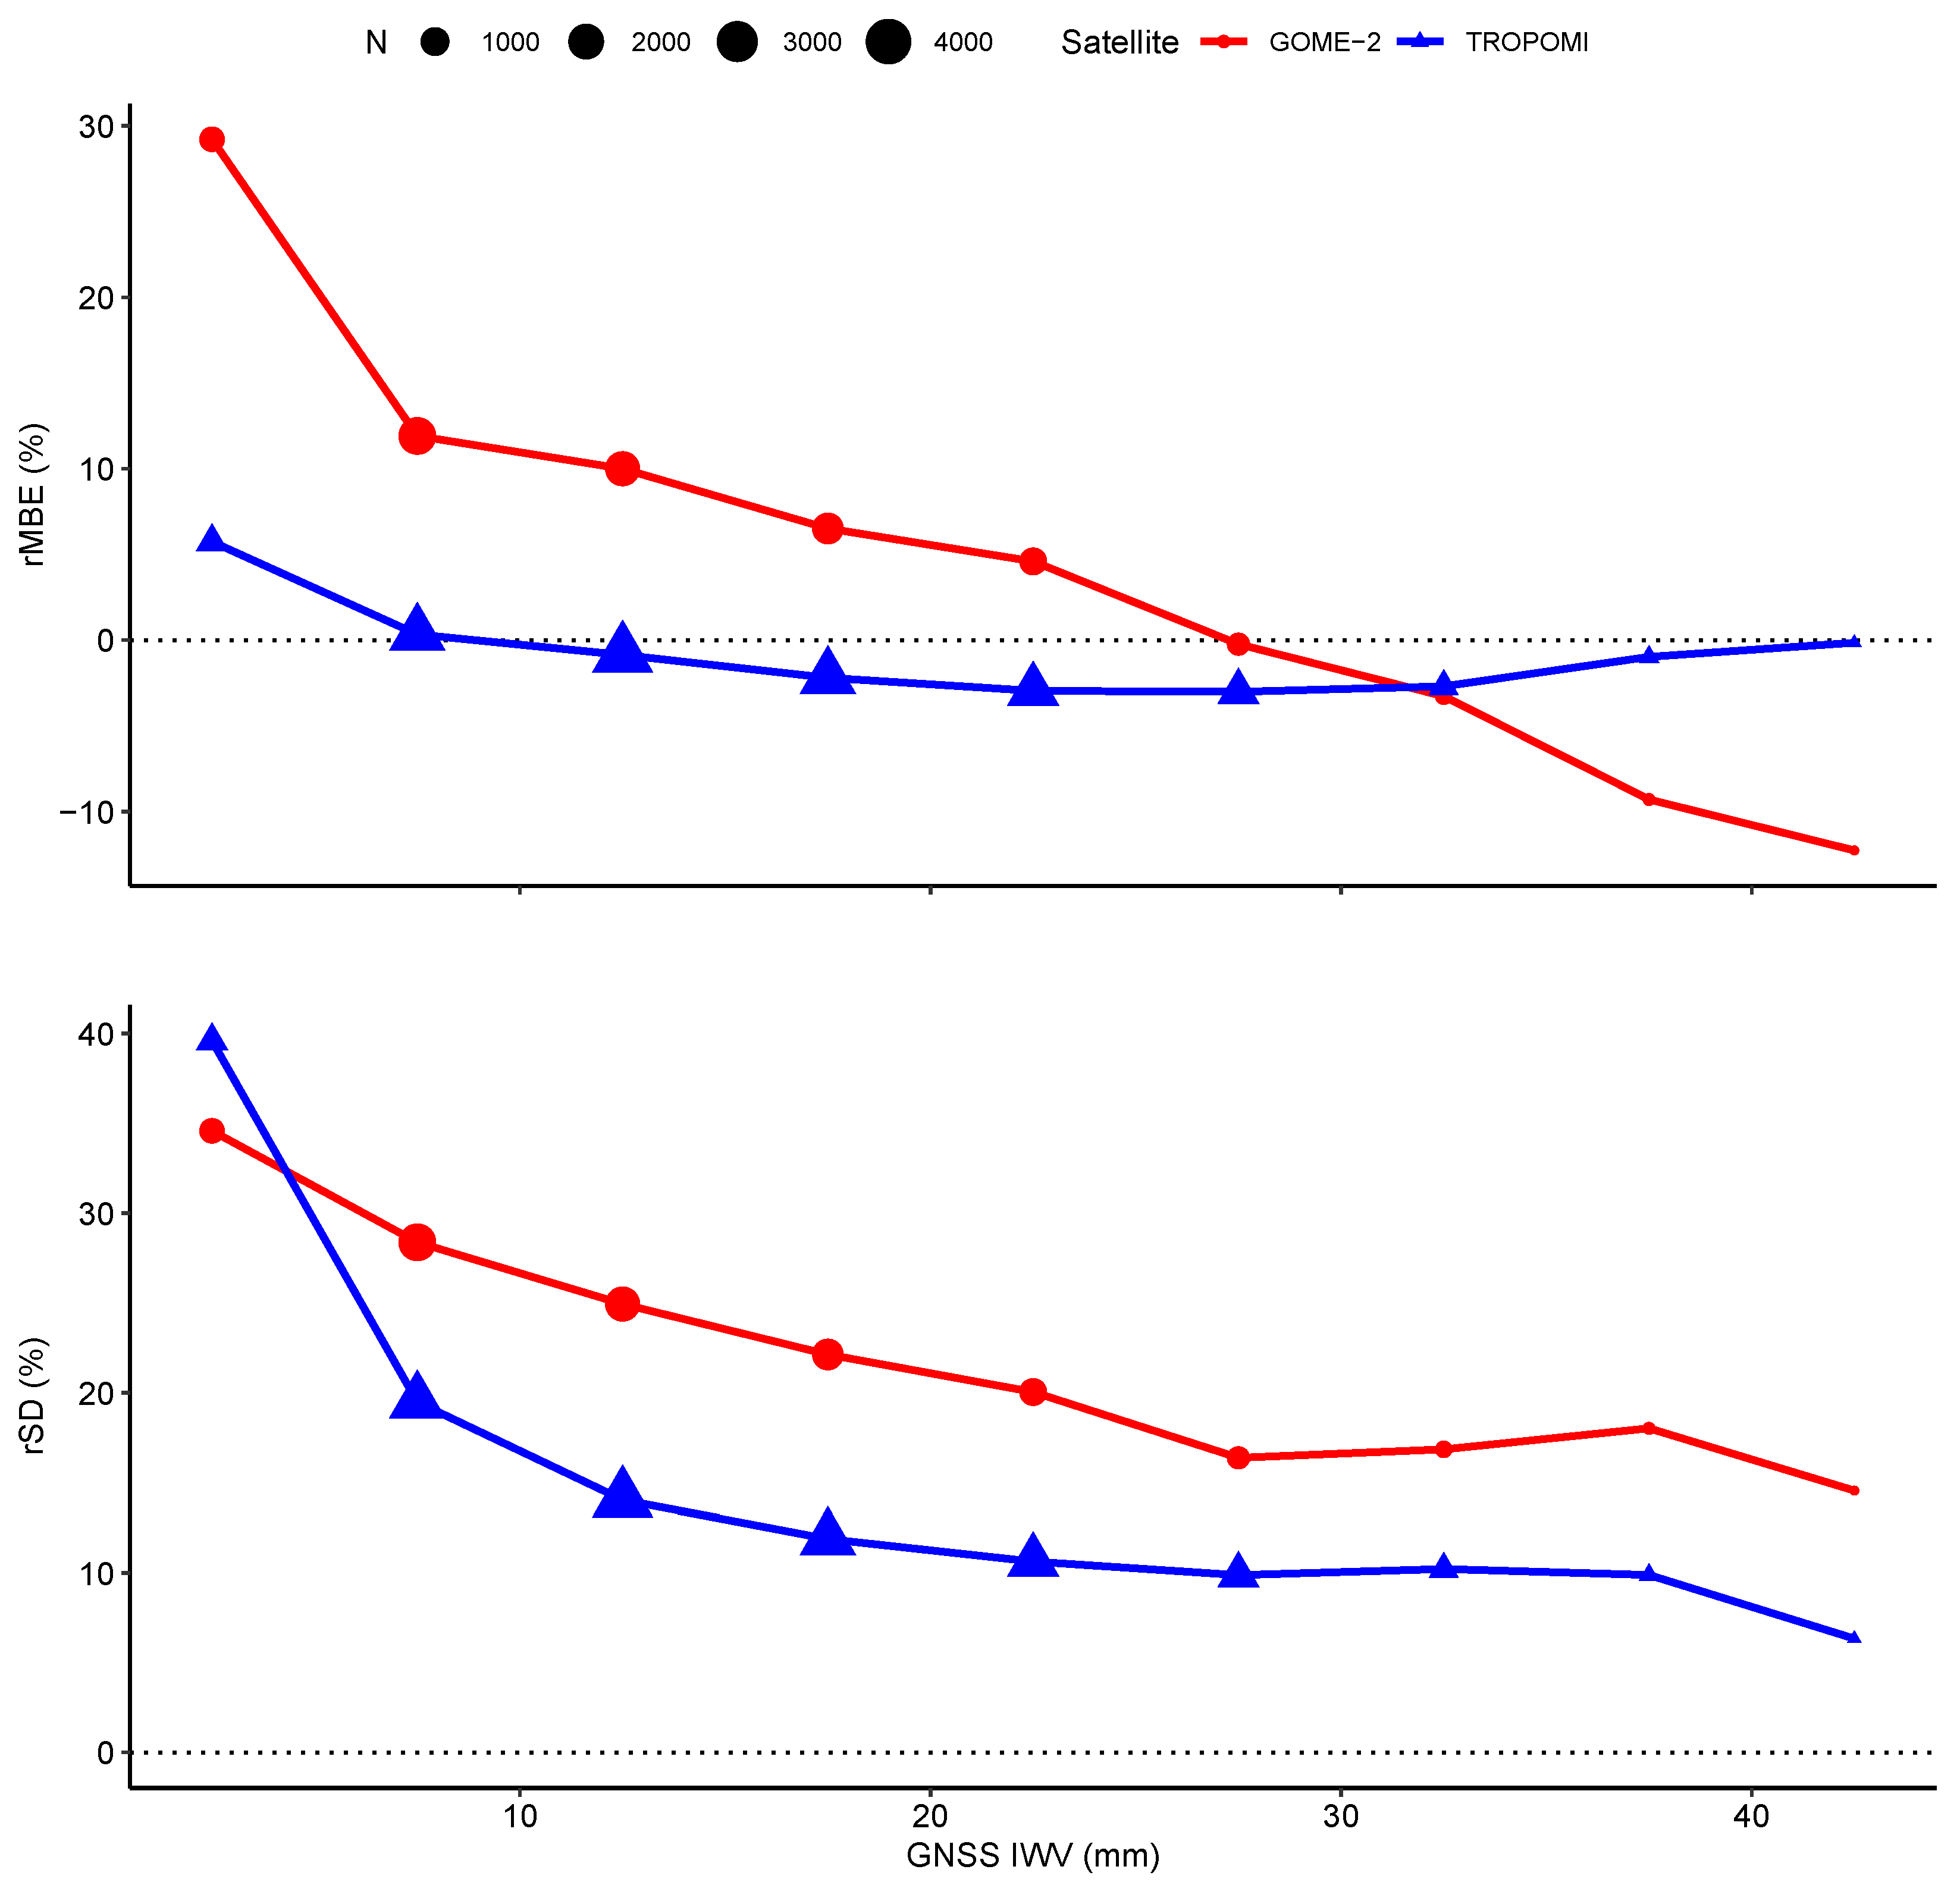
rMBE and rSD for bins of GNSS IWV of width 5 mm are shown in Figure 4. The general behavior is similar for both GOME-2 and TROPOMI, showing overestimation for small IWV and underestimation for large IWV, while rSD decreases with IWV. However, in the case of TROPOMI, the dependence is not so marked. All the TROPOMI bins are in the range from 3.0 to + 5.7 % . On the contrary, GOME-2 rMBE goes from −12.3 to 29.2%. Moreover, rSD decrease is more marked in TROPOMI than in GOME-2, GOME-2 rSD being higher than TROPOMI rSD by approximately 10%. As an exception, TROPOMI rSD for low IWV (0–5 mm ) is slightly higher than GOME-2 rSD. This decreasing behavior has been reported in other works [9,10,11,33]. Part of it could be explained by the low sensitivity of GNSS to low amounts of IWV reported in other works [35,36].

3.2.2. Dependence on SZA

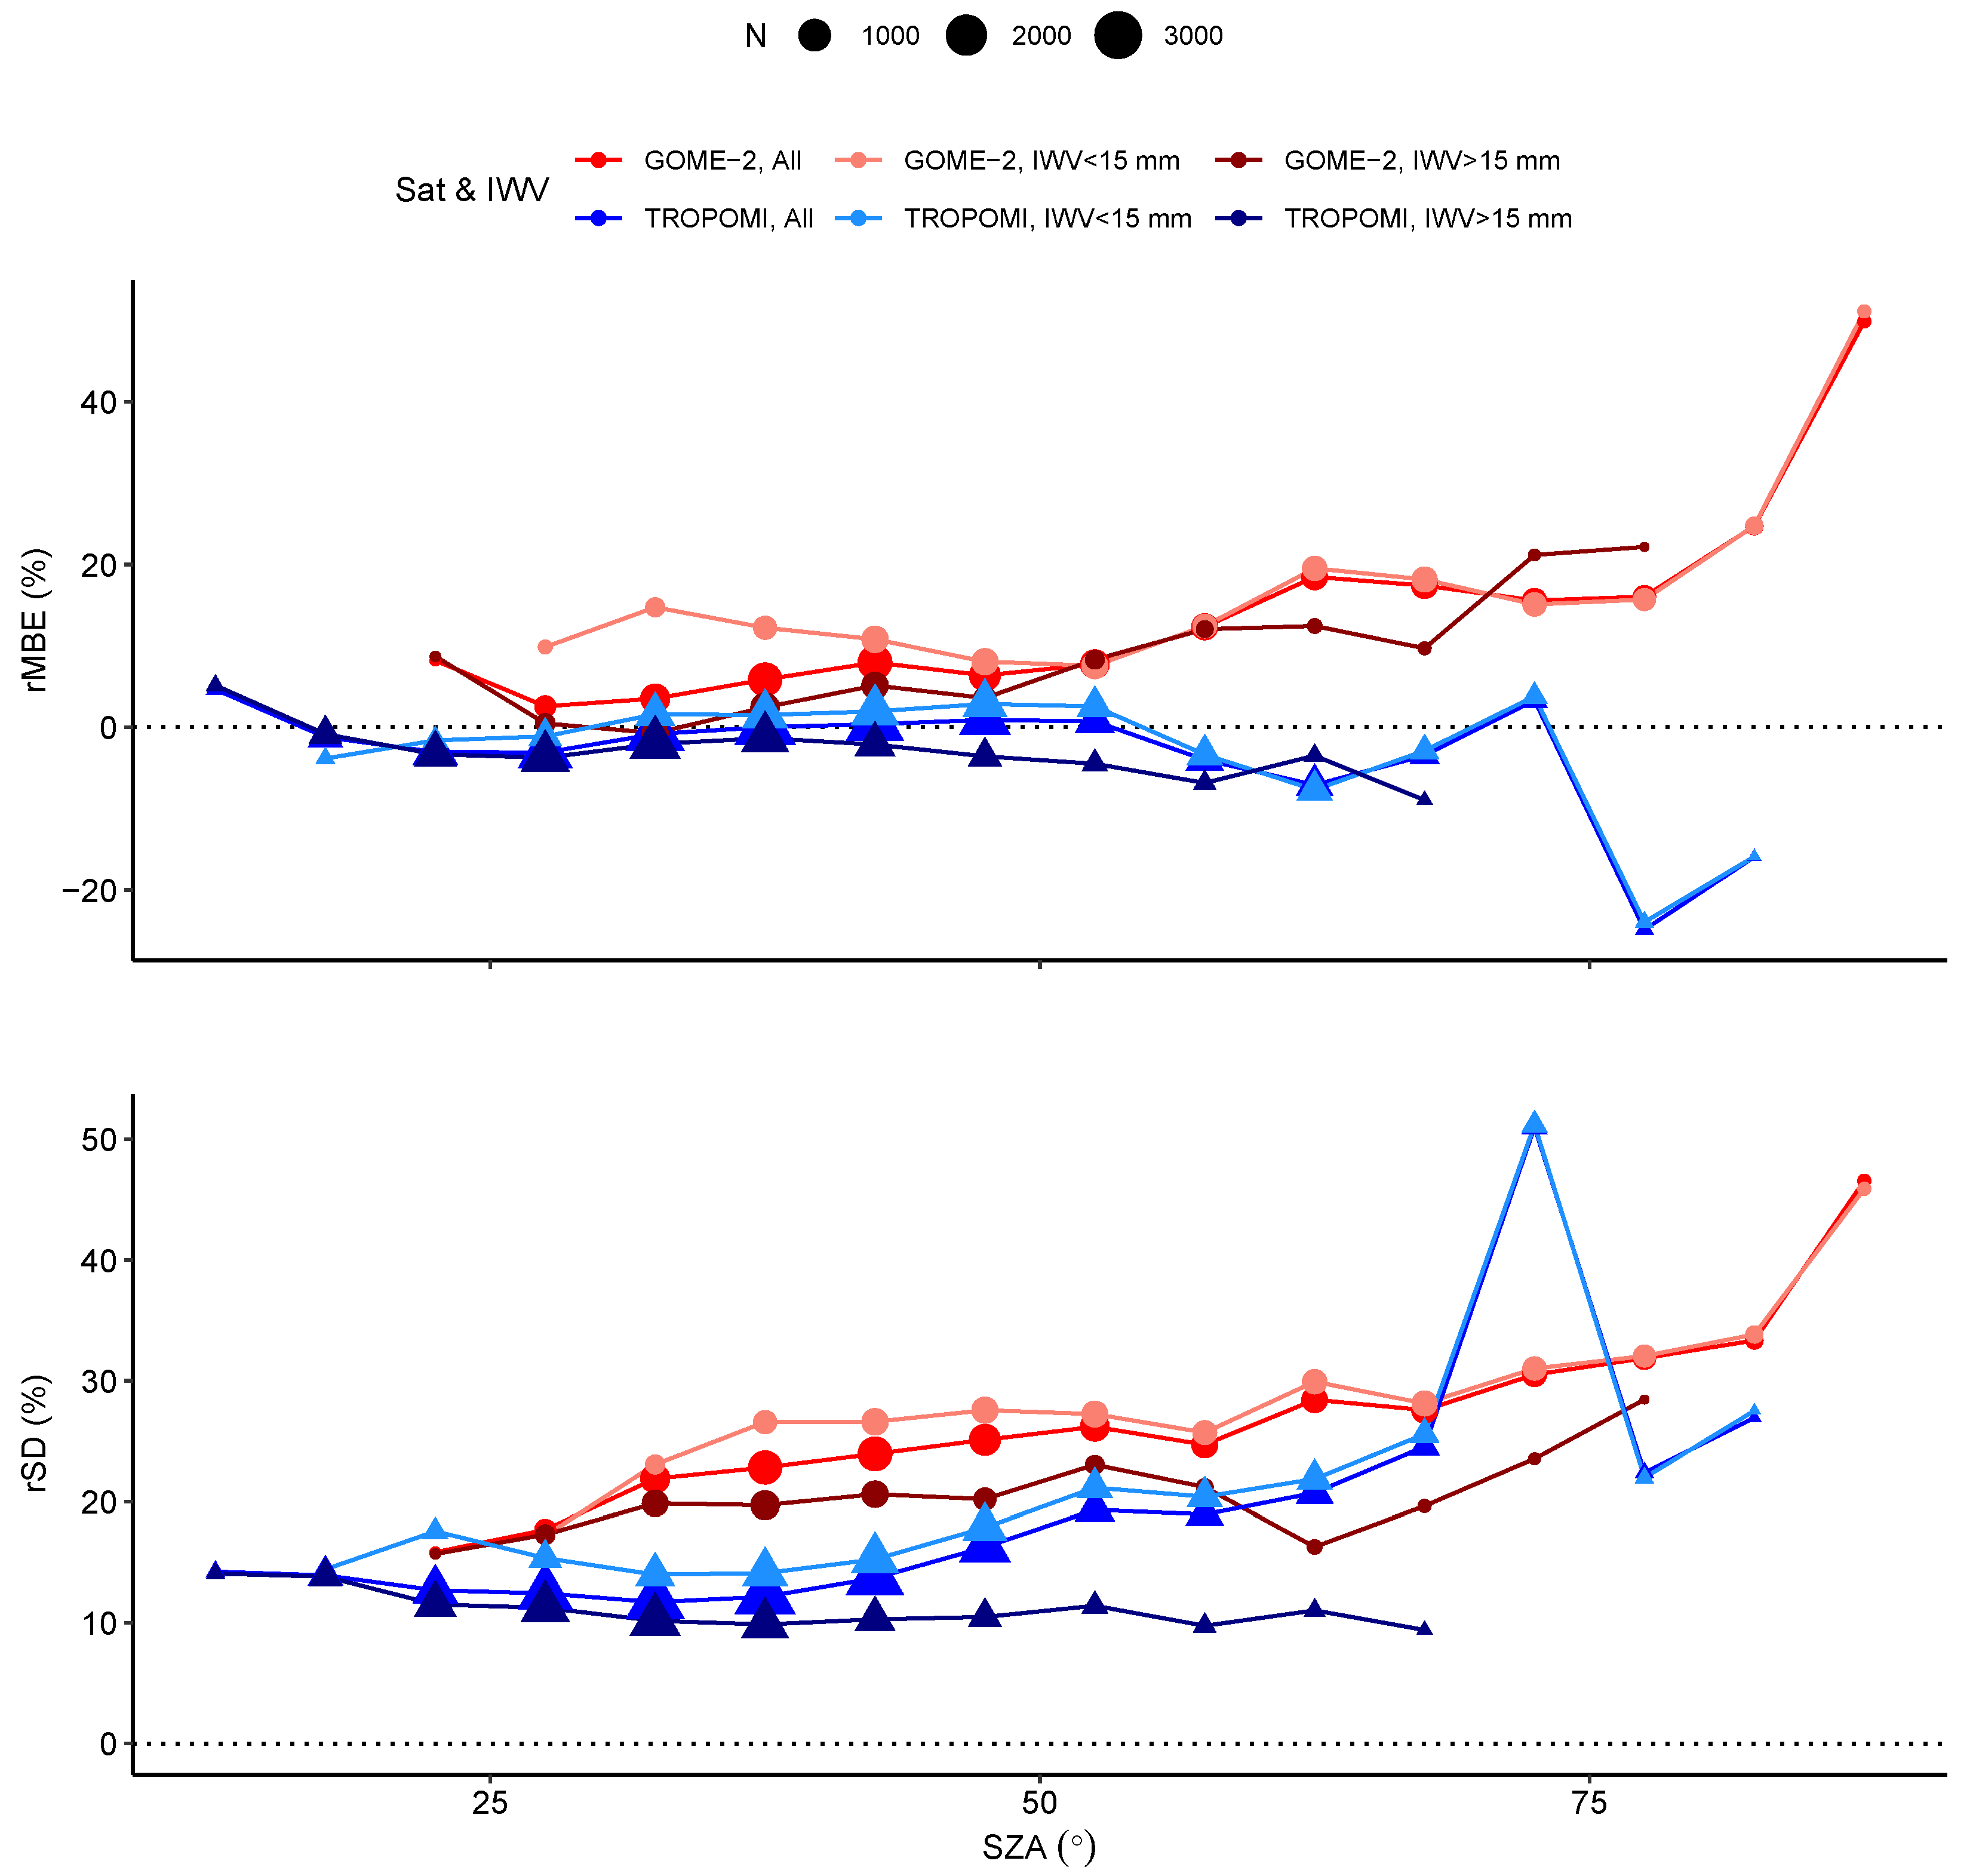
SZA is a variable typically affecting the performance of satellite products, especially those using solar radiation for retrieval [11,33]. Figure 5 shows the rMBE and rSD of both TROPOMI and GOME-2 in bins of 5 . Data have been separated by IWV (more/less than 15 mm and all data) since some studies [9,10] found that IWV can be a confounding factor when it comes to SZA dependence analysis. Both instruments show a similar behavior: rMBE has rather stable values up to SZA = 55 and, for larger SZA, the rMBE increases (to positive values for GOME-2 and to negative ones for TROPOMI). The dependence is more marked for the low IWV subset than for the high IWV one. rSD tends to increase with SZA, but high IWV shows more stable values. In TROPOMI, the high IWV subset shows a slight decrease of rSD as SZA increases.

3.2.3. Dependence on Cloud Fraction

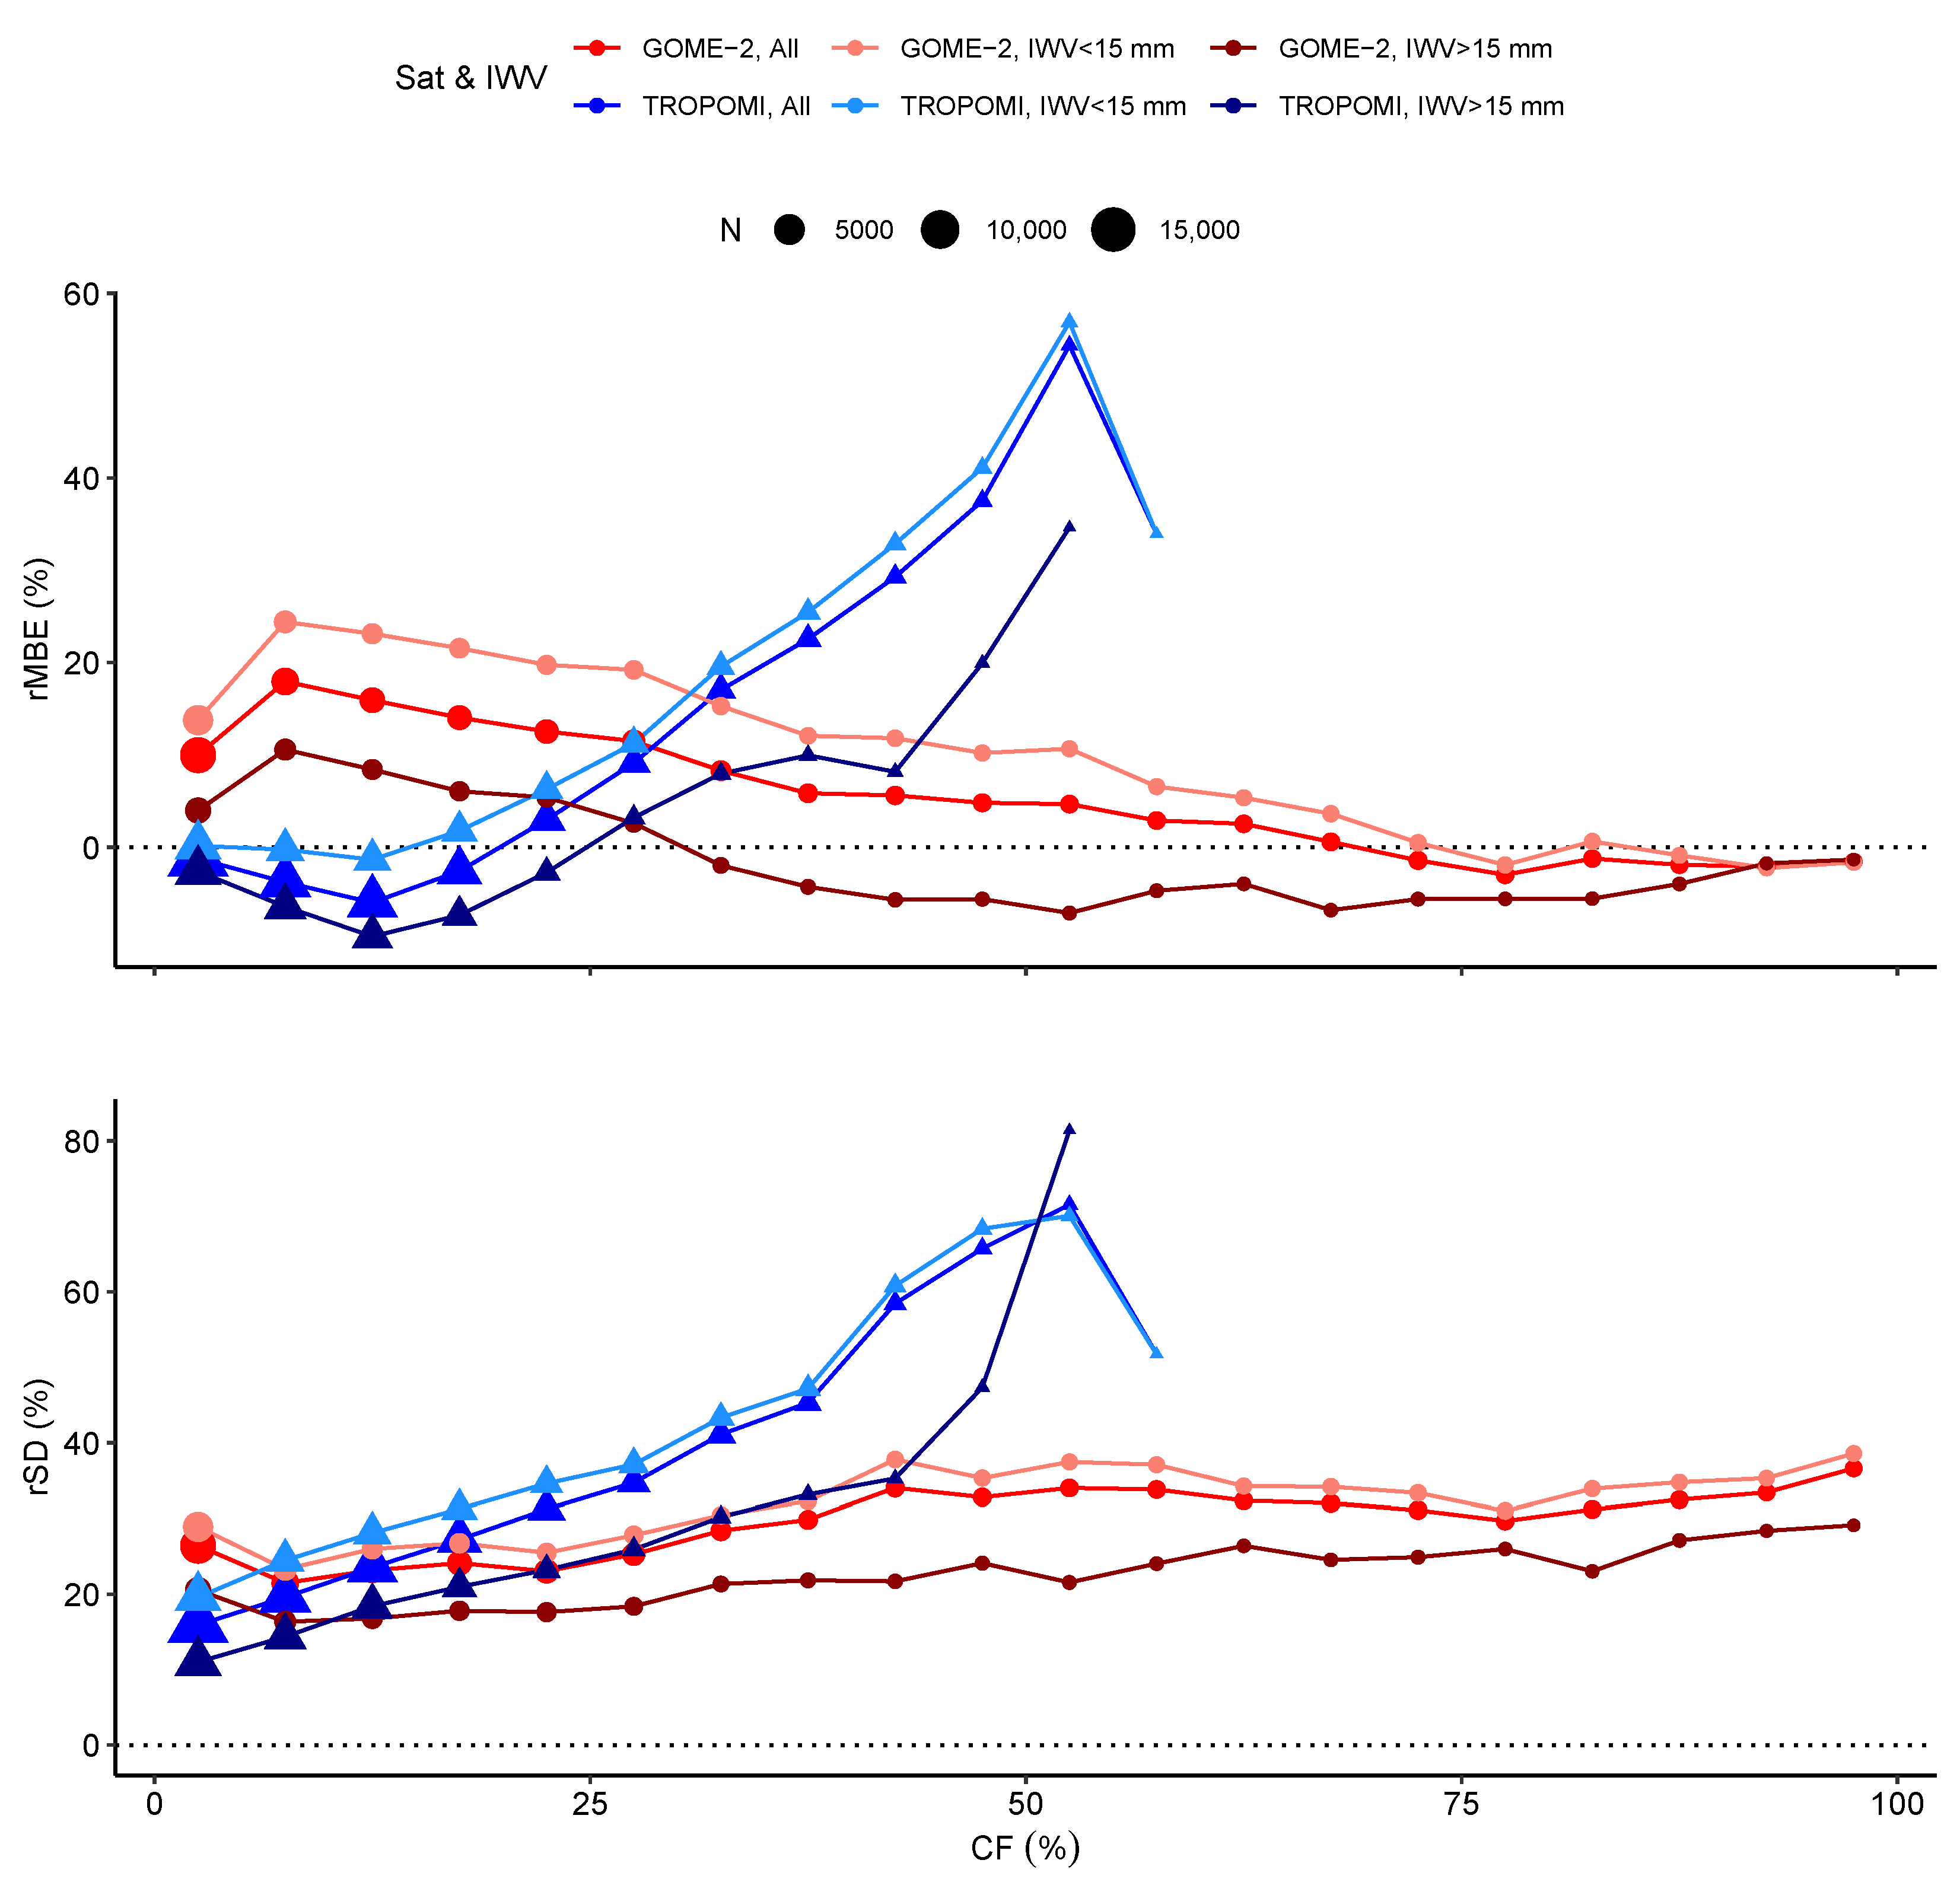
Clouds have been reported to cause the so-called “shielding effect”: water vapor below clouds is not detected by satellite instruments in IR or visible range [8]. A similar effect has been observed in some satellite algorithms used for the ozone retrieval [37,38]. Figure 6 shows that rMBE and rSD values are presented in bins of 5% CF width. Notice that quality assurance in TROPOMI takes out most cloudy data, resulting in lacking sufficient data for CF > 60 % . The behavior of GOME-2 is the following: low CF situations are overestimated, while the overestimation is decreased as CF increases. High IWV is underestimated for CF values over 30%, while low IWV are underestimated for CF values over 80%. TROPOMI, however, has some underestimation (more pronounced for high IWV than for low IWV) for low CF. For CF > 25 % , TROPOMI rMBE turns positive, reaching a maximum at 50 < CF < 55 % . Regarding rSD, GOME-2 shows a relatively stable increase rate as CF increases, with low IWV over high IWV around a ∼ 10 % . However, TROPOMI SD increases as CF increases. High IWV subset shows a steep increase in the interval 40–50% (reaching more than ∼ 80 % ). This shows that the TROPOMI algorithm for handling cloud scenes can be improved.

4. Conclusions

This work compares TROPOMI IWV, a product using a new algorithm, and the standard GOME-2 IWV product, which has been already widely tested and is operational, both against reference GNSS data in European sites. The period considered, May 2018 to May 2019, allows us to put into context the quality of the new TROPOMI product. However, it needs to be extended in further work to be able to generalize the conclusions drawn from the present work.
The analysis have been considered for cloud free situations ( CF < 5 % ) It has been observed that, in general terms, TROPOMI yields better dispersion (SD and rSD) with respect to GNSS than GOME-2. Moreover, TROPOMI generally shows less bias than GOME-2. In addition, the latter is more prone to overestimations of IWV and the former to underestimations. However, while GOME-2 yields relatively accurate error estimates, this TROPOMI product provides too conservative uncertainties for IWV.
The dependence of the differences satellite-GNSS on some variables is also analyzed. First, the dependence on the IWV itself is considered. It is shown that overestimation occurs at low IWV, while underestimation occurs at high IWV values. However, TROPOMI shows a less marked dependence on the IWV value. In both satellite instruments, the rSD decreases as IWV increases. GOME-2’s rSD is higher than TROPOMI’s except for low IWV (0–5 mm) values.
Dependence on SZA is also considered. In this case, overestimation in GOME-2 slightly increases with SZA. This increase becomes steeper when high SZA (over 70 ) is considered. TROPOMI, however, shows rather stable values of rMBE (slightly positive rMBE for low IWV and slightly negative for high IWV). On the contrary, for SZA > 55 , it decreases to some underestimation. For high SZA, GOME-2 overestimation is more important than TROPOMI’s. Regarding rSD, both satellite instruments show rather stable values. The values increase with SZA for SZA > 75 , with the exception of the TROPOMI high IWV subset. In that case, rSD is rather stable (even slightly decreasing) with SZA.
In addition, the effect of cloudiness in the satellite instruments performance is analyzed. The shielding effect is observed in the case of GOME-2 (especially for high IWV). In addition, TROPOMI rMBE and rSD peaks at the 50–55% CF bin. In contrast, GOME-2 rSD is rather stable with CF, slightly increasing.
The TROPOMI new algorithm for IWV estimation shows better results than the GOME-2 operational IWV product. This highlights that information from TROPOMI can be of the highest interest for the estimation of water vapor. It also mentions that it some tuning of the algorithm is necessary to avoid the dependences of the variables of study, especially with CF.

Author Contributions

J.V.-M.: Formal analysis, Methodology, Writing—original draft; M.A.: Funding acquisition, Conceptualization, writing—review and editing; K.L.C.: Data curation, writing—review and editing; D.L.: Conceptualization, writing—review and editing. All authors have read and agreed to the published version of the manuscript.

Funding

This work was partially supported by Junta de Extremadura and ERDF funds (IB18092). J.V.-M. was supported by a predoctoral fellowship (PD18029) from Junta de Extremadura and the European Social Fund. The authors thank ECMWF and IGS for providing the data necessary for this work.

Data Availability Statement

The data presented in this study are available on request from the corresponding author.

Conflicts of Interest

The authors declare no conflict of interest.

Abbreviations

The following abbreviations are used in this manuscript:
AMFAir Mass Factor
CFCloud Fraction
DOASDifferential Optical Absorption Spectrography
ECMWFEuropean Centre for Medium-Range Weather Forecasts
ENVISATEnvironmental Satellite
ERA5ECMWF ReAnalisys-5
EUMETSATEuropean Organisation for the Exploitation of Meteorological Satellites
GNSSGlobal Navigation Satellite Systems
GOME-2Global Ozone Monitoring Experiment-2
IGSInternational GNSS Service
IWVIntegrated Water Vapor
S5PSentinel-5 Precursor
SCDSlant Column Density
SCIAMACHYSCanning Imaging Absorption SpectroMeter for Atmospheric CHartographY
SZASolar Zenith Angle
TROPOMITROPOspheric Monitoring Instrument
VCDVertical Column Density
ZHDZenith Hydrostatic Delay
ZTDZenith Tropospheric Delay
ZWDZenith Wet Delay

References

  1. Myhre, G.; Shindell, D.; Bréon, F.M.; Collins, W.; Fuglestvedt, J.; Huang, J.; Koch, D.; Lamarque, J.F.; Lee, D.; Mendoza, B.; et al. Anthropogenic and Natural Radiative Forcing. In Climate Change 2013: The Physical Science Basis. Contribution of Working Group I to the Fifth Assessment Report of the Intergovernmental Panel on Climate Change; IPCC ed.; Cambridge University Press: Cambridge, UK, 2013; pp. 659–740. [Google Scholar]
  2. Colman, R. A Comparison of Climate Feedbacks in General Circulation Models. Clim. Dyn. 2003, 20, 865–873. [Google Scholar] [CrossRef]
  3. Colman, R.A. Climate Radiative Feedbacks and Adjustments at the Earth’s Surface. J. Geophys. Res. Atmos. 2015, 120, 3173–3182. [Google Scholar] [CrossRef]
  4. Vaquero-Martínez, J.; Antón, M. Review on the Role of GNSS Meteorology in Monitoring Water Vapor for Atmospheric Physics. Remote Sens. 2021, 13, 2287. [Google Scholar] [CrossRef]
  5. Köpken, C. Validation of Integrated Water Vapor from Numerical Models Using Ground-Based GPS, SSM/I, and Water Vapor Radiometer Measurements. J. Appl. Meteorol. 2001, 40, 1105–1117. [Google Scholar] [CrossRef]
  6. Prasad, A.K.; Singh, R.P. Validation of MODIS Terra, AIRS, NCEP/DOE AMIP-II Reanalysis-2, and AERONET Sun Photometer Derived Integrated Precipitable Water Vapor Using Ground-Based GPS Receivers over India. J. Geophys. Res. 2009, 114, D05107. [Google Scholar] [CrossRef] [Green Version]
  7. Rama Varma Raja, M.K.; Gutman, S.I.; Yoe, J.G.; McMillin, L.M.; Zhao, J. The Validation of AIRS Retrievals of Integrated Precipitable Water Vapor Using Measurements from a Network of Ground-Based GPS Receivers over the Contiguous United States. J. Atmos. Ocean. Technol. 2008, 25, 416–428. [Google Scholar] [CrossRef]
  8. Román, R.; Antón, M.; Cachorro, V.; Loyola, D.; Ortiz de Galisteo, J.; de Frutos, A.; Romero-Campos, P. Comparison of Total Water Vapor Column from GOME-2 on MetOp-A against Ground-Based GPS Measurements at the Iberian Peninsula. Sci. Total Environ. 2015, 533, 317–328. [Google Scholar] [CrossRef] [Green Version]
  9. Vaquero-Martínez, J.; Antón, M.; Ortiz de Galisteo, J.P.; Cachorro, V.E.; Costa, M.J.; Román, R.; Bennouna, Y.S. Validation of MODIS Integrated Water Vapor Product against Reference GPS Data at the Iberian Peninsula. Int. J. Appl. Earth Obs. Geoinf. 2017, 63, 214–221. [Google Scholar] [CrossRef] [Green Version]
  10. Vaquero-Martínez, J.; Antón, M.; Ortiz de Galisteo, J.P.; Cachorro, V.E.; Wang, H.; González Abad, G.; Román, R.; Costa, M.J. Validation of Integrated Water Vapor from OMI Satellite Instrument against Reference GPS Data at the Iberian Peninsula. Sci. Total Environ. 2017, 580, 857–864. [Google Scholar] [CrossRef]
  11. Vaquero-Martínez, J.; Antón, M.; Román, R.; Cachorro, V.E.; Wang, H.; González Abad, G.; Ritter, C. Water Vapor Satellite Products in the European Arctic: An Inter-Comparison against GNSS Data. Sci. Total Environ. 2020, 741, 140335. [Google Scholar] [CrossRef]
  12. Guerova, G.; Jones, J.; Douša, J.; Dick, G.; de Haan, S.; Pottiaux, E.; Bock, O.; Pacione, R.; Elgered, G.; Vedel, H.; et al. Review of the State of the Art and Future Prospects of the Ground-Based GNSS Meteorology in Europe. Atmos. Meas. Tech. 2016, 9, 5385–5406. [Google Scholar] [CrossRef] [Green Version]
  13. Antón, M.; Loyola, D.; Román, R.; Vömel, H. Validation of GOME-2/MetOp-A Total Water Vapour Column Using Reference Radiosonde Data from the GRUAN Network. Atmos. Meas. Tech. 2015, 8, 1135–1145. [Google Scholar] [CrossRef] [Green Version]
  14. Kalakoski, N.; Kujanpää, J.; Sofieva, V.; Tamminen, J.; Grossi, M.; Valks, P. Validation of GOME-2/Metop Total Column Water Vapour with Ground-Based and in Situ Measurements. Atmos. Meas. Tech. 2016, 9, 12. [Google Scholar] [CrossRef] [Green Version]
  15. Veefkind, J.; Aben, I.; McMullan, K.; Förster, H.; de Vries, J.; Otter, G.; Claas, J.; Eskes, H.; de Haan, J.; Kleipool, Q.; et al. TROPOMI on the ESA Sentinel-5 Precursor: A GMES Mission for Global Observations of the Atmospheric Composition for Climate, Air Quality and Ozone Layer Applications. Remote Sens. Environ. 2012, 120, 70–83. [Google Scholar] [CrossRef]
  16. Schneider, A.; Borsdorff, T.; aan de Brugh, J.; Aemisegger, F.; Feist, D.G.; Kivi, R.; Hase, F.; Schneider, M.; Landgraf, J. First Data Set of H2O/HDO Columns from the Tropospheric Monitoring Instrument (TROPOMI). Atmos. Meas. Tech. 2020, 13, 85–100. [Google Scholar] [CrossRef] [Green Version]
  17. Borger, C.; Beirle, S.; Dörner, S.; Sihler, H.; Wagner, T. Total Column Water Vapour Retrieval from S-5P/TROPOMI in the Visible Blue Spectral Range. Atmos. Meas. Tech. 2020, 13, 2751–2783. [Google Scholar] [CrossRef]
  18. Küchler, T.; Noël, S.; Bovensmann, H.; Burrows, J.P.; Wagner, T.; Borger, C.; Borsdorff, T.; Schneider, A. Total Water Vapour Columns Derived from Sentinel 5p Using the AMC-DOAS Method. Atmos. Meas. Tech. 2022, 15, 297–320. [Google Scholar] [CrossRef]
  19. Chan, K.L.; Valks, P.; Slijkhuis, S.; Köhler, C.; Loyola, D. Total Column Water Vapor Retrieval for Global Ozone Monitoring Experience-2 (GOME-2) Visible Blue Observations. Atmos. Meas. Tech. 2020, 13, 4169–4193. [Google Scholar] [CrossRef]
  20. Chan, K.L.; Xu, J.; Slijkhuis, S.; Valks, P.; Loyola, D. TROPOspheric Monitoring Instrument Observations of Total Column Water Vapour: Algorithm and Validation. Sci. Total Environ. 2022, 821, 153232. [Google Scholar] [CrossRef]
  21. Bevis, M.; Businger, S.; Herring, T.A.; Rocken, C.; Anthes, R.A.; Ware, R.H. GPS Meteorology: Remote Sensing of Atmospheric Water Vapor Using the Global Positioning System. J. Geophys. Res. 1992, 97, 15787. [Google Scholar] [CrossRef]
  22. Saastamoinen, J. Atmospheric Correction for the Troposphere and Stratosphere in Radio Ranging Satellites. In Geophysical Monograph Series; Henriksen, S.W., Mancini, A., Chovitz, B.H., Eds.; American Geophysical Union: Washington, DC, USA, 1972; pp. 247–251. [Google Scholar] [CrossRef]
  23. Hersbach, H.; Bell, B.; Berrisford, P.; Hirahara, S.; Horányi, A.; Muñoz-Sabater, J.; Nicolas, J.; Peubey, C.; Radu, R.; Schepers, D.; et al. The ERA5 Global Reanalysis. Q. J. R. Meteorol. Soc. 2020, 146, 1999–2049. [Google Scholar] [CrossRef]
  24. Wang, X.; Zhang, K.; Wu, S.; Fan, S.; Cheng, Y. Water Vapor-Weighted Mean Temperature and Its Impact on the Determination of Precipitable Water Vapor and Its Linear Trend: Water Vapor-Weighted Mean Temperature. J. Geophys. Res. Atmos. 2016, 121, 833–852. [Google Scholar] [CrossRef]
  25. Callies, J.; Corpaccioli, E.; Eisinger, M.; Hahne, A.; Lefebvre, A. GOME-2-Metop’s Second-Generation Sensor for Operational Ozone Monitoring. ESA-Bull.-Eur. Space Agency 2000, 102, 28–36. [Google Scholar]
  26. Munro, R.; Lang, R.; Klaes, D.; Poli, G.; Retscher, C.; Lindstrot, R.; Huckle, R.; Lacan, A.; Grzegorski, M.; Holdak, A.; et al. The GOME-2 Instrument on the Metop Series of Satellites: Instrument Design, Calibration, and Level 1 Data Processing—An Overview. Atmos. Meas. Tech. 2016, 9, 1279–1301. [Google Scholar] [CrossRef] [Green Version]
  27. Platt, U.; Stutz, J. Differential Optical Absorption Spectroscopy: Principles and Applications; Physics of Earth and Space Environments; Springer: Berlin, Germany, 2008. [Google Scholar]
  28. Grossi, M.; Valks, P.; Loyola, D.; Aberle, B.; Slijkhuis, S.; Wagner, T.; Beirle, S.; Lang, R. Total Column Water Vapour Measurements from GOME-2 MetOp-A and MetOp-B. Atmos. Meas. Tech. 2015, 8, 1111–1133. [Google Scholar] [CrossRef] [Green Version]
  29. Wagner, T.; Beirle, S.; Grzegorski, M.; Platt, U. Global Trends (1996-2003) of Total Column Precipitable Water Observed by Global Ozone Monitoring Experiment (GOME) on ERS-2 and Their Relation to near-Surface Temperature. J. Geophys. Res. 2006, 111, D12102. [Google Scholar] [CrossRef] [Green Version]
  30. Wagner, T.; Heland, J.; Zöger, M.; Platt, U. A Fast H2O Total Column Density Product from GOME: Validation with in-Situ Aircraft Measurements. Atmos. Chem. Phys. Discuss. 2003, 3, 323–353. [Google Scholar] [CrossRef]
  31. Wagner, T.; Beirle, S.; Deutschmann, T. Three-Dimensional Simulation of the Ring Effect in Observations of Scattered Sun Light Using Monte Carlo Radiative Transfer Models. Atmos. Meas. Tech. 2009, 2, 113–124. [Google Scholar] [CrossRef] [Green Version]
  32. Loyola, D.G.; Xu, J.; Heue, K.P.; Zimmer, W. Applying FP_ILM to the Retrieval of Geometry-Dependent Effective Lambertian Equivalent Reflectivity (GE_LER) Daily Maps from UVN Satellite Measurements. Atmos. Meas. Tech. 2020, 13, 985–999. [Google Scholar] [CrossRef] [Green Version]
  33. Vaquero-Martínez, J.; Antón, M.; Ortiz de Galisteo, J.P.; Cachorro, V.E.; Álvarez-Zapatero, P.; Román, R.; Loyola, D.; Costa, M.J.; Wang, H.; Abad, G.G.; et al. Inter-Comparison of Integrated Water Vapor from Satellite Instruments Using Reference GPS Data at the Iberian Peninsula. Remote Sens. Environ. 2018, 204, 729–740. [Google Scholar] [CrossRef]
  34. Garane, K.; Chan, K.L.; Koukouli, M.E.; Loyola, D.; Balis, D. TROPOMI/S5P Total Column Water Vapor Validation against AERONET Ground-Based Measurements. Atmos. Meas. Tech. Discuss. 2022, 1–22. [Google Scholar] [CrossRef]
  35. Wang, J.; Zhang, L.; Dai, A.; Van Hove, T.; Van Baelen, J. A Near-Global, 2-Hourly Data Set of Atmospheric Precipitable Water from Ground-Based GPS Measurements. J. Geophys. Res. 2007, 112, D11107. [Google Scholar] [CrossRef] [Green Version]
  36. Schneider, M.; Romero, P.M.; Hase, F.; Blumenstock, T.; Cuevas, E.; Ramos, R. Continuous Quality Assessment of Atmospheric Water Vapour Measurement Techniques: FTIR, Cimel, MFRSR, GPS, and Vaisala RS92. Atmos. Meas. Tech. 2010, 3, 323–338. [Google Scholar] [CrossRef] [Green Version]
  37. Kokhanovsky, A.; Rozanov, V. The Uncertainties of Satellite DOAS Total Ozone Retrieval for a Cloudy Sky. Atmos. Res. 2008, 87, 27–36. [Google Scholar] [CrossRef]
  38. Antón, M.; Loyola, D. Influence of Cloud Properties on Satellite Total Ozone Observations. J. Geophys. Res. 2011, 116, D03208. [Google Scholar] [CrossRef]
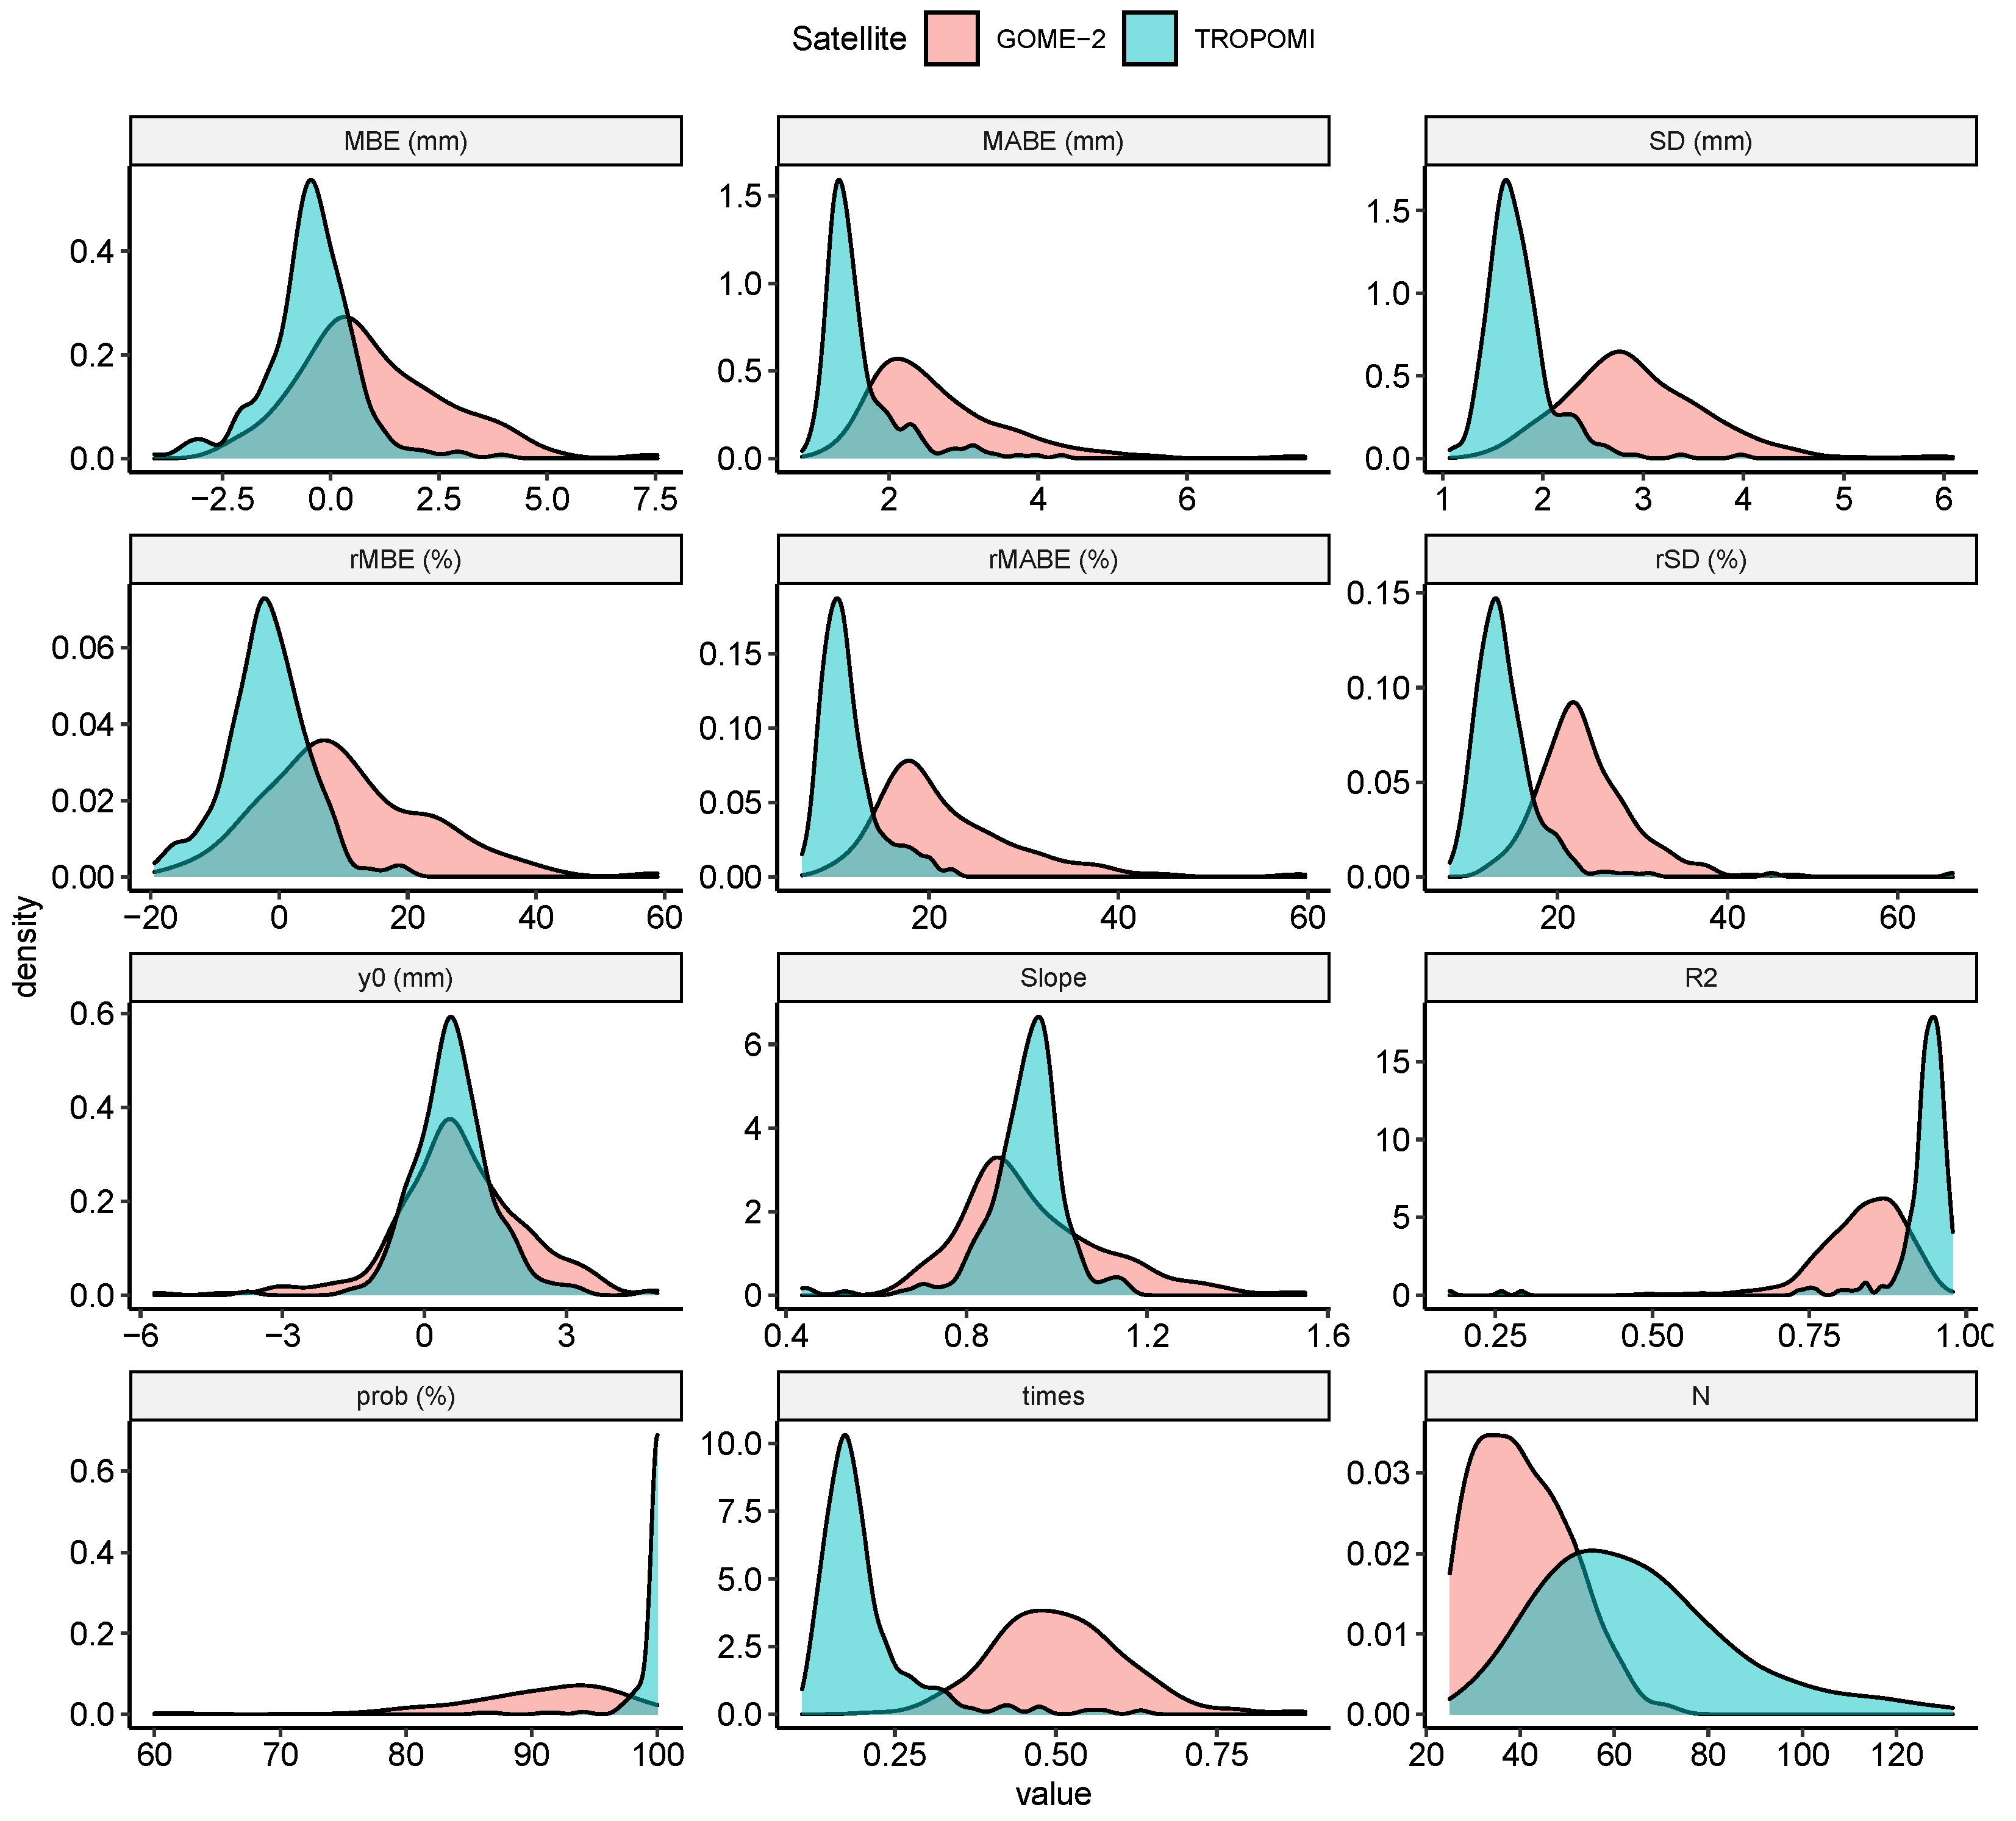
Figure 1. Statistical parameters for all stations. Values are given in mm for MBE, MABE, SD, y0; in percent for rMBE, rMABE, and rSD, while slope, R2 (correlation coefficient) and N (number of data) are unitless. Each value is calculated station-wise.
Atmosphere 13 01079 g001
Figure 2. Scatterplot of GOME-2 (left) and TROPOMI (right) IWV vs. GNSS IWV. Dotted, grey lines show the 20 % error ( ± 5 mm ); the dotted, black line is the ideal 1:1 line; and the red, solid line is the linear fit.
Atmosphere 13 01079 g002
Figure 3. Maps of rMBE (top), rSD (middle) and R2 (bottom) of TROPOMI (left) and GOME-2 (right) IWV with respect to GNSS IWV.
Atmosphere 13 01079 g003
Figure 4. rMBE and rSD against IWV in bins of 5 mm. Size of points indicates the number of data in that bin.
Atmosphere 13 01079 g004
Figure 5. rMBE and rSD against SZA in bins of 5°. Data are also divided by high IWV (darker colors), all data (regular color) and low IWV (light color).
Atmosphere 13 01079 g005
Figure 6. rMBE and rSD against CF in bins of 5%. Data are also divided by high IWV (darker colors), all data (regular colors) and low IWV (light colors).
Atmosphere 13 01079 g006
Publisher’s Note: MDPI stays neutral with regard to jurisdictional claims in published maps and institutional affiliations.