Article

Optimization Study of Sampling Device for Semi-Volatile Oil Mist in the Industrial Workshop

1
Tianjin Key Laboratory of Indoor Air Environmental Quality Control, School of Environmental Science and Engineering, Tianjin University, Tianjin 300072, China
2
Wuhan Second Ship Design and Research Institute, Wuhan 430010, China
*
Author to whom correspondence should be addressed.
Atmosphere 2022, 13(7), 1048; https://doi.org/10.3390/atmos13071048
Submission received: 4 May 2022 / Revised: 6 June 2022 / Accepted: 29 June 2022 / Published: 30 June 2022
(This article belongs to the Section Aerosols)

Abstract

:
A large number of metalworking fluids in industrial manufacturing processes generate high-concentrations of oil mist pollution, which is a typical semi-volatile aerosol and is generally composed of liquid particles and volatile gas components. Long-term exposure to oil mist pollution brings a series of occupational diseases to workers. For the semi-volatile aerosol, the traditional filter sampling method will lead to particle volatilization, which underestimates the concentration of particles and overestimates the concentration of gas. Therefore, this study combined the advantages of the electrostatic method and the Tenax tube adsorption method, to develop a more accurate measurement technology. First, a dichotomous sampler that could efficiently separate the gas and liquid phases of aerosols was optimized through a numerical model, which was validated by literature results. Next, a test table for oil mist sampling was built with a sampler which was fabricated by 3D printing, and the performance of the sampler was evaluated. The results show that the sampling technique can separate the gas and particulate phases of the oil mist efficiently and accurately. Compared with the traditional single sampling methods, the new sampler can better determine the true concentration of oil mist.

1. Introduction

The wide use of metalworking fluids in the machining industry has caused many environmental pollution problems. The primary pollutants in the air are various aerosols, which are harmful to human health [1,2,3,4,5,6,7]. As a typical semi-volatile aerosol, oil mist is generally produced in the processes of evaporation and condensation or centrifugal collision, and it is a uniform dispersion system composed of particulate matter and volatile gas components [8,9,10,11]. In recent years, with growing public emphasis on safety and environmental protection, quantitative technology for the detection of semi-volatile aerosols has received increasing attention from researchers [12,13,14,15,16]. Due to oil mist’s complex composition, there is currently no unified experimental method that will detect it accurately and quantitatively.
Traditionally, the sample methods for oil mist include the filter method and electrostatic precipitator method for the particle phase, and the Tenax tube adsorption method for the gas phase [17,18,19,20,21]. Leith et al. [22] evaluated the possibility of oil mist evaporation from filters and electrostatic precipitators and found that the quality of oil mist captured by electrostatic methods was significantly higher than that captured by filters. Volckens et al. [23] compared the sampling of oil mist particles by methods such as filtration, electrostatic precipitation and light scattering, and found that the use of electrostatic sampling significantly reduced the error caused by the volatilization of oily particles, but it was impossible to measure volatile products at the same time. Based on NIOSH 5524, Raynor et al. [24] used a glass fiber filter membrane with a diameter of 37 mm to weigh and sample oil mist, and found if the compounds in the filtered droplets are volatile or semi-volatile, they may evaporate into the gas passing through the filter. In sampling applications, failure to properly account for the evaporation of collected mist can lead to underestimated mist concentration. Simpson et al. [25] identified kinematic viscosity as a clearer indicator of the suitability of oil mist for filter sampling. When the filter was sampled on mineral oil with a certain low viscosity, sampling would greatly underestimate the true value, and they [26] discussed the influence of diffusion absorption rate and the wall deposition effect on gaseous pollutants sampled by Tenax tubes. The results showed that this method would sample both particulate matter and gas at the same time, and it was not suitable for the sampling of semi-volatile aerosols. In summary, these sampling methods in the existing research cannot capture the particle and gas component of the oil mist well at the same time. One solution is to separate the particle phase and gas phase first, and then integrate the sampling method of the particle phase and gas phase.
Common equipment for aerosol separation includes the diffuser, the inertial impactor, and the virtual impactor [27,28,29,30,31,32]. In the case of the diffuser, since the diffusion coefficients of particles and gas in the diffusion tube are different, separation is achieved as the gas diffuses to the tube wall and the particles flow out through the tube. However, this method usually samples only the compounds attached to the internal paint of the pipe wall, and there are large errors in the sampling of semi-volatile aerosols with complex components [33]. Meanwhile, inertial impactors have been widely used to collect particles in the air, but there is observable interaction between the particles and the impact plate, such as particle breakage, bounce, and overload [34]. As shown in Figure 1, the concept of a virtual collection surface has been introduced into the inertial impactor with the use of collection nozzles instead of impact plates. Kim et al. [35] developed a semi-volatile aerosol dichotomous sampler based on a virtual impactor. The results of oil mist sampling showed that the sampler could effectively separate particulate matter and gaseous phase, and the two-phase concentration could be determined at the same time [36,37]. However, the sampler structure in their research was completely symmetric under ideal conditions, which would limit its applicability to actual conditions.
In this study, a new semi-volatile aerosol sampling device based on the virtual impactor was developed for the high-precision measurement of semi-volatile aerosols. First, the influence of various parameters on the performance of the sampler was evaluated through numerical simulation, and then the optimal design parameters for the sampler were determined. Next, for an assessment of the actual performance of the sampler, the developed sampler was fabricated with 3D printing technology, and an experimental platform for oil mist sampling was built to verify the effectiveness of the sampling strategy.

2. Sampling Device Design

As a typical semi-volatile aerosol, oil mist is usually present in the air as a mixture of gaseous oil and liquid oil droplets. Therefore, two key factors in the accuracy of an oil mist sampling device are: (1) efficient separation of the gas and liquid phases, and (2) accurate measurement of the gas and liquid phases. The phases are separated in accordance with the virtual impactor principle, and then the electrostatic method and the Tenax tube adsorption method are used to measure the liquid and gas phases, respectively.
According to previous studies, the configuration of the virtual impactor is inherently related to the cross-trajectory phenomenon; that is, the transmission efficiency drops sharply under large particle diameters, and changing the nozzle size, Reynolds number and other parameters will not prevent this phenomenon [38]. However, the use of acceleration nozzles with a certain slope and divergent collection nozzles can reduce the particle-crossing phenomenon by focusing particle trajectories, thereby improving the transmission efficiency of semi-volatile aerosols [39]. In addition, the pressure gradient has proved to be an important factor in the flow stability in the virtual impactor. Since a negative pressure gradient tends to stabilize the flow, whereas a positive pressure gradient may make the flow unstable [40].
Based on the design concept of the virtual impactor in the literature, a new semi-volatile aerosol dichotomous sampler was designed in the present study, as shown in Figure 2. The maximum diameter of the sampler is 30 mm, the maximum height is 24 mm, and the wall thickness is 0.5 mm. The cavity incorporates a circular arc nozzle transition to reduce the collision of particles with the wall. And the lower part is designed as a divergent structure to reduce the phenomenon of cross trajectories. In addition, only one outlet is provided on the side of the sampler, which creates a variation in the flow field from one cross section to another across the axis; thus, there are circumferential changes. The gas and liquid particles separated by the virtual impactor are measured by the Tenax tube adsorption method and the electrostatic method at the major and minor outlets, respectively, to yield the final oil mist concentration.
To determine the detailed size of the sampler, the following sampler factors needed to be optimized: geometric size, Reynolds number (Re), and split ratio. The geometric dimensions included the throat size (D), the nozzle spacing (S), the corner radius of the collecting nozzle (R), and the split ratio, which represents the flow ratio of the major flow and the minor flow.
Efficient separation of the gas and liquid phases depends on the virtual impactor’s performance, which is usually related to the physical parameters of the particles, the detailed size of the virtual impactor and the speed of the outlet flow. Different parameters have different effects on the collection efficiency of particulate matter and the degree of wall loss [35,36]. Performance characteristics are usually expressed as a curve of transmission efficiency and internal wall losses versus the Stokes number (Stk). The Stk is defined as follows:
S t k = C ρ p D p 2 U j 9 μ L c
where C is Corning’s correction factor; ρp is the density of the particles, μg/m3; Dp is the diameter of the particles, m; Uj is the average flow velocity at the outlet of the accelerating nozzle, m/s; μ is the dynamic viscosity of the air, pa·s; and Lc is the characteristic size, m. Corning’s correction factor is defined by the following formula:
C = 1 + 2 λ D p 1.257 + 0.4 e 0.55 D p λ
where λ is the mean free path of air, which generally is 6.6 × 10⁻⁸ m.
Transmission efficiency (ηTE) and wall losses (WL) are expressed by the ratios of the number of particles flowing out with the minor flow (Nminor), and the number of particles deposited on the inner wall (Nwall), respectively, to the total number of particles at the entrance boundary (Ni):
η TE = N m i n o r N i
WL = N w a l l N i
In addition, the Reynolds number has a certain impact on the performance of the virtual impactor. The higher the Reynolds number at the acceleration nozzle, the greater the pressure drop across the impactor. If the Reynolds number is too low, the particles will be too small to achieve the inertia required for separation, so a reasonable Reynolds number is required. The Reynolds number is expressed as:
Re = ρ U j L c μ
where ρ is the air density, 1.29 kg/m3.

3. Numerical Optimization Method
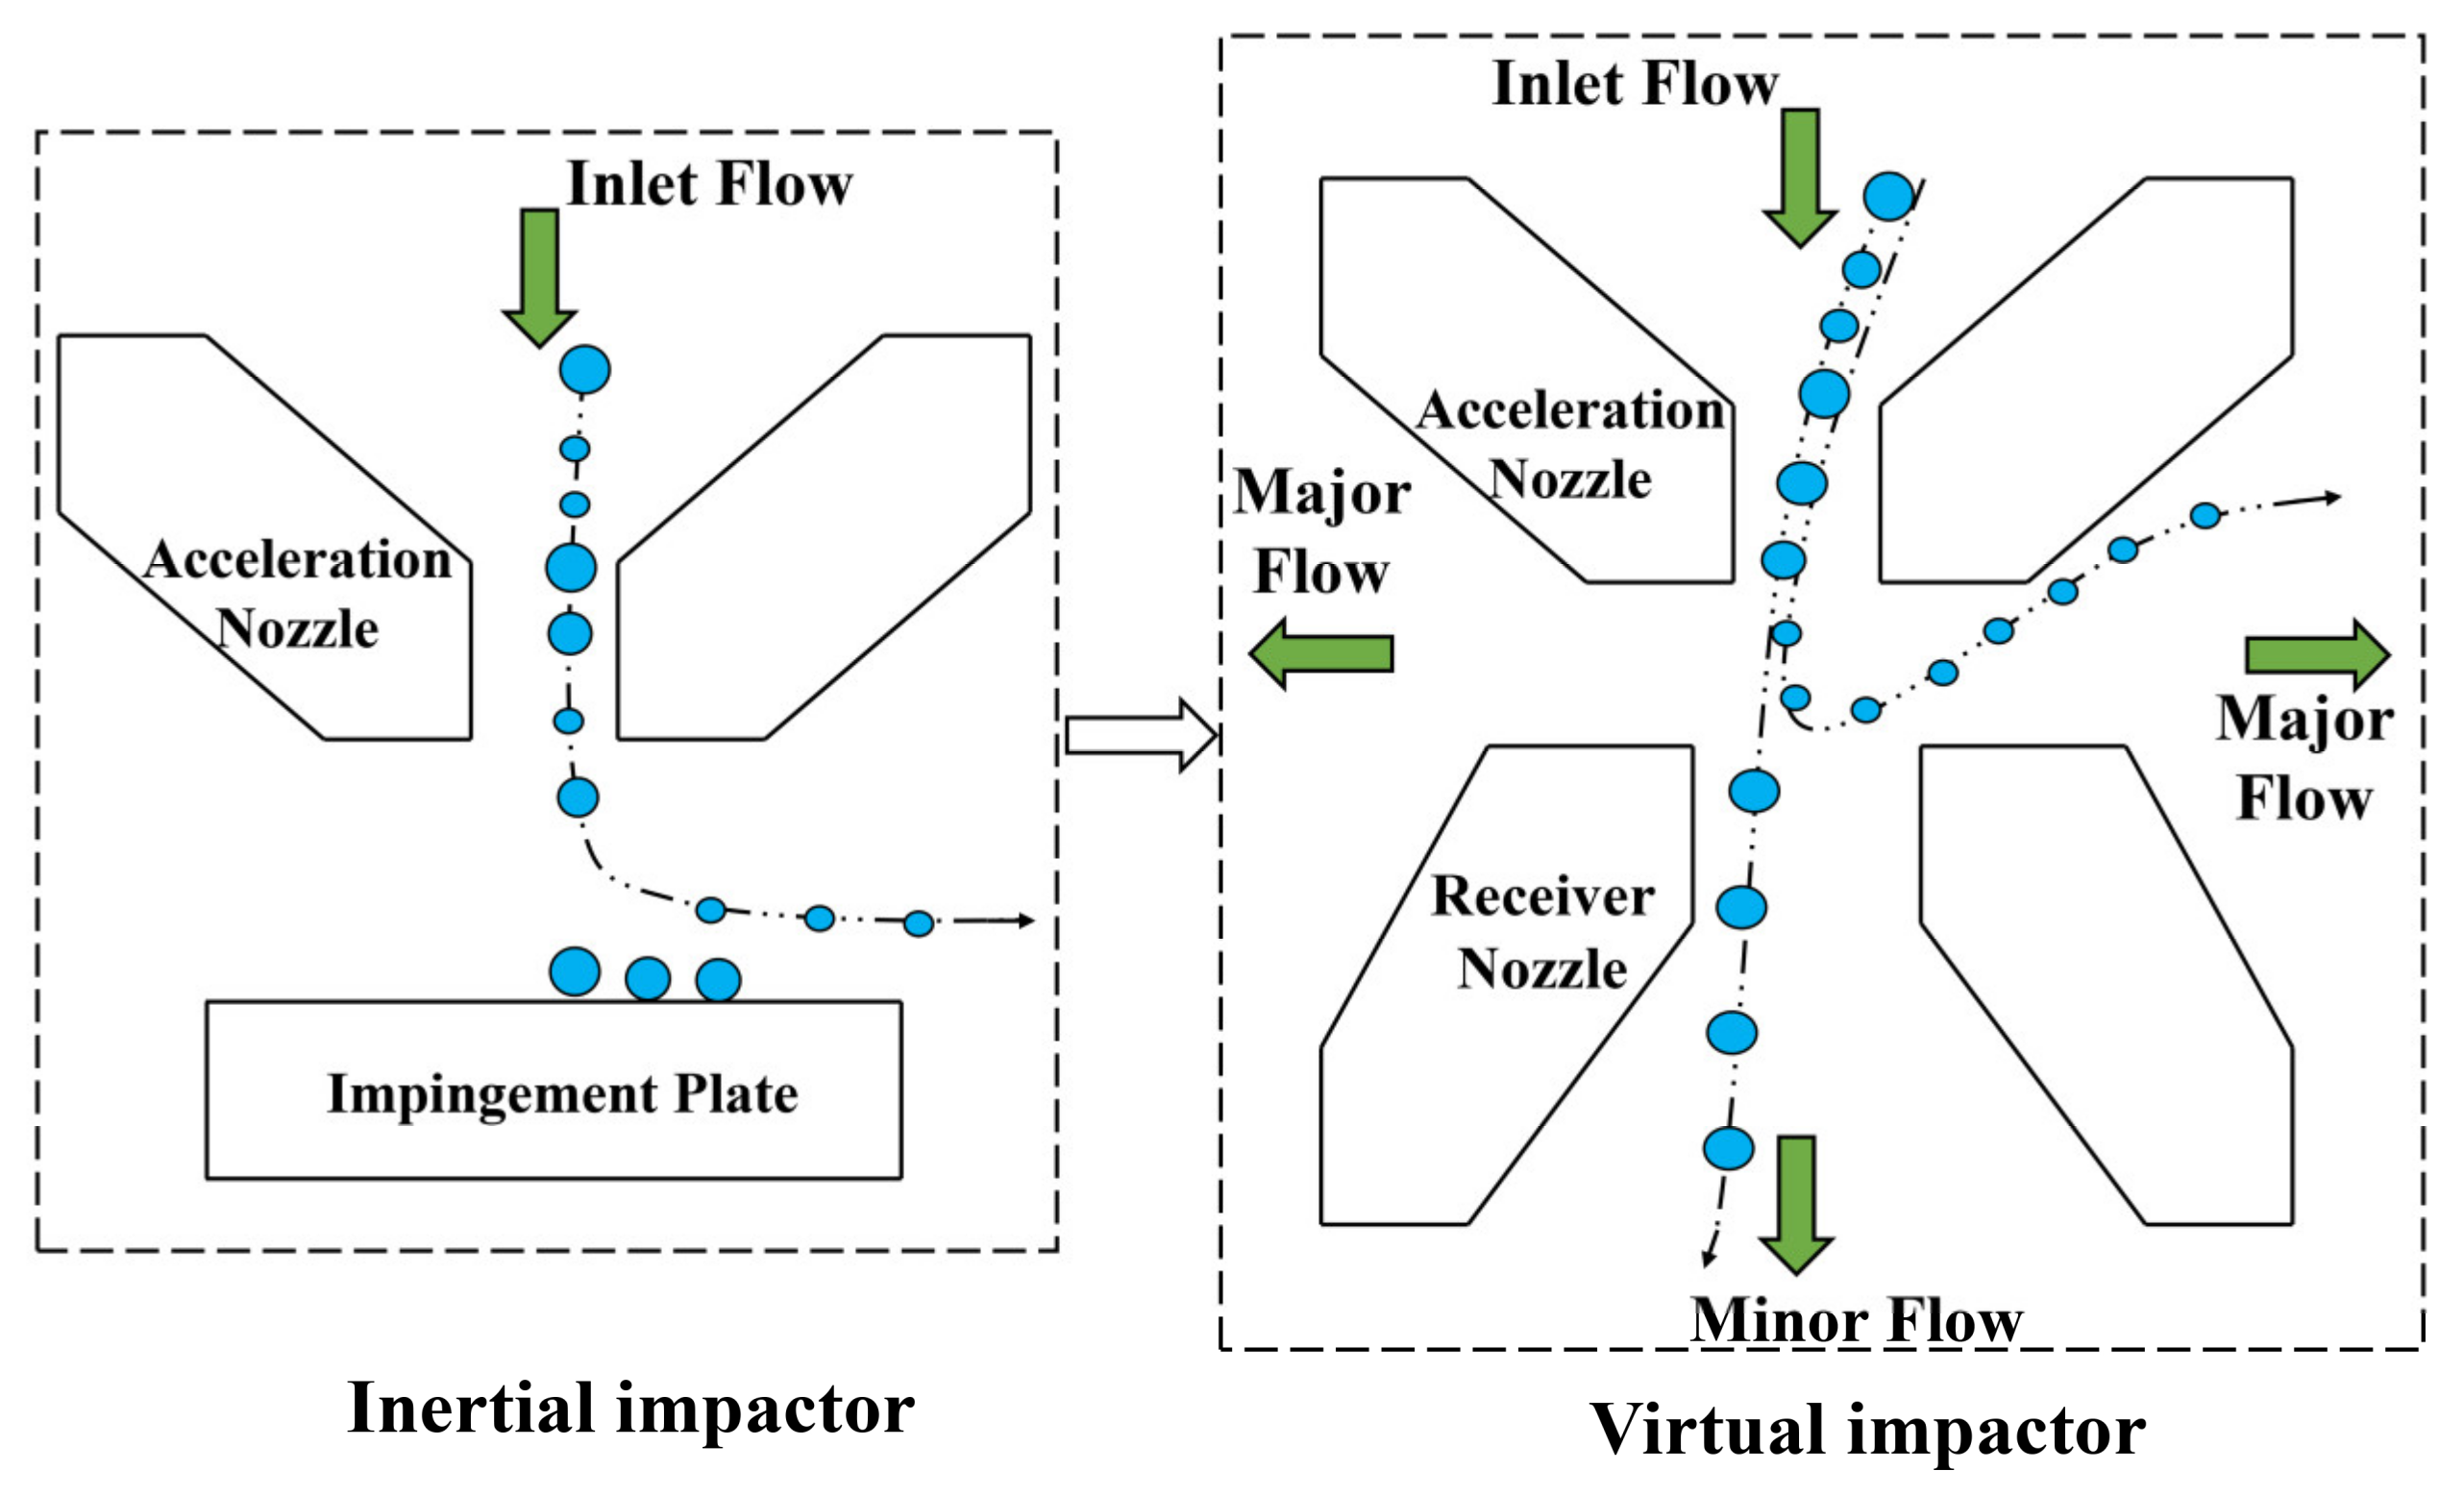
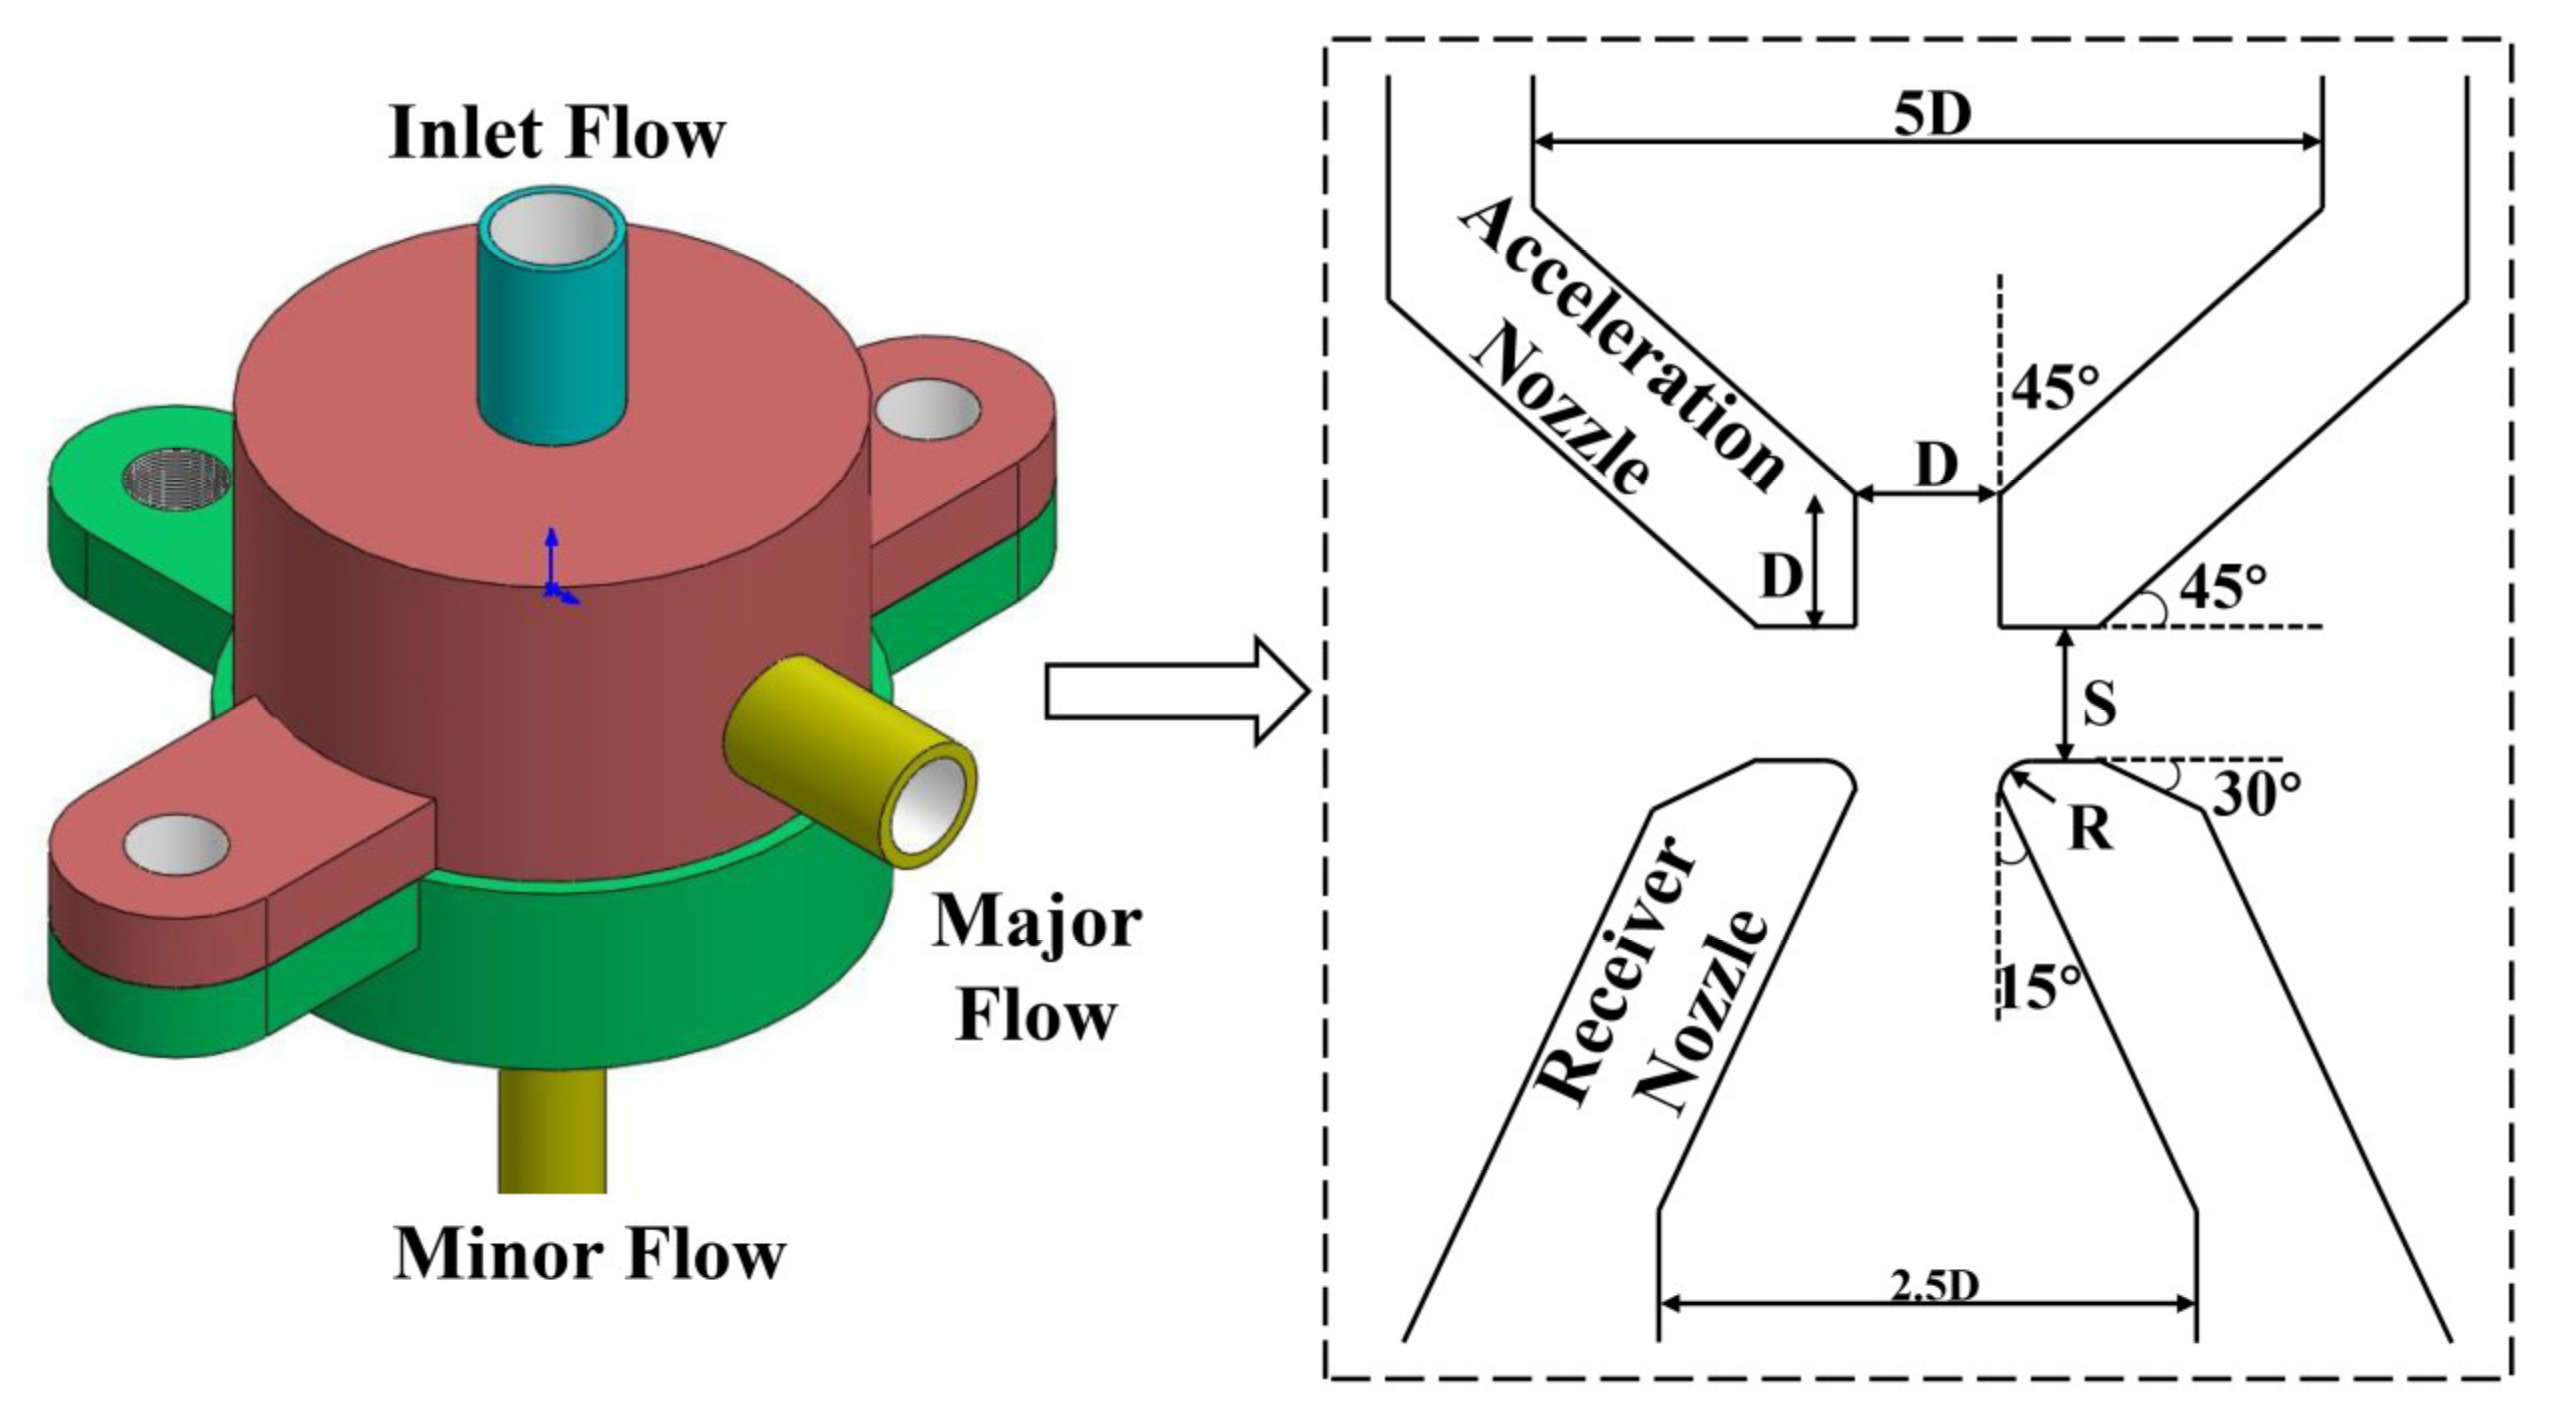
Numerical simulation has the characteristics of high flexibility, fast calculation speed, and low cost, and can be used for design optimization and performance analysis. Meanwhile, full-scale model experiments are costly and time-consuming, but the results are more reliable and can be used for final performance verification. Therefore, this study first employed a numerical simulation method to evaluate and optimize the sampler and then applied an experimental method to verify the optimization results.

3.1. Physical Model

The physical model used in the simulation is shown in Figure 2. The detailed structure of the sampler needed to be optimized, and because different situations would require models of different sizes, the specific size was not completely determined. The specific size of the sampler was optimized through subsequent numerical simulations.

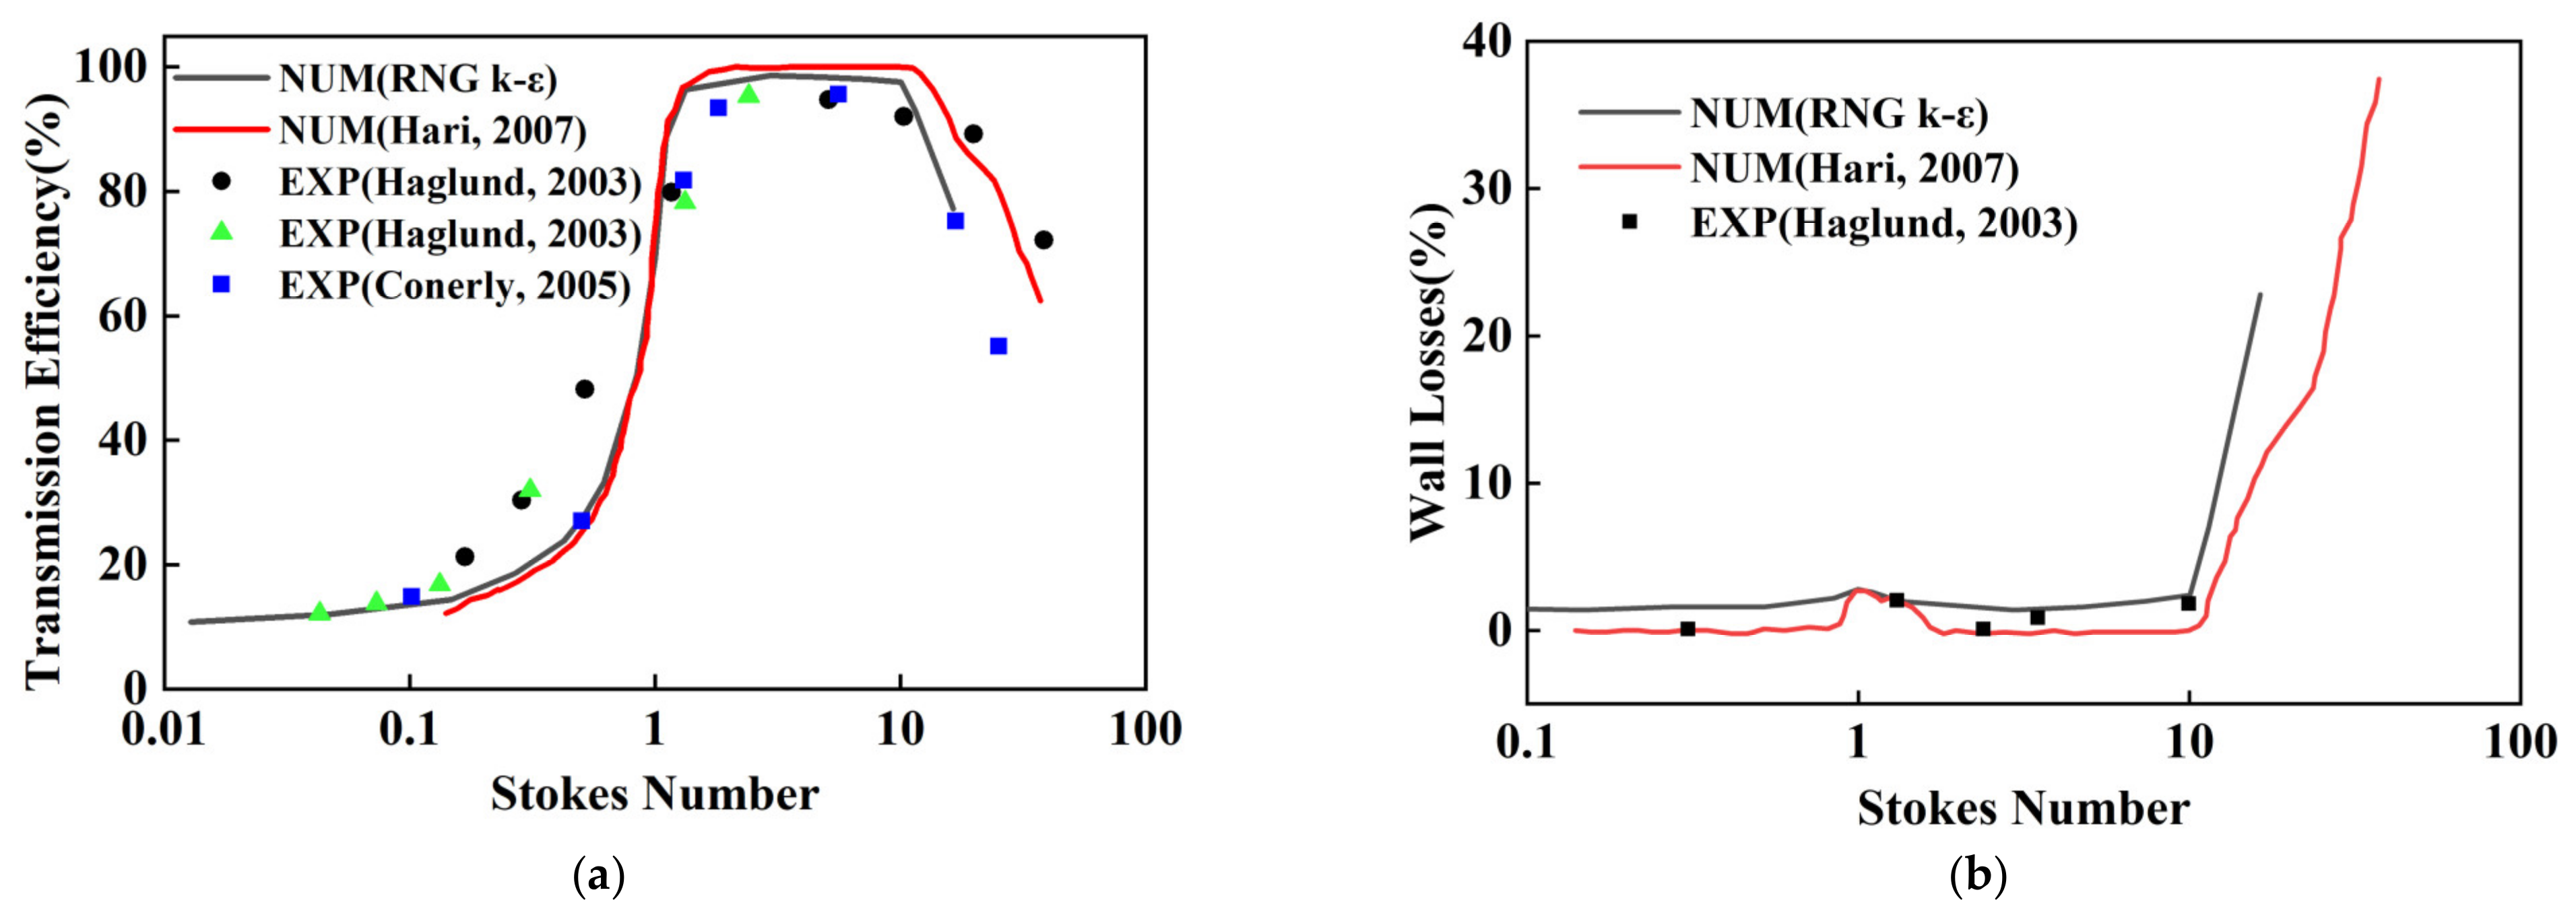
3.2. Numerical Method and Validation

To verify the accuracy of the simulation method used in this study, a simulation was performed on a device similar to that in this paper [38].
The RNG k-ε model was used to analyze the internal virtual impactor. For the flow problem, the main governing equations are the continuity equation, the momentum equation, the energy equation, the k equation, and the epsilon equation. These equations can be expressed in the following general form:
t ρ ϕ ¯ + x i ρ u ¯ i ϕ ¯ = x i Γ ϕ ϕ ¯ x i + S ϕ
where ρ is the fluid density, kg/m3; ui is the velocity of the fluid in all directions, m/s; ϕ is a specific variable, which can be velocity, temperature, concentration, etc.; Гϕ is the diffusion coefficient; Sϕ is the source term of the general equation. The corresponding parameters for the turbulence models used in this study are summarized in Table 1 and µ is the dynamic viscosity, N·s/m2; P is the pressure, Pa; T is the temperature, K; Pr is the Prandtl number; k and ε are the turbulent kinetic energy and turbulent dissipation rate, respectively. And The RNG k-ε model is a classical turbulence model in computational fluid dynamics, which will not be introduced here.
Since the studied particles were large, and the particles in the virtual impactor were gradually attenuated during the separation process, they could be regarded as discrete phases. Therefore, the Eulerian-Lagrangian model was selected, and it was assumed that there was only one-way coupling, that the fluid would affect the particle trajectory, and that the interference of the particles with the fluid was negligible. In addition, the influence of gravity on large particles and the influence of Stokes drag force and Saffman lift on small particles were also discussed. The particle orbit equation is as follows:
d u p d t = 18 μ a ρ p d p 2 C c u a u p + g ρ p ρ a ρ p
where ua and up are the air velocity and instantaneous velocity of particles, m/s; μa is the molecular dynamic viscosity coefficient of air, kg/m·s; ρp is the particle density, kg/m3; ρa is the air density, kg/m3; dp is the particle diameter, m; and Cc is the Cunningham correction factor.
The inlet was established as the velocity inlet, and the velocity was 21.8 m/s. The major flow and minor flow outlets were established as the pressure outlet, and the outlet flow weights were set to 90% and 10%, respectively. Since the collision and rebound of the particles had little effect on the results, the wall conditions were set as “trap”. In light of the small entrance, the number of incident particles was set to 500, and the number of particles was sufficient for the independence of the simulation results [41].
The simulation results for the virtual impactor are shown in Figure 3, and they are similar to the results of Hari et al. [38]. When the Stokes number was between 2 and 6, the transmission efficiency stabilized above 90%. In addition, it can be seen that the wall loss increased slightly when the Stokes number was close to 1, because some small particles became attached to the baffle of the collecting nozzle when moving with the major flow. In brief, the above simulation method was appropriate, and it was used in the following numerical evaluation.

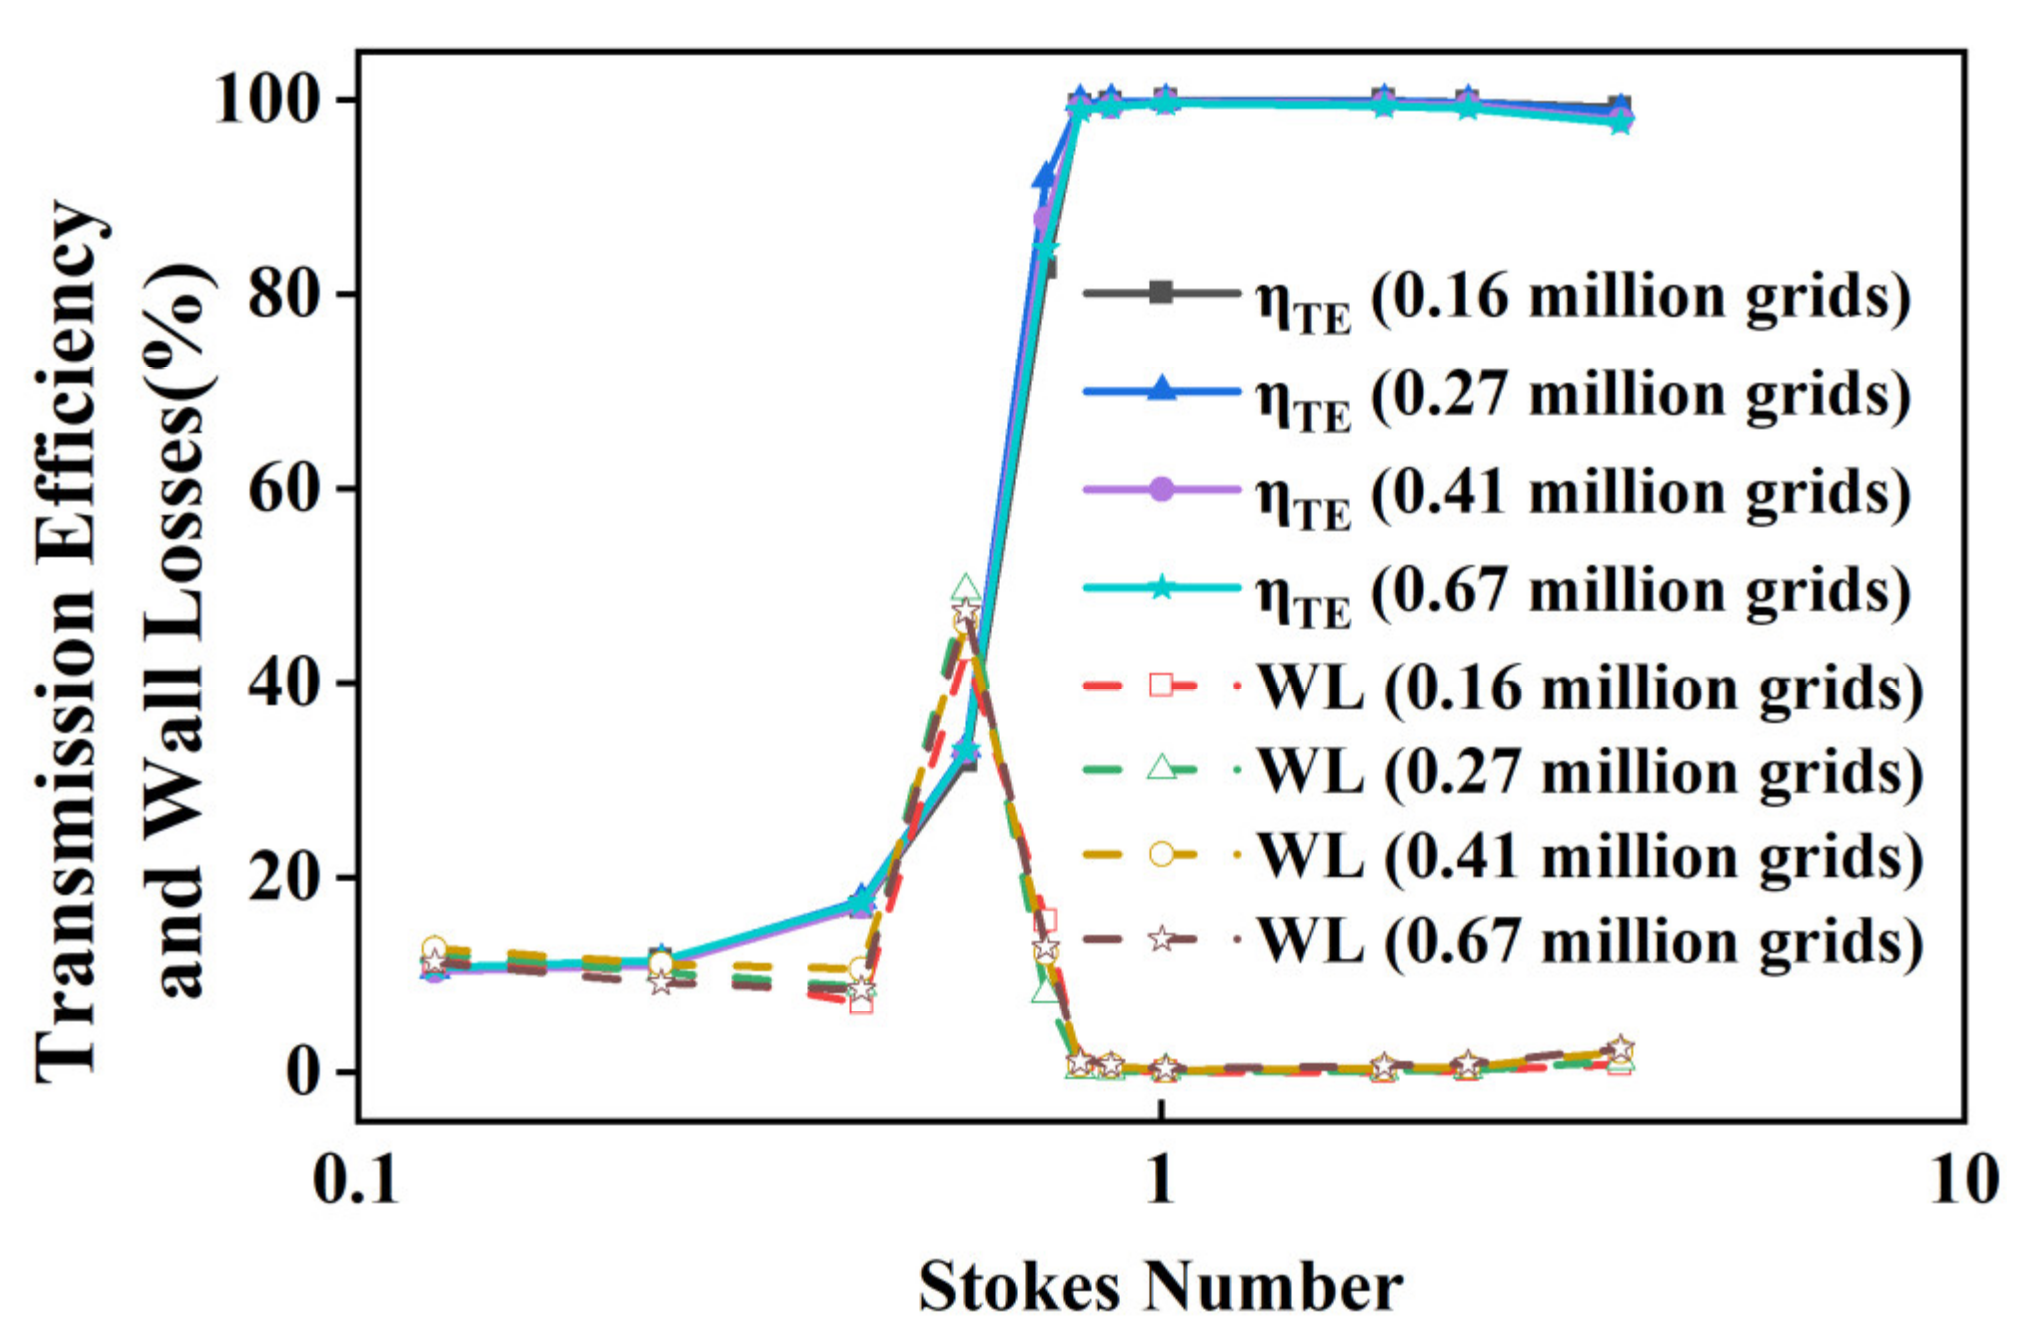
3.3. Grid Division and Verification of Grid Independence

Four different polyhedral grid numbers were used for verification of grid independence, and the basic grid sizes were set to 0.5 mm, 0.4 mm, 0.34 mm, and 0.3 mm and the grid number was 0.67 million, 0.41 million, 0.27 million and 0.16 million, respectively. As shown in Figure 4, the ηTE is the transmission efficiency with different numbers of grids, and WL is the wall losses with different numbers of grids. The calculation accuracy is closely related to the number of grids, and the grid independence verification is to ensure the accuracy and reduce the use of computing resources. Figure 4 shows that as the number of grids increases from 0.16 million to 0.67 million, the calculation results tend to be consistent. For the transmission efficiency, the calculation results with different grid numbers have little difference. And for the wall losses, the grid number of 0.16 million yielded the worst simulation result. Furthermore, there is no significant difference in the results between 0.41 million and 0.67 million grids. A grid number of 0.67 million require much more computing resources, so 0.41 million grids were used for CFD simulation in this study.

3.4. Boundary Conditions

The inlet boundary of the sampler in this study was set as the mass flow inlet, and the flow rate was 2 L/min. The turbulence intensity was 5%, and the turbulence length dimension was defined as 0.07 times the characteristic length (the inlet dimension). The wall condition of the sampler was “trap”, the major and minor flow outlet boundaries were the pressure outlet, and the default split ratio (the ratio of the major flow to the minor flow) was set to 9:1. In addition, in light of the huge amount of computation required for the random trajectory model, the effect of turbulence pulsation on the particles was ignored, and the number of incident particles was about 4000.

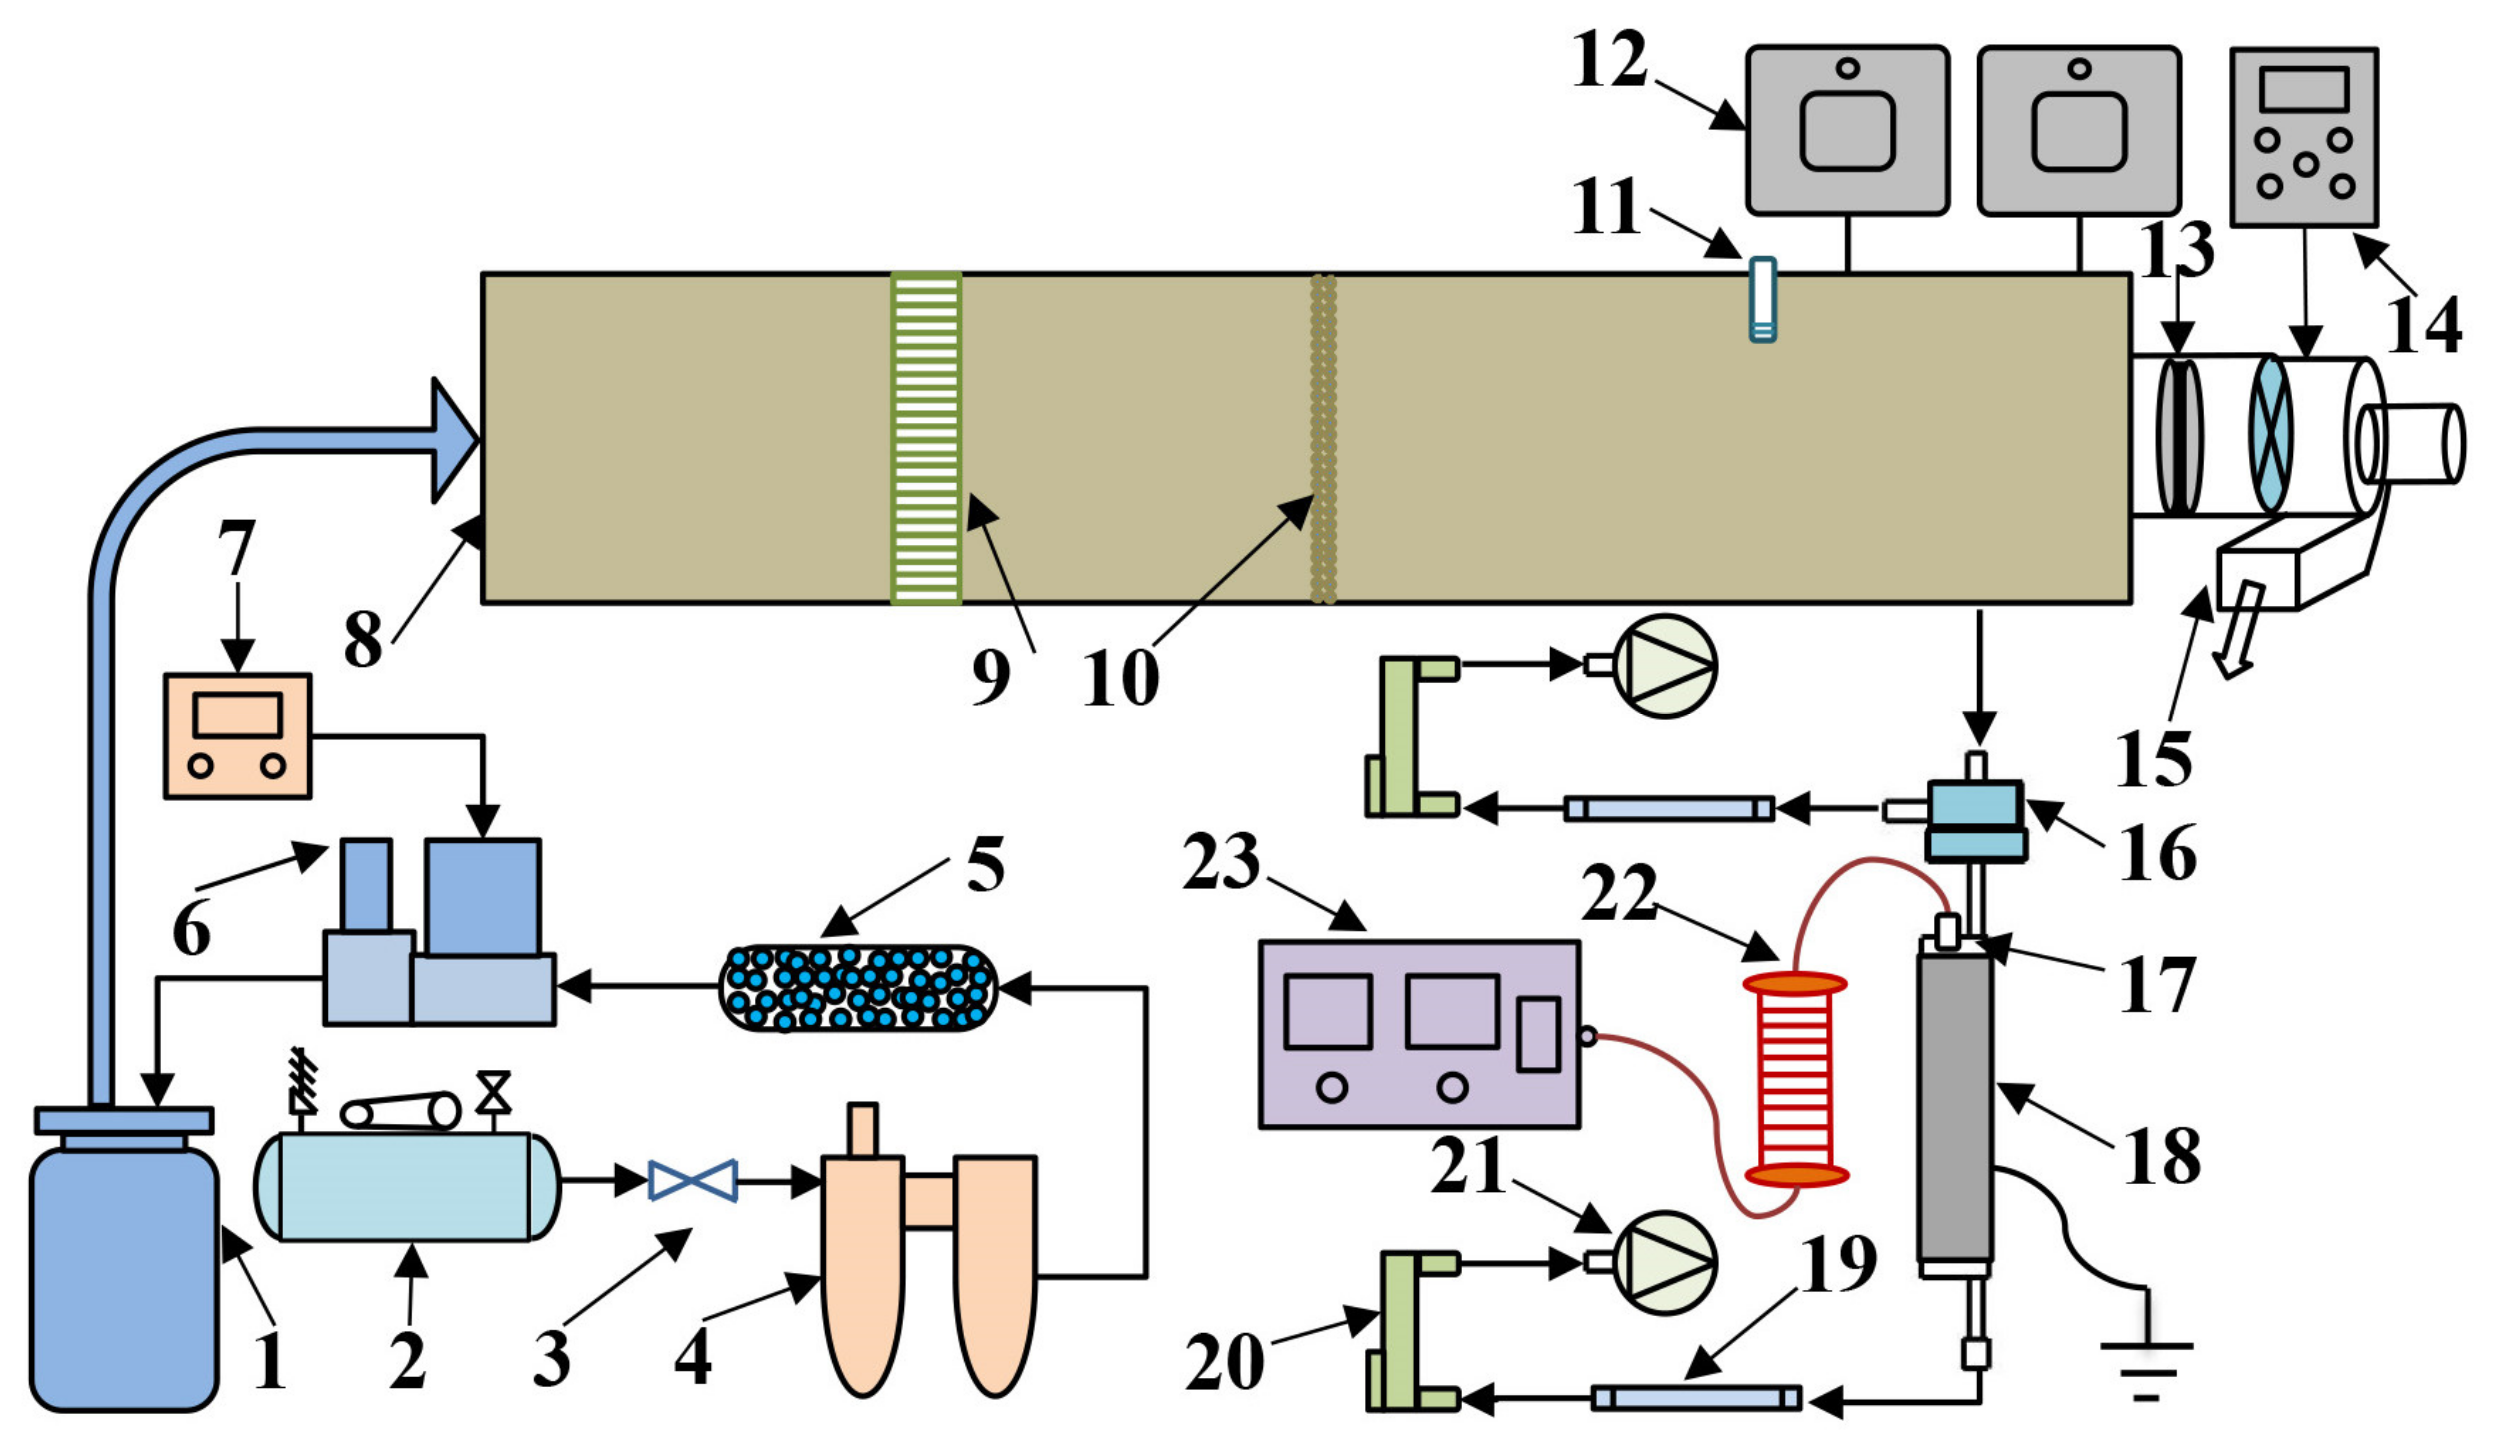
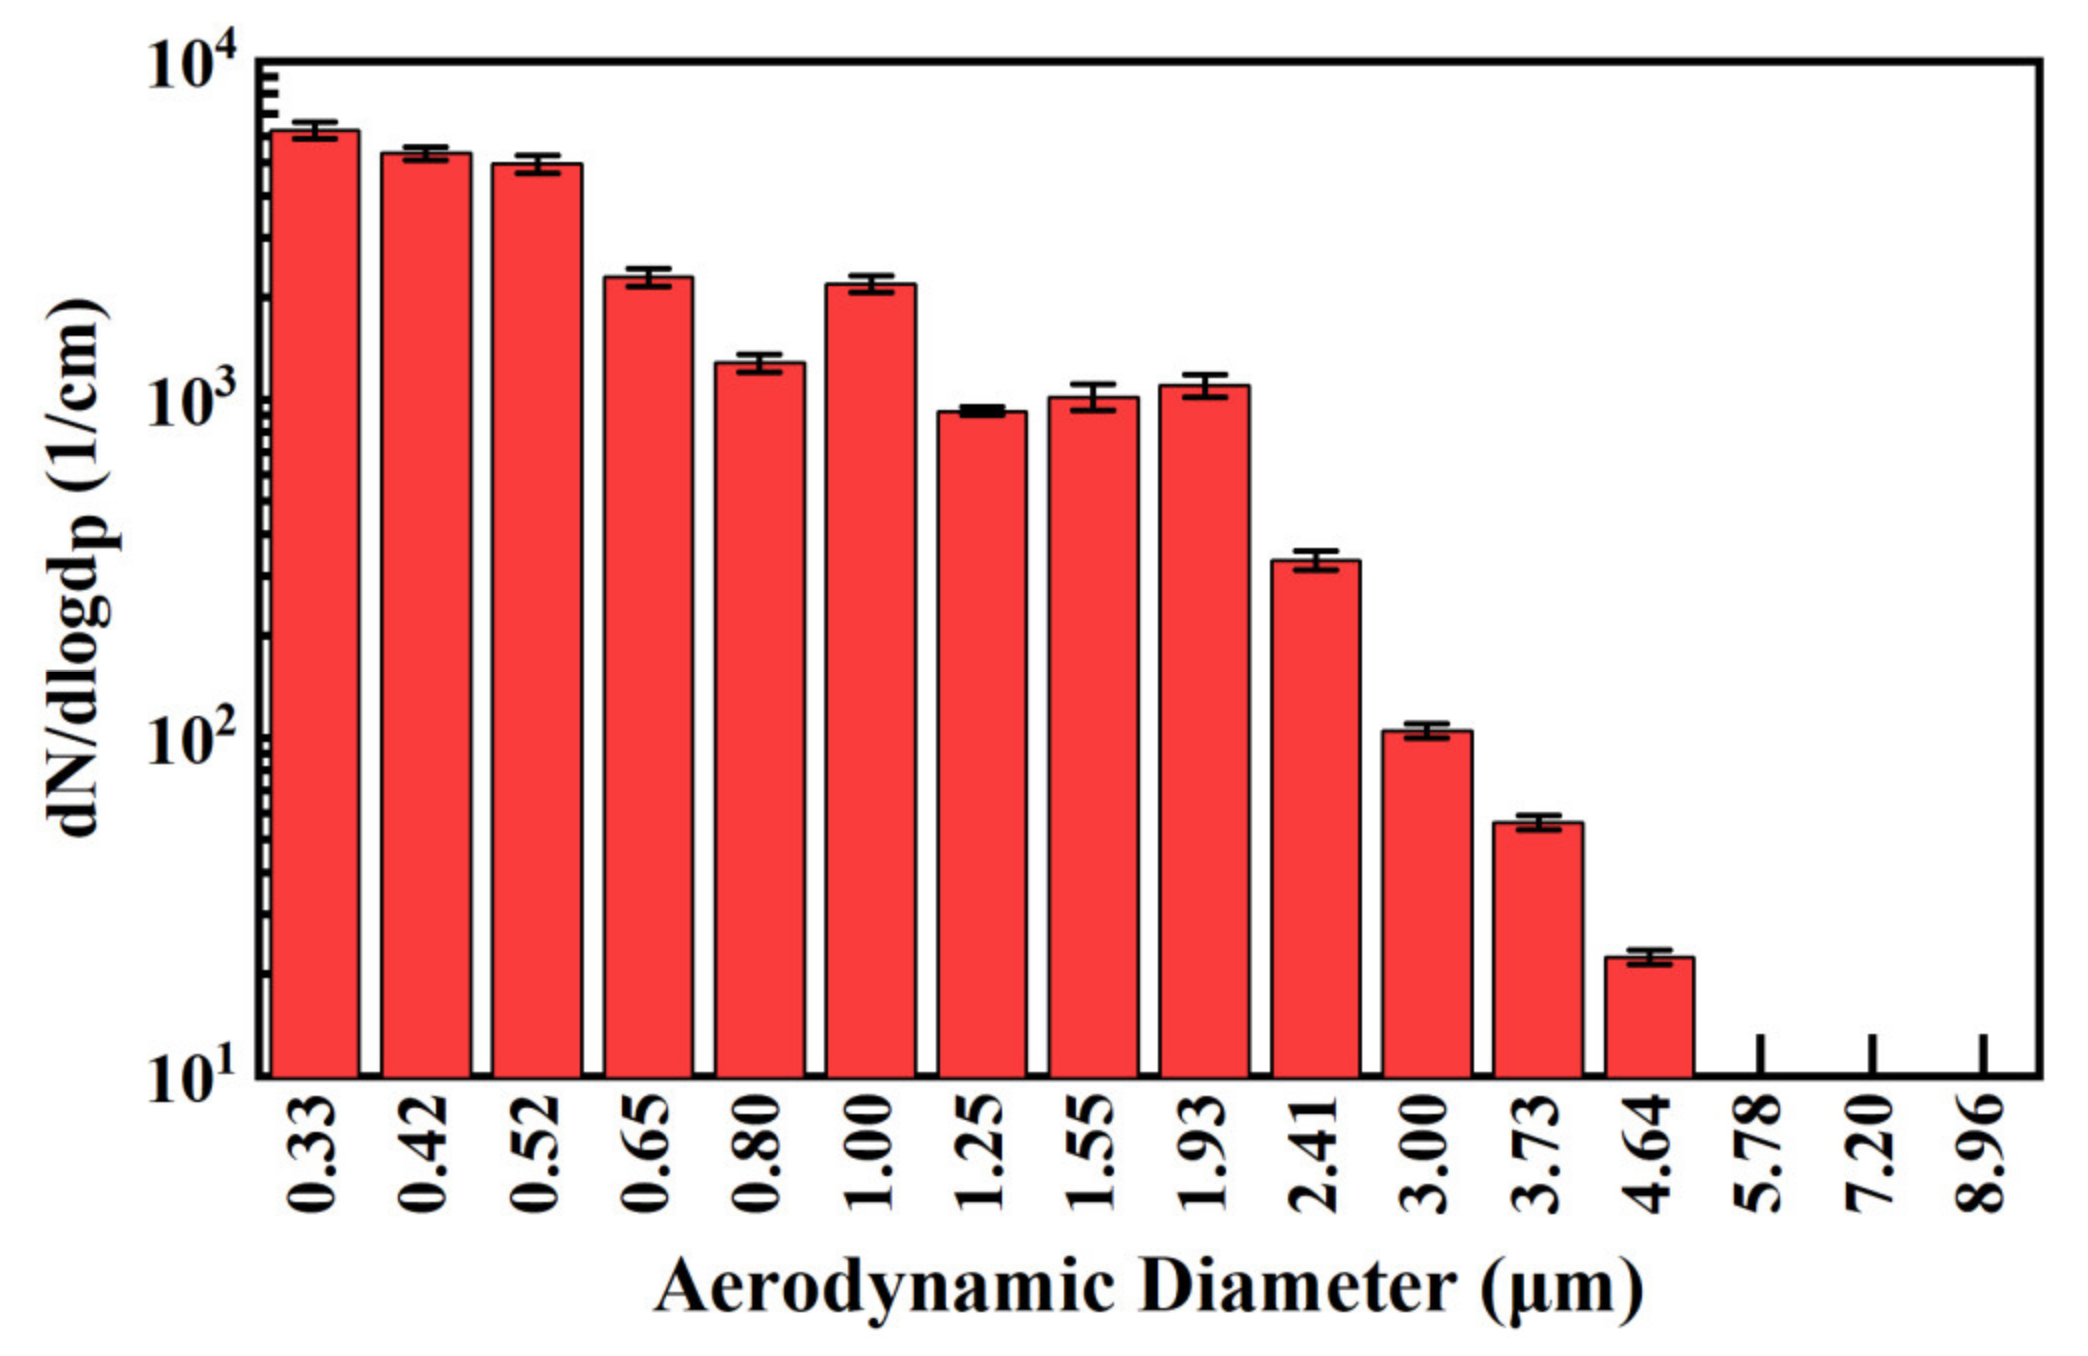
4. Full-Scale Experimental Evaluation

4.1. Experimental System

For verification of the actual performance of the sampler, an experimental bench for oil mist sampling was built. The experimental bench consisted mainly of an aerosol generation system, a mixing system and a sampling system. A schematic of the bench is provided in Figure 5.
The aerosol selected for this research was dioctyl sebacate (DOS), a colorless or light yellow transparent oily liquid with a density (at 20 °C) of 913 kg/m3 and low volatility. It maintains a stable shape and particle size during the process of oil mist production [42]. In the oil mist generation system, high-speed airflow was generated by an air compressor (0–40 L/min), and negative pressure is generated in the nozzle of the oil mist generator. The negative pressure drew DOS oil to the end face, where it collided with the airflow to produce particles of various sizes. The number concentration distribution of oil mist particles is shown in Figure 6. In addition, a pressure regulator was used to control the upper limit of the flow in the pipeline, and a mass flow controller was employed to control the flow stability.
For full mixing of the oil mist, an acrylic square cabin was designed with a length of 100 cm, a width of 20 cm, and a height of 20 cm. An aluminum honeycomb mesh (aperture of 5 mm) and a porous flow homogenizer (aperture of 3 mm) made of stainless steel were installed in the cabin, and a centrifugal induced draft fan was connected outside the cabin, which made the airflow in the cabin relatively uniform. Experimental measurements indicated that when the fan was running at the rated speed, the cabin wind speed was 0.2 m/s; when the frequency conversion was 30 Hz, the cabin wind speed was 0.13 m/s; and the experimental error did not exceed 0.02 m/s. Thus, the flow field in the cabin was evenly distributed.

4.2. Experimental Method

Since this experiment was based on the weighing method, and oil mist is usually much lighter than dust, a larger oil mist emission was required to reach the minimum weighable amount. The oil mist concentration in the cabin was controlled at 160 mg/m3 through adjustment of the mass flow controller and the frequency of the fan. The concentration of oil mist was monitored by a TSI Dusttrak II 8530, and sampling began after the concentration in the cabin had remained stable for 5 min.
First, the transmission performance of the sampler was determined. The specific steps were as follows: (1) use a TSI3330 optical particle size spectrometer to measure the mass concentration distribution of particle sizes in the cabin, (2) connect one path of the sampler to the TSI3330, and the other path to the flowmeter; adjust the flowmeter to the specified split ratio, and the TSI3330 afford to measure the mass concentration distribution with different particle diameters, and (3) combine the sampler branch and the experimental results in the cabin to obtain the sampler performance curve.
Next, different sampling methods, including the electrostatic method and the sampler method were compared. The specific steps of the electrostatic method were as follows: (1) adjust the high voltage to 6.5 kV, use the electrostatic tube alone to sample for one hour, and (2) use an electronic balance (precision: 0.0001) to measure the difference in quality before and after sampling. The specific steps of the sampler method were as follows: (1) perform three weighing experiments on the sampler, and the final results of the sampler, the electrostatic tube and the Tenax adsorption tube are the average value of three experiments, respectively; (2) adjust the flowmeters so that the major flow and the minor flow occur at different flow rate ratios (9:1 and 1:9) and continue sampling for one hour; (3) end the sampling and immediately weigh. The concentration of each phase in the oil mist can be obtained from the difference in quality before and after.

5. Results and Discussion

5.1. Numerical Optimization of the Sampler Design

To determine the optimal geometry of the sampler in detail, the sampler’s performance was first studied numerically. The effects of geometric parameters, Reynolds number, and split ratio on the performance of the sampler, as shown in Table 2, were taken into account.

5.1.1. Influence of Geometric Factors on Performance

The performance of the sampler under different corner radii of the collecting nozzle (R), nozzle spacings (S), and throat sizes (D) were studied by numerical simulation.
A.
The influence of the nozzle fillet radius on the performance of the impactor
Figure 7a shows the transmission efficiency (ηTE) and wall loss (WL) of the virtual impactor under different nozzle fillet radii. The higher the transmission efficiency, the better the separation performance of the virtual impactor for particles. Improved separation performance was the most important criterion for the virtual impactor, and lower wall loss was also important.
The transmission efficiency was equivalent for fillet radii of R = 0.10 mm and R = 0.15 mm, whereas it was generally lower for R = 0.40 mm. According to the change in the wall loss curve, the wall loss curve can be divided into three regions. For regions I and II, the wall loss for R = 0.15 mm was lower than for R = 0.10 mm. Meanwhile, in region III the wall losses were comparable under different fillet radii. In conclusion, R = 0.15 mm was a better choice for the sampler.
B.
The effect of nozzle spacing on performance
Figure 7b depicts the transmission efficiency and wall losses of the virtual impactor under different nozzle spacings. In regions I and III, the transmission efficiency was equivalent under different nozzle spacings. However, in region II, the efficiency at S = 1.20 mm was much lower than at S = 0.48 mm. Therefore, S = 1.20 mm would not be a better choice, even if the wall losses were lower in region II. Hence, S = 0.48 mm was chosen as the nozzle spacing of the sampler.
C.
The impact of throat size on performance
Figure 7c shows the transmission efficiency and wall losses of the virtual impactor under different incident nozzle throat sizes. With the exclusion of region I, the transmission efficiency for D = 1.0 mm was far less than for D = 0.8 mm. Thus, as with the above factors (nozzle spacing), there was little difference in wall losses between different throat sizes, but D = 0.8 mm had much higher transmission efficiency. Therefore, D = 0.8 mm was chosen as the throat size of the sampler.

5.1.2. The Impact of Reynolds Number on Performance

Figure 8a depicts the influence of the Reynolds number (where the characteristic length in the Reynolds number is the diameter of the throat) on the transmission efficiency and wall loss. Here Re = 1766, Re = 3531, and Re = 7062 represent flow rates through the virtual impactor of 1 LPM (L/min), 2 LPM and 4 LPM, respectively.
From an overall perspective, the transmission efficiency was equivalent under all Reynolds numbers, but the particle transmission efficiency under high Reynolds numbers first exhibited a downward trend. In addition, the wall loss at high Reynolds numbers also increased initially. The transmission efficiency at Re = 1766 was higher than that at Re = 3531 in part of the Stokes number range. In addition, the wall losses were close for different Reynolds numbers. Therefore, Re = 3531 was chosen; that is, the virtual impactor flow rate was 2 LPM.

5.1.3. The Impact of Split Ratio on Performance

Figure 8b shows the transmission efficiency and wall loss of the virtual impactor under different split ratios. The negative flow ratios (1:6 and 1:9) did not exhibit separating characteristics. As the Stokes number changed, the transmission efficiency remained almost the same, and thus there was no separation between coarse and fine particles. Although the wall loss of particles with low sizes was close to the ideal value of 0, the wall loss increased rapidly when the Stokes number exceeded 2, which would have been caused by the cross-track phenomenon.
In the case of positive flow ratios (6:1 and 9:1), no significant difference was observed in the wall loss. The transmission efficiency curve indicates that the transmission efficiency increased as the flow ratio decreased. Therefore, the positive flow ratio of 6:1 was selected
In summary, the optimal structure of this sampler is as follows: the diameter of the throat is 0.8 mm, the nozzle spacing is 0.48 mm, the nozzle has rounded corners, and the corresponding rounded corner radius is 0.15 mm. For boundary conditions, the intake air flow should be set to 2 L/min, and the split ratio should be the positive flow ratio.

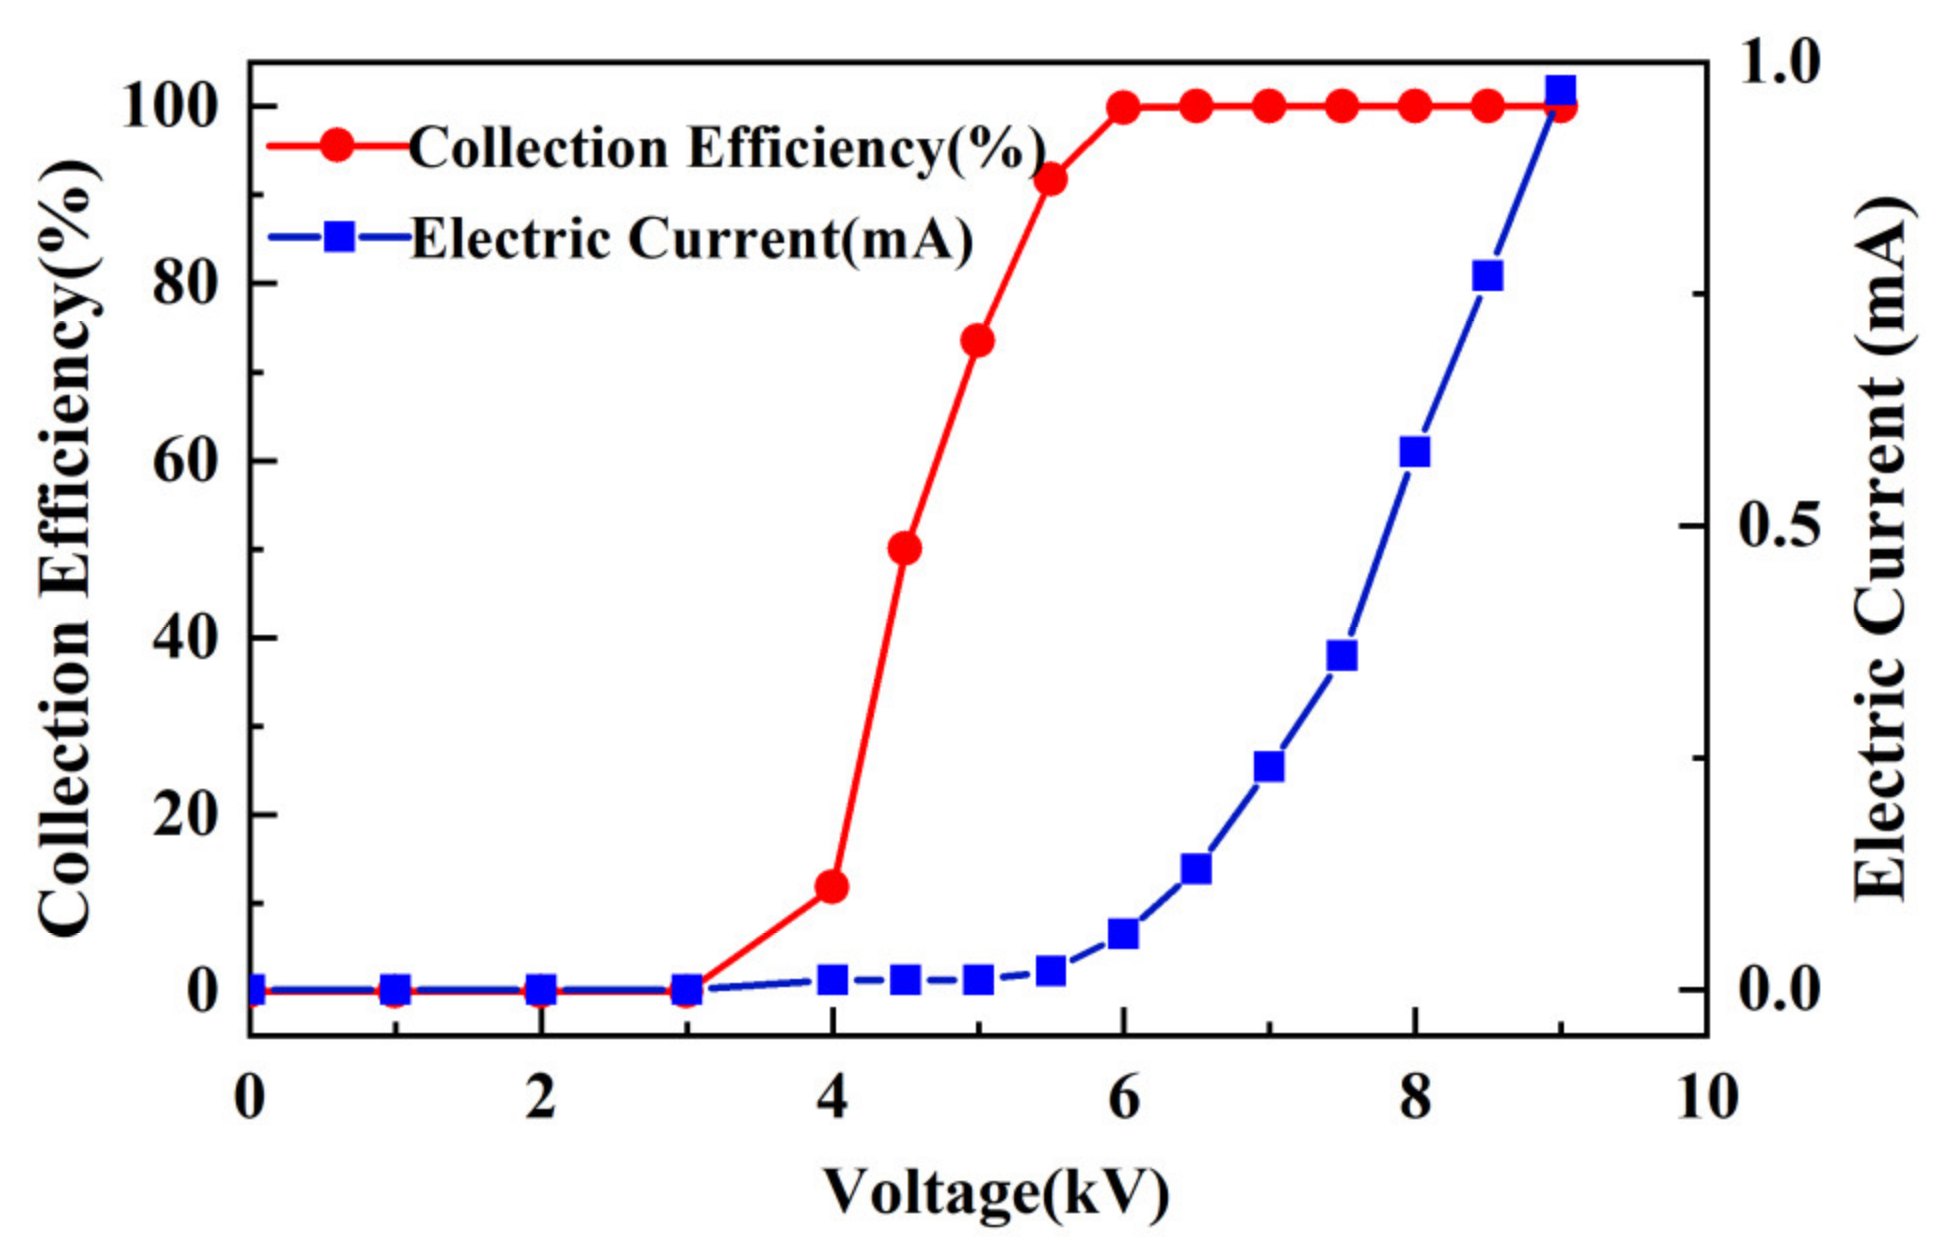
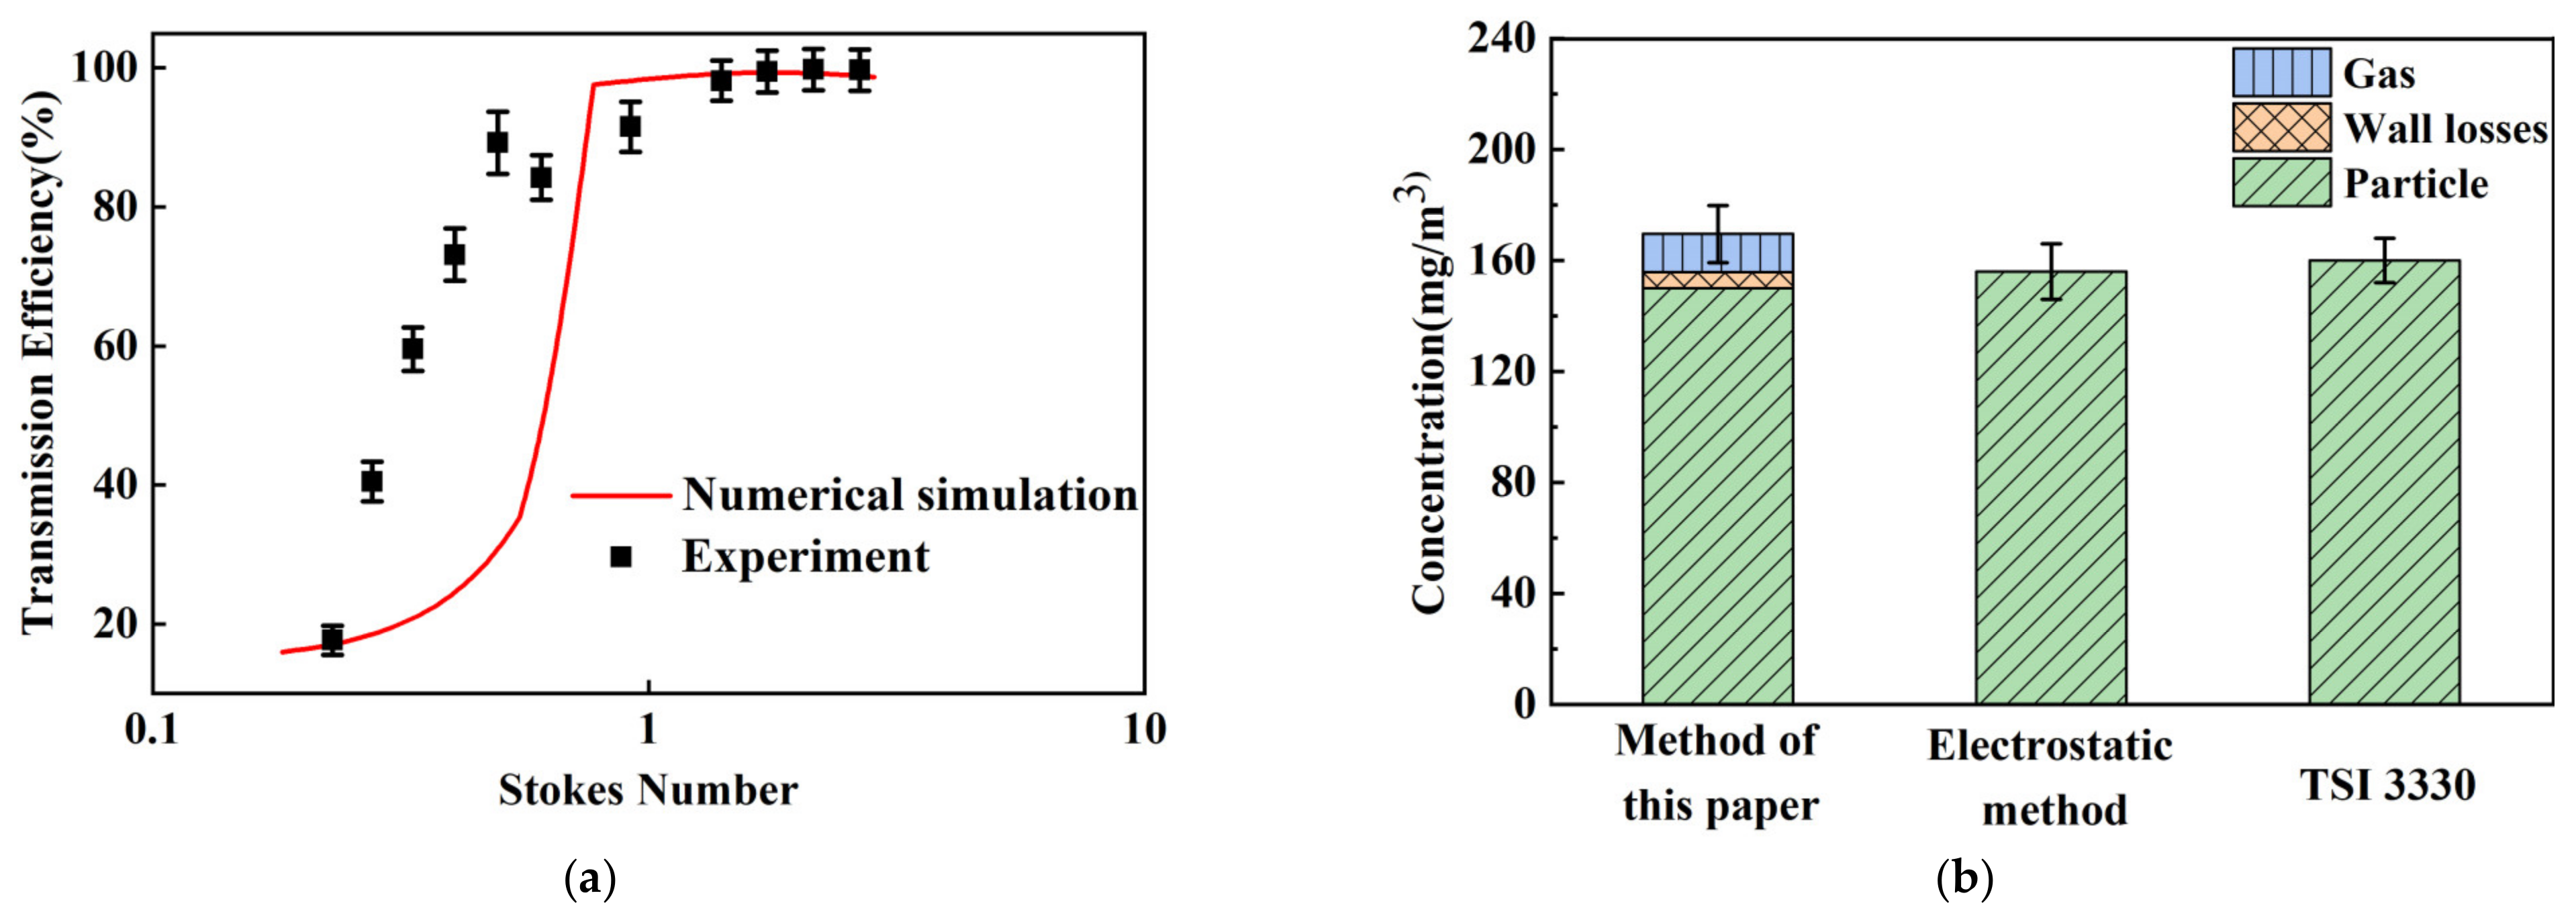
5.2. Experimental Evaluation of the Performance of the Sampler

According to the numerical simulation results, the sampler was fabricated by 3D printing technology (with an accuracy of ±0.05 mm). Figure 9 shows the main part of the sampler. The sampling system absorbs the separated gas through the Tenax adsorption tube, and the electrostatic tube adsorbs the separated particles. The electrostatic tube was made of stainless steel with an inner diameter of 20 mm and a length of 100 mm.
Figure 10 shows the volt-ampere characteristics of the electrostatic tube and the relationship between collection efficiency and voltage. It can be found that with the increase in the voltage, the collection efficiency of the electrostatic tube for particles increases. When the voltage reaches 6 kV, the efficiency of the electrostatic tube is close to 100%. When the voltage is higher than 6 kV, the collection efficiency stabilizes at 100% as the voltage increases, however the current increases exponentially. A high current will cause high heat generation, which increases the evaporation of volatile or semi-volatile droplets. Therefore, a voltage as small as possible is required under the premise of ensuring collection efficiency.
The experimental and numerical results for the sampler are compared in Figure 11a. It can be seen that the sampler had good transmission efficiency under the experimental conditions, but the efficiency drops when the Stokes number is close to 0.8, which may have been caused by a higher concentration of DOS oil at 1 μm aerodynamic diameter. The trend of the experimental results is consistent with the numerical simulation results, so the numerical model in this paper can be used for the optimization study of the virtual impactor. Figure 11b shows the sampling results of different sampling methods for the same environmental oil mist concentration. For the electrostatic method and the light scattering method, the measurement results for both are close to 160 mg/m3, and these two sampling methods can only measure the concentration of particulate matter in the air. The measurement results of the sampling method developed in this paper are close to 167 mg/m3 and the gas concentration is about 12 mg/m3. The results show that the method developed in this paper can be used to measure semi-volatile oil mist.

6. Conclusions and Limitations

This study developed a high-precision measurement sampler for semi-volatile aerosols by combining two traditional single sampling methods: the electrostatic and the Tenax tube adsorption methods. With oil mist as an example, an aerosol dichotomous sampling device was designed and optimized through numerical simulation. The validity of this sampling method was then verified experimentally. The sampling device was fabricated by 3D printing technology, and a complete test table for oil mist sampling was built for the experiments. The results show that the sampler had good transmission performance and effectively separated the gas phase and particle phase components in the oil mist. Compared with the traditional single sampling method, the sampling method proposed in this paper effectively separates the gas phase and the particle phase of the semi-volatile aerosol and measures them separately. Therefore, this method can more accurately measure the concentration of semi-volatile pollutants in the environment, avoid underestimating the concentration of pollutants in the production site during the measurement process, and provide help for the occupational health of production workers.
This sampling method also has some limitations. Firstly, this method requires a virtual impactor to separate the gaseous and particulate oil mist, which will generate wall losses during the separation process and lead to an underestimation of the particle phase. Secondly, this method has high requirements on the stability of the airflow speed of the virtual impactor. From Figure 8a, it can be found that the virtual impactor has the highest transmission efficiency and lowest wall losses when the Stk number is between 0.8 and 3. When the Stk number is in other ranges, it will cause larger wall losses, resulting in the underestimation of particle phase concentration.

Author Contributions

Writing-original draft preparation, Y.W. and H.Z.; Development of the project idea and funding acquisition, Z.L.; Writing-review & editing, X.S.; Methodology discussion, T.Y. All authors have read and agreed to the published version of the manuscript.

Funding

This work was funded by National Nature Science Foundation of China (Grant No. 51878442).

Institutional Review Board Statement

Not applicable.

Informed Consent Statement

Not applicable.

Data Availability Statement

Not applicable.

Conflicts of Interest

The authors declare no conflict of interest.

References

  1. Lacasse, Y.; Girard, M.; Cormier, Y. Recent advances in hypersensitivity pneumonitis. Chest 2012, 142, 208–217. [Google Scholar] [CrossRef] [PubMed]
  2. Lyu, W.; Li, Y.; Guan, D.; Zhao, H.; Zhang, Q.; Liu, Z. Driving forces of chinese primary air pollution emissions: An index decomposition analysis. J. Clean. Prod. 2016, 133, 136–144. [Google Scholar] [CrossRef] [Green Version]
  3. Antoci, A.; Galeotti, M.; Sordi, S. Environmental pollution as engine of industrialization. Commun. Nonlinear Sci. Numer. Simul. 2018, 58, 262–273. [Google Scholar] [CrossRef] [Green Version]
  4. Mirer, F.E. New evidence on the health hazards and control of metalworking fluids since completion of the osha advisory committee report. Am. J. Ind. Med. 2010, 53, 792–801. [Google Scholar] [CrossRef]
  5. Rim, K.T.; Lim, C.H. Biologically hazardous agents at work and efforts to protect workers’ health: A review of recent reports. Saf. Health Work 2014, 5, 43–52. [Google Scholar] [CrossRef] [Green Version]
  6. Tian, E.; Xia, F.; Wu, J.; Zhang, Y.; Li, J.; Wang, H.; Mo, J. electrostatic air filtration by multifunctional dielectric heterocaking filters with ultralow pressure drop. ACS Appl. Mater. Interfaces 2020, 12, 29383–29392. [Google Scholar] [CrossRef]
  7. Zhang, J.; Shao, Y.; Long, Z. Physicochemical characterization of oily particles emitted from different machining processes. J. Aerosol Sci. 2016, 96, 1–13. [Google Scholar] [CrossRef]
  8. Heitbrink, W.A.; Yacher, J.M.; Deye, G.J.; Spencer, A.B. Mist control at a machining center, part 1: Mist characterization. Am. Ind. Hyg. Assoc. J. 2000, 61, 275–281. [Google Scholar] [CrossRef]
  9. Wang, Y.; Murga, A.; Long, Z.; Yoo, S.J.; Ito, K. Experimental study of oil mist characteristics generated from minimum quantity lubrication and flood cooling. Energy Built Environ. 2021, 2, 45–55. [Google Scholar] [CrossRef]
  10. Wei, G.; Chen, B.; Lai, D.; Chen, Q. An improved displacement ventilation system for a machining plant. Atmos. Environ. 2020, 228, 117419. [Google Scholar] [CrossRef]
  11. Wang, X.; Zhou, Y.; Wang, F.; Jiang, X.; Yang, Y. Exposure levels of oil mist particles under different ventilation strategies in industrial workshops. Build. Environ. 2021, 206, 108264. [Google Scholar] [CrossRef]
  12. Cao, J.; Mo, J.; Sun, Z.; Zhang, Y. Indoor particle age, a new concept for improving the accuracy of estimating indoor airborne svoc concentrations, and applications. Build. Environ. 2018, 136, 88–97. [Google Scholar] [CrossRef]
  13. Dodson, R.E.; Camann, D.E.; Morello-Frosch, R.; Brody, J.G.; Rudel, R.A. Semivolatile organic compounds in homes: Strategies for efficient and systematic exposure measurement based on empirical and theoretical factors. Environ. Sci. Technol. 2015, 49, 113–122. [Google Scholar] [CrossRef] [Green Version]
  14. Okeme, J.O.; Saini, A.; Yang, C.; Zhu, J.; Smedes, F.; Klánová, J.; Diamond, M.L. Calibration of polydimethylsiloxane and XAD-pocket passive air samplers (pas) for measuring gas- and particle-phase SVOCS. Atmos. Environ. 2016, 143, 202–208. [Google Scholar] [CrossRef]
  15. Saini, A.; Okeme, J.O.; Mark Parnis, J.; McQueen, R.H.; Diamond, M.L. From air to clothing: Characterizing the accumulation of semi-volatile organic compounds to fabrics in indoor environments. Indoor Air 2017, 27, 631–641. [Google Scholar] [CrossRef]
  16. Little, J.C.; Weschler, C.J.; Nazaroff, W.W.; Liu, Z.; Cohen Hubal, E.A. Rapid methods to estimate potential exposure to semivolatile organic compounds in the indoor environment. Environ. Sci. Technol. 2012, 46, 11171–11178. [Google Scholar] [CrossRef]
  17. Sanchez, A.L.; Hubbard, J.A.; Dellinger, J.G.; Servantes, B.L. Experimental study of electrostatic aerosol filtration at moderate filter face velocity. Aerosol Sci. Technol. 2013, 47, 606–615. [Google Scholar] [CrossRef]
  18. Li, S.; Zhang, S.; Pan, W.; Long, Z.; Yu, T. Experimental and theoretical study of the collection efficiency of the two-stage electrostatic precipitator. Powder Technol. 2019, 356, 1–10. [Google Scholar] [CrossRef]
  19. Islamov, R.S. Influence of gas velocity on the particle collection and reentrainment in an air-cleaning electrostatic precipitator. Aerosol Sci. Technol. 2018, 52, 1415–1428. [Google Scholar] [CrossRef]
  20. Wistrom, A.O.; Khachatourian, A.V. Electrostatic interaction between unlike aerosols. Aerosol Sci. Technol. 2001, 35, 865–873. [Google Scholar] [CrossRef]
  21. Yoon, H.; Woo, J.H.; Ra, Y.M.; Yoon, S.S.; Kim, H.Y.; Ahn, S.; Yun, J.H.; Gwak, J.; Yoon, K.; James, S.C. Electrostatic spray deposition of copper-indium thin films. Aerosol Sci. Technol. 2011, 45, 1448–1455. [Google Scholar] [CrossRef]
  22. Leith, D.; Leith, F.A.; Boundy, M.G. Laboratory measurements of oil mist concentrations using filters and an electrostatic precipitator. Am. Ind. Hyg. Assoc. J. 1996, 57, 1137–1141. [Google Scholar] [CrossRef] [PubMed]
  23. Volckens, J.; Boundy, M.; Leith, D.; Hands, D. Oil Mist concentration: A comparison of sampling methods. Am. Ind. Hyg. Assoc. J. 1999, 60, 684–689. [Google Scholar] [CrossRef]
  24. Raynor, P.C.; Leith, D. Evaporation of accumulated multicomponent liquids from fibrous filters. Ann. Occup. Hyg. 1999, 43, 181–192. [Google Scholar] [CrossRef]
  25. Simpson, A.T.; Groves, J.A.; Unwin, J.; Piney, M. Mineral oil metal working fluids (MWFs)-development of practical criteria for mist sampling. Ann. Occup. Hyg. 2000, 44, 165–172. [Google Scholar] [CrossRef]
  26. Simpson, A.T.; Wright, M.D. Diffusive sampling of C7-C16 hydrocarbons in workplace air: Uptake rates, wall effects and use in oil mist measurements. Ann. Occup. Hyg. 2008, 52, 249–257. [Google Scholar] [CrossRef] [Green Version]
  27. Amaral, S.S.; de Carvalho, J.A.; Costa, M.A.M.; Pinheiro, C. An overview of particulate matter measurement instruments. Atmosphere 2015, 6, 1327–1345. [Google Scholar] [CrossRef] [Green Version]
  28. Hari, S.; Hassan, Y.A. Computational fluid dynamics simulation of virtual impactor performance: Comparison to experiment. powder technol. Powder Technol. 2008, 188, 13–22. [Google Scholar] [CrossRef]
  29. Zeeshan Zahir, M.; Lim, J.H.; Noh, S.Y.; Yook, S.J. Development of electric virtual impactor with variable sampling particle size range. Adv. Powder Technol. 2021, 32, 3456–3464. [Google Scholar] [CrossRef]
  30. Wang, P.; Yuan, S.; Oppong, P.K.; Yang, N. A Sheathed virtual impactor—Microseparator for improved separation of sub- and supercritical sized particles. J. Aerosol Sci. 2022, 164, 105999. [Google Scholar] [CrossRef]
  31. Lim, J.H.; Nam, S.H.; Kim, J.; Kim, N.H.; Park, G.S.; Maeng, J.S.; Yook, S.J. Development of three-stage bioaerosol sampler for size-selective sampling. J. Biomech. Eng. 2022, 144, 071008. [Google Scholar] [CrossRef]
  32. Ngagine, S.H.; Deboudt, K.; Flament, P.; Choël, M.; Kulinski, P.; Marteel, F. Development and characterization of a time-sequenced cascade impactor: Application to transient pm2.5 pollution events in urbanized and industrialized environments. Atmosphere 2022, 13, 244. [Google Scholar] [CrossRef]
  33. Dragan, C.C.; Kohlmeier, V.; Breuer, D.; Blaskowitz, M.; Karg, E.; Zimmermann, R. On the challenges of measuring semi-volatile organic compound aerosols using personal samplers. Gefahrst. Reinhalt. Luft 2017, 77, 411–415. [Google Scholar]
  34. Lee, H.; Jo, D.H.; Kim, W.G.; Yook, S.J.; Ahn, K.H. Effect of an orifice on collection efficiency and wall loss of a slit virtual impactor. Aerosol Sci. Technol. 2014, 48, 121–127. [Google Scholar] [CrossRef] [Green Version]
  35. Kim, S.W.; Raynor, P.C. A new semivolatile aerosol dichotomous sampler. Ann. Occup. Hyg. 2009, 53, 239–248. [Google Scholar] [CrossRef] [Green Version]
  36. Kim, S.W.; Raynor, P.C. Optimization of the design of a semivolatile aerosol dichotomous sampler. Aerosol Sci. Technol. 2010, 44, 129–140. [Google Scholar] [CrossRef]
  37. Kim, S.W.; Raynor, P.C. Experimental evaluation of oil mists using a semivolatile aerosol dichotomous sampler. J. Occup. Environ. Hyg. 2010, 7, 203–215. [Google Scholar] [CrossRef]
  38. Hari, S.; McFarland, A.R.; Hassan, Y.A. CFD study on the effects of the large particle crossing trajectory phenomenon on virtual impactor performance. Aerosol Sci. Technol. 2007, 41, 1040–1048. [Google Scholar] [CrossRef]
  39. Chang, P.K.; Hsiao, T.C.; Engling, G.; Chen, J.C. Computational fluid dynamics study of the effects of flow and geometry parameters on a linear-slit virtual impactor for sampling and concentrating aerosols. J. Aerosol Sci. 2019, 131, 28–40. [Google Scholar] [CrossRef]
  40. Hu, S.; McFarland, A.R.; Hu, S. Circumferential-slot virtual impactors with stable flow. Aerosol Sci. Technol. 2008, 42, 748–758. [Google Scholar] [CrossRef]
  41. Hari, S.; Hassan, Y.A.; Mcfarland, A.R. computational fluid dynamics simulation of a rectangular slit real impactor’s performance. Nucl. Eng. Des. 2005, 235, 1015–1028. [Google Scholar] [CrossRef]
  42. British Standard; High Efficiency Air Filters (EPA, HEPA and ULPA) Part 3: Testing Flat Sheet Filter Media; European Committee for Standardization: Brussels, Belgium, 2009.
Figure 1. Structural evolution of the impactor.
Atmosphere 13 01048 g001
Figure 2. Schematic view of the sampler.
Atmosphere 13 01048 g002
Figure 3. Comparison of numerical simulation and literature results [38]. (a) Transmission efficiency (b) Wall losses.
Atmosphere 13 01048 g003
Figure 4. Sampler performance curve with different grid numbers.
Atmosphere 13 01048 g004
Figure 5. Schematic diagram of the experimental system. (1—Oil mist generator, 2—Air compressor, 3—Pressure regulating valve, 4—Oil-water separator, 5—Drying pipe, 6—Mass flow controller, 7—Flow indicator (0~50 L/min), 8—Acrylic cabin, 9—Honeycomb mesh, 10—Porous flow homogenizer, 11—Temperature and humidity sensor, 12—Dust detector, 13—HEPA filter, 14—Frequency converter, 15—Centrifugal induced draft fan, 16—Virtual impactor, 17—Insulating resin screw, 18—Cylindrical electrostatic sampler, 19—Tenax adsorption tube, 20—Glass rotameter, 21—Vacuum pump, 22—High voltage generator, 23—BGG negative high voltage power supply).
Atmosphere 13 01048 g005
Figure 6. DOS oil concentration distribution (The number of experiments is 3).
Atmosphere 13 01048 g006
Figure 7. Influence of geometric factors on sampler performance. (a) Corner radius of the collecting nozzle. (b) Distance between the incident nozzle and the collection nozzle. (c) Throat diameter of the incident nozzle.
Atmosphere 13 01048 g007
Figure 8. (a) Influence of Reynolds number on sampler performance (b) Impact of split ratio on sampler performance.
Atmosphere 13 01048 g008
Figure 9. Photograph of the sampler.
Atmosphere 13 01048 g009
Figure 10. The performance curve of the electrostatic tube.
Atmosphere 13 01048 g010
Figure 11. (a) Comparison of the experimental and simulation results for the sampler (the number of experiments is 3). (b) comparison of results measured by different oil mist sampling methods (the number of experiments is 3).
Atmosphere 13 01048 g011
Table 1. Summary of coefficients in Equation (6).
Equation or ModelϕГϕSϕConstants
Continuity10
Momentumujμeff P x i + x j μ e f f u j x j + S u μeff=μ+μt
TemperatureT μ Pr + μ t Pr t ST μ t = ρ C μ k 2 ε  Cμ= 0.0845
RNG k-εk μ + μ t σ k G k + G b ρ ε G k = μ t S 2 S = 2 S i j S i j η = S k ε
G b = ρ g i μ t σ T , t T ¯ x i R ε = C μ ρ η 3 1 η / η 0 1 + β η 3 ε 2 k
αk = 1.0, αε = 1.3, C = 1.42,
C = 1.68, η0 = 4.377, β = 0.012
ε μ + μ t σ E G 1 ε G k ε k C 2 ε ρ ε 2 k R ε
Table 2. Sampler detail size.
Geometric Features (mm)Reynolds Number (Re)Split Ratio
Throat Size (D)Nozzle Spacing (S)Collecting Nozzle Radius (R)
0.80.480.1017669:1
0.1535316:1
1.01.201:6
0.4070621:9
Publisher’s Note: MDPI stays neutral with regard to jurisdictional claims in published maps and institutional affiliations.

