Abstract
It is very important to analyze the performance of the model rainstorm forecast for understanding the intensity and position deviation of the model precipitation and improving the forecast ability. This paper uses classical scoring and the MODE (Method for Object-Based Diagnostic Evaluation) method to evaluate the forecast performance of different products. The forecast and observation data used in the article mainly include CMA (China Meteorological Administration) multi-source merged precipitation analysis, the precipitation forecast of ECMWF (European Centre for Medium-Range Weather Forecasts), CMA-Meso (Mesoscale model forecast of CMA) and SCMOC (National Meteorological Center grid precipitation forecast guidance product) data. At the same time, the possible correction method of heavy rainfall area is explored by using the high and low-level circulation configuration of the ECMWF model. The main conclusions are as follows: ① MODE spatial verification shows that the number, intensity, area and location of ECMWF rainstorm precipitation objects match the observed precipitation best, which is obviously better than SCMOC and CMA-Meso precipitation forecasts. There are significantly fewer SCMOC rainstorm precipitation objects, and the area of each single precipitation object is significantly larger, which often fails to report the small area objects of convective precipitation. ② The reason for the high TS score of SCMOC is that it reduces the number of small area rainstorm objects and avoids the “double punishment” phenomenon caused by position forecast error, which leads to the failure of SCMOC in local rainstorm forecasts. ③ Analyzing the relationship between the circulation situation of the ECMWF model and the location of rainstorm forecasts by the model, it is found that the location of the rainstorm area is consistent with the upper circulation system, especially with the strong rising area of the vertical velocity of 700 hPa and the high value area of the specific humidity of 850 hPa. When the rainstorm area coincides with the upper air system but is not consistent with the ground convergence area and the high value area of velocity potential, the rainstorm location often has a large deviation. The location of the surface convergence area can be used as a reference to improve the performance of the rainstorm forecast.
1. Introduction
Improving the forecasting ability of rainstorm and heavy precipitation is one of the most important tasks in weather forecasting, and the floods caused by rainstorm or heavy precipitation often cause great loss to people’s lives, property, and the national economy. Therefore, rainstorm research has always been the focus and hot issue of meteorological workers at home and abroad. The existing research work on rainstorm forecasts in the Qinling Mountains and surrounding areas of China mainly focuses on three aspects: first, based on weather situation [1,2,3,4], water–vapor transfer [5,6,7], small and medium-scale characteristics [8,9,10,11,12]; second, the numerical simulation of system structure and evolution process of rainstorm using a high-resolution regional numerical model [13,14]; third, the rainstorm correction based on the statistical postprocessing of numerical forecast products [15,16]. These works not only enhance the scientific understanding of rainstorm problems, summarizing the systematic rainstorm development mechanism and the dynamic and thermal structure of the mesoscale system, they also have great value in improving the rainstorm forecast ability and reducing the loss of rainstorm meteorological disasters.
Compared with long-term statistical evaluation, targeted case analysis has more practical application significance [17]. This is because although the long-term statistical test can quantitatively give the forecast performance of the model, it often blurred the key details in the forecast, which is not conducive to the error analysis of the mode results. In previous research work, Wang Xinmin and Li Han used FSS (fractional skill score) score and CRA (contiguous rain area) to evaluate the precipitation forecast performance of the four models in 2018 [18]. Xu et al. [19]. evaluated the forecast performance of five numerical models on heavy precipitation in Zhejiang Province before and after the landfall of super typhoon Leqima. Based on the automatic station observation and ECMWF reanalysis data, Wang Xiaofeng et al. analyzed the forecast performance of four numerical models on the precipitation of Typhoon ’Fitow’ (NO.1323) [20]. Zhong Youliang et al. tested the forecast performance of the Grapes-REPS regional ensemble forecast mode for precipitation at 24–48 h in 2015 [21]. These works are conducive to improving the precipitation release capacity of the numerical model, but most of the research is mainly typhoon and rainstorm. In fact, the forecast performance of the heavy precipitation model is not only suitable for typhoons and rainstorms but also has important business application value for systematic rainstorms, warm area rainstorms, and rainstorms formed by topographic action.
In the flood season of 2020, there were many heavy precipitation weather processes in the Qinling Mountains and their surrounding areas, with high frequency, high intensity, and long duration, causing huge losses to people’s lives and property. This paper uses the object-oriented MODE method to evaluate the forecast performance of different precipitation products during the rainstorm weather process in the Qinling Mountains and the surrounding areas in 2020. The analysis results are connected with the weather situation, and we explore possible ways to improve the forecast performance of precipitation intensity and location area in order to help forecasters and product release research and development personnel to better use the numerical model products in business to improve the actual forecast ability.
2. Data and Methods
2.1. Data
The article mainly selects 7 rainstorm forecast cases in 2020. The specific rainstorm case information is shown in Table 1. The precipitation products are the global model ECMWF (European Centre for Medium-Range Weather Forecasts), CMA-Meso (China Meteorological Administration Mesoscale model forecast) and the grid precipitation forecast guidance products released by the National Meteorological Center SCMOC. The statistical period of daily precipitation is 00 UTC on the previous day to 00 UTC on the day. It should be noted that in order to match the actual business in the analysis, the model of the previous day started at 12 UTC, and the precipitation forecast matched the observation period after 12 h. The observation data adopted CMPA (CMA Multi-source Merged Precipitation Analysis) data, with a time resolution of 1 h and a spatial resolution of 0.05° × 0.05°. Sheng Yan et al. [22] pointed out that the data are representative and reliable, and they can be used to show the real situation of precipitation. The detailed numerical model forecast and observation analysis data information is shown in Table 2.

Table 1.
Circulation classification of selected rainstorm cases in Qinling mountains and their surrounding areas.
Table 2.
Details of numerical model forecasts and CMPA data.
In addition, ECMWF high and low air circulation situation data are used to classify weather patterns. The scope of the study is the Qinling Mountains and their surrounding areas (Figure 1), with a latitude and longitude range of 31°–40° N and 103°–113° E. All times in the text are in universal time.
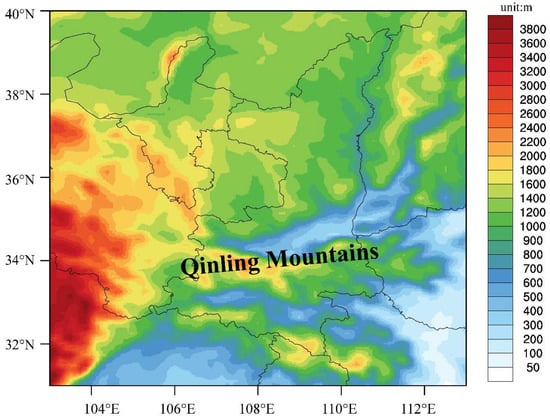
Figure 1.
Study area: Terrain of Qinling Mountains and their surrounding areas.
2.2. Methods
The MODE method was developed by Davis et al. [23,24,25]. The method convolved the original precipitation field by a given radius R, and it calculates the precipitation intensity, axis angle and area of the object based on analyzing the conditions. The MODE method resolution function is:
In this formula, f is the displacement function of the raw data field, is the filter function, and C is the resulting convolved field. The variables (x, y) and (u, v) are grid and displacement coordinates, respectively. The filter function is a simple circular filter determined by a radius of influence R and a height H.
The parameters R and H are not independent. They are related by the requirement that the integral of over the grid be unified:
Thus, the radius of influence R is the only tunable parameter in the convolution process. Once R is chosen, H is determined by the above equation. Once the convolved field C is in hand, it is thresholded to create a mask field M:
where T is the precipitation threshold. The objects are the connected regions where M = 1. Finally, the raw data are restored to object interiors to obtain the object.
The similarity calculation formula for the MODE method is as follows:
where ai represents the ith attribute of the object, represents the weight coefficient of the ith attribute of the object, and C(ai) represents the confidence level of the ith attribute. Ii(ai) represents the interest function of the ith property of the forecast field object, and it is a function of ai. Statistically, T(a) indicates the similarity between the matched forecast and observed precipitation objects. In other words, T(a) signifies whether the comprehensive attributes of the forecast object are consistent with the observed object. If the value of T(a) is larger, the two objects are more similar; that is, the comprehensive results of intensity, area, morphology and other performance indicators are more consistent with the observations.
In addition, TS (Threat Score) score and Bias are used to analyze the traditional forecast skill score of model precipitation forecasting. The formula is as follows:
where A is the number of correctly forecast precipitation events exceeding the threshold, B is the number of false alarms, and C is the number of missed alarms. Bias and TS scores have ideal values of 1, and Bias above 1 or below 1 indicates excessive or insufficient forecast frequency.
In addition, when analyzing the reasons for the offset of precipitation location forecast, the divergence characteristics of the ground wind field are further analyzed. Using the accelerated Liebman method [26], we calculate the potential function and then calculate the component of the radiation wind. The calculation formula is as follows:
where is the horizontal wind vector, is the rotating part of wind, is the divergence part of wind, is the vertical unit vector, is the flow function; is the potential function. and are the components of the divergent wind in the meridional and latitudinal directions, and D is divergence.
3. Results
3.1. Mode Method Analysis
Figure 2 shows the spatial test results of a rainstorm forecast example. For the convenience of expression, we select 00 UTC from 16 June to 17 June 2020 as the first Rainstorm Day, 00 UTC from 4 August to 5 August as the second Rainstorm Day, and 00 UTC from 6 August to 7 August as the third rainstorm day for specific analysis. The numbers in the figure represent the precipitation objects identified from different precipitation fields, and different colors indicate the matching situation between the forecast objects and the observed objects. According to the calculated value obtained from the fuzzy logic function T(a), when T(a) is greater than or equal to 0.6, it means that the forecast and observation are matched, and then, the attributes and characteristics of the forecast and observed objects are compared. The blue objects in the figure indicate T (a) < 0.6, the forecast and observed objects do not match successfully, and the objects of the remaining colors indicate matching successfully. As you can see, the first rainstorm day (upper row of Figure 2), three precipitation objects were identified in the observation field (Figure 2d), while ECMWF, CMA-Meso and SCMOC identified six, seven, and one objects, respectively. The number of SCMOC precipitation objects identified was significantly less. On the second rainstorm day (middle row in Figure 2), three precipitation objects were identified in the observation field, and one precipitation object was identified in both the models precipitation and SCMOC. The identification of precipitation objects on the third rainstorm day (Figure 2 lower row) was similar to that on the second rainstorm day. The precipitation objects in both the pattern forecast and those identified by SCMOC were significantly less compared with the observation. In fact, intuitively viewed from Figure 2, there are multiple small area precipitation objects in both the model forecast and the observation field, which are reflected in both the pattern forecast and the SCMOC.
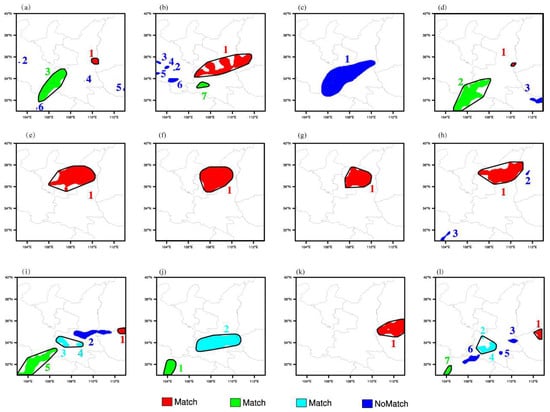
Figure 2.
The cases of MODE verification of rainstorm for three precipitation forecast products. (a–d) are torrential rain objects identified by ECMWF, CMA-Meso, SCMOC and observed precipitation for case 3, respectively. (e–h) are the same as (a–d), but for case 5. (i–l) are the same as (a–d), but for case 7. The red, green and blue in the figure are the matching objects with the same color in the forecast and observation precipitation fields. The blue precipitation object indicates that there is no match between the forecast and observation; that is, according to the matching rule, although there is a precipitation object in the forecast field, there is no precipitation object in the observation field, and vice versa.
The analysis found that the numerical model is weak in the forecast ability of convective precipitation, which leads to misreporting or the under reporting of small-area precipitation objects, while the SCMOC is not a model direct precipitation forecast. Instead, the precipitation release is based on the numerical model forecast; in the process of precipitation release, the forecast score is optimal. Using an objective method to avoid the phenomenon of double punishment, we often ignore some convective precipitation or small area of precipitation objects to improve the forecast score. However, it is also possible to reduce the forecast and early warning ability of small-scale local rainstorm.
Seven cases of the overall statistical characteristics are shown in Figure 3. In terms of model forecast and observation number of the precipitation objects, in addition to ECMWF, the CMA-Meso model forecasts slightly more objects than can be observed, while the actual number of precipitation recognition objects is less. In particular, the number of forecasted precipitation products in the SCMOC is very significant. From the perspective of the area of the identified object, except for the forecast area of three out of the seven cases, the forecast area of the other cases is larger than the observation. In Figure 3, the diagonal shows that the forecast and observation are completely matched. We can see that the rainstorm forecast area of the ECMWF model (Figure 3d) is slightly larger than the observation, which is better than the GRAPES and SCMOC precipitation forecast. SCMOC has significantly fewer forecasted objects (Figure 3b); the area of a single object significantly exceeds the observation (Figure 3e) precipitation object area. This phenomenon is similar in most of the SCMOC systemic drops, which leads to the long SCMOC precipitation forecast. In addition, the forecast deviation Bias may score higher, but in a single case, the rainstorm forecast frequency is significantly higher or lower.
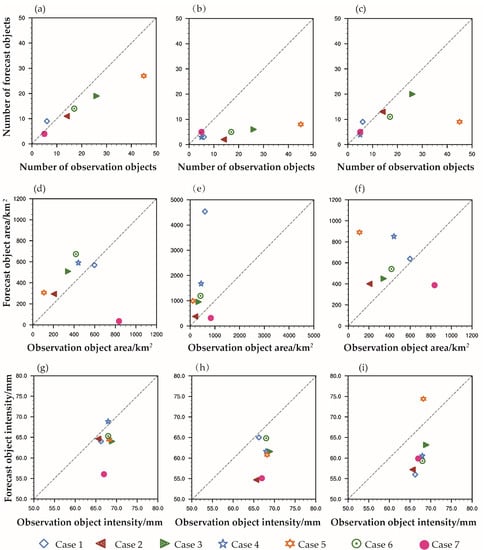
Figure 3.
The number, area, and intensity of precipitation objects verified by the MODE method of three precipitation forecast products and observe precipitation for 7 rainstorm cases of 2020. (a–c) are the number of objects. (d–f) are objects area. (g–i) are objects intensity.
The precipitation intensity of seven rainstorm cases was analyzed (Figure 3 bottom row). To comprehensively show the overall intensity of precipitation, 90% quantiles of precipitation greater than 50.0 mm were selected for analysis to remove the possible extreme precipitation at a single grid. It can be seen that ECMWF still has a good forecast performance in terms of intensity forecast. Excluding the seventh rainstorm case, the other rainstorm intensity forecast and observation values are basically similar. However, SCMOC and CMA-Meso were generally weak (Figure 3h), with no obvious advantage over ECMWF. The TS scores of ECMWF, SCMOC and CMA-Meso are 0.216, 0.227 and 0.193, respectively, and SCMOC has the largest TS score, but this does not mean that SCMOC has the best forecast and early warning ability. A mode test shows that the number of SCMOC rainstorm forecast objects is less than the observation, the area is too large and the intensity is too weak. The actual forecasting and early warning ability still needs to be improved.
From the perspective of the position forecast error of precipitation objects (Figure 4), compared with the observation, the ECMWF forecast position is mainly north and west. Forecast case 3 is the most obvious among all the cases, with the west and north exceeding one longitude and one latitude, and the position deviation in the other cases is mainly west. The forecast position of the SCMOC rainstorm object is relatively northward (Figure 4b), and the east–west error is not obvious. Moreover, for the individual case of convective precipitation, the forecast position of SCMOC convective precipitation is far from the central point, which is not as good as that of ECMWF. Among the three precipitation forecast positions, the CMA-Meso position (Figure 4c) has a high dispersion over the central point and the largest forecast error, and the position of the CMA-Meso rainstorm object is northerly relative to the overall observation, whether systematic or convective precipitation.
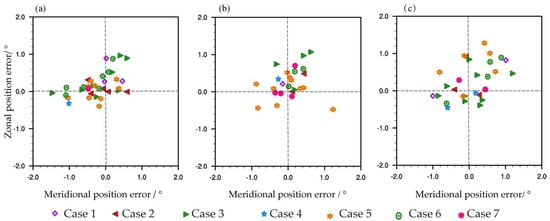
Figure 4.
Comparison of the spatial position error and observation of the object tested by the spatial MODE method of the rainstorm weather process in seven rainstorms in 2020. (a) ECMWF, (b) SCMOC, (c) CMA−Meso.
3.2. Relationship between Circulation Situation and Rainstorm Position Forecast Deviation
Mode verification shows that SCMOC has a large error in both the number, area, intensity of objects, and the spatial position, and the ECMWF model is more consistent with observation. Although in terms of the traditional test TS score, SCMOC performs the best, it is not completely equivalent to the forecast and early warning capability. Therefore, the causes of the precipitation error were analyzed. In order to be closer to the actual forecast operation, the reanalysis data are not used, but the actual forecast data are used. At the same time, the large systematic precipitation cases 3 and the convective precipitation cases 5 were selected as the analysis objects.
Figure 5 shows the observed precipitation, model precipitation forecast, and configuration of high and low altitude situation at 00 UTC on the 23rd of case 3. The grid precipitation of CMPA shows that it occurred in western Guanzhong and western southern Shaanxi (Figure 5a). Figure 5b shows the precipitation from 00 UTC on the 23rd to 00 UTC on the 24th from 00 UTC on the 22nd. The area and intensity of the rainstorm area are basically consistent with the observation as a whole, but the location is obviously west and north. The nature of precipitation is systematic precipitation. Convective precipitation accounts for less than 50% of the total precipitation in most parts of the region.
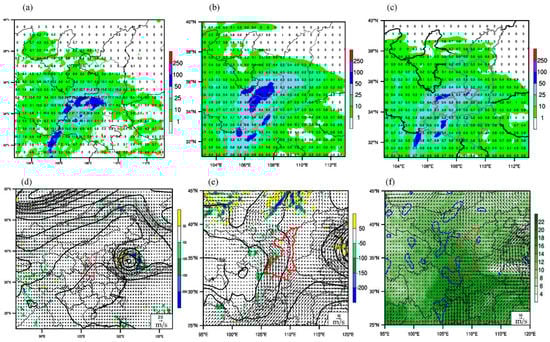
Figure 5.
The CMPA precipitation of a rainstorm forecast case on 23 July and the precipitation and high−altitude situation forecast of ECMWF model corresponding to the observation period. (a) CMPA 24 h cumulative precipitation from 00 UTC on 23 July to 00 UTC on 24 July. (b) The ECMWF model accumulated precipitation from 00 UTC on 23 July to 00 UTC on 24 July, and the initial time was 00 UTC on 22 July. (c) Same as (b), but the initial time was 12 UTC on 22 July. (d) The geopotential height of 500 hPa, the vertical velocity and wind field of the ECMWF model at 12 UTC on 23 July, and the initial time was 00 UTC on 22 July. (e) Same as (d), but for 700 hPa. (f) Same as (d), but it is 850 hPa specific humidity, relative divergence and wind field.
Figure 5c shows the precipitation from 00 UTC on the 23rd to 00 UTC on the 24th from 12 UTC on the 22nd. The area and intensity of the rainstorm area decreased significantly, and the location changed little. By analyzing the 10 times of precipitation forecasts from the ECMWF model within 120 h before the rainstorm, it is found that for this process, the precipitation position changes slightly from southeast to northwest, but the forecast is relatively stable as a whole.
The analysis model forecasts a high–low circulation situation with 500 hPa subtropical high control in most provinces in southern China. The 588 hPa geopotential height line crosses the central Shaanxi from southwest to northeast. The west of Guanzhong is affected by subtropical high peripheral warm air, has weak shear and obvious rising movement (Figure 5d), while the subtropical high peripheral typhoon is located on the Shandong peninsula; it has an impact on Shandong, Hebei, Tianjin, and other provinces and cities. At 700 hPa (Figure 5e), the cold air in the west of the typhoon vortex is transported to the south and blocked by the subtropical high; one part flows to the south and merges with the air flow around the typhoon, and the other part merges with the warm and humid air flow around the typhoon in the middle and north of Shaanxi and turns to the northwest.
The situation of 850 hPa (Figure 5f) is similar to 700, but the airflow convergence is more west and south. The convergence area is located in the west of Guanzhong and southern Shaanxi, and the convergence area has better water vapor conditions and specific humidity exceeding 12 g/kg. By comparing the precipitation forecast with the high-altitude situation, it can be found that the rainstorm position of the model forecast works very well with the large vertical velocity area of 700 hPa and 500 hPa, and the 850 hPa airflow convergence area. The situation field is consistent with the precipitation field.
The ground convergence and divergence wind and velocity potential during the rainstorm period are calculated, and the results are shown in Figure 5. It can be found that there are obvious differences in the location of the convergence area of the middle and low-level system and the surface wind field with 700 hPa and 850 hPa. On the surface map, from 00 UTC on 23 July (Figure 6a) to 18 UTC on 24 July (Figure 6d), the north of Xi’an, Xianyang and Baoji of Shaanxi province have been the convergence centers of the surface wind field for a long time. At the same time, they are also the high value area of velocity potential and the convergence center of surface air flow.
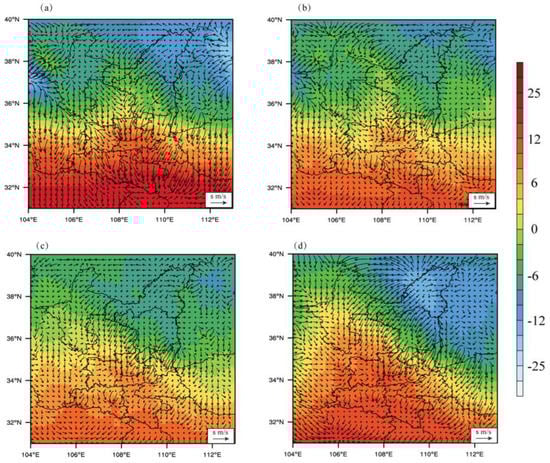
Figure 6.
The convergence and divergence wind and velocity potential of 4 times in the main precipitation period of rainstorm case 3 began to be predicted at 00 UTC on 22 July 2020. (a) Convergent divergent wind and velocity potential at 00 UTC on 23 July. (b) Same as (a), but at 16 UTC on 23 July. (c) Same as (a), but at 12 UTC on 23 July. (d) The same as (a), but at 18 UTC on 24 July.
Comparing the observed precipitation (Figure 5a) with the ground wind field (Figure 6), it is found that the two cooperate very well, indicating that the convergence of air flow on the ground has a direct impact on the falling area of rainstorm. In the analysis of the other five systematic precipitation cases, the rainstorm falling area of the ECMWF model often matches well with the middle 700 hPa and 850 hPa shear line, the high value area of specific humidity and the high value area of ascending movement, which is not completely consistent with the convergence area of the ground wind field. The middle and low-level system is located in the same place as the ground convergence area (case 2, case 4 and case 6). The rainstorm falling area is basically consistent with the observation that when the rainstorm area cooperates with the middle and low-level system and has a large deviation from the ground convergence area (case 1, case 3 and case 7), a better prediction effect can often be obtained by adjusting the rainstorm area with reference to the ground convergence area.
Figure 7 shows the high and low-altitude circulation situation forecast of ECMWF model convective precipitation case 5. Because it is convective precipitation, convergence and divergence wind and convective available potential energy (CAPE) are selected on the ground field. From the circulation situation of 500 hPa (Figure 7a), there is a weak short-wave trough in the periphery of the subtropical high, the system is not deep, and the cold air is significantly weak. On the 700 hPa weather chart (Figure 7b), the cold air and the warm and humid air flow in the north of Shaanxi intersect in the northwest of Guanzhong and the west of Shaanxi, and there is an obvious upward movement. The large area of vertical velocity of 700 hPa is very consistent with that of 500 hPa. From the model precipitation forecast, the rainstorm area basically coincides with the large vertical speed area, with the vertical velocity < −0.5 pa/s area; in most places, the precipitation is greater than 50.0 mm (Figure 7c). From the perspective of the observed precipitation, the rainstorm area is relatively scattered. Compared to the observation, the overall model forecast is west and north.
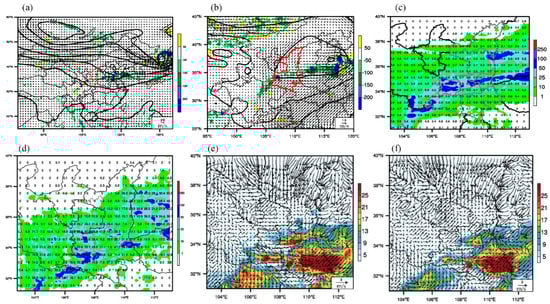
Figure 7.
A case study of ECMWF model forecast from 00 UTC on 6 August to 00 UTC on 7 August. (a) The 500 hPa geopotential height, vertical velocity and wind field of ECMWF at 12 UTC on 23 July, which the initial time was 00 UTC on 22 July. (b) Same as (a), but for 700 hPa. (c) The ECMWF accumulated precipitation from 00 UTC on 6 August to 00 UTC on 7 August, and the initial time was 00 UTC on 22 July. (d) CMPA 24 h cumulative precipitation from 00 UTC on 6 August to 00 UTC on 7 August. (e) The convergence and divergence wind and Cape of ECMWF model at 12 UTC on 6 August, and the initial time was 00 UTC on 5 August. (f) Same as (e), but the initial time of the model forecast is 6 August to 15 UTC.
By analyzing the surface convergence wind field, on 6 August at 12 UTC, the convective available potential energy at the junction of Hanzhong North Central, Xi’an South, Weinan southeast and Ankang Shangluo is high, and it is also the convergence area of the wind field, and the duration is more than 6 h (Figure 7f). The actual precipitation and rainstorm range (Figure 7d) corresponds very well to the ground convergence area, especially the local rainstorm at the junction of Weinan and Shangluo. The location is completely consistent, which is very instructive for predicting the local rainstorm. Furthermore, it is found that the simple ground convergence area cannot produce large precipitation. In this case, the Cape value in the east of Ankang and the south of Shangluo is large, and the wind field convergence is obvious, but it is far from the upper air system, and there is no rainstorm.
4. Conclusions and Discussion
Using the spatial verification MODE method, the forecast performance of the ECMWF, CMA-Meso, and national meteorological center grid precipitation guidance product SCMOC for different rainstorm weather processes is analyzed. At the same time, the ground convergence and divergence wind and velocity potential are calculated by using the high and low altitude situation field and ground wind field prediction data of the ECMWF model, so as to explore the possible ways to improve the rainstorm location forecast deviation. The main conclusions are as follows:
The verification of the MODE method shows that the number of precipitation objects identified in the precipitation field of the ECMWF model is basically consistent with the observation, and the number of precipitation objects identified by SCMOC is seriously small. By analyzing the intensity, area and position error of matching objects, it is found that although the TS score of the SCMOC rainstorm forecast is high, the area of a single precipitation object is significantly larger than the observation, and some small precipitation objects are missed, especially for some local rainstorms, The possible reason is that during the interpretation and application of model precipitation, SCMOC chose to increase the rainstorm prediction range of systematic precipitation and reduce some small-scale rainstorms caused by convective precipitation in order to avoid the “double punishment” phenomenon due to location deviation. Therefore, the application of SCMOC should pay special attention to the possible missed local rainstorms.
By analyzing the high and low altitude situation of the ECMWF model in the case of rainstorm forecast, the relationship between the ground convergence area and the rainstorm falling area forecasting by the model and the observed rainstorm falling area, it is found that the rainstorm falling area predicted by ECMWF is basically consistent with the shear line of 700 hPa and 850 hPa and the area with large specific humidity.
There are two situations for comparing the location of the rainstorm with the actual observation. One is that the 700 hPa and 850 hPa weather systems are in good agreement with the ground convergence line and the large value area of the velocity potential, and the deviation between the rainstorm falling area predicted by the model and the observation location is often small. Second, there is a large position deviation between the 700 hPa and 850 hPa systems and the ground convergence line and the high-value area of velocity potential; that is, the high and low-altitude situation is not consistent with the ground system. In this case, the ground convergence line lasts for a long time, which often indicates the falling area of rainstorm. Adjusting the falling area of the rainstorm through the ground convergence area and the high value area of velocity potential can improve the prediction performance of the rainstorm.
It should be noted that the ground convergence affecting the rainstorm may only work under the background of the whole high-altitude system. The simple ground convergence or the high-value area of velocity potential will not affect the falling area of the rainstorm, which needs special attention in application.
Author Contributions
Conceptualization, L.P. and H.Z.; methodology, L.P.; software, L.P.; writing—original draft preparation, H.Z.; writing—review and editing, H.Z. All authors have read and agreed to the published version of the manuscript.
Funding
This research was funded by the Shaanxi Province Natural Science Foundation (2021JM-595), Innovation and development project of the China Meteorological Administration Innovation and Development Project (CXFZ2022J023), Shaanxi Province Key Areas of Social Development (2022SF-360).
Institutional Review Board Statement
Not applicable.
Informed Consent Statement
Not applicable.
Data Availability Statement
Not applicable.
Conflicts of Interest
The authors declare no conflict of interest.
References
- Yu, X.D. Investigation of Beijing extreme flooding event on 21 July 2012. Meteorol. Environ. Res. 2012, 38, 1313–1329. (In Chinese) [Google Scholar]
- Sun, J.H.; Zhao, S.X.; Fu, S.M.; Wang, H.J.; Zheng, L.L. Multi-scale characteristics of record heavy rainfall over Beijing area on July 21, 2012. Chin. J. Atmos. Sci. 2013, 37, 705–718. (In Chinese) [Google Scholar]
- Sun, J.H.; Wang, H.J.; Wei, J.; Qi, L.L. The sources and transportation of water vapor in persistent heavy rainfall events in the angtze–Huaihe River valley. Acta Meteorol. Sin. 2016, 74, 542–555. (In Chinese) [Google Scholar]
- Tao, Z.Y.; Zheng, Y.G. Forecasting issues of the extreme heavy rain in Beijing on 21 July 2012. Torrential Rain Disaster 2013, 32, 193–201. (In Chinese) [Google Scholar]
- Pan, L.J.; Zhang, H.F.; Wang, N.; Zhou, Y.Q.; Hou, J.Z.; Zhang, J.H. Mesoscale and Doppler Radar Observation Analyses on a Severe Convective Weather Process in Middle Shaanxi Province in September 2010. Plateau Meteorol. 2013, 32, 278–289. (In Chinese) [Google Scholar]
- Pan, L.J.; Zhang, H.F.; Hou, J.Z.; Yuan, L.L. Initiation and Evolution of Storm over Loess Plateau for Weak Synoptic Forcing Situations. Plateau Meteorol. 2015, 34, 982–990. (In Chinese) [Google Scholar]
- Sun, J.S.; He, N.; Guo, R. The configuration change and train effect mechanism of multi-cellstorms. Chin. J. Atmos. Sci. 2013, 37, 137–148. (In Chinese) [Google Scholar]
- Zhang, Y.X.; Li, Z.T.; Yao, X.X. Analysis on mesoscale system of torrential rain occurring over North China on 21 July 2012. Plateau Meteorol. 2015, 34, 202–209. (In Chinese) [Google Scholar]
- Griffin, S.M.; Otkin, J.A.; Rozoff, C.M.; Sieglaff, J.M.; Cronce, L.M.; Alexander, C.R.; Jensen, T.L.; Wolff, J.K. Seasonal Analysis of Cloud Objects in the High-Resolution Rapid Refresh (HRRR) Model Using Object-Based Verification. J. Appl. Meteorol. Clim. 2017, 56, 2317–2334. [Google Scholar] [CrossRef]
- Duda, J.D.; Turner, D.D. Large-Sample Application of Radar Reflectivity Object-Based Verification to Evaluate HRRR Warm-Season Forecasts. Weather Forecast. 2021, 36, 805–821. [Google Scholar] [CrossRef]
- Xue, C.F.; Pan, L.J. Diagnostic Analysis of Precipitation Forecasting from Japan Thin-Grid Model based on MODE. Plateau Meteorol. 2016, 35, 406–418. (In Chinese) [Google Scholar]
- Pan, L.J.; Zhang, H.F.; Yuan, Y.; Wang, J.P.; Xue, R.; Chen, F.J. The verification of T639 thin grid model precipitation forecasting for continuous rainfall in Shaanxi in 2014. J. Meteorol. Environ. 2015, 31, 9–17. (In Chinese) [Google Scholar]
- Ji, L.; Zhi, X.; Simmer, C.; Zhu, S.; Ji, Y. Multimodel Ensemble Forecasts of Precipitation Based on an Object-Based Diagnostic Evaluation. Mon. Weather Rev. 2020, 148, 2591–2606. [Google Scholar] [CrossRef]
- Clark, A.J.; Bullock, R.G.; Jensen, T.L.; Xue, M.; Kong, F. Application of Object-Based Time-Domain Diagnostics for Tracking Precipitation Systems in Convection-Allowing Models. Weather Forecast. 2014, 29, 517–542. [Google Scholar] [CrossRef] [Green Version]
- Liu, C.; Sun, J.; Yang, X.; Jin, S.; Fu, S. Evaluation of ECMWF Precipitation Predictions in China during 2015–2018. Weather Forecast. 2021, 36, 1043–1060. [Google Scholar] [CrossRef]
- Lavers, D.A.; Harrigan, S.; Prudhomme, C. Precipitation Biases in the ECMWF Integrated Forecasting System. J. Hydrometeorol. 2021, 22, 1187–1198. [Google Scholar] [CrossRef]
- Davis, C.A.; Brown, B.G.; Bullock, R.; Halley-Gotway, J. The Method for Object-Based Diagnostic Evaluation (MODE) Applied to Numerical Forecasts from the 2005 NSSL/SPC Spring Program. Weather Forecast. 2009, 24, 1252–1267. [Google Scholar] [CrossRef] [Green Version]
- Wang, X.M.; Li, H. Spatial Verification Evaluation of Typhoon Rainstorm by Multiple Numerical Models. Meteorol. Mon. 2020, 46, 753–764. (In Chinese) [Google Scholar]
- Xu, L.; Yu, Z.S.; Qiu, J.J.; Li, Y.J.; Wu, M.W. Comparative analysis of multi-model precipitation forecast and evaluation before and after the landfall of Typhoon “Lekima”. J. Meteorol. Sci. 2020, 40, 303–314. (In Chinese) [Google Scholar]
- Wang, X.F.; Xu, X.L.; Yang, X.C.; Zhang, Y.C. The NWP models’ evaluation of landfall processes of the strong typhoon Fitow. Trans. Atmos. Sci. 2016, 40, 609–618. (In Chinese) [Google Scholar]
- Zhong, Y.L.; Cheng, J.; Wang, J.; Li, X.L. Evaluation of the Forecast for Landed Typhoons by Grapes-REPS Regional Ensemble Prediction System. J. Trop. Meteorol. 2017, 33, 953–964. (In Chinese) [Google Scholar]
- Sheng, Y.; Pan, Y.; Yu, J.J. Quality assessment of hourly merged precipitation product over China. Trans. Atmos. Sci. 2013, 36, 37–46. (In Chinese) [Google Scholar]
- Davis, C.A.; Brown, B.; Bullock, R.G. Object-based verification of precipitation forecasts, Part I: Methods and application to mesoscale rain areas. Mon. Weather Rev. 2006, 134, 1772–1784. [Google Scholar] [CrossRef] [Green Version]
- Davis, C.A.; Brown, B.; Bullock, R.G. Object-based verification of precipitation forecasts, Part II: Application to convective rain systems. Mon. Weather Rev. 2006, 134, 1785–1795. [Google Scholar] [CrossRef] [Green Version]
- Pan, L.; Zhang, H.; Liu, J.; Gao, X.; Qi, C. Comparative Analysis of SCMOC and Models Rainstorm Forecasting Performance in Qinling Mountains and Their Surrounding Areas. Atmosphere 2022, 13, 705. [Google Scholar] [CrossRef]
- Ren, C.P.; Cao, J.; Wang, L.J.; Cui, X.P. Comparison Study of the Impacts of Three Approaches for Calculating Streamfunction and Potential Velocity in a Limited Domain on the Analysis of the Rainfall Enhancement of Typhoon Bilis2013. Clim. Environ. Res. 2013, 18, 721–732. (In Chinese) [Google Scholar]
Publisher’s Note: MDPI stays neutral with regard to jurisdictional claims in published maps and institutional affiliations. |
© 2022 by the authors. Licensee MDPI, Basel, Switzerland. This article is an open access article distributed under the terms and conditions of the Creative Commons Attribution (CC BY) license (https://creativecommons.org/licenses/by/4.0/).