Article

Field Measurement and Evaluation of Effective Ventilation and Particulate Matter Discharge Efficiency of Air Shafts in Subway Tunnels

School of Mechanical Engineering, Tongji University, Shanghai 201804, China
*
Author to whom correspondence should be addressed.
Atmosphere 2022, 13(7), 1040; https://doi.org/10.3390/atmos13071040
Submission received: 8 June 2022 / Revised: 26 June 2022 / Accepted: 27 June 2022 / Published: 29 June 2022
(This article belongs to the Special Issue Ventilation in Buildings)

Abstract

:
The ventilation performance of air shafts is important to the air quality of subway tunnels, but there is no unified evaluation index of ventilation performance. In this paper, the air shafts at different locations in subway tunnels were taken as research objects, and the wind speed as well as the particulate matter concentration of each air shaft was tested. The effective ventilation volume and PM2.5 discharge efficiency of the air shafts were defined to evaluate the ventilation performance. It was found that on average, during the subway train service, the station air shaft on the train-arriving side can discharge 2050 m3 of dirty air in the tunnels and inhale 218 m3 of fresh air from the outside environment, while the station air shaft on the train-leaving side can absorb 2430 m3 of fresh air but can hardly effectively discharge dirty air; meanwhile, the middle air shaft can not only effectively exhaust 1519 m3 of dirty air but can also absorb 7572 m3 of fresh air. In addition, the middle air shaft has better ventilation performance if its inner opening is set on the top rather than on the side of the tunnel. The PM2.5 discharge efficiency of the station air shaft on the train-arriving side is 52.0~62.8%, higher than that of the middle air shaft of which the value is 26.8~40.7%. This research can provide guidance for ventilation performance evaluation of subway air shafts and provide a reference for subway tunnel air shaft location design.

1. Introduction

With the rapid growth in urban subway operation mileage, the air quality of the subway environment has also received increasing attention. Since the fresh air of the subway train cabins is introduced from the tunnel through the air-conditioning system, the air quality in the cabins is related to the tunnel environment. When the subway trains run in the tunnel, the temperature in the tunnel rises and particulate matter is produced. Thus, effective ventilation for the subway tunnel is necessary to discharge the heat and pollutants. While the natural ventilation driven by piston wind plays a role that works through the air shafts during the subway operation time, station air shafts are generally set at both ends of subway stations. Middle air shafts are set in the middle of some long tunnels. If the ventilation performance of air shafts is poor, the air quality in the tunnel will gradually deteriorate during the operation time.
The particles in a subway system mainly originate from the tunnel due to the friction between the contact surfaces during the train movement [1]. Since most of the contact surfaces consist of metal material [2], there are a lot of metal components (such as Fe, Mn, Cu, and Zn [3,4,5,6]) in the particles in a subway tunnel, which may cause serious damage to DNA [7,8,9] and other potential harms [10,11,12]. The particles in a tunnel will spread into the platform and the passenger cabin. Therefore, in order to further reduce the PM level a subway system, the most important goal is to reduce the PM level in the tunnel. Up to now, various techniques have been put forward to control the particles in the tunnel, such as magnetic hybrid filters [13], hybrid dust collectors [14], baffle dust collectors [15], louver dust collectors [16], and so on. However, these techniques are being studied, and there is a long way for them to mature.
As a matter of fact, the air shafts in a subway tunnel may work in discharging PM out of the tunnel as they take the role of tunnel ventilation. The PM discharge ability depends on the ventilation performance of the air shafts. Up to now, there is no unified ventilation performance evaluation index for subway air shafts. Lin [17] defined an index, η P E , to evaluate the air exchange efficiency of the piston effects for the air shaft. The index was related to the distance of air travel (inflow or outflow) in each piston effect cycle. However, the distance is not easy to measure. Kim [18], Lee [19], and Huang [20,21] used the ventilating flow rate through the air shaft to evaluate the ventilation performance. However, it cannot effectively reflect the air change between the tunnel and outdoor atmosphere since the volume of the air shaft is not taken into consideration. The temperature and airflow velocity distributions were also used to evaluate the ventilation performance of different air shafts [22]. On the other hand, most of the studies adopted a simulation method to study the ventilation performance of air shafts, and a few have used field measurements. Huang [23] numerically investigated the characteristics of train-induced unsteady airflow in a subway tunnel with natural ventilation shafts. Kim [18] found that when an air shaft was installed only at the train-arriving side, a smaller distance between the air shaft and the station improves the ventilation performance. Wu [24] pointed out that the ventilation system with two air shafts in the station has better performance than that with only one shaft. For the one-shaft system, the location of the shaft on the train-leaving side of the station performs better than on the train-coming side. Fan at al. [25,26] studied the influence of the cross-sectional area and aspect ratio of the air shaft on natural ventilation during a tunnel fire. Besides, the train density is a significant factor affecting the air exchange rate of the air shaft [27], and the diameter also matters [28]. The results of the above studies are all based on numerical simulation methods. Field measurement research usually only tests the wind speed on the air dampers of the air shafts. They seldom pay attention to the ventilation performance [29,30].
This study focuses on the PM pollution situation in a subway system and the ventilation performance of air shafts at different locations in a subway tunnel, aiming to discuss the ventilation performance evaluation method and the possibility of using natural ventilation to discharge the PM in the tunnel. First, the particulate matter size and concentration at different positions in two subway stations were investigated. Second, the piston wind speeds in different air shafts were measured and compared. Moreover, the effective ventilation volume was defined and calculated to evaluate the ventilation performance of different air shafts. Finally, the PM2.5 variations at the inner opening and outer opening of the air shaft were analyzed, and the PM2.5 discharge efficiency was discussed.

2. Experimental Methodology

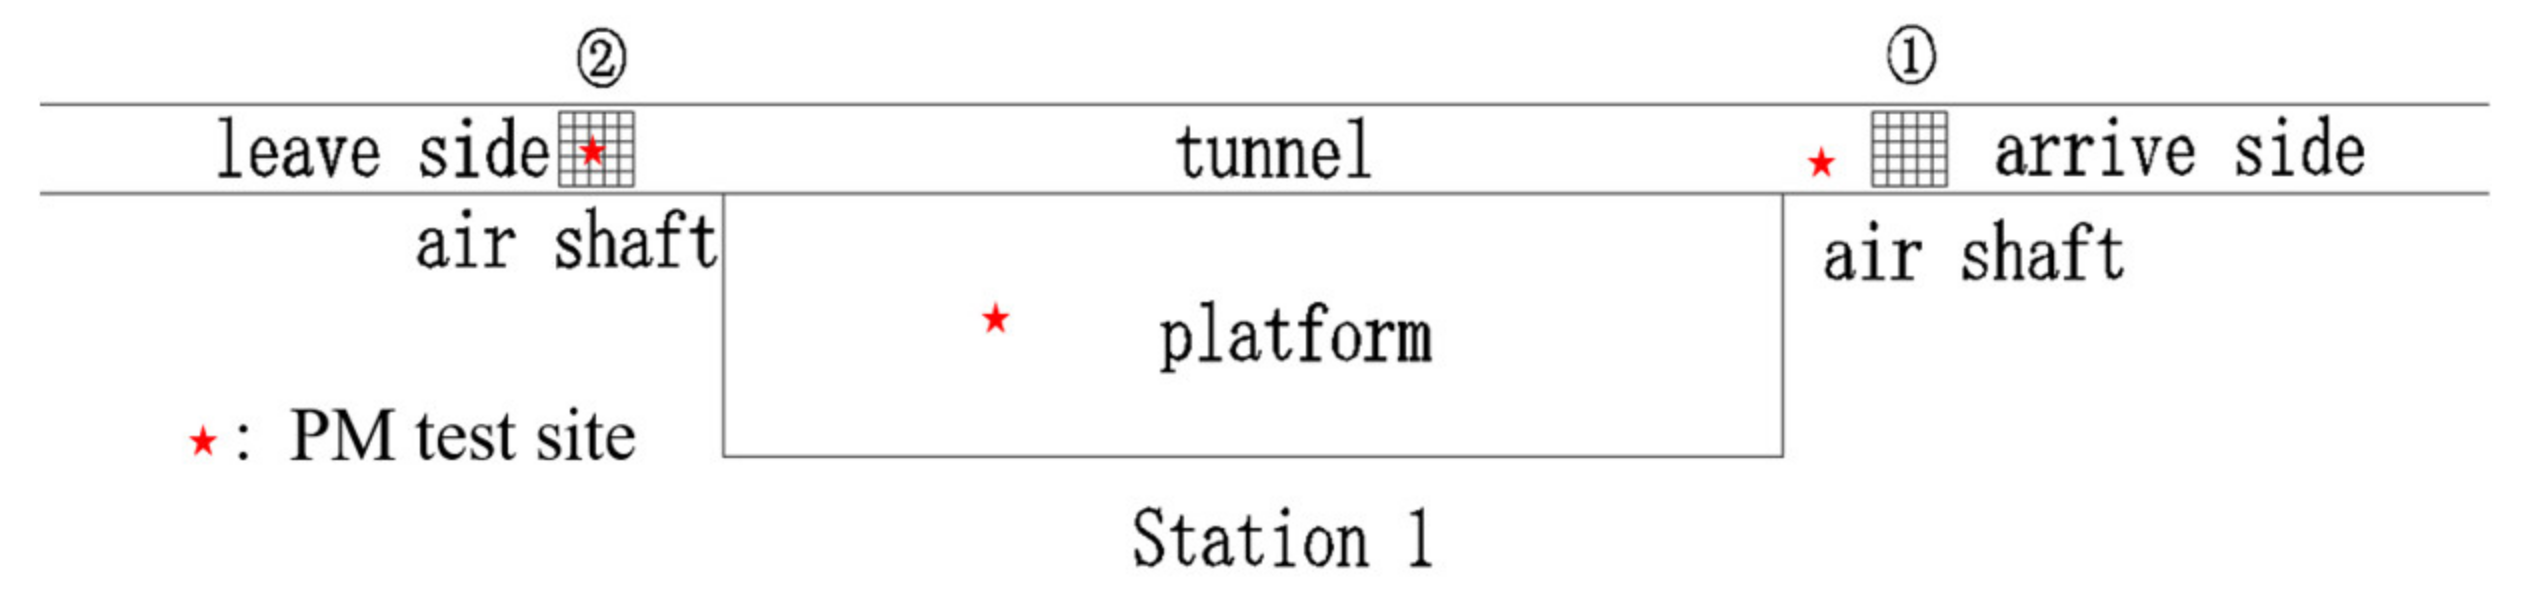
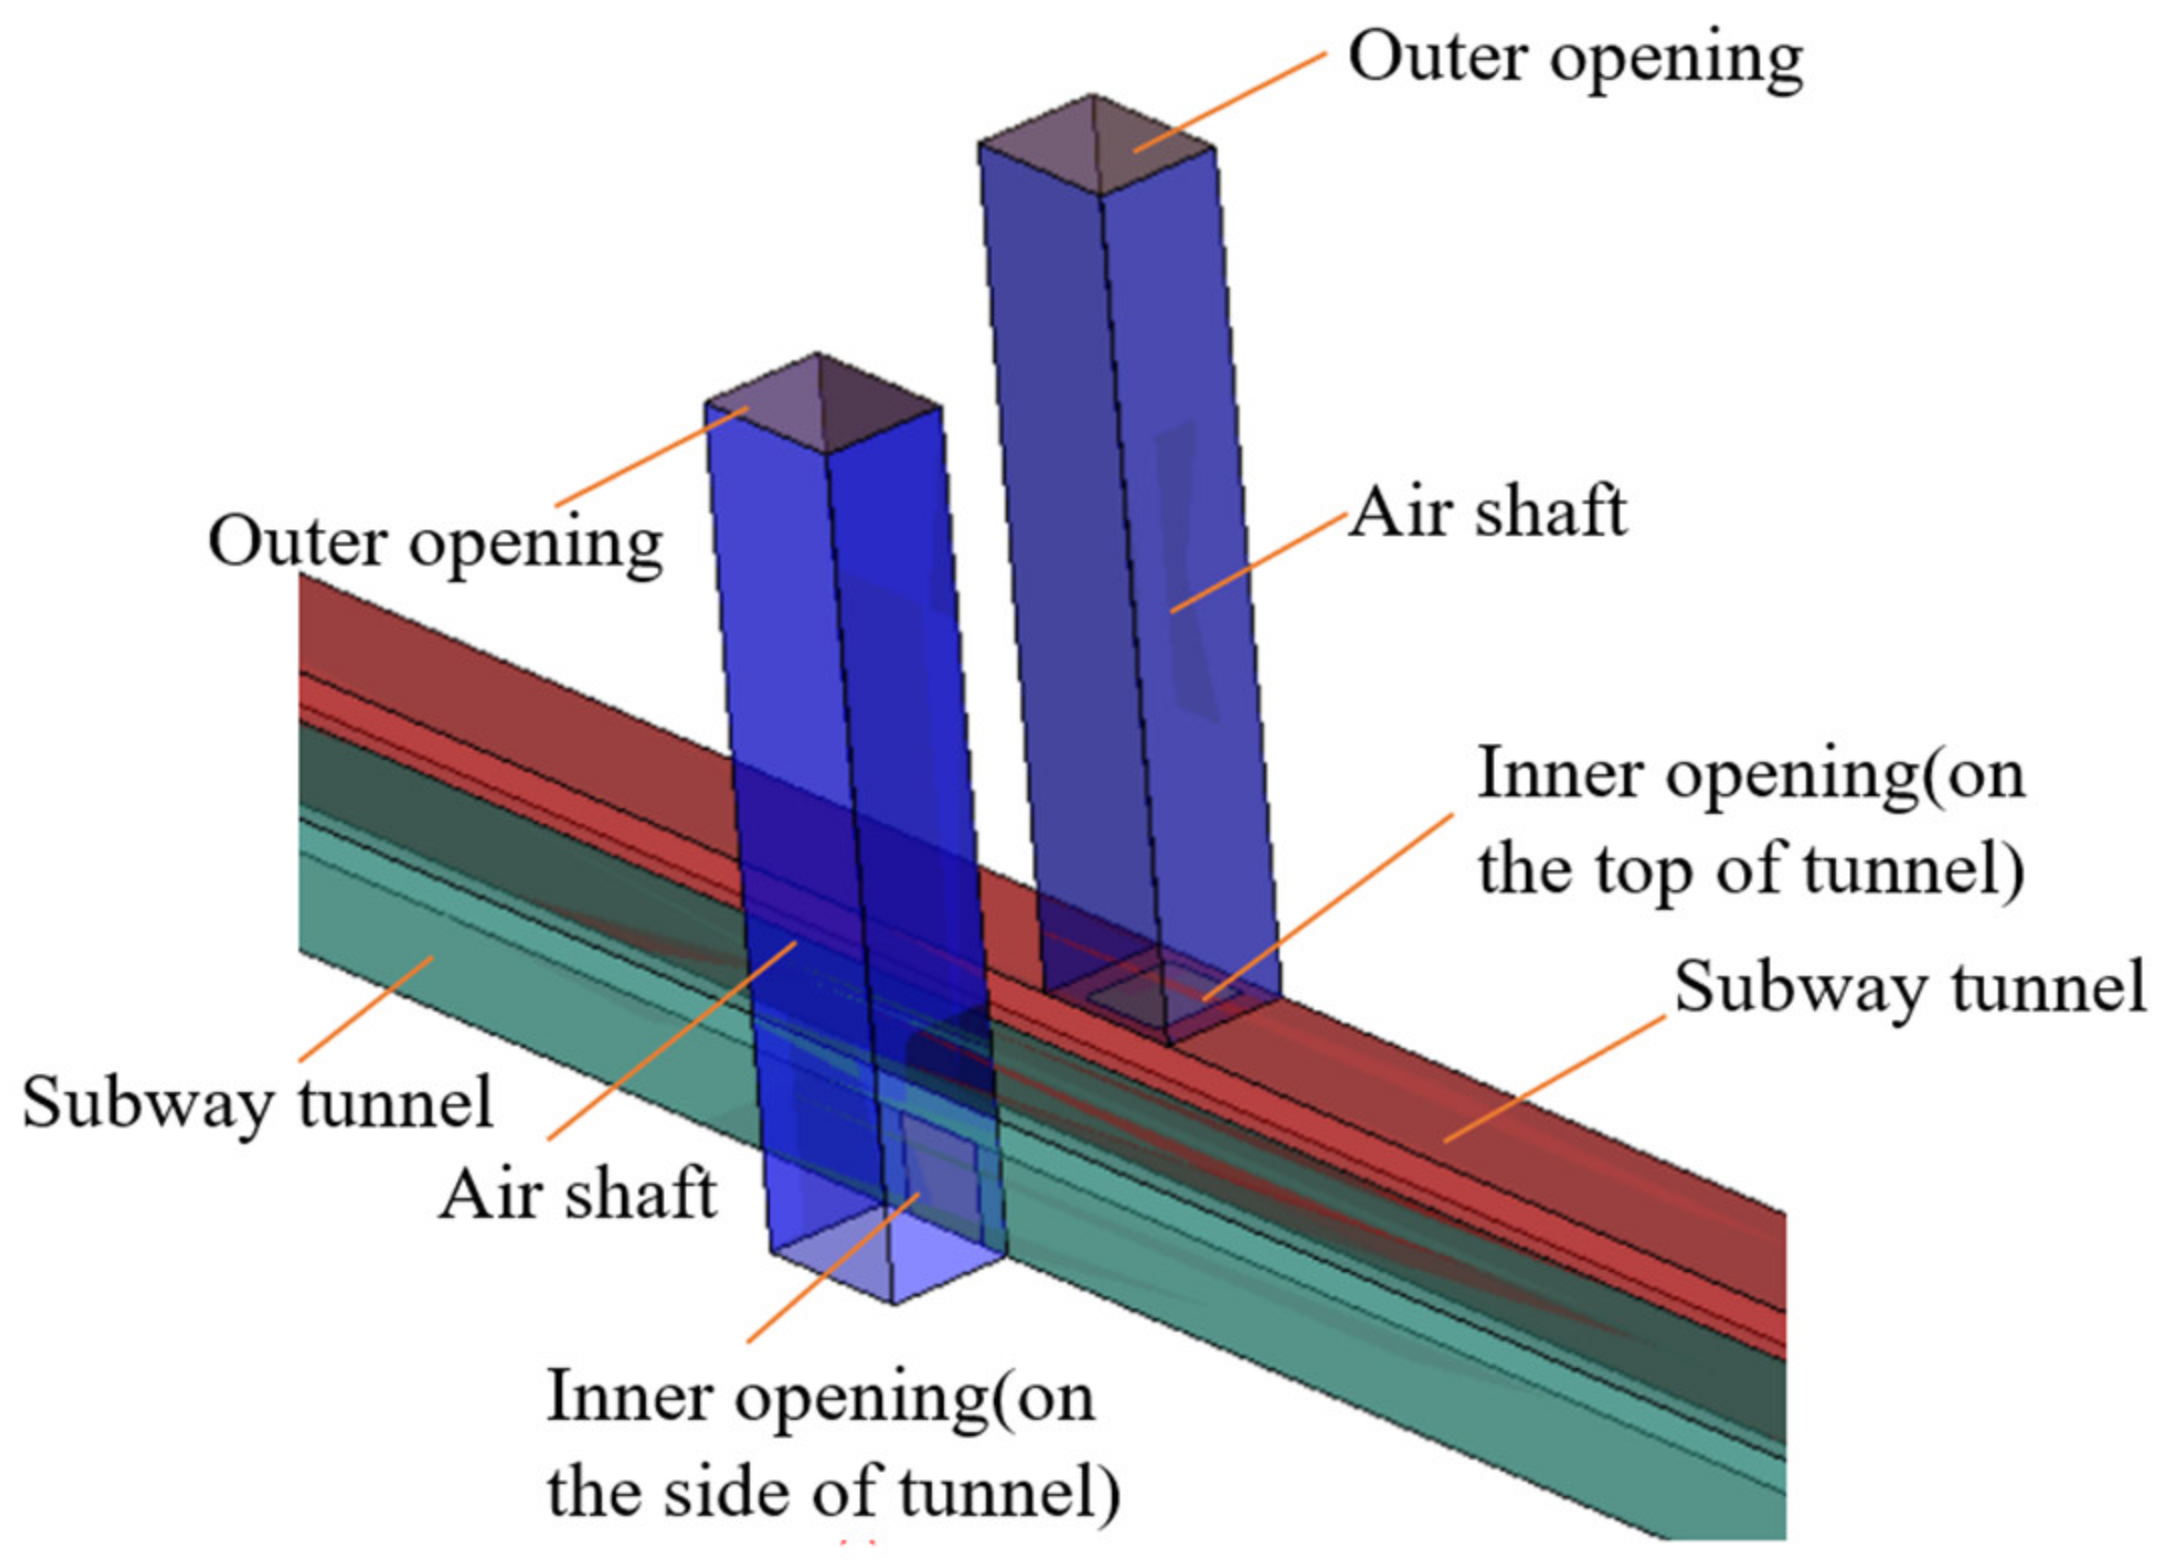
2.1. Research Object

This study was conducted on two subway lines: Line 1 and Line 2. The subway train running interval in Line 1 is 2~3 min, while in Line 2 it is 5~6 min. The measurement of this study included two parts: the particulate matter measurement and the piston wind speed measurement. The PM concentration was tested in two stations with PSDs. Station 1 was located at Line 1 and Station 2 was located at Line 2. The PM concentration on the platform and in the air shaft and the tunnel were measured in the two stations. The piston wind speed was tested in four air shafts. They were the station air shaft ① on the train-arriving side and the station air shaft ② on the train-leaving side on the upline of Line 1 (Figure 1) as well as the middle air shaft ③ on the downline and the middle air shaft ④ on the upline in Line 2 (Figure 2). The subway train running on Line 1 and Line 2 was a B-type, which was composed of six cars with a total length of 120 m. The distance between Station 2 and Station 3 of Line 2 was 2.6 km.
The test sites were on the air damper at the inner opening of the connection of the subway tunnel and the air shafts (Figure 3). The inner opening of air shafts ①, ②, and ③ were set on the top of the tunnel, while the inner opening of air shaft ④ was set on the side of the tunnel. The information of each air shaft is shown in Table 1.

2.2. Equipment and Method

The DustTrak DRX dust meter (Model 8534) from TSI Corporation of the United States was used to measure the PM concentration. It can read the concentration of PM1, PM2.5, and PM10 at the same time with the data recording function. The test range is 0.001~150 mg/m3, and the test accuracy is ±0.001 mg/m3. The equipment was calibrated before every test. The Testo480 anemometer from Detu Corporation of Germany was used to measure the piston wind speed. The test range is 0~20 m/s, and the test accuracy is ±0.01 m/s. The recording intervals of the two devices were both set to 1 s.
To reduce the piston wind speed test error, each air damper was uniformly divided into four parts, and the center of each part was arranged with one wind speed measuring point (Figure 4.). The wind speed was obtained by taking the average value of the four measuring points. The test was carried out during the subway operation period. Each test ensured that at least five trains passed through the air shaft.

3. Result and Discussion

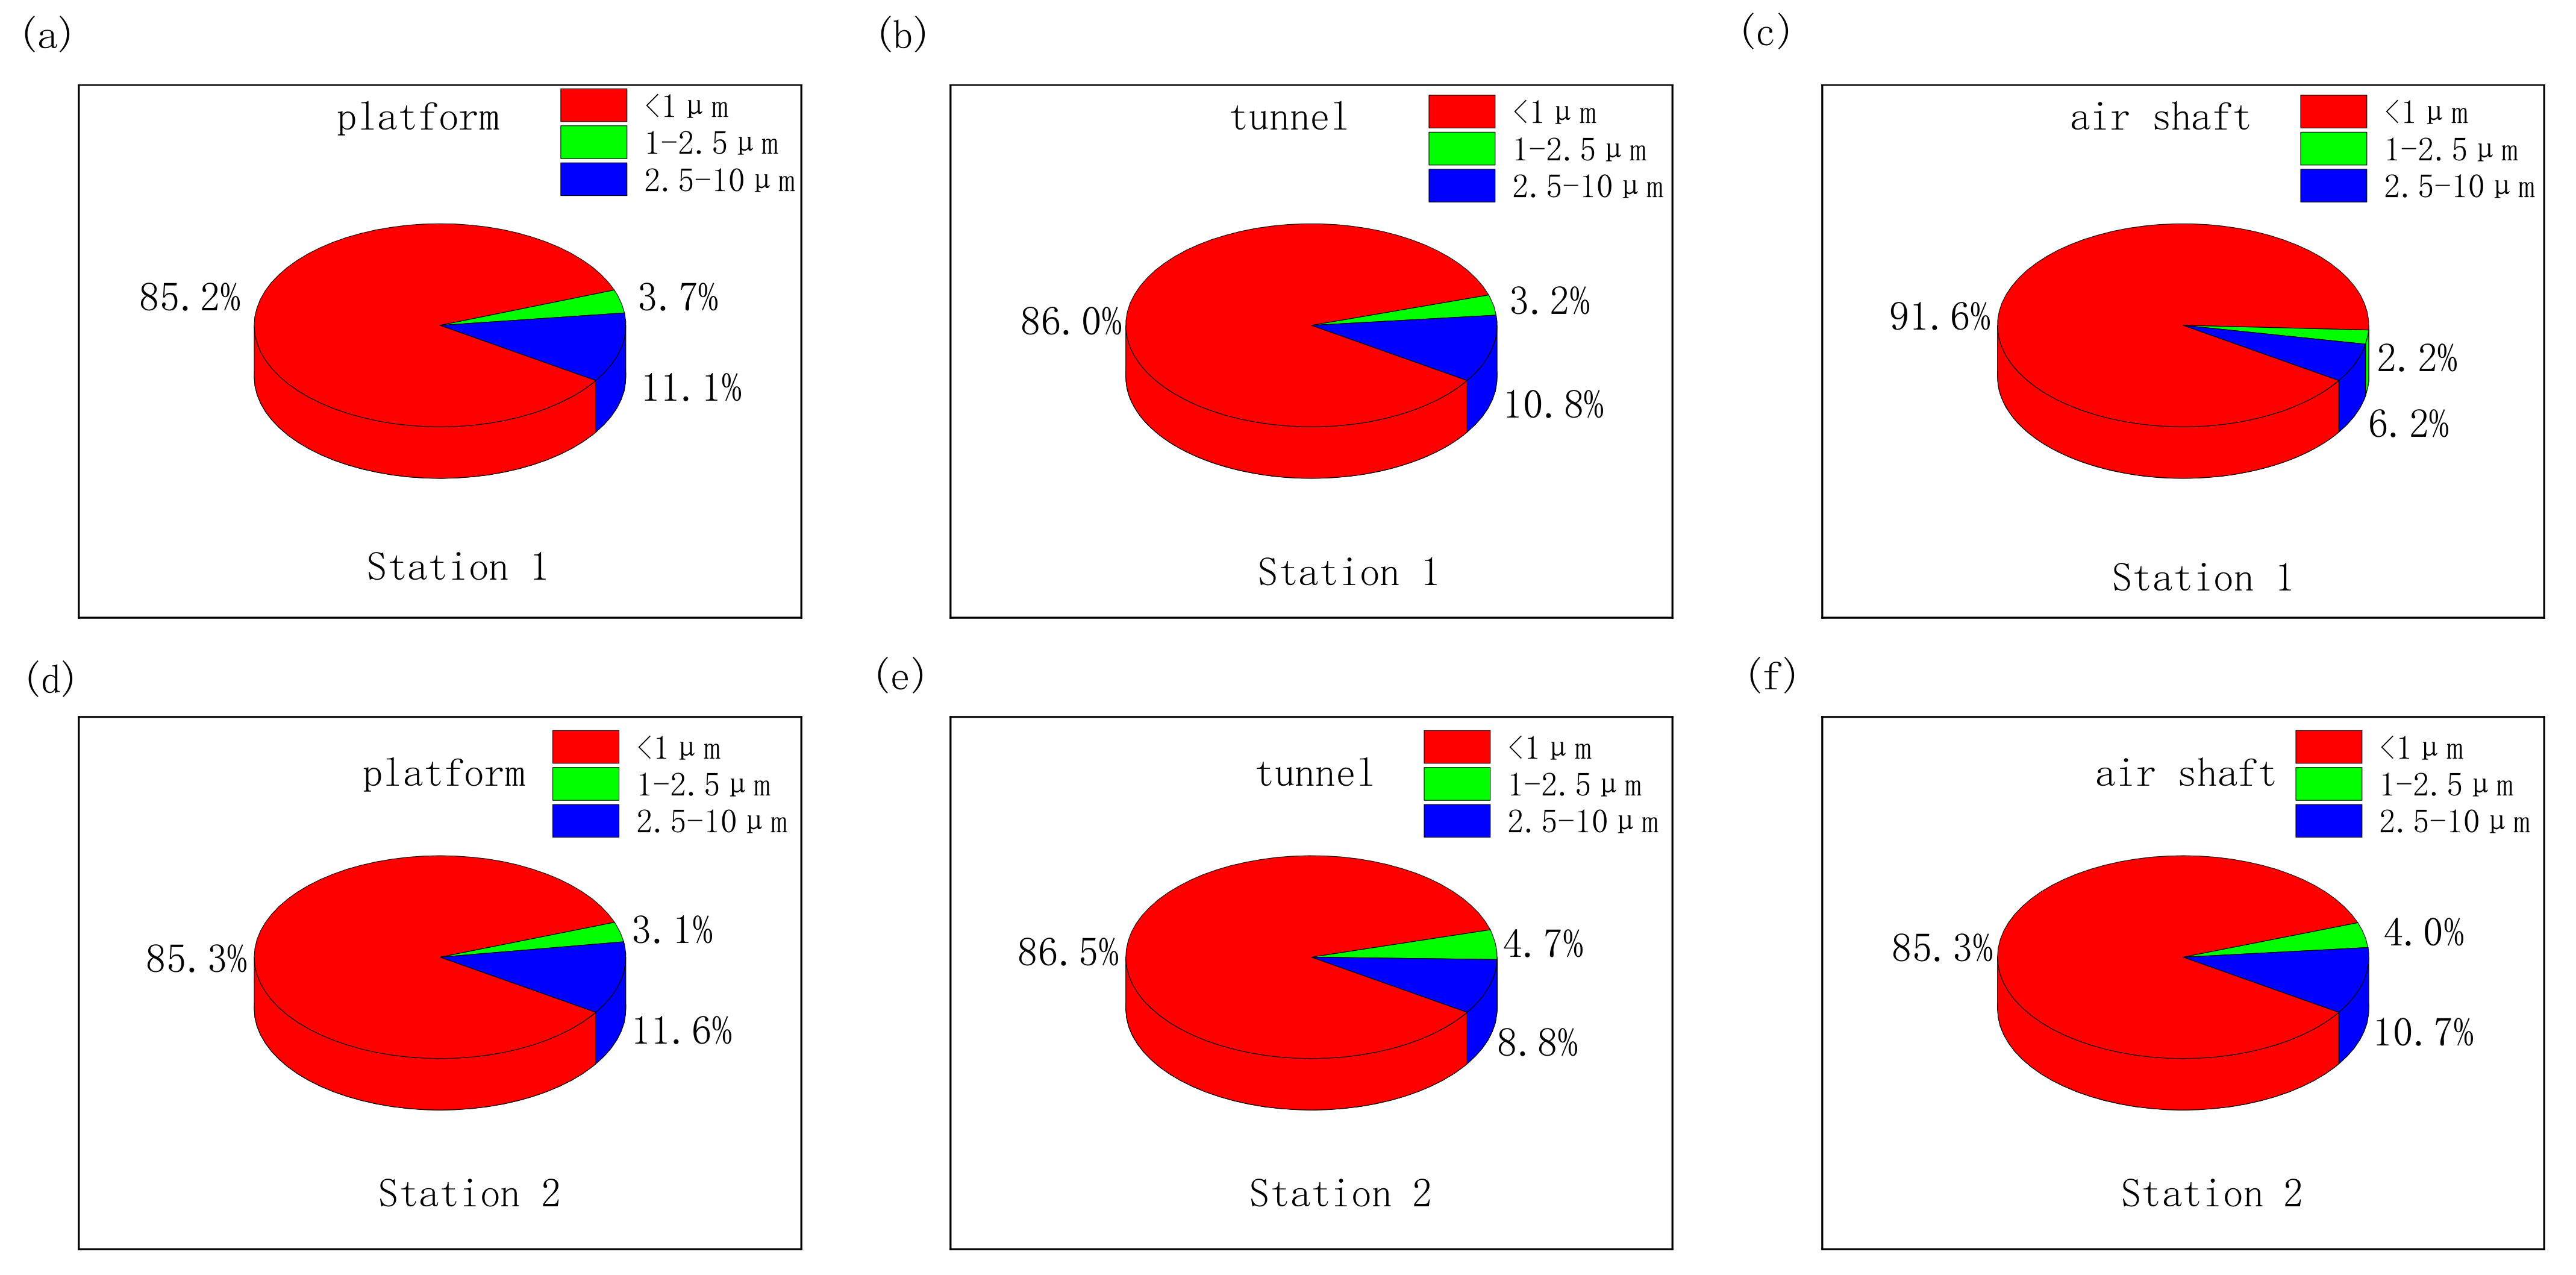
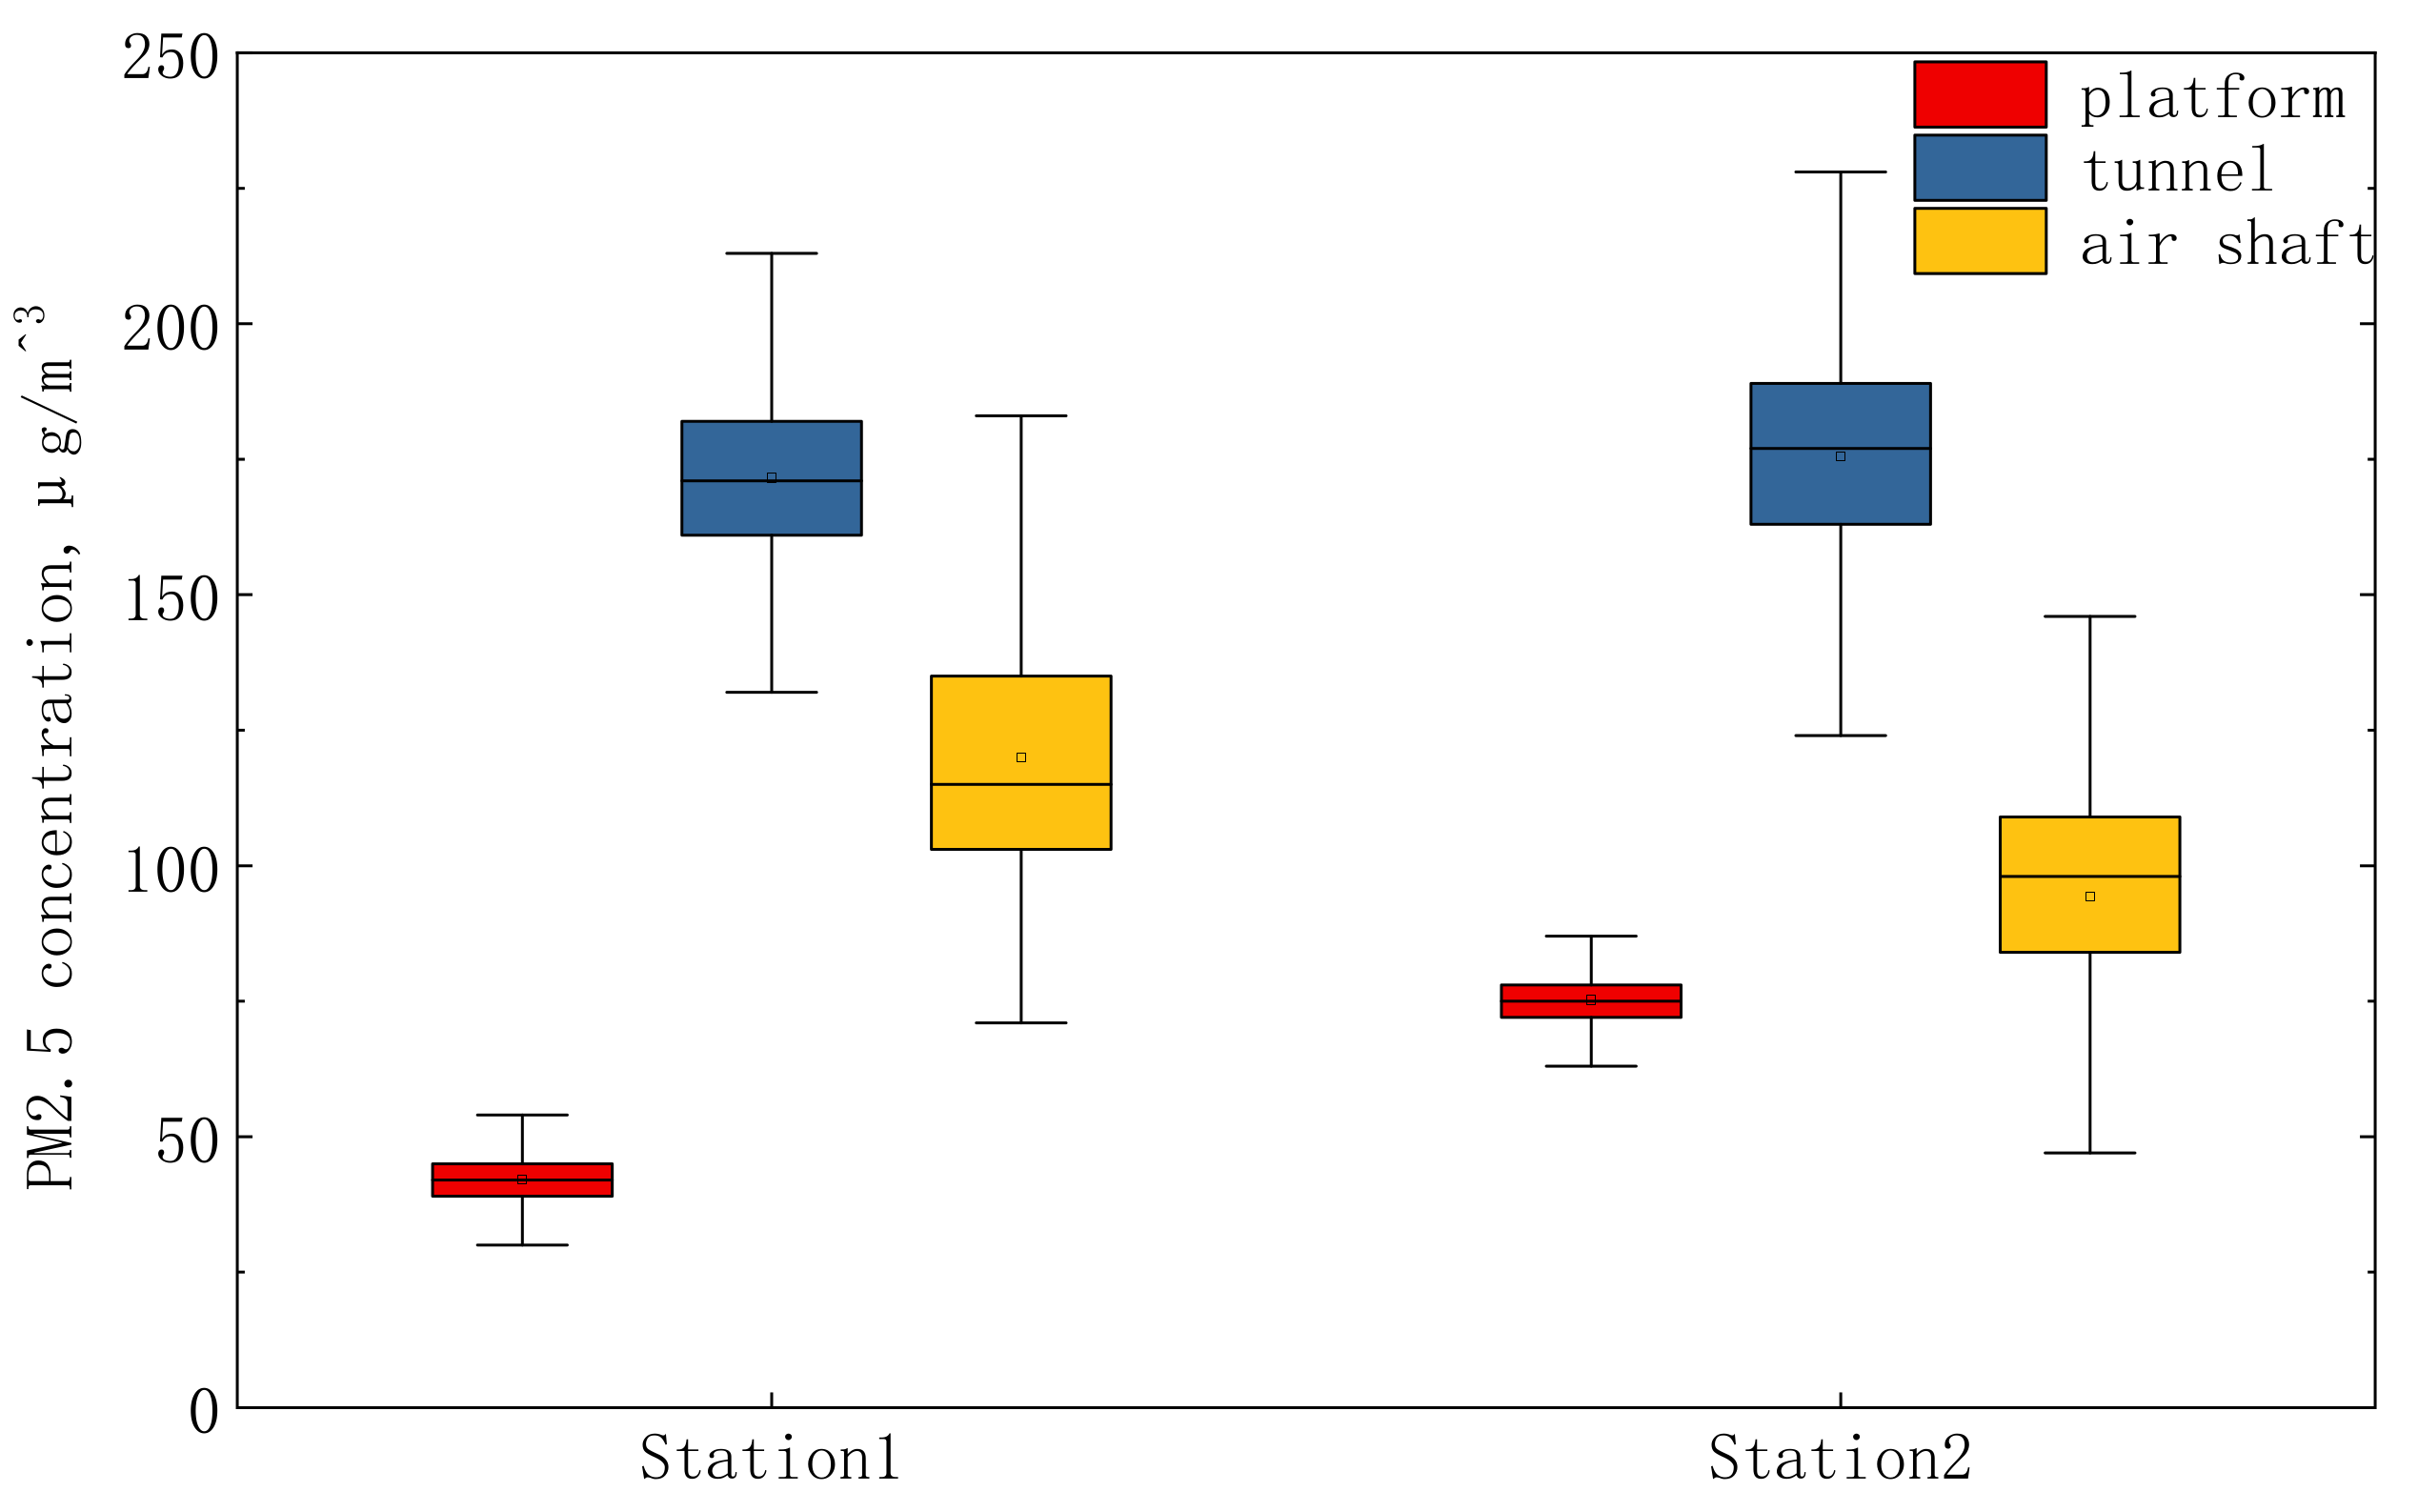
3.1. Particulate Matter Size and Concentration

The PM measurements obtained from the dust meter form the basis of the results discussed in this study. According to the PM1, PM2.5, and PM10 concentrations obtained from the dust meter, the particle size composition of PM10 at different locations can be calculated, which is shown in Figure 5. It is obvious that the particle size composition at different positions has little difference, and PM1 makes up more than 85% of the inhalable particulate matter in the subway environment. Especially in the air shaft at Station 1, the value of PM1/PM10 even reached to 91%. This phenomenon is mainly due to the repeated collisions and friction on the particles by the train moving. The smaller the particle size is, the more harmful it is to human body. It is a reminder that the air conditioner filter material in subway trains should be able to block PM1, as the fresh air of the subway train cabins is introduced from the tunnel through air-conditioning system.
Now that the particulate matter sizes are similar at different positions, the following content will take PM2.5 as the main object of discussion. Figure 6 shows the PM2.5 concentration testing result at different locations. The mean masses of PM2.5 concentrations on the platform and in the tunnel and the air shaft were 42.0 μ g / m 3 , 171.6 μ g / m 3 , and 120.0 μ g / m 3 , respectively, in Station 1 and 75.2 μ g / m 3 , 175.6 μ g / m 3 , and 94.3 μ g / m 3 , respectively, in Station 2. Obviously, the particulate matter level in the tunnel is much higher than on the platform, which is consistent with the findings of others [14]. The particle concentration in the air shaft was lower than in the tunnel. It can be explained that the air shaft takes the role of tunnel ventilation through piston wind, so it can discharge part of the particles out of the tunnel.
The PM2.5 concentration in the tunnel has little difference between Station 1 and Station 2, but on the platform and in the air shaft there is a clear difference. The PM2.5 concentration on the platform of Station 1 was lower than that of Station 2, while the result in the air shaft is the opposite. During the test, we found that the passenger flow was close between the two stations. However, Station 1 is equipped with air purifiers while Station 2 is not. Therefore, it can be inferred that the air purifiers reduce the PM2.5 concentration on the platform. Station 1 is located near a crossing with a heavy traffic flow, while Station 2 is located next to an isolated road with light traffic flow. It is known that vehicles emit large amounts of particulate matter. Therefore, the ambient air quality of Station 2 is better than that of Station 1. Since the air shaft will intake the outside air into the tunnel, this can explain why the PM2.5 concentration in air shaft of Station 1 is higher than that of Station 2.

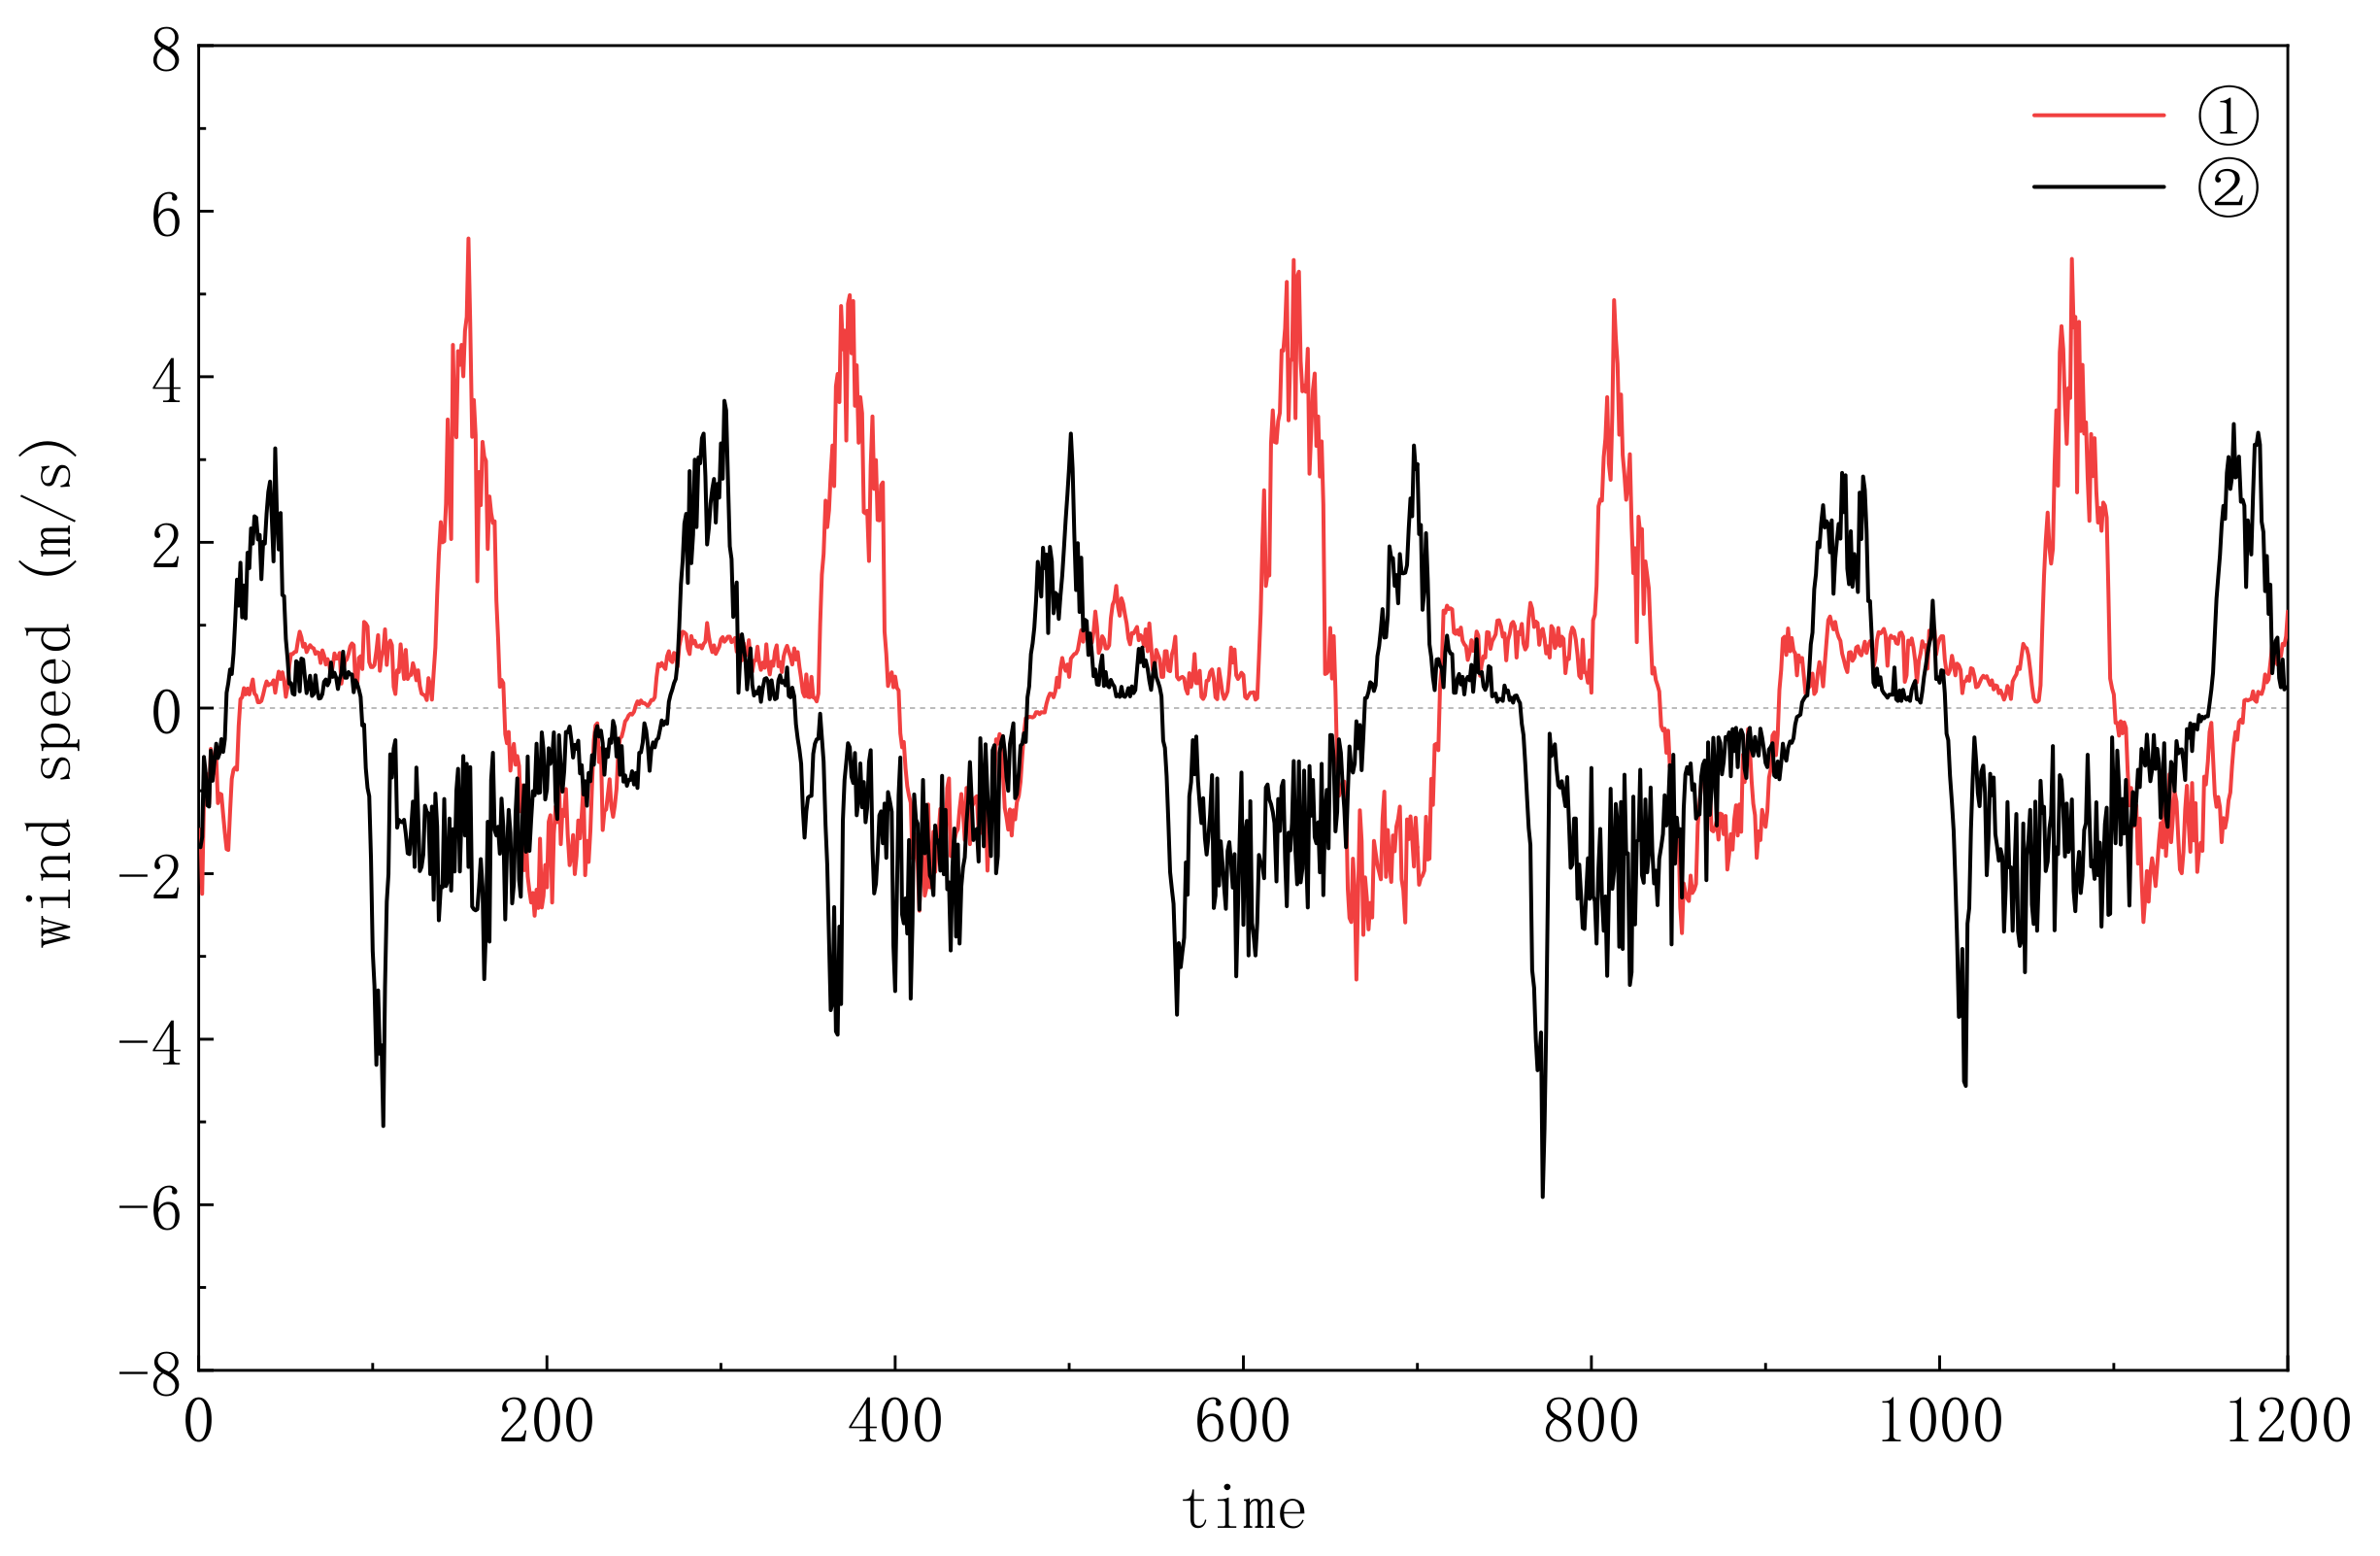
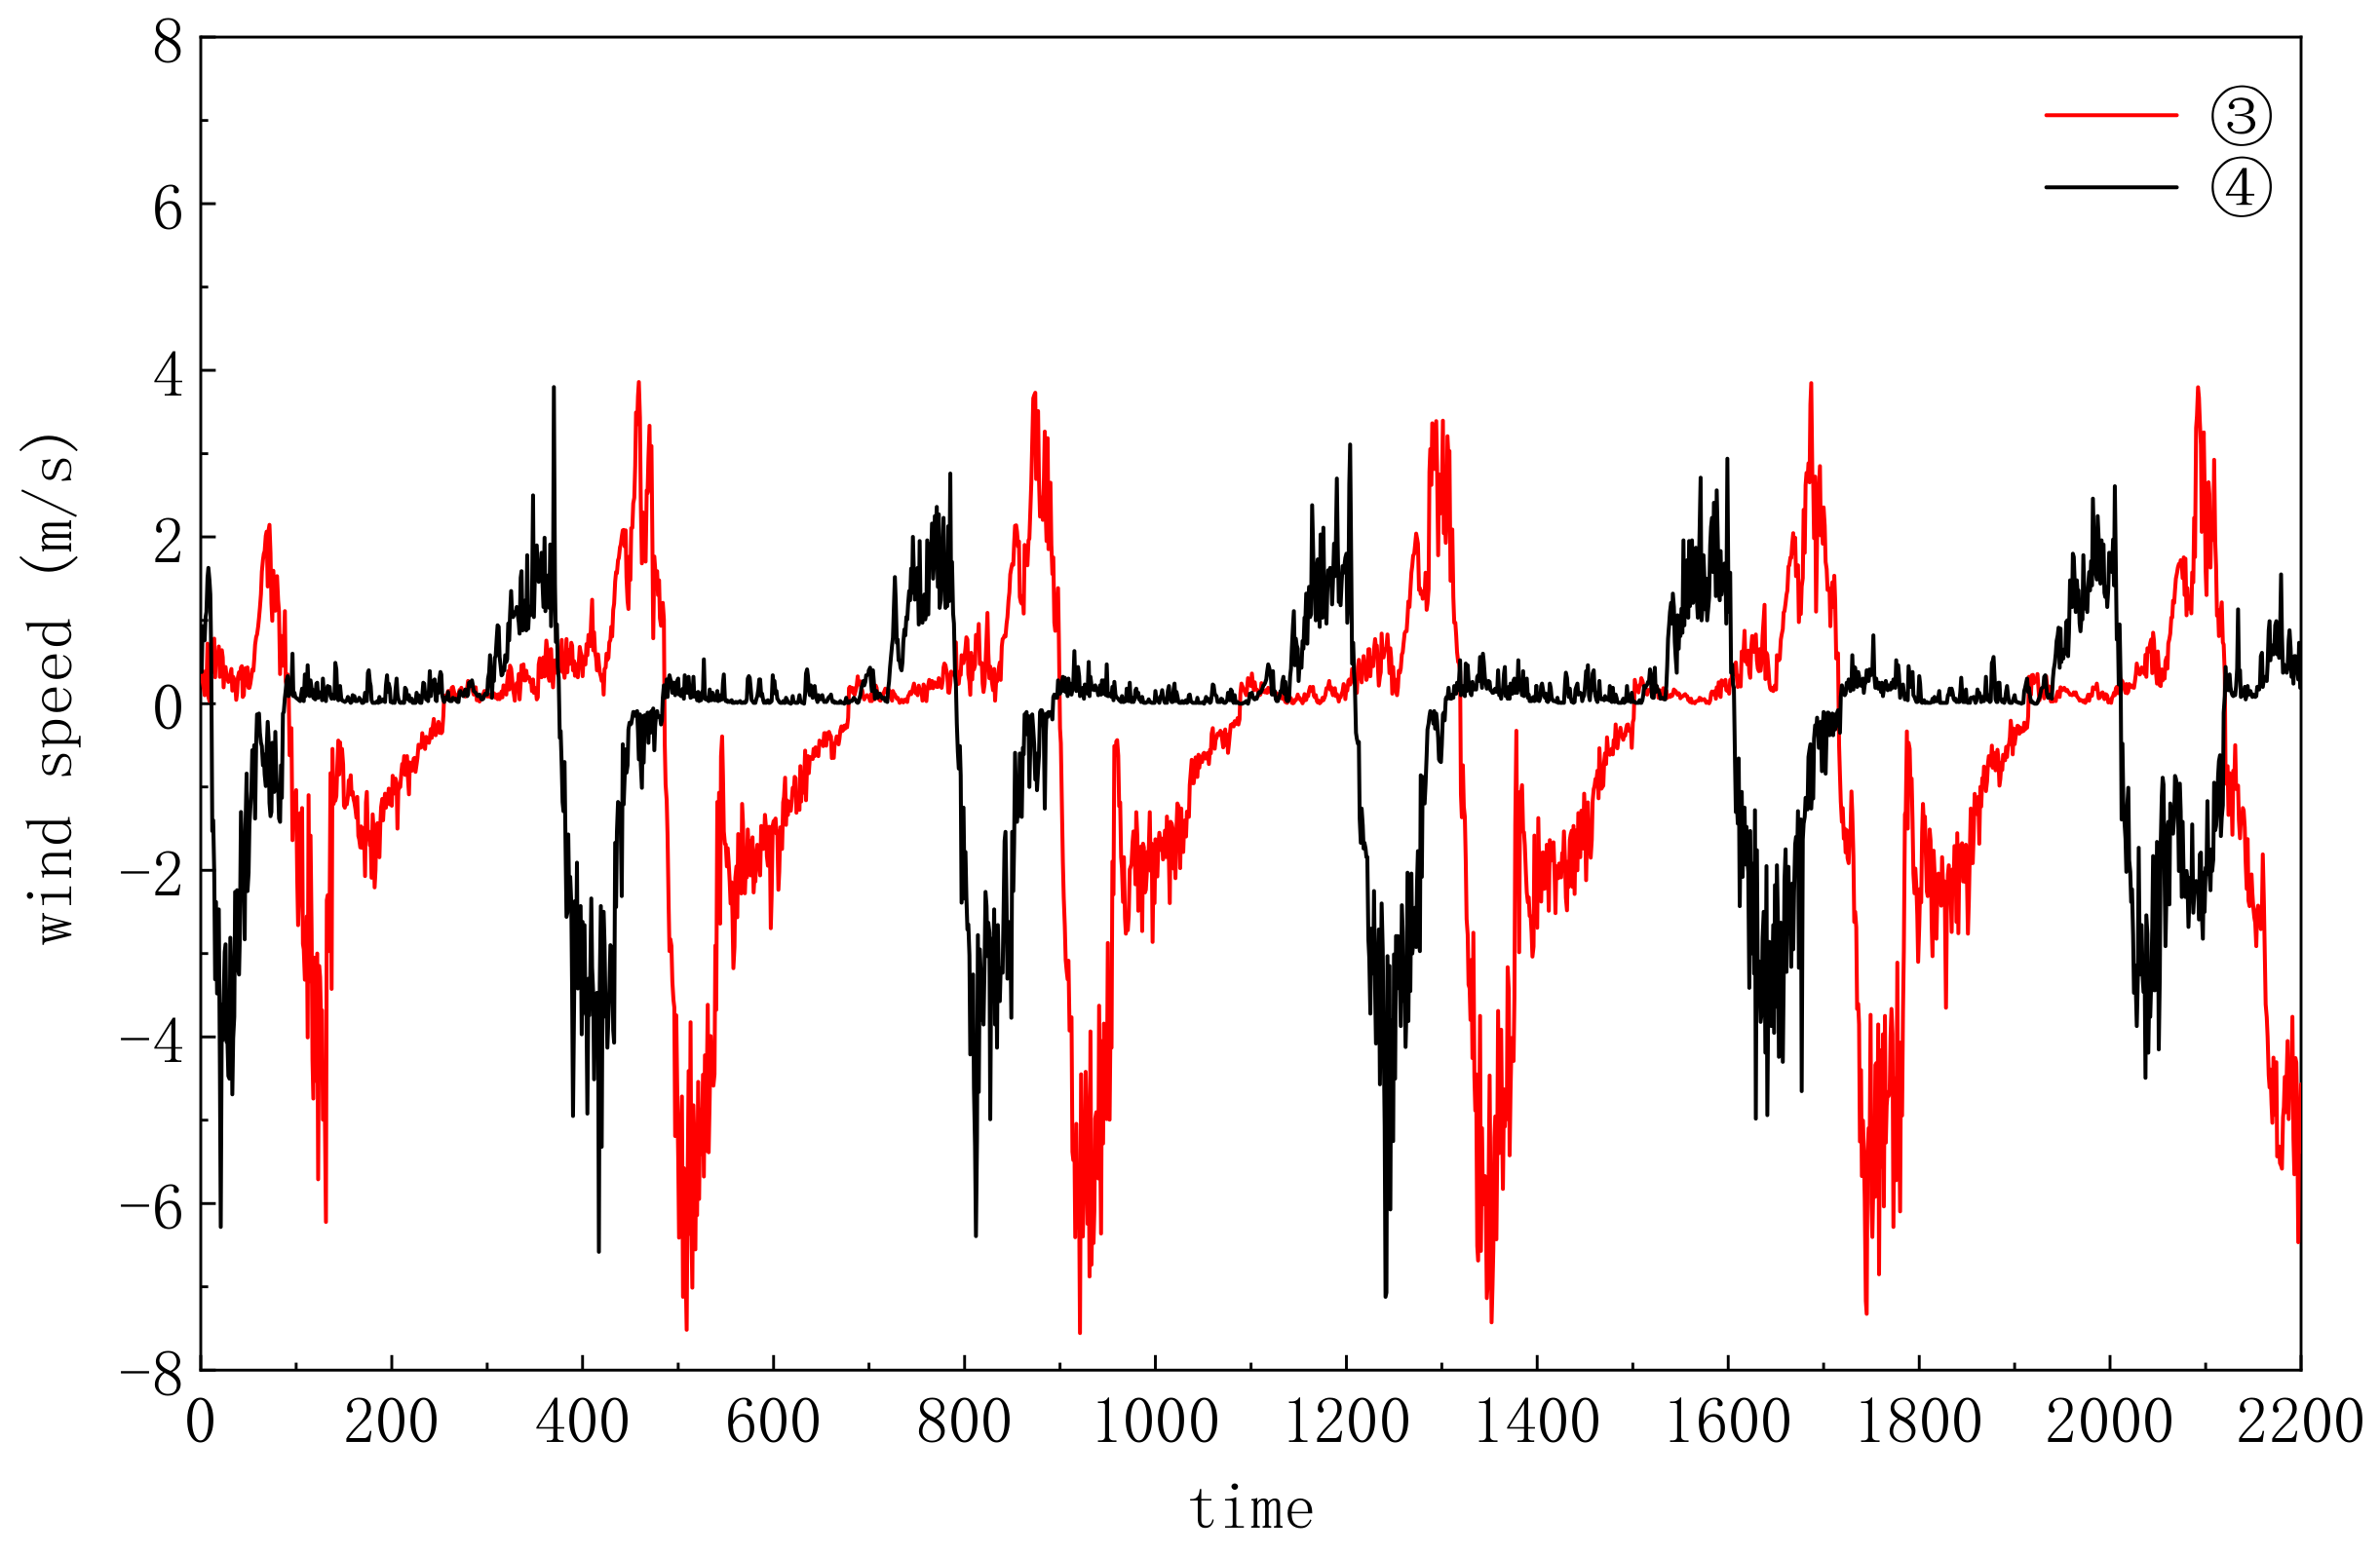
3.2. Piston wind Speed

The inflow-air direction was defined as negative, which means that the air shaft is sucking fresh air from outside. Whereas the outflow-air direction was defined as positive, which means that the air shaft is exhausting dirty air from the tunnel. The wind speed variations at the inner opening of each air shaft during the five trains passing by are shown in Figure 7 and Figure 8.
It can be seen from the figures that the wind direction at the air damper changes when the train passes by the air shaft. Before the train passes, the air shaft exhausts air, and after the train passes, the air shaft sucks air, which is consistent with the research of Huang [22]. This is because when the train is running in the tunnel, the front of the train is a positive pressure zone, and the rear of the train is a negative pressure zone.
The maximum wind speed in air shaft ① appears in the air exhaust process, while in air shafts ②, ③, and ④, the maximum wind speed appears in the air suction process. For station air shafts ① and ②, it is because the train decelerates to enter the platform and accelerates to leave the platform. For middle air shafts ③ and ④, it can be explained that the pressure at the rear of the train is greater than the pressure at the front of the train in the subway tunnel when the train is traveling at a constant speed.
The maximum wind speed of the middle air shafts is 6~8 m/s, larger than that of the station air shafts, of which the value is 5~6 m/s. According to previous studies, piston wind speed is related to train speed. During the test, it was found that it takes 20 s for the train in Line 1 to pass through the station. Therefore, it can be calculated that the speed of the train accelerates from 0 to 43.2 km/h when it leaves the station in Line 1. As for Line 2, it takes 175 s for the train run from Station 1 to Station 2. According to the acceleration of 0.6 m/s2, it can be calculated that the maximum running speed is 64.8 km/h for the train between Station 1 and Station 2, which is equal to the speed of the train passing by the middle air shaft and is obviously larger than the station air shafts.

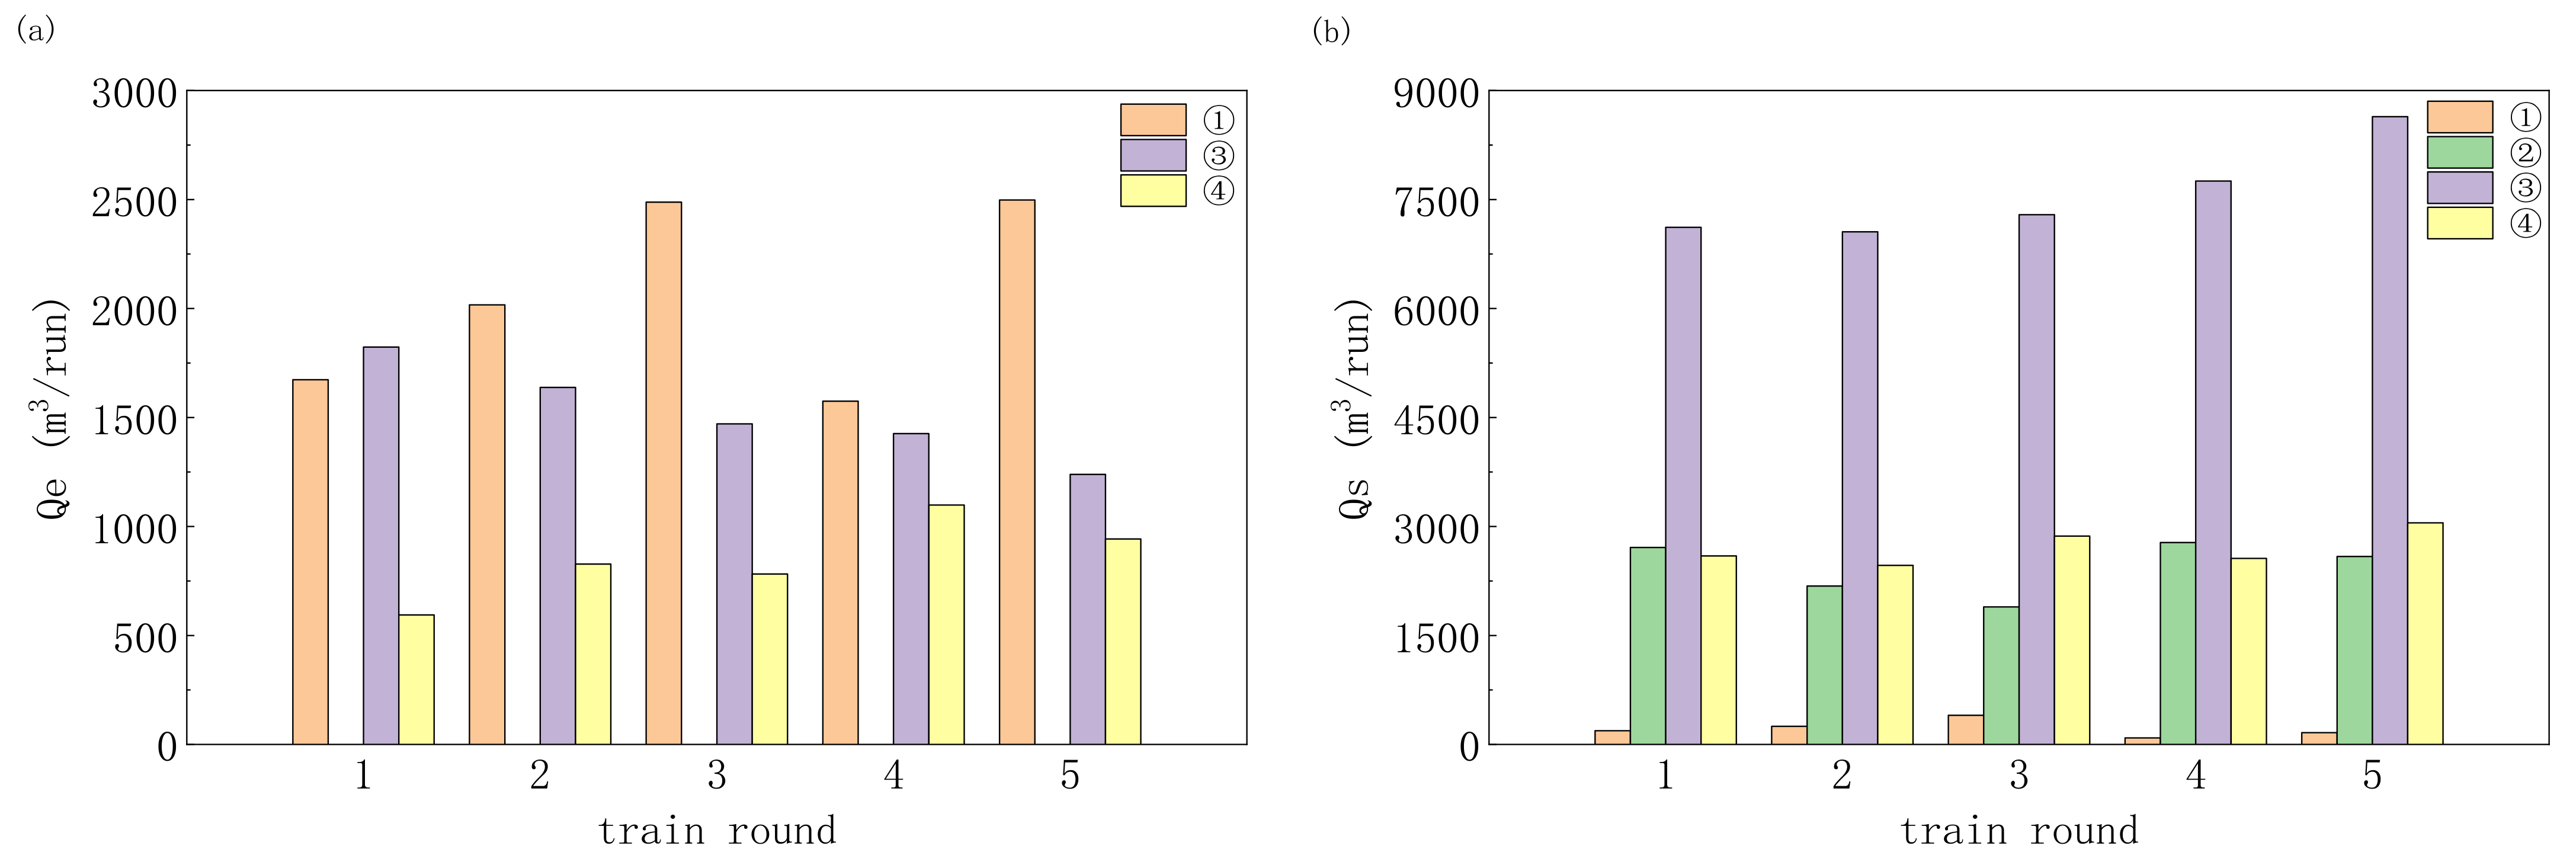
3.3. Effective Ventilation Volume of Air Shafts

The piston wind speed cannot reflect the ventilation performance of different air shafts, but another indicator can be obtained from the wind speed. The effective exhaust air volume, Q e , and the effective suction air volume, Q s , of the air shaft can be defined as follows when each train passes:
Q e = G o u t V s h a f t
Q s = G i n V s h a f t
where Q e / Q s are the effective exhaust/suction air volume (m3/run); G o u t / G i n are the air volume passing through the air damper (m3/run); and V s h a f t is ths total air shaft volume (m3).
Q e reflects the capacity for the air shaft to discharge the dirty air in the tunnel to the outside environment when the train is approaching. Q s reflects the capacity for the air shaft to suck fresh air from outside environment to the tunnel when the train is moving away.
When G o u t < V s h a f t , Q e = 0 , which represents that the air shaft cannot effectively exhaust air; when G i n < V s h a f t , Q s = 0 , which represents that the air shaft cannot effectively suck air in.
G o u t and G i n can be calculated according to Equation (3):
G = 0 T v i A d t i
where v i is the wind speed (m/s); A is the ventilation area of the air damper (m2); t i is the sampling interval time (s); and T is the time that the piston wind acts on the damper (s).
The indices Q e and Q s take the air shaft volume into consideration and can reflect the actual ventilation performance of the air shafts.
Based on the measured wind speed data, the effective exhaust/suction air volume of each air shaft during the five subway trains passing by was calculated and is shown in Figure 9. The horizontal axis of the graph refers to the train round, and the vertical axis refers to the effective exhaust/suction air volume. The effective ventilation volume of the air shaft changed relatively smoothly during the test period. The effective exhaust air volume for station air shaft ① ranged from 1575 to 2498 m3/run, and for station air shaft ② it was 0, while middle air shaft ③ ranged from 1239 to 1823 m3/run, and middle air shaft ④ ranged from 594 to 1098 m3/run. The effective suction air volume for station air shaft ① ranged from 89 to 401 m3/run, and station air shaft ② ranged from 1893 to 2779 m3/run, while middle air shaft ③ ranged from 7056 to 8641 m3/run, and middle air shaft ④ ranged from 2465 to 3050 m3/run.
The average values of the effective ventilation volumes from five trains are shown in Figure 10. The order of magnitude of the ventilation volumes is consistent with the study of Lee et al. [19]. They tested six air shafts between two subway stations, and the ventilation flow rate of each shaft during the train service ranged from 197.67 to 1292.24 m3/run.
As can be seen from Figure 11, the station air shaft on the train-arriving side mainly discharged the dirty air in the tunnel and could inhale a small amount of fresh air from the outside, while the station air shaft on the train-leaving side could inhale a large amount of fresh air but could hardly effectively exhaust the air. This is because when the train was approaching the station, most air flowed to the outside through the air shaft on the train-arriving side, and the pressure in front of the air shaft dropped, so less air flowed to the air shaft on the train-leaving side. After the train passed by the air shaft on the train-arriving side, it stopped at the station and the piston wind quickly decayed. There was no driven force for the air shaft on the train-arriving side to inhale fresh air before the train started to run. When the train stared to run, the train speed was not high, so the air shaft on the train-arriving side could only inhale a little fresh air from outside. However, when the train passed through the air shaft on the train-leaving side, the train speed reached 43.2 km/h. Thus, the driven force was enough for the air shaft to suck a large amount of fresh air.
The middle air shaft could not only effectively discharge the dirty air in the tunnel but it could also inhale a large amount of fresh air from the outside, and the suction capacity was obviously stronger than the exhaust capacity. This was due to the longer duration of outside wind flowing into the tunnel. In addition, the effective ventilation volume of the middle air shaft was significantly larger than that of the station air shaft, which was due to the greater speed of the trains passing through the middle air shaft, generating greater piston wind.
Comparing the middle air shafts ③ and ④, it can be seen that the effective ventilation volume of the air shaft with the inner opening set at the top of the tunnel was significantly greater than that of the shaft set at the side of the tunnel. The air shaft volume and train passing speed of ③ and ④ were the same. One possibility is that the airflow resistance of the two air shafts is different. An air shaft has less airflow resistance with the inner opening set at the top of tunnel. It indicates that when designing a new tunnel, it is better to set the inner opening of the air shaft at the top of the tunnel to obtain a better ventilation performance.
From the measurement data, it is obvious that the air shaft volume and effective ventilation volume are an order of magnitude. Therefore, the air shaft volume will greatly affect the actual ventilation performance. According to a previous study [10], if the buried depth of a subway tunnel is constant, an appropriate increase in the cross-sectional area of an air shaft will improve the air volume passing through the air damper. However, the air shaft volume will also increase, and more air will be trapped in the air shaft. The effective ventilation volume may not increase. Therefore, it is necessary to use effective ventilation volume to evaluate the ventilation performance.

3.4. PM2.5 Discharge Efficiency of Air Shafts

According to the above research, both the station air shaft and the middle air shaft can effectively exhaust air. In order to further study the exhaust efficiency of particulate matter in the air exhaust process of the air shaft, the PM2.5 concentration and wind speed at the inner opening and outer opening in piston air shafts ① and ④ were measured synchronously. The PM2.5 testing results are shown in Figure 11.
The PM2.5 concentrations at the inner opening and outer opening of air shaft ① varied from 30 μ g / m 3 to 120 μ g / m 3 and from 20 μ g / m 3 to 140 μ g / m 3 , respectively, and the PM2.5 concentrations at the inner opening and outer opening of air shaft ④ varied from 130 μ g / m 3 to 200 μ g / m 3 and from 80 μ g / m 3 to 150 μ g / m 3 , respectively. The PM2.5 concentration at the inner opening and outer opening both had increasing and decreasing progresses. The gradual increase in the PM2.5 concentration at the inner opening was mainly due to the resuspension of particles deposited on the ground under the action of piston wind before the train passed by, while the sharp decrease was mainly caused by the outside fresh air inhaled into the air shaft after the train passed by. The gradual increase in the PM2.5 concentration at the outer opening was caused by the exhaust air from the tunnel, while the sharp decrease was due to the air shaft suddenly changing from exhausting air to inhaling air, and the PM2.5 concentration in the outside ambient environment was much lower than in the tunnel. Based on the above analysis, it can be inferred that the air shaft can discharge some of the particles in the tunnel.
In order to further study the process of exhausting particles from the air shafts, the collected data were smoothed using an FFT filter, and the cut-off frequency was set to 0.005 to obtain the results shown in Figure 12. It can be seen in Figure 12 that the PM2.5 concentration at the inner and outer openings of the piston air shaft showed a roughly periodic trend, and the period was consistent with the train running interval. The PM2.5 concentration change phase at the inner opening lagged behind the outer opening. According to the calculation, the mean value of Δt in Figure 12a is 117.6 s, while in Figure 12b it is 80.4 s, which can be approximately regarded as the time it takes for the particles to move from the inner opening to the outer opening. The total length of both air ducts was 60 m. Thus, it can be inferred that the particles traveled at about 0.51 m/s in air shaft ① and at about 0.75 m/s in air shaft ④during the exhausting progress.
It can be seen in Figure 11 and Figure 12 that the difference in PM2.5 concentration between the inner opening and outer opening in air shaft ① is much lower than that of air shaft ④, indicating that the ability to discharge PM2.5 in the tunnel of different air shafts varies greatly. To evaluate this ability, the PM2.5 discharge efficiency, η , of an air shaft when each train passes can be defined as:
η = M i n M o u t / M i n
where M o u t is the mass of PM2.5 through the outer opening of the air shaft during the exhaust progress, μ g / run and M i n is the mass of PM2.5 through the inner opening of the air shaft during the exhaust progress, μ g / run .
M o u t and M i n can be calculated by Equations (5) and (6):
M o u t = 0 T o u t c i _ o u t v i _ o u t A d t i
M i n = 0 T i n c i _ i n v i _ i n A d t i
where c i _ o u t and c i _ o u t are the mass concentration of PM2.5 of each sampling at the outer and inner openings of the air shaft, respectively, during the exhaust progress, μ g / m 3 ; v i _ o u t and v i _ i n are the wind speed of each sampling at the outer and inner openings of air shaft, respectively, during the exhaust progress, m / s ; T o u t and T i n are the duration of the exhaust progress at the outer and inner openings of air shaft, s ; and A is the cross-sectional area of the aim damper, m 2 .
The defined indicator can be calculated based on the measured data in Figure 11 and the analysis in Figure 12, and the calculation result is shown in Figure 13. The PM2.5 discharge efficiency of station air shaft ① was between 52.0% and 62.8%, while the value of middle air shaft ④ was between 26.8% and 40.7%. This means that the air shafts, indeed, can discharge the particulate matter out of the tunnel through the piston wind, to some extent. Although the middle shafts have higher effective ventilation volumes than the station air shafts, they have poorer PM2.5 discharge efficiencies. To evaluate the overall ventilation performance of air shafts, both indicators need to be examined. It is obvious that the PM2.5 discharge efficiency is influenced by the volume of air shafts because more particles will stay in the air shaft if it has larger volume and cannot be discharged out. A previous study found that the depth of an underground subway station will affect the PM concentration in the station. The major reason is that the particles in the tunnel are hard to discharge via the air shafts if the tunnel is too deep underground. It also reveals that there is some potential to improve the particulate matter discharge efficiency of subway tunnels with reasonable air shaft locations and structure designs.

4. Conclusions

In this paper, the particulate pollution levels at different locations in a subway system were investigated. The wind speeds at the inner openings of the subway tunnel air shafts during the subway operation period were obtained through field tests, and the effective ventilation volume was defined to evaluate the ventilation performance of the air shaft. The PM2.5 discharge efficiency was defined to evaluate the ability of the air shafts to discharge the particulate matter from the tunnel. The main findings are summarized as follows:
(1)
PM1 accounted for more than 85% of the inhalable particulate matter in the subway systems, which puts forward a higher requirement for the material of air conditioner filters in subway trains. The value of PM 2.5 mass concentration at different locations is: tunnel > air shaft > platform.
(2)
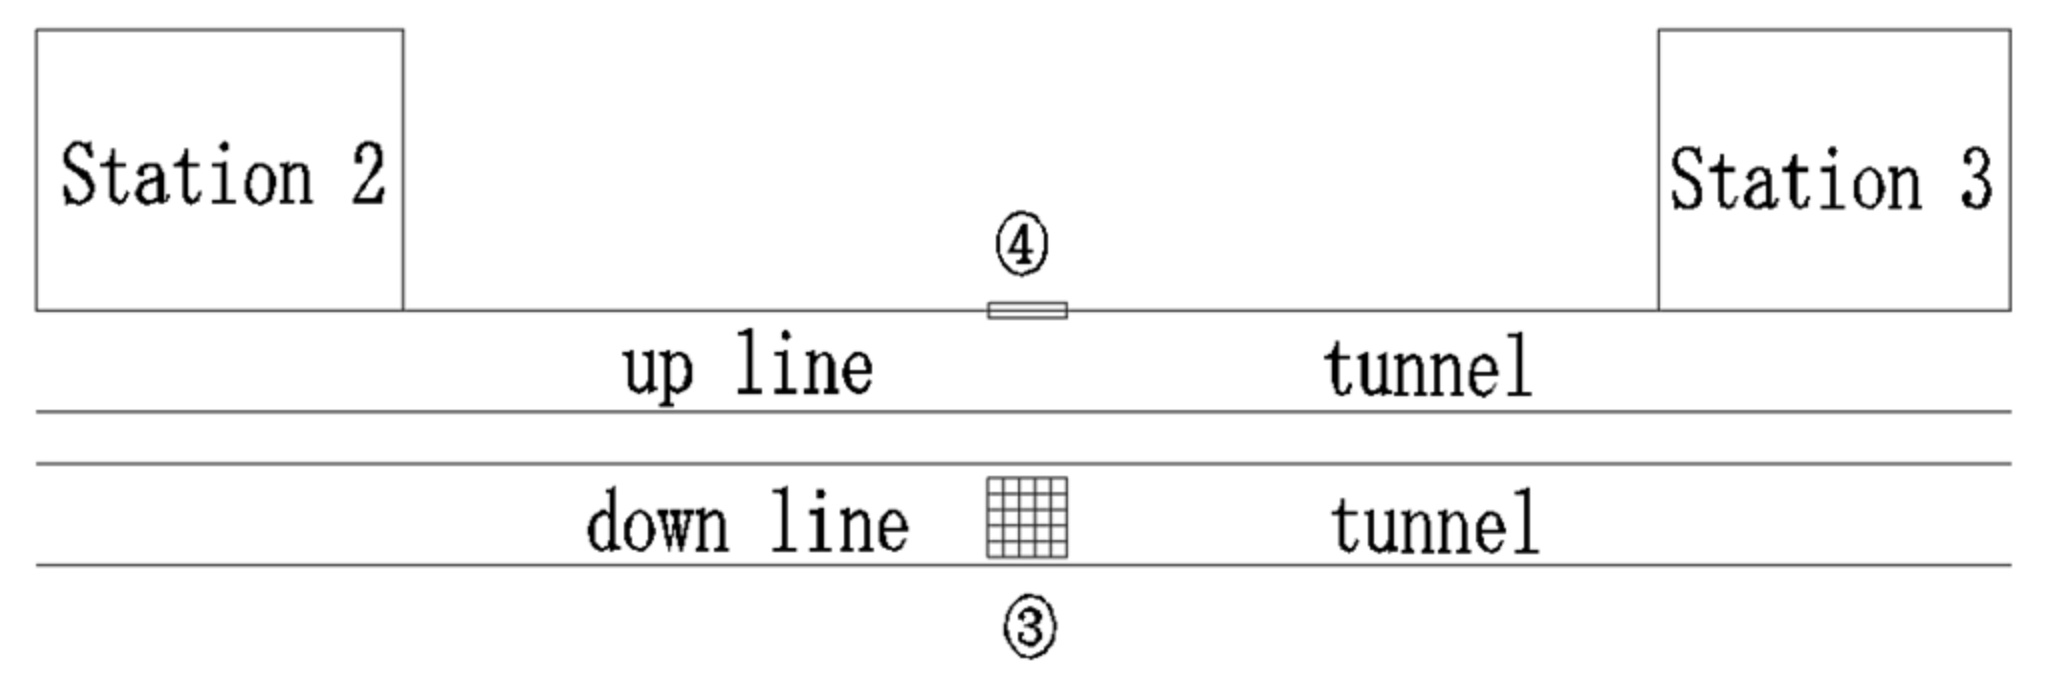
The station air shaft on the train-arriving side can effectively exhaust 2050 m3 of dirty air in the tunnel and inhale 218 m3 of fresh air per train, while the station air shaft on the train-leaving side can effectively inhale 2430 m3 of fresh air from the outside atmosphere per train but can hardly discharge the dirty air in the tunnel. The middle air shaft can not only effectively exhaust dirty air (1519 m3 per train) but can also inhale a large amount of fresh air (7273 m3 per train), and the effective air suction/exhaust volume is significantly larger than the that of the station air shafts.
(3)
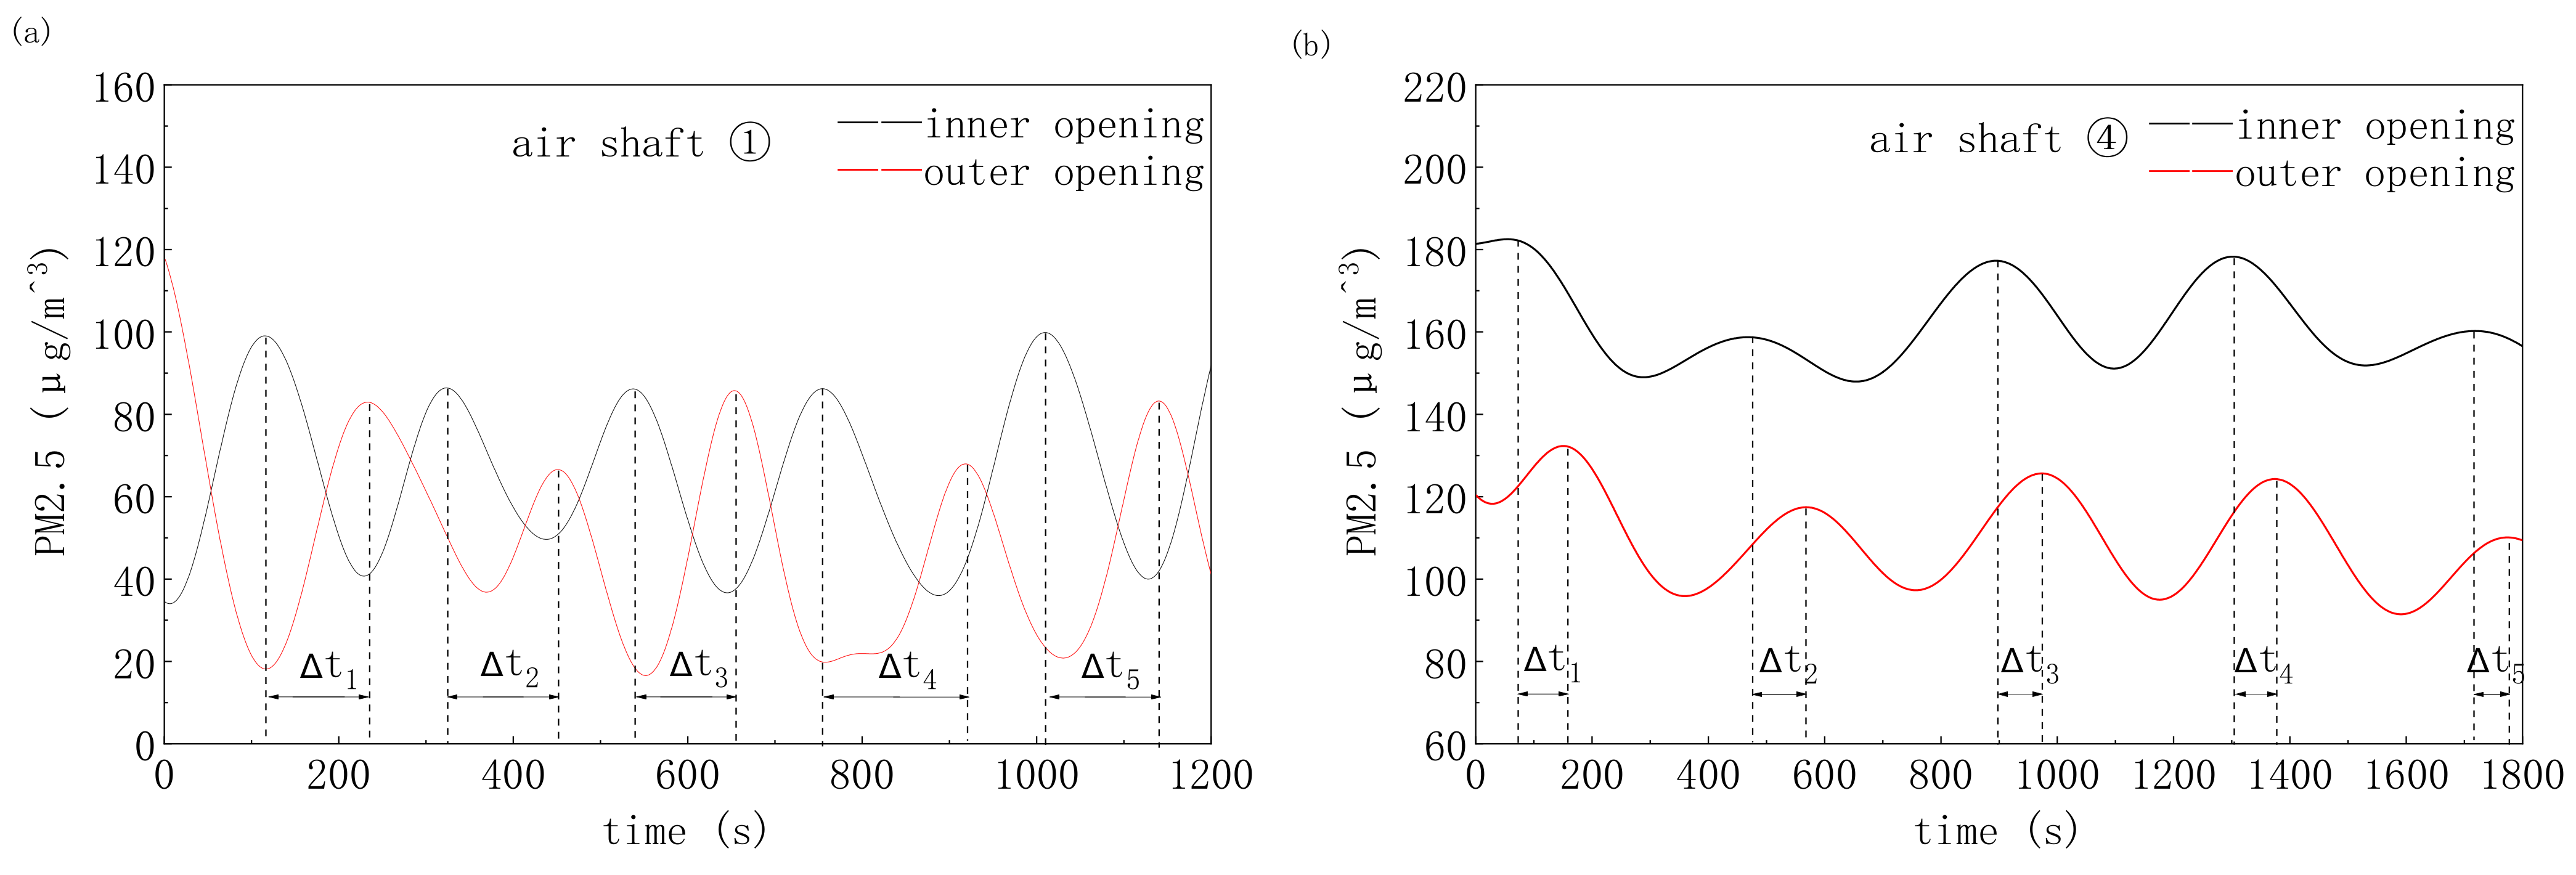
The air shaft has better ventilation performance if its inner opening is set on the top of the tunnel rather than on the side of the tunnel. When designing a new tunnel, it is better to set the inner opening of the air shaft at the top of the tunnel to obtain a better ventilation performance.
(4)
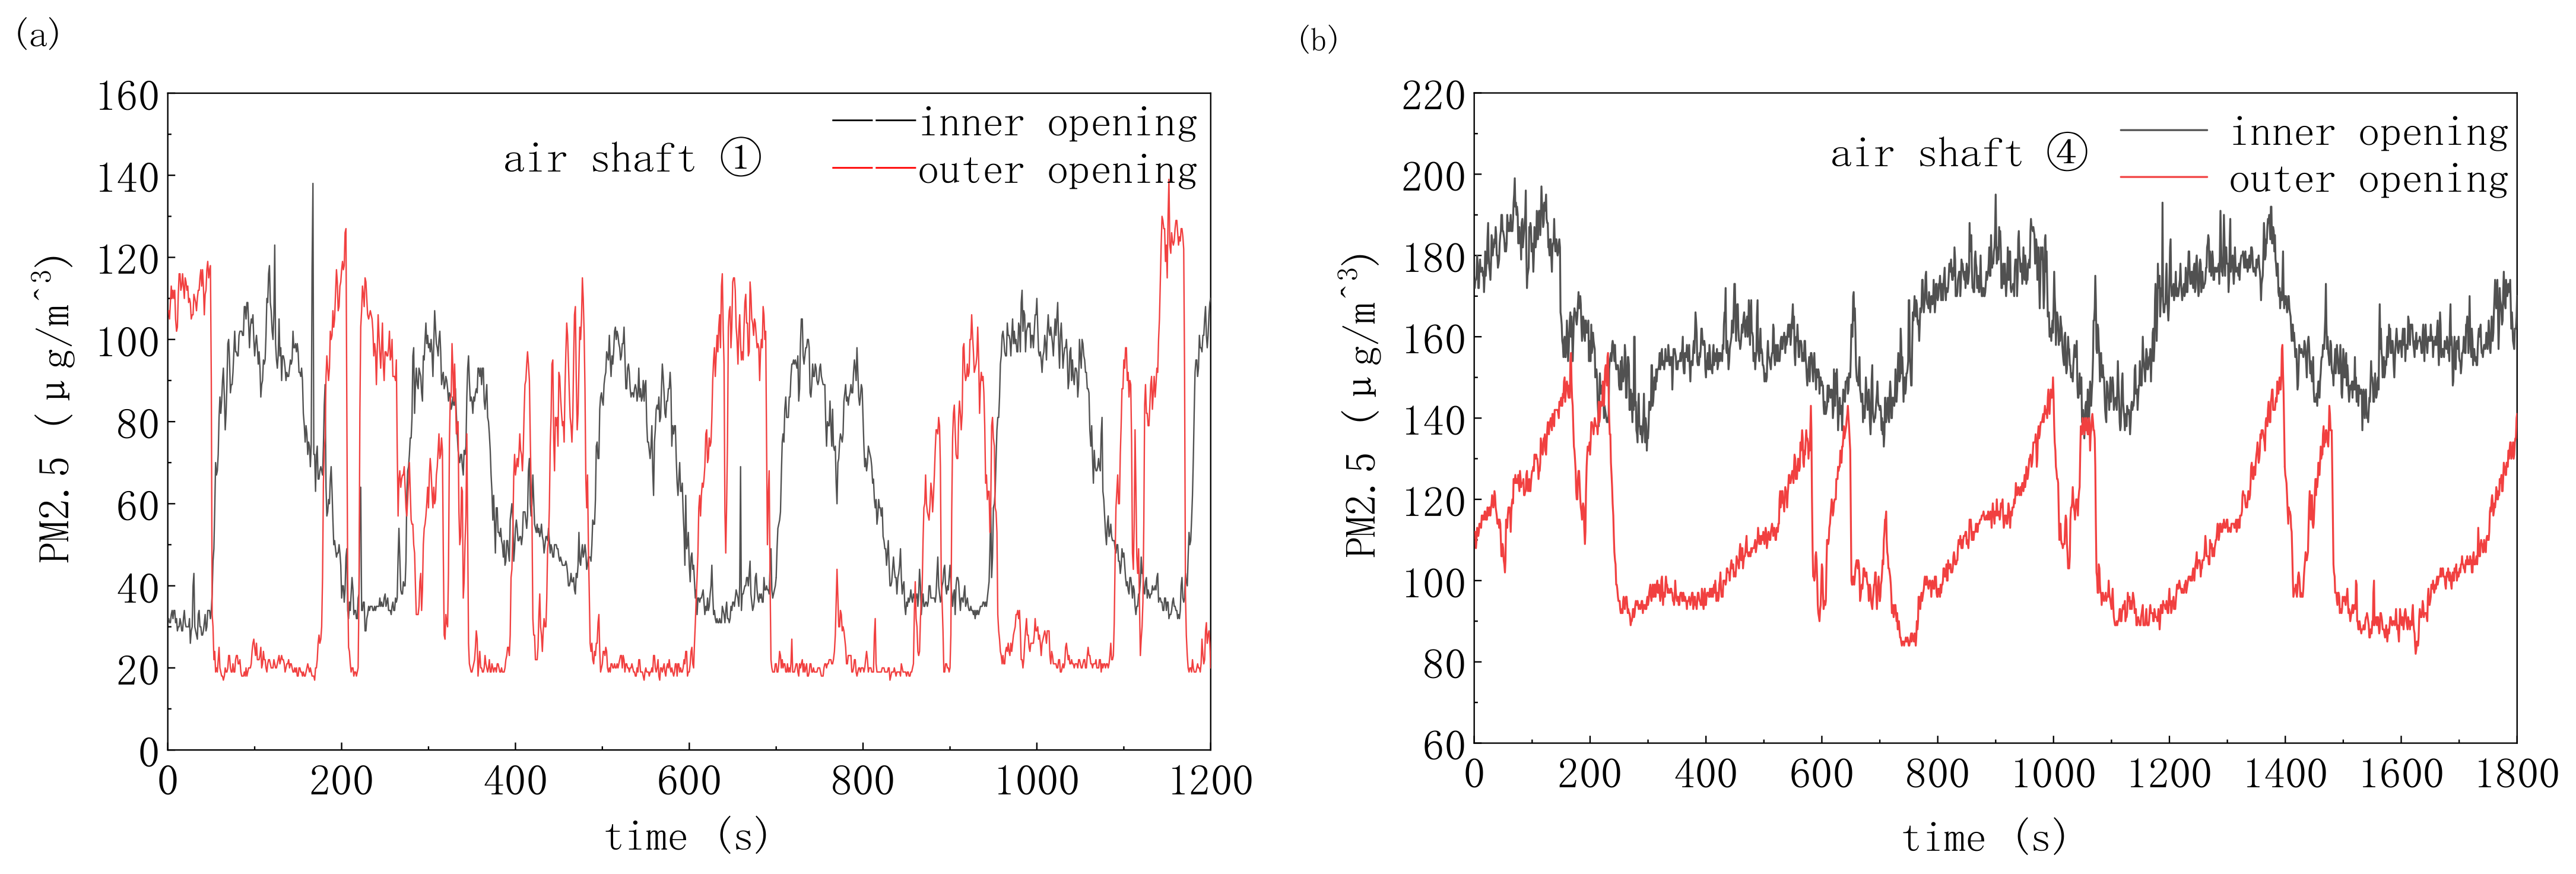
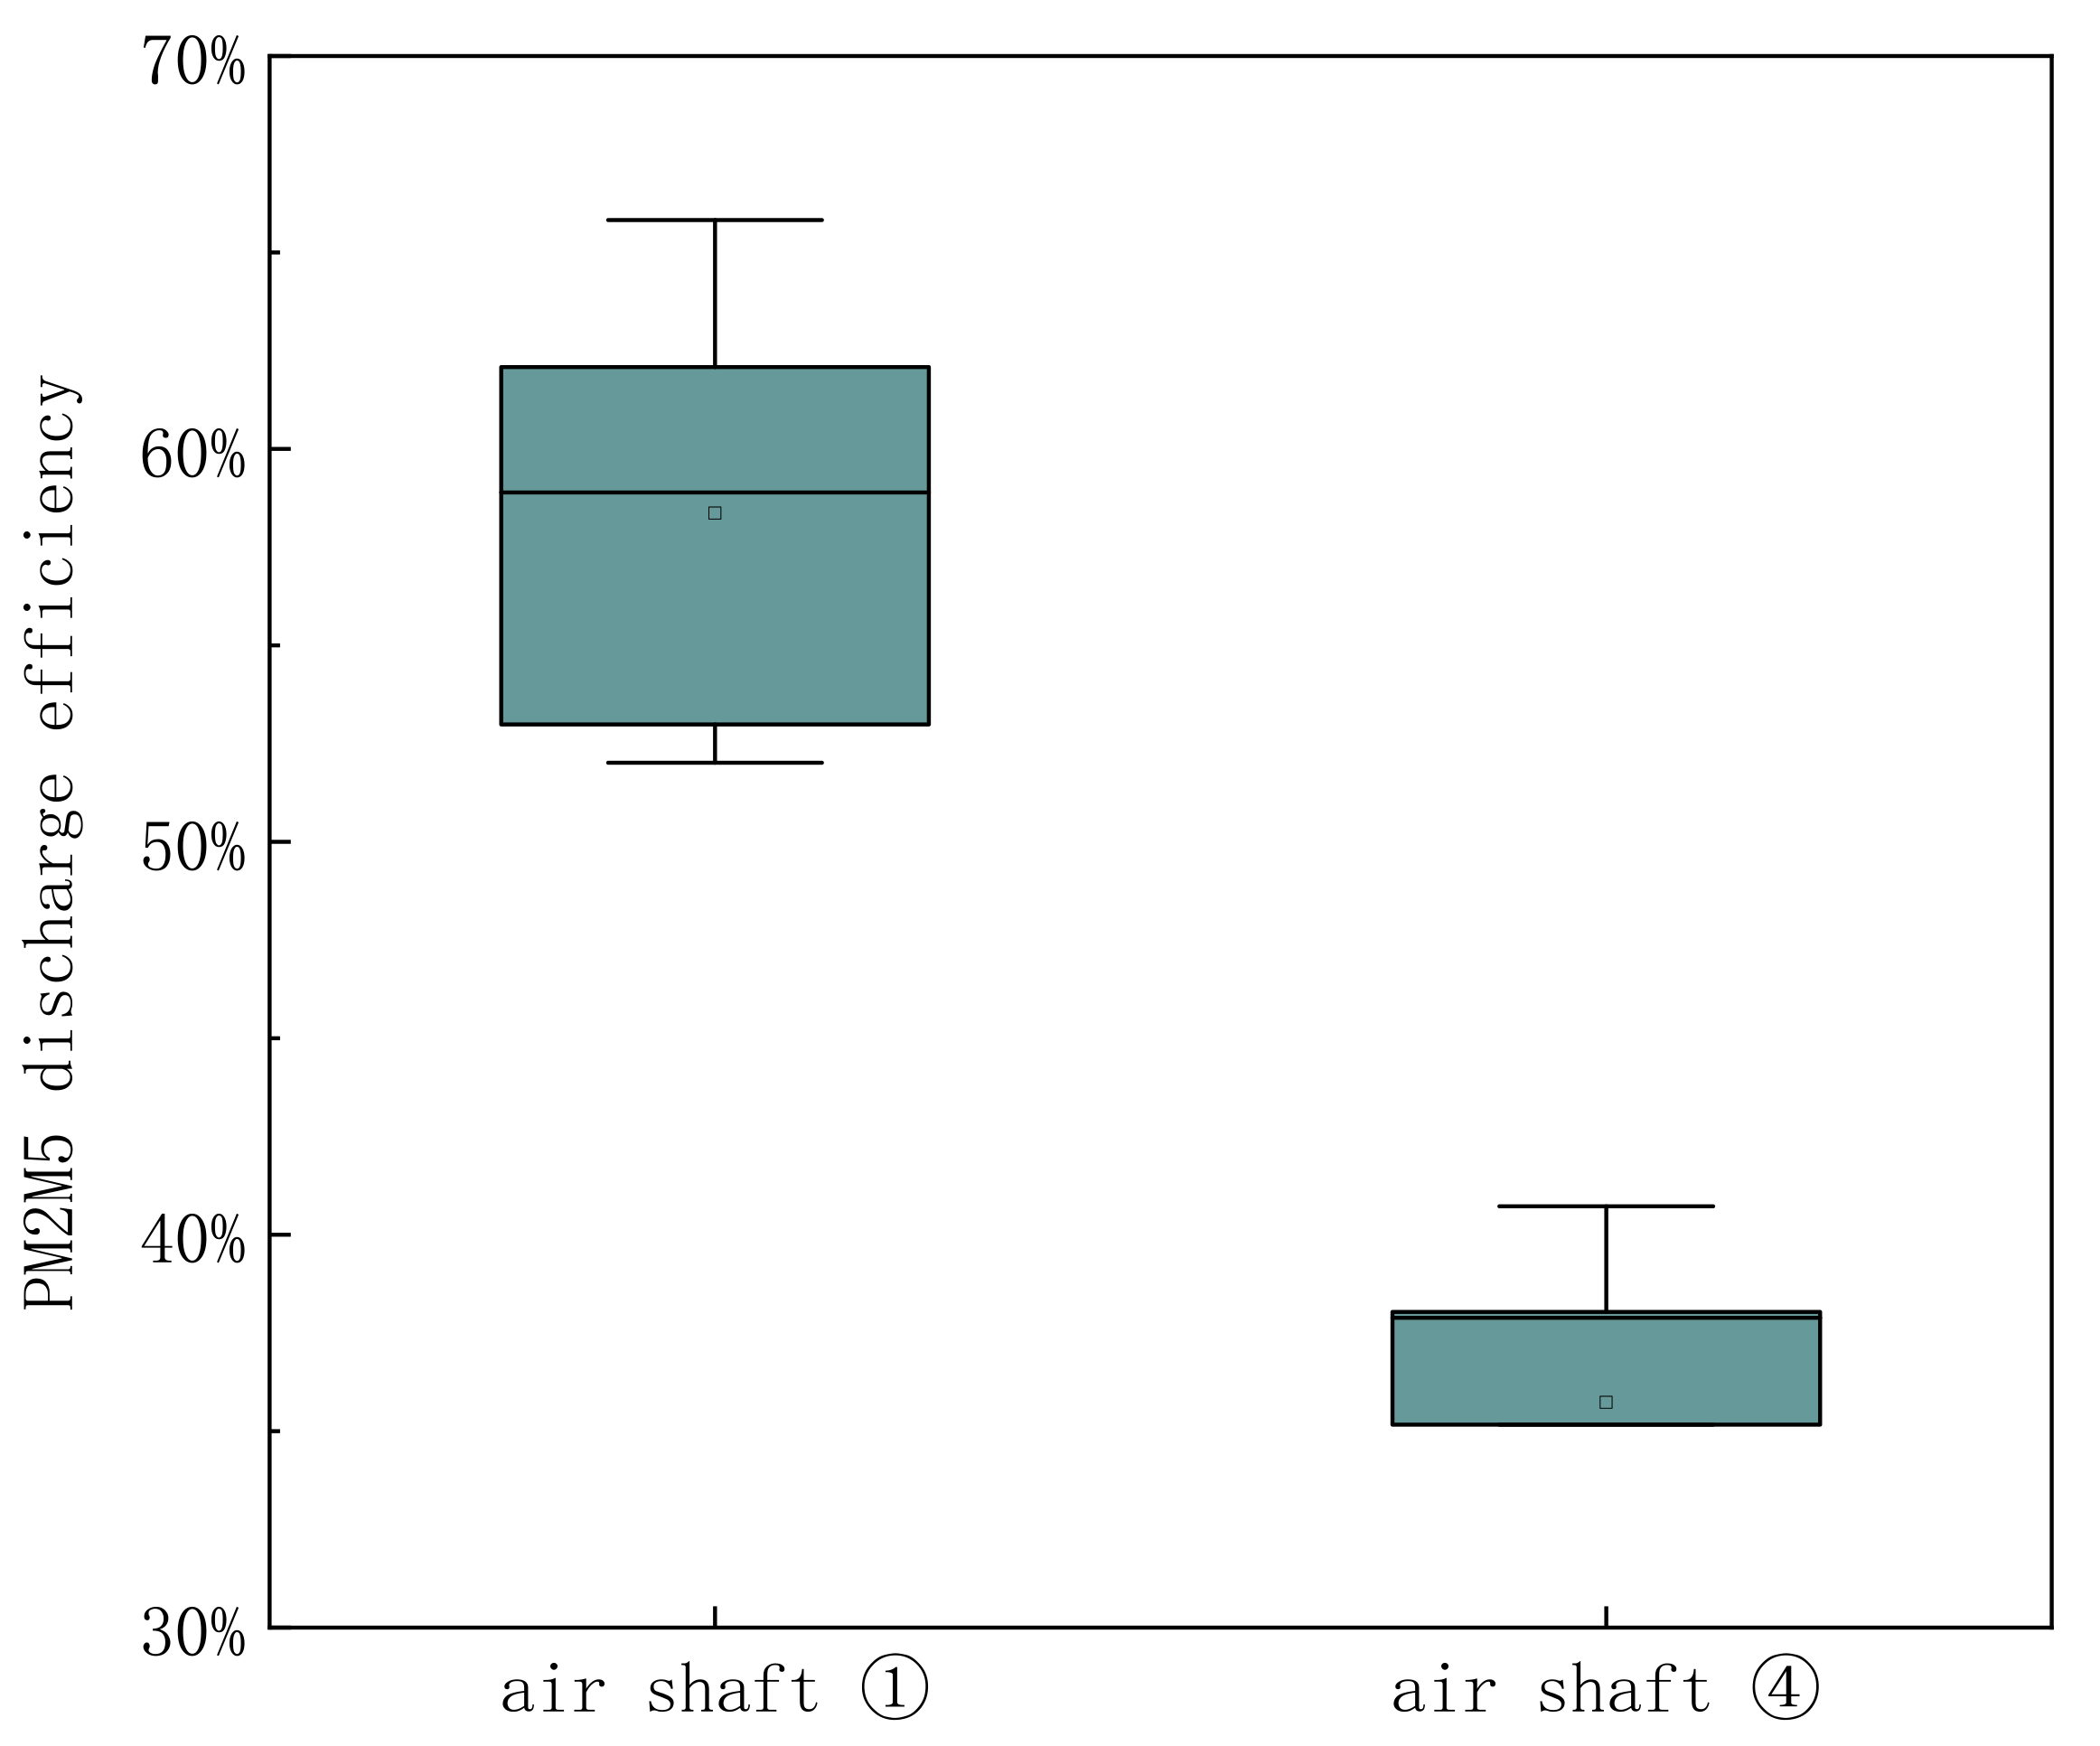
The PM2.5 discharge efficiency of the station air shaft on the train-arriving side was 52.0%~62.8%, higher than that of the middle air shaft, which was 26.8%~40.7%. This index can be used to evaluate the ventilation performance from another angle.
More tests are necessary to exclude additional factors, such as the structure of air shafts, so as to better compare the ventilation performance of different air shafts. Furthermore, simulations can be conducted to compare with the experimental results. If the simulation results are consistent with the experimental results, the two ventilation performance evaluation indexes put forward in this study can be better used in subway tunnel air shaft design.

Author Contributions

Conceptualization, J.Z. and Y.W.; methodology, J.Z. and H.Q.; writing—original draft preparation, H.Q.; writing—review and editing, H.Q., J.Z. and Y.W.; visualization, H.Q.; supervision, Yan Wu; project administration, J.Z.; funding acquisition, J.Z. and Y.W. All authors have read and agreed to the published version of the manuscript.

Funding

This research was funded by (National Natural Science Foundation of China) grant number (52108087) and (Shanghai Sailing Program) grant number (19YF1451100).

Conflicts of Interest

The authors declare no conflict of interest.

References

  1. Colombi, C.; Angius, S.; Gianelle, V.; Lazzarini, M. Particulate matter concentrations, physical characteristics and elemental composition in the Milan underground transport system. Atmos. Environ. 2013, 70, 166–178. [Google Scholar] [CrossRef]
  2. Font, O.; Moreno, T.; Querol, X.; Martinsa, V.; Rodasb, D.S.; Miguelc, E.; Capdevilac, M. Origin and speciation of major and trace PM elements in the Barcelona subway system. Transp. Res. Part D Transp. Environ. 2019, 72, 17–35. [Google Scholar] [CrossRef]
  3. Guo, L.; Hu, Y.; Hu, Q.; Lin, J.; Li, C.; Chen, J.; Li, L.; Fu, H. Characteristics and chemical compositions of particulate matter collected at the selected metro stations of Shanghai, China. Sci. Total Environ. 2014, 496, 443–452. [Google Scholar] [CrossRef] [PubMed]
  4. Lee, Y.; Lee, Y.C.; Kim, T.; Choi, J.S.; Park, D. Sources and Characteristics of Particulate Matter in Subway Tunnels in Seoul, Korea. Int. J. Environ. Res. Public Health 2018, 15, 2534. [Google Scholar] [CrossRef] [Green Version]
  5. Lu, S.; Liu, D.; Zhang, W.; Liu, P.; Fei, Y.; Gu, Y.; Wu, M.; Yu, S.; Yonemochi, S.; Wang, X.; et al. Physico-chemical characterization of PM2.5 in the microenvironment of Shanghai subway. Atmos. Res. 2015, 153, 543–552. [Google Scholar] [CrossRef]
  6. Kang, S.; Hwang, H.; Park, Y.; HyeKyoung, K.; Chul-Un, R. Chemical Compositions of Subway Particles in Seoul, Korea Determined by a Quantitative Single Particle Analysis. Environ. Sci. Technol. 2008, 42, 9051–9057. [Google Scholar] [CrossRef]
  7. Lennart, L.K.; Asa, H.; Lennart, M. Subway particles are more genotoxic than street particles and induce oxidative stress in cultured human lung cells. Chem. Res. Toxicol. 2005, 18, 726–731. [Google Scholar]
  8. Jung, M.H.; Kim, H.R.; Park, Y.J.; Park, D.S.; Chung, K.H.; Oh, S.M. Genotoxic effects and oxidative stress induced by organic extracts of particulate matter (PM 10) collected from a subway tunnel in Seoul, Korea. Mutat. Res. 2012, 749, 39–47. [Google Scholar] [CrossRef]
  9. Ngoc, L.T.N.; Lee, Y.; Chun, H.S.; Ju-Young, M.; Jin, S.C.; Duckshin, P.; Young-Chul, L. Correlation of alpha/gamma-Fe2O3 nanoparticles with the toxicity of particulate matter originating from subway tunnels in Seoul stations, Korea. J. Hazard Mater. 2020, 382, 121175. [Google Scholar] [CrossRef]
  10. Zhang, Y.; Chu, M.; Zhang, J.; Duan, J.; Hu, D.; Zhang, W.; Yang, X.; Jia, X.; Deng, F.; Sun, Z. Urine metabolites associated with cardiovascular effects from exposure of size-fractioned particulate matter in a subway environment: A randomized crossover study. Env. Int. 2019, 130, 104920. [Google Scholar] [CrossRef]
  11. Debananda, R.; Yong-Chil, S.; Hyeong, G.; Namgung, S.; Bark, K. Inhalation cancer risk from PM10 in the metropolitan subway stations in Korea-ScienceDirect. J. Transp. Health 2019, 14, 100580. [Google Scholar]
  12. Bachoual, R.; Boczkowski, J.; Goven, D.; Amara, N.; Tabet, L.; On, D.; Leçon-Malas, V.; Aubier, M.; Lanone, S. Biological effects of particles from the Paris subway system. Chem. Res. Toxicol. 2007, 20, 1426–1433. [Google Scholar] [CrossRef] [PubMed]
  13. Son, Y.S.; Oh, Y.H.; Choi, I.Y.; Dinh, T.; Chung, S.; Lee, J.; Park, D.; Kim, J. Development of a magnetic hybrid filter to reduce PM10 in a subway platform. J. Hazard Mater. 2019, 368, 197–203. [Google Scholar] [CrossRef] [PubMed]
  14. Woo, S.-H.; Cheon, T.-W.; Lee, G.; Kim, J.B.; Bae, G.-N.; Kwon, S.-B.; Hong, R.J.; Yook, S.-J. Performance evaluation of a hybrid dust collector for removing particles during subway train operation. Aerosol Sci. Technol. 2019, 53, 562–574. [Google Scholar] [CrossRef]
  15. Sim, J.-B.; Woo, S.-H.; Yook, S.-J.; Kim, J.B. Baffle dust collector for removing particles from a subway tunnel during the passage of a train. J. Mech. Sci. Technol. 2018, 32, 1415–1421. [Google Scholar] [CrossRef]
  16. Sim, J.-B.; Yoon, H.H.; Woo, S.-H.; Yook, S.; Kim, J.B.; Bae, G.; Yoon, H.H. Performance Estimation of a Louver Dust Collector Attached to the Bottom of a Subway Train Running in a Tunnel. Aerosol Air Qual. Res. 2017, 17, 1954–1962. [Google Scholar] [CrossRef] [Green Version]
  17. Lin, C.J.; Chuah, Y.K.; Liu, C.W. A study on underground tunnel ventilation for piston effects influenced by draught relief shaft in subway system. Appl. Therm. Eng. 2008, 28, 372–379. [Google Scholar] [CrossRef]
  18. Kim, J.Y.; Kim, K.Y. Effects of vent shaft location on the ventilation performance in a subway tunnel. J. Wind. Eng. Ind. Aerodyn. 2009, 97, 174–179. [Google Scholar] [CrossRef]
  19. Lee, K.B.; Park, J.S.; Myung Do, O. Field measurement and estimation of ventilation flow rates by using train-induced flow rate through subway vent shafts. J. Mech. Sci. Technol. 2014, 28, 2677–2686. [Google Scholar] [CrossRef]
  20. Huang, Y.D.; Li, C.; Kim, C.N. A numerical analysis of the ventilation performance for different ventilation strategies in a subway tunnel. J. Hydrodyn. 2012, 24, 193–201. [Google Scholar] [CrossRef]
  21. Huang, Y.D.; Gong, X.Y.; Pen, Y.J.; Lin, X.Y.; Kim, C.N. Effects of the ventilation duct arrangement and duct geometry on ventilation performance in a subway tunnel. Tunn. Undergr. Space Technol. Inc. Trenchless Technol. Res. 2011, 26, 725–733. [Google Scholar]
  22. Yang, Z.A.; Yang, Y.A.; Zahali, B.; Rongwei, B.; Junhui, G.; Yixiao, W.; Liang, Y. Analytical and numerical study on natural ventilation performance in single- and gable-slope city tunnels. Sustain. Cities Soc. 2019, 45, 258–270. [Google Scholar]
  23. Huang, Y.D.; Gao, W.; Kim, C.N. A numerical study of the train-induced unsteady airflow in a subway tunnel with natural ventilation ducts using the dynamic layering method. J. Hydrodyn. 2010, 22, 164–172. [Google Scholar] [CrossRef]
  24. Wu, Y.; Gao, N.P.; Wang, L.H.; Yan, W.; Naiping, G.; Lihui, W.; Xiping, W. A numerical analysis of airflows caused by train-motion and performance evaluation of a subway ventilation system. Indoor Built Environ. 2013, 23, 1420326X13479623. [Google Scholar]
  25. Ji, J.; Han, J.Y.; Fan, C.G.; Gao, Z.H.; Sun, J.H. Influence of cross-sectional area and aspect ratio of shaft on natural ventilation in urban road tunnel. Int. J. Heat Mass Transf. 2013, 67, 420–431. [Google Scholar] [CrossRef]
  26. Fan, C.G.; Ji, J.; Wang, W.; Sun, J.H. Effects of vertical shaft arrangement on natural ventilation performance during tunnel fires. Int. J. Heat Mass Transf. 2014, 73, 158–169. [Google Scholar] [CrossRef]
  27. Liu, Y.; Shi, K.F.; Zhang, Y.; Li, X.F.; Yu, Y.B. Influence of train operating organization on airflow exchange volume of air shafts. HAVC 2019, 49, 7–13. [Google Scholar]
  28. Zhang, Z.; Zhang, H.; Tan, Y.; Yang, H. Natural wind utilization in the vertical shaft of a super-long highway tunnel and its energy saving effect. Build. Environ. 2018, 145, 140–152. [Google Scholar] [CrossRef]
  29. Wang, L.H.; Gong, W.; Song, J.; Shen, Z.Q.; Yan, Z.C. Field Measurement Study on Velocity Characteristics of Horizontal Piston Wind Valve in Subway. J. Refrig. 2012, 33, 54–59+65. [Google Scholar]
  30. Zhang, Y.; Zhang, Q.; Bi, H.Q.; Yang, X. Field Measurement and Analysis of the Wind Speed of the Air Passage at the Airshaft for Subway. Refrig. Air Cond. 2020, 34, 463–467. [Google Scholar]
Figure 1. The location of station air shafts in Line 1.
Atmosphere 13 01040 g001
Figure 2. The location of middle air shafts in Line 2.
Atmosphere 13 01040 g002
Figure 3. The schematic diagram of the wind speed test site.
Atmosphere 13 01040 g003
Figure 4. Wind speed measuring points on air damper.
Atmosphere 13 01040 g004
Figure 5. The particle size composition of PM10 (a) on the platform at Station 1; (b) in the tunnel at Station 1; (c) in the air shaft at Station 1; (d) on the platform at Station 2; (e) in the tunnel at Station 2; and (f) in the air shaft at Station 2.
Atmosphere 13 01040 g005
Figure 6. PM2.5 concentration at different locations.
Atmosphere 13 01040 g006
Figure 7. Wind speed variations at the inner openings of station air shafts ① and ②.
Atmosphere 13 01040 g007
Figure 8. Wind speed variations at the inner openings of middle air shafts ③ and ④.
Atmosphere 13 01040 g008
Figure 9. (a) Effective exhaust air volume ( Q e ) of each air shaft per train; (b) Effective suction air volume ( Q s ) of each air shaft per train.
Atmosphere 13 01040 g009
Figure 10. Average effective exhaust/suction air volume of different air shafts.
Atmosphere 13 01040 g010
Figure 11. Changes in PM2.5 concentration over time at the inner opening and outer opening of (a) air shaft ① and (b) air shaft ④.
Atmosphere 13 01040 g011
Figure 12. Filtering of PM2.5 concentration at the inner opening and outer opening of (a) air shaft ① and (b) air shaft ④.
Atmosphere 13 01040 g012
Figure 13. PM2.5 discharge efficiency of air shaft ① and air shaft ④.
Atmosphere 13 01040 g013
Table 1. Information of each air shaft.
Air ShaftLocationDamper Area, m2Total Duct Volume, m3Inner Opening Location
Train-arriving side of station20.141634Top of tunnel
Train-leaving side of station20.141634Top of tunnel
Middle of interval tunnel20.141500Top of tunnel
Middle of interval tunnel20.141500Side of tunnel
Publisher’s Note: MDPI stays neutral with regard to jurisdictional claims in published maps and institutional affiliations.

