Article

Self-Organized Criticality of Precipitation in the Rainy Season in East China

1
College of Physical Science and Technology, Yangzhou University, Yangzhou 225009, China
2
School of Atmospheric Sciences, Sun Yat-Sen University, Zhuhai 519082, China
*
Author to whom correspondence should be addressed.
Atmosphere 2022, 13(7), 1038; https://doi.org/10.3390/atmos13071038
Submission received: 1 June 2022 / Revised: 24 June 2022 / Accepted: 27 June 2022 / Published: 29 June 2022

Abstract

:
Based on daily precipitation data from 1960 to 2017 in the rainy season in east China, to a given percentile threshold of one observation station, the time that precipitation spends below threshold is defined as quiet time τ . The probability density functions τ in different thresholds follow power-law distributions with exponent β of approximately 1.2 in the day, pentad and ten-day period time scales, respectively. The probability density functions τ in different regions follow the same rules, too. Compared with sandpile model, Γ function describing the collapse behavior can effectively scale the quiet time distribution of precipitation events. These results confirm the assumption that for observation station data and low-resolution precipitation data, even in China, affected by complex weather and climate systems, precipitation is still a real world example of self-organized criticality in synoptic. Moreover, exponent β of the probability density function τ , mean quiet time τ ¯ q and hazard function H q of quiet times can give sensitive regions of precipitation events in China. Usual intensity precipitation events (UPEs) easily occur and cluster mainly in the middle Yangtze River basin, east of the Sichuan Province and north of the Gansu Province. Extreme intensity precipitation events (EPEs) more easily occur in northern China in the rainy season. UPEs in the Hubei Province and the Hunan Province are more likely to occur in the future. EPEs in the eastern Sichuan Province, the Guizhou Province, the Guangxi Province and Northeast China are more likely to occur.

1. Introduction

China is located in the subtropical and midlatitude regions of the Northern Hemisphere. Due to the influence of the East Asian monsoon and global warming, extreme precipitation events occur frequently. Flood-oriented disasters occur frequently and pose serious threats to China’s ecological environment, economic culture and social life [1,2,3,4,5]. Therefore, it is important to study the spatiotemporal evolution characteristics of precipitation events with different intensities and explore the internal nonlinear dynamics mechanism. Numerous studies have focused on the distribution and evolution of precipitation in China regarding intensity, frequencies, duration and recurrence period [6,7,8,9]. Although the spatial variation and trend analysis of precipitation can help us to better understand the variability in precipitation, the connections between the dynamic mechanisms of precipitation remain unclear yet [10,11,12].
Precipitation is the coupling result of multiscale (spatiotemporally) nonlinear complex systems, which has a decisive influence on the spatial and temporal distribution of regional water resources and the evolution of the ecological environment. In recent years, studies have shown that meteorological elements, such as temperature and precipitation, have a long-term statistical memory. The occurrence time of extreme events has a significant long-term correlation, and it is related to the clustering of extreme events [13,14,15]. Fisher et al. [16] reported that the frequencies of extreme events are independent of each other and follow a Poisson distribution. In addition, there is no internal connection between them, and they do not represent a cluster feature. He et al. [17] also confirmed the long-term sustainable characteristics of natural phenomena, such as precipitation, by analyzing hydrological data from a nonlinear perspective.
In addition to the above characteristics of precipitation events, statistical measures present strong statistical regularities [18,19,20], supporting the hypothesis that atmospheric convection and precipitation may be a real-world example of self-organized criticality [21,22,23,24,25,26]. Self-organized criticality was first proposed by Per Bak et al. in 1987 [27], who showed the dynamical system with spatial degrees of freedom naturally evolve into self-organized critical point. It is widely used to explain the power-law frequency distribution of many nonlinear dynamical systems, such as population distribution in human society [28], species extinction and viral spread in biology [29,30], and plate motion and seismic activity in geophysics [31,32]. At present, there is no unified definition of self-organized criticality, and the necessary conditions for the occurrence of self-organized criticality are still unclear. With previous research work [33,34,35], we give a summary and descriptive definition. Self-organized criticality describes non-linear or complex dynamical systems independent of external parameters, which are driven by energy and evolve into self-organized critical points. Once the dynamical systems reach critical points, “avalanches” of energy release will happen along with scale-free property and power-law distribution. The sandpile model as a prototypical self-organized criticality system is usually used to investigate the characteristics [33,36]. In meteorology and hydrology, Deluca et al. [37,38] compared the intensities across different climates from the atmospheric radiation measurement database of high-resolution (1-min) with a sandpile model. The results indicate high-resolution precipitation data is in agreement with self-organized criticality hypothesis. “Episodic” precipitation events decided by a certain threshold, similar to avalanches in self-organized criticality sandpile models, can be defined as an additive effect of the precipitation over a certain time period. That is, occurrence of precipitation events, subject to threshold, can be regarded as “collapse” actions of the self-organized criticality system. Then, (1) for observation station data and low-resolution precipitation data (daily), is precipitation still a self-organized criticality system? (2) In China, affected by complex weather and climate systems, is precipitation still a self-organized criticality system? Here, inspired by the concept of self-organized criticality, a key variable “quiet time” is defined as the time that precipitation spends below threshold, i.e., the interval of the adjacent precipitation events for a certain threshold. Accordingly, based on low-resolution precipitation data (daily), we studied the characteristics of probability density function of quiet time in different thresholds in China and focused on the questions above, and tried to find out the underlying dynamics mechanism of precipitation.

2. Data and Method

2.1. Data

The daily precipitation data from 1960 to 2017 from April to September (Chinese rainy season) from 194 international exchange stations in China are considered. The dataset is provided by the Chinese Meteorological Data Service Center (CMDC), China Meteorological Administration (CMA). After validating the data by screening and eliminating suspicious and missing records to ensure their continuity and consistency, 174 meteorological observation stations data remained. Considering the evenness of the spatial distribution of observation stations, the east area of 105° E China is chosen. Figure 1 shows the locations of observation stations in this study.

2.2. Method

Compared to concepts of self-organized criticality and precipitation systems, to a given threshold, the occurrence of precipitation events is considered as the collapse of a precipitation system. The time that precipitation spends below threshold is quiet time. In detail, quiet time is defined as follows:
The precipitation events threshold q is determined by the nonparametric percentile method defined by Bonsal [39]. Sorting precipitation observed data { x ( j ) , j = 1 , 2 , , N } in ascending order as x 1 , x 2 , , x m , , x n , the probability ( P ) of any value less than or equal to x m is obtained as Equation (1),
P = ( m 0.31 ) / ( n + 0.38 )
Considering the daily precipitation data for April to September at every station in every year, n = 183 and the threshold for the 90th percentile is obtained by linear interpolation between x 165 ( P = 89.8%) and x 166 ( P = 90.4%). The rest of the percentile thresholds can be obtained in a similar way.
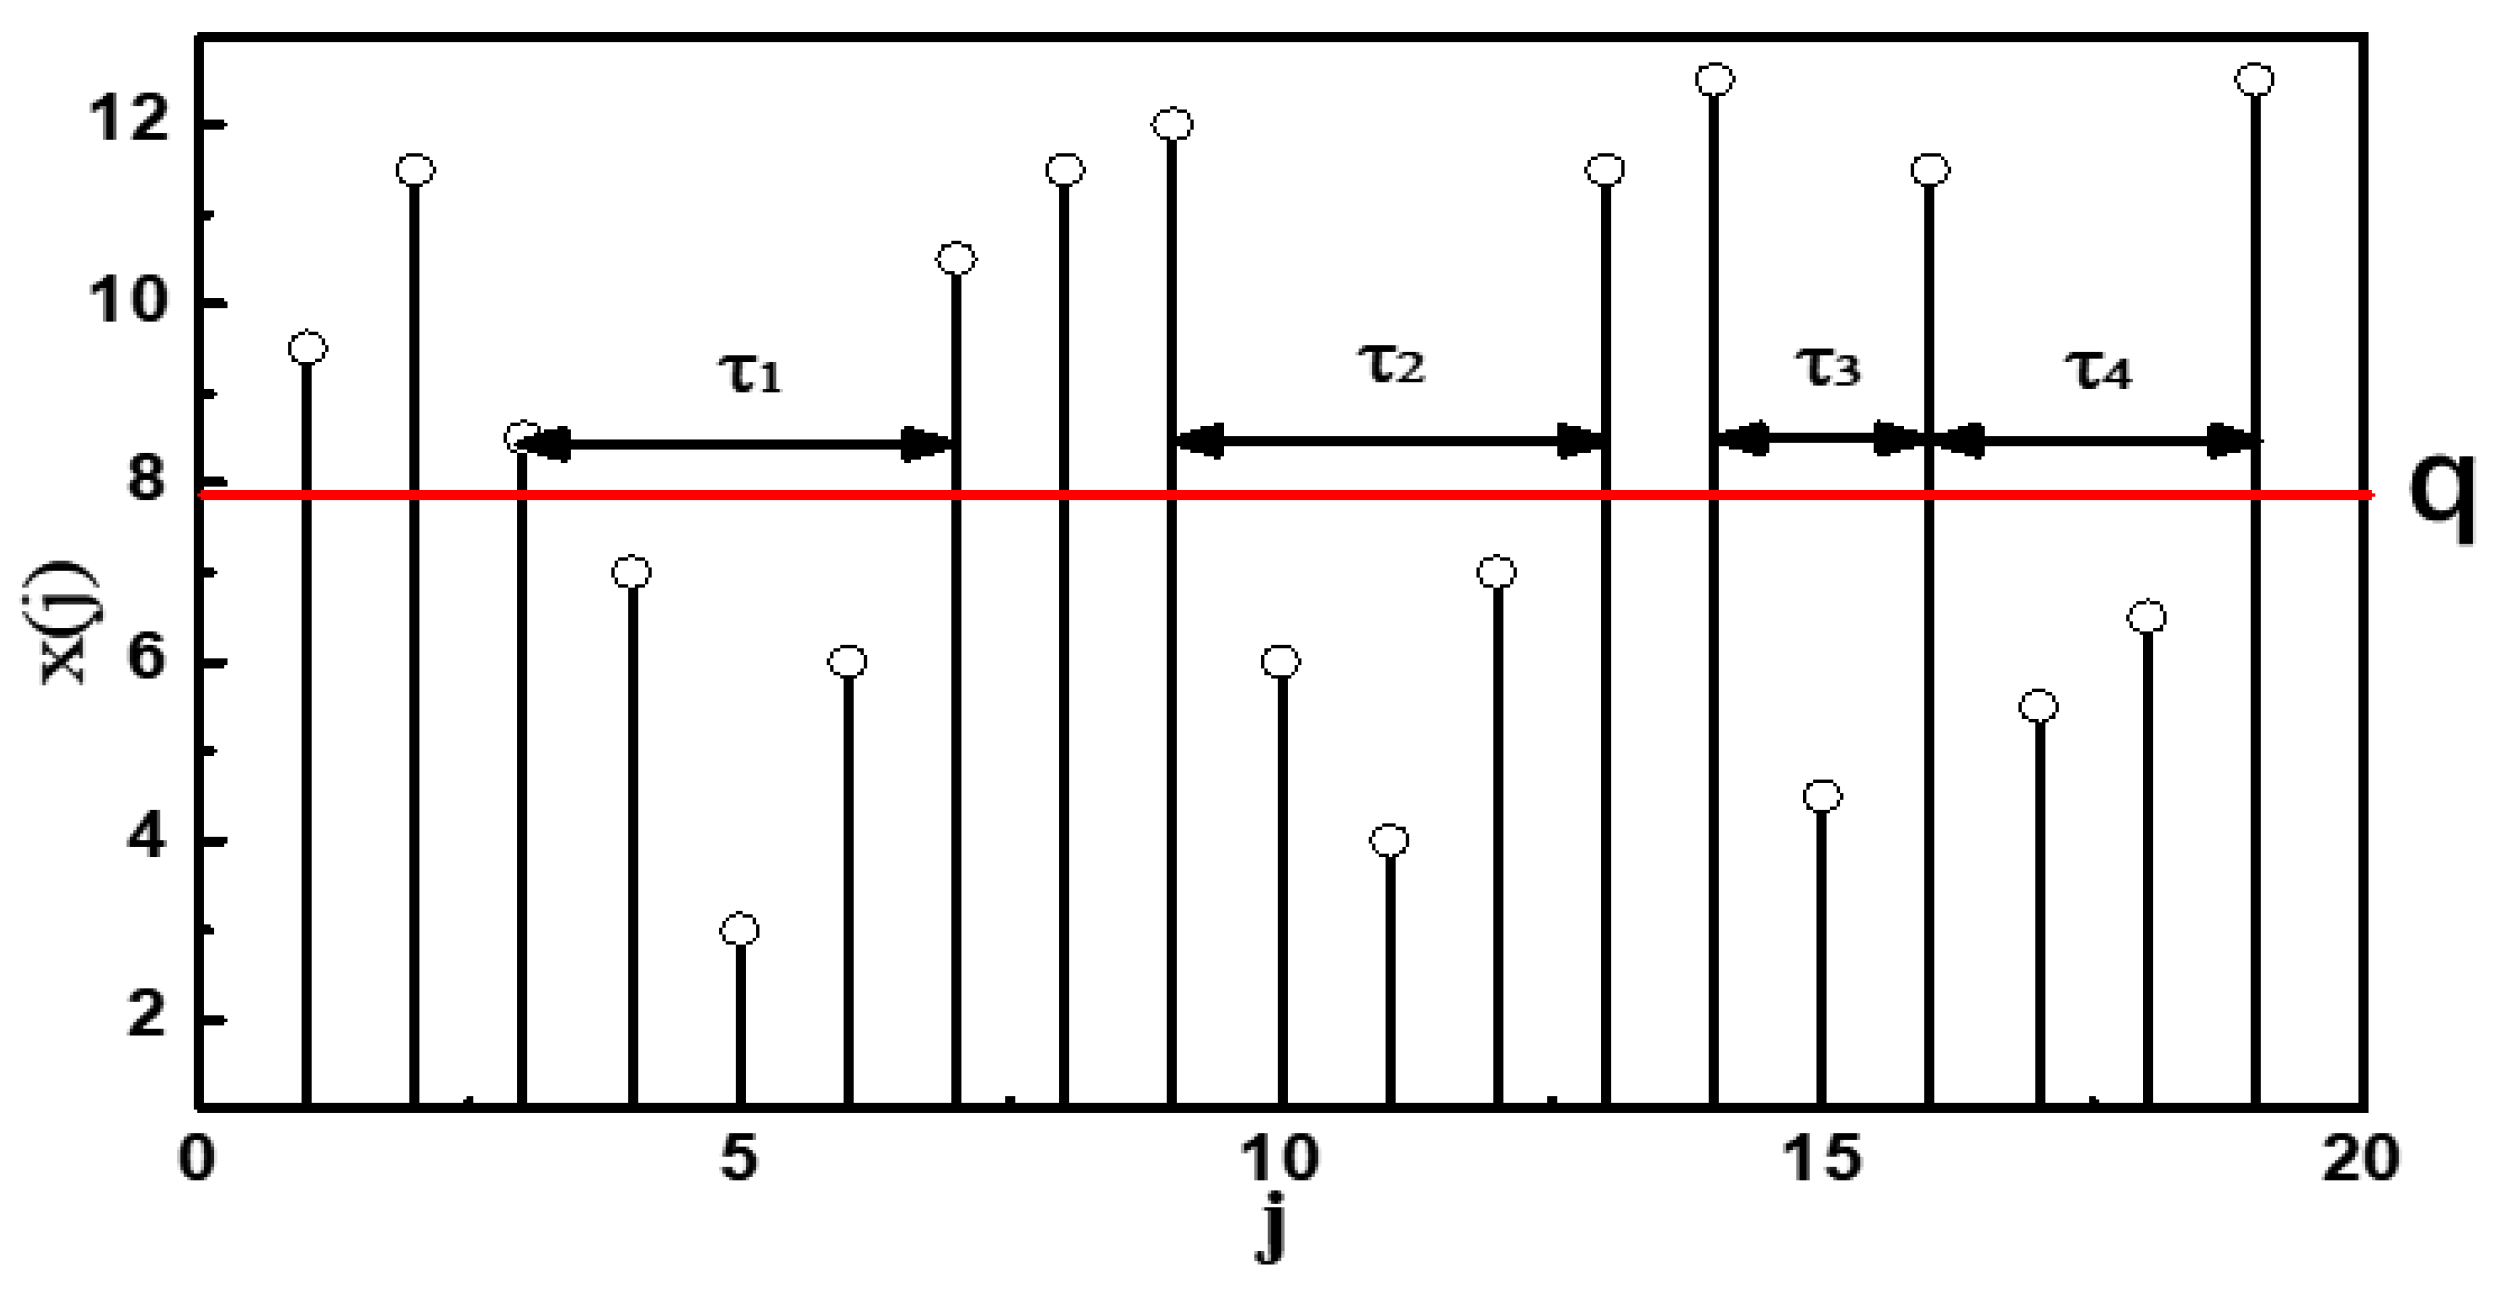
For the given threshold q , the first to last daily precipitation value exceeding the threshold is regarded as one precipitation event, and the interval between two adjacent precipitation events for the same threshold q is defined as the quiet time τ . Figure 2 shows a schematic diagram of the quiet time for a certain time period. Once the percentile threshold q is set, the corresponding number of precipitation events N q and quiet time sequence can be obtained. According to the physics implication of quiet time as shown in Figure 2, a longer quiet time corresponds to a longer waiting time required for the occurrence of precipitation events. Additionally, such precipitation events are more dispersed in time, and the chances of clustering are weaker. In contrast, shorter quiet times indicate that such precipitation events occur more frequently, and therefore, clustering possibilities are stronger. To examine the variation in precipitation events with different intensities, the percentiles 30, 40, 50, 60, 70, 80 and 90 are selected in this study. For the corresponding sub-percentile threshold of q , the quiet time series under the corresponding percentile threshold is denoted as
{ T 30 ( j ) , T 40 ( j ) , T 50 ( j ) , T 60 ( j ) , T 70 ( j ) , T 80 ( j ) , T 90 ( j ) } , ( j = 1 , 2 , 3 , ) .
The high q thresholds are corresponded to extreme precipitation events, and “recurrence period” is commonly used to represent the occurrence probability of such events. In fact, the recurrence period represents a probabilistic turning period that provides the average time interval over a long period of time [40] for the occurrence of precipitation with the same intensity. The recurrence period definitely depends on the threshold chosen. However, it cannot be used to explain the relationship between different extreme precipitation events with different thresholds. It cannot describe the internal dynamic mechanism from the perspective of nonlinear characteristics, either. Quiet time is defined from the concept of self-organized criticality system. It presents the inherent property of self-organized criticality system. From this point of view, the definition of quiet time has a more practical physics value.
To compare the clustering precipitation characteristics for the same intensity, the average quiet time ( τ ¯ q ) of precipitation events is defined. If the sample size of N , then i = 1 N q τ q ( i ) N . The average quiet time ( τ ¯ q ) can be defined as follows:
τ ¯ q = i = 1 N q τ q ( i ) N q N N q
The smaller average quiet time corresponds to more precipitation events occurring. In such cases, precipitation is observed more frequently as an indication of clustering characteristics.

3. Self-Organized Critical Characteristics of Precipitation Events

The probability density distribution of quiet time τ for different intensity precipitation events will be examined. The results showed that the probability density of quiet time for different thresholds approximately follows the power-law distribution function (Equation (3)).
P q ( τ ) ~ 1 τ β
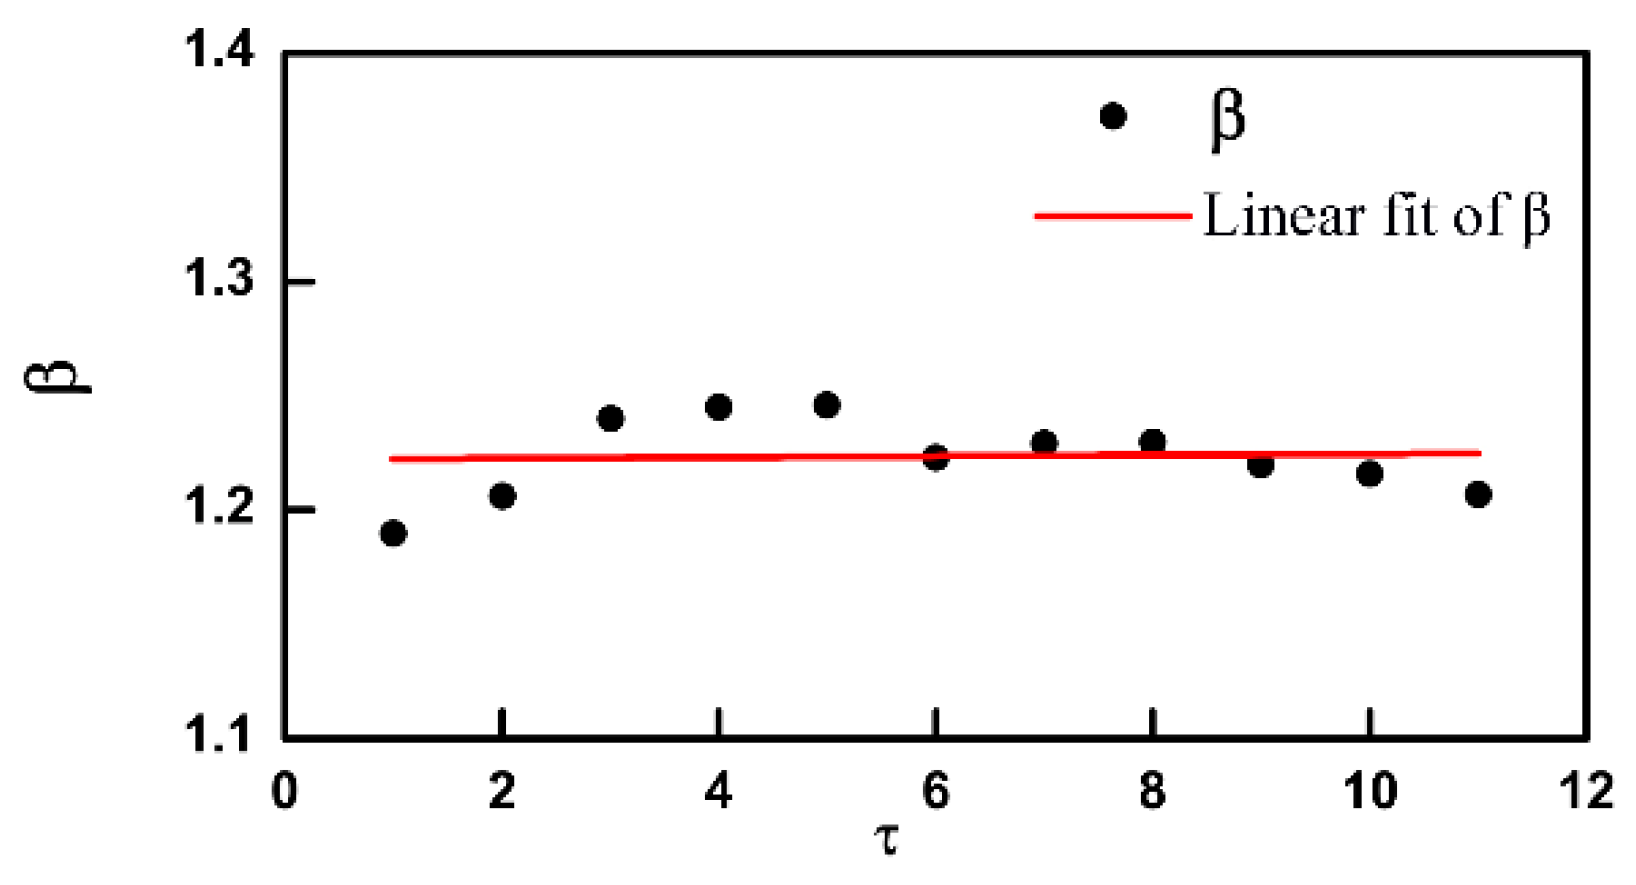
To exclude the possible influence of time series length on the power-law exponent of quiet time, the observations of Beijing Station are considered as an example. Every five-year data point is extended to form 11 time series, i.e., 1960–1965, 1960–1970…, and 1960–2016. The average exponent β of the probability density function is calculated about the quiet time for 11 time intervals. Intervals 1–11 are used to denote each time series. Figure 3 shows the change in β with the 11time intervals. As shown in Figure 3, the trend coefficient is −0.1, and it is not significant at the 5% level. The mean value of all β values is 1.2. Thus, the length of the time series has little influence on the exponent β   of quiet time. Therefore, it is feasible to select 1960 to 2017 precipitation data to analyze the characteristics of the probability density function of quiet time.
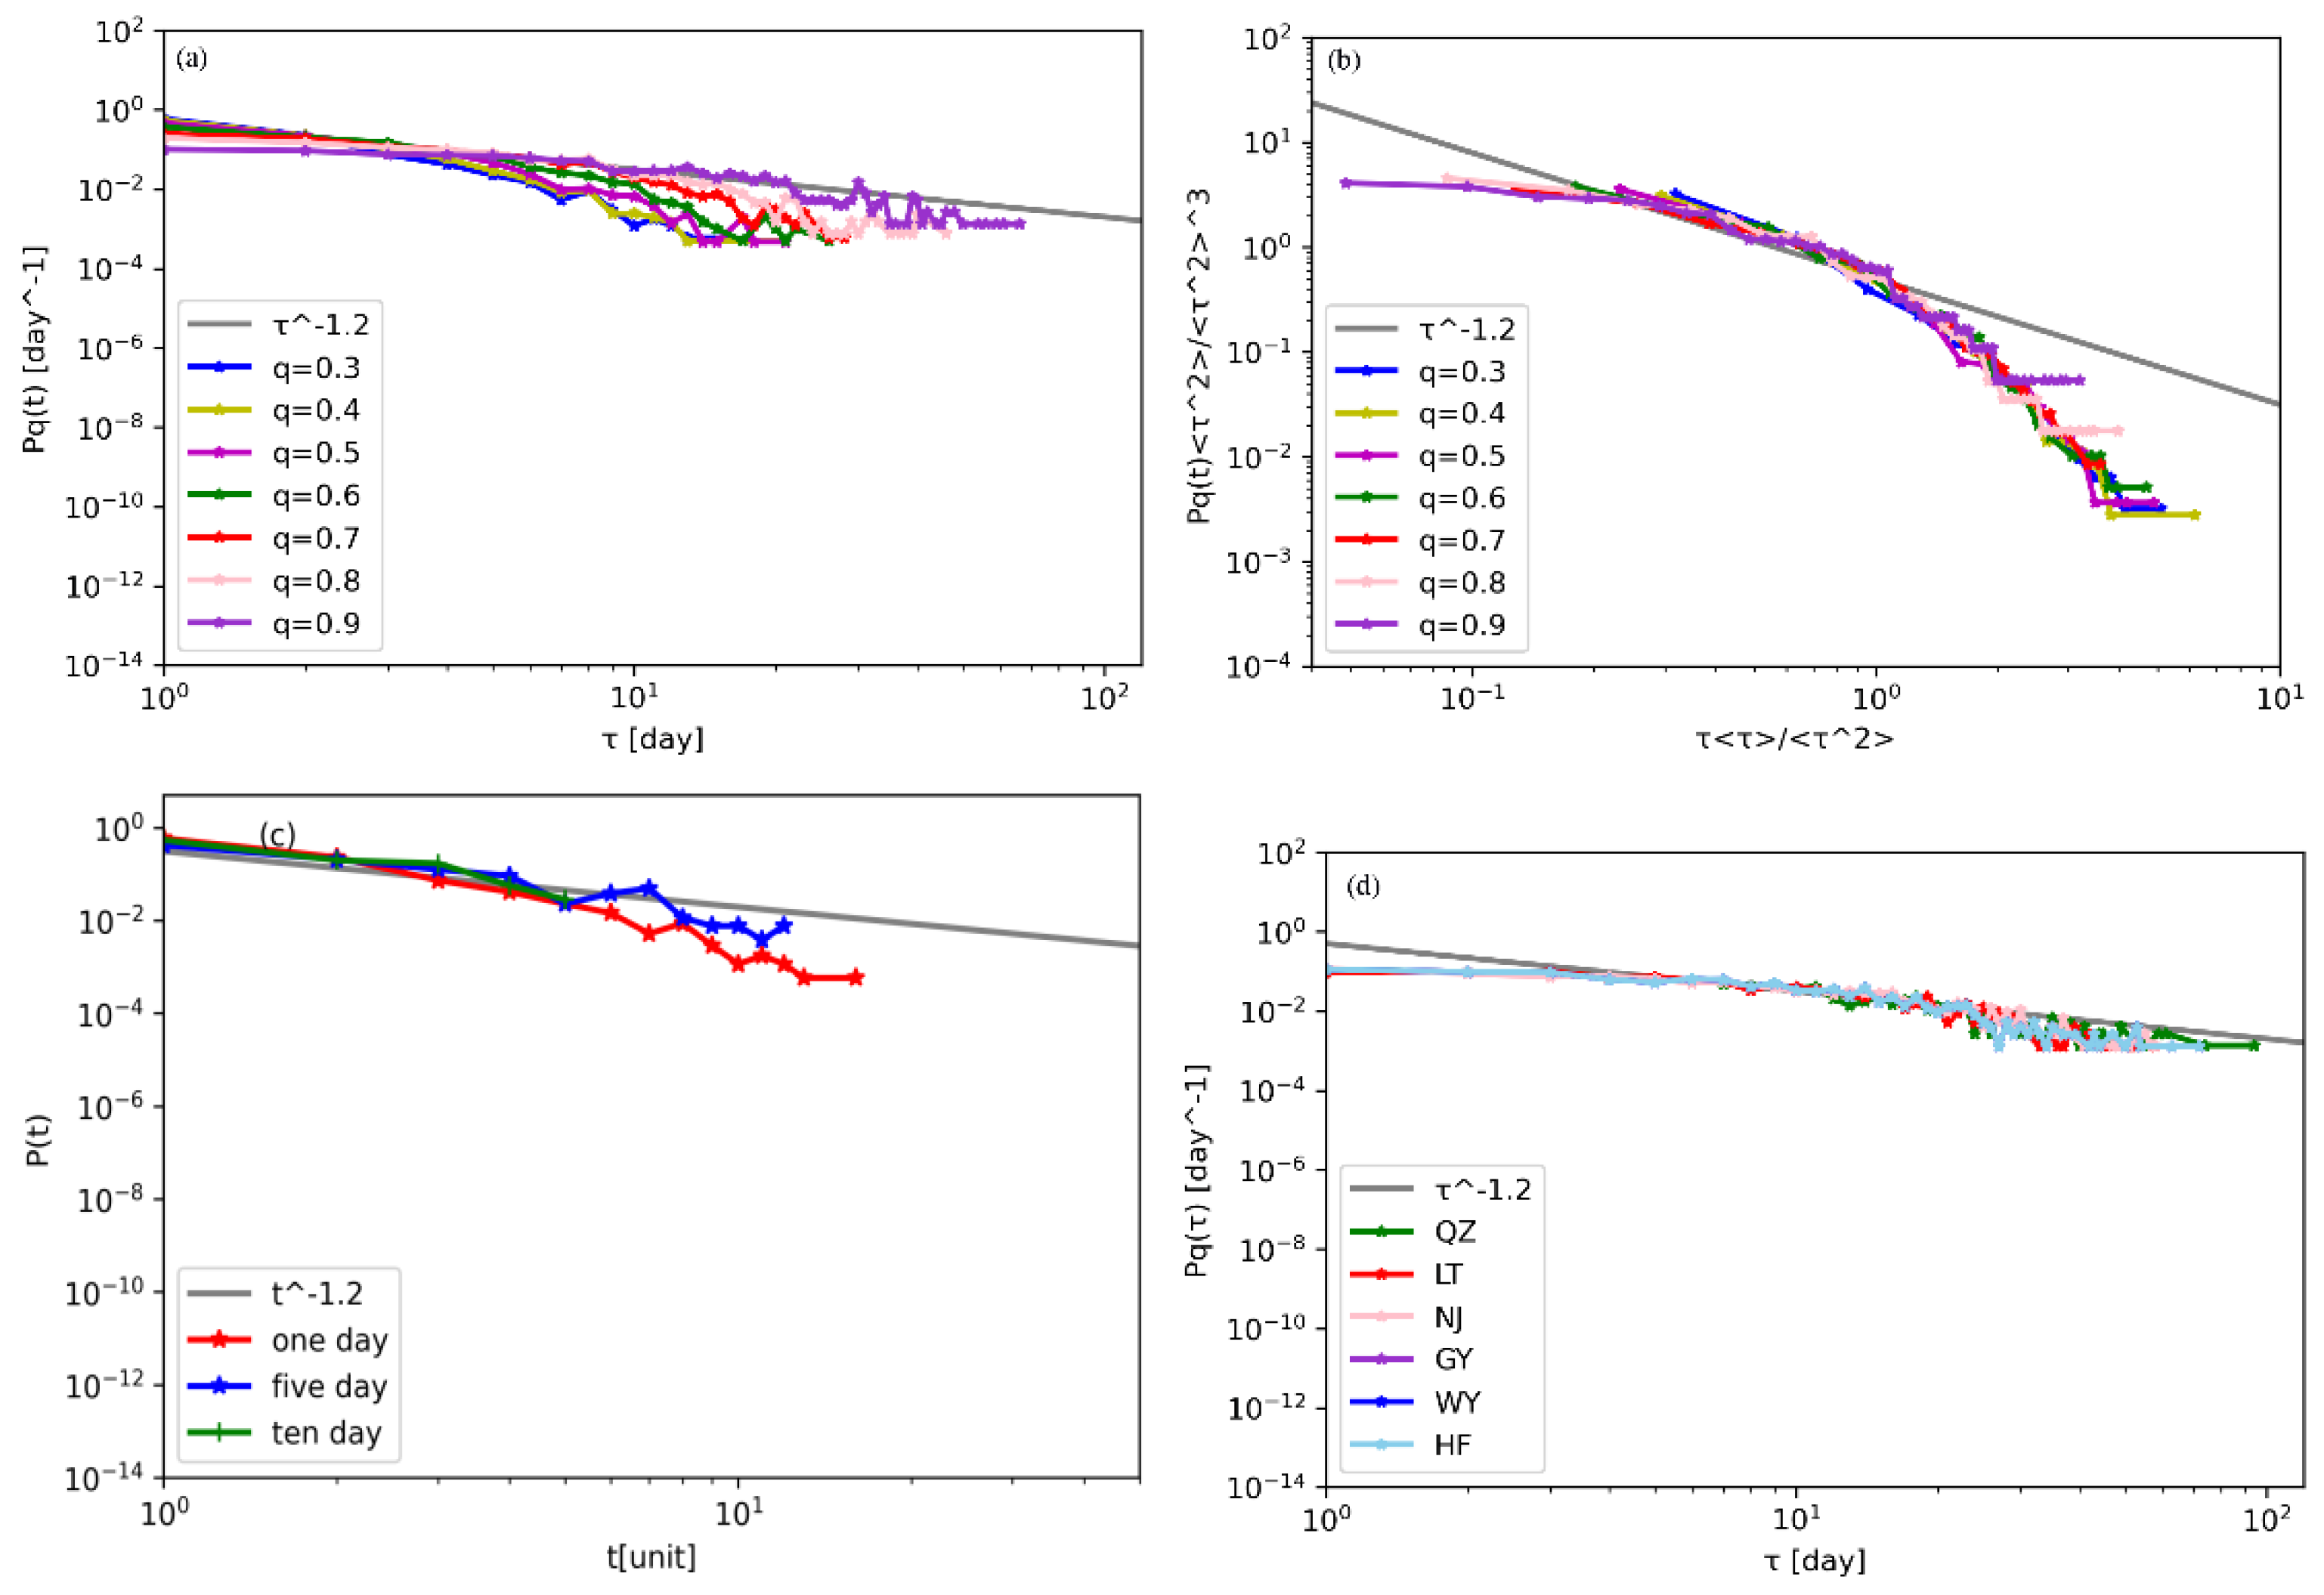
Figure 4a shows the probability density function considering the quiet time of precipitation events with different thresholds using the double-logarithmic coordinate system for Beijing Station. The fitting curve under each threshold is close to the power-law distribution with an exponent β   of 1.2. Among them, the probability density distribution of precipitation events within the 30–70 percentile thresholds is basically consistent; that is, when the threshold does not exceed the 70th percentile, the probability density distribution of quiet time has nothing to do with the threshold. Moreover, there is a faster decay at the tail, which deviates far from 1 τ 1.2 . This result may be caused by the finiteness of the length of the time series. For extreme precipitation events with a threshold exceeding the 70th percentile, the probability density functions agree with the power-law function. In the tail part, there is also a faster decay. However, the decay is obviously weakened. These results are consistent with the previous assumption that the occurrence of extreme precipitation events conforms to the collapse characteristics of the self-organized critical model. Once the quiet time follows a power-law distribution, its probability density function can be represented by a scale law independent of the threshold, as shown in Equation (4):
P q ( τ ) 1 τ β f 0 ( τ / a )
where a is the scale parameter related to percentile threshold q and f 0 is the scale equation. f 0 is constant when τ is small; otherwise, it corresponds to a fast decay or exponential equation. When it is around the critical point or it is independent of the length of the time series, a is divergent,   f 0 tends to be constant, P q ( τ ) is a power-law distribution, and β is the true critical exponent. For   1 < β < 2 , τ a 2 β , τ 2 a 3 β , and a τ 2 / τ ,   a β τ 2 2 / τ 3 . Therefore, the axes in Figure 4a can be rescaled [38,41] so that quiet time is dimensionless, as shown in Figure 4b. The probability density functions of quiet time in precipitation events with different thresholds are very similar without the influence of the length of the time series. This finding theoretically demonstrates the scale-free property. Figure 4c shows that the probability density distributions of quiet time are also similar with three different time scales (day, pentad and ten-day periods) of the precipitation events with 30 percentile thresholds. This finding further shows the precipitation event time scale-free property. In addition, six observation stations distributed in different regions of eastern China are selected. Nanjing (NJ), Wanyuan (WY) and Hefei (HF) are at approximately the same latitude. Quzhou (QZ), Leting (LT) and Ganyu (GY) are at approximately the same longitude. The probability density functions in different regions also follow power-law distributions with β 1.2 nearby (Figure 4d). This finding shows the spatial scale-free property of precipitation events. All the results are consistent with the assumption that precipitation is a real-world example of self-organized criticality.
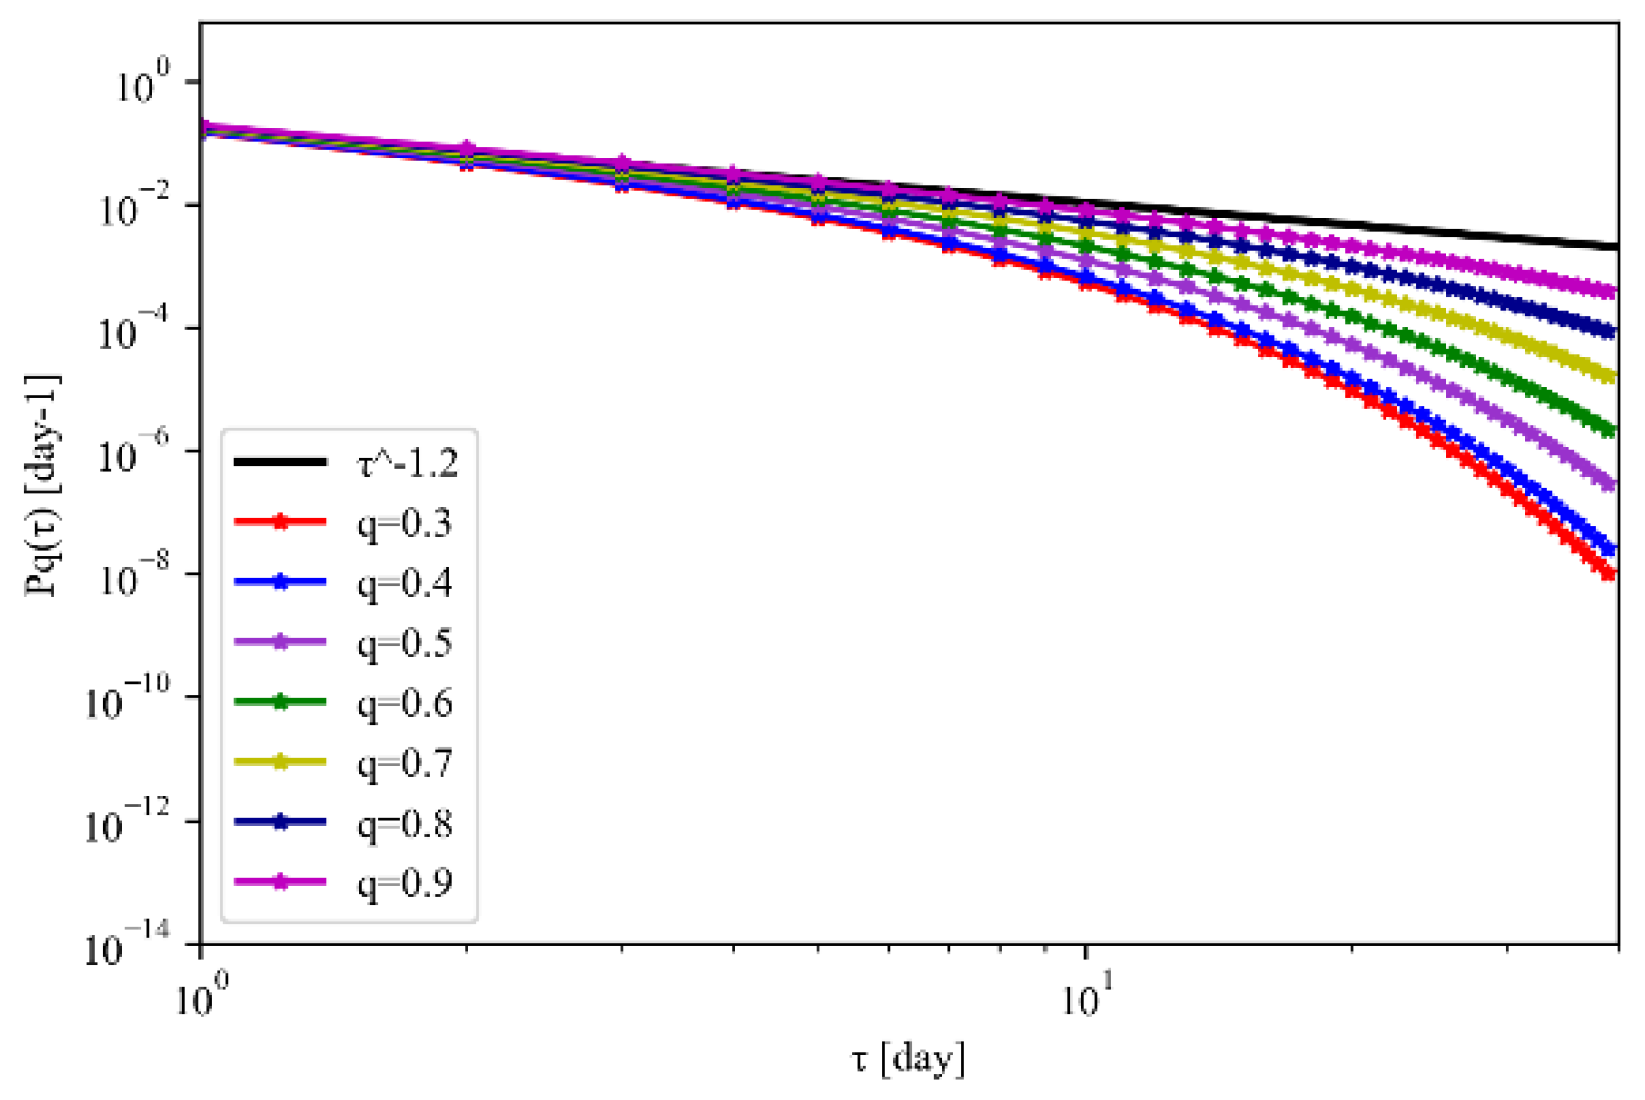
The simulation of the formation and characteristics of the self-organization critical state is studied with a sandpile model. The specific distribution of the quiet time in the model can be described with the first-order approximation of Γ distribution Equation (5) [42,43]. For m 0 , it is the minimum quiet time of the distribution, and γ is the scale parameter, where if m = 0 ,   γ > 0 , and if m > 0 , < γ < + , and a is the scale parameter greater than zero (increasing with threshold). The standard parameter Γ ( γ , m a ) is a high-order incomplete Γ distribution determined by   Γ ( γ , z ) = z x γ 1 e x d x . Through the parameterization, the exponent β = 1 γ of the power-law distribution can be determined. Thus, the theoretical probability density of quiet time Equation (6) for precipitation events can be obtained as shown in Figure 5. Compared with Figure 4a, the theoretical characteristics of the probability density distribution of quiet time are consistent. For the low percentile threshold, there is rapid decay in the tail, while the distribution pattern is close to the power-law distribution function with a high percentile threshold. Therefore, the above results provide a certain theoretical foundation for the predictability of precipitation.
1 Γ ( γ , m a ) { 1 / Γ ( γ ) ,                     γ > 0   γ ( m a ) γ ,                 γ < 0
P q ( τ ) = 1 a Γ ( γ , m a ) ( a τ ) 1 γ e τ / a

4. Practical Application of Self-Organized Critical Precipitation Events

4.1. Variables β and τ ¯ q

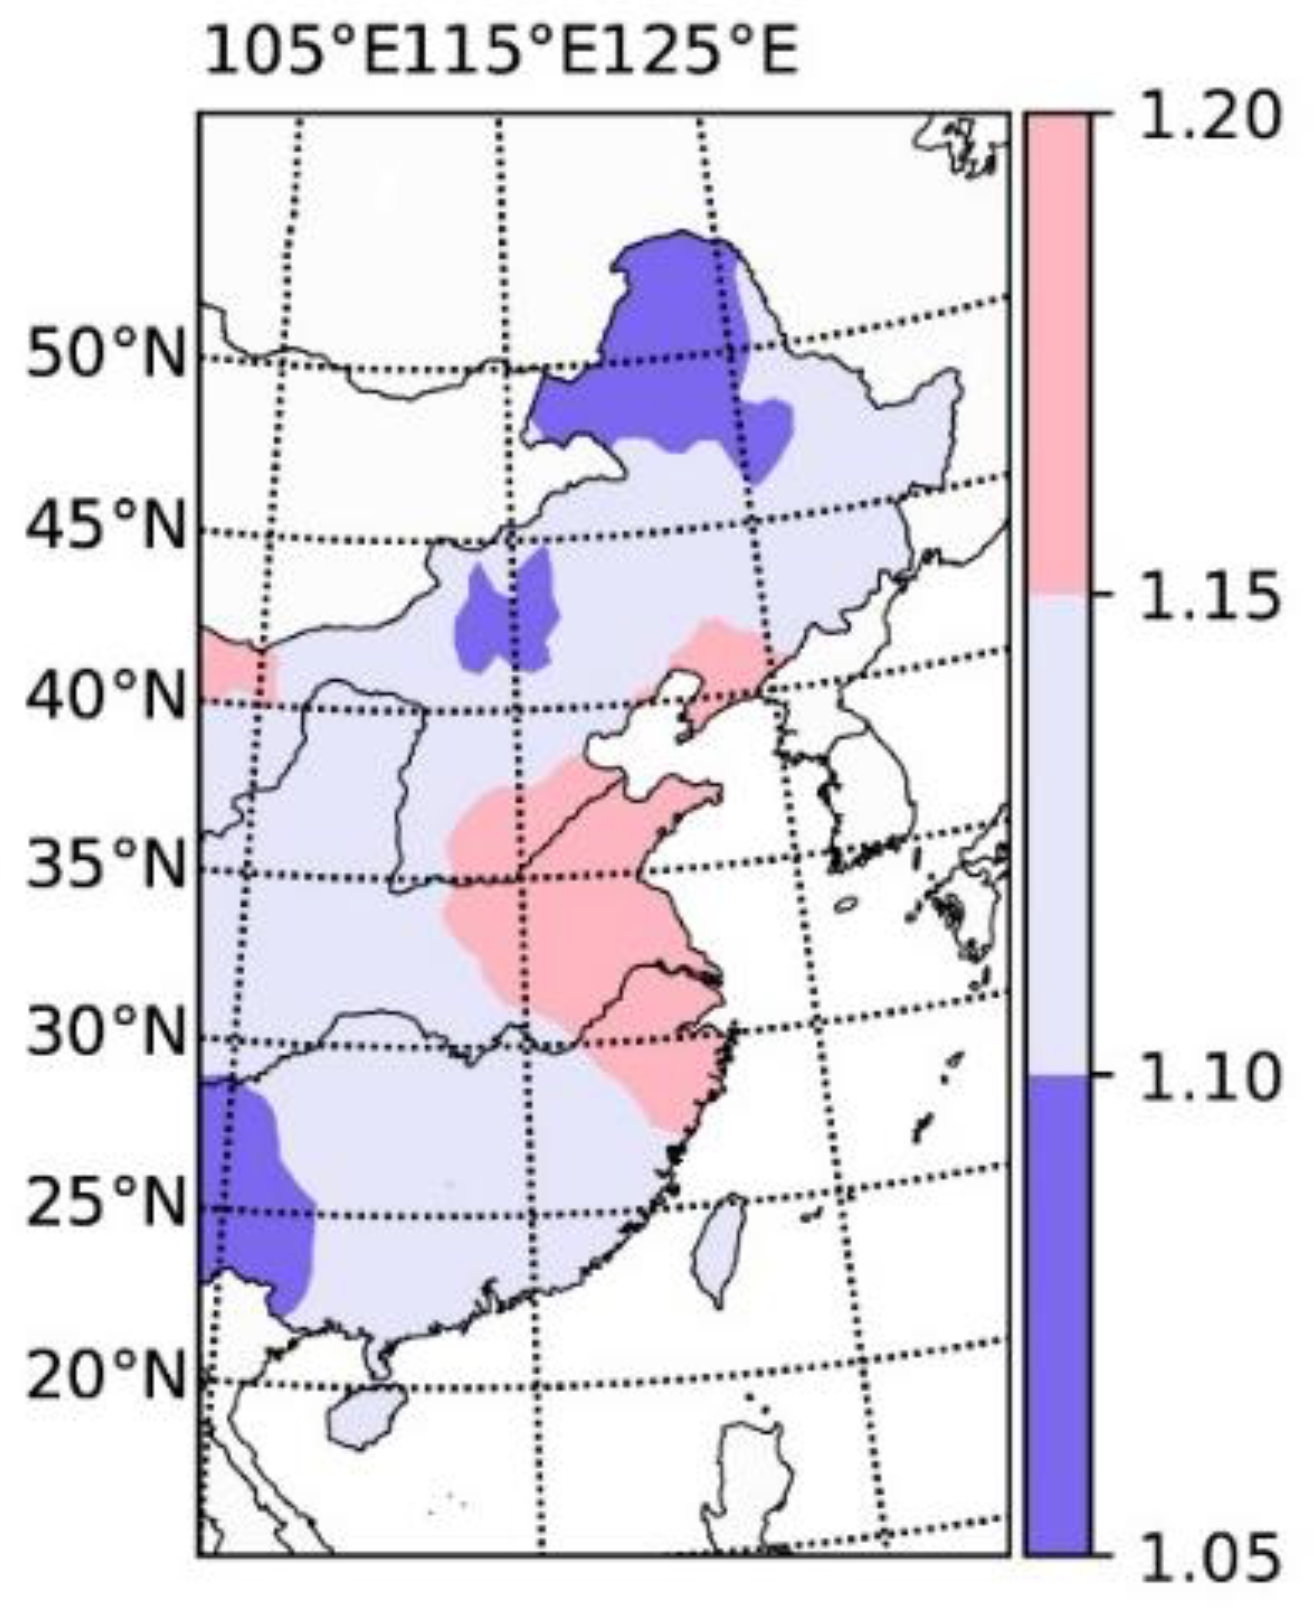
The precipitation quiet time with different thresholds follows a power-law distribution and scale-free characteristics. To obtain the full view, the data of other stations in eastern China are similarly explored. Figure 6 shows the spatial distribution of the mean power-law exponent β for the probability density of precipitation quiet time data with different thresholds. β changes from 1.05 to 1.20 (scale-free features are also consistent, and details are not given here). The larger β, the faster P q ( τ ) decays, and the slope β   of P q ( τ )   in the double-logarithmic coordinate system is smaller. For the same probability, the larger β, the smaller τ is and the clustering of precipitation is stronger. That means precipitation events occur more easily. As shown in Figure 6, the regions with high values are mainly concentrated in the Changjiang-Huaihe River basin, indicating that precipitation events more easily occur in clusters. Therefore, these regions are sensitive to precipitation events and deserve more attention. In fact, precipitation in these areas has shown a significant increasing trend in recent years [11,12,44,45]. In particular, these areas are located in the economically developed Yangtze River Delta area and become very concentrated in flood season precipitation forecasts. The regions with low β values were mainly concentrated in central Inner Mongolia and northeast and southwest China, where precipitation events do not easily occur.
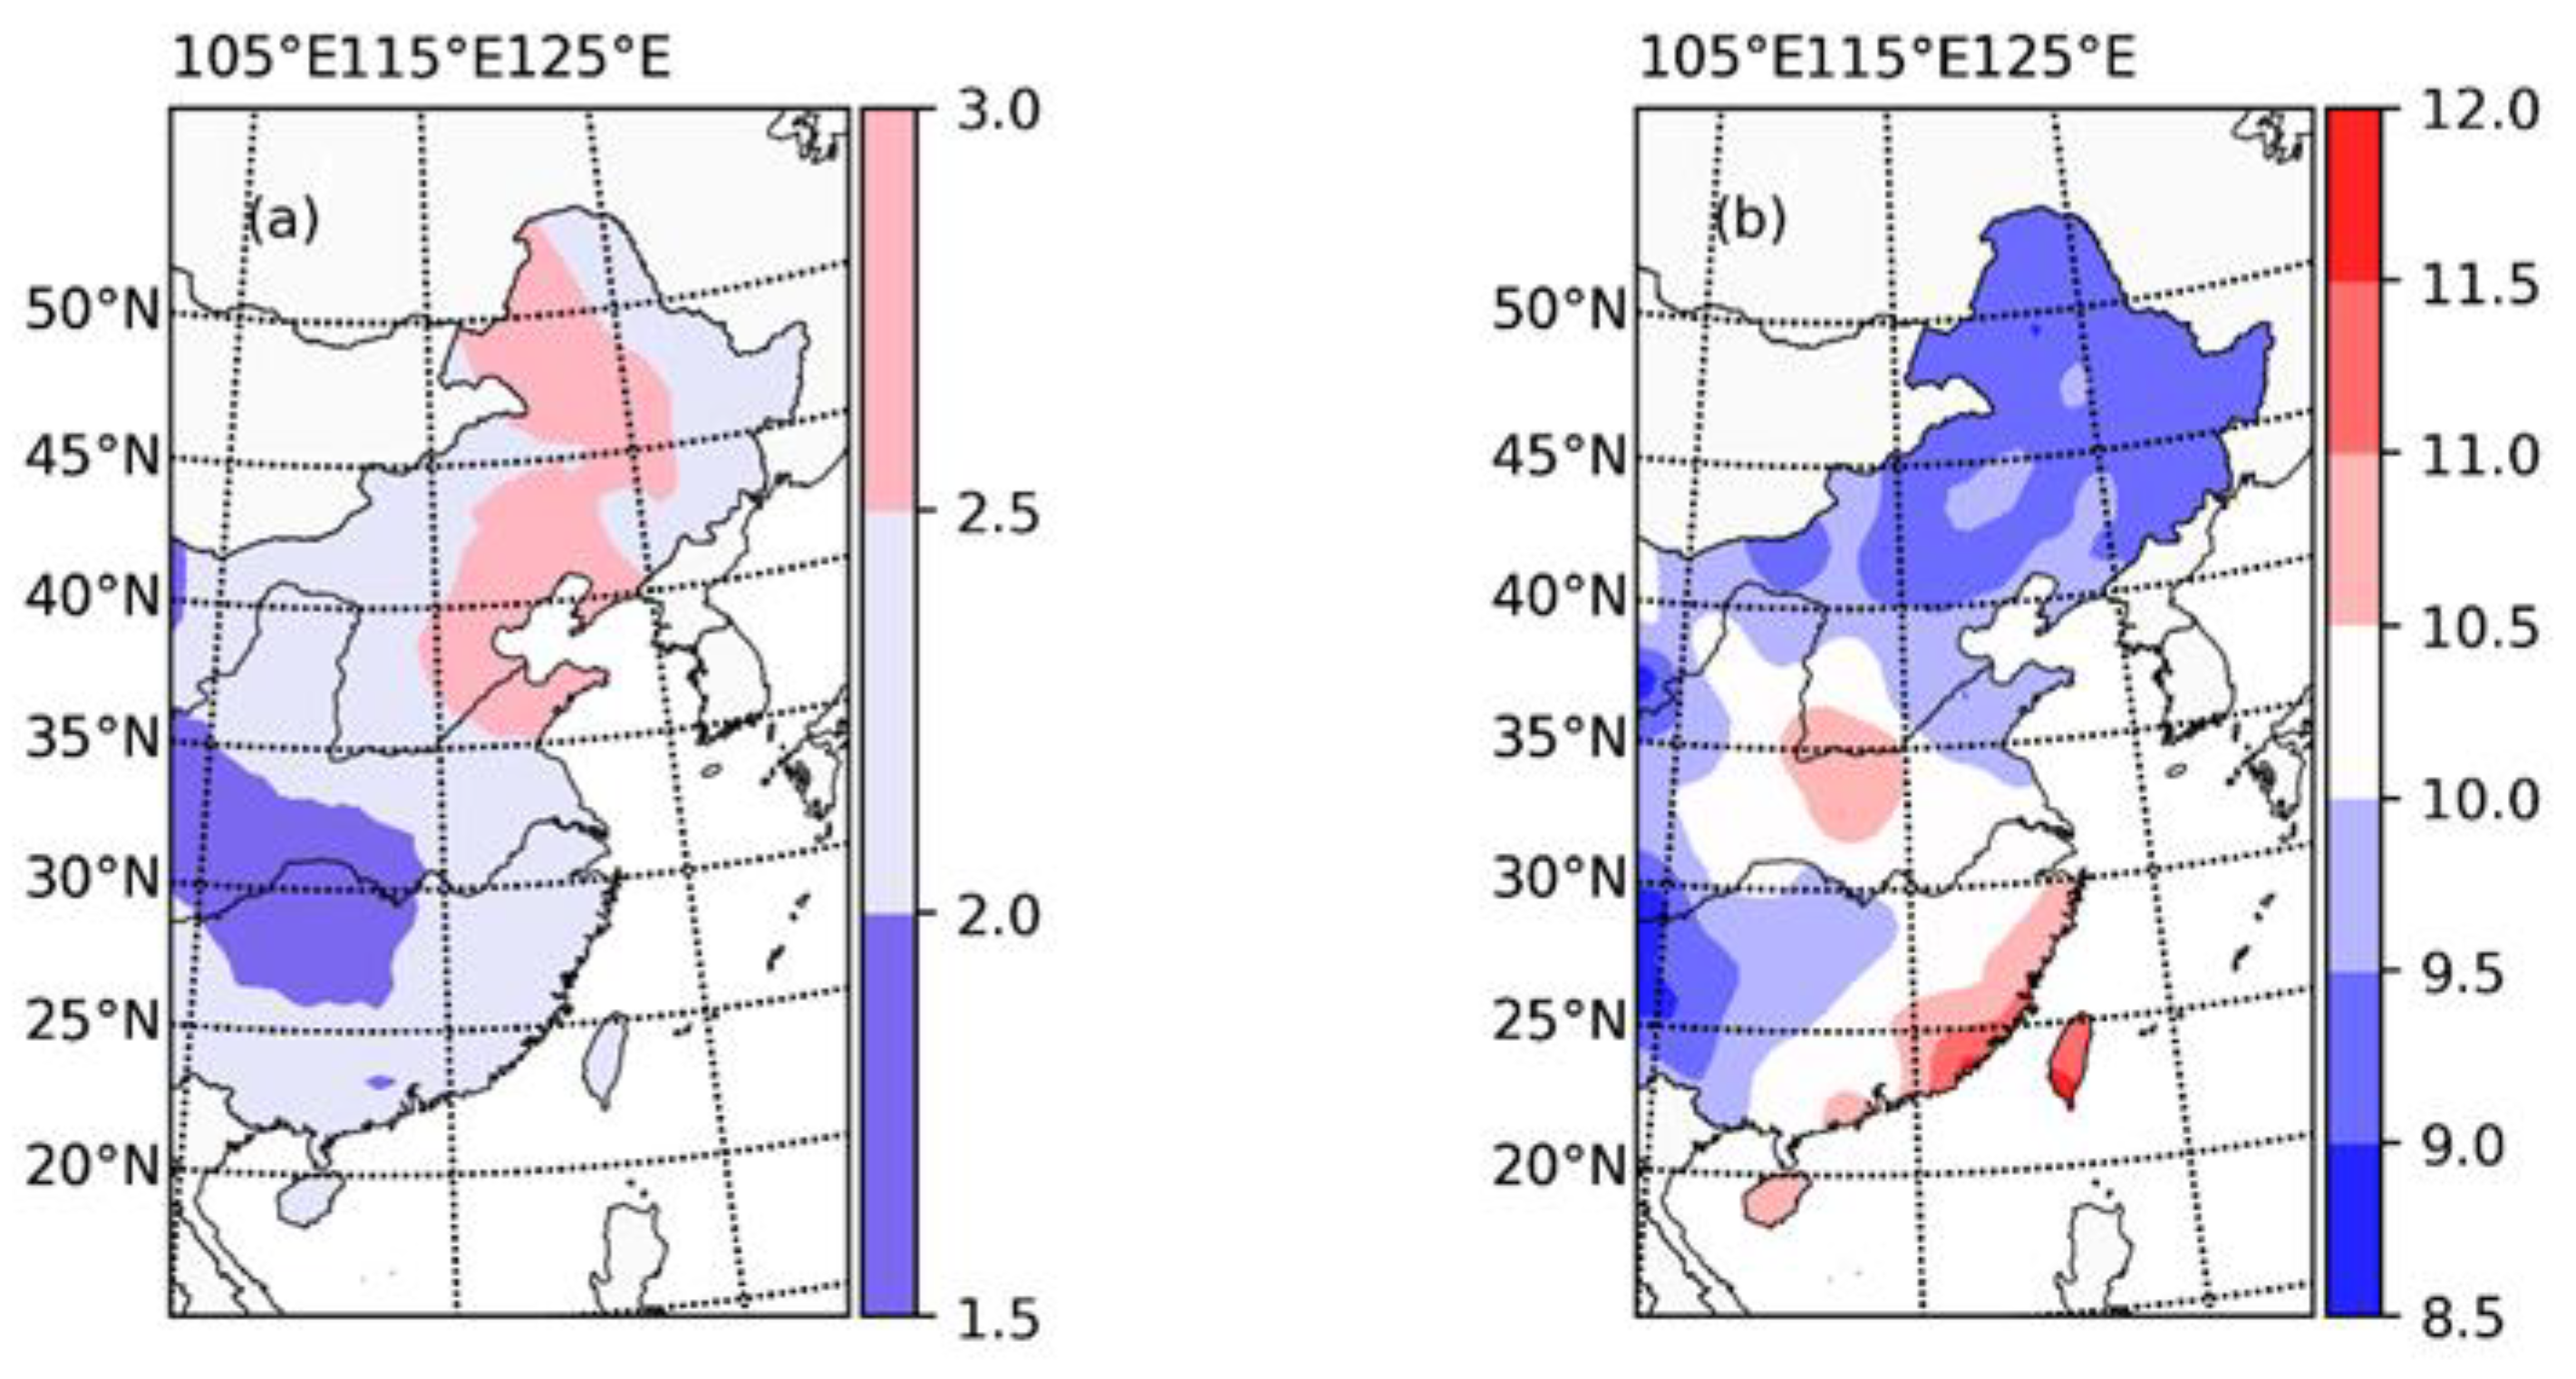
According to Equation (2), τ ¯ q demonstrates that q-percentile precipitation events easily occur. Then, the distribution of τ ¯ q can show the clustering characteristics of precipitation events (Figure 7). The above analytical results (Figure 4a) indicate that quiet time PDFs for 30–70 percentile precipitation events are consistent, while quiet time PDFs for extreme precipitation events exceeding the 70th percentile are closer to the power-law distribution. Therefore, defining 30-percentile precipitation events is representative of usual intensity precipitation events (UPEs), and 90-percentile precipitation events are extreme intensity precipitation events (EPEs). UPEs easily occur and cluster mainly in the middle Yangtze River basin, east of the Sichuan Province and north of the Gansu Province in approximately 1.5–2.0-day intervals (Figure 7a). UPEs are relatively concentrated in these regions. In these regions, UPEs are common. The high-value regions of UPEs are mainly in eastern Inner Mongolia, the Liaoning Province and the Shandong Province, which indicates that UPEs are relatively sporadic. However, the τ ¯ q of EPEs is high in the south and low in the north. Rainy season in south China begins early and ends late, which could result in EPEs being relatively dispersed. In north China, EPEs more easily occur in the rainy season. EPEs in the north are usually affected by northeastern cold vortices, whose life cycles are 5–7 days. This phenomenon may cause strong clustering in the north [46,47,48].

4.2. Warning Information for Precipitation Events Based on the Hazard Function

Considering that the conventional precursory pattern-recognition method requires a large amount of data and cannot capture long-term clustering [49,50,51], we use hazard function H q to study the probability prediction of precipitation events. The hazard function is sensitive to both clustering and repelling of events. Equation (7) gives the probability per unit time that the quiet time for events defined by a threshold given by percentile q terminates between t w and t w + d t w , given that it has exceeded t w .
H q ( t w ) d t w = t w t w + d t w P q ( τ ) d τ t w P q ( τ ) d τ = P q ( t w ) d t w S q ( t w )
S q = t w P q (   τ ) d τ
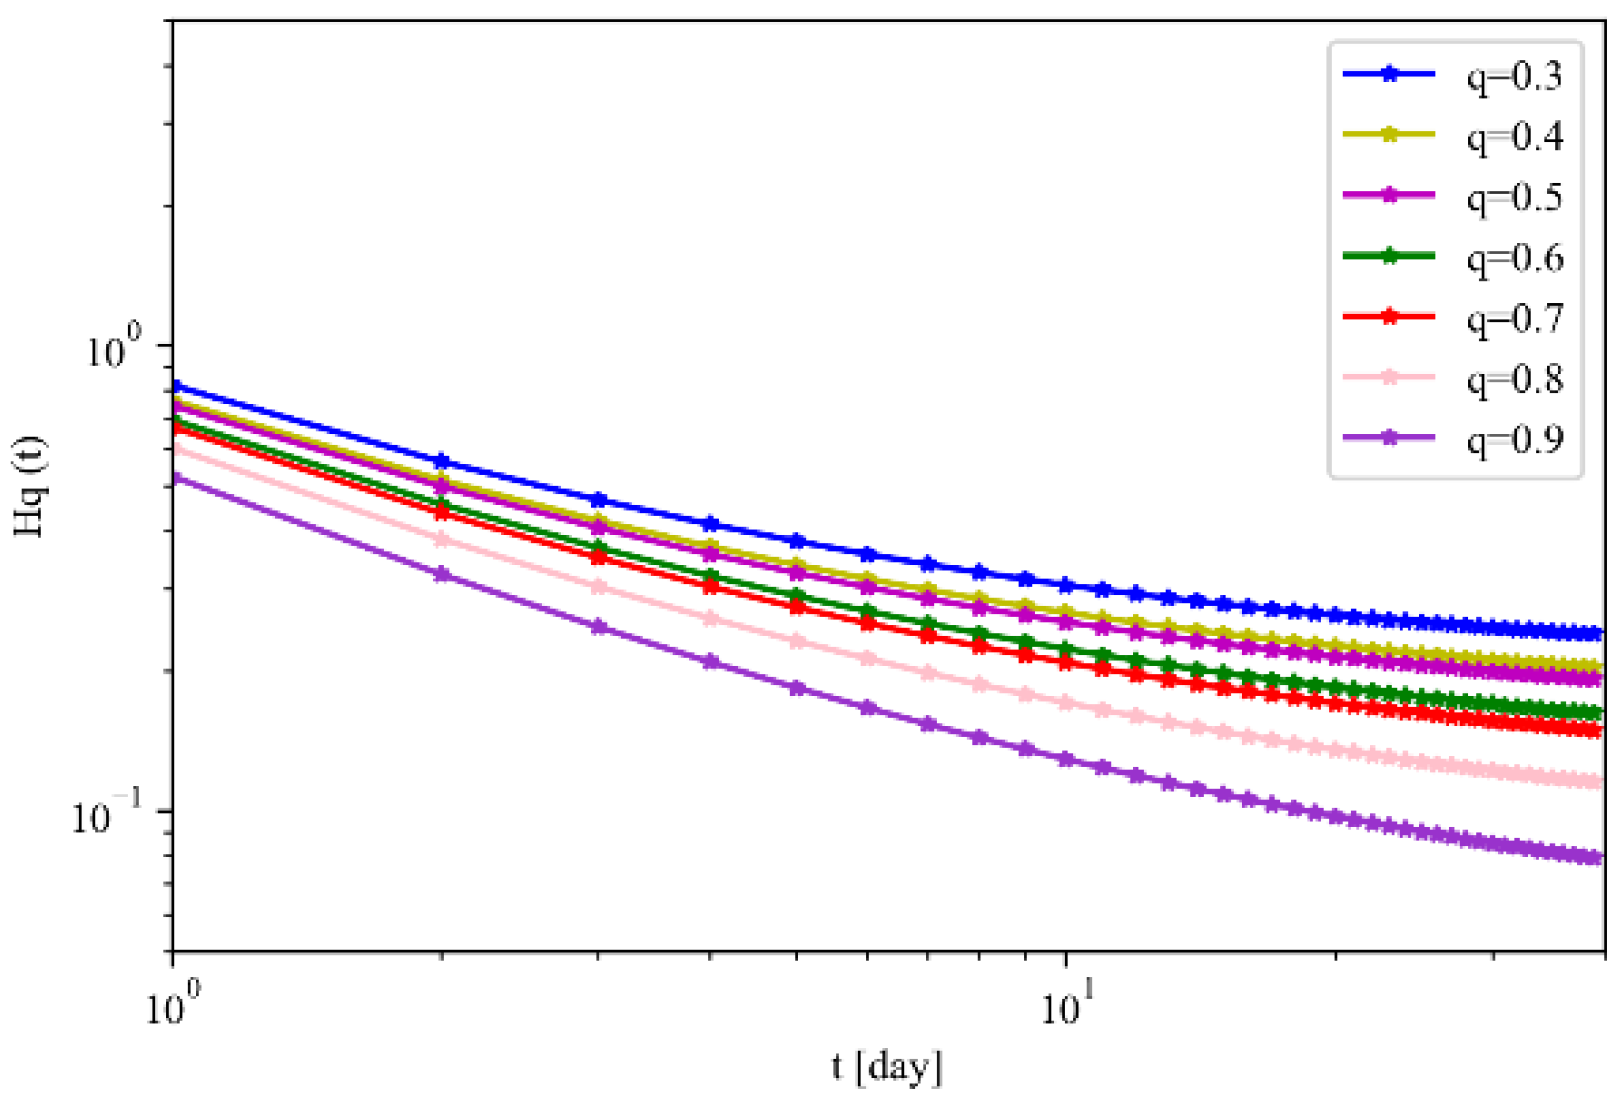
where S q is the survivor function [52], the probability that the quiet time is greater than   t w . The hazard function can be constructed numerically via the quiet time PDF and the survivor function. H q gives a probabilistic forecast; then, we only give the warning information with a hazard function, and here predictive quality assessment is not involved. Quiet time means the duration of silence between two adjacent events; once quiet time terminates, the event will occur. Therefore, the value H q shows the probability per unit time of a given q-percentile precipitation event occurring after the silence ends. Figure 8 gives the hazard function for quiet times H q of Beijing station precipitation for different thresholds. For the same t w , the more extreme the event is, the less likely it is to occur in the next time, i.e., normal events are more likely to occur; for the same H q in which an event is expected in the next unit time, the more extreme the event is, the shorter the quiet time is. According to the instruction significance, the probability of breaking the silence and the precipitation event occurring can be obtained in eastern China in the current climate.
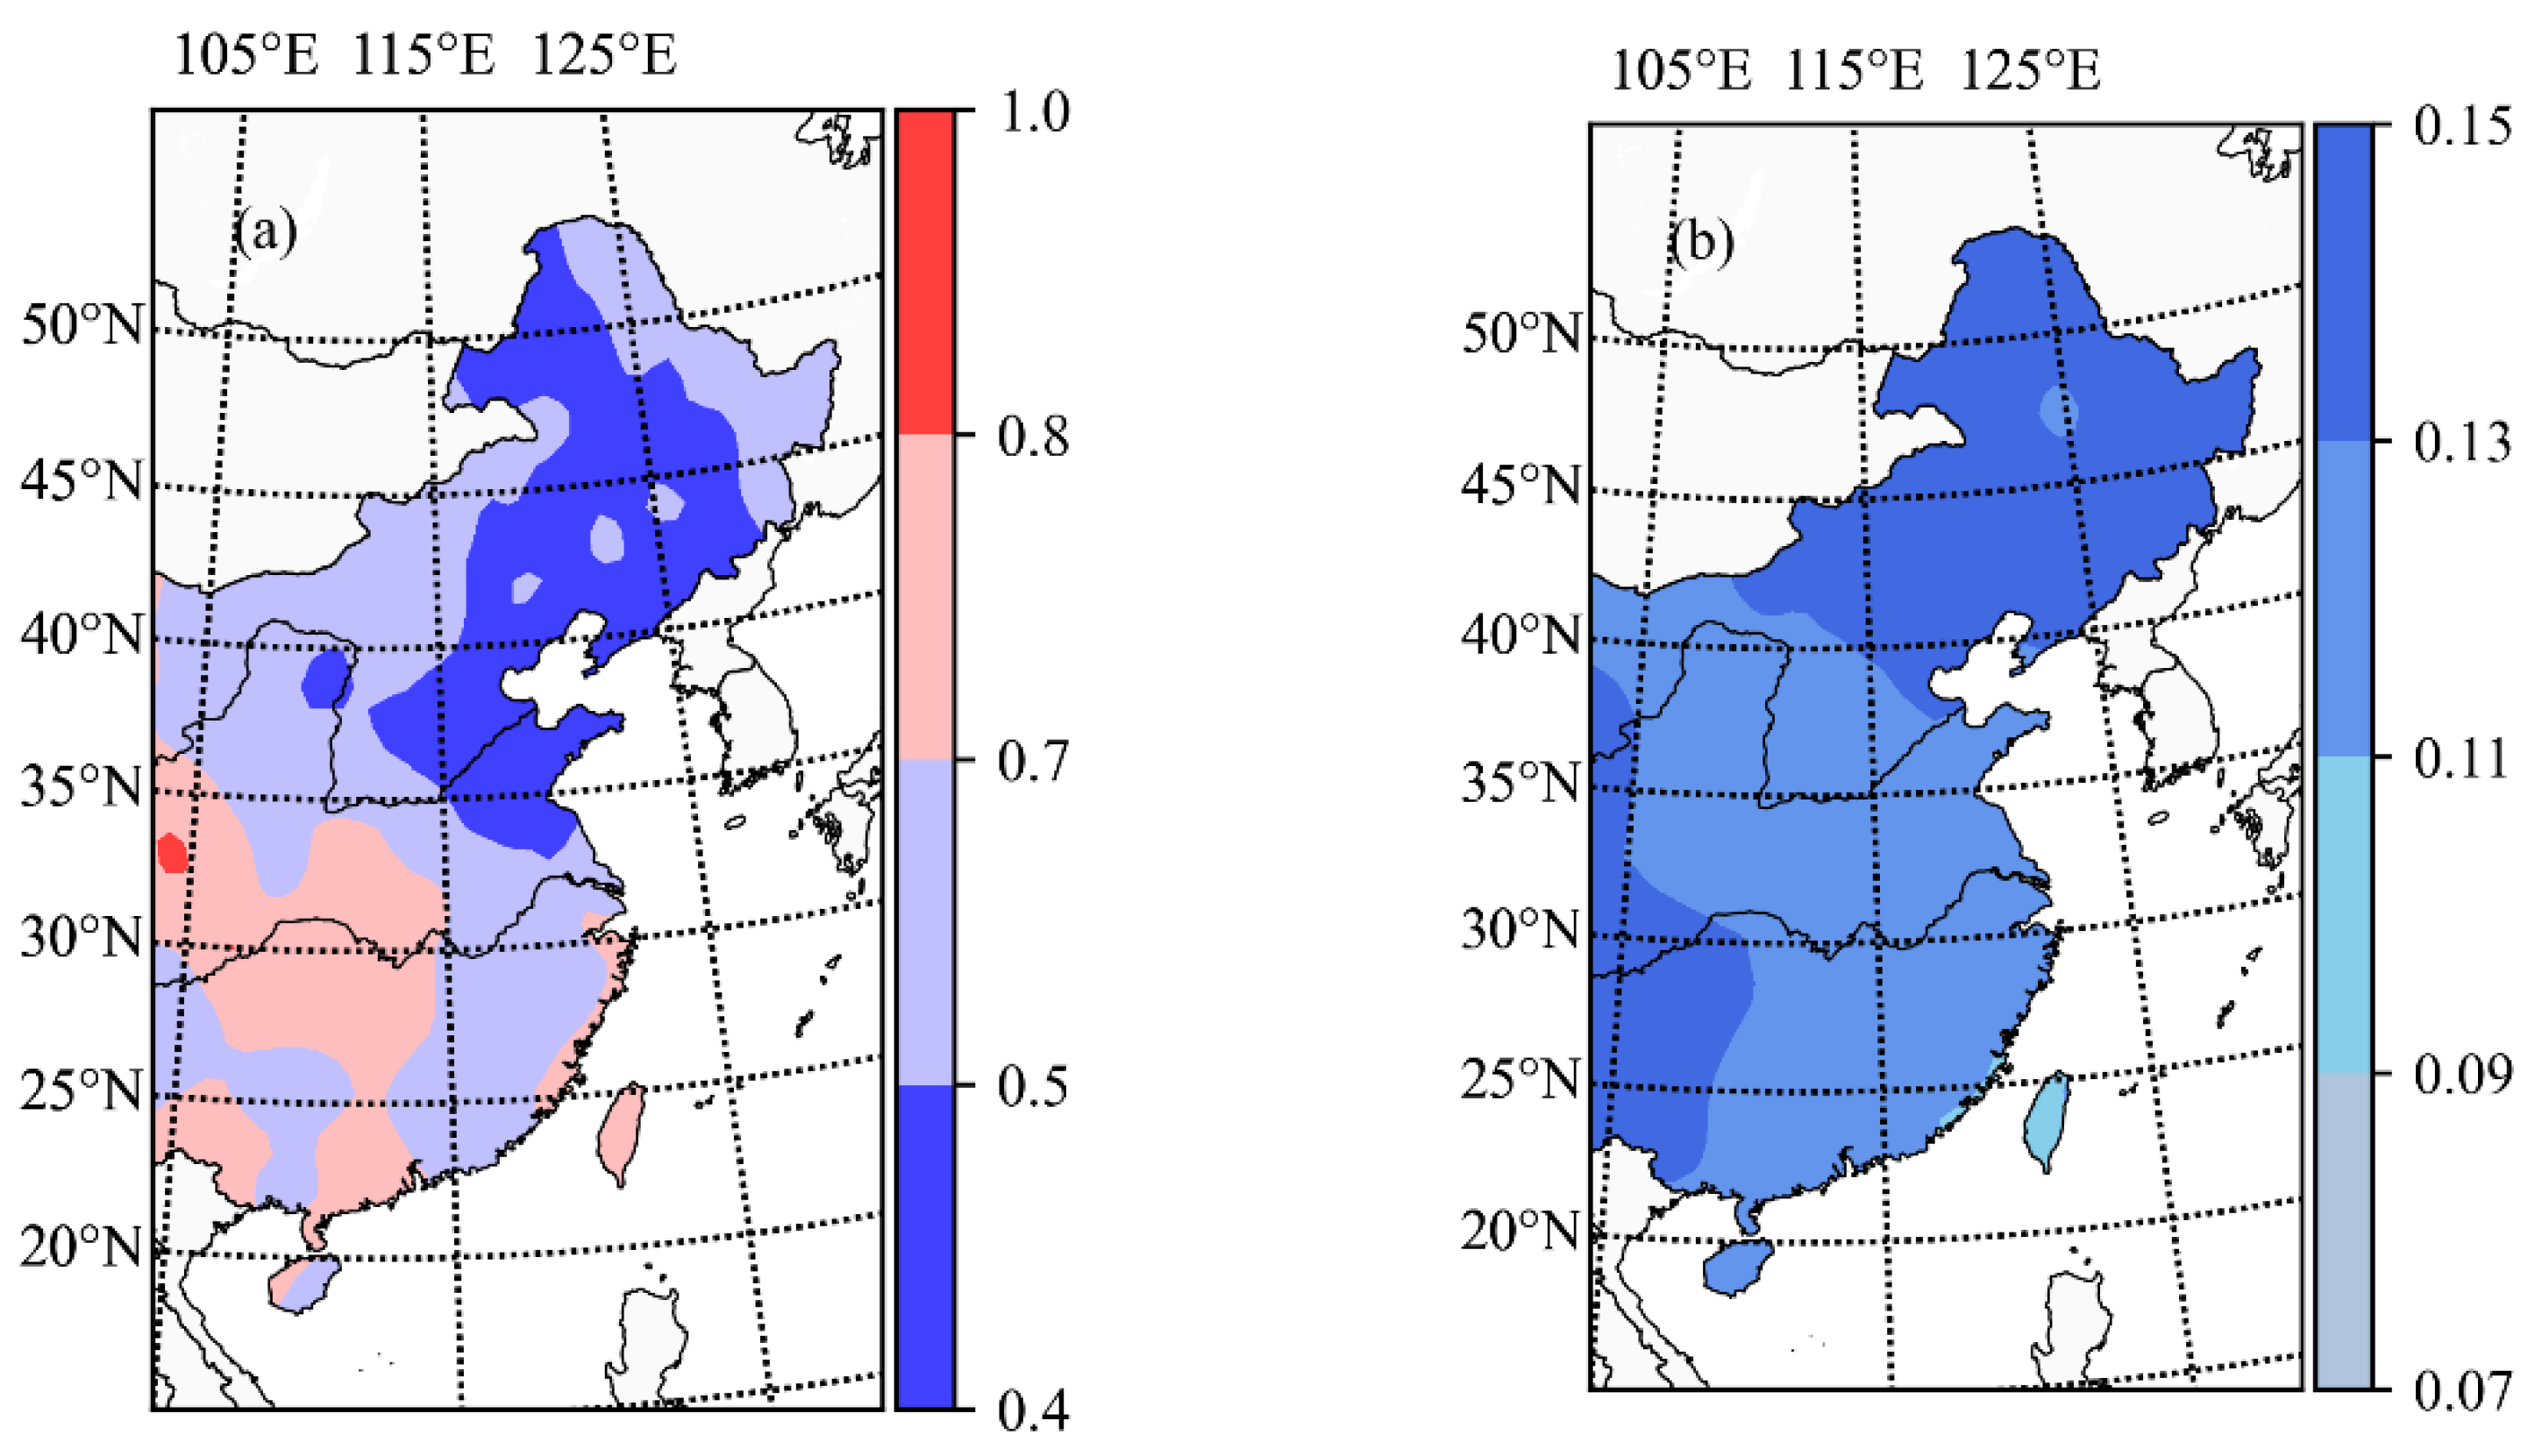
For different intensities of precipitation events, if the quiet time is the mean quiet time τ ¯ q   in the current climate, according to H q , we can obtain the occurring probability, which can give some warning information about the coming precipitation events. Figure 8 shows the occurrence probability of precipitation events. As shown in Figure 9a, for UPEs, the large-probability regions are mainly in the Hubei Province and the Hunan Province, where the usual precipitation events are more likely to occur at the next time. The low-probability regions are mainly in the Huanghuai Basin, North China and Northeast China, where ordinary precipitation events do not occur easily. For EPEs (Figure 7b), the east Sichuan Province, the Guizhou Province, the Guangxi Province and Northeast China are mainly the large-probability regions, where extreme events more easily occur, which is consistent with the previous analysis (Figure 7b). These regions, prone to extreme precipitation events, need more attention.

5. Conclusions and Discussion

Considering existing research work, precipitation could be a real-world example of self-organized criticality. Then, the occurrence of precipitation events is the collapse of the self-organized criticality system. Therefore, the percentile threshold method is used to detect different intensities of precipitation events of daily precipitation data from 1960 to 2017 in the rainy season in east China. The interval of the adjacent events is defined as quiet time τ , which can describe the duration of the same threshold occurrence. The probability density function of quiet time with different precipitation thresholds follows a power-law distribution and scale-free properties. For the 30–70 percentile precipitation events, quiet time PDFs are consistent and have nothing to do with the threshold, while for the 70-percentile extreme precipitation events, they are closer to the power-law distribution. Compared with the sandpile model, the Γ function describing the collapse behavior can better scale the precipitation quiet time distribution characteristics. In other words, for observation station data and low-resolution precipitation data, even in China, affected by complex weather and climate systems, precipitation is still a real-world example of self-organized criticality in synoptic scale. Because there is not enough long-time series, precipitation events on longer time scales such as month, season, year, etc., are not considered here. Subsequently, we may consider using a weather generator to get enough precipitation time series to study the nonlinear characteristics of precipitation at a longer scale.
In addition, several interesting variables involved in the analysis of precipitation self-organized criticality characteristics are used. The power-law exponent β of the probability density of precipitation quiet time indicates the clustering degree. The higher β is, the more likely a precipitation event is to occur. The Changjiang-Huaihe River basin is prone to precipitation events in the rainy season with high β. According to the analysis of different percentiles of the probability density function of quiet time, 30-percentile precipitation events are defined as UPEs, and 90-percentile precipitation events are EPEs. Combined with the indicative meaning of the value τ ¯ q , which means q-percentile precipitation events easily occur, the middle Yangtze River basin, east of the Sichuan Province and north of the Gansu Province are known areas in which UPEs easily occur. In addition, the northern area more easily generates EPEs. The prediction of precipitation events based on hazard functions is also studied. The Sichuan Province, the Hubei Province and the Hunan Province are highly likely to experience UPEs in the next mean quiet time. The Sichuan Province, the Guizhou Province and Northeast China are more likely to have EPEs.
Precipitation is a synergistic result of different spatial-temporal nonlinear systems, and understanding its dynamics and mechanisms is a complex and long-term process. Here, only the self-organized criticality characteristics of precipitation events in synoptic scale are briefly analyzed. Furthermore, how do the interdecadal changes over time affect the clustering features of precipitation events? How do extra-forcing signals affect precipitation clustering? These are research questions we will continue to address.

Author Contributions

Z.Q. and Q.Z. contributed to conception and design of the study. L.W. and Y.X. organized the database. Z.Q. and Q.Z. wrote the first draft of the manuscript. All authors have read and agreed to the published version of the manuscript.

Funding

This research was funded by the National Key Research and Development Program of China (Grant no. 2017YFC1502305), National Natural Science Foundation of China (Grant No. 41975062, 41675050).

Institutional Review Board Statement

Not applicable.

Informed Consent Statement

Not applicable.

Data Availability Statement

The daily precipitation data of international exchange stations in China was analyzed in this study. This dataset can be found at the following link: http://data.cma.cn/dataService/cdcindex/datacode/A.0013.0001/showvalue/normal.html accessed on 31 May 2022.

Conflicts of Interest

The authors declare no conflict of interest.

References

  1. Wang, L.-C.; Wu, J.-T.; Lee, T.-Q.; Lee, P.-F.; Chen, S.-H. Climate changes inferred from integrated multi-site pollen data in northern Taiwan. J. Southeast Asian Earth Sci. 2011, 40, 1164–1170. [Google Scholar] [CrossRef]
  2. Pryor, S.C.; Howe, J.A.; Kunkel, K.E. How spatially coherent and statistically robust are temporal changes in extreme precipitation in the contiguous USA? Int. J. Climatol. 2009, 29, 31–45. [Google Scholar] [CrossRef]
  3. Trenberth, K.E. Atmospheric Moisture Residence Times and Cycling: Implications for Rainfall Rates and Climate Change. Clim. Chang. 1998, 39, 667–694. [Google Scholar] [CrossRef]
  4. Bao, M.; Huang, R.H. Characteristics of the Interdecadal Variations of Heavy Rain over China in the Last 40 Years Chinese. J. Atmos. Sci. 2006, 30, 1057–1067. (In Chinese) [Google Scholar]
  5. Contractor, S.; Donat, M.G.; Alexander, L.V. Changes in Observed Daily Precipitation over Global Land Areas since. J. Clim. 2021, 34, 3–19. [Google Scholar] [CrossRef]
  6. Zhao, J.H.; Feng, G.L.; Yang, J.; Zhi, R.; Wang, Q.G. Analysis of the distribution of the large-scale drought/flood of summer in China under different types of the western Pacific subtropical high. Acta. Meteor. Sinica. 2012, 70, 1021–1031. (In Chinese) [Google Scholar]
  7. He, B.-R.; Zhai, P.-M. Changes in persistent and non-persistent extreme precipitation in China from 1961 to 2016. Adv. Clim. Chang. Res. 2018, 9, 177–184. [Google Scholar] [CrossRef]
  8. He, J.H.; Wu, Z.W.; Jiang, Z.H. “Climate effect”of the northeast cold vortex and its influences on Meiyu. Chin. Sci. Bull. 2006, 51, 2803–2809. (In Chinese) [Google Scholar] [CrossRef]
  9. Shi, N.; Huang, X.X.; Yang, Y. Temporal and spatial characteristics of the trend of global precipitation annual precipitation field from 1948 to 2000. Chin. J. Atmos. Sci. 2003, 27, 971–982. (In Chinese) [Google Scholar]
  10. Zhang, Q.Y.; Lv, J.M.; Yang, L.M. The interdecadal variation of precipitation pattern over China during summer and its relationship with the atmospheric internal dynamic processes and extra-forcing factors. Chin. J. Atmos. Sci. 2007, 31, 1290–1300. (in Chinese). [Google Scholar]
  11. Song, Y.; Achberger, C.; Linderholm, H. Rain-season trends in precipitation and their effect in different climate regions of China during 1961–2008. Environ. Res. Lett. 2011, 6, 1481–1484. [Google Scholar] [CrossRef] [Green Version]
  12. Jin, W.X.; Sun, C.H.; Zuo, J.Q.; Li, W.J. Spatiotemporal Characteristics of Summer Precipitation with Different Durations in Central East China. Clim. Environ. Res. 2015, 20, 465–467. (In Chinese) [Google Scholar]
  13. Duan, L.; Zheng, J.; Li, W.; Liu, T.; Luo, Y. Multivariate properties of extreme precipitation events in the Pearl River basin, China: Magnitude, frequency, timing, and related causes. Hydrol. Process. 2017, 31, 3662–3671. [Google Scholar] [CrossRef]
  14. Rho, H.; Kim, J.H. Modelling the entire range of daily precipitation using phase-type distributions. Adv. Water Resour. 2018, 123, 210–224. [Google Scholar] [CrossRef]
  15. Arneodo, A.; Bacry, E.; Graves, P.V.; Muzy, J.F. Characterizing Long-Range Correlations in DNA Sequences from Wavelet Analysis. Phys. Rev. Lett. 1995, 74, 3293–3296. [Google Scholar] [CrossRef] [Green Version]
  16. Fisher, R.A.; Tippett, L.H.C. Limiting forms of the frequency distribution of the largest or smallest member of a sample. Math. Proc. Camb. Philos. Soc. 1928, 24, 180–190. [Google Scholar] [CrossRef]
  17. He, W.P.; Feng, G.L.; Wu, Q.; Wan, S.Q.; Chou, J.F. A new method for abrupt change detection in dynamic structures. Nonlinear Process. Geophys. 2008, 15, 601–606. [Google Scholar] [CrossRef]
  18. Gong, Z.Q.; Feng, G.L.; Wan, S.Q.; Li, J.P. Analysis of features of climate change of Huabei area and the global climate change based on heuristic segmentation algorithm. Acta Phys. Sin. 2006, 55, 477–484. [Google Scholar] [CrossRef]
  19. Feng, G.-L.; Gong, Z.-Q.; Zhi, R.; Zhang, D.-Q. Analysis of precipitation characteristics of South and North China based on the power-law tail exponents. Chin. Phys. B. 2008, 17, 2745–2752. [Google Scholar]
  20. Feng, G.L.; Gong, Z.Q.; Dong, W.J. Li, J.P. Research on Climate Mutation Detection Based on Heuristic Segmentation Algorithm. Acta Phys. Sin. 2005, 54, 5494–5499. [Google Scholar] [CrossRef]
  21. Wang, Q.G.; Zhi, R.; Zhang, Z.P. The Preliminary Analysis of the Procedures of Extracting Predicable Components in Numerical Model of Lorenz System. Acta Phys. Sin. 2008, 57, 5343–5350. [Google Scholar]
  22. Yano, J.I.; Fraedrich, K.; Blender, R. Tropical Convective Variability as 1/f Noise. J. Clim. 2001, 14, 3608–3616. [Google Scholar] [CrossRef]
  23. Peters, O.; Neelin, J.D. Critical phenomena in atmospheric precipitation. Nat. Phys. 2006, 2, 393–396. [Google Scholar] [CrossRef] [Green Version]
  24. Shi, K.; Di, B.; Liu, C.; Huang, Z.; Zhang, B. Wenchuan aftershocks as an example of self-organized criticality. J. Southeast Asian Earth Sci. 2012, 50, 61–65. [Google Scholar] [CrossRef]
  25. Gang, W.; Min, L.; Fang-Li, Q.; Yi-Jun, H. Self-organized Criticality Model for Ocean Internal Waves. Commun. Theor. Phys. 2009, 51, 490–494. [Google Scholar] [CrossRef]
  26. Fraedrich, K.; Larnder, C. Scaling regimes of composite rainfall time series. Tellus A 1993, 45, 10. [Google Scholar] [CrossRef]
  27. Bak, P.; Tang, C.; Wiesenfeld, K. Self-organized criticality: An explanation of the 1/f noise. Phys. Rev. Lett. 1987, 59, 381–384. [Google Scholar] [CrossRef]
  28. Zanette, D.H. Multiplicative processes and city sizes. In The Dynamics of Complex Urban Systems. An Interdisciplinary Approach; Springer: Berlin, Germany, 2007. [Google Scholar]
  29. Sepkoski, J.J., Jr. Ten years in the library: New data confirm paleontological patterns. Paleobiology. 1993, 19, 43–51. [Google Scholar] [CrossRef] [Green Version]
  30. Johansen, A. Spatio-temporal self-organization in a model of disease spreading. Phys. D Nonlinear Phenom. 1994, 78, 186–193. [Google Scholar] [CrossRef]
  31. Hovius, N.; Stark, C.P.; Allen, P.A. Sediment flux from a mountain belt derived by landslide mapping. Geology 1997, 25, 231–234. [Google Scholar] [CrossRef] [Green Version]
  32. Geller, R.J.; Jackson, D.D.; Kagan, Y.Y.; Mulargia, F. Earthquakes cannot be predicted. Science 1997, 275, 1616. [Google Scholar] [CrossRef] [Green Version]
  33. Bak, P.; Tang, C.; Wiesenfeld, K. Self-organized criticality. Phys. Rev. A 1988, 38, 364–374. [Google Scholar] [CrossRef]
  34. Aschwanden, M.J. A statistical fractal-diffusive avalanche model of a slowly-driven self-organized criticality system. Astron Astrophys. 2012, 539, A2. [Google Scholar] [CrossRef]
  35. Aschwanden, M.J. A macroscopic description of a generalized self-organized criticality system: Astrophysical applications. Astrophys J. 2014, 782, 54–73, arXiv: 1310.4191. [Google Scholar] [CrossRef] [Green Version]
  36. Dhar, D. The Abelian Sandpile and Related Models. Physica A 1999, 263, 4–25. [Google Scholar] [CrossRef] [Green Version]
  37. Deluca, A.; Moloney, N.R.; Corral, A. Data-driven prediction of thresholded time series of rainfall and self-organized criticality models. Phys. Rev. E 2015, 91, 052808. [Google Scholar] [CrossRef] [Green Version]
  38. Deluca, A.; Puig, P.; Corral, A. Testing universality in critical exponents: The case of rainfall. Phys. Rev. E 2016, 93, 042301. [Google Scholar] [CrossRef] [Green Version]
  39. Bonsal, B.R.; Zhang, X.; Vincent, L.A.; Hogg, W.D. Characteristics of Daily and Extreme Temperatures over Canada. J. Clim. 2001, 14, 1959–1976. [Google Scholar] [CrossRef]
  40. Zhang, H.; Fraedrich, K.; Blender, R.; Zhu, X. Precipitation Extremes in CMIP5 Simulations on Different Time Scales. J. Hydrometeorol. 2013, 14, 923–928. [Google Scholar] [CrossRef] [Green Version]
  41. Peters, O.; Hertlein, C.; Christensen, K. A complex view of rainfall. Phys. Rev. Lett. 2002, 88, 18–701. [Google Scholar]
  42. Peters, O.; Deluca, A.; Corral, J.; Neelin, D.; Holloway, C.E. Universality of rain event size distributions. J. Stat. Mech. 2010, 2010, P11030. [Google Scholar] [CrossRef]
  43. Deluca, A.; Corral, A. Fitting and goodness-of-fit test of non-truncated and truncated power-law distributions. Acta Geophys. 2013, 61, 1351–1394. [Google Scholar] [CrossRef] [Green Version]
  44. Zhi, R.; Lian, Y.; Feng, G.L. Based on the power law tail index to study the influence of different scale systems on precipitation. Acta Phys. Sin. 2007, 56, 1000–3290. [Google Scholar]
  45. Gong, Z.; Feng, G.; Dogar, M.M.; Huang, G. The possible physical mechanism for the EAP–SR co-action. Clim. Dyn. 2017, 51, 1499–1516. [Google Scholar] [CrossRef] [Green Version]
  46. Zhao, J.H.; Wang, Q.G.; Zhi, R. A study of the extreme temperature group-occurring events in China. Acta. Meteor. Sinica 2012, 70, 302–310. [Google Scholar]
  47. Gong, Z.; Feng, G.; Ren, F.; Li, J. A regional extreme low temperature event and its main atmospheric contributing factors. Theor. Appl. Climato 2014, 117, 195–206. [Google Scholar] [CrossRef]
  48. Liu, G.; Lian, Y.; Yan, P.C. The Objective Recognition and Classification of Northeast Cold Vortex and the Northern Hemisphere Atmospheric Circulation Characters in May to August. Sci. Geogr. Sin. 2015, 35, 9. [Google Scholar]
  49. Hoffmann, H.; Payton, D. Optimization by Self-Organized Criticality. Sci. Rep. 2018, 8, 2358. [Google Scholar] [CrossRef]
  50. Saeedi, A.; Jannesari, M.; Gharibzadeh, S.; Bakouie, F. Coexistence of Stochastic Oscillations and Self-Organized Criticality in a Neuronal Network: Sandpile Model Application. Neural Comput. 2018, 30, 1132–1149. [Google Scholar] [CrossRef]
  51. Peng, X.-D.; Qu, H.-P.; Xu, J.-Q.; Han, Z.-J. Self-Organized Criticality Theory Model of Thermal Sandpile. Chin. Phys. Lett. 2015, 32, 094501. [Google Scholar] [CrossRef]
  52. Kalbfleisch, J.D.; Prentice, R.L. The Statistical Analysis of Failure Time Data, 2nd ed.; Wiley: Hoboken, NJ, USA, 2002. [Google Scholar]
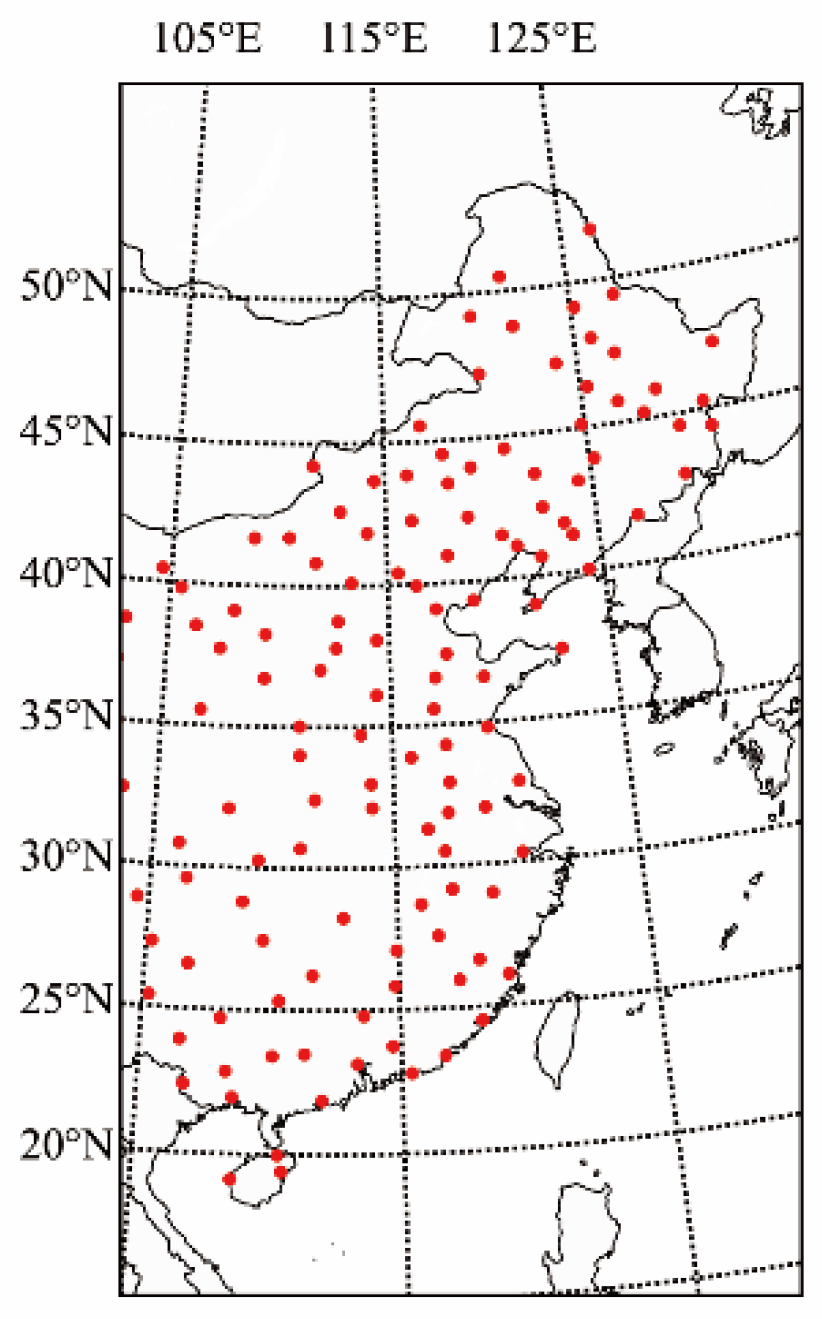
Figure 1. Locations of observation stations in the study.
Atmosphere 13 01038 g001
Figure 2. Pictorial definition of quiet time   τ . The red line represents the precipitation threshold q , while τ 1 ,   τ 2 , τ 3 and   τ 4 are the corresponding quiet times.
Atmosphere 13 01038 g002
Figure 3. The changes of β with different lengths of time series.
Atmosphere 13 01038 g003
Figure 4. Probability density functions τ of precipitation events: (a) in different thresholds; (b) after rescaling; (c) in different time scales; (Beijing Station) (d) in different stations (Quzhou, Leting, Nanjing, Ganyu, Wanyuan, Hefei).
Atmosphere 13 01038 g004
Figure 5. Probability density functions τ of precipitation events with sandpile model theory in different thresholds (Beijing Station).
Atmosphere 13 01038 g005
Figure 6. Spatial distribution of the power-law distribution means exponent β of precipitation quiet time in eastern China.
Atmosphere 13 01038 g006
Figure 7. Spatial distribution τ ¯ q : (a) UPEs and (b) EPEs.
Atmosphere 13 01038 g007
Figure 8. Hazard functions H q of quiet time in different thresholds (Beijing Station).
Atmosphere 13 01038 g008
Figure 9. The occurring probability of different intensities precipitation events in the next mean quiet time: (a) UPEs; (b) EPEs.
Atmosphere 13 01038 g009
Publisher’s Note: MDPI stays neutral with regard to jurisdictional claims in published maps and institutional affiliations.